Article

Investigation on the Electrochemical Corrosion Behavior of TP2 Copper and Influence of BTA in Organic Acid Environment

School of Materials Science and Engineering, Jiangsu University of Science and Technology, Zhenjiang 212003, China
*
Author to whom correspondence should be addressed.
Metals 2022, 12(10), 1629; https://doi.org/10.3390/met12101629
Submission received: 5 August 2022 / Revised: 24 September 2022 / Accepted: 26 September 2022 / Published: 28 September 2022

Abstract

:
In this work, the corrosion behavior of copper in a simulated organic acid environment containing formic acid and acetic acid was investigated by electrochemical testing and surface characterization. In addition to deducing the corrosion mechanism of copper in the organic acid corrosion environment, the corrosion inhibitor BTA was also used to slow down the corrosion of copper by organic acid. The results show that the corrosion rate of copper in the two groups of organic acids first decreases and then increases with the immersion time. Microelectrochemical (Scanning Vibrating Electrode Technique) results shows that the anodic peak of the sample is higher in formic acid. Formic acid is more corrosive. The corrosion products of red copper gradually increased in the two groups of organic acid atmospheres, and the final corrosion products were cuprous oxide, copper formate particles and copper acetate hydrate, respectively. When the concentration of BTA is 0.5 g/L, the electrochemical activity of TP2 copper is weakened, the surface of the sample is relatively smooth, there are no large corrosion pits, and the corrosion rate is reduced.

1. Introduction

Copper has excellent corrosion resistance, electrical conductivity, thermal conductivity and machinability, and is often used in electrical and electronic markets, shipping, manufacturing of industrial machinery and equipment, and medical and chemical industries [1,2]. Copper and copper alloys are mainly used in the preparation of various types of wires, seawater pipelines and valves, heat exchangers, condensers, heaters and propellers in marine and marine engineering. Copper is used in shipbuilding to make conductive parts and corrosion-resistant parts. Aluminum bronze and manganese bronze are mainly used as anti-wear parts under high load. Ni-Al bronze is mainly used for corrosion-resistant parts in contact with seawater and other media [3]. Cupronickel is used for ship radiators and sea pipe systems [4,5,6]. At the same time, copper also has good corrosion resistance in the ocean, acid, alkali, salt solution, atmospheric environments and a variety of carboxyl-containing organic acids (formic acid, acetic acid) corrosion environments. However, when the medium contains water, sulfide, etc., or is affected by the external environment such as temperature, the copper surface will corrode to varying degrees [7,8].
In industrial production, copper used to make heat dissipation equipment has the highest probability of corrosion failure, mainly because heat exchangers and coolers use lubricating oil and chlorinated organic chemicals for degreasing, cleaning and pickling operations in the manufacturing process. Solvents, and these organic substances are one of the main sources of organic acid pollutants [9,10,11,12]. The source may also be separate from the manufacturing process itself. For example, volatile substances from building materials, such as glass glue, adhesives, varnishes, and plastic products commonly used in wood furniture and home decoration, release large amounts of organic acids [13,14,15,16]. The residual lubricating oil and organic solvent in the processing process will be rapidly hydrolyzed in the copper tube to generate carboxylate ions (COOH). These organic acid pollutants are mixed in gas or liquid to corrode the copper surface [9]. At the same time, due to the defects of the copper tube itself and the influence of many factors such as high temperature, moisture, and corrosive environment, the organic acid pollutants in the solution or the air are at a high level, which accelerates the electrochemical corrosion of copper, thereby greatly reducing the use of copper performance [17,18,19,20]. Organic acid pollutants will appear in solution or gas, which will lead to corrosion failure of equipment, but the corrosion is more serious when exposed to organic acid gas environment.
For the study of organic acid pollutants, the corrosion behavior of copper in organic acid environment should be analyzed from multiple perspectives. Masahiro et al. [21] successfully simulated the corrosion of copper samples in an organic acid solution and confirmed that the organic acid corrosion of the Cu samples occurred after immersion in an aqueous solution containing formic acid for 28 days. Chandra et al. [11] showed that short-chain carboxylic acids can originate from residual organic compounds (such as synthetic lubricating oils, degreasers or anti-tarnishing agents), anthropogenic or biological processes. Cozzarini et al. [22] performed a failure analysis of copper tubes in three different heat exchanger systems. The results show that the presence of carboxylic acid is responsible for the corrosion failure of copper. Gil et al. [23] compared the two experimental techniques of IRAC and QCM to analyze the corrosion status of copper test pieces exposed to low concentrations of organic acids. The study found that formic acid was the most corrosive, followed by acetic acid and propionic acid. The analysis is because formic acid has a stronger proton effect, resulting in a lower pH in the exposure environment of formic acid. Both formic acid and acetic acid have great influence on the corrosion of copper [24]; however, the research on the corrosion of organic acid pollutants on metals is limited, especially on the corrosion of copper.
In this study, the electrochemical corrosion behavior of organic acid pollutants on copper was firstly analyzed by immersion method. Then, the morphology and composition of copper corrosion products in organic acid gas environment were analyzed by characterization method, so as to reveal the corrosion mechanism and law of copper in organic acid environment. Finally, corrosion inhibitor was used to reduce the corrosion harm of organic acid in the solution to copper.

2. Materials and Methods

2.1. Materials

The sample taken in the experiment is a TP2 copper sample, and the sample is cut into a size of 10 mm × 10 mm × 2 mm. The nominal composition (wt%) of the metal is 99.90% Cu and 0.01% impurity. In order to characterize the corrosion behavior of metal, copper was grinded continuously with SiC paper with granularity of 600, 800, 1200, 1500 and 2000, respectively, until the direction of the abrasion marks is the same each time, and the interval is even. After fine grinding, use an ultrasonic cleaning device to wash off the impurities on the surface, and then use it after natural air-drying. In addition, a copper block of 10 mm × 10 mm × 2 mm was obtained by wire cutting for exposure testing. The organic acid reagents used are formic acid (HCOOH) and acetic acid (CH3COOH) solutions. In the experiment, benzotriazole (BTA) was selected as copper corrosion inhibitor, and acetic acid with a concentration of 1% were used as corrosion solutions.

2.2. Electrochemical Testing

The experiment used Zennium E4 electrochemical workstation to study the corrosion of copper immersed in organic acid solution. The test system is a three-electrode system, the working electrode is a prepared copper electrode, the auxiliary electrode is a platinum electrode, the reference electrode is a 217-type saturated calomel electrode, and the electrolyte solution is a prepared organic acid solution. The scan range of the potentiodynamic polarization test was set to −0.3 V~0.3 V (vs. OCP), and the scan rate was 1 mv/s. The frequency range of AC impedance measurement is 0.01 Hz–100 KHz, and the amplitude is 10 mV. Before starting the test, make sure that the open circuit potential is stable. Formic acid and acetic acid solutions were both 1% concentration.
In addition, the corrosion of copper by formic acid and acetic acid was also studied by microelectrochemistry. Microscale electrochemical tests were performed using a Princeton VersaSCAN Microscanning Electrochemical Workstation (AMETEK, Inc., San Diego, CA, USA). SVET technology reflects the local current on the surface of the sample by measuring the potential difference in the solution and reflects the inhomogeneity of the electrochemical activity on the surface of the sample through three-dimensional images. As shown in Figure 1a, the electrochemical sample was fixed on a specific electrolytic cell and leveled before the test, and then the probe was installed to keep the distance between the probe and the surface of the sample within 100 μm. During the test, the test sample needs to be polarized with constant current to speed up the corrosion reaction process, and then select a point on the surface of the sample as the starting point for surface scanning, the frequency is 5 kHz, the scanning area is 1 mm×1 mm, and the step size is 20 μm.

2.3. Exposure to Organic Acid Gas Atmosphere

As shown in Figure 1b, the corrosion of copper by organic acid gas was studied by exposure atmosphere experiment. The copper block of 10 mm × 10 mm × 2 mm was placed in a glass test tube at an angle of 45° and placed in a closed sealed glass bottle (volume approx. 1 L) containing 100 mL formic acid and acetic acid solution to simulate an exposure environment. Corrosion in the presence of only organic acid gases is ensured in formic or acetic acid vapors at a concentration of 1% [25]. Meanwhile, thermal cycling experiments were performed by placing the sealed glass containers in an incubator at 40 °C for 12 h, and then at room temperature 25 °C for 12 h to ensure a 24-h cycle of alternating temperatures. The thermal cycle lasted for up to 30 days, and samples were taken at 5, 15, and 30 days to observe and analyze the corrosion morphology and composition of corrosion products, and to ensure the replacement of oxygen during exposure to corrosion.

2.4. Corrosion Product Analysis

Scanning electron microscope (SEM) was used to analyze the morphology of corrosion products, and energy dispersive spectrometer was used to perform point scanning elemental analysis of corrosion products. Then, an X-ray diffractometer (XRD) was used for phase analysis. After the X-ray passes through the substance to be tested, a specific diffraction pattern will be generated, which can reflect the structure of the crystal. The diffraction angle 2θ is 20–95°, and the scanning speed is 20°/min.

3. Results

3.1. Potentiodynamic Polarization Measurements
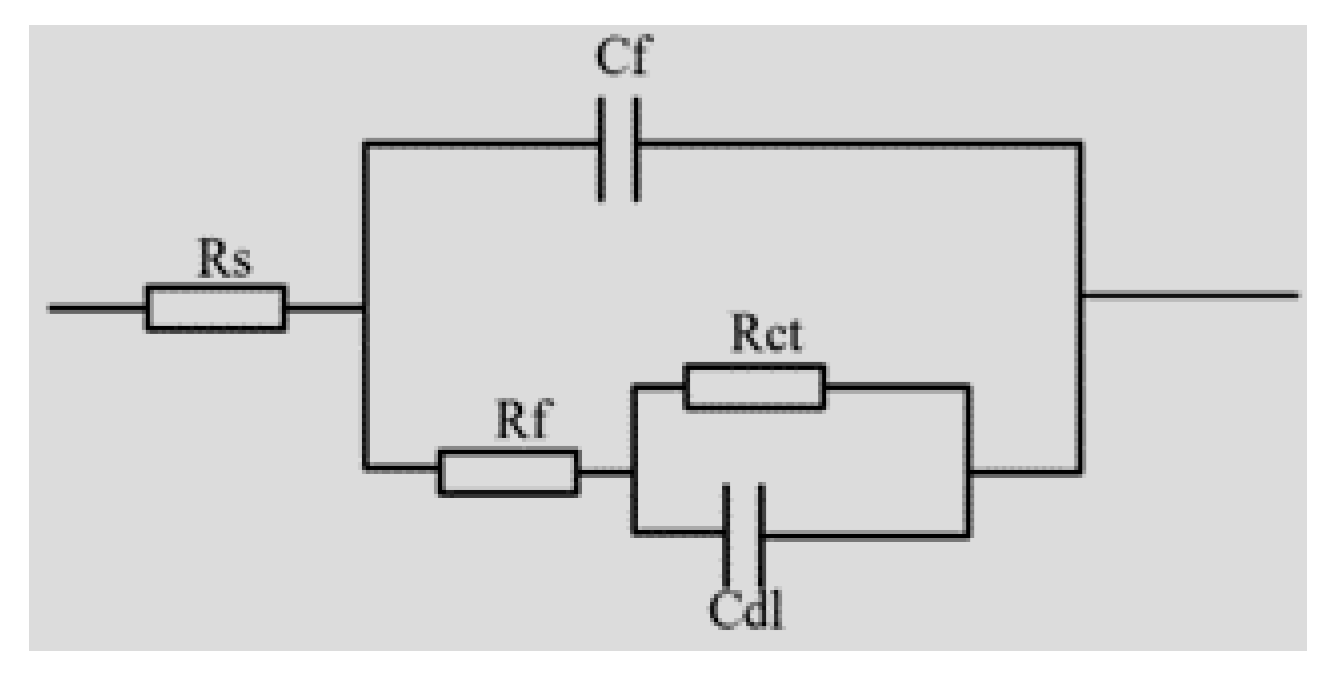
Figure 2 shows the trend of potentiodynamic polarization curves of TP2 copper soaked in 1% formic acid and acetic acid solutions for 0 h, 24 h, 240 h, 480 h, and 960 h, respectively. Zahner Analysis software was used to fit the polarization curve data, and the fitting results are shown in Table 1.
The polarization curves of red copper in the two groups of organic acid solutions are basically similar, and there is no major difference in the corrosion process. There is no obvious passivation zone, showing a state of continuous dissolution. The corrosion mechanism of the two is roughly the same. It can be seen from Table 1 that with the increase of immersion time, carboxylate ions continue to erode the surface of copper, and the passivation film is damaged. The surface of the substrate is gradually eroded. After immersion for 480 h, the corrosion current of red copper increased, the potential shifted significantly negatively, and the corrosion tendency was further deepened, indicating that the increase of corrosion time would also aggravate the corrosion degree of the sample. After immersion for 960 h, the potential of the two did not change much, but in acetic acid solution, the corrosion potential shifted positively and the self-corrosion current of copper increased to 4.55 μA·cm−2 and 3.44 μA·cm−2, respectively.
Figure 3 shows the change curves of corrosion potential and corrosion current of copper after different immersion times in formic acid and acetic acid solutions. In the early stage of immersion, the corrosion potential and corrosion current of red copper in the two organic acids have little difference, so it is difficult to compare the corrosiveness of the two organic acids. However, with the increase of immersion time, the self-corrosion potential of red copper in the two organic acid solutions first shifted to more positive and then to more negative, but after immersing in acetic acid for 960 h, the self-corrosion potential shifted to more positive. The self-corrosion current of copper in the two organic acid solutions first increased and then decreased. After soaking for 24 h, when the self-corrosion current value of TP2 copper is less than 0 h, it means that the copper is soaked in the acid solution, and a relatively dense passivation film is gradually formed, and the passivation film will be oxidized to CuO near the solution side, and the inner layer is Cu2 O/CuO dense oxide film, and the outer layer is composed of a soluble mixture [26], mainly including copper formate and copper acetate. The passivation film formed in a short time has a double-layer structure, which effectively inhibits the progress of corrosion in the early stage and reduces the corrosion rate and corrosion tendency [27]. The corrosion law of red copper in the two organic acid solutions is similar, and anodic dissolution occurs in the anodic polarization zone. The self-corrosion current density value varies with the immersion time. The self-corrosion current density shows a continuous increase trend, and there was no obvious passivation area. In conclusion, the corrosion of copper by formic acid pollutants became more and more serious with the increase of time.

3.2. EIS Behavior

In order to further study the effect of organic acid pollutants on the surface and passivation film of copper samples, the electrochemical impedance spectroscopy test results of immersion in formic acid and acetic acid solutions for 0 h, 24 h, 240 h, 480 h, and 960 h are shown in Figure 4 and Figure 5. The impedance spectrum fitting equivalent circuit of the copper sample in formic acid and acetic acid solution is shown in Figure 6.
As shown in the electrochemical impedance spectra shown in Figure 4 and Figure 5, the Nyquist plots of TP2 copper in formic acid and acetic acid solutions have two capacitive reactance arcs, corresponding to two capacitive reactance peaks in the Bode plot. The capacitive arc radius reflects the film-forming properties of the metal passivation film. The larger the capacitive arc radius, the better the corrosion resistance and the higher the passivation film impedance [28]. As shown in the Nyquist diagram, the radius of the capacitive reactance arc of TP2 copper increases first and then decreases with the increase of immersion time, showing a large capacitive reactance arc in the high frequency region, and the capacitive reactance of the sample in formic acid the arcs are smaller than the capacitive arc in acetic acid solution. The radius of the capacitive reactance arc after immersion for 24 h is the largest, which may be because the red copper in the organic acid solution will oxidize in pure water at first to form a Cu2O passivation film. With the increasing immersion time, both groups of capacitive reactance arc radius are decreasing.
Table 2 and Table 3 are the equivalent circuit data, where Rs is the solution resistance, Rf is the passivation film resistance, Rct is the charge transfer resistance, Cdl is the double layer capacitance, and Cf is constant phase angle elements of electric double layer capacitors. At the initial stage of immersion, the Rct value of copper in acetic acid was 4.45 × 10⁴ Ω, which was significantly higher than that in formic acid, which was 2.31 × 10⁴ Ω. At the beginning, copper showed excellent corrosion resistance in acetic acid, and Rf was close to 11 kΩ, which fully demonstrated that the passivation film of copper has the best compactness in the early stage of the acetic acid solution. After immersion for 24 h, the charge transfer resistance of the two groups of solutions increased significantly, and the reaction resistance of electron transfer increased, which had a good inhibitory effect on the erosion of organic acid pollutants. However, with the increase of immersion time, the charge transfer resistance and film resistance of red copper in the two groups of organic acid solutions decreased significantly, the protective effect of the passive film of red copper on the substrate became worse, and the corrosion reaction accelerated in the organic acid environment. After immersion for 960 h, the charge transfer resistance of formic acid and acetic acid solution decreased to the lowest value, and the corrosion effect of organic acid pollutants was remarkable, but the charge transfer resistance of copper in acetic acid was significantly higher than that in formic acid.

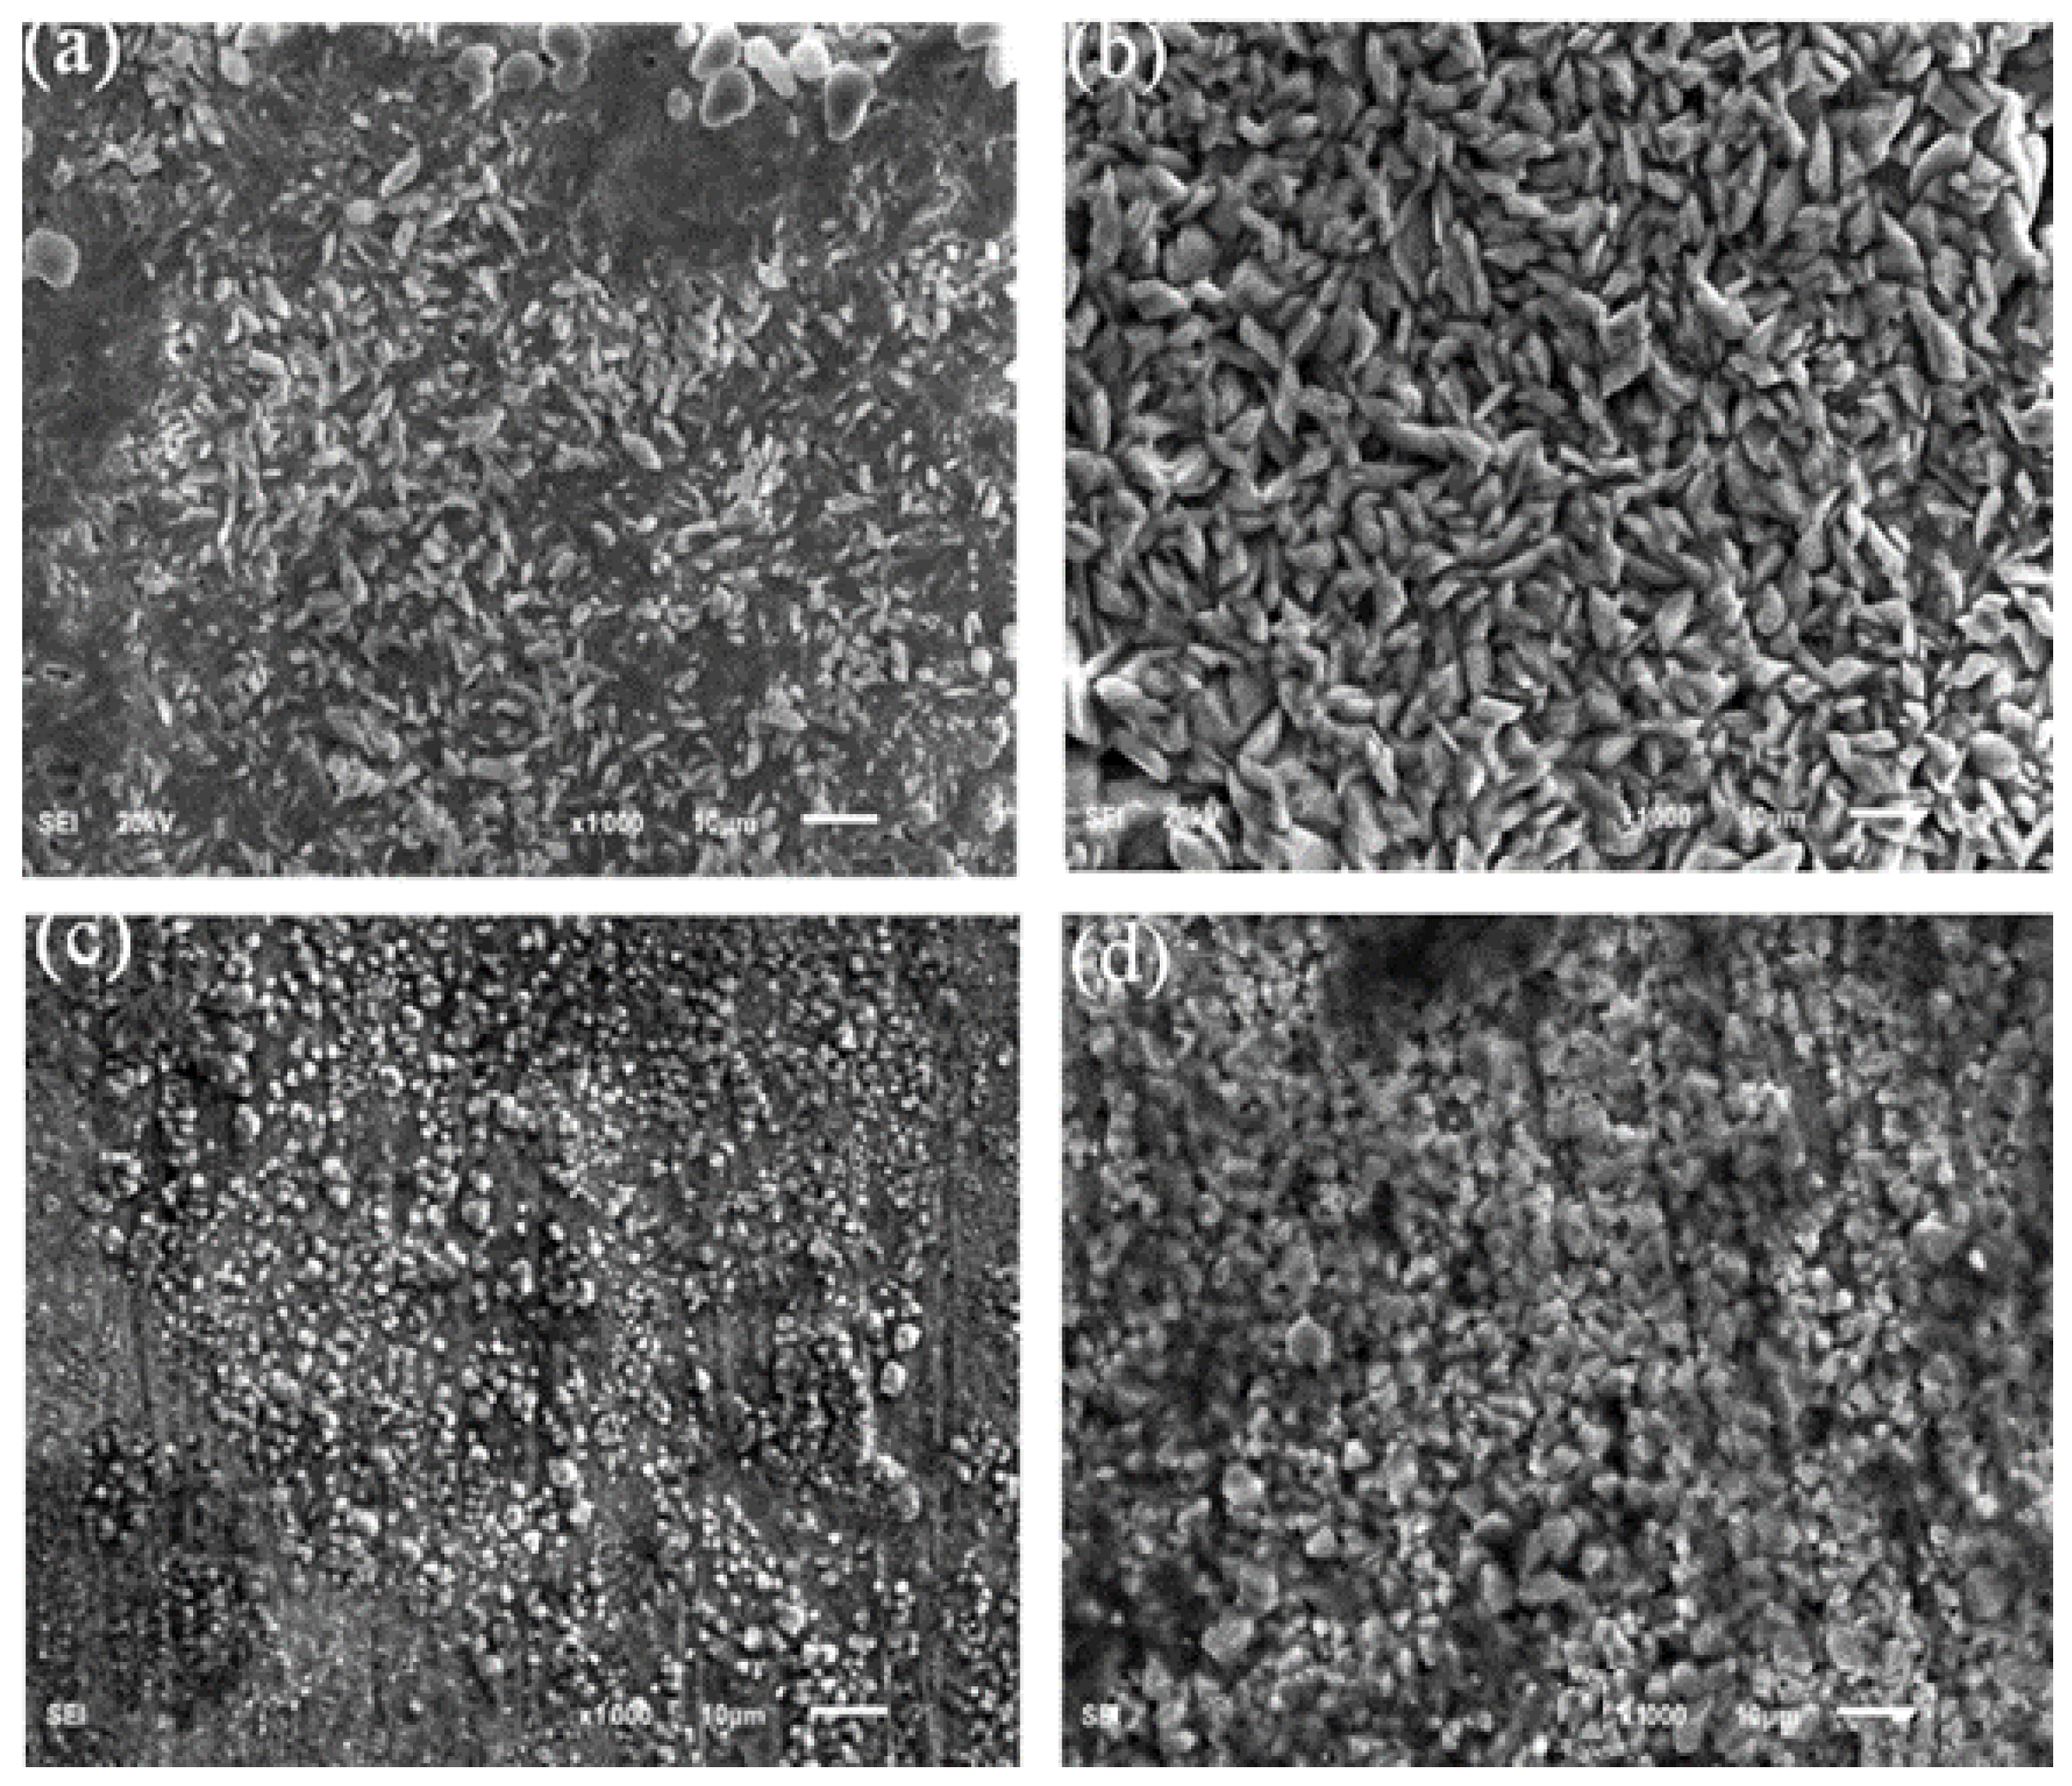
3.3. Morphological Characteristics after Soaking
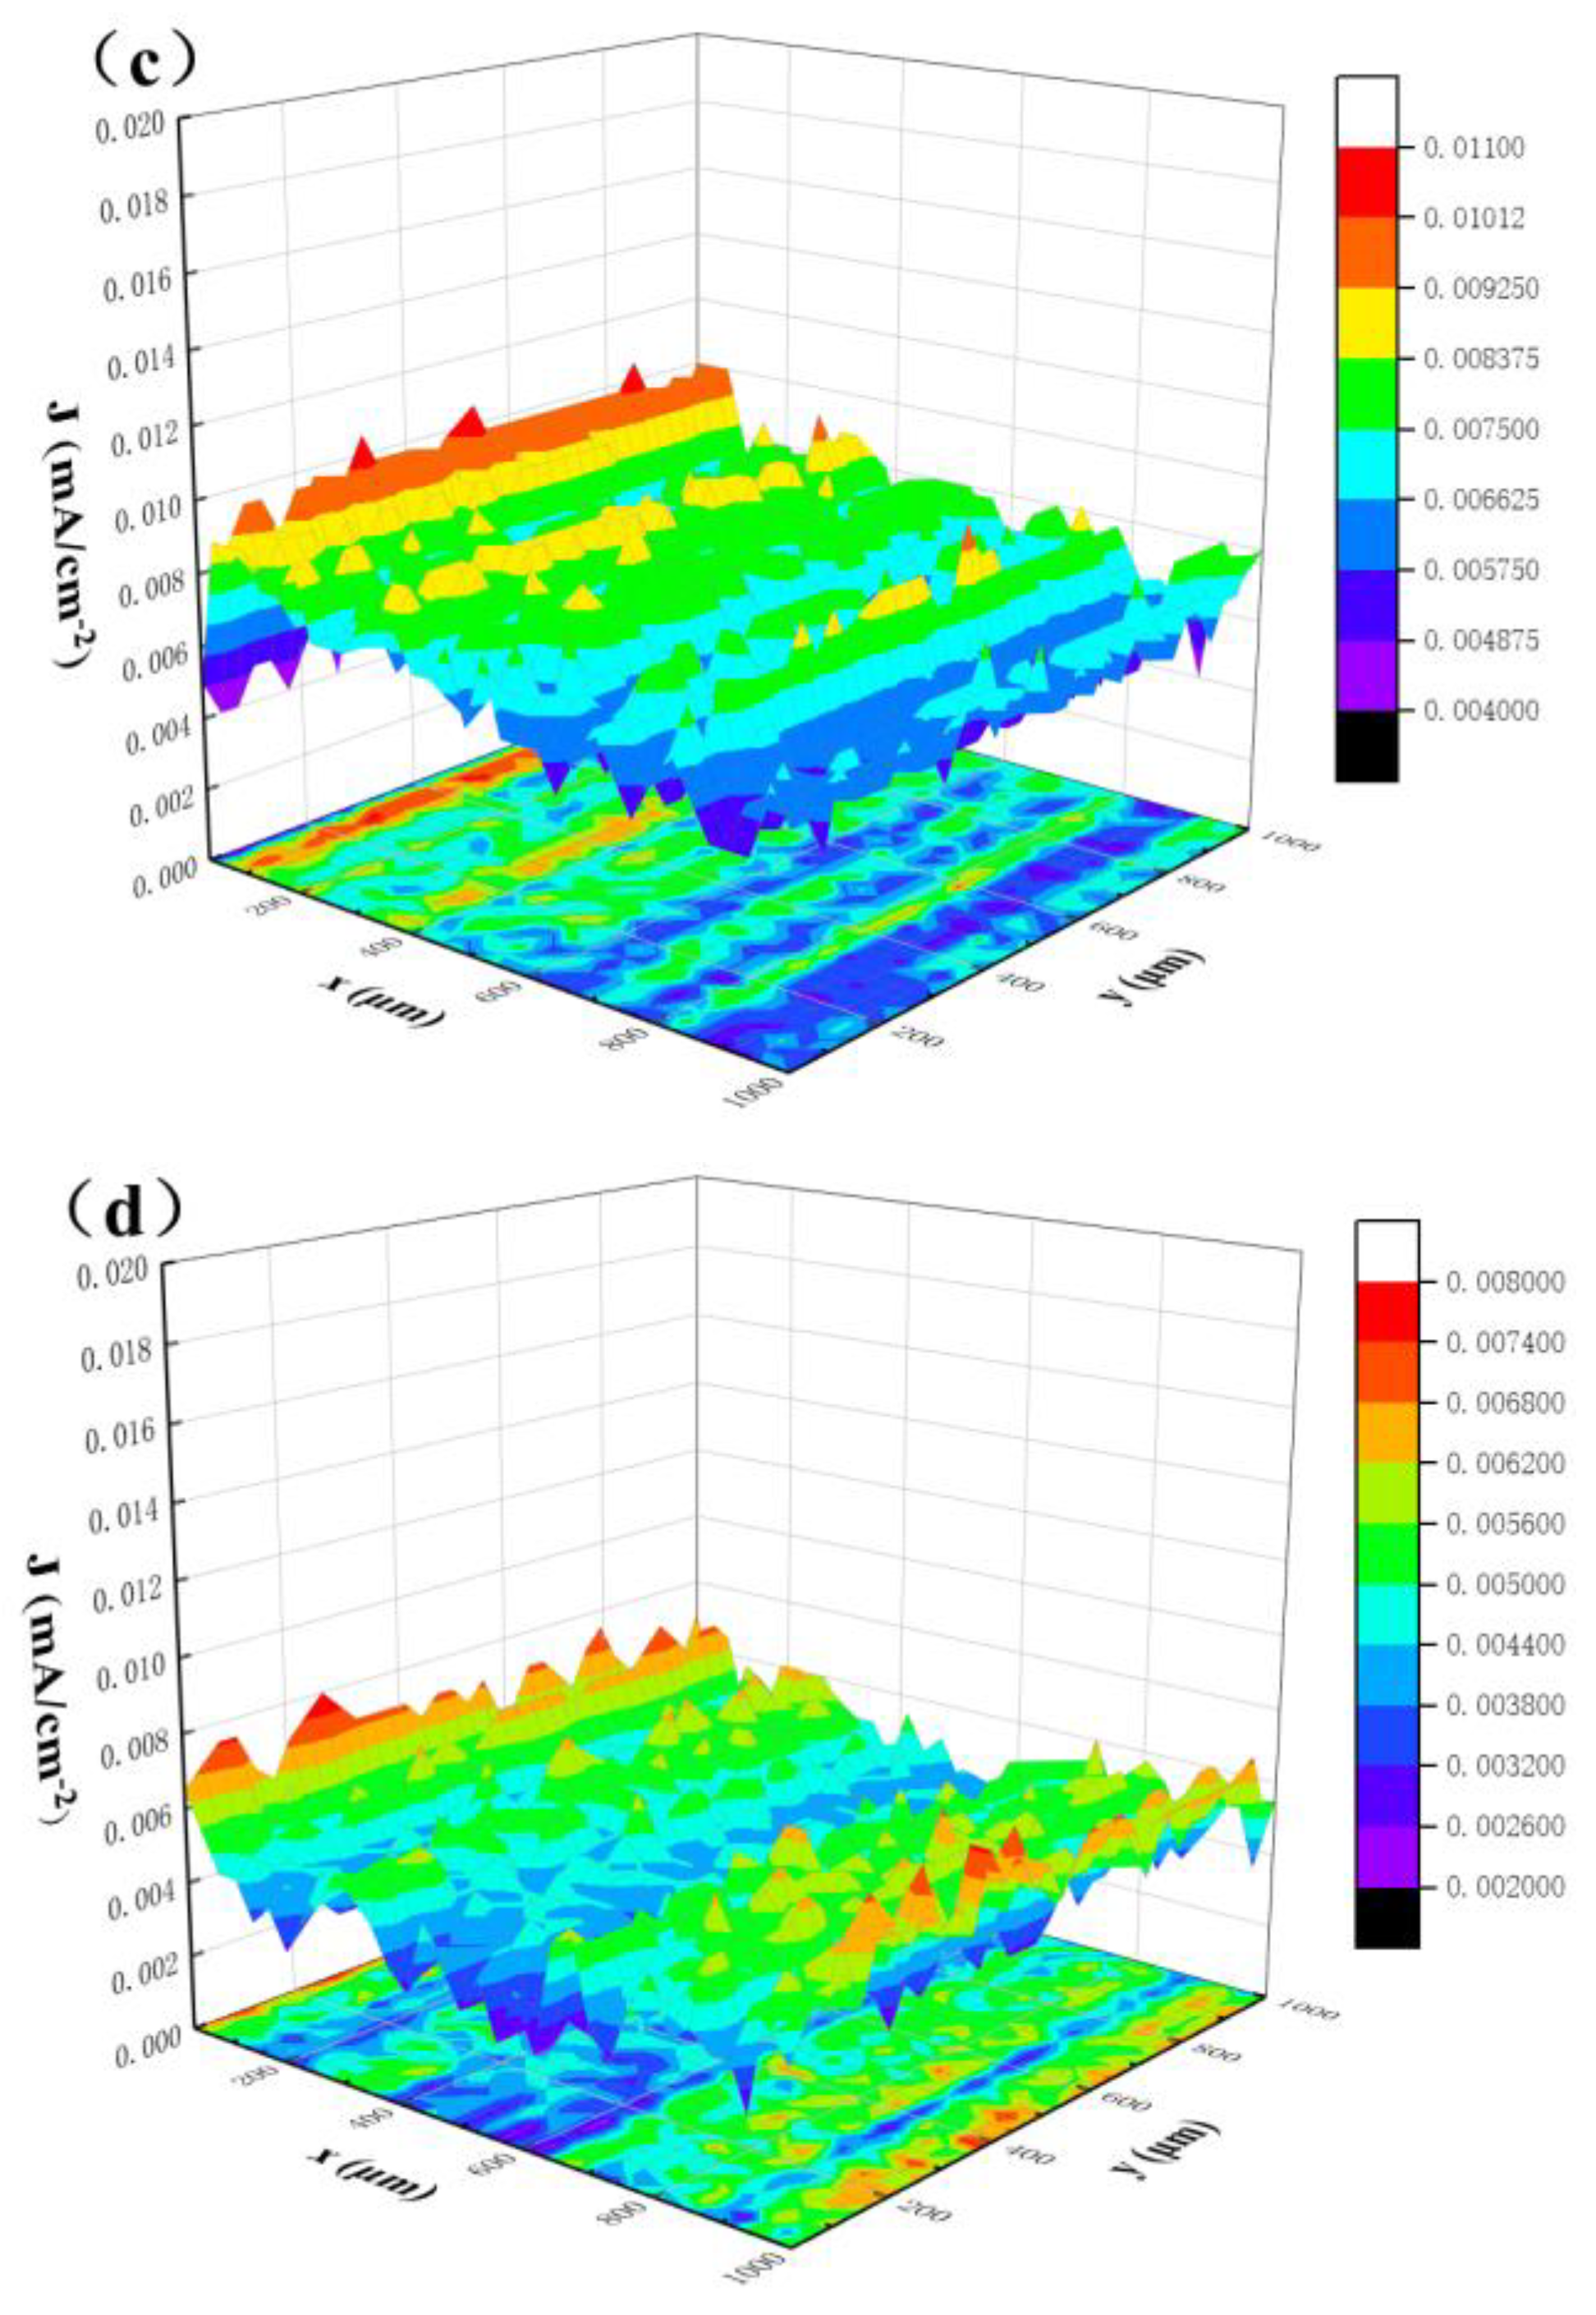
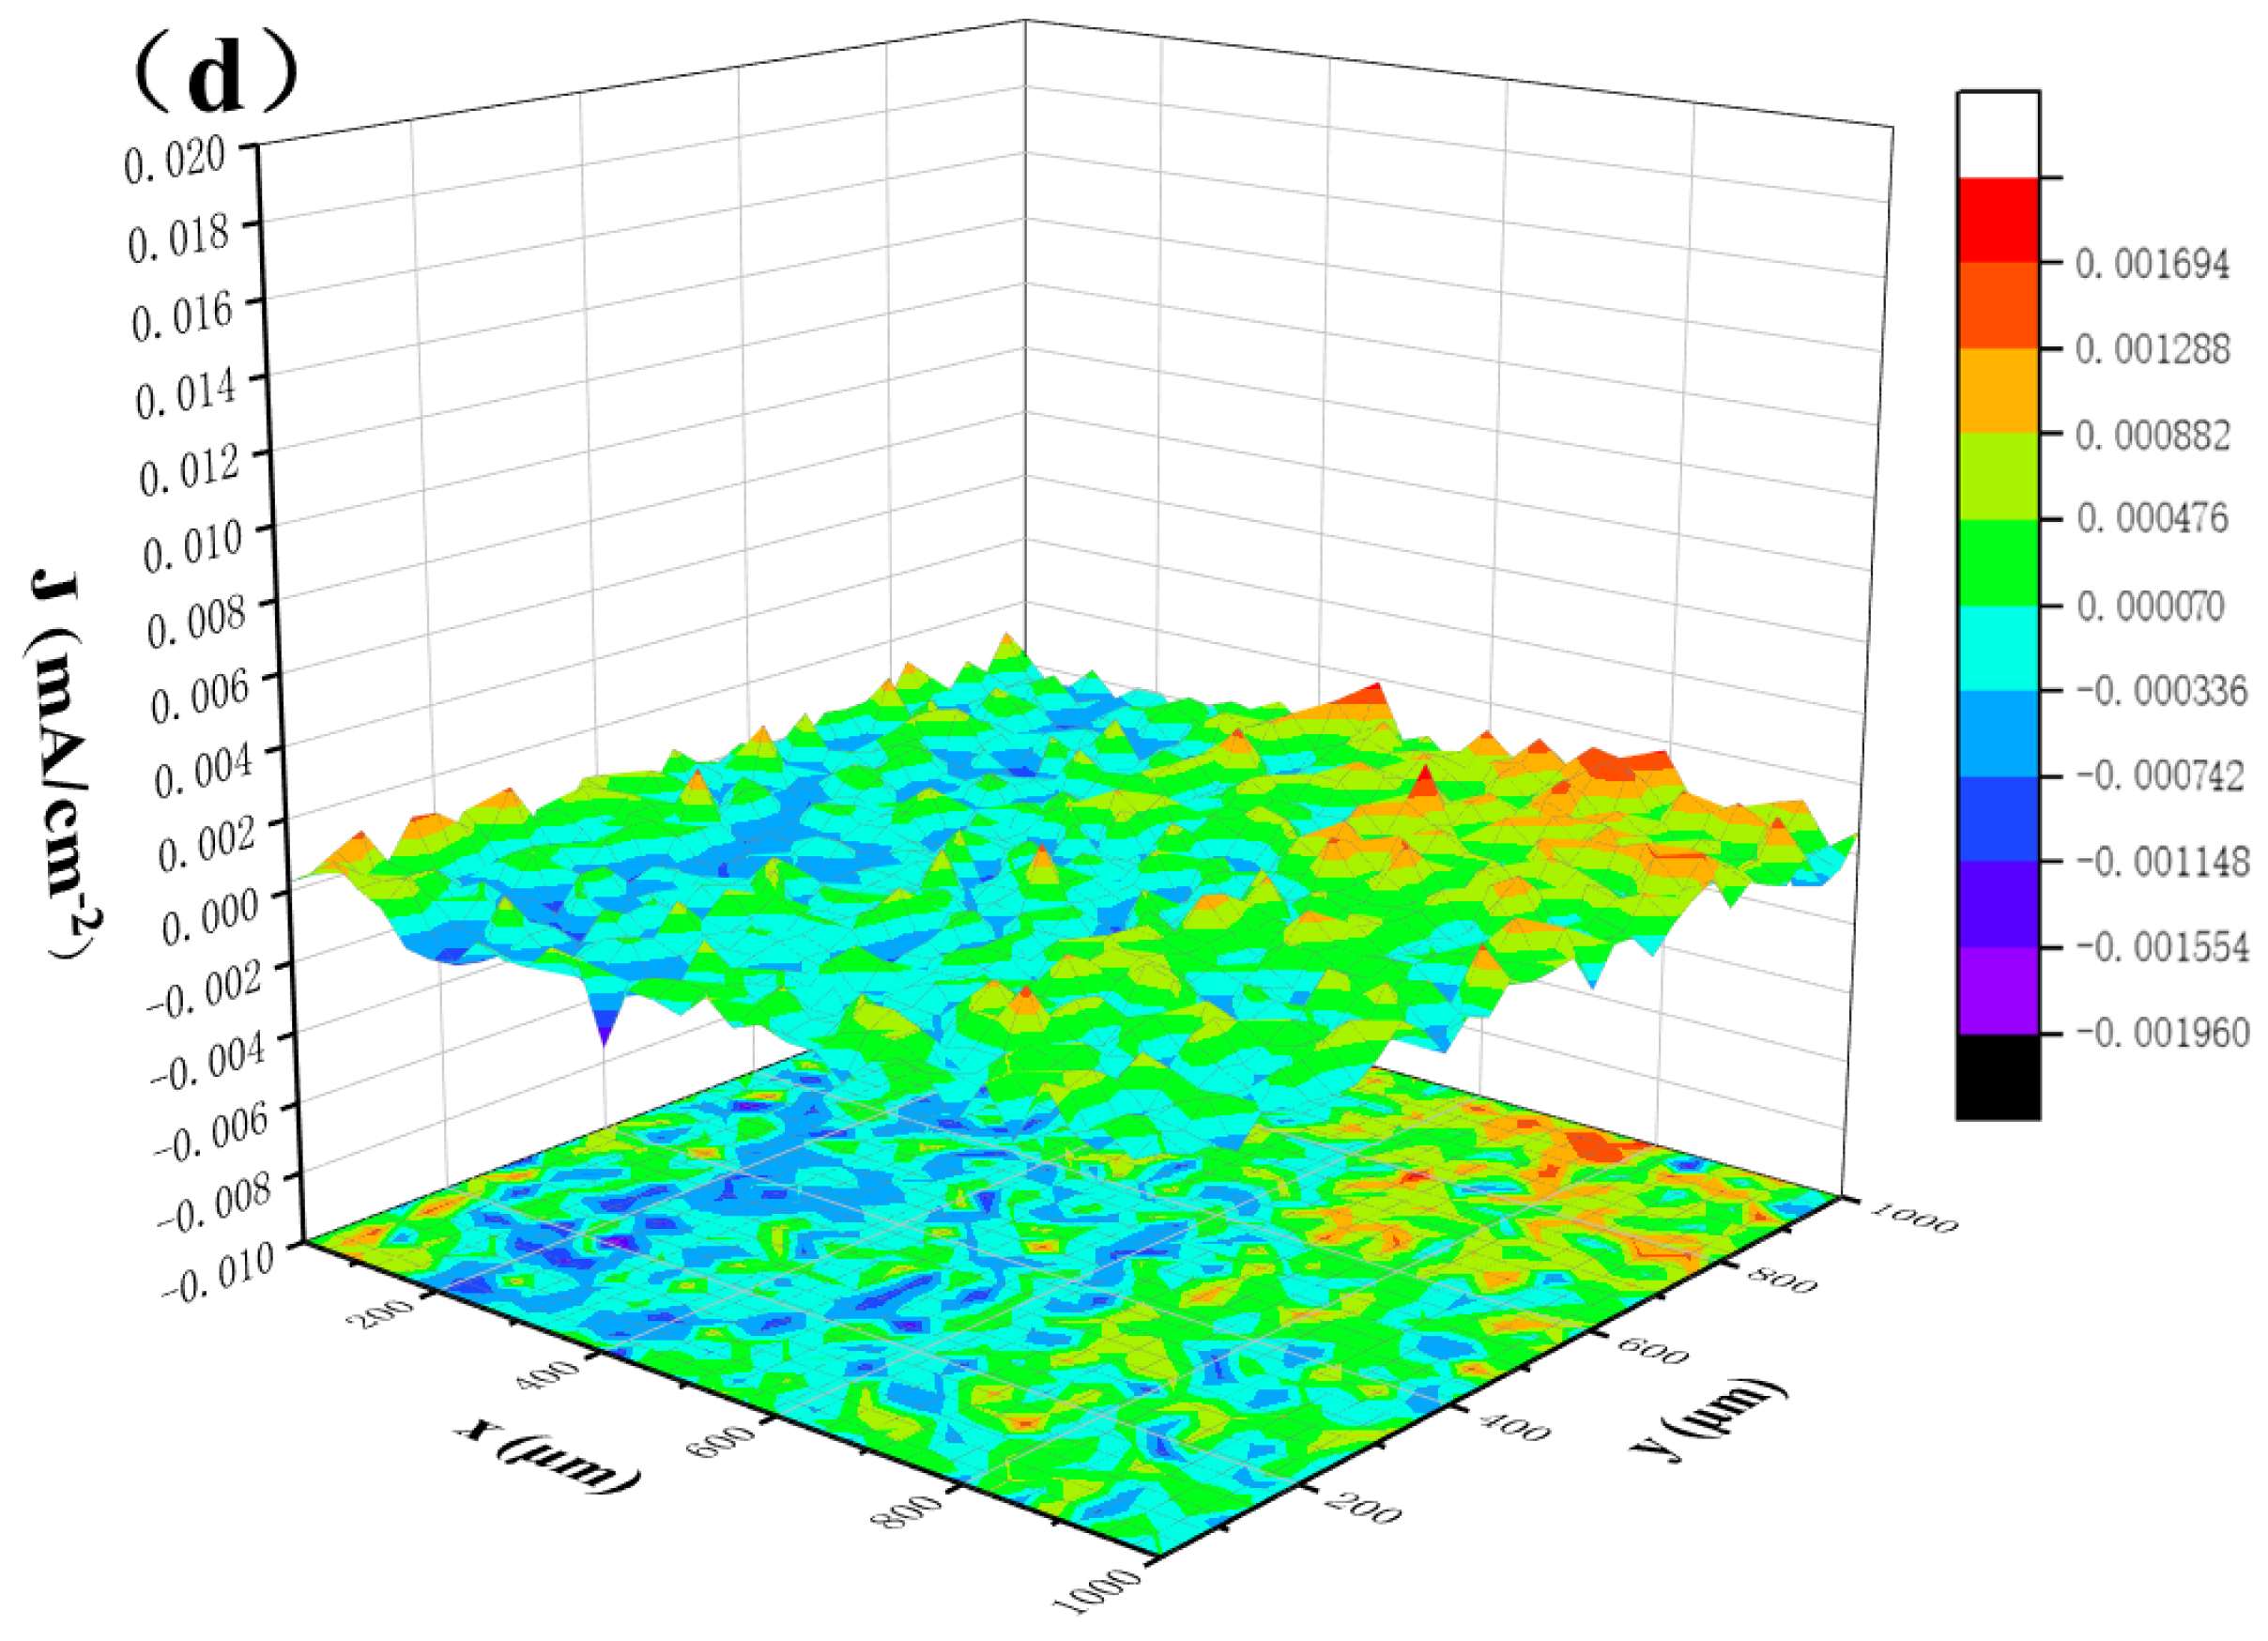
Figure 7 shows the SEM microscopic topography of TP2 copper immersed in an organic acid solution for 480 h and 960 h. Under different immersion time, the morphology of the sample surface was corroded to different degrees, and corrosion pits were obviously observed. After being soaked in formic acid solution for 480 h, the surface of red copper has serious continuous pits and pits, which are closely arranged in crevices, and the corrosion effect is obvious. Under the same immersion conditions, the copper samples in the acetic acid solution did not have large-area corrosion pits, the corrosion pits were sparsely distributed and small in area, the scratches on the copper surface were clearly visible, and the surface morphology was less different from the original sample. After soaking for 960 h, the surface of the copper sample in the formic acid solution has been corroded into a ravine shape, and the surface is uneven. It can be confirmed that the corrosion morphology has spread from continuous corrosion pits to deeper corrosion pits. On the other hand, for copper immersed in acetic acid solution, the range of corrosion holes gradually expanded with time, and large-diameter corrosion pits were obviously eroded on the surface of the sample after being corroded for 960 h. It can be seen from the figure that the two groups of organic acid pollutants will corrode the surface of the substrate, and the corrosion rate of copper immersed in acetic acid solution is significantly lower compared to formic acid.

3.4. SVET Behavior

SVET technology utilizes microelectrodes, signal conversion devices, and amplifiers to eliminate interference factors caused by micro scanning, thereby improving sensitivity and measurement accuracy. The advantages of less destructive, high precision and high sensitivity enable SVET to accurately measure the electrochemical activity of samples in tiny areas [29,30]. The figure shows the SVET detection results of copper in organic acid solution immersed continuously for 960 h. The overall current density change can be obtained from the three-dimensional stereogram, and the corrosion activity at the defect location can be continuously deduced through the SVET scan line, where the peaks and valleys represent the micro-anode and micro-cathode currents, respectively. The two-dimensional plan shows the distribution of micro-anode and micro-cathode, reflecting the inhomogeneity of the electrochemical reaction when carboxylate ions are continuously ionized outside the sample. Through the comprehensive analysis of SVET three-dimensional and two-dimensional plan, the degree of reaction between formic acid and acetic acid at different times can be judged.
Figure 8 shows the current densities gradient changes of copper immersed in an organic acid solution for 480 h and 960 h using the micro-electrochemical SVET test technology. Corrosion current occurs in tiny areas of the sample surface where corrosion occurs, and anodic peaks appear in areas that are dissolving. Figure 8a shows the current density of TP2 copper immersed in formic acid solution for 480 h. In the three-dimensional image of the selected micro-area, a raised anode peak can be seen, indicating that the current around the anode peak fluctuates greatly, and these areas are likely to be around the sample. The area where corrosion occurs, dissolves earlier in the corrosion solution, destroys the passivation film on the surface of the red copper, and causes the substrate to be exposed in the solution, becoming an anode phase and starting to activate corrosion. Figure 8b shows the measurement results of TP2 copper immersed in acetic acid solution for 480 h. The fluctuations in the three-dimensional graph are not large, and the difference in current density values is small, indicating that the anode current changes slowly in this area, and the probability of corrosion around is low. There is still a good protective layer in the solution to inhibit the occurrence of corrosion. With the continuous development of corrosion, as shown in Figure 8c,d, the anode peak gradually becomes larger, the whole 3D image is undulating and uneven, and the anode current has a large difference, which is consistent with the scan after immersion for 960 h. The corrosive medium continuously erodes the surface of the sample, resulting in vertical and horizontal grooves and unevenness on the copper surface, so that the micro-probe detects the anodic corrosion current value of defects and pits. From the results displayed by the SVET three-dimensional map, the overall wave peak of the formic acid solution has a larger trend, and more and more carboxylate ions continue to erode the surface of the sample, and the electrochemical activity increases significantly.

3.5. Corrosion Morphology Characteristics after Gas Atmosphere Exposure

3.5.1. Micro Topography Analysis

Figure 9 shows the SEM micrographs of TP2 copper samples exposed to 1% concentration of formic acid and acetic acid in gas phase environment for 15 d and 30 d corrosion. It can be seen from Figure 9a,b that almost no scratches can be seen on the surface of the corroded copper sample, and the accumulation of corrosion products is obvious. While the sample exposed to formic acid atmosphere for 15 days shows that the surface is covered with a layer of the fine rice-like corrosion particles are sparsely arranged, with different shapes and sizes, and some particles are connected to each other. After 30 days of corrosion, the corrosion products on the surface of the sample continued to increase, and the distribution was denser, and a large number of closely connected thick and thin strip-shaped corrosion particles appeared. The exposure results showed that with the increase of exposure time, the corrosion of copper in the formic acid pollutant environment became more and more serious, and the corrosion products gradually grew from fine particles to longer and larger fine particles.
When copper is exposed to acetic acid vapor corrosion environment at 40 °C, the corrosion degree of the substrate is relatively light. It can be seen from Figure 9c,d that after exposure to acetic acid atmosphere for 15 days, relatively small particles are formed on the surface of copper, and scratches can still be clearly seen. Compared with formic acid vapor corrosion, although the surface is completely covered with corrosion products, but the particle size of the corrosion products produced is small, the arrangement is sparse, and the number is small. After 30 d exposure, the corrosion products on the surface of the samples increased and the arrangement was denser. Although there are more obvious coarse particles on the surface of the copper sample in the acetic acid atmosphere, and the number is large, but the corrosion product particles of the copper in the formic acid atmosphere are coarser, the surface is more uneven, and the substrate has been completely covered. Formic acid contamination has more serious corrosion damage to the sample.

3.5.2. EDS Analysis

The surface energy spectrum results of TP2 copper exposed to formic acid and acetic acid gas phase environment for 30 days are shown in Table 4, and Figure 10 is the corresponding energy spectrum diagram. It can be seen from the table and the figure that in addition to the Cu element contained in the copper matrix itself, the presence of C and O elements was also detected in the energy spectrum results, indicating that with the prolongation of the gas phase corrosion time, the carbon dioxide and oxygen in the atmosphere also participate in the process of gas phase corrosion. Comparing the energy spectrum results of the two organic acids, it is obvious that the Cu content in the formic acid environment is lower than that in the acetic acid environment, and the O element generated in the formic acid is much higher than that in the acetic acid environment. It shows that a certain amount of copper formate compound and copper acetate compound corrosion products may be formed on the surface of the red copper sample, and the corrosion is more serious in the formic acid gas phase.

3.5.3. XRD Analysis of Phase Results

It can be seen from the XRD phase analysis results in Figure 11a that the corrosion products after 30 d corrosion in formic acid atmosphere are mainly compounds such as cuprous oxide and copper formate. The original sample is mainly the diffraction peak of copper. After 5 days of corrosion in formic acid atmosphere, a mixture of CuO and Cu2O is first formed on the surface of the sample. In the middle stage of corrosion, the content of Cu was significantly reduced, and the content of Cu2O formed in the early stage increased, a part of which was oxidized to CuO, and a certain amount of Cu(HCOO)2 and Cu(OH)(HCOO) were formed. With the increase of exposure corrosion time, the previous corrosion products still exist, and the new corrosion products are mainly copper formate (Cu(HCOO)2). The peaks corresponding to copper gradually decreased as the exposure time to formic acid gas increased from 0 d to 30 d, and at the same time, the content of copper hydroxide also decreased. When the copper sample is exposed to a corrosive gas environment containing formic acid pollutants for a long time, the corrosion products of cuprous oxide and copper formate crystals will eventually appear.
The phase results of copper in acetic acid atmosphere showed that CuO and Cu2O were mainly formed in the early stage. With the increase of corrosion time, Cu(CH3OO)2·2H2O and Cu4OH(CH3OO)7·2H2O began to appear in the corrosion products. The previous reaction is similar to the reaction shown in the formic acid gas phase, but the reaction between copper ions and acetic acid produces basic copper acetate, which is also accompanied by basic copper carbonate. The copper that has been corroded by acetic acid for a long time finally produces the hydrate of cuprous oxide and copper acetate. When there is basic copper acetate in the corrosion product, it means that organic acid corrosion is still occurring.

3.6. Influence of BTA for Corrosion of Copper in Organic Acid Environment

Due to the special use environment of red copper, the method of adding corrosion inhibitor to the organic acid liquid solution is preferred in this study to reduce the corrosion of organic acid. The surface morphology of copper after adding BTA corrosion inhibitor was observed by scanning electron microscope, and the effect of BTA on corrosion behavior was analyzed by micro-electrochemical experiment.

3.6.1. OCP Analysis

Figure 12 is a graph showing the change of open circuit potential value with time after adding different concentrations of BTA in acetic acid solutions. It can be seen from the figure that the initial open circuit potential of the red copper sample is negative in the acetic acid solution without corrosion inhibitor. When the corrosion inhibitor was added, the open circuit potential of copper changed from negative to positive, and the initial value of the open circuit potential is higher than the value when no corrosion inhibitor is added, indicating that the corrosion inhibitor gradually adsorbed on the surface of copper and quickly reacted with copper ions to form a dense oxide film, which effectively prevented corrosion. Moreover, the initial open circuit potential value of high concentration BTA is very large, indicating that the possibility of corrosion is extremely low.

3.6.2. SVET Analysis

Figure 13 shows the SVET measurement results of copper soaked for 960 h after adding corrosion inhibitors of different concentrations in acetic acid solution. On the surface of the samples, obvious anode and cathode regions can be seen, but the current densities in the anode regions of several groups of samples are relatively small, and the maximum is not more than 5μA/cm−2, indicating that these regions have a low tendency to corrode.
Figure 13a shows the addition of 0.05 g/L corrosion inhibitor to the acetic acid solution, the current density value fluctuates little, and there are no obvious raised anodic peaks, indicating that the probability of corrosion around is low. There is a dense composite protective film on the surface of the sample after adding the corrosion inhibitor, which further inhibits the occurrence of corrosion. Continue to add an appropriate amount of corrosion inhibitor to the acetic acid solution. As shown in Figure 13b,c, the anode area of the sample continues to shrink, while the cathode area begins to increase, and the total current density value also decreases. When the corrosion inhibitor is 0.5 g/L, the maximum anode current does not exceed 1 μA·cm−2, and the cathode area is the largest. BTA can produce a relatively complete composite protective film on the copper surface well which plays the role of isolating the corrosive medium. When the corrosion inhibitor in the acetic acid solution was increased to 1.0 g/L, the anode area increased, but it still played an anti-corrosion effect. The peak change trend of the three-dimensional map was small, and the BTA molecules in the corrosion inhibitor and Cu continuously form a chemical film through the bonding reaction, resulting in a significant decrease in the electrochemical activity of the sample surface.

3.6.3. Corrosion Morphology Analysis

Using corrosion inhibitor to improve the corrosion resistance of copper in organic acid solution. SEM was used to characterize the corrosion morphology of copper samples in acetic acid solutions with BTA concentrations of 0.05 g/L, 0.1 g/L, 0.5 g/L and 0.1 g/L. As shown in Figure 14, the sample after adding BTA to the acetic acid solution was corroded for 960 h and the surface was relatively smooth without many corrosion pits. However, when the corrosion inhibitor is less, there are still more corrosion pits.

3.6.4. Corrosion Inhibition Mechanism of BTA

Usually, in an oxygen-containing environment, a passivation reaction occurs on the surface of the copper sample, and a layer of Cu2O protective film is formed, which improves the protection of the substrate in a short time. However, when the metal sample is in an acidic solution, the Cu2O film on the surface is prone to dissolution reaction, the distribution is discontinuous, and the protective effect on the matrix is gradually weakened [31]. However, BTA corrosion inhibitor can be used on the surface of metal or metal oxide through chemical bonding to quickly form a composite protective film on the surface of red copper. Among them, there are two ways to form the Cu(I)-BTA film that plays a role in corrosion inhibition [32]:
(1) BTA reacts directly with Cu2O to form Cu(I)-BTA
2BTA + Cu2O = 2Cu(I)-BTA + H2O
(2) Cu2O is quickly dissolved by acid to generate monovalent copper ions and continue to react with BTA to generate Cu(I)-BTA
Cu2O + 2H+ = 2Cu+ + H2O
Cu+ + BTA = Cu(I)-BTA +H+
The Cu(I)-BTA generated by adding BTA to the organic acid solution and the Cu2O generated by copper passivation synergistically inhibit the corrosion of copper, and the formed protective film is called Cu/Cu2O/Cu(I)-BTA composite film. The chemical conversion film Cu(I)-BTA formed after BTA treatment is formed on the metal-solution interface and adsorbed on copper or copper oxide. As shown in Figure 15, the N molecule of BTA is adsorbed to the positively charged Cu2O surface through electrostatic attraction. The reaction produces chain-like Cu(I)-BTA [33]. After adding 0.5 g/L BTA to the acetic acid solution, the anodic polarization process of red copper was obviously inhibited, and the corrosion effect of organic acid could be alleviated most effectively.

4. Conclusions

In this work, the electrochemical corrosion behavior of red copper in organic acid etching solution was studied. The corrosion behavior of red copper in the medium of organic acid pollutants was deeply explored by analyzing the corrosion morphology and corrosion products. The following conclusions were drawn:
  • The corrosion mechanism of red copper in the two groups of organic acid solutions are similar, and the corrosion rates first decrease and then increase with the prolongation of immersion time. The SVET test results show that copper has a raised anodic peak after immersion in formic acid and acetic acid solutions, the surrounding anodic current fluctuates greatly, more and more organic acid pollutants continue to erode the surface of the sample, and the electrochemical activity increases significantly. The corrosion tendency of red copper in formic acid solution is greater, and the corrosion traces on the surface of the substrate are obvious after soaking.
  • With the increase of corrosion time, the corrosion of red copper in the organic acid atmosphere became more serious, the corrosion products on the surface of the sample increased, and the content of Cu decreased significantly. The main corrosion products generated in formic acid atmosphere are copper formate particles, while the main corrosion products generated by red copper in acetic acid atmosphere are cuprous oxide and copper acetate hydrate.
  • After adding BTA, the electrochemical activity of red copper in organic acid etching solution gradually weakened, and the anodic peak of SVET became smaller obviously. When the concentration of corrosion inhibitor BTA is 0.5 g/L, the surface of the sample is relatively flat, and there are no large corrosion pits, indicating that a relatively complete protective film is formed on the copper surface under the action of BTA, which reduces the corrosion rate.

Author Contributions

Conceptualization, Z.Z. and C.Z. (Chuanbo Zheng); methodology, Z.Z.; software, G.Y.; formal analysis, C.Z. (Cheng Zhang); investigation, H.Q.; resources, G.Y.; data curation, C.Z. (Cheng Zhang); writing—original draft preparation, C.Z. (Chuanbo Zheng); writing—review and editing, Z.Z.; project administration, C.Z. (Chuanbo Zheng). All authors have read and agreed to the published version of the manuscript.

Funding

This work was supported by Industry-University-Research Pre-research Project of Zhangjiagang (No. ZKCXY2121).

Institutional Review Board Statement

Not applicable.

Informed Consent Statement

Not applicable.

Data Availability Statement

Not applicable.

Conflicts of Interest

The authors declare no conflict of interest.

References

  1. Huang, H.; Guo, X.; Zhang, G. Effect of direct current electric field on atmospheric corrosion behavior of copper under thin electrolyte layer. Corros. Sci. 2011, 53, 3446–3449. [Google Scholar] [CrossRef]
  2. Chen, X.Z.; Fang, S.Y. Flattery on the development of high-end copper materials. Shanghai Nonferrous Met. 2014, 35, 1–6. [Google Scholar]
  3. Taher, A. Corrosion Behavior of Copper-Nickel Alloy in Marine Environment. Appl. Mech. Mater. 2015, 799–800, 222–231. [Google Scholar] [CrossRef]
  4. Zhukov, A.A.; Polovinchuk, V.P.; Churkin, V.S.; Kaubrak, E.V.; Kuz’Menko, V.A.; Pakhnyushchii, I.O. Effect of copper on the thermal conductivity, wear resistance, and machinability of gray cast iron. Metal. Sci. 1989, 31, 262–265. [Google Scholar] [CrossRef]
  5. Tao, L.; Yin, Y.; Chen, S.; Chang, X.; Sha, C. Super-hydrophobic surfaces improve corrosion resistance of copper in seawater. Electrochimica. Acta 2007, 52, 3709–3713. [Google Scholar]
  6. Herrera, A.; Alcantara, M.; Hinojosa, J.; Castano, V. Studies on the corrosion resistance of various copper alloys. Corros. Rev. 2000, 18, 489–498. [Google Scholar] [CrossRef]
  7. Rahmouni, K.; Keddam, M.; Srhiri, A. Corrosion of copper in 3% NaC1 solution polluted by sulphide ions. Corros. Sci. 2005, 47, 3249–3266. [Google Scholar] [CrossRef]
  8. Barouni, K.; Bazzi, L.; Salghi, R. Some amino acids as corrosion inhibitors for copper in nitric acid solution. Mater. Lett. 2008, 62, 3325–3327. [Google Scholar] [CrossRef]
  9. Cano, E.; Simancas, J.; Narváez, L.; Bastidas, J.M. Study of copper corrosion by acetic acid vapours at 40 and 80% relative humidities. Bol. Soc. Esp. Ceram. Vidr. 2004, 43, 212–215. [Google Scholar] [CrossRef]
  10. Baba, H.; Kodama, T. Localized corrosion of copper in wet organic acid vapor. Zairyo-to-Kankyo 1995, 44, 233–239. [Google Scholar] [CrossRef]
  11. Chandra, K.; Kain, V.; Shetty, P.S.; Kishan, R. Failure analysis of copper tube used in a refrigerating plant. Eng. Fail. Anal. 2014, 37, 1–11. [Google Scholar] [CrossRef]
  12. Bastidas, D.M.; La lglesia, V.M.; Cano, E.; Fajardo, S.; Bastidas, J.M. Kinetic study of formate compounds developed on copper in the presence of fomic acid vapor. Electrochem. Soc. 2008, 155, C578–C582. [Google Scholar] [CrossRef]
  13. Bastidas, D.M.; Criado, M.; Fajardo, S.; La lglesia, V.M.; Cano, E.; Bastidas, J.M. Copper deterioration: Causes, diagnosis and risk minimisation. Mater. Rev. 2010, 55, 99–127. [Google Scholar] [CrossRef]
  14. Cano, E.; Mora, E.M.; Azcaray, H. Copper corrosion initiated by butyric acid vapors. Electrochem. Soc. 2004, 151, B207–B213. [Google Scholar] [CrossRef]
  15. Situmorang, R.S.; Kawai, H. Investigating the mechanism behind ‘Ant Nest’ corrosion on copper tube. Materials 2018, 11, 533. [Google Scholar] [CrossRef] [PubMed]
  16. Notoya, T. Localized corrosion in copper tubes and the effect of anti-tarnishing pretreatment. Mater. Sci. Lett. 1991, 10, 389–391. [Google Scholar] [CrossRef]
  17. Bastidas, D.M.; Cayuela, I.; Rull, J. Ant-nest corrosion of copper tubing in air-conditioning units. Mater. Rev. 2006, 42, 367–381. [Google Scholar] [CrossRef]
  18. Potzelberger, I.; Mardare, A.I.; Hassel, A.W. Screening of catalytic effects on copper-zinc thin film combinatorial libraries for formaldehyde oxidation. Phys. Stat. Solidi 2015, 212, 1184–1190. [Google Scholar] [CrossRef]
  19. Mor, E.D.; Beccaria, A.M. Effects of temperature on the corrosion of copper in sea water at different hydrostatic pressures. Materials 1979, 30, 554–558. [Google Scholar] [CrossRef]
  20. Sánchez-Tovar, R.; Montaés, M.T. The effect of temperature on the galvanic corrosion of the copper/aisi 304 pair in libr solutions under hydrodynamic conditions. Corros. Sci. 2010, 52, 722–733. [Google Scholar] [CrossRef]
  21. Masahiro, S.; Hironobu, T. Ant Nest Corrosion Developed on Copper Tubes Immersed in Copper Formate and Copper Acetate Solutions. Corros. Eng. 2018, 67, 221–226. [Google Scholar]
  22. Cozzarini, L.; Marsich, L.; Schmid, C. Ant-nest corrosion failure of heat exchangers copper pipes. Eng. Fail. Anal. 2020, 109, 104387. [Google Scholar] [CrossRef]
  23. Gil, H.; Leygraf, C.; Tidblad, J. GILDES Model Simulations of the Atmospheric Corrosion of Copper Induced by Low Concentrations of Carboxylic Acids. Electrochem. Sci. 2011, 158, C429. [Google Scholar] [CrossRef]
  24. Singh, V.B.; Singh, R.N. Corrosion and inhibition studies of copper in aqueous solutions of formic acid and acetic acid. Corros. Sci. 1995, 37, 1399–1410. [Google Scholar] [CrossRef]
  25. Elliott, P.; Corbett, R.A. Ant Nest Corrosion-Exploring the Labyrinth. Corros. Rev. 2001, 19, 1–14. [Google Scholar] [CrossRef]
  26. Zhang, D.Q.; Gao, L.X.; Zhou, G.D. Inhibition of copper corrosion in aerated hydrochloric acid solution by heterocyclic compounds containing a mercapto group. Corros. Sci. 2004, 46, 3031–3040. [Google Scholar] [CrossRef]
  27. Klemm, S.O.; Kollender, J.P.; Hassel, A.W. Combinatorial corrosion study of the passivation of aluminium copper alloys. Corros. Sci. 2011, 53, 1–6. [Google Scholar] [CrossRef]
  28. Dai, N.; Zhang, J.; Chen, Y. Heat Treatment Degrading the Corrosion Resistance of Selective Laser Melted Ti-6Al-4V Alloy. Electrochem. Soc. 2017, 164, C428–C434. [Google Scholar] [CrossRef]
  29. Ikeuba, A.I.; Okafor, P.C.; Ita, B.; Obike, A.I.; Abeng, F.E.; Essien, U.; Bamigbola, A. Insitu SVET studies on the current density distribution on dissolving of Mg, MgZn2, Mg2Si and Al4Cu2Mg8Si7 surfaces in NaCl solutions. Anti-Corros. Methods Mater. 2022, 69, 104–110. [Google Scholar] [CrossRef]
  30. Hussain, A. Corrosion Studies Using the Scanning Vibrating Electrode Technique (SVET)—A Brief Review. Curr. Mater. Sci. 2021, 14, 125–130. [Google Scholar] [CrossRef]
  31. Echavarria, A.V.; Echeverria, F.E.; Arroyave, C.; Cano, E.; Bastidas, J.M. Carboxilic acids in the atmosphere and their effect on the degradation of metals. Corros. Rev. 2003, 21, 395–414. [Google Scholar] [CrossRef]
  32. Ling, Y.; Guan, Y.; Han, K.N. Corrosion inhibition of copper with benzotriazole and other organic surfactants. Corros. Sci. 1995, 51, 367–375. [Google Scholar] [CrossRef]
  33. Maciel, J.M.; Jaimes, R.F.V.V.; Corio, P. The characterization of the protective film formed by benzotriazole on the 90/10 copper–nickel alloy surface in H2SO4 media. Corrosion 2008, 50, 879–886. [Google Scholar] [CrossRef]
Figure 1. (a) SVET test schematic diagram; (b) schematic diagram of simulated exposure experiment.
Metals 12 01629 g001
Figure 2. Polarization curves of copper after different soaking time in 1% organic acid solution: (a) Formic acid; (b) Acetic acid.
Metals 12 01629 g002
Figure 3. Curves of corrosion potential and corrosion current of copper after immersion in formic acid and acetic acid solution: (a) Formic acid; (b) Acetic acid.
Metals 12 01629 g003
Figure 4. Results of electrochemical impedance spectroscopy of copper immersed in formic acid solution for different time.
Metals 12 01629 g004
Figure 5. Results of electrochemical impedance spectroscopy of copper immersed in acetic acid solution for different time.
Metals 12 01629 g005
Figure 6. Impedance spectrum equivalent circuit diagram of copper in organic acid.
Metals 12 01629 g006
Figure 7. TP2 copper surface in 1% formic acid and acetic acid solution immersion corrosion diagram: (a) Formic acid, 480 h; (b) Formic acid, 960 h; (c) Acetic acid, 480 h; (d) Acetic acid, 960 h.
Metals 12 01629 g007
Figure 8. SVET images of copper soaked in formic acid and acetic acid solutions for different times: (a) Formic acid, 480 h; (b) Acetic acid, 480 h; (c) Formic acid; 960 h, (d) Acetic acid, 960 h.
Metals 12 01629 g008aMetals 12 01629 g008b
Figure 9. SEM images of copper samples under two different corrosive environmental fluids: (a) Formic acid,15 d; (b) Formic acid,30 d; (c) Acetic acid,15 d; (d) Acetic acid, 30 d.
Metals 12 01629 g009
Figure 10. Surface energy spectrum of copper exposed to organic acids for 30 days: (a) Formic acid; (b) Acetic acid.
Metals 12 01629 g010
Figure 11. X-ray diffraction of copper sample in organic acid environment: (a) Formic acid; (b) Acetic acid; a = Cu; b = Cu2O; c = Cu(OH)2; d = CuO; e = Cu(OH)(HCOO); f= Cu(HCOO)2; g= Cu2(OH)2 CO3; h = Cu(CH3OO)2·2H2O; i = Cu4OH(CH3OO)7·2H2O.
Metals 12 01629 g011
Figure 12. Open circuit potential of TP2 copper in acetic acid solution containing BTA.
Metals 12 01629 g012
Figure 13. SVET images of copper in acetic acid solution with different concentrations of corrosion inhibitors: (a) 0.05 g/L; (b) 0.1 g/L; (c) 0.5 g/L; (d) 1.0 g/L.
Metals 12 01629 g013aMetals 12 01629 g013b
Figure 14. Corrosion of TP2 copper soaked in acetic acid solution with corrosion inhibitor: (a) 0.05 g/L; (b) 0.1 g/L; (c) 0.5 g/L; (d) 1.0 g/L.
Metals 12 01629 g014
Figure 15. The chemical structure of BTA.
Metals 12 01629 g015
Table 1. Self-corrosion potential and self-corrosion current density of copper in formic and acetic acid solution.
SolutionsSoaking Time/hIcorr/μA·cm−2Ecorr/mV
Formic acid00.785−65.5
240.628−59.7
2401.44−78.5
4802.16−84.5
9604.55−90.1
Acetic acid00.437−71.2
240.311−16.6
2400.791−18.2
4801.6−60.7
9603.44−43
Table 2. Equivalent circuit parameters of impedance spectrum fitting of TP2 copper in formic acid solution.
Soaking Time
(h)
Rsol
(Ω · cm2)
Cf
(F/cm2)
Rf
(Ω · cm2)
Cdl
(F/cm2)
Rct
(Ω · cm2)
075.64.94 × 10−63.92 × 1034.1 × 10−52.31 × 10⁴
241603.61 × 10−67.53 × 1031.51 × 10−53.46 × 10⁴
24071.75.76 × 10−55.22 × 1031.13 × 10−41.48 × 10⁴
48050.34.72 × 10−53.04 × 1031.13 × 10−49.70 × 10³
96036.21.11 × 10−40.583 × 1033.43 × 10−31.47 × 10³
Table 3. Equivalent circuit parameters of impedance spectrum fitting of TP2 copper in acetic acid solution.
Soaking Time
(h)
Rsol
(Ω · cm2)
Cf
(F/cm2)
Rf
(Ω · cm2)
Cdl
(F/cm2)
Rct
(Ω · cm2)
01749.8 × 10−610.9 × 1034.46 × 10−54.45 × 10⁴
241969.24 × 10−67.89 × 1032.37 × 10−56.32 × 10⁴
2401822.11 × 10−59.52 × 1035.29 × 10−42.53 × 10⁴
4802023.53 × 10−51.73 × 1036.36 × 10−42.01 × 10⁴
9601343.86 × 10−50.37 × 1037.98 × 10−47.58 × 10³
Table 4. Surface energy spectrum results of copper exposed to organic acids for 30 days (wt%).
Corrosive EnvironmentCuOC
Formic acid40.1242.8317.05
Acetic acid66.6316.6616.71
Publisher’s Note: MDPI stays neutral with regard to jurisdictional claims in published maps and institutional affiliations.

