Article

Strength–Ductility Matching Mechanism for Multi-Phase Microstructure Control of High-Ductility Ship Plate Steel

1
Institute of Engineering Technology, University of Science and Technology Beijing, Beijing 102206, China
2
Collaborative Innovation Center of Steel Technology, University of Science and Technology Beijing, Beijing 100083, China
*
Author to whom correspondence should be addressed.
Metals 2022, 12(10), 1657; https://doi.org/10.3390/met12101657
Submission received: 1 September 2022 / Revised: 26 September 2022 / Accepted: 26 September 2022 / Published: 30 September 2022

Abstract

:
Generally, the development of ship plate steels is mainly concerned with the improvement of strength and toughness, such as F32 and F36. Due to the strength–ductility trade-off, it is difficult to combine excellent ductility with strength improvement, resulting in a poor deformation ability of the traditional ship plate steels during collision. In the present study, a series of high-ductility ship plate steels with property gradients were obtained by multi-phase microstructure control. The strength–ductility matching mechanism was analyzed. Meanwhile, the roles of M/A islands and lamellar pearlites in plastic deformation were also revealed. The results show that the microstructure of “quasi-polygonal ferrite + granular bainite + M/A islands + fewer lamellar pearlites” has the best strength–ductility match. The excellent ductility is mainly dependent on dispersive kernel average misorientation, recrystallized grains without distortion, and soft grains. In addition, the longer branch crack can effectively relieve the stress concentration at the tip of the main crack. Compared with lamellar pearlites, the dispersed M/A island grains have a higher strength contribution and more stable γ-fibers, which is beneficial to delay the appearance of internal micro-voids and micro-cracks. However, the lamellar pearlites can coordinate deformation only when the orientation of thinner lamellae exceeds two.

1. Introduction

In recent years, the development of ships has shown a trend of large scale and high speed, which has led to a high incidence of maritime traffic accidents, and even destroyers equipped with advanced radar systems have not been spared [1]. In addition, when liquefied natural gas (LNG) and liquefied petroleum gas (LPG) carriers collide, they lead to the leakage of cargo and cause environmental pollution [2,3]. The application of FH32 and FH36 high-strength ship plate steels has gradually increased due to both high strength and excellent low-temperature impact toughness [4,5]. Unfortunately, due to the strength–ductility trade-off, it is often difficult to combine excellent ductility with strength improvement [6]. To improve the deformability in the collision, a double-layer hull or the introduction of porous glass heterogeneous spheres has been used [7]. From the perspective of light weight, it is also possible to use high-ductility steel plates to improve the impact energy absorbed while ensuring strength.
By intelligently adjusting the chemical composition and heat treatment process, the multi-phase microstructure control can be achieved, allowing dislocation engineering to break through the limit of the strength–ductility trade-off. During plastic deformation, the soft and hard phases can coordinate with each other [8,9,10]. Based on the above ideas, Dong et al. took the lead in proposing the concept of multi-phase, meta-stable, multi-scale M3 microstructure steels (third-generation low-alloy structural steels) [11]. Compared with the typical ferrite-pearlite (F-P) steels of the first generation and the ferrite-bainite/martensite (F-B/M) steels of the second generation, the high-strength bainite/martensite matrix combined with the transformation-induced plasticity (TRIP) effect of metastable austenite in M3 microstructure steels, which are mostly used as automotive steels and construction steels, can improve the comprehensive properties [12,13,14,15]. Ismail et al. developed fibrous dual-phase steel with excellent crack resistance by sub-temperature quenching of the fully α’ microstructure, and the elongation was only about 20% [16]. This is attributed to the limited improvement in ductility of ferrite-martensite (F-M) dual-phase steels due to significant dislocation strengthening and rigid properties of lath or massive martensite [17,18]. By contrast, Shang et al. obtained stable ultrafine retained austenite by intercritical annealing and tempering of low-carbon copper-bearing medium-manganese steels, so that the TRIP effect occurred in a wide range, and the elongation was up to about 27% [19]. However, due to the high cost and complicated process, the above-mentioned methods are not suitable for the production of ship plate steels. At present, the multi-phase microstructure control of high-ductility ship plate steels to improve the strength–ductility match has been rarely studied.
The multi-phase microstructure control of high-ductility ship plate steels should take ferrite as the matrix to control the morphology and distribution of lamellar pearlites (LP), bainites, and M/A islands. The plastic deformation mechanism of lamellar pearlites is often attributed to cementite lamellae’s orientation, bending, or kink failure. In a certain range, by increasing the hardness difference between the soft and hard phases, the effect of phase transformation strengthening can be fully exerted [20,21,22]. When the deformation substructures within grains undergo sufficient static recovery and recrystallization, the adverse effects of dislocation and substructure strengthening on plasticity can be reduced. M/A island particles have a dispersion strengthening effect similar to that of the second phase, so the introduction of dispersively distributed M/A island particles can achieve a better strength–ductility match [23,24,25]. However, when lath bainite (LB) exists, the M/A islands of the long-axis ratio divide the prior austenite grains and are roughly parallel to the lath ferrites, where a large number of high-density dislocations are accumulated and restricted [26,27].
In this paper, the multi-phase microstructure control with a strength–ductility matching gradient was achieved by using a specific composition and online optimization of the “relaxation-laminar cooling-air cooling” three-stage cooling process. The influence of multi-phase microstructure differences on the contribution of strength and ductility was analyzed, and the fracture behavior during tensile failure of different microstructure types was studied, which promote the development of high-ductility ship plate steels.

2. Materials and Methods

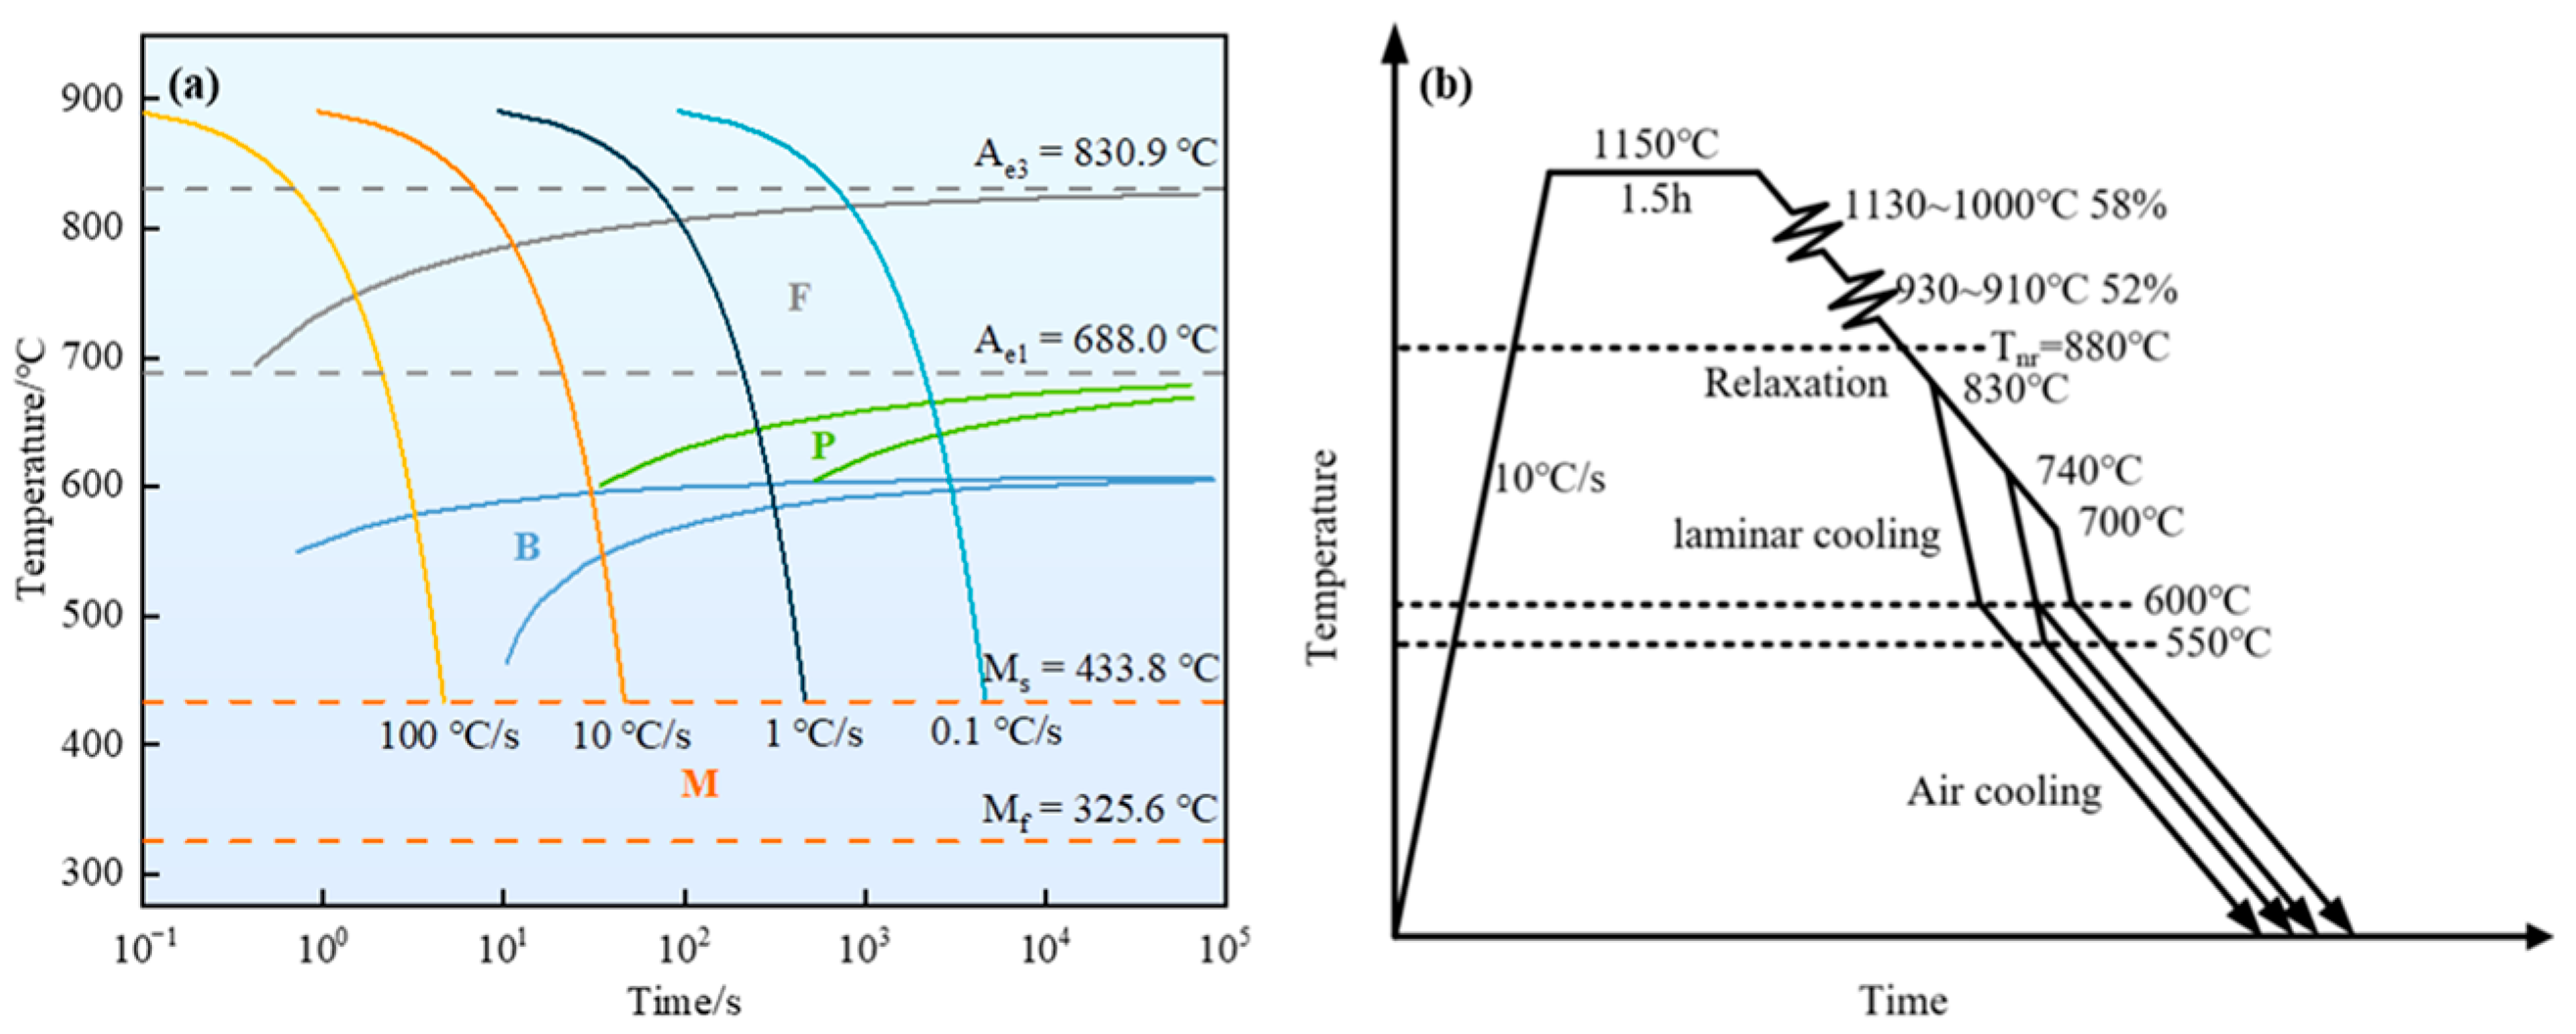
2.1. Materials and Process

The chemical composition of the steel is shown in Table 1. The design of low-C and high-Mn ensures good low-temperature toughness and weldability while making up for the lack of strength, especially tensile strength [28]. Microalloying elements such as Nb, V, and Ti usually prevent the growth of austenite grains at high temperatures, inhibit ferrite nucleation, and produce carbonitride precipitates during cooling. Therefore, considering the effect of grain size, ferrite content, and precipitates on ductility, a small number of microalloying elements should be added, and a better strength–ductility match is mainly obtained through the multi-phase microstructure control of the soft and hard phases [29].
By JMatPro software (version 7.0, Sente Software, Guildford, UK), the temperatures of Ae1 and Ae3 were measured to be 830.9 °C and 688.0 °C, respectively. The continuous cooling transition (CCT) curve is shown in Figure 1a. The nonrecrystallization temperature (Tnr) was calculated to be about 880 °C according to Equation (1) [30].
T nr = 887 + 464 C + 890 Ti + 363 Al 357 Si + 6445 Nb 644 Nb + 732 V 230 V
The billets were prepared by vacuum melting and then forged to a 60 mm thick ingot. Rolled to 12 mm through the thermomechanical control process, the three-stage cooling process of “relaxation-laminar cooling-air cooling” was adopted in the cooling stage (Figure 1b). The billets were rolled in the recrystallization zone after holding at 1150 °C for 1.5 h. Then, they were relaxed to different temperatures to adjust the hardness difference between the soft and hard phases, and the temperature range was controlled from the austenite region to the austenite + ferrite region. For the rough rolling stage: the starting temperature was 1130 °C, the total reduction was 58%, and the final temperature was more than 1000 °C. For the finish rolling stage: the starting temperature was 930 °C, the total reduction was 52%, and the final temperature was 910 °C. The cooling rate in the relaxation stage was measured as 2.5–3.0 °C/s. To realize the transformation of the microstructure from F + P to F + B by adjusting the starting and final cooling temperatures, the laminar cooling rate was determined according to the CCT curve as 15 °C/s. The specific cooling process is presented in Table 2. For the convenience of description, the samples were named ST830-FT600, ST740-FT600, ST700-FT600, and ST740-FT550 according to the starting cooling temperature and final cooling temperature.

2.2. Mechanical Tests

According to the standard of ISO 6892-1: 2019, the tensile tests were carried out on a CMT5386 electronic universal testing machine along the rolling direction (RD) at a tensile rate of 3 mm/min, and the elongation was measured with an Epsilon-3543 extensometer (Epsilon Technology Corp., Jackson, MS, USA). The low-temperature impact tests of −60 °C were carried out on a JBDW-300D ultra-low-temperature impact testing machine (Koohei Test Machine Co., Ltd., Jinan, China) according to the standard of ISO 148-1: 2016. The microhardness was measured by a HV-1000Z micro-Vickers hardness tester (Lab Testing Technology Co., Ltd., Shanghai, China), the experimental load was 500 N, and the holding time was 15 s. The results were taken as the average of three parallel samples. The dimensions of tensile and low-temperature-impact specimens are shown in Figure 2.

2.3. Microstructure Characterization

The specimens were taken along the RD-ND surface of the samples, and the microstructure characteristics were observed by optical microscopy (OM), scanning electron microscopy (SEM, ZEISS GeminiSEM500, Carl Zeiss AG, Oberkochen, Germany), electron backscatter diffraction (EBSD), and transmission electron microscopy (TEM, FEIF 20, FEI Company, Hillsborough, OR, USA). Samples for OM and SEM analysis were mechanically polished and then etched by 4% nitric acid solution. EBSD analysis was performed after electrolytic polishing with 10 vol.% perchloric acid solution (voltage 20 kV; current 1 A). The TEM samples were first ground to 50 μm and then diluted by the double-jet polishing technique (5 vol.% perchloric acid solution + 95 vol.% absolute ethanol).
The separation of F and P + B in metallographic photographs was carried out by a Gaussian filter in Matlab software (version 2020b, The MathWorks Inc., Natick, MA, USA), followed by statistics of phase proportion and grain size using Image pro plus (version 6.0, Media Cybernetic Inc., Silver Springs, MD, USA) and Matlab-linecut. There had been many studies that had effectively distinguished between F, B, and M [31,32,33]. However, none of them could definitely distinguish degenerate LP and granular bainite (GB) with similar contrast. The surface scanning analysis of the C element on LP, degenerate LP, GB, and M/A islands of different morphology by EPMA (EPMA-1720H, Shimadzu, Kyoto, Japan) was combined with SEM and TEM to clarify the microstructure. Macroscopic dislocation density analysis was performed with a D8 Advance X-ray diffractometer (Bruker AXS GmbH, Karlsruhe, Germany) (stepping, CuKα, voltage 40 kV, current 40 mA, 2θ range 40°–140°, step size 0.02°, and dwell time 1.2° per step). According to the Williamson–Hall (W–H) analysis, the effect of grain refinement on the broadening of diffraction peaks could be ignored (Equation (2)) [34,35].
δ hkl cos θ hkl λ 2 e sin θ hkl λ
where δhkl is the full-width at half-maximum (FWHM) of the diffraction peak corresponding to θhkl, and λ is the wavelength of CuKα radiation (0.15418 nm). When only the lattice distortion caused by the micro-strain was considered, the total dislocation density ρ and the dislocation of the crystal plane ρhkl were calculated by Equation (3) and Equation (4), respectively [36,37].
ρ = K e 2 b 2
ρ hkl = δ hkl 2 2 ln 2 π b 2
K is a constant of 14.4 for BCC, b is the Burgers vector of ferrite (b = 0.248 nm), and e is the average effective micro-strain calculated through MDI Jade software (version 6.0, Materials Data Inc., Livermore, CA, USA).

3. Results and Discussion

3.1. Microstructure

3.1.1. Microstructure Recognition

The microstructure of samples, the extraction of the hard phase, and the calculation of the F average grain size using Matlab are shown in Figure 3. The specific results of the grain size and the phase proportion are presented in Table 3. This method shows high accuracy and confidence. Obviously, the same deformation schedule made the number of ferrite nucleation points equal, and the proportions of ferrite were all about 65–75%. The type and size of the hard phase affected the proportion of ferrite to a certain extent. As the starting cooling temperature decreased from 830 °C to 700 °C, the F average grain size increased from 9.59 μm to 12.39 μm, and the microstructure gradually changed from quasi-polygonal (QF) + GB + LP to QF + LP with the larger LP (Figure 3a–i). The closer the starting cooling temperature was to Ae1, the easier it was to obtain banded LP with a larger size. Compared with ST740-FT600 and ST740-FT550 (Figure 3d–f and Figure 3j–l), when the final cooling temperature dropped to the bainite transformation zone, the F + B dual-phase structure with the lath characteristic was formed, and the pearlite transformation zone was completely avoided at this time.
The differences in microstructures are not only reflected between F, P, and B but also in the size and morphology of M/A islands obtained by different cooling schedules, as shown in Figure 3c,f,i,l. It was found that the different transformation temperatures during the continuous cooling process caused the difference in bainite morphology rather than the transformation mechanisms [38]. With the extension of the relaxation process, the size of M/A islands gradually increased. However, when approaching the eutectoid transformation temperature, pearlite was more likely to be produced, and the M/A islands were refined into granular or short films.
The continuous cooling feature made it impossible to obtain pure GB. The EPMA surface scanning results of the C element are shown in Figure 4. The distribution of the C element at the cementite lamellae (Fe3C) was relatively uniform, while the M/A islands distributed at the GB or grain boundaries were enriched to varying degrees. The fine M/A grains and coarse M/A blocks can be observed from the TEM morphology in Figure 5a,b, corresponding to ST830-FT600 and ST740-FT600. Figure 5c,d show the GB and degenerate LP with similar SEM morphology, and the short M/A films are visible in the GB or near the LP. The long rapid cooling time and low carbon content made the crystal structure of martensitic BCT similar to that of ferritic BCC.

3.1.2. XRD and TEM Analysis of Dislocation

The XRD patterns of the samples are shown in Figure 6a, which exhibit obvious broadening of the BCC peaks. A linear fitting was performed using 2sinθhkl/λ in Equation (2) as the horizontal coordinate and δhklcosθhkl/λ as the vertical coordinate to obtain the slopes e (Figure 6b). Then, the slopes were brought into Equation (3), and the total dislocation densities of samples were 5.10 × 10¹³ m−2, 9.66 × 10¹³ m−2, 4.36 × 10¹² m−2, and 1.09 × 10¹⁴ m−2. Figure 6d–f show the amplifications of the diffraction peaks of (110), (211), and (310) crystal planes with obvious intensity or broadening, respectively. The diffraction peaks of ST740-FT550 with the worst ductility have a certain degree of left shift and the broadening effect was more obvious, which indicated that there was more serious lattice distortion inside. For ST740-FT600 and ST740-FT550 with higher total dislocation density, the dislocation density of each crystal plane was also higher than those of the other samples, as shown in Figure 6c. The dislocation density of ST740-FT550 had an obvious peak on the (310) crystal plane, which was related to the obvious broadening of the diffraction peak. Lath bainite was more likely to accumulate a high density of dislocations.
In order to further clarify the difference of macro-dislocation in the microstructure, the dislocations and substructures of the samples were observed by TEM, as shown in Figure 7. A dynamic recrystallization (DRX) grain remaining after rolling in the recrystallization zone was observed in ST830-FT600, and the ferrite grains were in the region of low dislocation density, with dislocation tangles only at the grain boundary bulges (Figure 7a). Although the extension of the relaxation time made the dislocation within the grains aggregate and nucleate to generate static recrystallization (SRX) sub-grains, there were still many unnucleated dislocation tangles in ST740-FT600. The coarse M/A blocks with high dislocation density in Figure 7b were also the reason for increased total dislocation density. More sufficient relaxation and short-time rapid cooling made the SRX in ST700-FT600 fully progressed, F grains with low dislocation density, and LP with only a few parallel dislocation lines (otherwise fine dislocation lines were limited in narrow spacing between cementite lamellae), resulting in a significant reduction in macro-dislocation density (Figure 7c). The lath structures of ST740-FT550 were the key to the highest macro-dislocation density (Figure 7d). In addition to piling up at the lath tips, dislocations also formed many distinct dislocation walls. As grain boundaries tended to move toward high dislocation densities, more grain boundary bulges were generated.

3.2. Mechanical Properties

The engineering stress–strain curves and tensile properties of the samples are shown in Figure 8a,c. Different strength–ductility matches were obtained by adjusting the process, and the low-temperature impact energies were greater than 230 J. For ST700-FT600 with a typical QF + LP structure, which was rapidly cooled only in the pearlite transformation zone, the overall dislocation density within the large QF was low, and the dislocations moved first, resulting in a longer yield plateau. Although ST700-FT600 had the most excellent total elongation of 36.7%, it also lost a certain strength. The yield strength (YS) and tensile strength (TS) were, respectively, only 329 MPa and 459 MPa, and the impact energy was the lowest value of 250 J. Compared with ST740-FT600 and ST740-FT550, as the final cooling temperature decreased from 600 °C to 550 °C, the strength increased significantly, but the total elongation was only 23.8%. When the starting cooling temperature rose to around the Ae1 temperature, the rapid cooling after the relaxation of the γ region tended to generate more GB and M/A island particles with a dispersive distribution, and the small-sized LP decreased greatly. The yield strength, tensile strength, and total elongation were increased to 397 MPa, 528 MPa, and 32.0%, respectively, obtaining the best strength–ductility match.
Figure 9 shows the fracture morphologies of the samples with different ductility after uniaxial tensile tests. As shown in Figure 9a,c, for the high-ductility samples with elongation >30%, dimples and micro-voids were observed at the fracture, which belonged to the typical complete ductile fracture, and also revealed the nucleation and growth mechanism of the holes. The dimples of ST830-FT600 were smaller, mainly parabolic and partially equiaxed, and distributed with micro-voids, while the dimples of ST700-FT600 with better ductility were obviously enlarged and equiaxed, and the micro-voids were also expanded and accompanied by micro-cracks. In the fracture of ST740-FT600 with medium ductility (Figure 9b), there were only sparsely distributed parabolic dimples, and the size of micro-voids was similar to that of ST700-FT600. Some cleavage planes existed between dimples and micro-voids, and the fracture mode was a mixed ductile-brittle fracture. The variation in micro-voids and micro-cracks in Figure 9a–c might be related to the proportion of dispersed M/A island particles and LP. The limited effect of small-sized LP was reflected in the inhibition of crack initiation and propagation during the tensile process, which could cause micro-voids to expand to form micro-cracks. More cleavage planes were present in the least ductile ST740-FT550, as shown in Figure 9d. Although the micro-voids were smaller (similar to ST830-FT600), more of them interconnected to form micro-cracks. The failure mode was a typical cleavage brittle fracture.
Figure 8b shows the work hardening rate curves derived from the true stress–strain curves. The difference in the total elongation of the samples was mainly reflected in the uniform plastic deformation stage. In general, the point on the intersection between the work hardening rate and the true stress–strain curves is defined as the end point of uniform elongation [39]. The ST700-FT600 with the best ductility had a uniform elongation of 17.5%, followed by ST830-FT600, which was 13.0%. It was consistent with the effect of the shape and size of M/A islands in DP steel on the work hardening rate. Increasing the number of small M/A islands could bring a higher work hardening rate [40]. It was generally believed that the work hardening behavior was related to dislocation movement in the stage of uniform plastic deformation [41]. The entanglement and pilling-up caused by the increase in dislocation density further inhibited the movement of dislocation, requiring higher stress and further deformation. As the strain progressed, the work hardening rate gradually decreased, but the samples with better ductility consistently maintained a high work hardening rate. Figure 8d shows the hardness value and hardness difference of the soft and hard phases. The hardness difference of ST830-FT600 and ST700-FT600 with total elongation >30% was 25 HV and 34 HV, which was much larger than the other two groups. The hardness of the two phases had the same trend, and the valley value appeared at ST700-FT600. However, the fluctuation in hardness was mainly related to strength, while the increase in elongation was mainly reflected in the large hardness difference.

3.3. Analysis of Strength–Ductility Matching Mechanism

3.3.1. Effect of Different Microstructure Types

Figure 10a–d show the grain boundary distribution characteristics of the samples by EBSD, where the red line represents the low-angle grain boundary (LAGB) of 2–15°, and the blue line represents the high-angle grain boundary (HAGB) more than 15°. There were fewer substructures in the large-sized QFs, and LAGBs were mainly concentrated near pearlite, bainite, and HAGBs. The specific distributions of grain boundary angles are shown in Figure 10e–h. The proportion of LAGBs gradually increased with the decrease in elongation, which was only 15.4% and 13.3% in ST830-FT600 and ST700-FT600, respectively. For ST740-FT600 and ST740-FT550, in addition to the large proportion of LAGBs, the proportion of 2–5° LAGBs was relatively high, indicating that there were more deformed grains with high dislocation density. Figure 10i–l show the kernel average misorientation (KAM) of the samples. It was precisely because the recrystallization zone rolling avoided the deformed grains in the nonrecrystallization zone as much as possible, there was sufficient time for static recovery and recrystallization after rolling, and the mean KAM of the samples was less than 0.4° [42]. The excellent ductility of ST700-FT600 mainly depended on the ferrite grains with low strain accumulation, which could preferentially undergo plastic deformation and yield during the tensile process, but also sacrificed a certain yield strength.
In general, grains with grain orientation spread (GOS) <1.5° were considered as fully recrystallized grains [43]. Figure 11a–d show the extraction and statistical results of recrystallized grains for each sample. The proportion of recrystallized grains in each sample was 47.7%, 41.1%, 55.4%, and 33.3%, respectively, and the corresponding average recrystallized grain size was 7.48 μm, 7.35 μm, 14.69 μm, and 5.87 μm, as shown in Figure 11e–h. It could be seen that ductility was positively correlated with the proportion and size of recrystallized grains. Comparing ST830-FT600 and ST740-FT600 with similar strength, the average recrystallized grain size was similar, while the proportion of recrystallized grains differed by 6.6% and the elongation differed by 5.1%, which indicated that the effect of proportion on ductility was dominant.
Combined with the grain boundary distribution characteristics, when the mean KAM and LAGB proportion were relatively high, it tended to show high strength and low ductility. However, when there was not much difference between the two values, this rule might not apply. Compared with ST830-FT600, ST740-FT600 had a higher proportion of LAGB and larger mean KAM, but the strength and ductility were decreased. It might be related to the type of microstructure and whether the grains were easy to rotate and slip during plastic deformation.
The Schmidt factor (SF) could indicate the slip system and mode of the grains, and by comparing the SF value, it could be judged whether the grain was easy to twist and slip during plastic deformation [44]. For the BCC phase, the easiest slip system was {110}<111>. The diagrams and frequency distributions of the Schmidt factor under this slip system are shown in Figure 12. Gussev et al. defined grains with SF ≥ 0.4 as soft grains and those with SF < 0.4 as hard grains [45]. The percentages of hard grains in the samples were 2.6%, 5.1%, 1.1%, and 9.4%. It was found that ductility was strongly sensitive to the proportion of soft and hard grains. As the proportion of hard grains decreased, ductility increased significantly. The hard ferrite grains surrounded by pearlite or bainite were present in the band contrast (BC) diagrams of different microstructures. In addition, observing ST700-FT600 (F + P) and ST740-FT550 (F + B), hard grains also existed in LP and LB (Figure 12c,d), where the presence of LB would significantly increase the number of hard grains. However, only a few LP or partial regions of LP showed the hard orientation in ST700-FT600 due to the multi-orientation characteristics of the internal lamellar arrangement.
Correspondingly, for ST830-FT600 and ST740-FT600 with similar properties and microstructures in Figure 12a,b, which both had small-sized LP and a single internal lamellar orientation, it was easier to produce hard grains. Among them, the content of small-sized LP in ST740-FT600 with poor ductility was more prominent, and the proportion of hard grains was also higher. In addition, as a hard and brittle phase, small-sized LP had a weaker improvement in yield strength and tensile strength than the dispersed M/A island particles.
In fact, the difference in the content of the dispersed M/A islands in the two groups, which produced a contribution similar to the precipitates for yield strength, can be calculated by Equation (5) [46]:
σ s = Δ σ SH + Δ σ P + Δ σ SS + Δ σ GB
where ΔσSH, ΔσP, ΔσSS, and ΔσGB represent the strength contributions of dislocations, precipitates, solid solution, and grain boundaries, respectively. Because the two groups had the same composition and similar grain size, the effects of Δσss and ΔσGB were considered on the same level. The extremely low microalloying elements made the effect of ΔσP negligible and the approximate effect could be replaced by the dispersed M/A islands. ΔσSH can be calculated by Equation (6) according to the Taylor hardening law [47]:
Δ σ SH = M α G b ρ
where the Taylor factor M is 3.06, the empirical constant α is 0.23, and the shear modulus G can be calculated as G = E / 2 ( 1 + υ ) , of which the elastic modulus E can be measured through engineering stress–strain curves, and Poisson’s ratio υ is 0.25. Therefore, by substituting the results of dislocation density and elastic modulus into the formula, the ΔσSH values of ST830-FT600 and ST740-FT600 were calculated to be 93 MPa and 128 MPa, respectively. Thus, combined with yield strength, ST830-FT600 mainly based on “QF + GB + M/A islands” exhibited an improvement of about 55 MPa compared to ST740-FT600 due to more dispersed M/A islands.

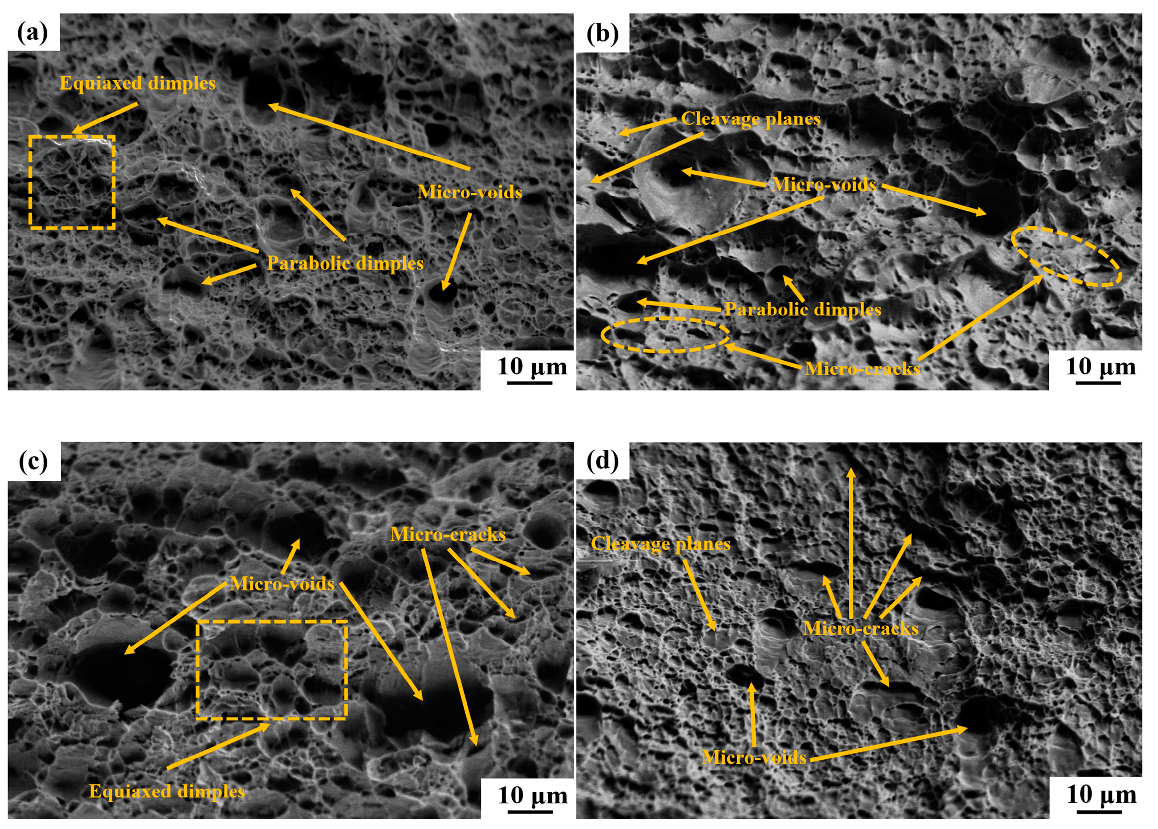
3.3.2. Effect of Branch Cracks on Ductility

The inverse pole figure (IPF) + BC maps of the samples near the main crack are shown in Figure 13a–d. The length of the branch cracks in the diagrams was 94.2 μm, 25.5 μm, 146.7 μm, and 23.1 μm, respectively. It could be seen that the length of the branch crack was positively correlated with stress release and ductility. Cracks branching from the main crack and micro-cracks initiated inside had distinct effects on ductility. Liu et al. declared that when multiple separated laminated ligaments were formed near the main fracture direction, it provided an additional energy release path for fracture, which was beneficial to improving fracture toughness [48]. The same was true for the tensile process; a strong stress concentration was generated at the crack tip when the main crack propagated perpendicular to the axial direction. At this time, if a secondary crack branch approximately parallel to the axial direction was generated, the stress concentration at the crack tip could be effectively relieved. Combined with the hindering effect of the hard phase, the propagation speed of the main crack would be greatly slowed down. Comparing ST830-FT600 and ST700-FT600, although branch cracks reduced the tendency of brittle fracture, their crack propagation paths were slightly different. The hindering effect of hard grains with low SF value offset the crack propagation, as shown in Figure 13e,f. The branch crack in ST830-FT600 constantly changed in direction (Line 1 to Line 3) and gradually became sharper (Line 4). After propagating to a certain extent, it stopped and was not connected to the front micro-voids. In ST700-FT600, however, the crack propagated straight forward, and the width did not change significantly with the propagation.
Figure 14 shows the unilateral variation of disorientation and SF at different propagation stages of the crack. Although the branch crack in ST700-FT600 grew linearly along the axial direction, many internal micro-cracks were derived around them. When the microstructure difference was large, the deformation process and fracture mechanism could be analyzed by fractography. The next section further discusses the role of M/A island particles and small LPs in plastic deformation, by comparing the tensile process of ST830-FT600 and ST740-FT600.

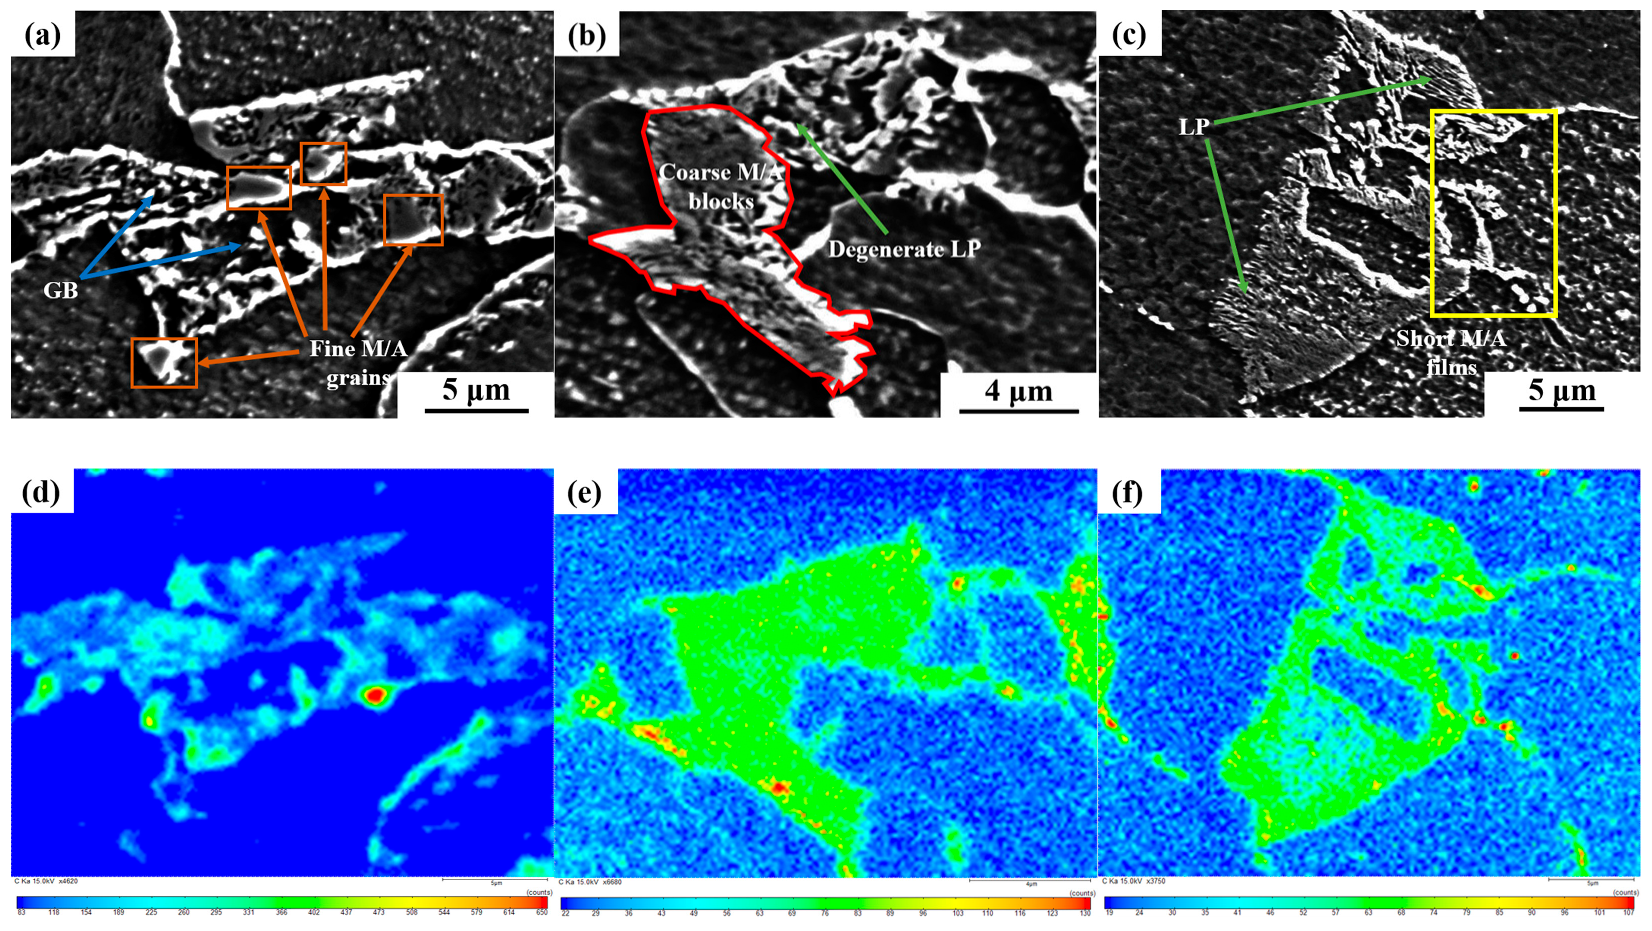
3.3.3. M/A Island and LP on Tensile Failure Behavior

ST830-FT600 and ST740-FT600 were stretched to 5%, 15%, and 25% strain to analyze the ability of M/A island particles and lamellae in pearlite to coordinate deformation. Figure 15a–i show the kernel average misorientation and grain boundary distribution under different strains. The mean KAM and proportion of LAGB under each strain are shown in Figure 16a. The plastic deformation was divided into three stages by three strains. With the increase in the dependent variable, the average KAM value and the proportion of LABG both increased, but the rate of increase in each stage was not the same.
First, in the initial plastic deformation stage (stage I) of 0–5%, the increase in the mean KAM and LAGB proportion of ST740-FT600 with higher original dislocation density was relatively slow. This stage was dominated by dislocation multiplication, and a large amount of LAGBs had not been formed. Then, in the uniform plastic deformation stage (stage II) of 5–15%, the mean KAM of the two groups increased rapidly at a similar rate. Furthermore, the dislocation cells formed by dislocation entanglement in ST740-FT600 were rapidly forming LAGBs, and the dislocations inside the ferrite moved to the grain boundaries, where more severe work hardening and local strains were concentrated under the same strain. Finally, in the nonuniform deformation stage (stage III) of 15–25% (the stage that led to a significant difference in total elongation), ST830-FT600 maintained a high KAM value and uniform strain distribution. However, in ST740-FT600, a large number of dislocation cells evolved into LAGBs, and the proportion of LAGBs increased to a maximum of 81.4% with the appearance of micro-voids and micro-cracks.
The results indicated that the accumulation and uniform distribution of dislocations sustained a more stable plastic deformation [49]. When the microstructure changed from M/A island particles to small LPs, the deformability was weakened. In particular, the dual accumulation of dislocations at the LP grain boundaries and within the lamellae would lead to increased crack initiation probability and propagation instability. Figure 15g shows that the nucleation of micro-voids and the initiation of micro-cracks were basically located between the soft and hard grains, and the point-to-point disorientation did not change much, between 0 and 5°. The point-to-point disorientation and SF distribution of Line 1 to Line 3 are shown in Figure 16b–d. In addition, micro-voids were also nucleated at the ferrite trigeminal grain boundaries, where LPs were often formed. The Taylor factor (TF) reflected the ability of grains to resist plastic deformation. A larger TF value represented a larger deformation work required, which could be used to distinguish between easy-slip and hard-slip grains [50]. Figure 15h shows that all the above defects were located between the hard-slip and easy-slip grains. Area 1 and Area 2 clearly indicate that micro-voids occur between easy-slip and hard-slip grains.
Figure 17 shows the orientation distribution function (ODF) of the φ2 = 45° section in the RD-ND plane under different strains and the standard ODF card. The typical γ-fiber (φ1 = 0–90°, Φ = 55°) and a certain degree of the α-fiber (φ1 = 0°, Φ = 0–55°) were present in undeformed samples. In contrast, ST830-FT600 showed a stronger γ-fiber, while ST740-FT600 also had an obvious (001)<110> cubic texture. It was shown that a higher volume fraction of the γ-fiber in the BCC phase was accompanied by better ductility, and accordingly, the formation of the cubic texture needed to be suppressed to achieve excellent tensile properties [51]. When the strain was in the range of 0–5%, both of them maintained stable γ-fibers, and the α-fibers were enhanced. When the strain reached 15%, the strength of the γ-fiber and α-fiber in ST830-FT600 began to decay, while for ST740-FT600, the γ-fiber disappeared, and the α-fiber evolved into a Goss component. When the strain was increased to 25%, only the Goss component remained in ST740-FT600, while the weak α-fiber and (111)<011 > texture on γ-fiber lines still remained in ST830-FT600. By comparing the texture evolution law during the tensile process, it was found that the dispersed M/A island particles would bring a more stable γ-fiber, which improved the strength and brought a more durable plastic deformation at the same time.
According to the above analysis, there are obvious differences in the plastic deformation ability of M/A island particles and LPs. Figure 18a,c show the distribution of internal defects near the main crack after fracture of ST830-FT600 and ST740-FT600. Combined with the deformation mechanism diagram of M/A islands and LPs during the tensile process (Figure 18e), the respective roles were further analyzed. For ST830-FT600 with the best strength–ductility match, micro-voids were mainly formed by debonding at the interface of the ferrite matrix and dispersed M/A island particles. The plastic deformation of ferrite transferred the stress to the M/A islands, causing stress concentration at the interface, and when the stress reached a certain level, debonding caused deformation relaxation. However, the further propagation of micro-voids was limited by the surrounding M/A islands, making it difficult to interconnect, and resulting in an excellent strength–ductility match. It was demonstrated by the contrast of bright and dark fields of TEM in Figure 18b. However, only when the M/A islands were sufficiently fine could the above-mentioned effects be fully exerted.
In addition to micro-voids, there were also micro-cracks that penetrated through the LP or initiated inside the LP of ST740-FT600. Figure 18d shows the coordination ability of the number of lamella orientations to plastic deformation. When there were multiple orientations in LP, only the cementite lamellae perpendicular to the tensile direction were fractured, and the LP had a good ability to coordinate deformation. When there were double orientations in LP, the plastic deformation ability of pearlite decreased. The fracture of one orientation promoted the formation of micro-voids, but the other orientation provided a channel for dislocation slip, making micro-voids confined between the HAGBs and lamellae. At worst, the single orientation of the lamella had almost no plastic deformation ability. The rupture of the inner lamellae could easily cause the nucleation and growth of micro-voids. When the crack propagated along the HAGBs with high grain boundary energy passed, it would connect to the micro-voids through the LP, and the crack propagation would continue.

4. Conclusions

In the present work, by adjusting the cooling processes for specific compositions, the multi-phase microstructure control was achieved, and a series of steels with different strength–ductility matches were obtained. The analysis of the strength–ductility matching mechanism with different microstructures and the deformation failure behavior during the tensile process were carried out. The main conclusions are as follows:
(1)
After image recognition of GB, M/A islands, and degenerate LP, it was confirmed that ST830-FT740 with the structure of “QF + GB + M/A islands + fewer LPs” had the best strength and ductility match.
(2)
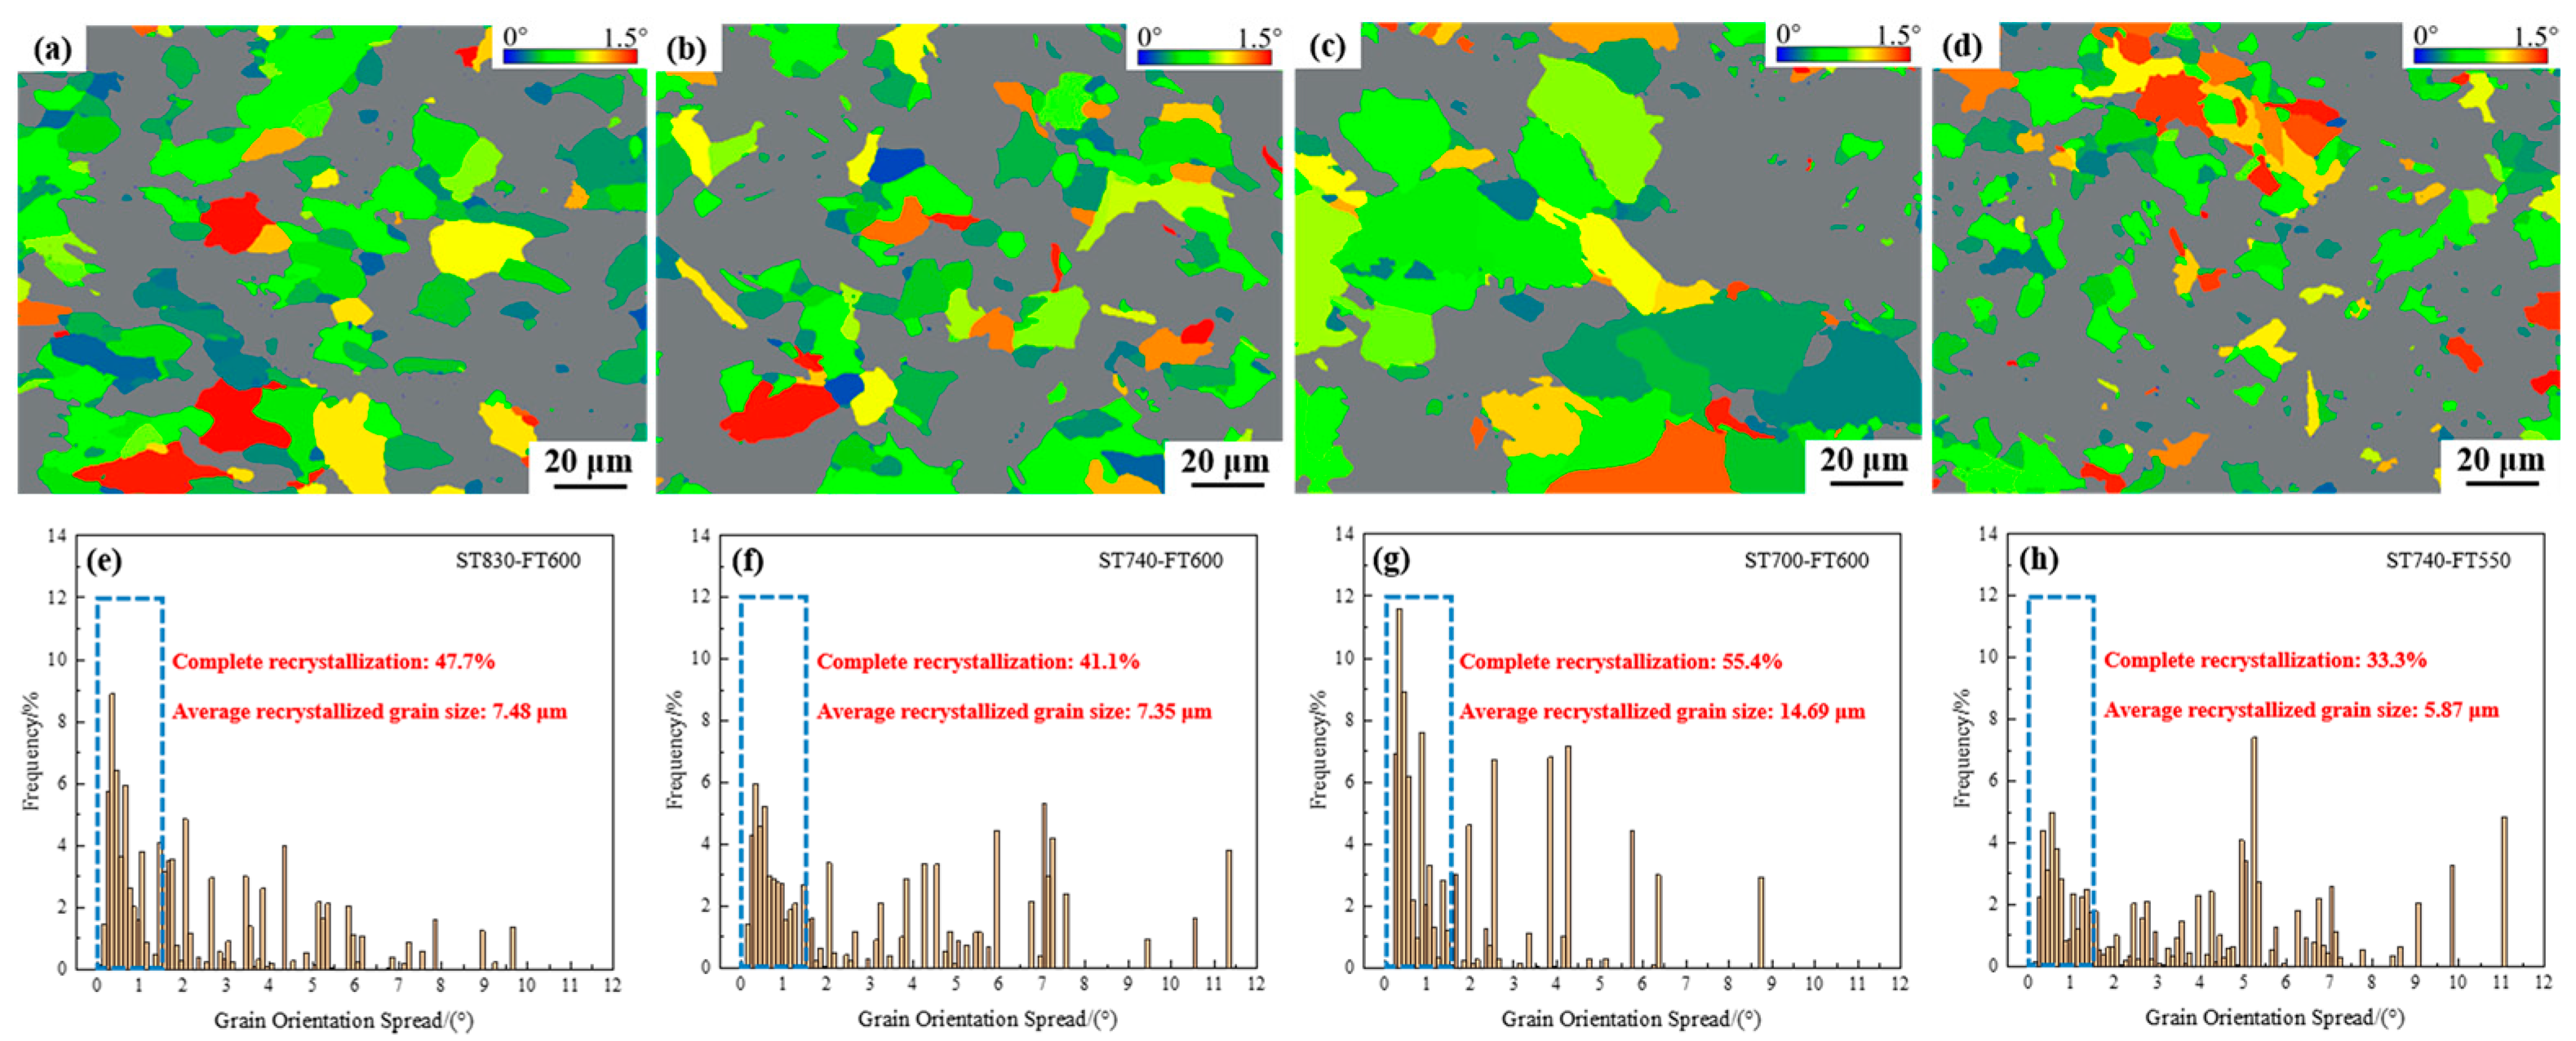
The ductility decreased linearly with the decrease in dislocation density, the increase in the proportion of LAGBs and mean KAM, and the decrease in the proportion of recrystallized grains and soft grains. There was an upward trend in strength, but anomalies occurred when the structure was similar. Compared with ST740-FT600 whose structure was dominated by more LPs and fewer M/A islands, the dispersion strengthening effect of more M/A islands in ST830-FT600 contributed about 55 MPa to the improvement of yield strength.
(3)
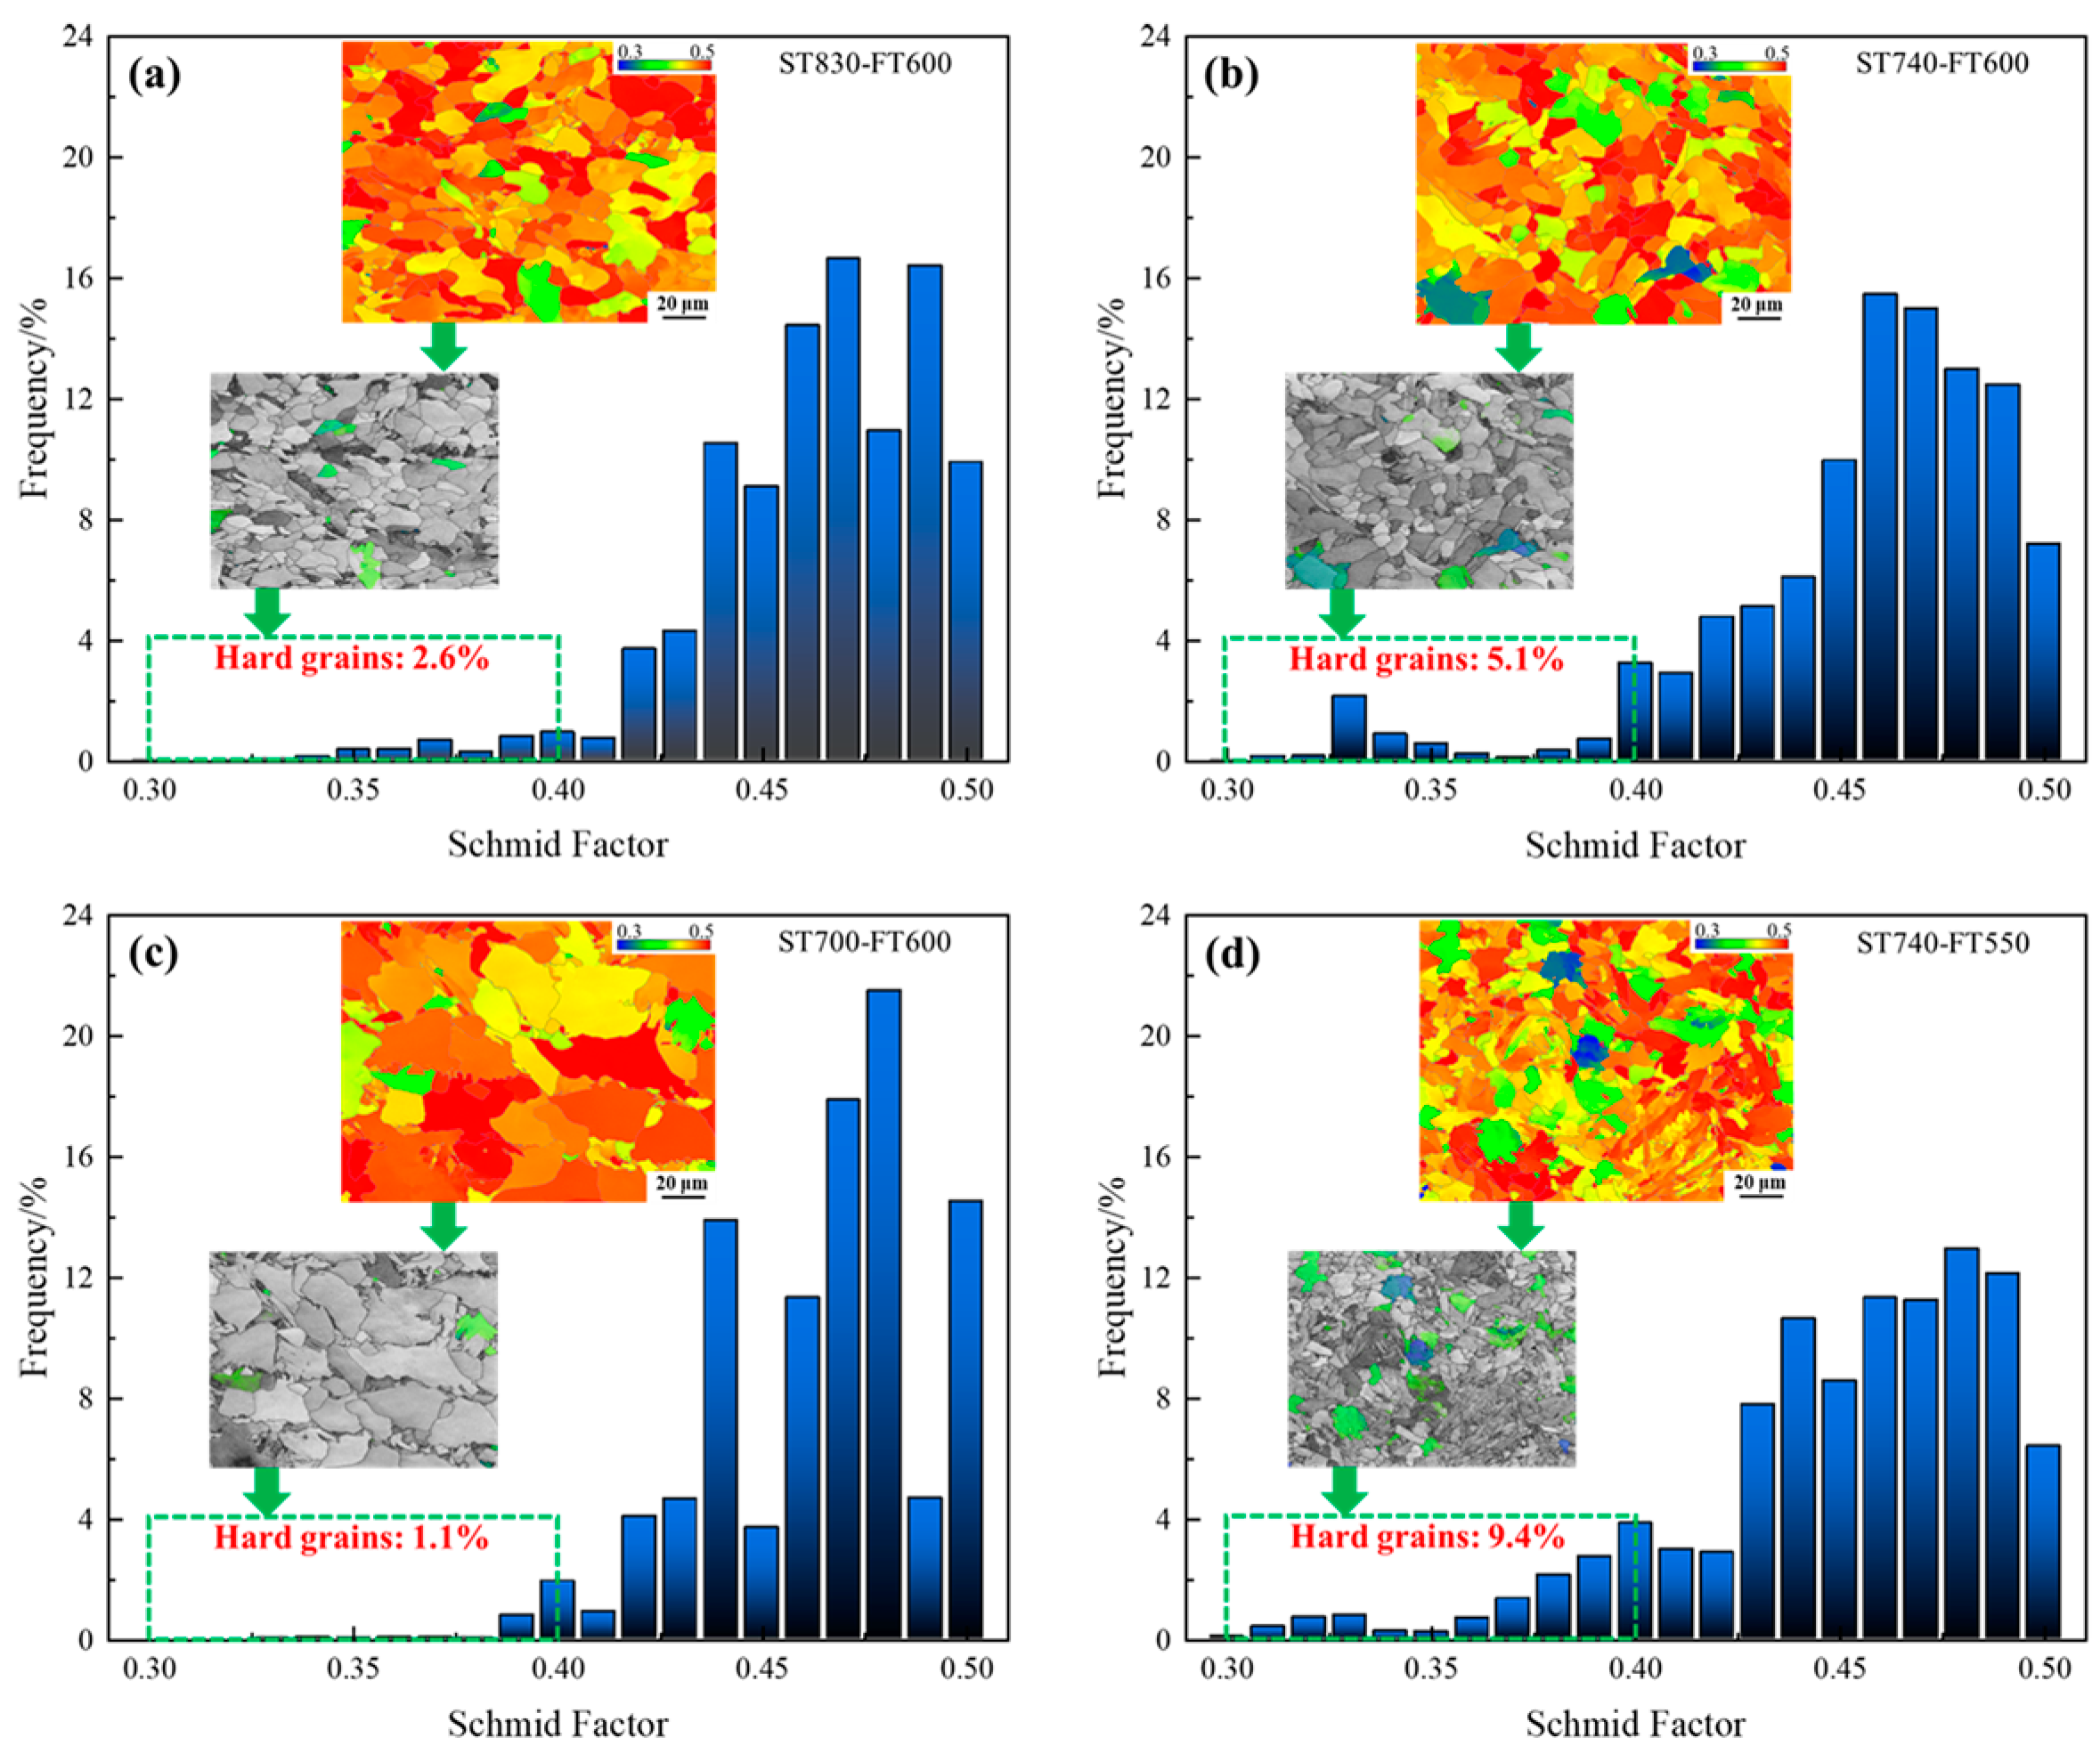
The longer branch crack generated at the main crack effectively relieved the stress concentration at the crack tip, which was beneficial to the improvement of ductility. The crack originated from the vicinity of soft grains, and the hard grains with low SF had a more significant effect on crack deflection than HAGBs.
(4)
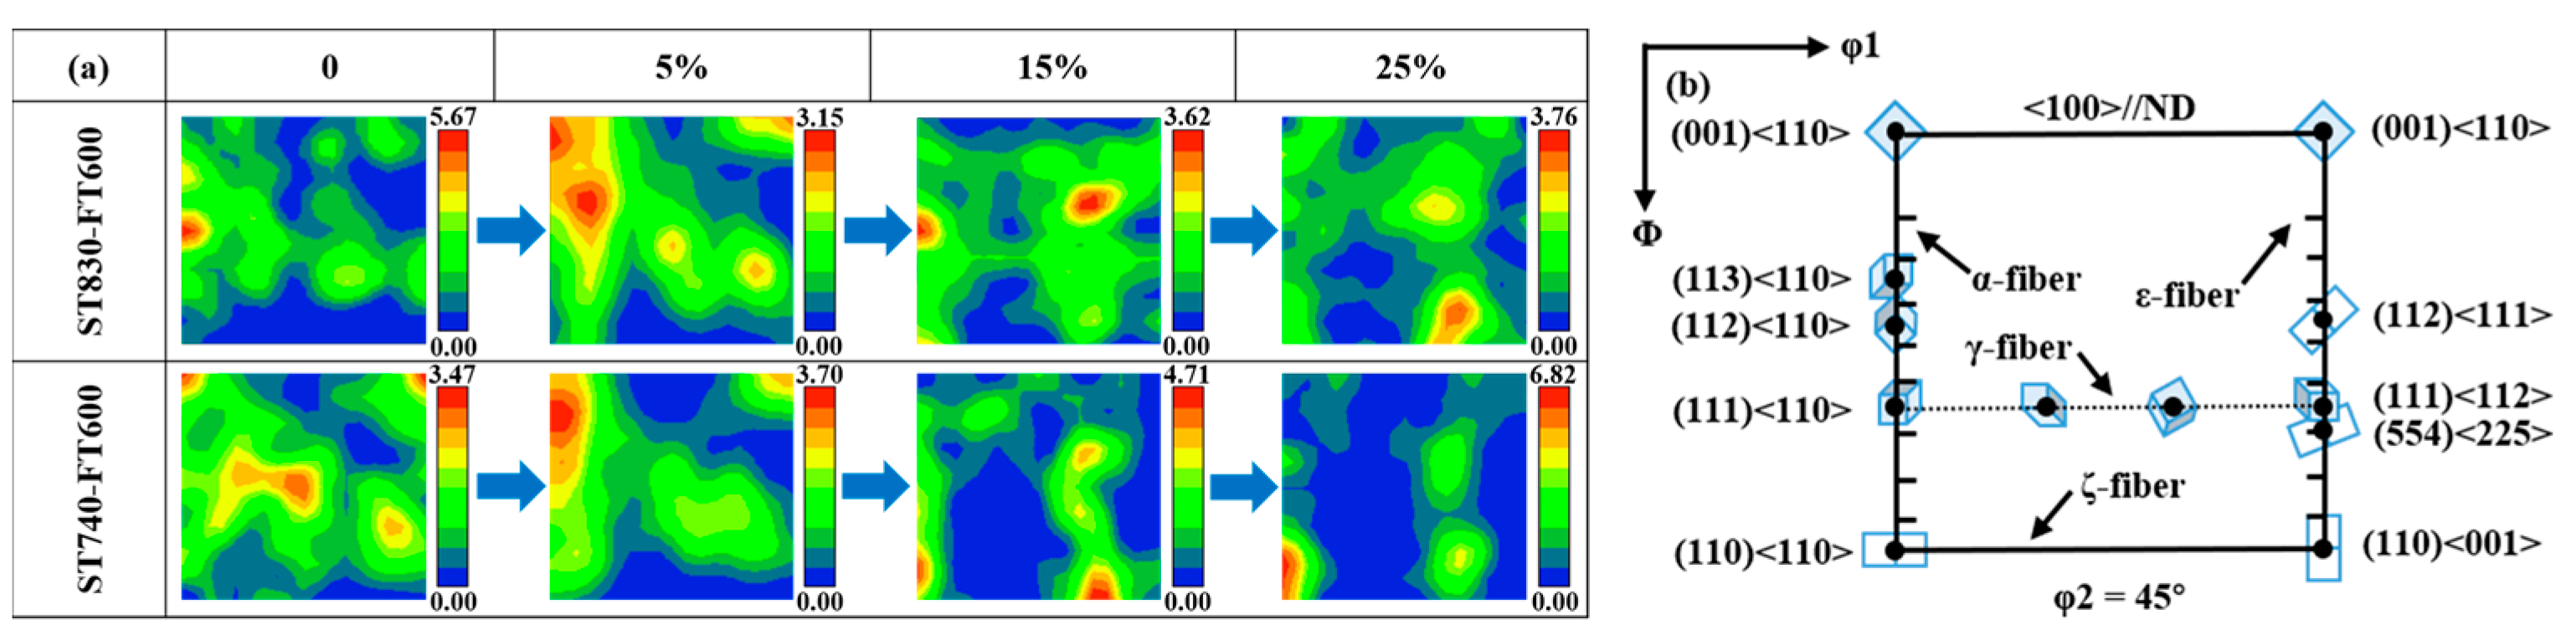
The dispersed M/A islands were beneficial to the accumulation and uniform distribution of dislocations, and also brought about a more stable γ-fiber, which slowed down the generation of defects and maintained plastic deformation for a longer time. Fine M/A island grains had a hindering effect on the growth of micro-voids, while LPs mainly depended on the orientation of the lamellae, and only multiple orientations had the ability to coordinate deformation.

Author Contributions

Conceptualization, H.W. and Z.M.; investigation, J.L.; writing—original draft preparation, E.W.; funding acquisition, H.W. All authors have read and agreed to the published version of the manuscript.

Funding

This research was funded by the National Key R&D Program of China (2021YFB3701700).

Institutional Review Board Statement

Not applicable.

Informed Consent Statement

Not applicable.

Data Availability Statement

The data presented in this study are contained within the article.

Acknowledgments

The authors are grateful to those who supported this research.

Conflicts of Interest

The authors declare no conflict of interest.

References

  1. Mallam, S.C.; Marit, W.A.; Aas, J. Reintroducing the Sharp-End Operator to Organizational Learning: How Accident Reports Are Used by Maritime Officers. Saf. Sci. 2022, 147, 105632. [Google Scholar] [CrossRef]
  2. Park, M.; Kim, J.; Pyo, C.; Son, J.; Kim, J. Research for the Optimal Flux-Cored Arc Welding Process of 9% Nickel Steel Using Multi Object Optimization with Solidification Crack Susceptibility. Materials 2021, 14, 1659. [Google Scholar] [CrossRef] [PubMed]
  3. Song, Z.J.; Hu, Z.Q.; Ringsberg, J.W. Critical Void Volume Fraction Identification Based on Mesoscopic Damage Model for NVA Shipbuilding Steel. J. Mar. Sci. Appl. 2019, 18, 444–456. [Google Scholar] [CrossRef]
  4. Wang, D.; Zhang, P.; Peng, X.D.; Yan, L.; Li, G.L. Comparison of Microstructure and Mechanical Properties of High Strength and Toughness Ship Plate Steel. Materials 2021, 14, 5886. [Google Scholar] [CrossRef]
  5. Luo, Y.; Li, W.; Zhou, P.W.; Xu, Y.T.; Pang, H.Y.; Zhong, N.; Jiao, H.S.; Jin, X.J. Effect of Tempering on Carbides and Hydrogen Embrittlement in E690 High Strength Marine Structural Steel. J. Iron Steel Res. Int. 2022, 1–14. [Google Scholar] [CrossRef]
  6. He, B.B.; Hu, B.; Yen, H.W.; Cheng, G.J.; Wang, Z.K.; Luo, H.W.; Huang, M.X. High Dislocation Density-Induced Large Ductility in Deformed and Partitioned Steels. Science 2017, 357, 1029–1032. [Google Scholar] [CrossRef]
  7. Okawa, T.; Yanagita, K.; Inami, A.; Yamada, Y.; Ichikawa, K.; Shirahata, H.; Ishida, K.; Inai, T. Development and Adoption of Steel Plate (NSafeTM-Hull) for Shipbuilding with Improved Collision Safety. Nip. Steel Sum. Metal Technol. Rep. 2015, 110, 30–35. [Google Scholar]
  8. Man, Z.Q.; Yu, W.; Yang, H.; Chang, W.G.; Cao, Y.F. Effects of Final Cooling Temperature on Microstructure Transformation and Properties of Q550 Low Carbon Bainite Steel. Mater. Sci. Forum 2020, 993, 550–558. [Google Scholar] [CrossRef]
  9. Isavand, S.; Assempour, A. Strain Localization and Deformation Behavior in Ferrite-Pearlite Steel Unraveled by High-Resolution in-Situ Testing Integrated with Crystal Plasticity Simulations. Int. J. Mech. Sci. 2021, 200, 106441. [Google Scholar] [CrossRef]
  10. Wu, M.; Zhao, F.; Che, J.L.; Jiang, B.; Zhang, C.L.; Liu, Y.Z. The Toughening Mechanisms of Microstructural Variation and Ni Addition in Direct-Cooled Microalloyed Ferrite-Pearlite Steels. Mater. Sci. Eng. A 2018, 738, 353–361. [Google Scholar] [CrossRef]
  11. Dong, H.; Wang, M.Q.; Weng, Y.Q. Performance Improvement of Steels through M3 Structure Control. In Advanced Steels; Springer: Berlin/Heidelberg, Germany, 2010; Volume 45, pp. 1–7. [Google Scholar]
  12. Janakiram, S.; Phani, P.S.; Ummethala, G.; Malladi, S.K.; Gautam, J.; Kestens, L.A.I. New Insights on Recovery and Early Recrystallization of Ferrite-Pearlite Banded Cold Rolled High Strength Steels by High Speed Nanoindentation Mapping. Scr. Mater. 2021, 194, 113676. [Google Scholar] [CrossRef]
  13. Allain, S.Y.P.; Roth, A.; Bouaziz, O.; D’Eramo, E. Microstructure-Based Behavior Law for Globular Pearlitic Steels. J. Mater. Res. Technol. 2019, 8, 3373–3376. [Google Scholar] [CrossRef]
  14. Zhao, J.W.; Jiang, Z.Y. Thermomechanical Processing of Advanced High Strength Steels. Prog. Mater. Sci. 2018, 94, 174–242. [Google Scholar] [CrossRef]
  15. Zhou, W.H.; Wang, X.L.; Venkatsurya, P.K.C.; Guo, H.; Shang, C.J.; Misra, R.D.K. Structure-Mechanical Property Relationship in a High Strength Low Carbon Alloy Steel Processed by Two-Step Intercritical Annealing and Intercritical Tempering. Mater. Sci. Eng. A 2014, 607, 569–577. [Google Scholar] [CrossRef]
  16. Ismail, K.; Perlade, A.; Jacques, P.J.; Pardoen, T. Outstanding Cracking Resistance of Fibrous Dual Phase Steels. Acta Mater. 2021, 207, 116700. [Google Scholar] [CrossRef]
  17. Wang, J.; Li, W.; Zhu, X.; Zhang, L.Q. Effect of Martensite Morphology and Volume Fraction on the Low-Temperature Impact Toughness of Dual-Phase Steels. Mater. Sci. Eng. A 2022, 832, 142424. [Google Scholar] [CrossRef]
  18. Li, X.H.; Liu, Y.C.; Gan, K.F.; Dong, J.; Liu, C.X. Acquiring a Low Yield Ratio Well Synchronized with Enhanced Strength of HSLA Pipeline Steels through Adjusting Multiple-Phase Microstructures. Mater. Sci. Eng. A 2020, 785, 139350. [Google Scholar] [CrossRef]
  19. Hu, B.; Rong, X.Q.; Tian, C.; Yu, Y.S.; Guo, H.; Misra, R.D.K.; Shang, C.J. Nanoscale Precipitation and Ultrafine Retained Austenite Induced High Strength-Ductility Combination in a Newly Designed Low Carbon Cu-Bearing Medium-Mn Steel. Mater. Sci. Eng. A 2021, 822, 141685. [Google Scholar] [CrossRef]
  20. Izotov, V.I.; Pozdnyakov, V.A.; Luk’yanenko, E.V.; Usanova, O.Y.; Filippov, G.A. Influence of the Pearlite Fineness on the Mechanical Properties, Deformation Behavior, and Fracture Characteristics of Carbon Steel. Phys. Met. Met. 2007, 103, 519–529. [Google Scholar] [CrossRef]
  21. Xu, P.W.; Liang, Y.; Li, J.; Meng, C. Further Improvement in Ductility Induced by the Refined Hierarchical Structures of Pearlite. Mater. Sci. Eng. A 2019, 745, 176–184. [Google Scholar] [CrossRef]
  22. Bansal, G.K.; Srivastava, V.C.; Ghosh Chowdhury, S. Role of Solute Nb in Altering Phase Transformations during Continuous Cooling of a Low-Carbon Steel. Mater. Sci. Eng. A 2019, 767, 138416. [Google Scholar] [CrossRef]
  23. Sun, C.; Liu, S.L.; Misra, R.D.K.; Li, Q.; Li, D.H. Influence of Intercritical Tempering Temperature on Impact Toughness of a Quenched and Tempered Medium-Mn Steel: Intercritical Tempering versus Traditional Tempering. Mater. Sci. Eng. A 2018, 711, 484–491. [Google Scholar] [CrossRef]
  24. Elshaer, R.N.; El-Fawakhry, M.K.; Farahat, A.I.Z. Microstructure Evolution, Mechanical Properties and Strain Hardening Instability of Low and Medium Carbon Quenching & Partitioning Steels. Met. Mater. Int. 2022, 28, 1433–1444. [Google Scholar]
  25. Zhu, W.T.; Cui, J.J.; Chen, Z.Y.; Zhao, Y.; Chen, L.Q. Correlation of Microstructure Feature with Impact Fracture Behavior in a TMCP Processed High Strength Low Alloy Construction Steel. Acta Met. Sin. 2022, 35, 527–536. [Google Scholar] [CrossRef]
  26. Sun, D.Y.; Liu, C.B.; Long, X.Y.; Zhao, X.J.; Li, Y.G.; Lv, B.; Zhang, F.C.; Yang, Z.N. Effect of Introduced Vanadium Carbide at the Bay Region on Bainite Transformation, Microstructure and Mechanical Properties of High-Carbon and High-Silicon Steel. Mater. Sci. Eng. A 2021, 811, 141055. [Google Scholar] [CrossRef]
  27. De-Castro, D.; Eres-Castellanos, A.; Vivas, J.; Caballero, F.G.; San-Martín, D.; Capdevila, C. Morphological and Crystallographic Features of Granular and Lath-like Bainite in a Low Carbon Microalloyed Steel. Mater. Charact. 2022, 184, 111703. [Google Scholar] [CrossRef]
  28. He, X.K.; Yang, Z.Q.; Wang, Z.; Qiao, S.B.; Liu, Z.D. Effect of Mn Content on Microstructure, Tensile and Impact Properties of SA508Gr.4N Steel for Reactor Pressure Vessel. J. Iron Steel Res. Int. 2020, 27, 461–470. [Google Scholar] [CrossRef]
  29. Xiong, W.M.; Song, R.B.; Huo, W.F.; Yu, P.; Qin, S.; Liu, Z.J. Microstructure Characteristics and Impact Fracture Mechanisms of Nb and V–Ti Micro-Alloyed Offshore Platform Steels. Vacuum 2022, 195, 110709. [Google Scholar] [CrossRef]
  30. Akhtar, M.N.; Khan, M.; Khan, S.A.; Afzal, A.; Subbiah, R.; Ahmad, S.N.; Husain, M.; Butt, M.M.; Othman, A.R.; Bakar, E.A. Determination of Non-Recrystallization Temperature for Niobium Microalloyed Steel. Materials 2021, 14, 2639. [Google Scholar] [CrossRef]
  31. Zajac, S.; Schwinn, V.; Tacke, K.H. Characterisation and Quantification of Complex Bainitic Microstructures in High and Ultra-High Strength Linepipe Steels. Mater. Sci. Forum 2005, 500–501, 387–394. [Google Scholar] [CrossRef]
  32. Xu, X.N.; Tian, Y.; Ye, Q.B.; Misra, R.D.K.; Wang, Z.D. The Significant Impact of the Characteristics of Granular Structure and Granular Bainite on the Mechanisms Contributing to Strength–Ductility Combination. J. Mater. Eng. Perform. 2021, 30, 7479–7487. [Google Scholar] [CrossRef]
  33. Tomaz, R.F.; Brandão Santos, D.; Camey, K.; Barbosa, R.; Spangler Andrade, M.; Pérez Escobar, D. Complex Phase Quantification Methodology Using Electron Backscatter Diffraction (EBSD) on Low Manganese High Temperature Processed Steel (HTP) Microalloyed Steel. J. Mater. Res. Technol. 2019, 8, 2423–2431. [Google Scholar] [CrossRef]
  34. Mukherjee, P.; Sarkar, A.; Barat, P.; Bandyopadhyay, S.K.; Sen, P.; Chattopadhyay, S.K.; Chatterjee, P.; Chatterjee, S.K.; Mitra, M.K. Deformation Characteristics of Rolled Zirconium Alloys: A Study by x-Ray Diffraction Line Profile Analysis. Acta Mater. 2004, 52, 5687–5696. [Google Scholar] [CrossRef]
  35. Mote, V.; Purushotham, Y.; Dole, B. Williamson-Hall Analysis in Estimation of Lattice Strain in Nanometer-Sized ZnO Particles. J. Theor. Appl. Phys. 2012, 6, 6–13. [Google Scholar] [CrossRef]
  36. Li, X.; Wiskel, J.B.; Henein, H.; Ivey, D.G.; Omotoso, O. Characterization of Microstructure in High Strength Microalloyed Steels Using Quantitative X-Ray Diffraction. In Proceedings of the Biennial International Pipeline Conference, Calgary, AB, Canada, 29 September–3 October 2008; Volume 3, pp. 445–451. [Google Scholar]
  37. Zhu, W.X.; Zhao, F.; Yin, S.; Liu, Y.; Yang, R.G. Effect of Tensile Deformation on Residual Stress of GH4169 Alloy. Materials 2021, 14, 1773. [Google Scholar] [CrossRef] [PubMed]
  38. Caballero, F.G.; Roelofs, H.; Hasler, S.; Capdevila, C.; Chao, J.; Cornide, J.; Garcia-Mateo, C. Influence of Bainite Morphology on Impact Toughness of Continuously Cooled Cementite Free Bainitic Steels. Mater. Sci. Technol. 2012, 28, 95–102. [Google Scholar] [CrossRef]
  39. Sendrowicz, A.; Myhre, A.O.; Yasnikov, I.S.; Vinogradov, A. Stored and Dissipated Energy of Plastic Deformation Revisited From the Viewpoint of Dislocation Kinetics Modelling Approach. Acta Mater. 2022, 237, 118190. [Google Scholar] [CrossRef]
  40. Mirzadeh, H.; Alibeyki, M.; Najafi, M. Unraveling the Initial Microstructure Effects on Mechanical Properties and Work-Hardening Capacity of Dual-Phase Steel. Metall. Mater. Trans. A Phys. Metall. Mater. Sci. 2017, 48, 4565–4573. [Google Scholar] [CrossRef]
  41. Chen, Y.N.; Wu, Z.C.; Wu, G.; Wang, N.; Zhao, Q.Y.; Luo, J.H. Investigation on Micromechanism of Ferrite Hardening after Pre-Straining with Different Strain Rates of Dual-Phase Steel. Mater. Sci. Eng. A 2021, 802, 140657. [Google Scholar] [CrossRef]
  42. Lobanov, M.L.; Danilov, S.V.; Pastukhov, V.I.; Averin, S.A.; Khrunyk, Y.Y.; Popov, A.A. The Crystallographic Relationship of Molybdenum Textures after Hot Rolling and Recrystallization. Mater. Des. 2016, 109, 251–255. [Google Scholar] [CrossRef]
  43. Radwański, K. Application of FEG-SEM and EBSD Methods for the Analysis of the Restoration Processes Occurring during Continuous Annealing of Dual-Phase Steel Strips. Steel Res. Int. 2015, 86, 1379–1390. [Google Scholar] [CrossRef]
  44. Liu, Z.G.; Li, P.J.; Xiong, L.T.; Liu, T.Y.; He, L.J. High-Temperature Tensile Deformation Behavior and Microstructure Evolution of Ti55 Titanium Alloy. Mater. Sci. Eng. A 2017, 680, 259–269. [Google Scholar] [CrossRef]
  45. Gussev, M.N.; Field, K.G.; Busby, J.T. Deformation Localization and Dislocation Channel Dynamics in Neutron-Irradiated Austenitic Stainless Steels. J. Nucl. Mater. 2015, 460, 139–152. [Google Scholar] [CrossRef]
  46. Ganji, R.S.; Sai Karthik, P.; Bhanu Sankara Rao, K.; Rajulapati, K.V. Strengthening Mechanisms in Equiatomic Ultrafine Grained AlCoCrCuFeNi High-Entropy Alloy Studied by Micro- and Nanoindentation Methods. Acta Mater. 2017, 125, 58–68. [Google Scholar] [CrossRef]
  47. Zhang, Y.Y.; Wu, H.B.; Yu, X.P.; Tang, D.; Yuan, R.; Sun, H. Microstructural Evolution and Strengthening Mechanisms in CrxMnFeNi High-Entropy Alloy. J. Mater. Res. Technol. 2021, 12, 2114–2127. [Google Scholar] [CrossRef]
  48. Liu, L.; Yu, Q.; Wang, Z.; Ell, J.; Huang, M.X.; Ritchie, R.O. Making Ultrastrong Steel Tough by Grain-Boundary Delamination. Science 2020, 368, 1347–1352. [Google Scholar] [CrossRef] [PubMed]
  49. Masoumi, M.; Silva, C.C.; De Abreu, H.F.G. Effect of Rolling in the Recrystallization Temperature Region Associated with a Post-Heat Treatment on the Microstructure, Crystal Orientation, and Mechanical Properties of API 5L X70 Pipeline Steel. Mater. Res. 2017, 20, 151–160. [Google Scholar] [CrossRef]
  50. Sarkar, A.; Sanyal, S.; Bandyopadhyay, T.K.; Mandal, S. Implications of Microstructure, Taylor Factor Distribution and Texture on Tensile Properties in a Ti-Added Fe-Mn-Al-Si-C Steel. Mater. Sci. Eng. A 2019, 767, 138402. [Google Scholar] [CrossRef]
  51. Modak, P.; Patra, S.; Mitra, R.; Chakrabarti, D. Effect of Starting As-Cast Structure on the Microstructure–Texture Evolution During Subsequent Processing and Finally Ridging Behavior of Ferritic Stainless Steel. Metall. Mater. Trans. A Phys. Metall. Mater. Sci. 2018, 49, 2219–2234. [Google Scholar] [CrossRef]
Figure 1. (a) CCT curve; (b) schematic diagram of the thermomechanical control process.
Metals 12 01657 g001
Figure 2. Dimensions of tensile and low-temperature-impact specimens.
Metals 12 01657 g002
Figure 3. Metallographic photographs, schematic diagrams of phase separation, F grain size distributions, and SEM micrographs. (ac) ST830-FT600, (df) ST740-FT600, (gi) ST700-FT600, and (jl) ST740-FT550.
Metals 12 01657 g003
Figure 4. Distribution of C elements in different morphological microstructures. (a,d) GB and fine M/A grains, (b,e) coarse M/A blocks, and (c,f) LP and short M/A films.
Metals 12 01657 g004
Figure 5. TEM micrographs of (a) fine M/A grains, (b) coarse M/A blocks, (c) GB, and (d) degenerate LP and short M/A films. The solid red circles indicate areas of the SAED pattern.
Metals 12 01657 g005
Figure 6. (a) XRD diffraction patterns; (b) linear fitting of average effective microstrain; (c) total dislocation density and crystal plane dislocation density; (df) crystal plane diffraction peak magnifications.
Metals 12 01657 g006
Figure 7. TEM micrographs of dislocations and substructures. (a) ST830-FT600, (b) ST740-FT600, (c) ST700-FT600, and (d) ST740-FT550.
Metals 12 01657 g007
Figure 8. (a) Engineering stress–strain curves; (b) work hardening rate curves; (c) tensile properties; (d) hardness difference.
Metals 12 01657 g008
Figure 9. Micrographs of tensile fracture. (a) ST830-FT600, (b) ST740-FT600, (c) ST700-FT600, and (d) ST740-FT550.
Metals 12 01657 g009
Figure 10. Grain boundary distribution maps, disorientation angle distribution, and kernel average misorientation of (a,e,i) ST830-FT600, (b,f,j) ST740-FT600, (c,g,k) ST700-FT600, and (d,h,l) ST740-FT550.
Metals 12 01657 g010
Figure 11. Maps of recrystallized grains distribution and grain orientation spread. (a,e) ST830-FT600, (b,f) ST740-FT600, (c,g) ST700-FT600, and (d,h) ST740-FT550.
Metals 12 01657 g011
Figure 12. Schmidt factor distribution of the samples. (a) ST830-FT600, (b) ST740-FT600, (c) ST700-FT600, and (d) ST740-FT550.
Metals 12 01657 g012
Figure 13. IPF+BC maps near the main crack of (a) ST830-FT600, (b) ST740-FT600, (c) ST700-FT600, and (d) ST740-FT550; (e,f) SF maps of ST830-FT600.
Metals 12 01657 g013
Figure 14. Disorientation angles and Schmidt factors of corresponding lines in SF maps. (a) Line 1, (b) Line 2, (c) Line 3, and (d) Line 4.
Metals 12 01657 g014
Figure 15. KAM maps under different strains of (ac) ST830-FT600 and (df) ST740-FT600. (g,h) SF and TF maps of ST740-FT600 under the strain of 25%, respectively.
Metals 12 01657 g015
Figure 16. (a) Variation in KAM and LAGB with strain; SF and disorientation of corresponding lines in Figure 15g: (b) Line 1, (c) Line 2, and (d) Line 3.
Metals 12 01657 g016
Figure 17. (a) The orientation distribution function (ODF) of the φ2 = 45° section in the RD-ND plane under different strains; (b) the standard ODF card.
Metals 12 01657 g017
Figure 18. SEM and TEM micrographs of internal defects near the main crack: (a,b) ST830-FT600 and (c,d) ST740-FT600; (e) schematic diagram of the deformation of M/A islands and LPs.
Metals 12 01657 g018
Table 1. Chemical composition of the steel (wt.%).
CMnSiPSNiAlNbVTiFe
0.11.550.20.0090.0010.10.050.010.0050.01Bal.
Table 2. Cooling process parameters of the samples.
SamplesCooling Rate of Relaxation, °C/sStarting Cooling Temperature, °CCooling Rate of Laminar Cooling, °C/sFinal Cooling Temperature, °C
ST830-FT6002.5–3.083015600
ST740-FT600740600
ST700-FT600700600
ST740-FT550740550
Table 3. Statistics of phase proportion and F average grain size.
Samples F Phase Proportion, %P + B Phase Proportion, %F Average Grain Size, μm
ST830-FT60073.3 ± 2.326.7 ± 2.39.59
ST740-FT60073.8 ± 1.526.2 ± 1.510.95
ST700-FT60066.4 ± 1.833.6 ± 1.812.39
ST740-FT55069.6 ± 2.530.4 ± 2.59.97
Publisher’s Note: MDPI stays neutral with regard to jurisdictional claims in published maps and institutional affiliations.

