Article

Influence of the Tool Rotational Speed on Physical and Chemical Properties of Dissimilar Friction-Stir-Welded AA5083/AA6060 Joints

1
Faculty of Mechanical Engineering and Ship Technology, Gdansk University of Technology, Narutowicza 11/12, 80-233 Gdansk, Poland
2
Department of Innovation Engineering, University of Salento, Via per Arnesano, 73100 Lecce, Italy
*
Author to whom correspondence should be addressed.
Metals 2022, 12(10), 1658; https://doi.org/10.3390/met12101658
Submission received: 21 August 2022 / Revised: 16 September 2022 / Accepted: 28 September 2022 / Published: 30 September 2022
(This article belongs to the Special Issue Welding and Fatigue of Railway Metallic Materials)

Abstract

:
Aluminum alloys have been successfully used in the railroad and automotive industries because of their potential to significantly reduce component weights, and their good mechanical and anti-corrosion properties. Problems with joining aluminum alloys are characterized by low weldability, which influences the need for studies focused on unconventional methods. The environmentally friendly and low-cost friction-stir-welding method enables the material to be joined without melting. In the following study, dissimilar butt joints were produced from AA5083 and AA6060 alloys. A constant tool traverse speed of 100 mm/min and a tool tilt angle of 2º were used, combined with tool rotational speeds of 800, 1000 and 1200 RPM. It was revealed that as the tool speed increases, the hardness in the weld nugget zone increases, due to higher heat input and more effective recrystallization. The highest hardness of the weld nugget zone was observed for the weld that was produced with the highest tool rotational speed, and was equal to 1.07 GPa, compared to the hardness of both parent materials of 0.75 and 1.15 GPa for AA5083 and AA6060, respectively. Increasing the heat input also decreased the hardness of the heat-affected zone, where recrystallization was not observed. The lowest density of dislocations with the highest mobility was observed in the heat-affected zone on the AA6060 side, which also contributed to the reduction in strength in this zone. The produced welds exhibited corrosion resistance between both parent materials, with the lowest corrosion current density being 6.935 ± 0.199 µA·cm−2 for the weld that was produced at a tool speed of 1200 RPM.

1. Introduction

Aluminum alloys are increasingly being used in a wide range of industries, including the automotive and railroad industries. The biggest challenge in these sectors is to implement a material that is characterized by high strength, corrosion resistance and easy machinability [1]. In addition, rising transportation costs are necessitating further reductions in the weight of vehicular components, while maintaining their optimal properties. Aluminum alloys are an excellent alternative to steel. Their use enables the weight of the structure to be reduced by up to three times, resulting in a significant reduction in the cost of transportation [2]. The adoption of aluminum in train wagon bodies minimizes the weight and energy that are required to accelerate and decelerate them. This can increase vehicle payloads, leading to lower fuel consumption and lower machine operating costs [3].
Aluminum alloys are characterized by good corrosion resistance; however, even slight corrosion losses can contribute to a rapid reduction in the mechanical properties of the structure. Therefore, it is extremely important, in addition to ensuring high structural strength, to determine the resistance of aluminum alloys to corrosion. Among the alloys with particularly high corrosion resistance are the ones that are in series 5XXX and 6XXX. AA5083 alloy is characterized by very good corrosion resistance and high strength [4,5]. AA6060 exhibits excellent machinability and high strength in plate form. AA6XXX alloy is commonly applied in high-speed train manufacturing, for example, in profiles and carriage components [6,7]. Welding dissimilar materials together is of great importance in the industry. It is necessary for a number of construction applications, in order to maximize the quality of structures and to improve strength, weight, and corrosion resistance.
In spite of the many advantages that are associated with the use of aluminum alloys in the transportation industry, a welding problem arises [8,9,10]. Aluminum alloys are characterized by poor weldability. Their joining by conventional methods carries a high risk of creating a structure with numerous defects and low strength [11].
Friction-stir welding (FSW) offers an alternative way of joining materials to avoid the risks of potential defects arising from conventional welding. During the FSW process, a specially designed tool, consisting of a pin and a shoulder, is used to join materials that are in contact with each other. The tool is put into rotary motion, and is placed between the components to be welded until contact between the surfaces of the components and the tool shoulder is achieved. The tool is then set into simultaneous linear motion along the joint line. The kinetic energy of the tool is converted into thermal energy, which is created by friction at the interface between the tool and work pieces. The heated material is plasticized, mixed by the pin and extruded in the backwards direction of the tool, which is moving along the edge of the contact line. As no melting point during welding is reached, solid-state FSW brings many advantages over conventional welding. The reduction in weld defects such as discontinuities and porosities, the lower solubility of hydrogen and the lower process costs associated with FSW are contributing to the growing interest in this method [12]. Due to lower energy consumption and the use of non-consumable tools, this method is also classified as a green technology [13].
The majority of studies and patents on FSW have been on aluminum and its alloys, according to an analysis by Magalhaes et al. [14], followed by iron alloys, magnesium, titanium and their alloys. Moreover, a number of previous studies on FSW involved dissimilar aluminum alloys. Ghaffarpour et al. [1] successfully joined AA5083-H12 and AA6061-T6 alloys with the FSW process. Tensile tests and hardness measurements were performed in order to investigate the strength of the produced samples. The lowest hardness was recorded in the heat-affected zone of the AA6061-T6 sheet. It was also noted that by increasing the tool rotational speed, the hardness of the mixing zone was reduced. Furthermore, Devaiah et al. [15] used a FSW process to produce AA5086/AA6061 joints that were characterized by a high tensile strength. Peel et al. [16] produced high-quality joints of AA5083/AA6082. In the study of Khodir et al. [17], the friction-stir-welded joints of AA2024/A7075 were found to exhibit high tensile strength and hardness. Palanivel et al. [18] investigated the effect of tool geometry on the tensile strength of AA5083-H111/AA6351-T6 joints. It was found that using straight square and hexagon pins yielded the best quality joints. Guo et al. [19] studied the mutual position of AA6061 and AA7075 alloys during welding. It was observed that the positioning of the AA6061 alloy on the advancing side promotes material mixing, and improves the mechanical properties of the weld. In a study by Mastanaiah el al. [20], it was found that by increasing the welding speed and decreasing the tool rotational speed, defect formation is more possible during the FSW of AA2219 and AA5083 alloys. Dong et al. [21] successfully used an FSW process on AA7003/AA6060, obtaining welds characterized by a high ultimate tensile strength that was equal to 78.2% of base material AA6060. Due to the different properties of the alloys used in this study, including the high corrosion resistance of the 5XXX series alloy and the high strength of the 6XXX alloy, welding them properly together is crucial in designing structures that provide such performance. Such examples include structures that are exposed to significant load transfer, and whose parts are simultaneously exposed to a corrosive environment, such as seawater or the atmosphere. To the best of the authors’ knowledge, there are no reports on dissimilar friction-stir welding of AA5083 and AA6060 aluminum alloys.
Therefore, the aim of the present study was to weld dissimilar AA5083-O and AA6060-T6 aluminum alloys together using FSW. The effect of tool rotational speed during the FSW process on the microstructure, hardness, dislocation density and mobility, as well as corrosion resistance, was investigated.

2. Materials and Methods

The friction-stir-welding method was applied to join commercial AA5083-O and AA6060-T6 aluminum alloys. The nominal chemical compositions of both alloys are presented in Table 1. The alloys were purchased in the form of rolled sheets that were 3 mm in thickness. The plates were butt-welded with AA5083 on the advancing side and AA6060 on the retreating side, parallel to the rolling direction. The welds were designed to be 200 mm in length from two plates with dimensions of 100 mm × 200 mm.
The process was performed on a conventional milling machine (FU251, Friedrich Engels Kazanluk, Sofia, Bulgaria). Figure 1 presents the schematic illustration of the process, as well as the geometry of the tool adopted for the studies. The tool shoulder was of a flat surface with a diameter equal to 18 mm. The length of the pin was 2.5 mm. The pin shape was hexagonal with a distance across the flats of 6 mm. The pin was designed with 0.5 mm long grooves for every 0.5 mm of the hexagonal pin’s length. The pin was produced of 73MoV52 steel, while the shoulder was made of X210Cr12 steel. The measured hardness of the pin was 58 HRC and of the shoulder 61 HRC (Wilson Mechanical Instrument Co., Inc., New York, NY, USA). The welding of dissimilar joints was carried out at a constant tool traverse speed of 100 mm/min, and a constant tool tilt angle of 2º. The tool rotational speeds used were 800, 1000, and 1200 RPM. Table 2 presents the process parameters, as well as revolutionary pitch values, defined as the rotational speed of the tool divided by its traverse speed.
Specimens of dimensions 300 mm × 10 mm were prepared for the microstructure observations. For this purpose, the samples were wet ground on the cross-sections of the welds to a final gradation of #4000, and polished with a 1-micrometer diamond suspension. A double-stage etching was performed using Weck’s etchant. Firstly, the polished samples were immersed in a 2 wt% NaOH solution for 60 s. In the second stage, the samples were etched in a solution containing 4 g of KMnO4, 1 g of NaOH and 100 mL of distilled water, for 10 s. The microstructure was observed using an optical microscope (BX51, OLYMPUS, Tokyo, Japan), according to the ASTM E3 standard guide for preparation of metallographic specimens.
Hardness measurements were conducted using indentation tests on the cross-sections of the samples, as presented in Figure 1 (NanoTest Vantage, Micro Materials, Wrexham, UK). The tests were conducted in the mid-thickness of the cross-sections, with the indents spaced at a distance of 0.5 mm, in accordance with the ASTM E384-17 standard test method for microindentation hardness of materials. A pyramidal diamond Berkovich indenter was used to carry out 60 independent measurements with a force of 1 N. The loading and unloading times were equal to 20 s. The dwell time was set to 5 s.
The electrochemical properties measurements were performed in accordance with the ASTM G5-94 standard reference test method for making potentiostatic and potentiodynamic anodic polarization measurements. Disc samples with an area of 1 cm2 were cut from the weld nugget (Figure 1). The tests were conducted in 3.5 wt% NaCl (99.8% purity, Warchem, Warsaw, Poland) solution in distilled water, using a potentiostat/galvanostat (Atlas 0531, Atlas Sollich, Rębiechowo, Poland). The temperature of the solution during the tests was maintained at 20 °C. A three-electrode system was applied. A platinum electrode was used as a counter electrode, a saturated calomel electrode was used as a reference electrode, and a welded sample or a base material sample was used as a working electrode. The tests were initiated by measuring the open-circuit potential (OCP) for 60 min. The corrosion curves were obtained using the potentiodynamic method for a potential range from −2 V to +1 V. The potential scan rate was equal to 1 mV/s. The corrosive potential (Ecorr) and the corrosion current density (icorr) values were determined using the Tafel extrapolation method and AtlasLab software (ATLAS 0532 Electrochemical unit and Impredance Analyser, Atlas Sollich, Rębiechowo, Poland). The surfaces of the samples after the corrosion tests were investigated using a high-resolution scanning electron microscope (SEM) (Phenom XL, Thermo Fisher Scientific, Breda, The Netherlands) with a back-scattered electron detector (BSE).

3. Results and Discussion

Visual inspections were conducted to determine the quality of the performed welds. The images of the weld seam surfaces are presented in Figure 2. No serious surface defects, such as lack of bonding or grooves, were found. A very little material outflow was observed in the case of the samples that were produced with tool rotational speeds of 800 and 1000 RPM. Moreover, the weld produced with the tool rotational speed of 800 RPM exhibited a slight cavitation defect on the retreating side. In the case of welds produced with lower tool rotational speeds (800 RPM and 1000 RPM), insufficient plasticization of the material occurred as a result of the lower heat input, which led to the formation of defects. Small cavitation losses on the retreating side, as well as material outflows observed in both cases, were also caused by insufficient mixing of the material. For the weld produced with the highest tool rotational speed equal of 1200 RPM, no irregularities of the weld seam were found on the surface. The weld surface was smooth, and exhibited a periodic structure. It is believed that the key factors in determining the weld quality are sufficient heat input and proper mixing of the plasticized material. By increasing the tool rotational speed, higher heat is input; thus, sufficient plasticizing and mixing result in the formation of a non-defective weld seam.
Figure 3 presents the macro- and microstructure of one selected weld that was produced with a tool rotational speed of 1200 RPM. Based on macroscopic observations, a characteristic basin shape of the weld nugget can be distinguished. The microscopic observations (Figure 3b–h) permit evaluation of the grain size and shape within all the specified zones. The heat input strongly influenced the microstructure of the heat-affected zone (HAZ), the thermo-mechanically affected zone (TMAZ) and the weld nugget zone (WN). During the process, frictional heating causes plasticization of the material. The amount of heat introduced to the material depends strongly on the process parameters. Husain et al. [22] noted that with increasing the tool rotational speed, the peak temperature during FSW becomes higher. The same conclusions were observed in the studies of Krishnan et al. [23], Liu et al. [24] and Salih et al. [25]. The nugget zone (Figure 3h) experienced the highest heat input, as well as plastic deformation, during mixing by the pin. It resulted in recrystallization within the zone, and led to the finest microstructure. Thermo-mechanically affected zones (Figure 3f–g) on both sides of the welds also experienced high temperature peaks and plastic deformation due to the mixing by the tool. The recrystallization process was not observed in the TMAZ due to lower heat input. The heat-affected zones on both sides (Figure 3d,e) resulted only through thermal evolution. No recrystallization process occurred within the HAZ. By approaching both parent metals, the material already became characterized by the original microstructures of both alloys (Figure 3b,c).
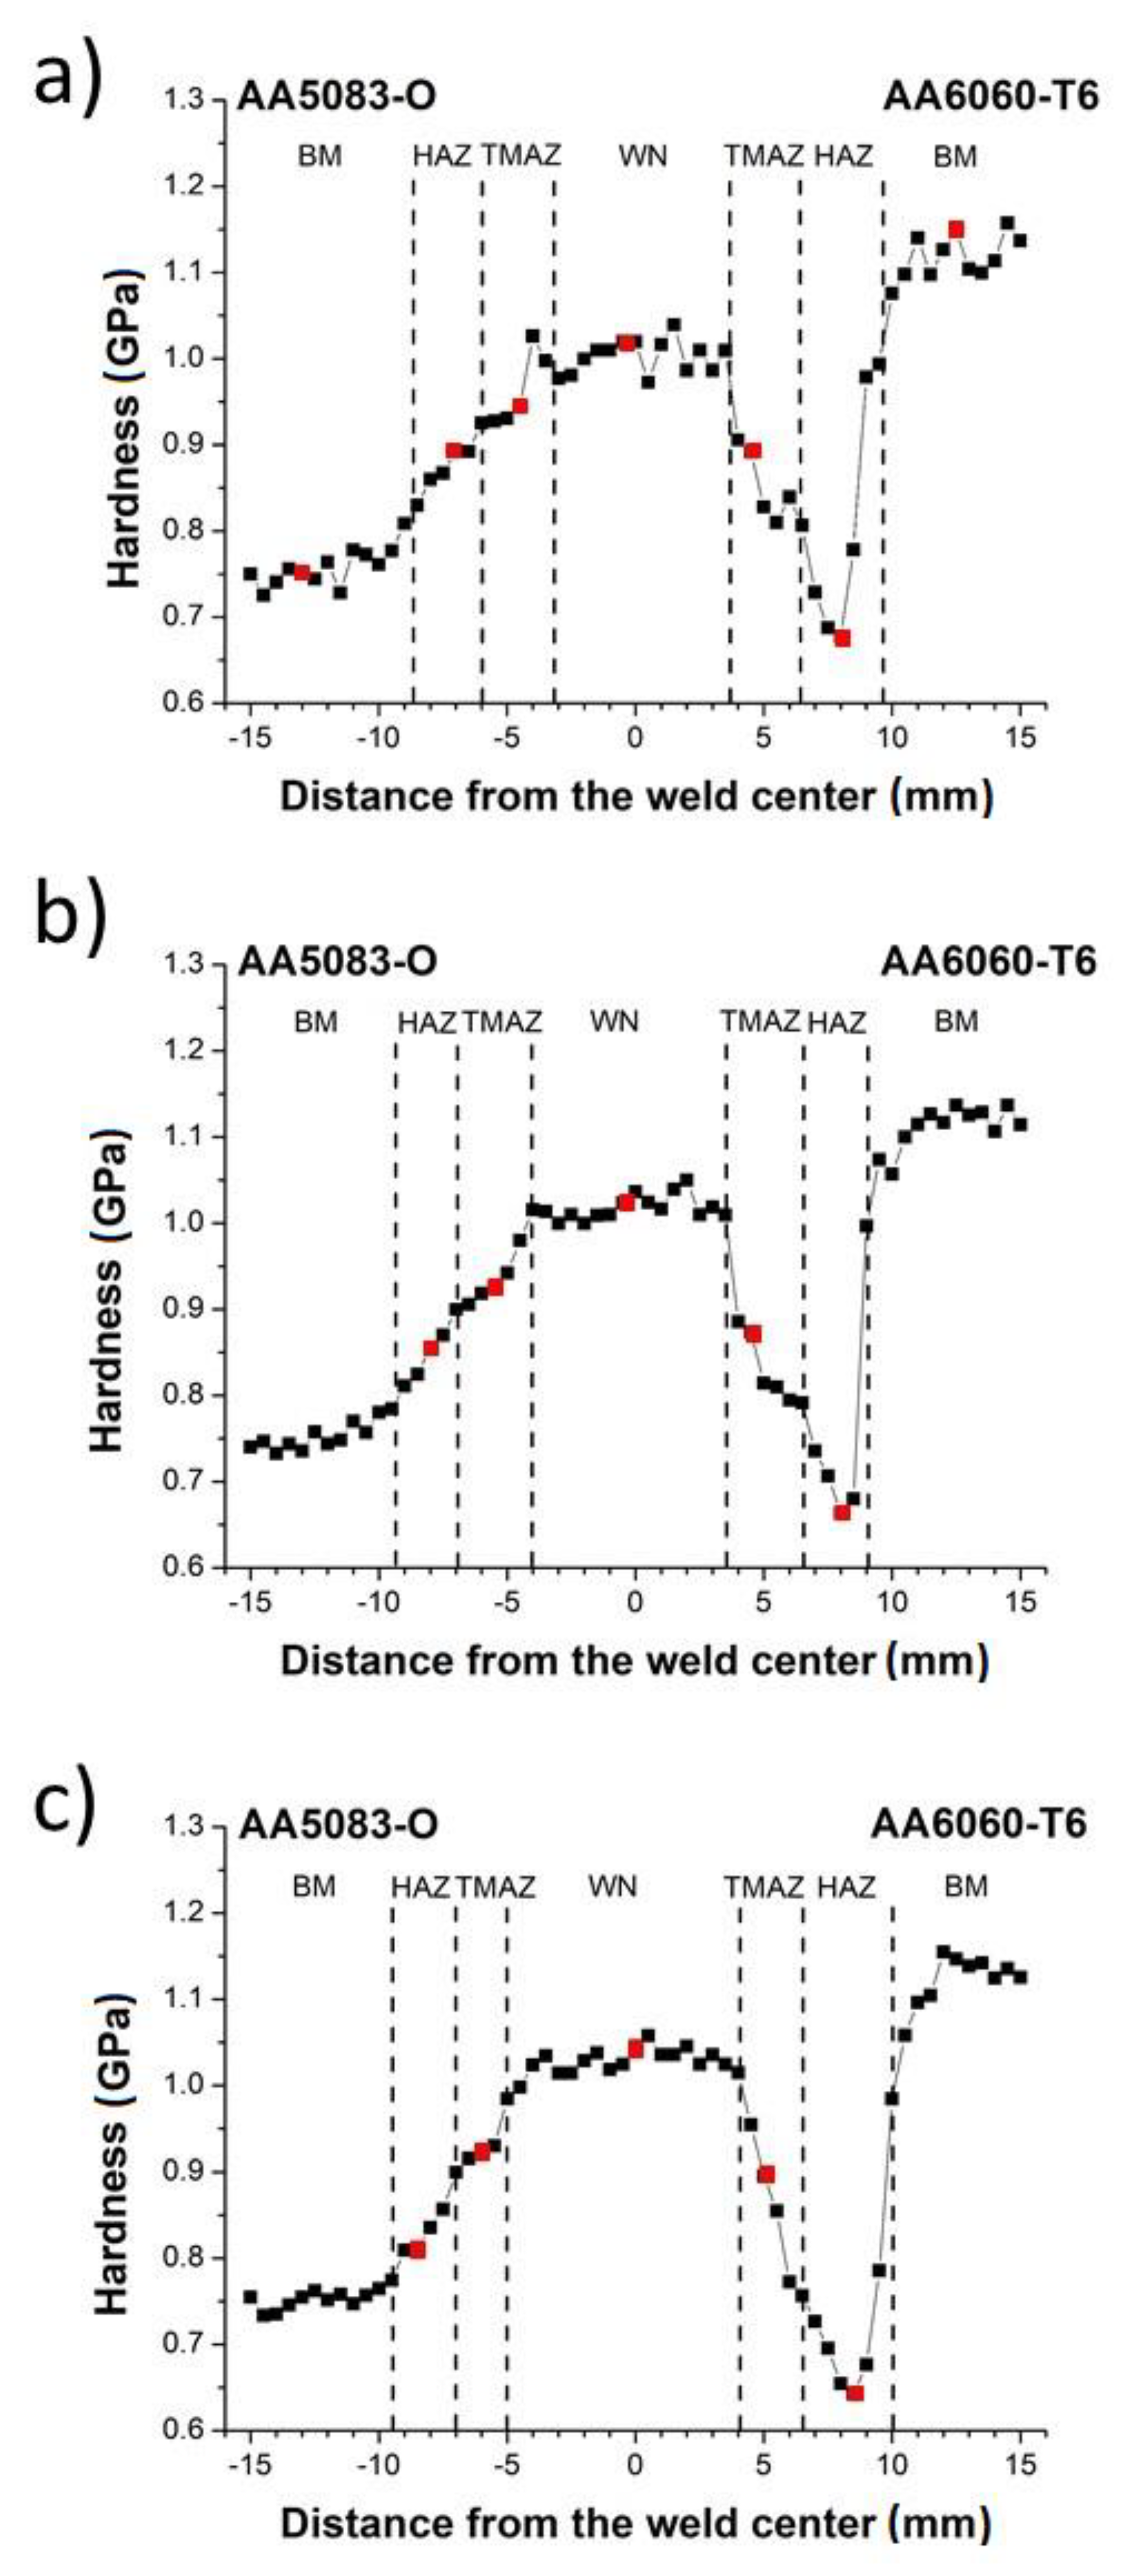
Figure 4 presents the hardness profiles on the mid-thickness of cross-sections of the produced welds. The hardnesses of the base metals were equal to approximately 0.75 GPa and 1.15 GPa for AA5083 and AA6060, respectively. The hardness profiles are asymmetrical due to the dissimilar welding of materials with different properties, classified in different groups of aluminum alloys, and delivered under different conditions. Aluminum alloys of the 5XXX series are classified as non-heat treatable. The strength of these alloys is initially formed by alloying pure aluminum by adding elements such as magnesium. Further increases in the strength of these alloys are achieved through various types of cold working or hardening processes. On the contrary, aluminum alloys of the 6XXX series are classified as heat-treatable aluminum alloys. By adding alloying elements, such as magnesium and silicon, the strength of the alloy is initially formed. The alloying elements exhibit increasing solid solubility when the temperature increases. This provides significant additional strengthening to the heat-treatable alloys by subjecting them to solid solution treatment, quenching and, when applicable, precipitation heat-treatment known also as artificial aging, such as in the case of the AA6060-T6 used in this study. Due to the different behaviors of these alloys under deformation and temperature, differences in the hardness profile on the advancing and retreating sides can be observed. Analyzing the hardness profile from the side of the AA6060 alloy to the center of the joint, the typical shape of the hardness profile for FSW joints of 6xxx-T6 series aluminum alloys is maintained, characterized by a minimum of hardness in the heat-affected zone [26,27]. Softening observed in the heat-affected zone on the side of AA6060-T6 is an effect of precipitate coarsening and dissolution, due to sufficient heat input. The greatest recovery in strength can be observed in the nugget zone, as a result of the recrystallization process. The fine-grained structure resulting from the recrystallization process affects the increase in hardness. According to the Hall–Petch relationship, the increase in hardness can be observed as the average grain size decreases [28,29]. On the advancing side section of the hardness profile, the typical decrease in hardness in HAZ was not observed. At the sections of HAZ and TMAZ, an increase in hardness up to the weld nugget was observed. Welds produced from annealed metal, such as AA5083 in the O condition, do not exhibit a typical hardness drop in HAZ [16]. In the direction of the weld nugget, usually a higher hardness than the base metal in O condition can be noted due to modest hot work-hardening, and finally, grain refinement in the nugget zone [30]. The formation of the weld nugget eliminates the prior deformation microstructure in cold worked material and as a result, the hardness of the nugget zone is independent of the original base metal condition [31].
Figure 5 presents the influence of the revolutionary pitch parameter on the maximum hardness of the nugget zone (a), minimum hardness of the heat-affected zone (b) and the size of the nugget zone (c). The size of the nugget zone was determined based on the hardness profiles in the center of the cross-sections, as indicated in Figure 4. It is clear that as tool rotational speed increases while maintaining a constant tool traverse speed, the value of revolutionary pitch increases; thus, the amount of heat input during the process increases [32,33,34]. For the weld produced with a tool rotational speed of 1200 RPM and a tool traverse speed of 100 mm/min, the highest hardness of the weld nugget was observed. This is due to the highest heat input, which resulted in the most effective recrystallization and the finest microstructure. Meanwhile, decreasing the tool rotational speed resulted in a lower heat input; consequently, less effective dynamic recrystallization in the weld nugget was observed. It should be also noted that microstructural observations confirmed the above findings. By applying the highest revolutionary pitch, the highest heat input resulted, and thus the finest microstructure in the nugget zone and the highest hardness were noted. However, with a high amount of heat generated during the process, the temperature peak in the heat-affected zone also increased. There, the influence of heat served a negative effect, as grain refinement did not occur as a result of recrystallization; only the introduced heat caused the dissolution of strengthening precipitates. This relationship is shown in Figure 5b. As the revolutionary pitch increased, thereby increasing the amount of heat introduced, the hardness of HAZ decreased due to the intensified process of dissolution of strengthening precipitates. It is also noticeable that as the revolutionary pitch increased, the size of the nugget zone tended to increase as well (Figure 5c). This is also explained by an increase in the heat input observed during the process, since the revolutionary pitch was increased. The zone of interest in continuous dynamic recrystallization increased in size in this case, and subsequently the measured size increased, indicating a larger zone of improved hardness with regard to TMAZ and HAZ.
The hardness and strength of the material were also significantly affected by the dislocations in the material, particularly their density and mobility [35]. During indentation tests, especially when small forces were applied, a significant increase in the hardness of the material was observed. This is because applied strains resulted in the formation of dislocations in the region under the indenter. Penetration of an indenter into material causes a local increase in dislocations. This phenomenon is referred to as the indentation size effect (ISE). During indentation, dislocations, called geometrically necessary dislocations (GNDs), appear in the material. Their existence increases the flow stress and the measured hardness value. Their density is inversely proportional to the indentation depth (h), so this effect is particularly significant for small forces applied. With deeper penetration of an indenter, the steady state is reached, and the hardness depends only on statistically stored dislocations (SSDs). Geometrically necessary dislocations are necessary because they are introduced into the material to accommodate the shape of the indenter. The density of GNDs ( ρ G N D ) is derived from the complete line length k of the dislocation loops, which are required to create the shape of the indenter. Hence, they enable the necessary lattice rotations. The total length of the line is then divided by the semispherical volume V, which is a storage volume of GNDs with a contact radius ac. The geometry of the cross-section of a sample during indentation is presented in Figure 6. In the picture, an angle between the surface of a sample and the indenter is defined as δ. For the Berkovich indenter, the value of this angle is equal to 24.7°. In the current considerations, the storage volume of GNDs is considered to be the plastically deformed volume under the indenter, instead of using the volume defined by the contact radius. As presented in Figure 6, the radius of the plastic zone is defined as apz, and f is a factor connecting ac with apz. For metallic materials, the plastic zone radius is assumed to be larger than the contact radius, so f > 1 [36]. In order to calculate the value of GNDs density ( ρ G N D ), the following formula can be used:
ρ G N D = 3 2 · 1 f 3 · t a n 2 δ b · h
where b is a magnitude of the Burgers vector (for aluminum b = 0.286 nm). The maximum indenter displacement for plastic deformations h can be registered during indentation tests [37]. The calculated ρ G N D values are presented in Table 3.
It can be assumed that for a Berkovich indenter, a hemispherical shape of the plasticized zone can be observed. For soft metals, such as aluminum alloys, the volume of this zone significantly exceeds the volume defined by the contact radius. In the case of tests on aluminum alloys using the Berkovich indenter, a factor f equal to 3 can be assumed [38].
In addition to geometrically necessary dislocations and statistically stored dislocations, the hardness of the material is also determined by the frictional stresses of the crystal lattice Hfr, and the hardening of the solid solution by dissolved alloy additives Hss. These correlations can be represented by the following equation:
H I S E = H s s + H f r + M C a G b ρ G N D + ρ S S D
Where M is a Taylor coefficient (here assumed to be equal to 3 [39]), C is a factor that transfers the complex stress state under the indenter into a uniaxial stress state (equal to 3 in this case [38]), a is a factor that depends on the dislocation substructure, G is a transverse elastic modulus of the test material and b is a magnitude of the Burgers vector. For both GNDs and SSDs, a value of factor a = 0.5 can be assumed because of the complex stress field in the area under the Berkovich indenter. For aluminum, the value of the Burgers vector is equal to b = 0.286 nm, and the transverse elastic modulus G is equal to 26 GPa [40]. In this analysis, only dislocation hardening will be considered. Thus, equation (2) can be expressed as follows:
H I S E = M C a G b ρ G N D + ρ S S D
On the contrary, when the ISE is not considered, the relationship between macroscopic hardness H0 and SSD density ( ρ S S D ) is expressed by Taylor’s relation [41]:
H 0 = M C a G b ρ S S D
Considering the HISE hardness values obtained in the indentation tests, the maximum depth of indenter displacement h and the constants introduced earlier, the density of SSDs can be calculated from the relationship, shown as follows:
ρ SSD = H I S E 2 M C a G b 2 ρ G D N
In order to calculate the dislocation mobility, the following Orowan equation was used [42]:
d ε d t = ε ˙ = b · ρ S S D · v
Where ε is strain and v is dislocation mobility.
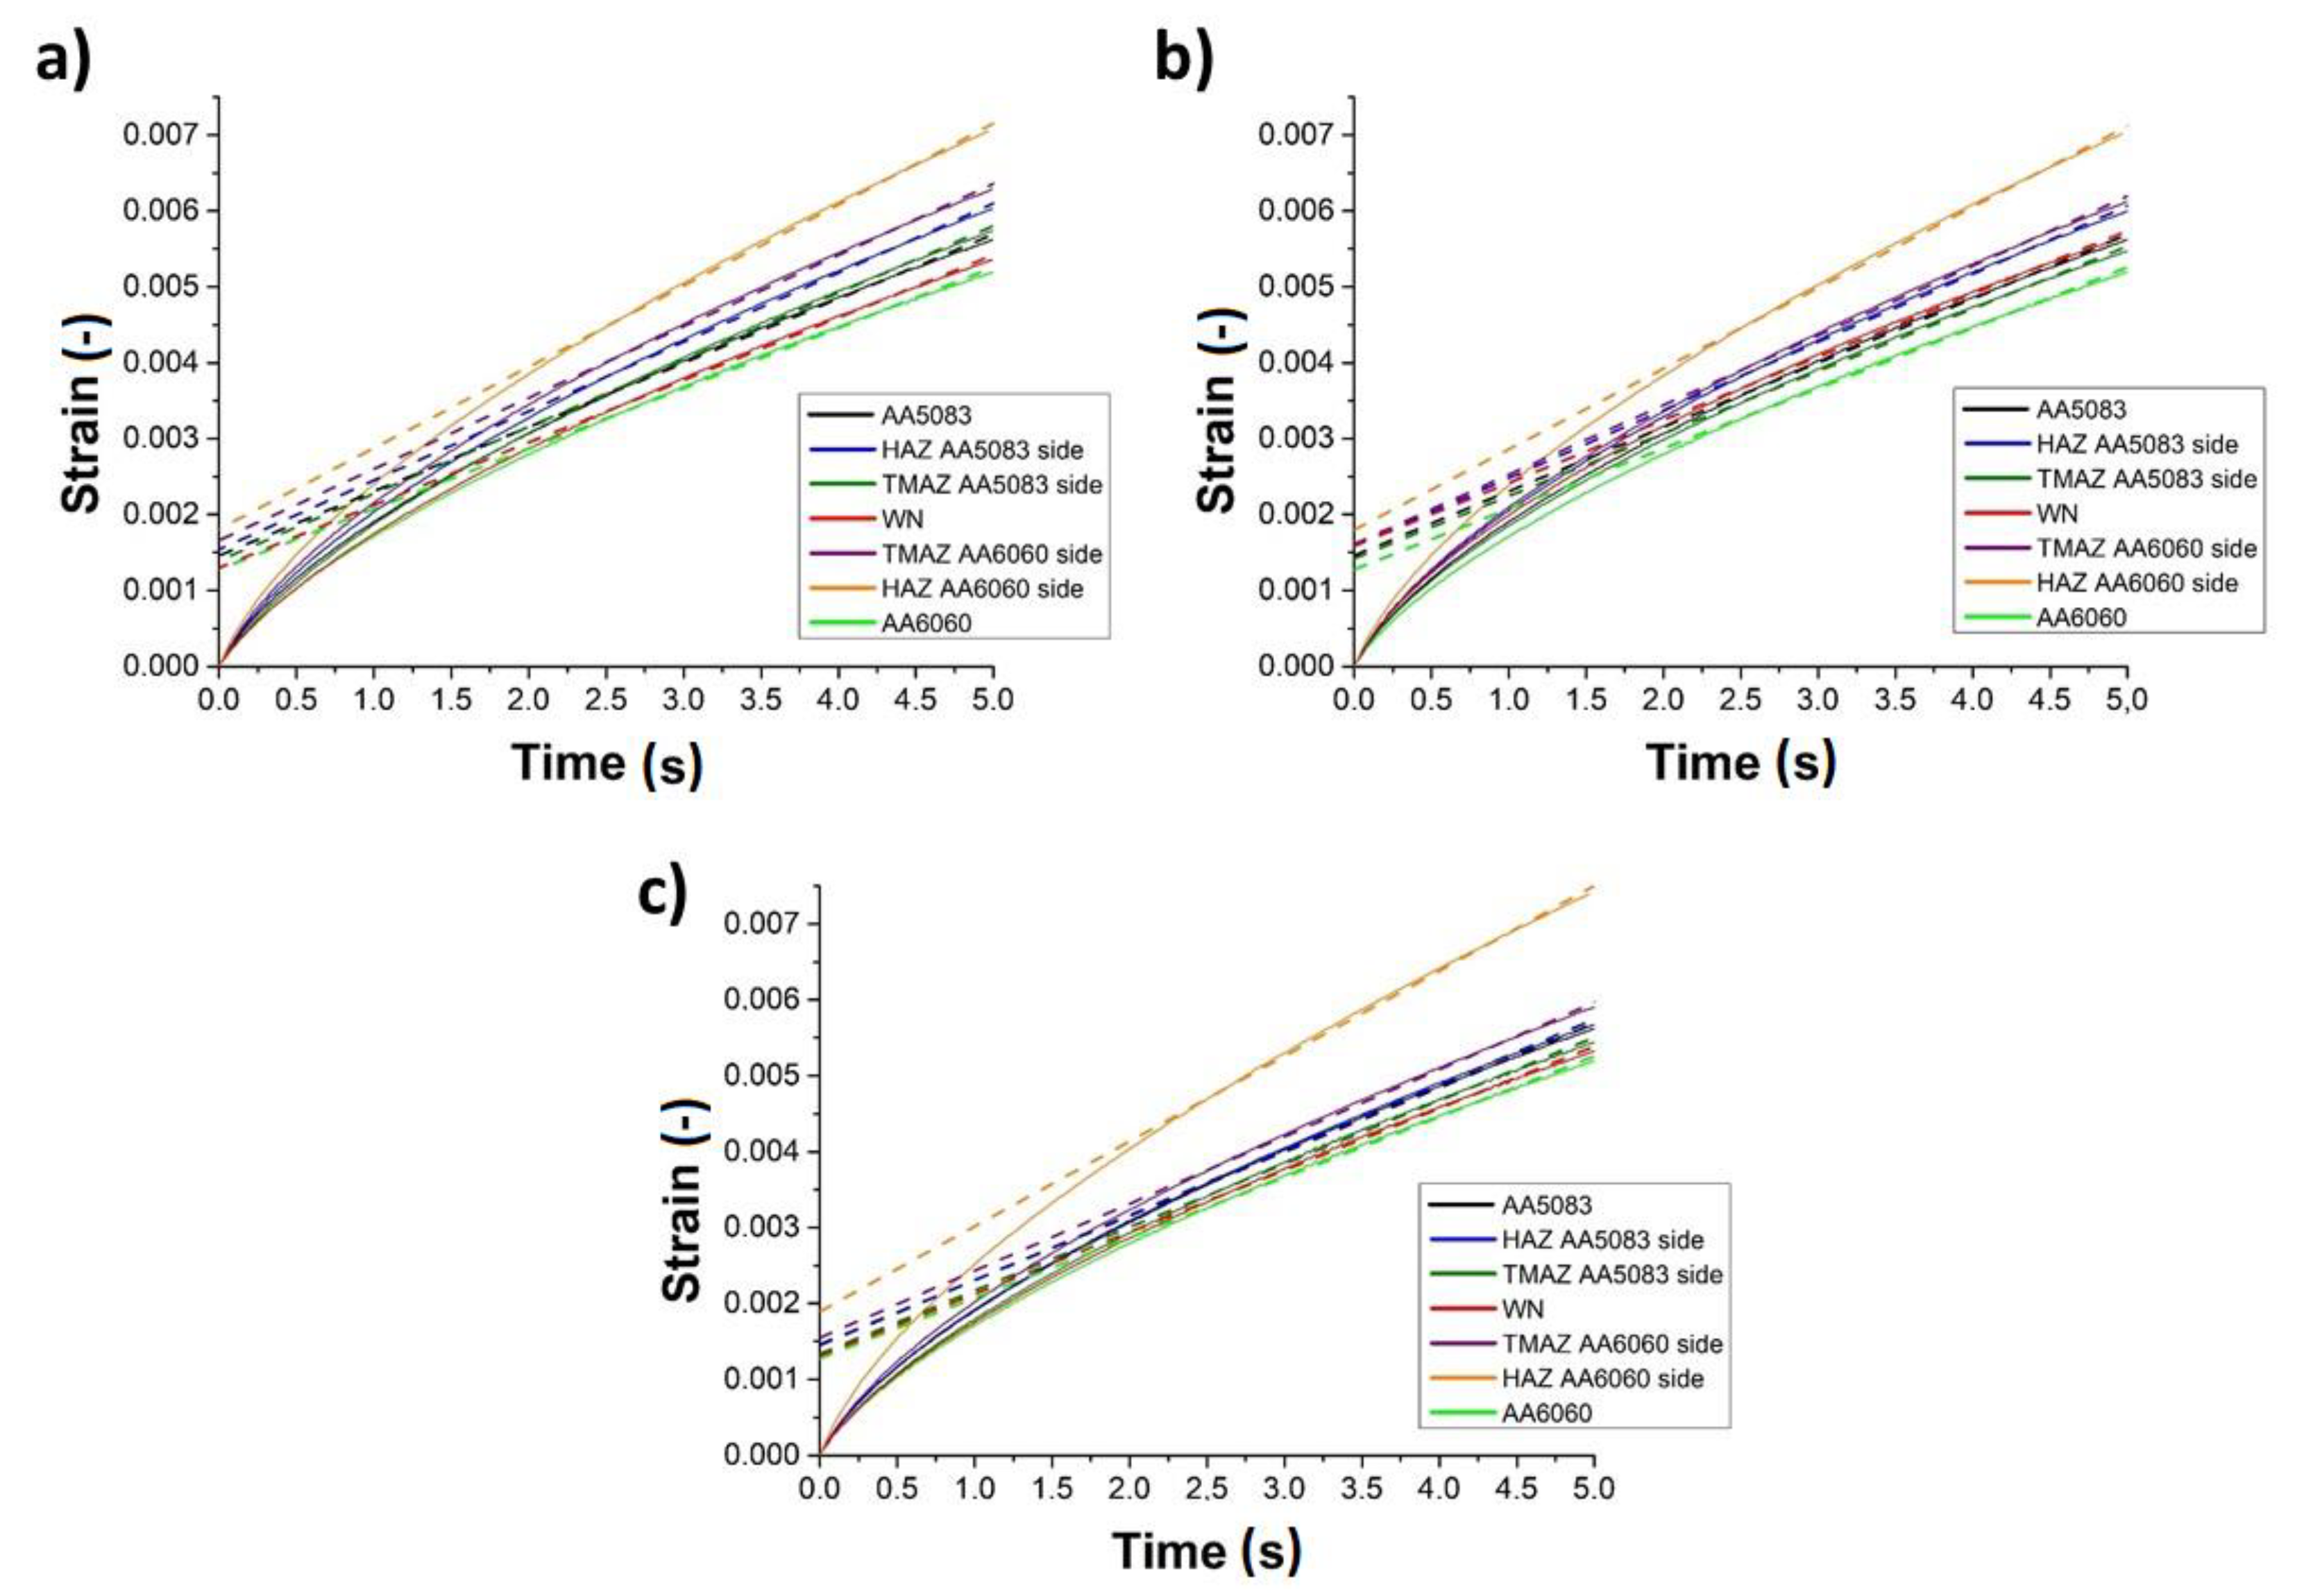
In order to calculate the strain derivative as a function of time, the stabilized fragment of creep during the indentation dwell time period at maximum force was approximated to a linear function. The calculations were performed for all the samples, in the exact areas of base materials AA5083 and AA6060, HAZ and TMAZ for both advancing and retreating sides and the weld nuggets. The exact measurement positions are presented in Figure 4 with red dots. The results of the analysis are presented in Figure 7. Finally, the calculations on dislocation mobilities were performed using a converted Equation (6):
v = ε ˙ b · ρ S S D
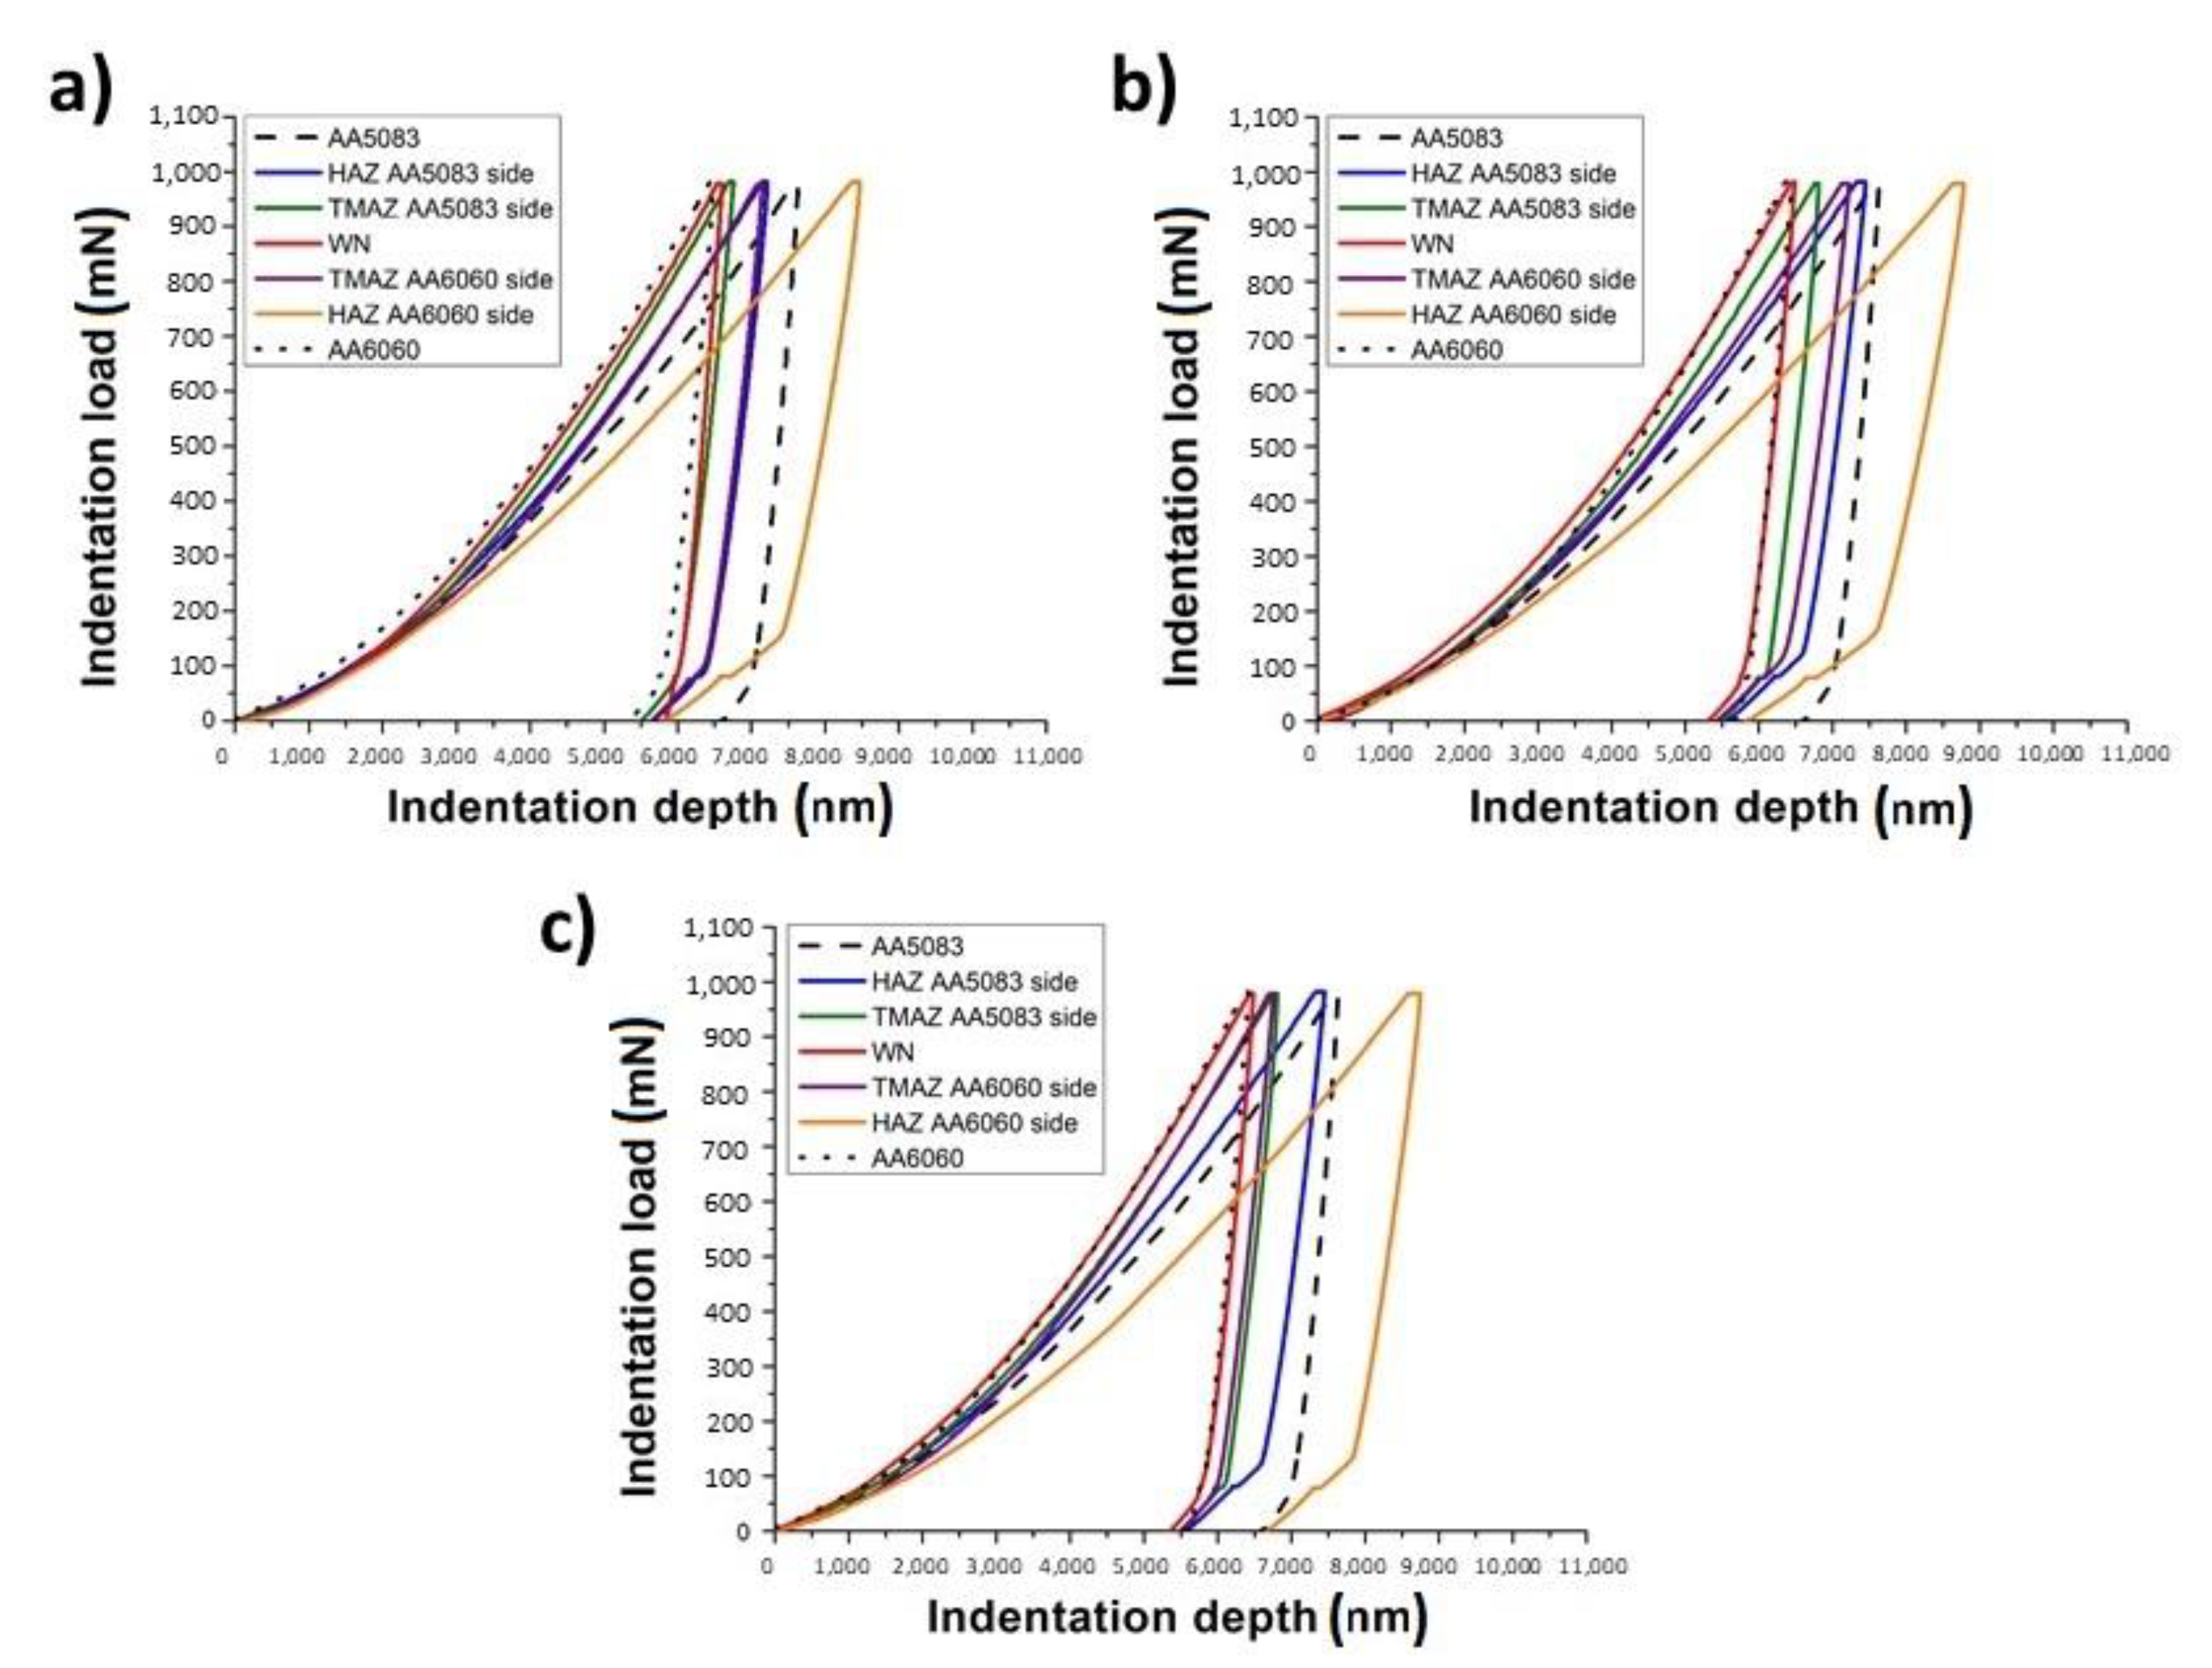
The results of the above calculations are presented in Table 3. Figure 7 presents hysteresis plots of load–depth for a single indentation in the distinguished zones of the samples produced with tool rotational speeds of 800, 1000 and 1200 RPM. Figure 8 shows the relationships between strain and time for the dwell period during the indentation tests in the base materials AA5083, AA6060, HAZ and TMAZ at both sides, and WN for the samples produced with 800 (a), 1000 (b) and 1200 RPM (c). The exact locations are indicated with red dots on the hardness profiles presented in Figure 4.
In the friction-stir-welded joints, the dislocation density results from strain and severe plastic deformations, as well as recrystallization in the WN [43,44]. The resulting values of the dislocation density and mobility are influenced not only by process parameters, such as the rotational and traverse speed of the tool, the tilt angle and its geometry, but also by the properties of the parent materials. The amount of heat input, the process of plasticization of the material, its mixing, dissolution of strengthening precipitates and recrystallization, significantly affect the resulting joint properties.
In all of the cases, the densities of geometrically necessary dislocations are significantly lower than the densities of statistically stored dislocations, due to the relatively high applied measurement forces. It should be noted that the highest density of statistically stored dislocations can be observed in AA6060 base metal. Furthemore, the weld nugget zones of all the produced welds exhibit high SSD dislocation densities of 9.171 × 10¹⁴, 9.404 × 10¹⁴ and 9.501 × 10¹⁴ m−2 for the welds produced with tool rotational speeds of 800, 1000 and 1200 RPM, respectively. Higher heat input during the FSW process from increased tool rotational speed resulted in the increase in dislocation densities observed in the nugget zones of the produced welds. Studies conducted thus far do not indicate a clear trend that determines the effect of the FSW process on dislocation densities and mobility. In a studies by Woo et al. [45], it was observed that the dynamic recrystallization zone after the FSW process of AA6061-T6 was characterized by a lower dislocation density than that of the parent material. On the contrary, in another study of Woo et al. [46], a higher dislocation density was found in the weld nugget zone compared to AA6061-T6 parent material. Yuzbekova et al. [47] observed a higher dislocation density in friction-stir-welded AA5024 aluminum alloy. Moreover, Laska et al. [38] found higher dislocation densities in dissimilar friction-stir-welded joints of AA6060/AA6082, compared to both parent materials. Ni et al. [48] noted a lower dislocation density in the weld nugget zone of friction-stir-welded SiCp/AA2009-T351 compared to the base material. This was explained by the dynamic recrystallization processes occurring in the weld nugget, and a low cooling rate after the process. The lowest dislocation density was observed in heat-affected zones from the side of the AA6060 alloy, for all the produced welds. Similarly, in the study by Ni et al. [48], in the HAZ of the SiCp/AA2009-T351 FSWed joint, a significant decrease in dislocation density was noted through TEM observations. The reduction in dislocation density in the heat-affected zone is a result of the release of dislocations during the FSW thermal cycle [48].
By analyzing the dwell time of indentation studies, it is possible to determine the mobility of dislocations. In the above study, the lowest dislocation mobilities were observed in the AA6060 parent material and weld nugget zones. In contrast, the highest mobilities were registered in the HAZ zones of all welds on the retreating side of the AA6060 parent material. The calculated mobilities were equal to 6.142 × 10⁻⁹, 6.442 × 10⁻⁹ and 7.009 × 10⁻⁹ m s for the welds produced with tool rotational speeds equal to 800, 100 and 1200 RPM, respectively. Compared to both parent materials, the calculated values were equal to 4.429 × 10⁻⁹ and 2.844 × 10⁻⁹ m s for AA5083 and AA6060, respectively; the increase in the mobility was noticeable. It is also worth noting that by increasing the tool rotational speed, and consequently the heat input, the dislocations became characterized by higher mobility. According to Taylor and Orowan’s theory, materials that are characterized by lower dislocation densities and high dislocation mobilities tend to exhibit lower strength [38]. Therefore, the reduction in hardness in the HAZ zones on the AA6060 side is also influenced by the high-mobility dislocations present in the material. The results of SSD density and dislocation mobility calculations are shown in the graphs of Figure 9.
Functional properties, in addition to the strength of welded components, are significantly affected by the corrosion resistance of the material. It is of particular importance in the case of structures that are used in corrosive environments. It should be also noted that in the case of even occasional contact with corrosive environments, small corrosion losses can significantly affect the strength of the structure. Figure 10 presents the open circuit potential (OCP) measurements (Figure 10a) and potentiodynamic polarization curves for the produced samples (Figure 10b) that were subjected to tests in 3.5 wt% NaCl solution. The OCP measurements preceded the potentiodynamic test, and were performed for 60 min, to reach stability. Potentiodynamic curves recorded in the study were subjected to the Tafel extrapolation. Based on the obtained data, the values of corrosive potential (Ecorr) and corrosion current density (icorr) were collected. Table 4 presents the results of the potentiodynamic studies.
The corrosion potential shifted from the minimum value of −0.738 ± 0.013 V for the base metal AA6060, to 0.661 ± 0.017 V for the base metal AA5083. The corrosion potential for all the welded samples adopted values that were between both parent materials. The results of the conducted experiments indicate that the AA5083 parent material exhibited the highest corrosion resistance. In this case, the corrosion current density was equal to 4.506 ± 0.278 µA·cm−2. The lowest corrosion resistance and the highest corrosion current density of 9.047 ± 0.768 µA·cm−2 were from the AA6060 alloy. In general, aluminum alloys in both 5XXX and 6XXX series exhibited good corrosion resistance. Alloys in series 5XXX are so-called seawater-resistant alloys, and are characterized by excellent electrochemical properties [49]. Sukiman et al. [50] also registered better corrosion resistance for AA5083 when compared to the AA6060 alloy. All of the welds displayed a corrosion resistance that was greater than that of alloy AA6060, but less than that of alloy AA6082. In a study by Kartsonakis et al. [51], it was demonstrated that the friction-stir welding process resulted in the production of dissimilar AA5083/AA6082 joints that were characterized by a corrosion resistance that was between both parent materials. Furthermore, the corrosion resistance of the AA5083 alloy was higher than that of the AA6XXX series alloy. Several scientific investigations indicated that the FSW process itself improves the corrosion resistance of welds. Qin et al. [52] revealed that the FSWed joints of 2A14 aluminum alloy were more resistant to corrosion processes in exfoliation corrosion solution. In the study of Zucchi et al. [53], it was observed that the FSWed joint of AA5083 was more resistant to exfoliation corrosion than its base metal. On the contrary, Maggiolino et al. [54] found no significant differences between the corrosion resistance of AA6060 alloy and its friction-stir-welded joint.
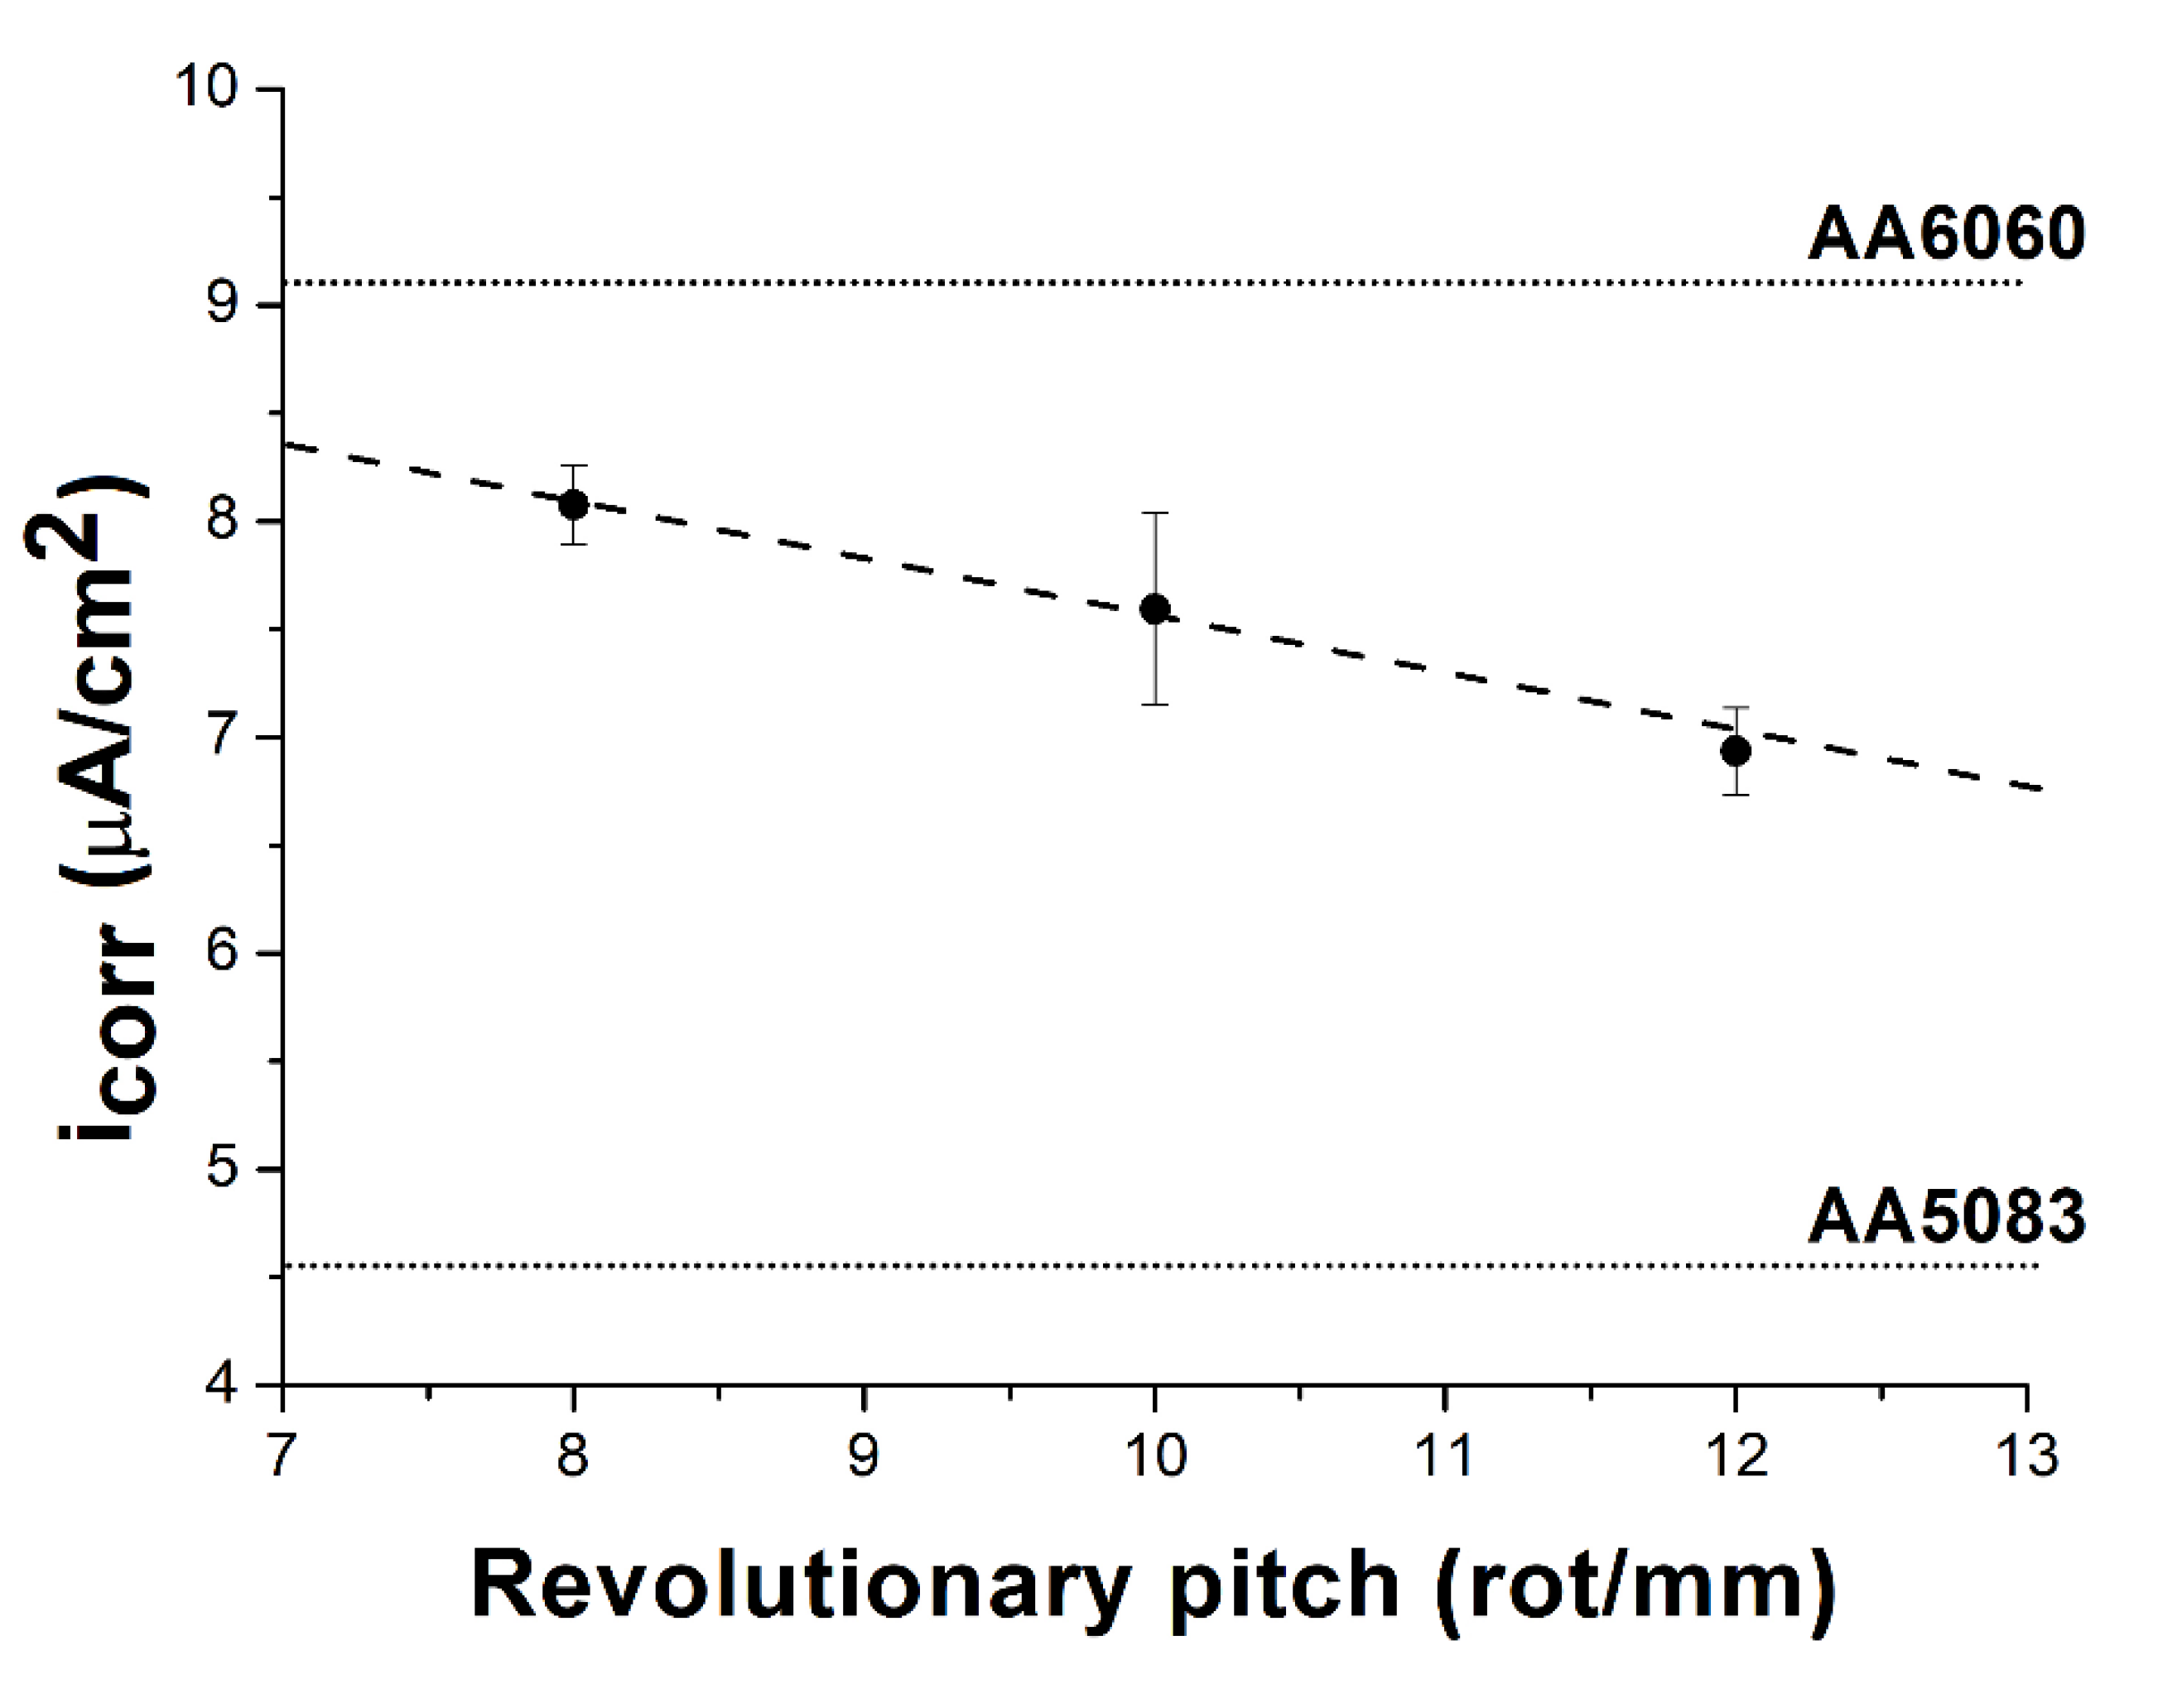
In the present study, the values of corrosion current density were equal to 8.075 ± 0.182, 7.592 ± 0.442 and 6.935 ± 0.199 µA·cm−2 for the welds produced with tool rotational speeds of 800, 1000 and 1200 RPM, respectively. These observations are also presented in Figure 11. It is clearly visible that by increasing the revolutionary pitch, the corrosion current density decreases. This means that by increasing heat input, better corrosion properties of the weld may result. Important factors that affect the corrosion resistance of metals are grain size and distribution of precipitates. Microstructure serves an important role in the formation of a passive oxide layer on the metal surface that provides protection against corrosion. A finer grain microstructure is characterized by a more reactive surface, thus formation of the oxide layer progresses more easily. Due to that fact, the corrosion rate of aluminum in NaCl solution has a tendency to decrease as the grain size decreases [55]. Song et al. [56] noted that when the finer grains are observed for pure aluminum, the resistance to pitting corrosion increases as a result of the denser oxide layer on the surface. The recrystallization processes that occur in the weld nugget provide refinement of the grains, as well as more uniform precipitate distributions, which also improves the corrosion resistance of the weld. Higher input heat results in more effective recrystallization; thus, the finer the microstructure, and better the corrosion resistance.
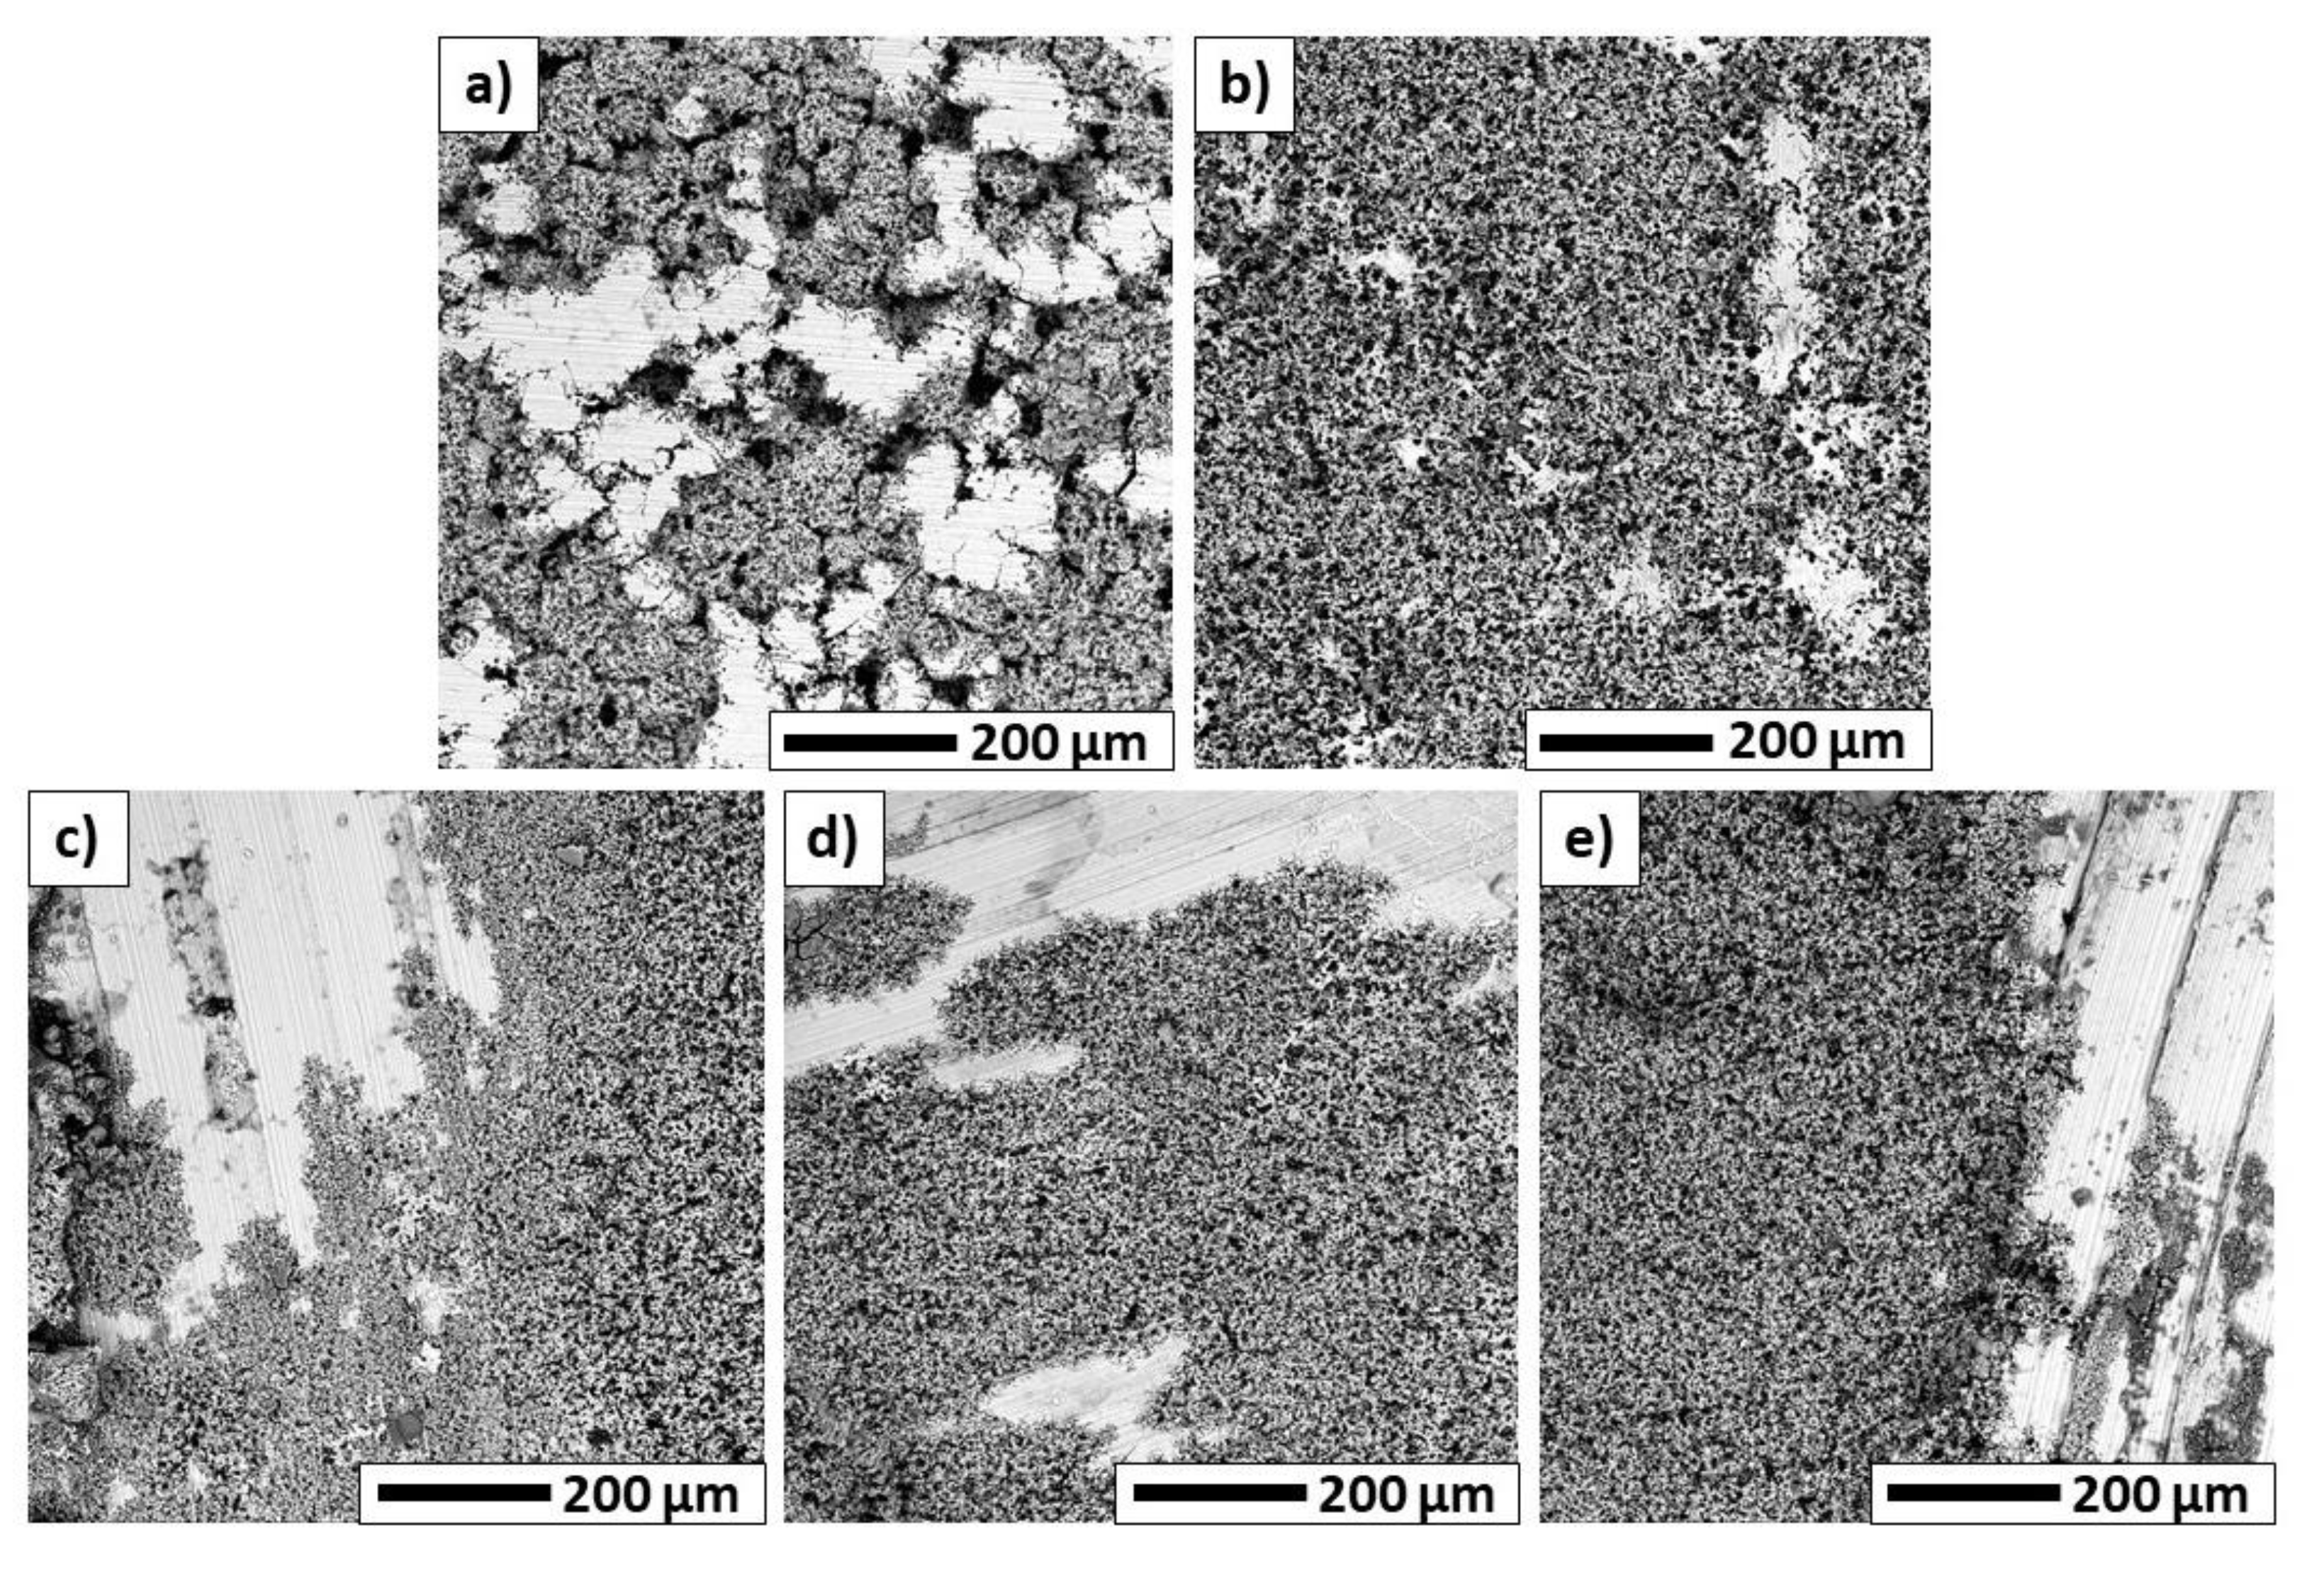
Figure 12 depicts the scanning electron microscopy images of the surface of the welded samples, and both base materials, after corrosion tests. For welded samples, the characteristic geometry of the surface of the nugget, resulting from simultaneous tool traverse and rotational motions, is noticeable. For these samples, no significant differences were found based on SEM observations. Thus, it is not possible to determine the effect of process parameters on the corrosion resistance of welds, on the basis of microscopic observations alone. However, it should be noted that differences in corrosion resistance can be found in the samples of the native materials, which did not undergo thermomechanical processes. The corrosion losses on the AA6060 alloy (Figure 12b) are larger. In the case of the parent material AA5083 (Figure 12a), the area unaffected by corrosion processes was larger, so the corrosion resistance of this alloy in 3.5 wt% NaCl solution is greater. Although scanning electron microscope observations do not allow quantitative evaluations of the corrosion resistance of welds, the results obtained are consistent with Tafel’s extrapolation results. A qualitative evaluation of the obtained images confirms that the AA5083 alloy has the highest corrosion resistance. Alloy AA6060 experienced high corrosion losses, while the produced welds showed moderate corrosion resistance. In their case, corrosion losses that were observed on the surface were higher than those of the AA5083 parent material, and lower than those of the AA6060 parent material. This is confirmed by the results of the potentiodynamic tests and Tafel extrapolations.

4. Conclusions

The friction-stir-welding process was applied to produce dissimilar butt welds with AA5083 and AA6060 aluminum alloys. Different tool rotational speed values were used (800, 1000, 1200 RPM), with a constant tool traverse speed (100 mm/min) and tool tilt angle (2°). The studies were conducted to evaluate the microstructure, hardness, dislocation density and mobility, as well as corrosion resistance, of the resulting welds. The following conclusions can be drawn from this study:
  • The use of a hexagonal tool with grooves, along with the selection of the above process parameters, yielded sound welds that were characterized by an absence of surface defects. The typical microstructure characterized by zones of HAZ, TMAZ and fine-grained WN was revealed.
  • Hardness measurements were taken on cross sections of the joints using indentation tests. A reduction in hardness values was observed in the heat-affected zones on the AA6060 alloy side of the produced welds. The lowest hardness was noted for the HAZ of the weld that was produced with a tool rotational speed of 1200 RPM, and was equal to 0.64 GPa. In addition, it was observed that the maximum hardness of the nugget zone increased with increasing tool rotational speed. This is explained by a more efficient recrystallization process occurring as a result of higher heat input. The highest hardness of the WN zone was observed for the weld that was produced with the highest tool rotational speed of 1200 RPM, and was equal to 1.07 GPa.
  • Based on the results of the indentation tests, in particular, the dwell time period, the densities and mobilities of dislocations in the individual zones of weld cross sections were calculated. The lowest dislocation density of 5.597 × 10¹⁴ m−2, with the highest mobility of 7.009 × 10⁻⁹ m s , was observed in the heat-affected zones on the AA6060 side of the resulting welds, which may explain the significant strength reduction in this zone.
  • The conducted potentiodynamic tests in 3.5 wt% NaCl revealed that the AA5083 base material was characterized by the highest corrosion resistance, and the corrosion current density was equal to 4.506 ± 0.278 µA·cm−2. The highest corrosion current density 9.047 ± 0.768 µA·cm−2 was noted for the base metal AA6060. The corrosion current densities for all welded samples yielded average values that fell between both parent materials. By increasing the tool rotational speed, there was higher heat input. This resulted in more effective recrystallization, and better corrosion resistance of the welds.

Author Contributions

Conceptualization, A.L.; methodology, A.L.; validation, A.L., M.S., A.P. and P.C.; formal analysis, P.C. and M.S.; investigation, A.L.; writing—original draft preparation, A.L.; writing—review and editing, P.C. and M.S.; visualization, A.L. and A.P.; supervision, P.C. and M.S. All authors have read and agreed to the published version of the manuscript.

Funding

This research received no external funding.

Conflicts of Interest

The authors declare no conflict of interest.

References

  1. Ghaffarpour, M.; Kolahgar, S.; Dariani, B.M.; Dehghani, K. Evaluation of dissimilar welds of 5083-H12 and 6061-T6 produced by friction stir welding. Metall. Mater. Trans. A Phys. Metall. Mater. Sci. 2013, 44, 3697–3707. [Google Scholar] [CrossRef]
  2. Ancona, A.; Daurelio, G.; De Filippis, L.A.C.; Ludovico, A.D.; Spera, A.M. CO2 Laser Welding of Aluminium Shipbuilding Industry Alloys: AA 5083, AA 5383, AA 5059, and AA 6082. In Proceedings of the XIV International Symposium on Gas Flow Chemical Lasers, and High-Power Lasers, Wroclaw, Poland, 25–30 August 2002; pp. 577–587. [Google Scholar]
  3. Kawasaki, T.; Makino, T.; Masai, K.; Ohba, H.; Ina, Y.; Ezumi, M. Application of friction stir welding to construction of railway vehicles. JSME Int. J. Ser. A Solid Mech. Mater. Eng. 2004, 47, 502–511. [Google Scholar] [CrossRef]
  4. Vasudevan, N.; Bhaskar, G.B.; Rajendra Prasad, A.; Suresh, S.M. Corrosion study on AA5083 aluminum alloy—Boron carbide composite. Mater. Today Proc. 2019, 16, 1124–1129. [Google Scholar] [CrossRef]
  5. Samuel Ratna Kumar, P.S.; Robinson Smart, D.S.; John Alexis, S. Corrosion behaviour of Aluminium Metal Matrix reinforced with Multi-wall Carbon Nanotube. J. Asian Ceram. Soc. 2017, 5, 71–75. [Google Scholar] [CrossRef]
  6. Liu, Q.; Han, R.; Gao, Y.; Ke, L. Numerical investigation on thermo-mechanical and material flow characteristics in friction stir welding for aluminum profile joint. Int. J. Adv. Manuf. Technol. 2021, 114, 2457–2469. [Google Scholar] [CrossRef]
  7. Chen, X.; Peng, Y.; Peng, S.; Yao, S.; Chen, C.; Xu, P. Flow and fracture behavior of aluminum alloy 6082-T6 at different tensile strain rates and triaxialities. PLoS ONE 2017, 12, e0181983. [Google Scholar] [CrossRef] [PubMed]
  8. Baratzadeh, F.; Boldsaikhan, E.; Nair, R.; Burford, D.; Lankarani, H. Investigation of mechanical properties of AA6082-T6/AA6063-T6 friction stir lap welds. J. Adv. Join. Processes 2020, 1, 100011. [Google Scholar] [CrossRef]
  9. Varma, K.V.K.; Baig, I.; Kumar, B.V.R.R.; Ramana, M.V. Effect of friction stir welding parameters on tool geometry and metallurgical properties of AA 6082-T6 weldments at different weld zones. Mater. Today Proc. 2021, 45, 3195–3200. [Google Scholar] [CrossRef]
  10. Maciel, R.; Bento, T.; Braga, D.F.O.; da Silva, L.F.M.; Moreira, P.M.G.P.; Infante, V. Fatigue properties of combined friction stir and adhesively bonded AA6082-T6 overlap joints. Fatigue Fract. Eng. Mater. Struct. 2020, 43, 2169–2180. [Google Scholar] [CrossRef]
  11. Li, Y.; Zou, W.; Lee, B.; Babkin, A.; Chang, Y. Research progress of aluminum alloy welding technology. Int. J. Adv. Manuf. Technol. 2020, 109, 1207–1218. [Google Scholar] [CrossRef]
  12. Safeen, M.W.; Spena, P.R. Main issues in quality of friction stir welding joints of aluminum alloy and steel sheets. Metals 2019, 9, 610. [Google Scholar] [CrossRef]
  13. Laska, A.; Szkodo, M. Manufacturing Parameters, Materials, and Welds Properties of Butt Friction Stir Welded Joints–Overview. Materials 2020, 13, 4940. [Google Scholar] [CrossRef] [PubMed]
  14. Magalhães, V.M.; Leitão, C.; Rodrigues, D.M. Friction stir welding industrialisation and research status. Sci. Technol. Weld. Join. 2018, 23, 400–409. [Google Scholar] [CrossRef]
  15. Devaiah, D.; Kishore, K.; Laxminarayana, P. Optimal FSW process parameters for dissimilar aluminium alloys (AA5083 and AA6061) Using Taguchi Technique. Mater. Today Proc. 2018, 5, 4607–4614. [Google Scholar] [CrossRef]
  16. Peel, M.J.; Steuwer, A.; Withers, P.J.; Dickerson, T.; Shi, Q.; Shercliff, H. Dissimilar friction stir welds in AA5083-AA6082. Part I: Process parameter effects on thermal history and weld properties. Metall. Mater. Trans. A Phys. Metall. Mater. Sci. 2006, 37, 2183–2193. [Google Scholar] [CrossRef]
  17. Khodir, S.A.; Shibayanagi, T. Friction stir welding of dissimilar AA2024 and AA7075 aluminum alloys. Mater. Sci. Eng. B Solid-State Mater. Adv. Technol. 2008, 148, 82–87. [Google Scholar] [CrossRef]
  18. Palanivel, R.; Koshy Mathews, P.; Murugan, N.; Dinaharan, I. Effect of tool rotational speed and pin profile on microstructure and tensile strength of dissimilar friction stir welded AA5083-H111 and AA6351-T6 aluminum alloys. Mater. Des. 2012, 40, 7–16. [Google Scholar] [CrossRef]
  19. Guo, J.F.; Chen, H.C.; Sun, C.N.; Bi, G.; Sun, Z.; Wei, J. Friction stir welding of dissimilar materials between AA6061 and AA7075 Al alloys effects of process parameters. Mater. Des. 2014, 56, 185–192. [Google Scholar] [CrossRef]
  20. Mastanaiah, P.; Sharma, A.; Reddy, G.M. Dissimilar Friction Stir Welds in AA2219-AA5083 Aluminium Alloys: Effect of Process Parameters on Material Inter-Mixing, Defect Formation, and Mechanical Properties. Trans. Indian Inst. Met. 2016, 69, 1397–1415. [Google Scholar] [CrossRef]
  21. Dong, J.; Zhang, D.; Zhang, W.; Zhang, W.; Qiu, C. Microstructure evolution during dissimilar friction stir welding of AA7003-T4 and AA6060-T4. Materials 2018, 11, 342. [Google Scholar] [CrossRef] [Green Version]
  22. Husain, M.M.; Sarkar, R.; Pal, T.K.; Prabhu, N.; Ghosh, M. Friction Stir Welding of Steel: Heat Input, Microstructure, and Mechanical Property Co-relation. J. Mater. Eng. Perform. 2015, 24, 3673–3683. [Google Scholar] [CrossRef]
  23. Krishnan, M.; Subramaniam, S.K. Investigation of Mechanical and Metallurgical Properties of Friction Stir Corner Welded Dissimilar Thickness AA5086-AA6061 Aluminium Alloys. Mater. Res. 2018, 21, e20171045. [Google Scholar] [CrossRef]
  24. Liu, F.J.; Fu, L.; Chen, H.Y. Effect of high rotational speed on temperature distribution, microstructure evolution, and mechanical properties of friction stir welded 6061-T6 thin plate joints. Int. J. Adv. Manuf. Technol. 2018, 96, 1823–1833. [Google Scholar] [CrossRef]
  25. Salih, O.S.; Ou, H.; Wei, X.; Sun, W. Microstructure and mechanical properties of friction stir welded AA6092/SiC metal matrix composite. Mater. Sci. Eng. A 2019, 742, 78–88. [Google Scholar] [CrossRef]
  26. Morozova, I.; Obrosov, A.; Naumov, A.; Królicka, A.; Golubev, I.; Bokov, D.O.; Doynov, N.; Weiß, S.; Michailov, V. Impact of impulses on microstructural evolution and mechanical performance of al-mg-si alloy joined by impulse friction stir welding. Materials 2021, 14, 347. [Google Scholar] [CrossRef]
  27. Laska, A.; Szkodo, M.; Koszelow, D.; Cavaliere, P. Effect of Processing Parameters on Strength and Corrosion Resistance of Friction Stir-Welded AA6082. Metals 2022, 12, 192. [Google Scholar] [CrossRef]
  28. Naik, S.N.; Walley, S.M. The Hall–Petch and inverse Hall–Petch relations and the hardness of nanocrystalline metals. J. Mater. Sci. 2020, 55, 2661–2681. [Google Scholar] [CrossRef]
  29. Bahrami, M.; Dehghani, K.; Besharati Givi, M.K. A novel approach to develop aluminum matrix nano-composite employing friction stir welding technique. Mater. Des. 2014, 53, 217–225. [Google Scholar] [CrossRef]
  30. Sangalli, G.; Lemos, G.V.B.; Martinazzi, D.; De Lima Lessa, C.R.; Beskow, A.B.; Reguly, A. Towards qualification of friction stir welding to AA5083-O and AA5052-O aluminum alloys. Mater. Res. 2019, 22, e20190349. [Google Scholar] [CrossRef]
  31. Threadgill, P.L.; Leonard, A.J.; Shercliff, H. Friction Stir Welding of Aluminium Alloys. Int. Mater. Rev. 2009, 54, 49–93. [Google Scholar] [CrossRef]
  32. Sato, Y.S.; Onuma, T.; Ikeda, K.; Kokawa, H. Experimental verification of heat input during friction stir welding of Al alloy 5083. Sci. Technol. Weld. Join. 2016, 21, 325–330. [Google Scholar] [CrossRef]
  33. Zhang, Z.; Zhang, Z.; Zhang, H. Numerical investigations of size effects on residual states of friction stir weld. Proc. Inst. Mech. Eng. Part B J. Eng. Manuf. 2014, 228, 572–581. [Google Scholar] [CrossRef]
  34. Sedmak, A.S.; Kumar, R.; Chattopadhyaya, S.; Hloch, S.; Tadić, S.S.; Djurdjević, A.A.; Čeković, I.R.; Dončeva, E. Heat input effect of friction stir welding on aluminum alloy AA 6061-T6 welded joint. Therm. Sci. 2016, 20, 637–641. [Google Scholar] [CrossRef]
  35. Thirathipviwat, P.; Song, G.; Bednarcik, J.; Kühn, U.; Gemming, T.; Nielsch, K.; Han, J. Compositional complexity dependence of dislocation density and mechanical properties in high entropy alloy systems. Prog. Nat. Sci. Mater. Int. 2020, 30, 545–551. [Google Scholar] [CrossRef]
  36. Durst, K.; Backes, B.; Franke, O.; Göken, M. Indentation size effect in metallic materials: Modeling strength from pop-in to macroscopic hardness using geometrically necessary dislocations. Acta Mater. 2006, 54, 2547–2555. [Google Scholar] [CrossRef]
  37. Yamada, H.; Ogasawara, N.; Shimizu, Y.; Horikawa, H.; Kobayashi, H. Effect of high strain rate on micro-indentation test in pure aluminum. EPJ Web Conf. 2012, 26, 2–6. [Google Scholar] [CrossRef]
  38. Laska, A.; Szkodo, M.; Pawłowski, Ł.; Gajowiec, G. Corrosion properties of dissimilar AA6082/AA6060 friction stir welded butt joints in different NaCl concentrations. Int. J. Precis. Eng. Manuf. Green Technol. 2022. [Google Scholar] [CrossRef]
  39. Johnson, K.L. Contact Mechanics; Cambridge University Press: Cambridge, UK, 1985; ISBN 9780521255769. [Google Scholar]
  40. Cho, J.; Molinari, J.F.; Anciaux, G. Mobility law of dislocations with several character angles and temperatures in FCC aluminum. Int. J. Plast. 2017, 90, 66–75. [Google Scholar] [CrossRef]
  41. Zhuang, Z.; Liu, Z.; Cui, Y. Strain Gradient Plasticity Theory at the Microscale. In Dislocation Mechanism-Based Crystal Plasticity; Academic Press: Cambridge, UK, 2019; pp. 57–90. ISBN 9780128145913. [Google Scholar]
  42. Voyiadjis, G.Z.; Abed, F.H. Effect of dislocation density evolution on the thermomechanical response of metals with different crystal structures at low and high strain rates and temperatures. Arch. Mech. 2005, 57, 299–343. [Google Scholar] [CrossRef]
  43. Jata, K.V.; Sankaran, K.K.; Ruschau, J.J. Friction-stir welding effects on microstructure and fatigue of aluminum alloy 7050-T7451. Metall. Mater. Trans. A Phys. Metall. Mater. Sci. 2000, 31, 2181–2192. [Google Scholar] [CrossRef]
  44. Prangnell, P.B.; Heason, C.P. Grain structure formation during friction stir welding observed by the “stop action technique”. Acta Mater. 2005, 53, 3179–3192. [Google Scholar] [CrossRef]
  45. Woo, W.; Balogh, L.; Ungár, T.; Choo, H.; Feng, Z. Grain structure and dislocation density measurements in a friction-stir welded aluminum alloy using X-ray peak profile analysis. Mater. Sci. Eng. A 2008, 498, 308–313. [Google Scholar] [CrossRef]
  46. Woo, W.; Ungár, T.; Feng, Z.; Kenik, E.; Clausen, B. X-ray and neutron diffraction measurements of dislocation density and subgrain size in a friction-stir-welded aluminum alloy. Metall. Mater. Trans. A Phys. Metall. Mater. Sci. 2010, 41, 1210–1216. [Google Scholar] [CrossRef]
  47. Yuzbekova, D.; Kulitskiy, V.; Mogucheva, A.; Kaibyshev, R. Effect of friction stir welding on microstructure of a 5024 alloy. Mater. Sci. Forum 2017, 879, 2249–2254. [Google Scholar] [CrossRef]
  48. Ni, D.R.; Chen, D.L.; Wang, D.; Xiao, B.L.; Ma, Z.Y. Tensile properties and strain-hardening behaviour of friction stir welded SiCp/AA2009 composite joints. Mater. Sci. Eng. A 2014, 608, 1–10. [Google Scholar] [CrossRef]
  49. Nişancioǧlu, K. Corrosion and protection of aluminum alloys in seawater. In Corrosion Behaviour and Protection of Copper and Aluminium Alloys in Seawater; European Federation of Corrosion (EFC) Series; Woodhead Publishing: Sawston, UK, 2007; pp. 145–155. ISBN 9781845692414. [Google Scholar]
  50. Sukiman, N.L.; Zhou, X.; Birbilis, N.; Hughes, A.E.; Mol, J.M.C.; Garcia, S.J.; Thompson, G.E. Durability and Corrosion of Aluminium and Its Alloys: Overview, Property Space, Techniques and Developments. In Aluminium Alloys—New Trends in Fabrication and Applications; IntechOpen: London, UK, 2012; pp. 47–97. ISBN 978-953-51-0861-0. [Google Scholar]
  51. Kartsonakis, I.A.; Dragatogiannis, D.A.; Koumoulos, E.P.; Karantonis, A.; Charitidis, C.A. Corrosion behaviour of dissimilar friction stir welded aluminium alloys reinforced with nanoadditives. Mater. Des. 2016, 102, 56–67. [Google Scholar] [CrossRef]
  52. Qin, H.; Zhang, H.; Sun, D.; Zhuang, Q. Corrosion behavior of the friction-stir-welded joints of 2A14-T6 aluminum alloy. Int. J. Miner. Metall. Mater. 2015, 22, 627–638. [Google Scholar] [CrossRef]
  53. Zucchi, F.; Trabanelli, G.; Grassi, V. Pitting and stress corrosion cracking resistance of friction stir welded AA 5083. Werkst. Und Korros. 2001, 52, 853–859. [Google Scholar] [CrossRef]
  54. Maggiolino, S.; Schmid, C. Corrosion resistance in FSW and in MIG welding techniques of AA6XXX. J. Mater. Process. Technol. 2008, 197, 237–240. [Google Scholar] [CrossRef]
  55. Ralston, K.D.; Fabijanic, D.; Birbilis, N. Effect of grain size on corrosion of high purity aluminium. Electrochim. Acta 2011, 56, 1729–1736. [Google Scholar] [CrossRef]
  56. Song, D.; Ma, A.; Jiang, J.; Lin, P.; Yang, D. Corrosion behavior of ultra-fine grained industrial pure Al fabricated by ECAP. Trans. Nonferrous Met. Soc. China 2009, 19, 1065–1070. [Google Scholar] [CrossRef]
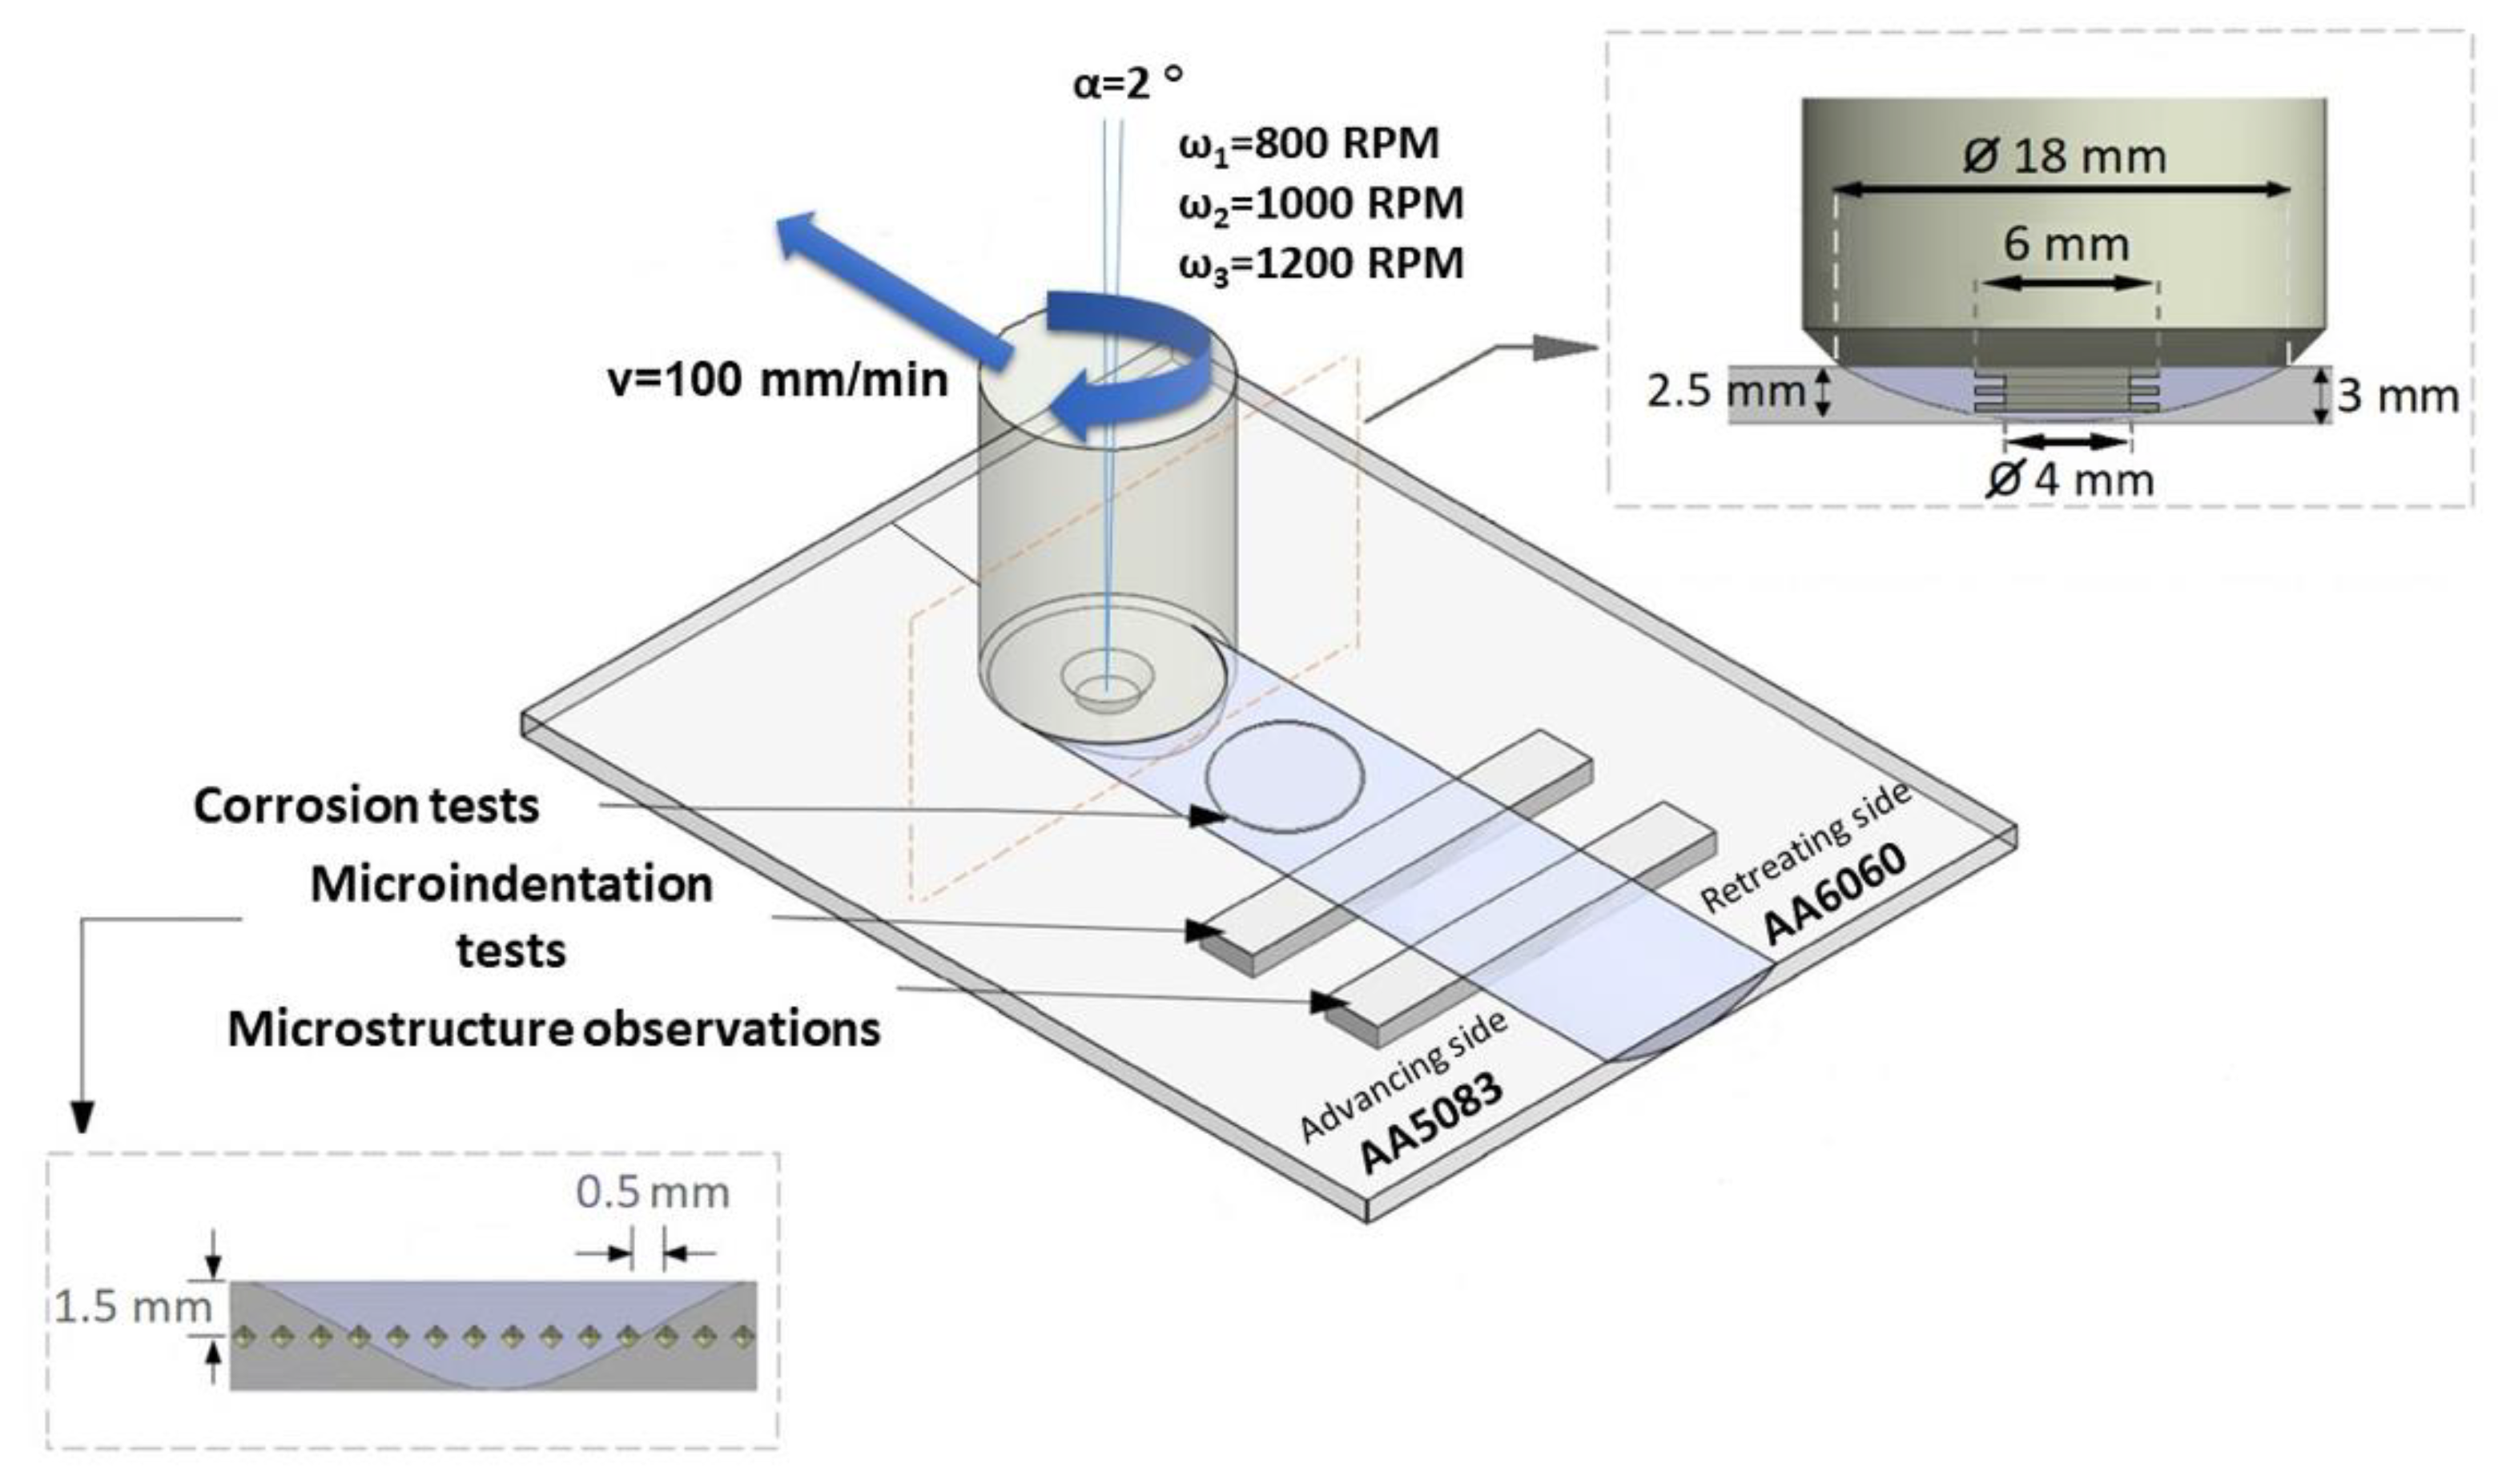
Figure 1. Schematic illustration of the process, geometry of the tool and location of the samples for the performed tests.
Metals 12 01658 g001
Figure 2. Friction-stir-welded samples produced with tool rotational speeds of 800 RPM (a), 1000 RPM (b) and 1200 RPM (c).
Metals 12 01658 g002
Figure 3. Macrostructure of the weld produced with a tool rotational speed of 1200 RPM (a), and microstructures of base metals AA5083 (b), AA6060 (c), HAZ on AA5083 side (d), HAZ on AA6060 side (e), TMAZ on AA5083 side (f), TMAZ on AA6060 side (g) and the weld nugget (h).
Metals 12 01658 g003
Figure 4. Hardness profiles of the joints produced with a tool rotational speed of 800 RPM (a), 1000 RPM (b) and 1200 RPM (c). Red dots indicate the exact locations of further dislocation density and mobility calculations.
Metals 12 01658 g004
Figure 5. Relationship between the maximum hardness of the nugget zone and revolutionary pitch (a), minimum hardness of the heat-affected zone and revolutionary pitch (b) and size of the nugget zone and revolutionary pitch (c).
Metals 12 01658 g005
Figure 6. Cross-section of a sample during indentation tests.
Metals 12 01658 g006
Figure 7. Hysteresis plots of load–depth for a single indentation in the base metals AA5083, AA6060, HAZ, TMAZ and WN, for the welds produced with tool rotational speeds of 800 RPM (a), 1000 RPM (b) and 1200 RPM (c).
Metals 12 01658 g007
Figure 8. Strain versus time diagrams for the indentation dwell time period in the base metals AA5083, AA6060, HAZ, TMAZ and WN for the welds produced with tool rotational speeds of 800 RPM (a), 1000 RPM (b) and 1200 RPM (c).
Metals 12 01658 g008
Figure 9. Density of SSDs (a) and dislocation mobilities (b) for all of the tested samples in different zones.
Metals 12 01658 g009
Figure 10. Open circuit potentials (OCP) (a) and potentiodynamic polarization curves (b) for all the tested samples in 3.5 wt% NaCl solution.
Metals 12 01658 g010
Figure 11. The relationship between corrosion current density (icorr) and revolutionary pitch for the produced welds.
Metals 12 01658 g011
Figure 12. SEM images illustrating the surfaces of the samples after electrochemical tests on the base materials AA5083 (a), AA6060 (b), and the welds produced with tool rotational speeds of 800 RPM (c), 1000 RPM (d) and 1200 RPM (e).
Metals 12 01658 g012
Table 1. Chemical compositions of the AA5083 and AA6060 alloys.
Chemical Composition (wt%)
SiFeCuMnMgCrZnTiAl
AA50830.400.400.100.604.500.150.250.15balance
AA60600.400.200.100.100.400.050.150.10balance
Table 2. FSW process parameters and corresponding revolutionary pitch values.
MaterialTraverse Speed (mm/min)Rotational Speed (RPM)Tilt Angle (º)Revolutionary Pitch (rot/mm)
AA5083/AA606010080028
AA5083/AA60601001000210
AA5083/AA60601001200212
Table 3. Hardness, maximum indenter displacement, density of GNDs, density of SSDs and dislocation mobilities for all of the tested samples in different zones.
SampleHISE (GPa)hmax (µm) ρ G N D 1 m 2 ρ s s d 1 m 2 V m s  
-AA50830.7547.6295.386 × 10126.679 × 10144.429 × 10−9
-AA60601.1036.2836.540 × 10129.785 × 10142.844 × 10−9
ω = 800 RPMHAZ AA5083 side0.8817.2265.687 × 10127.811 × 10144.082 × 10−9
ω = 800 RPMTMAZ AA5083 side0.9456.6936.140 × 10128.378 × 10143.681 × 10−9
ω = 800 RPMWN1.0346.5186.305 × 10129.171 × 10143.142 × 10−9
ω = 800 RPMTMAZ AA6060 side0.8967.1435.753 × 10127.945 × 10144.137 × 10−9
ω = 800 RPMHAZ AA6060 side0.6878.3564.918 × 10126.086 × 10146.142 × 10−9
ω = 1000 RPMHAZ AA5083 side0.8437.3385.600 × 10127.124 × 10144.403 × 10−9
ω = 1000 RPMTMAZ AA5083 side0.9326.9225.937 × 10128.264 × 10143.482 × 10−9
ω = 1000 RPMWN1.0606.5036.319 × 10129.404 × 10143.090 × 10−9
ω = 1000 RPMTMAZ AA6060 side0.8837.2195.692 × 10127.829 × 10144.095 × 10−9
ω = 1000 RPMHAZ AA6060 side0.6528.6414.755 × 10125.775 × 10146.442 × 10−9
ω = 1200 RPMHAZ AA5083 side0.8457.3335.604 × 10127.490 × 10144.015 × 10−9
ω = 1200 RPMTMAZ AA5083 side0.9436.9105.947 × 10128.362 × 10143.487 × 10−9
ω = 1200 RPMWN1.0716.4356.386 × 10129.501 × 10143.003 × 10−9
ω = 1200 RPMTMAZ AA6060 side0.9257.0495.830 × 10128.203 × 10143.768 × 10−9
ω = 1200 RPMHAZ AA6060 side0.6328.7424.700 × 10125.597 × 10147.009 × 10−9
Table 4. Open circuit potentials (OCP), corrosion potentials (Ecorr) and corrosion current densities (icorr) for the tested samples.
Sampleω = 800 RPMω = 1000 RPMω = 1200 RPMAA5083AA6060
OCP (V)−0.697 ± 0.039−0.694 ± 0.039−0.679 ± 0.007−0.661 ± 0.017−0.738 ± 0.013
Ecorr (V)−1.328 ± 0.015−1.312 ± 0.014−1.299 ± 0.015−1.356 ± 0.009−1.196 ± 0.001
icorr (µA·cm−2)8.075 ± 0.1827.592 ± 0.4426.935 ± 0.1994.506 ± 0.2789.047 ± 0.768
Publisher’s Note: MDPI stays neutral with regard to jurisdictional claims in published maps and institutional affiliations.