Article

Influence Evaluation of Tungsten Content on Microstructure and Properties of Cu-W Composite

National Joint Engineering Research Center for Abrasion Control and Molding of Metal Materials, Henan University of Science & Technology, Luoyang 471003, China
*
Author to whom correspondence should be addressed.
Metals 2022, 12(10), 1668; https://doi.org/10.3390/met12101668
Submission received: 27 August 2022 / Revised: 28 September 2022 / Accepted: 30 September 2022 / Published: 5 October 2022

Abstract

:
At present, most studies focus on Cu-W composites with high W content (W content > 50 wt%), while there are only sporadic reports on Cu-W composites with low W content (W content < 50 wt%). In this work, Cu-W composites with different W contents (0, 10 wt%, 20 wt% and 30 wt%) were prepared, and the effects of W content on microstructure, density, hardness, electrical conductivity, strength and electrical contact properties were systematically studied, with the expectation of providing an experimental basis and theoretical support for expanding the application range of Cu-W composites with low W content. The results showed that, with the increase in W content, the Cu matrices divided into finer and more uniform grains; the density and electrical conductivity of Cu-W composites decreased; and the compressive yield strength and hardness gradually increased. As the content of W increased, the arc burning time of the Cu-W composite contacts began to fluctuate. There was a loss of both the cathode and the anode contacts of the pure Cu, but the mass transfer of the Cu-W composite contacts occurred as follows: the anode weight increases, while the cathode weight decreases. The addition of W particles changed the non-uniform ablation of the pure Cu, and the surface ablation of the Cu-W composite contacts remained uniform.

1. Introduction

Metal copper (Cu) has been widely used in electrical, electronics, energy, aerospace, marine equipment, decorative and other fields, due to its good conductivity, heat conduction, plasticity and corrosion resistance. However, the low strength and hardness of pure Cu greatly limit its engineering applications [1,2,3]. With the rapid development of science and technology, the demand for comprehensive properties of materials is increasing. In recent years, extensive research has been carried out on high-performance Cu matrix composites [4,5,6,7,8].
By introducing a second phase into the Cu matrix, the composite properties of pure Cu can be largely improved. For example, Pan et al. [9] fabricated high-performance Cu–TiB2 nanocomposites by introducing TiB2 into the copper melt. Their strength was greatly improved, while maintaining high conductivity. Akbarpour [10] added SiC nanoparticles into a Cu matrix and studied the microstructure and mechanical properties of the Cu–SiC nanocomposite. It was found that the microhardness of the Cu increased with the incorporation of SiC. Câmara et al. [11] also studied the properties of Cu–SiC composites with SiC content and found that when the content of SiC was 15 wt%, the Vickers microhardness of the composite could reach a maximum value. Shu et al. [12] introduced B4C particles into a Cu matrix to form Cu-B4C composites. The wear resistance of the Cu-15 wt%B4C composites was much higher than that of pure Cu. The tribo-mechanical properties of Cu-Al2O3 composites have been studied by Pingale et al. [13]. When compared to pure Cu, the friction coefficient of the composites reduced by 28%. In addition to these particles, other particles have also been added to copper matrices to improve their properties, e.g., CNTs [14], ZrO2 [15,16,17], ZnO [18], TiC [19,20], and ZrB2 [21,22,23].
Tungsten (W) has many advantages, such as high strength, a high elastic modulus, a high density, high hardness, a high melting point and low thermal expansion [24,25,26,27]. If W is introduced into a copper matrix, the mechanical properties of the copper matrix, especially at high temperatures, can be greatly improved. The study of Cu-W composites is a hot topic right now, and they have been applied in some materials, such as rocket engines and golf clubs. Cu-W composite properties can be adjusted by adjusting the ratios of W and Cu phases. At present, most studies focus on Cu-W composites with high W content (W content > 50 wt%) [28,29,30], while there are only sporadic reports on Cu-W composites with low W content (W content < 50 wt%). In our previous work, we have systematically studied the effect of sintering temperature on the microstructure and behaviors of Cu-20 wt% W composites [31] and their high-temperature compression performance [32]. In this paper, W particles were introduced into Cu powder with the mechanical mixing method, and Cu-W composites with different W contents were prepared through powder metallurgy technology, in which the W content was 0, 10 wt%, 20 wt% and 30 wt%. The effects of W content on the microstructure, density, hardness, electrical conductivity, strength and electrical contact properties were systematically studied. Through this work, we hope to provide an experimental basis and theoretical support for the application and promotion of Cu-W composites with low W contents.

2. Materials and Methods

The raw materials of Cu powder and W powder were purchased commercially from Ningbo Jinlei Nanomaterials Technology Co., LTD, China. The purity of the powders was greater than 99.9%. Certain amounts of Cu powder and W powder were weighed using an electronic analysis balance and put into a ball mill tank. Anhydrous ethanol and φ 8 mm Al2O3 balls were used as the grinding medium. The ball mill tank was then placed on a horizontal ball mill for mixing, the speed of the ball mill was set to 60 r/min, and the mixing time was set to 24 h. After mixing, the composite powder was immediately taken out from the ball mill tank and put into a vacuum drying oven for drying. The drying temperature was 50 °C, the duration was 4 h, and the vacuum degree was 10−2 Pa. The powder was sifted through a 200 mesh sieve, and the grinding ball was sifted out to obtain Cu-W composite powder, in which the W content was 0, 10 wt%, 20 wt% and 30 wt%, respectively. Pure Cu, Cu-10 wt% W, Cu-20 wt% W and Cu-30 wt% W composite materials were obtained by sintering with a discharge plasma sintering furnace (Model: SPS-20T-10). Figure 1 shows the sintering process curve. The detailed sintering process was introduced in our previous work [31,32].
The relative densities of the Cu-W composites were measured via the Archimedes method. A microhardness tester (Model: HVS−1000, Yantai, China) was used to measure hardness with a 200 g indenter load. A conductivity meter (Model: Sigma 2008B, Kawasaki, Japan) was used to measure electrical conductivity. The room temperature compression tests were carried out on a universal testing machine (Model: AG-1250 kN, Tokyo, Japan). The compression rate was 0.05 mm/s, and the deformation was 70%. The cylindrical sample size was φ 8 × 12 mm. Electrical contact properties were tested with an electric contact testing system (Model: JF04C, Kunming, China), and the test parameters are shown in Table 1. Each index was measured five times, and the average value was taken as the final value.
Scanning electron microscopy (SEM, Model: TESCAN, Brno, Czechia) and energy spectrum analysis (EDS, Model: TESCAN) were used to observe and analyze the microstructure of the powders, Cu-W composites, fracture appearances and contact surfaces.

3. Results and Discussion

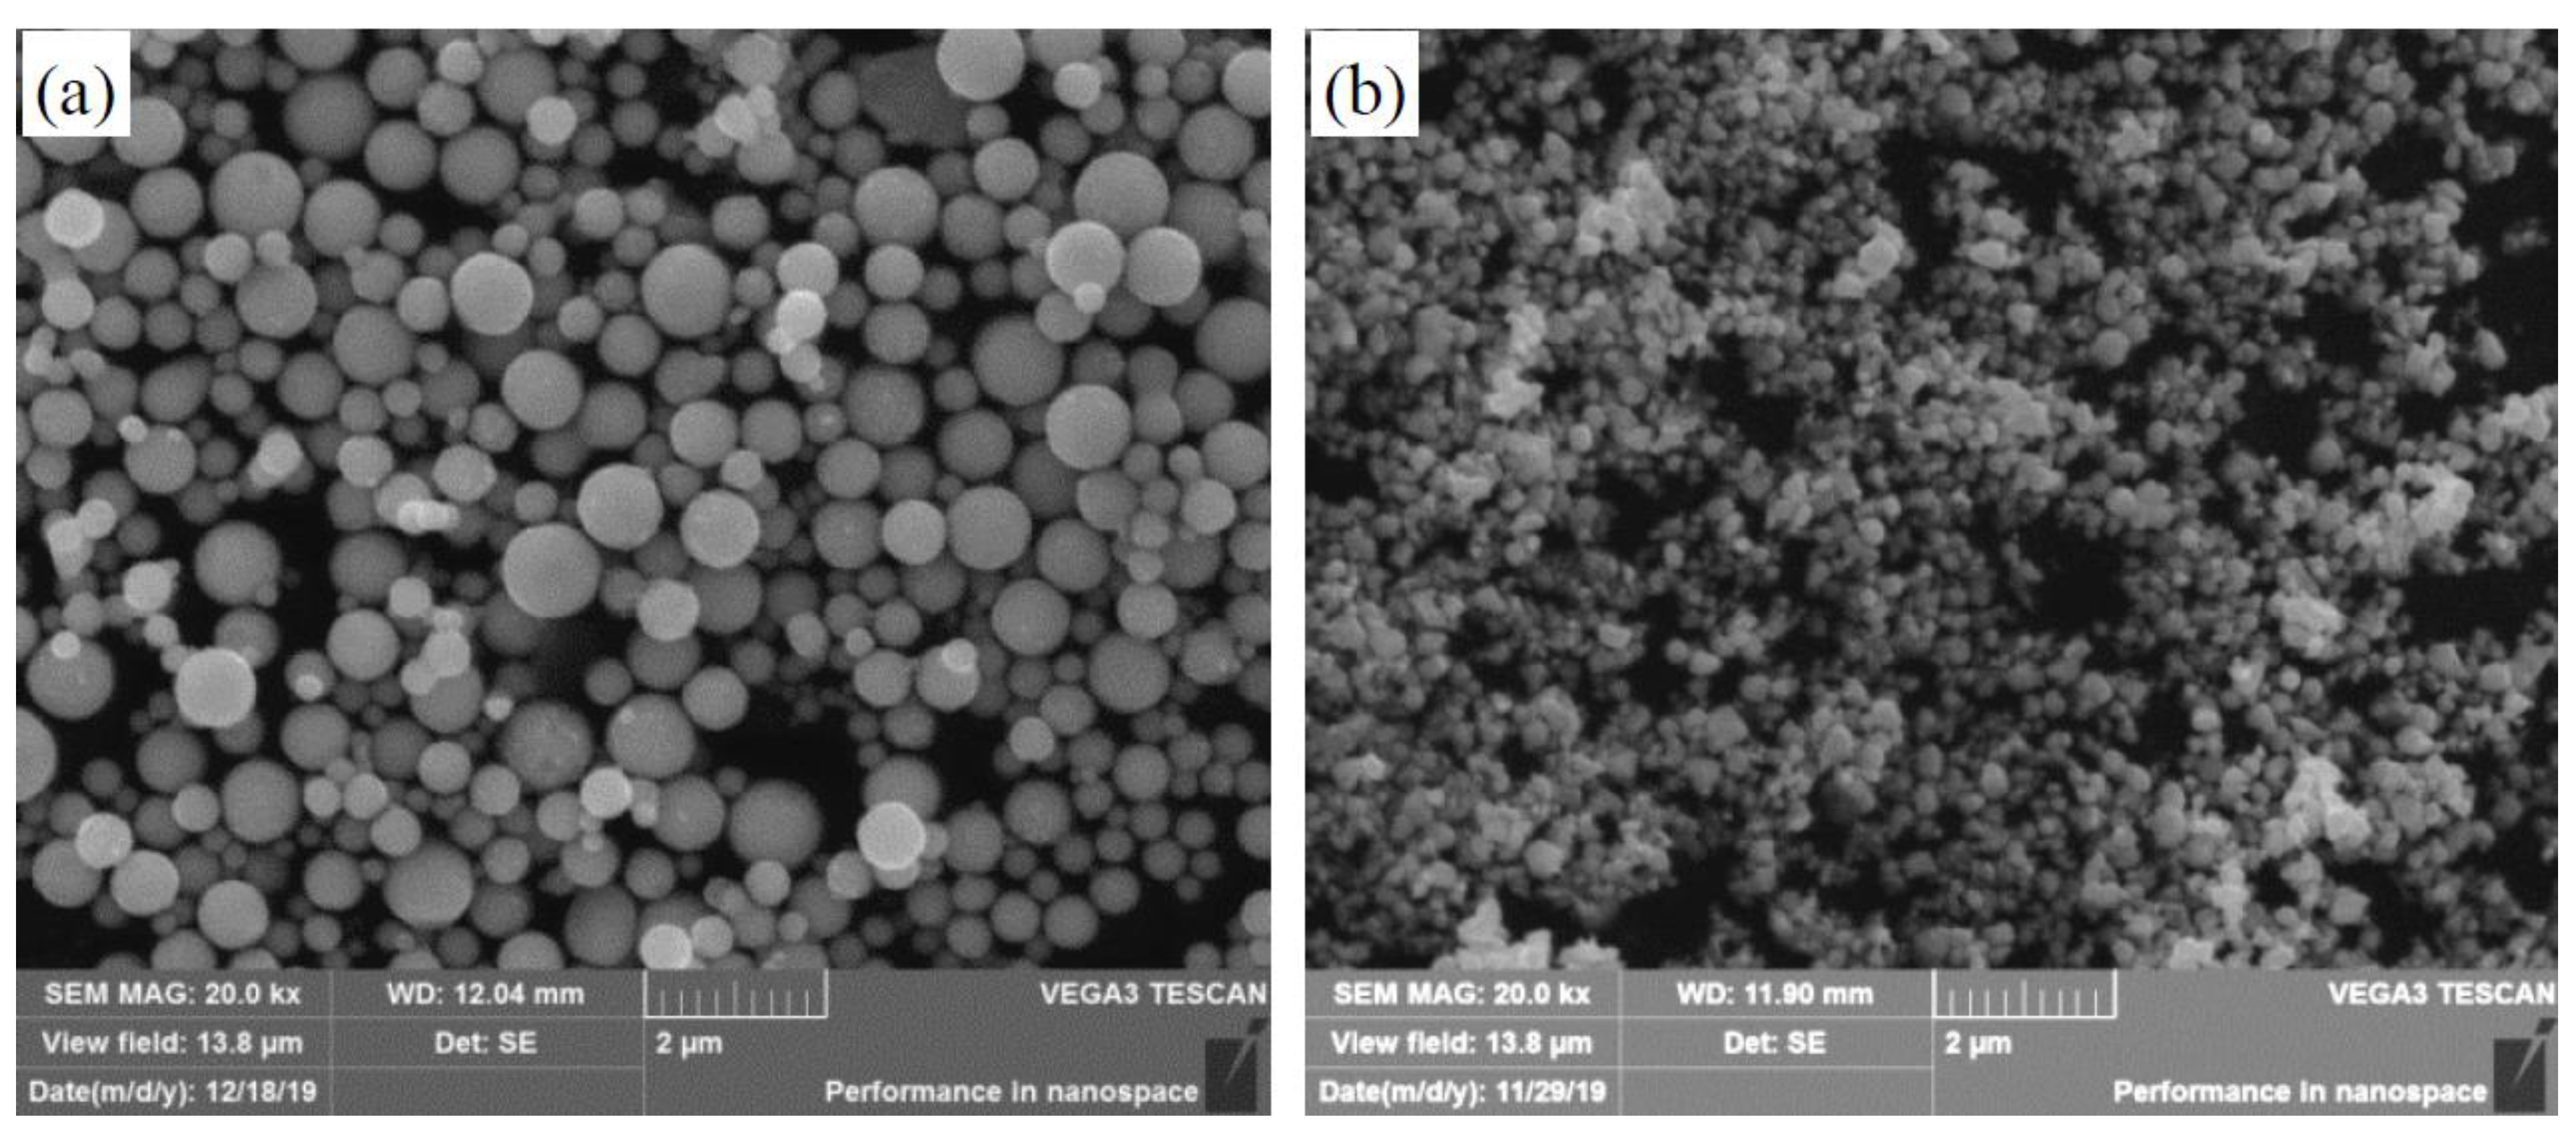
Figure 2 shows the micromorphologies of the pure Cu powder and the pure W powder. The pure Cu powder was spherical in shape, and there was no adhesion between the powder grains (Figure 2a). The particle size of the Cu powder was about 0.2–1 μm. As shown in Figure 2b, the pure W powder was spherical in shape, but some of the powders were agglomerated. The particle size of the W powder was about 200 nm.
Microscopic images of the Cu-W composite powders with different W contents are shown in Figure 3. In the figure, the gray particles are Cu and the white particles are W. The distribution of the W particles was roughly uniform, as shown in Figure 3a–c. In the mixing process, the internal energy of the powder particles increased, due to the interaction between the powder particles or between the powders and the grinding balls, which led to the plastic deformation of some the larger Cu particles, transforming them from spherically-shaped to olive- or cake-shaped. Additionally, parts of the powders were broken into flocculent structures, as marked by the letter A in Figure 3a, and EDS analysis of area A showed that the flocculent structure was Cu (Figure 3d). Figure 3e shows the XRD patterns of the pure Cu, pure W and Cu-W composite powders, indicating that there were no extra diffraction peaks, except for the Cu and the W. The Cu-W composite powders were almost free of Al2O3 from the grinding balls.
Figure 4 shows the microstructures of the Cu-W composites with different W contents. The pure Cu grains were fine and uniform, as shown in Figure 4a. With the increase in tungsten content, the white phases increased in BSE diagrams of the Cu-W composites, as is shown in Figure 4b–d, and the white phases of tungsten were evenly distributed in the gray copper matrix.
Figure 5 shows the fracture morphologies of the Cu-W composites with different W contents. The pure Cu sample showed typical ductile fracture morphology, with fine and uniform dimples distributed on the fracture surface, as is shown in Figure 5a. The fracture of the Cu-10 wt% W composite was mainly composed of tearing edges and dimples coated with particles (Figure 5b). The tearing edges were mainly composed of Cu, and the dimples were coated with W particles. With the increase in W content, W particles tended to agglomerate and distribute along the tearing edges, which can be seen in Figure 5c,d.
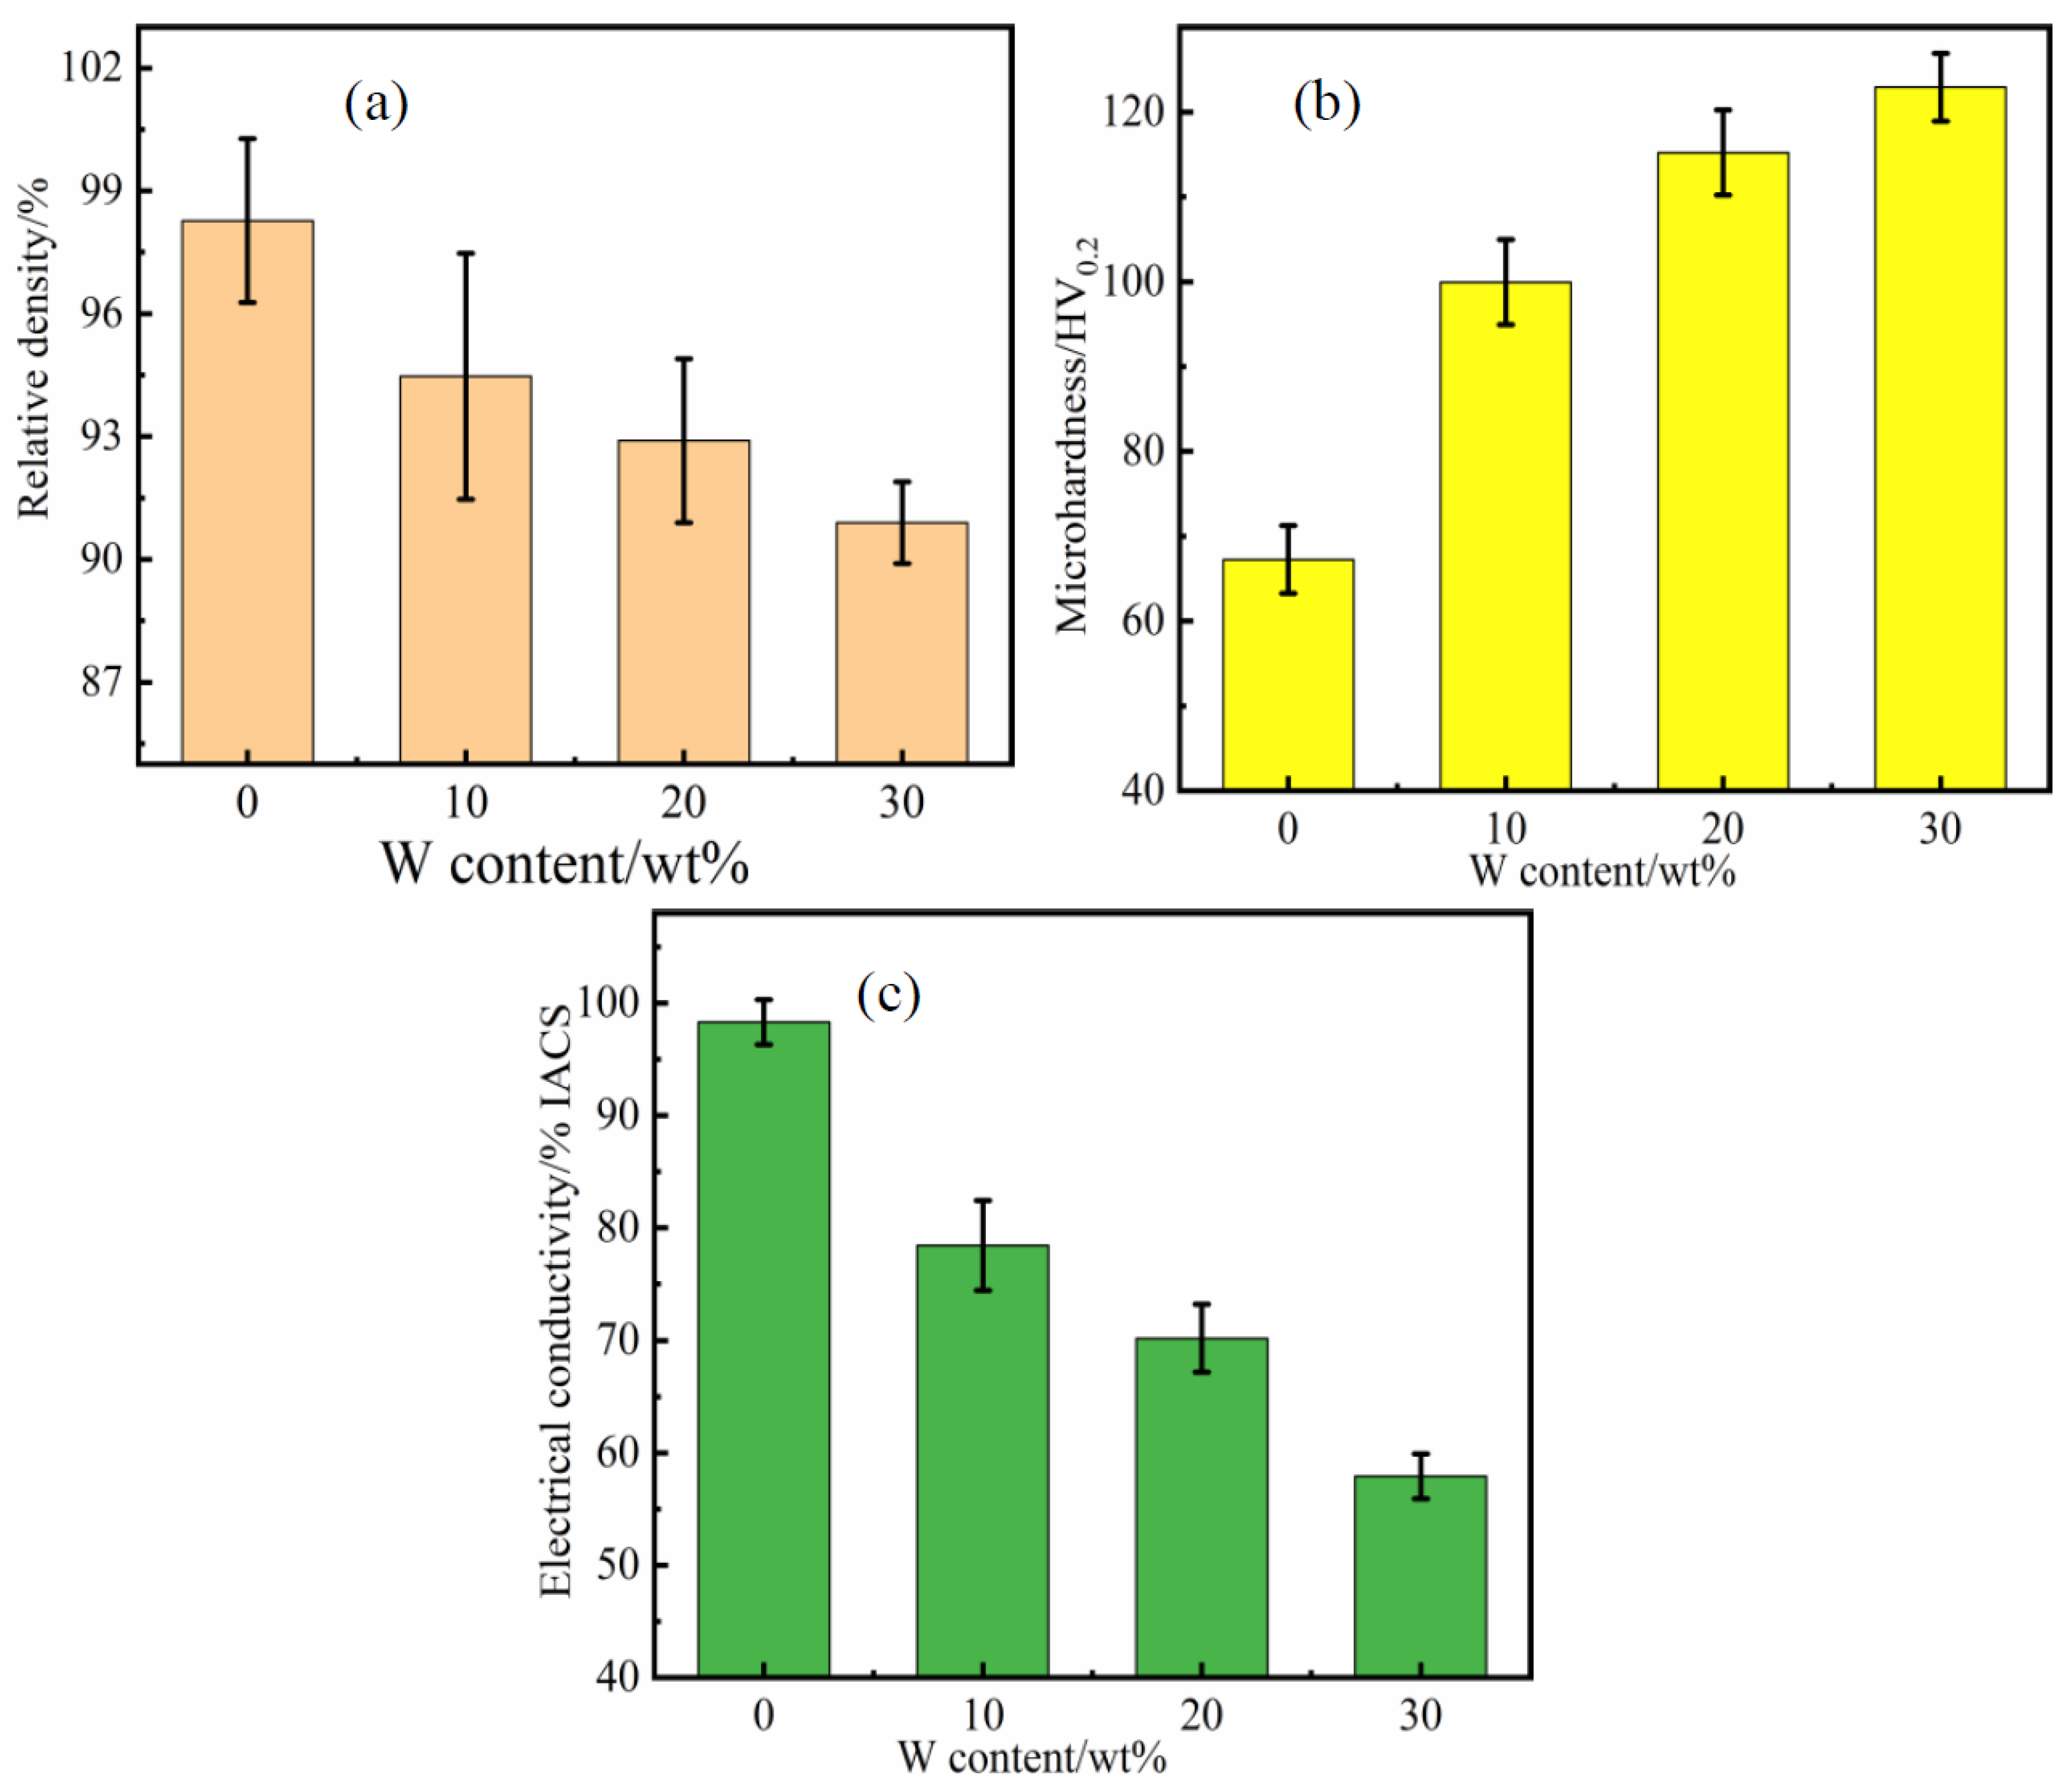
Figure 6 presents the influence of different W contents on the properties of the Cu-W composites. With the increase in W content, the relative density of the samples showed a decreasing trend (see Figure 6a). The relative density of the pure copper reached 98.27%, while the lowest value of relative density was 90.91% for the Cu-30 wt% W composite. The hardness of the pure Cu sample was 67.23 HV, and the addition of W significantly improved the hardness of the composites. With the increase in W content, the hardness of the composites showed a rising trend (see Figure 6b). Compared with the pure Cu, the hardness of the Cu-10 wt% W, Cu-20 wt% W and Cu-30 wt% W composites increased by 48.58%, 71.28% and 82.74%, respectively. The conductivity of the pure Cu was as high as 98.3% IACS. The conductivity of the Cu-W composites reduced when the W content increased (see Figure 6c).
Figure 7 shows the room temperature compression stress–strain curves with increasing W content. The yield strength of the pure Cu sample was relatively low, about 91 MPa, and the W particles had an obvious strengthening effect. At the initial stage of compression deformation, the strength of the Cu-W composites increased rapidly to the yield point, and then, the compressive strength of the composites increased with increasing deformation. The yield strengths of the Cu-10 wt% W, Cu-20 wt% W and Cu-30 wt% W composites were 247 MPa, 346 MPa and 399 MPa, which increased by 172.17%, 280.15% and 338.21%, respectively, compared with the pure Cu.
Electrical contact experiments were carried out on the Cu-W composites with different W contents under the load conditions of 20 V and 20 A. Figure 8 presents the change in arc ignition at time of contact. The arc of the pure Cu sample was relatively stable, and an arc was generated during contact closure at 1 ms (see Figure 8a). When the content of W increased to 10 wt% and the number of electrical contact tests was greater than 2000, the discharge phenomenon weakened during the closure process of the Cu-10 wt% W contact (see Figure 8b). As the content of W continued to increase, the arc burning times of the Cu-W composite contacts began to fluctuate, as can be seen in Figure 8c,d.
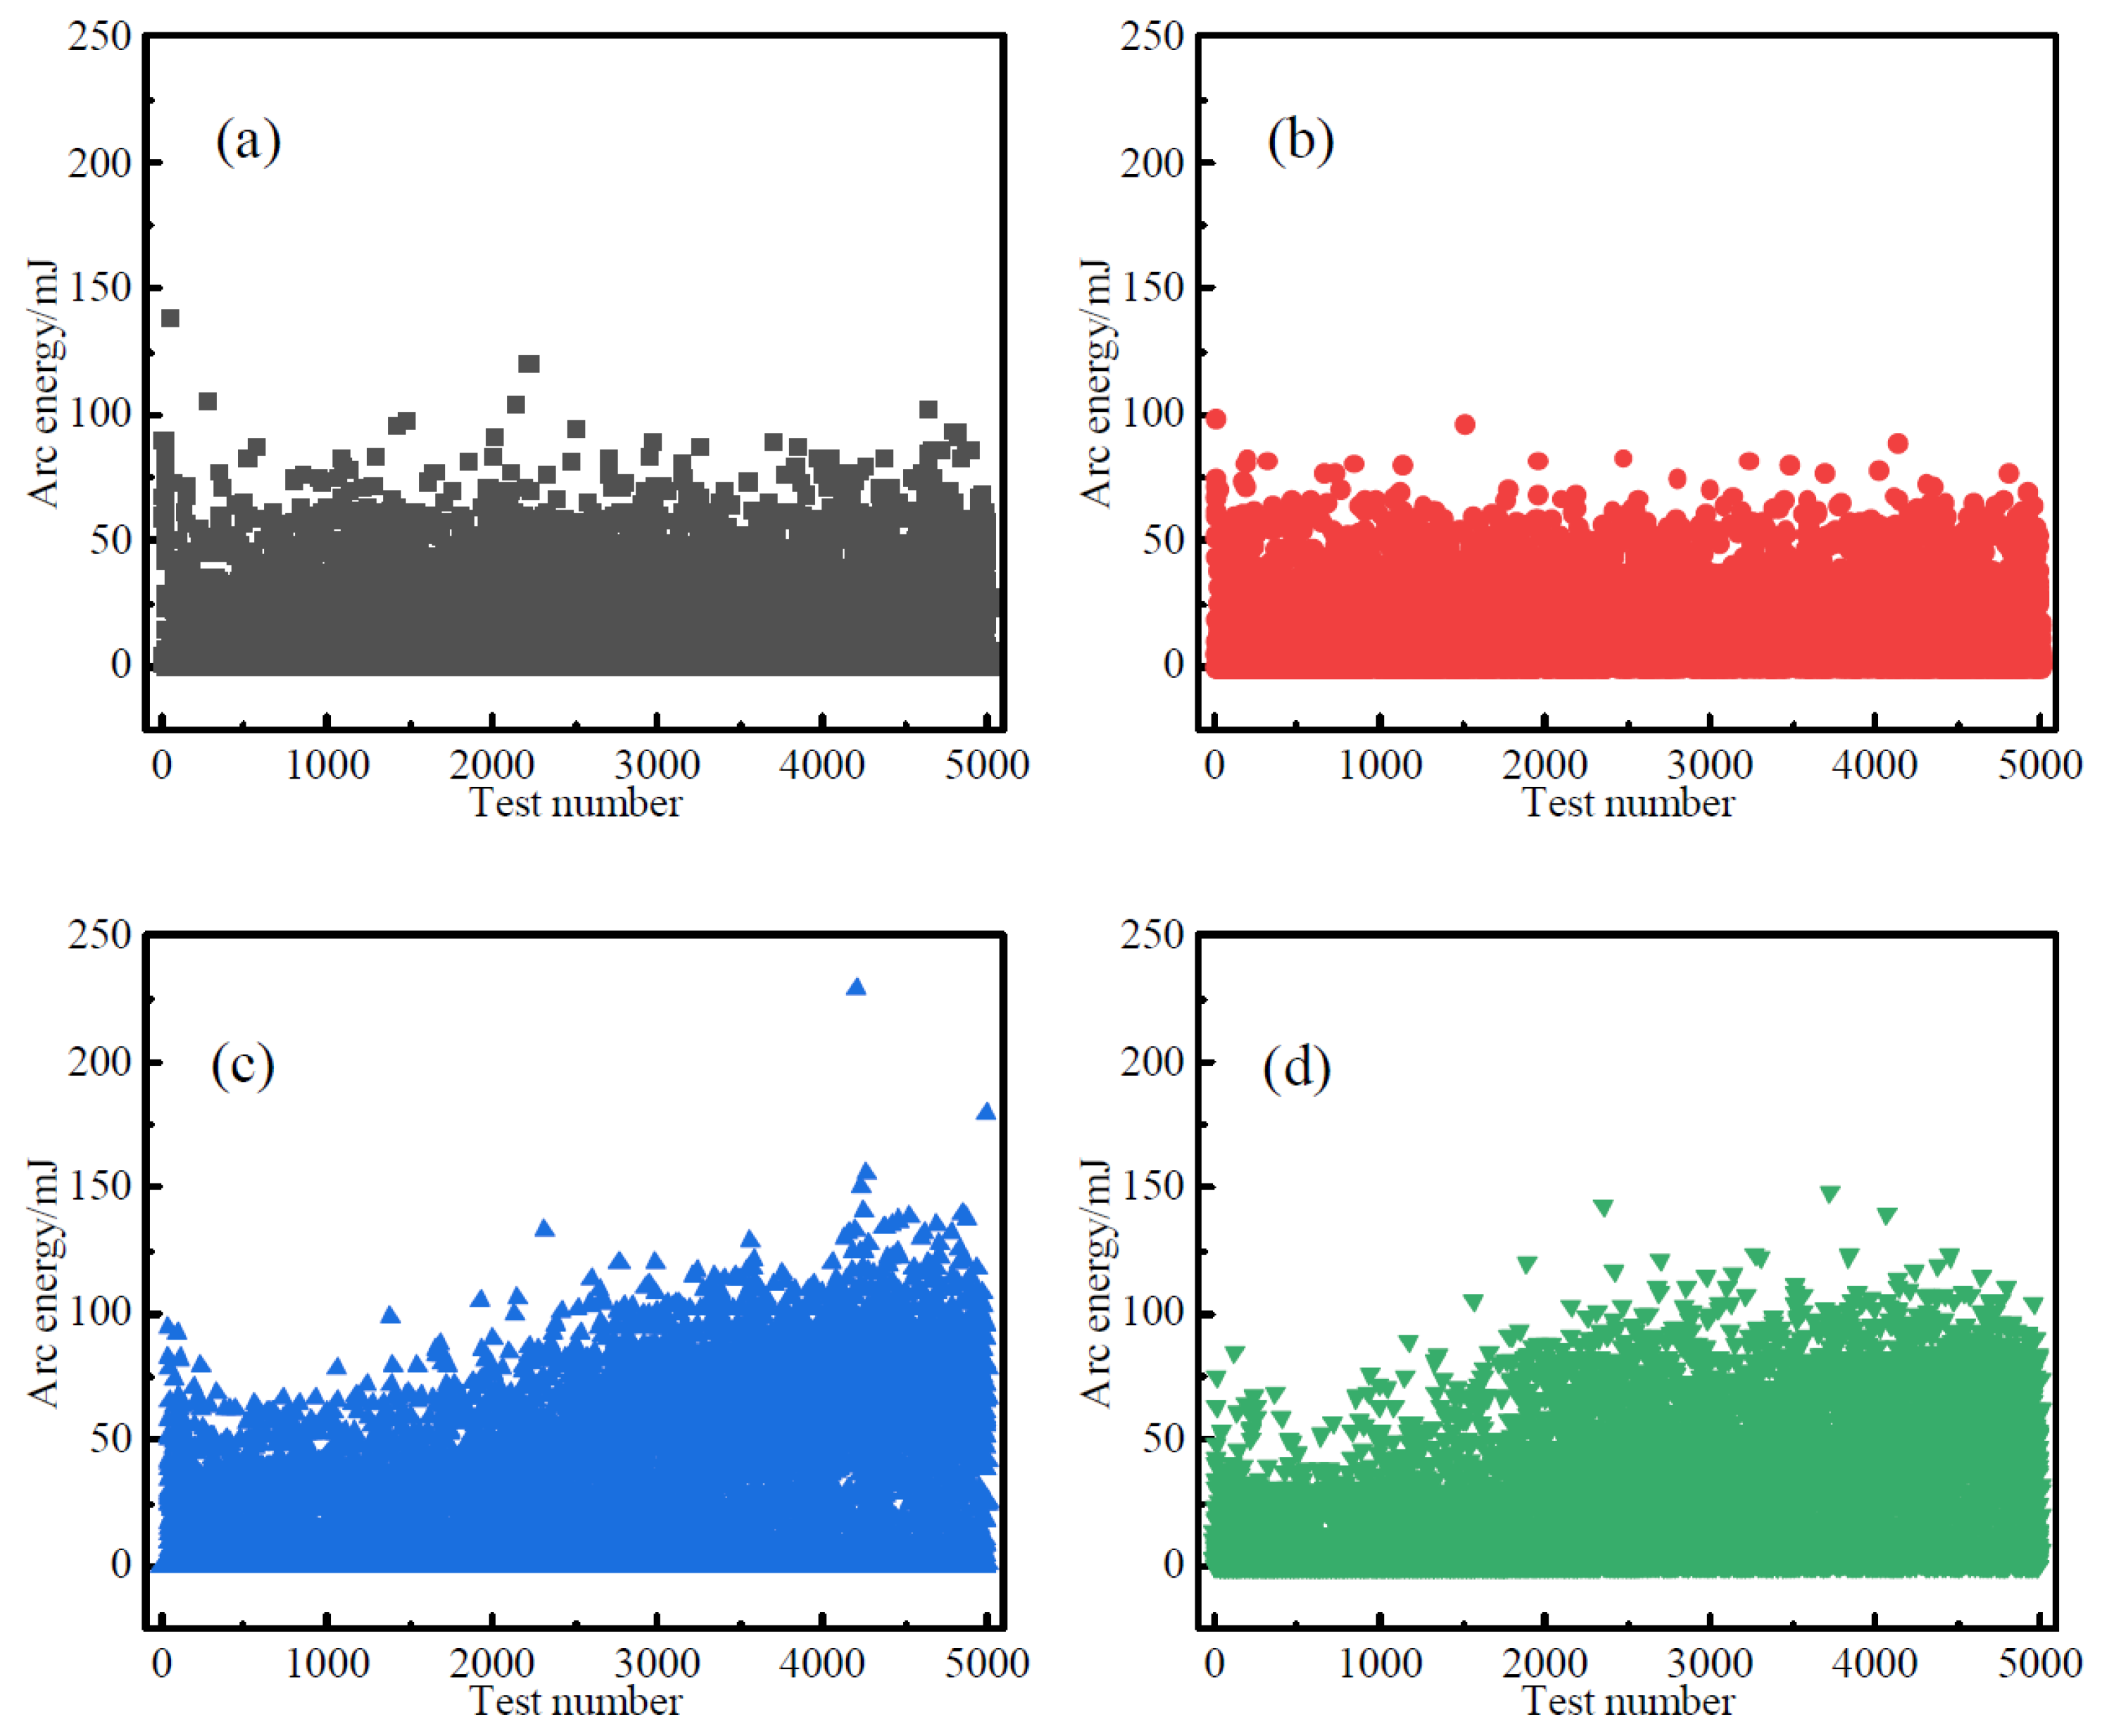
Figure 9 presents the arc energy trends of the Cu-W composite contacts with different W contents with the number of electrical contact tests. It can be seen from Figure 9 that the trend of arc energy was consistent with the arc time. Arc energy was positively correlated with arc time, as illustrated by Equation (1), the voltage between contacts and the current between contacts, and the arc energy increases with the increase in arc time, voltage and current.
W a r = 0 t a r U a r | i a r | d t = f ( U a r , i a r , t a r )
where, W a r represents arc burning energy, J; U a r represents the voltage between contacts, V; i a r represents the current between contacts, A; and t a r represents the arc burning time, in ms.
In the process of arc erosion, W particles in the Cu-W composite adsorb Cu vapor through capillary force, thus reducing the concentration of metal vapor between contacts. However, as the W content increased, the electrical conductivity of the Cu-W composites decreased, and the electrical resistance increased. The heat generated in the electrical contact processes promoted the melting and evaporation of the copper phases. Therefore, the changes in arc energy and arc time of the Cu-W composite contacts were the result of the combined actions of the W content and the electrical conductivity.
Figure 10 shows the changing trend of welding force of the Cu-W composite contacts with different W contents with the number of electrical contact tests. It can be seen from Figure 10 that, in the 5000th electrical contact experiments, the fusion force generated by the Cu-W contacts during the disconnection process was close to 30 cN.
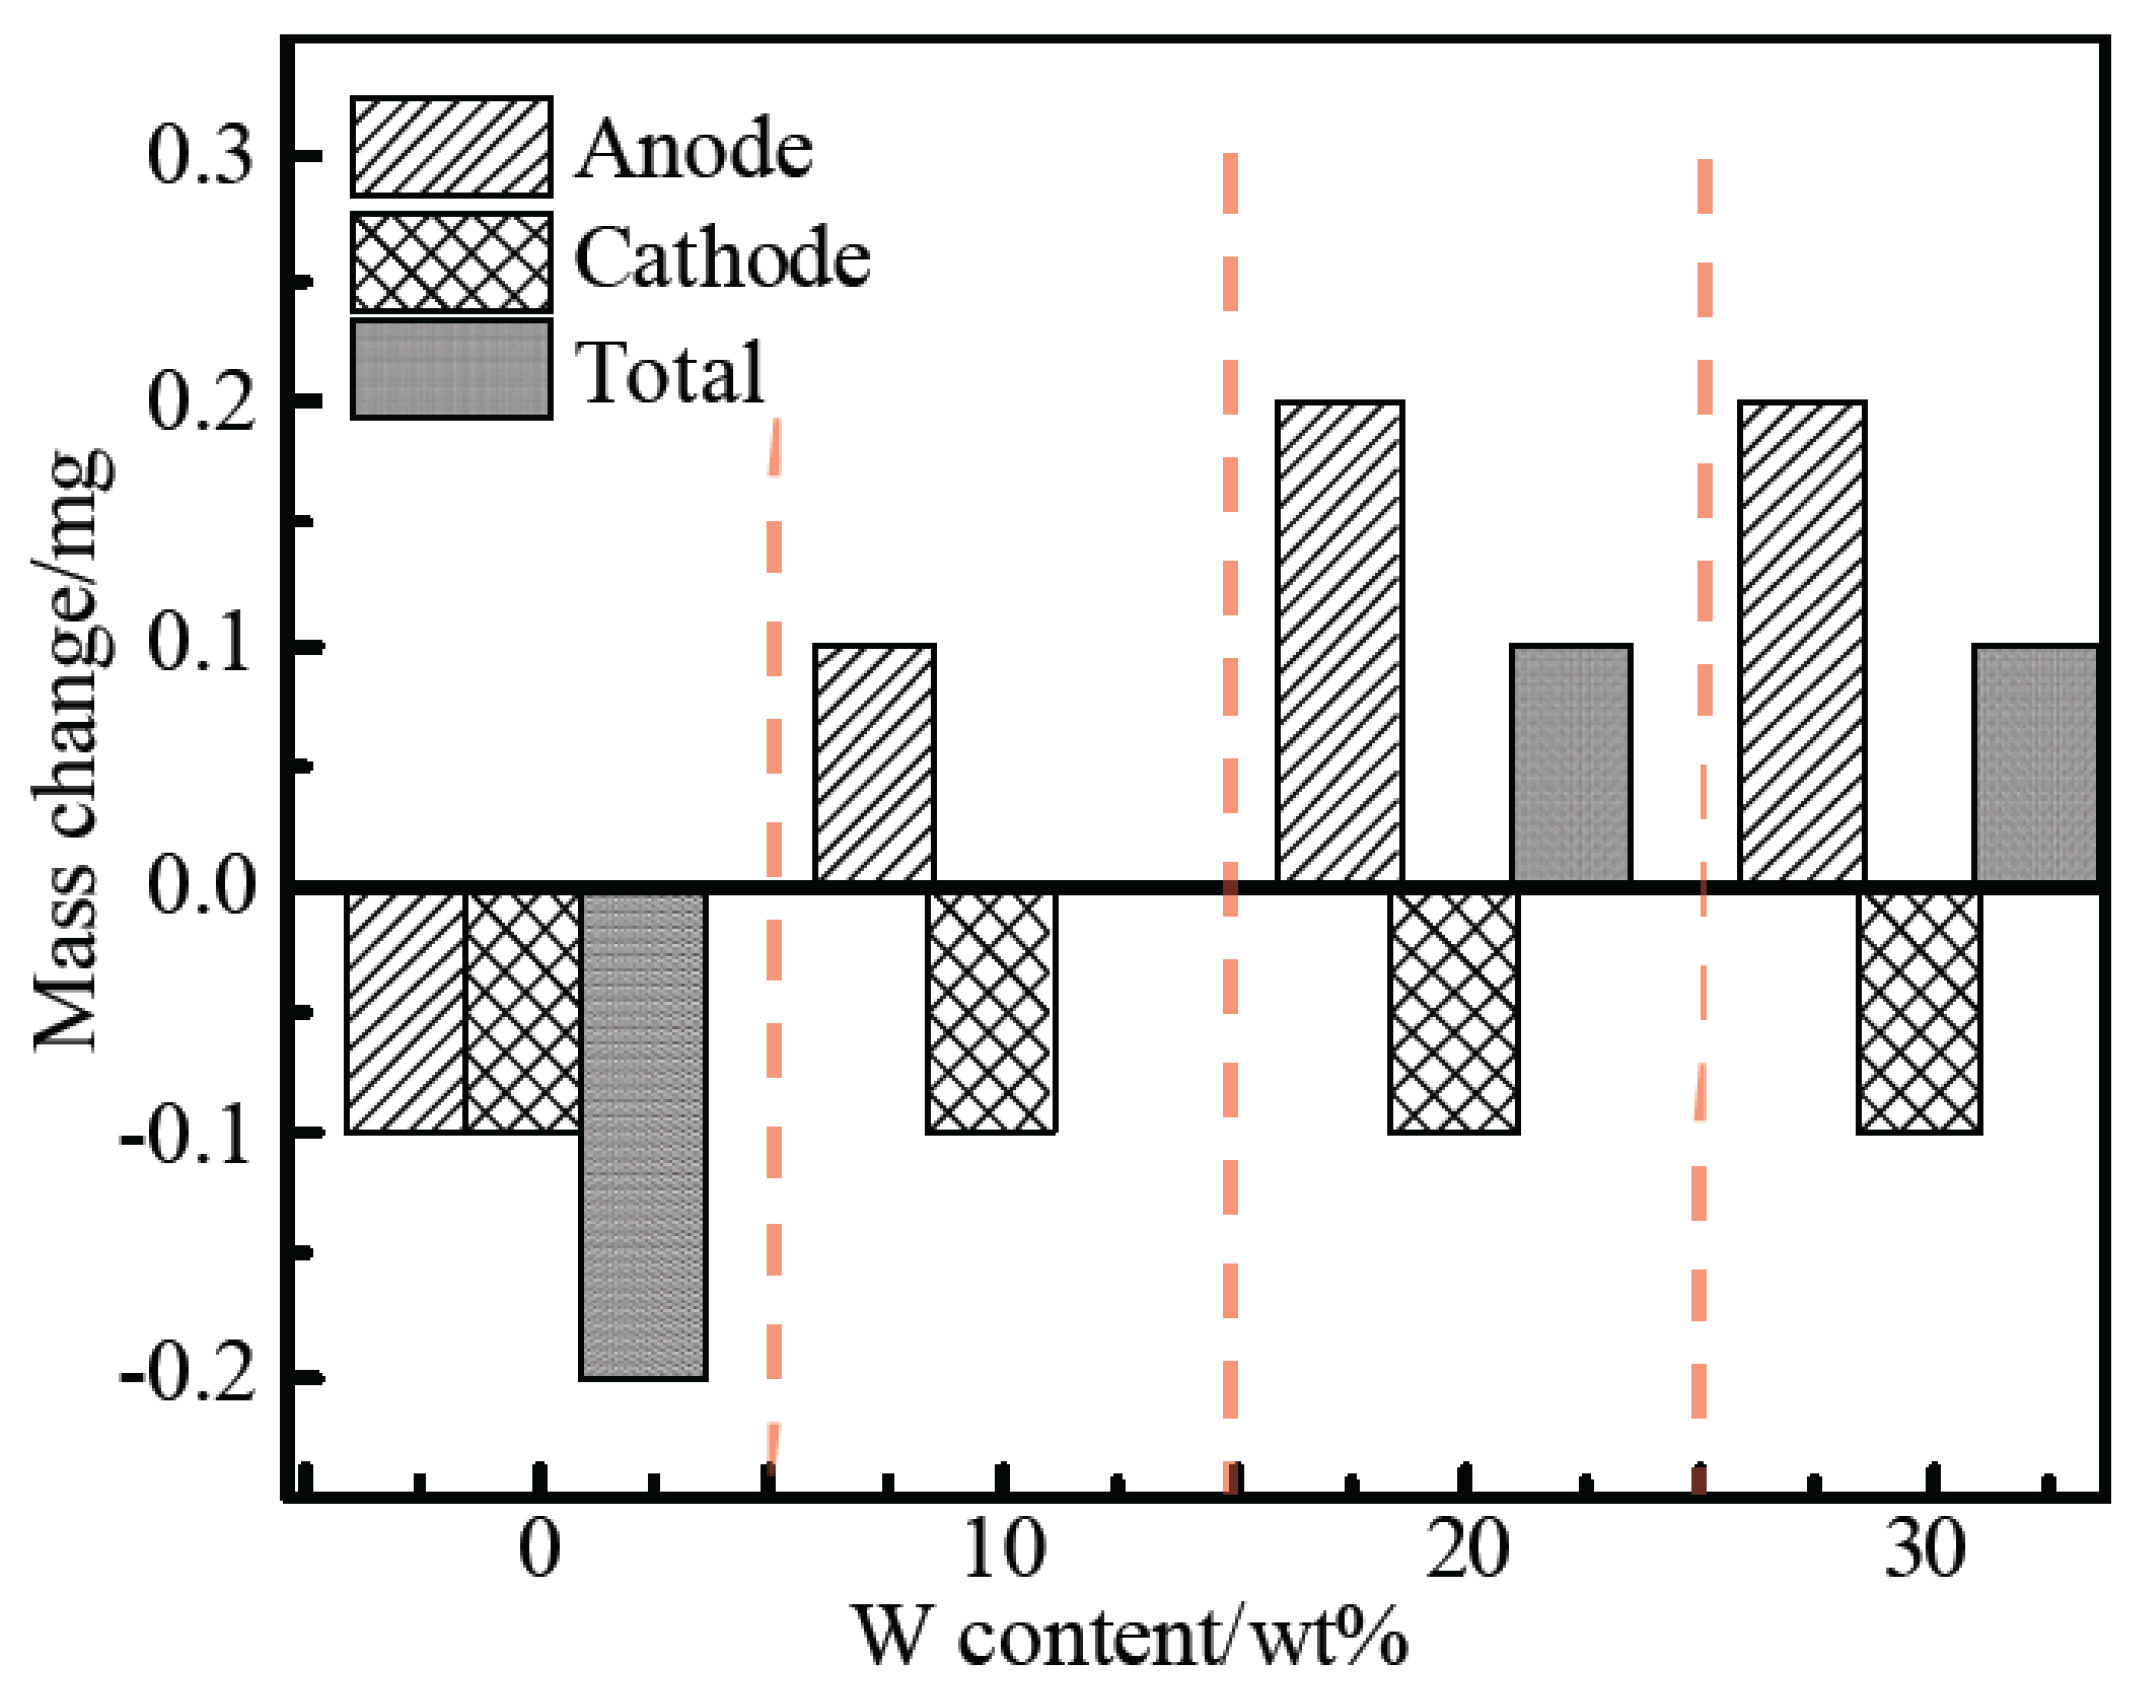
During 5000 opened and closed tests, the contact surfaces were subjected to the combined actions of mechanical force, friction, arc heat and current heat, so the contact materials were prone to mass change, which is one of the most common failures of contact materials. Figure 11 shows the change in the contact mass of the Cu-W composites, where positive values indicated an increase in contact mass, and negative values indicated a decrease in contact mass. Figure 11 shows a loss of both cathode and anode contacts for the pure Cu. However, the mass transfers of the Cu-W composite contacts occurred as follows: the anode weight increased, while the cathode weight decreased. As the W content was increased in the Cu-W composites, the mass of the anode contacts increased, and the mass of the cathode contacts reduced by about 0.1 mg.
There are three reasons for the quality changes in the contacts: (1) the mass transfer of molten bridges between contacts; (2) the evaporation and deposition of metal vapors; and (3) molten metal spatter. In the process of contact closure, the arc generated between contacts released a lot of heat, and the copper phases at the arc root changed into liquid or gaseous phases. Some of the gaseous metals ionized and promoted discharge between the contacts, and the remaining gaseous metals condensed on the surface of the contacts during the process of contact separation and cooling. In the process of contact closure, liquid metal splashed under the action of the impact force; most of the liquid droplets spattered on the surface of the cathode contact. A small amount of metal droplets splashed on the surface of the anode contact or the atmosphere.
The liquid flow of the pure Cu contact was strong, and the droplet splashing phenomenon was significant, so the qualities of the pure copper cathode and anode contacts are missing. The addition of the W particles with high melting points adsorbed the metal vapor and reduced the fluidity of the liquid phase, so the liquid phase splash phenomenon of the W contacts was weakened. The molten liquid phase on the surface of the cathode contacts changed to adhere to the surface of the anode contacts, resulting in mass transfer between the contacts. Generally speaking, the poor wettability between tungsten and copper leads to poor W-Cu alloy compactness. In our previous work [32], we found that the relative densities of the W-Cu composites in other literature only reached about 85%. Fine pores existed between the tungsten phases and the copper phases. As the W content increased, the internal defects of the Cu-W composites increased, and the density decreased. The arc burning energy of the Cu-W composite materials increased with increasing W content, and the heat generated increased. The metal in the arc erosion area of the contact surfaces had a large number of defects after repeated melting and cooling processes. Due to the above reasons, the metal bonding in the arc erosion area was not tight, and the cathode contact material adhered to the anode contact surface layer by layer, which became denser in the subsequent contact impact processes.
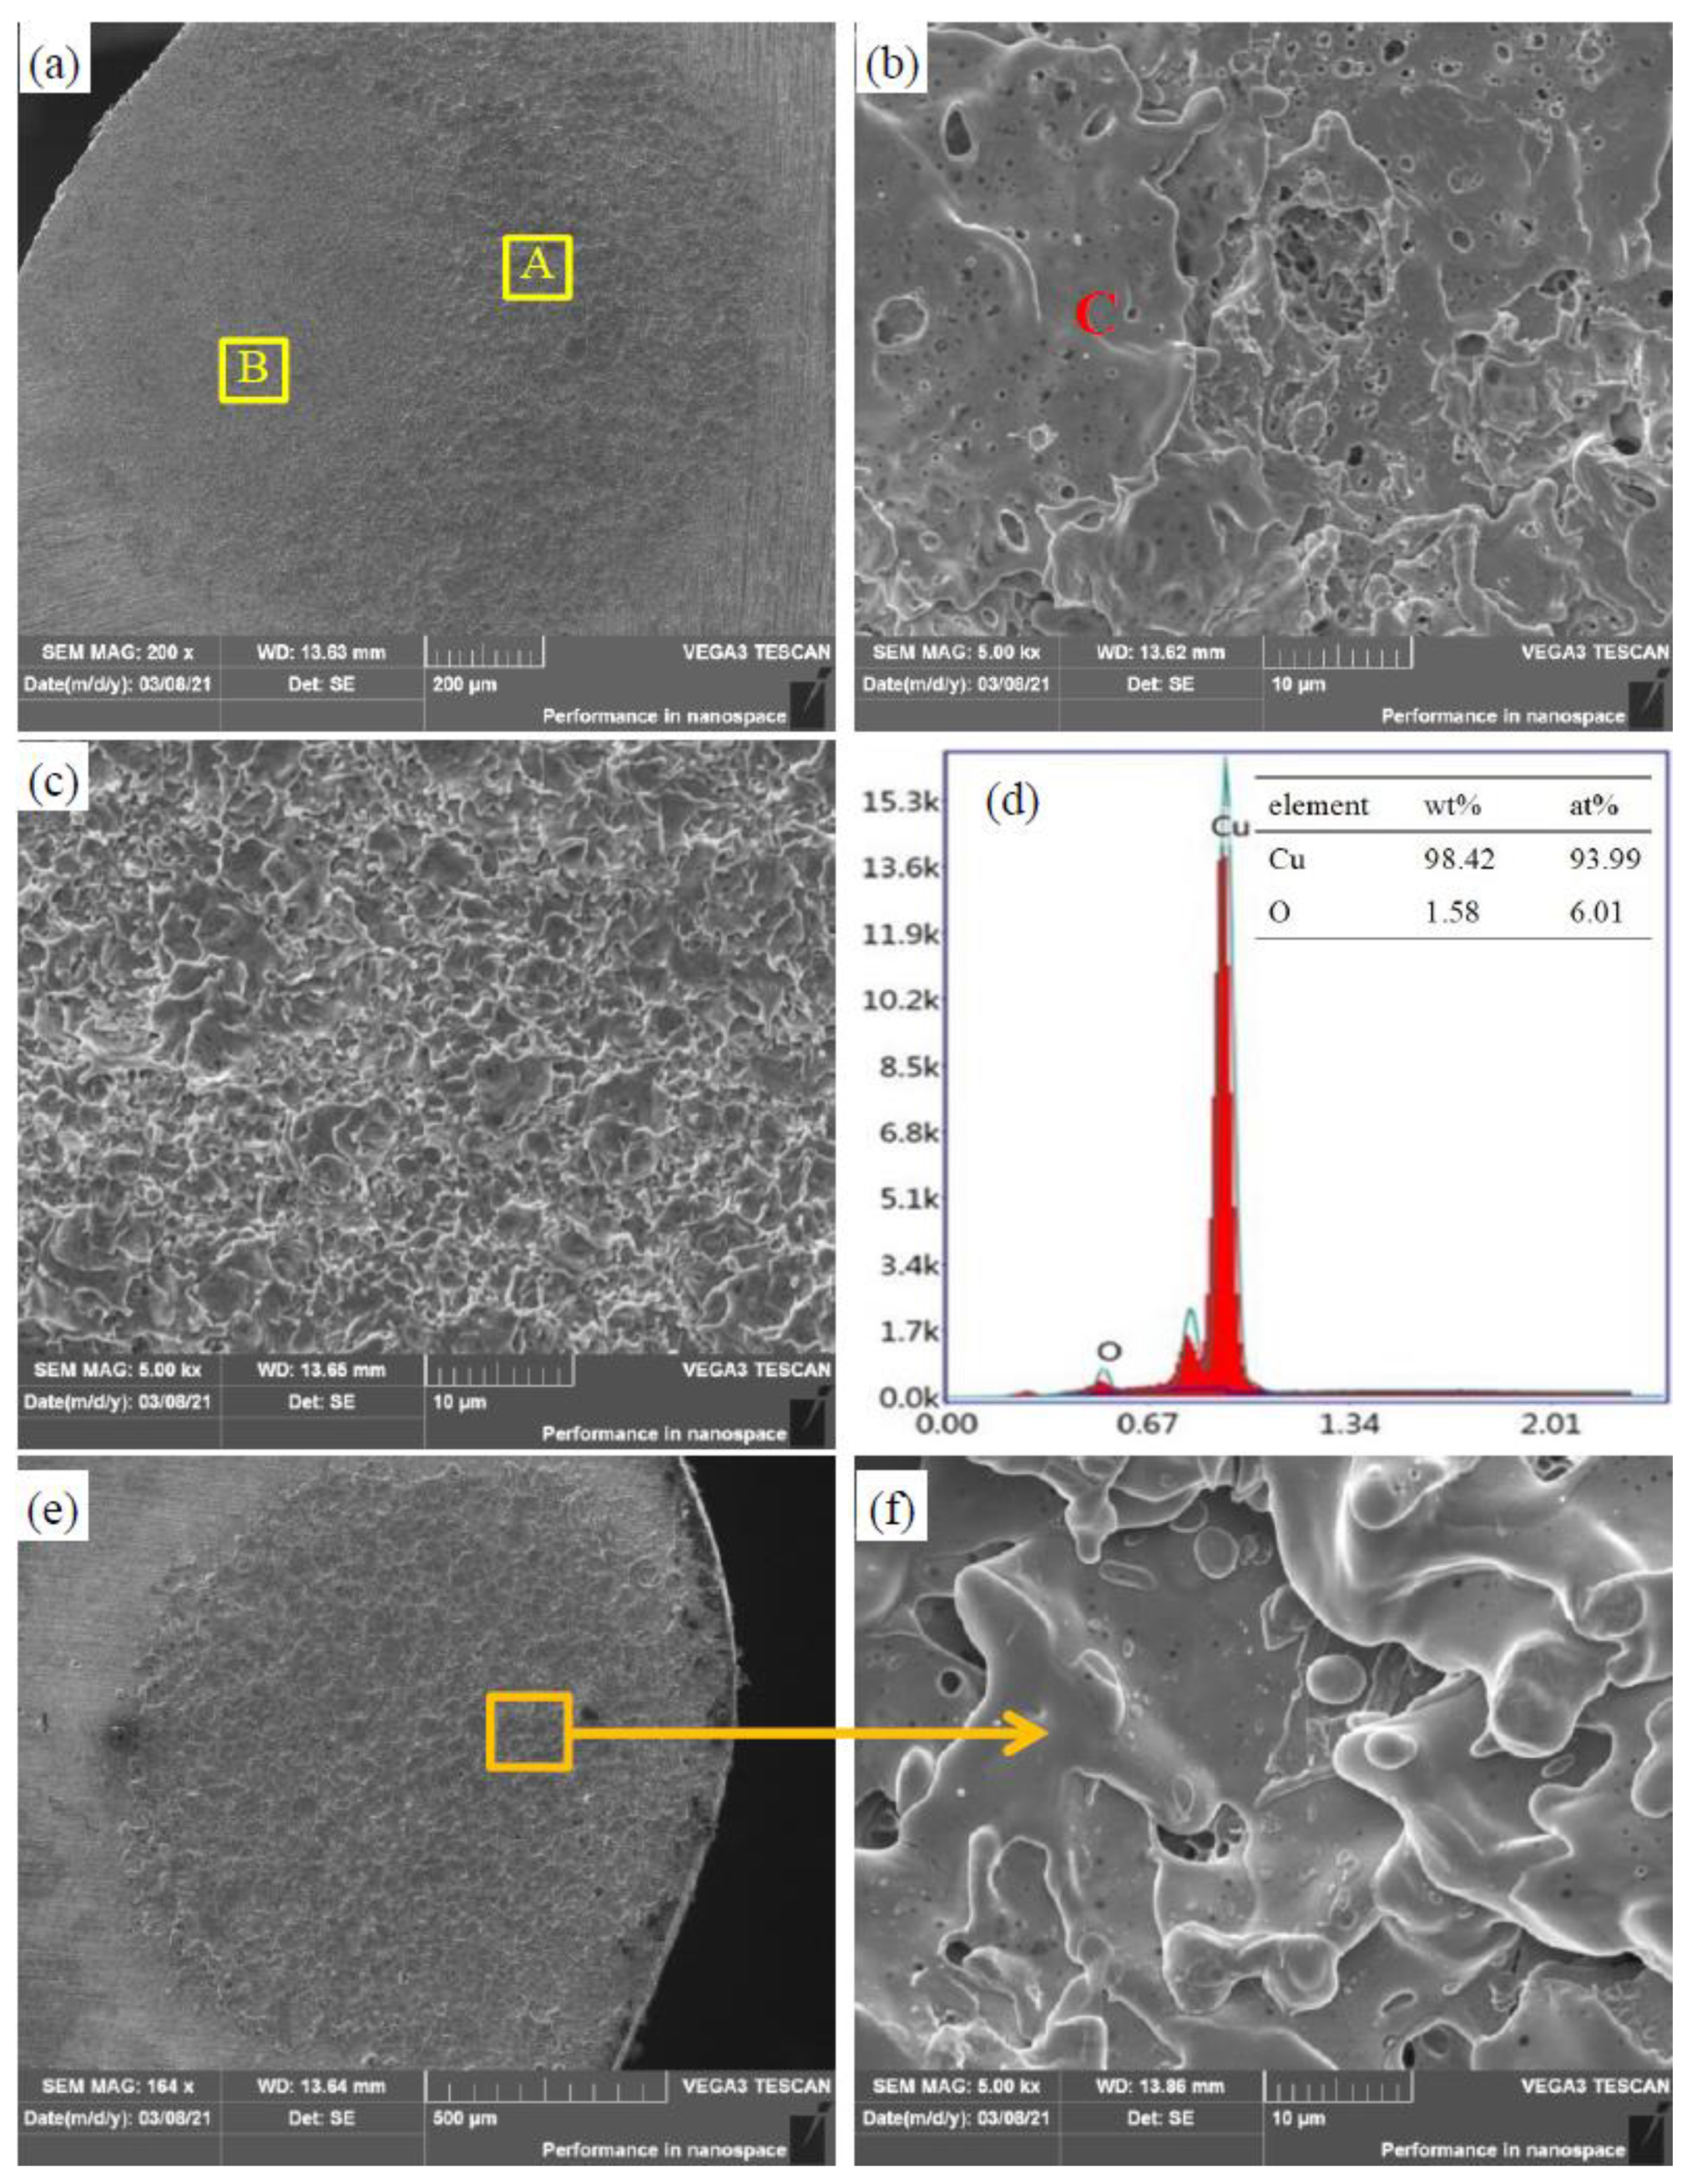
Figure 12 shows the surface morphology of the pure Cu contacts after the electric contact test. The arc erosion area of the pure Cu anode contact was round, and the burning pits were not evenly distributed. The burning pits in the right area were large, and the burning pits in the left area were shallow and dense, as is shown in Figure 12a. Figure 12b is an enlarged view of area A in Figure 12a. It can be seen that severe ablations occurred in this area. The melting of the contact surface spread out to the outer layer, and there were holes left by gas overflow in the outer layer of the spreading layer.
In the process of arc discharge of the anode and cathode contacts, the metal at the arc root repeatedly melted, splashed and solidified with the combustion and extinction of the arc, and finally covered the surfaces of the contacts with layers of the molten phase. Figure 12c is a magnified view of region B in Figure 12a. The burn pits in this region were evenly distributed, and the size of burn pits was about 2μm. Figure 12d is the energy spectrum of area C in Figure 12b. The analysis showed that the spreading layer on the contact surfaces was copper. During electrical contact, argon gas was gently swept between the cathode and anode contacts, so that the contacts would remain almost empty, and only a small part of the copper would be oxidized. The ablation phenomenon of the pure copper cathode contact was more significant than that of the anode contact. As can be seen from Figure 12e,f, the copper sputtering zone appeared on the periphery of the ablation zone of the cathode contact, and the burning pits on the surface of the contact were evenly distributed, while the molten copper phase spread outwardly in layers.
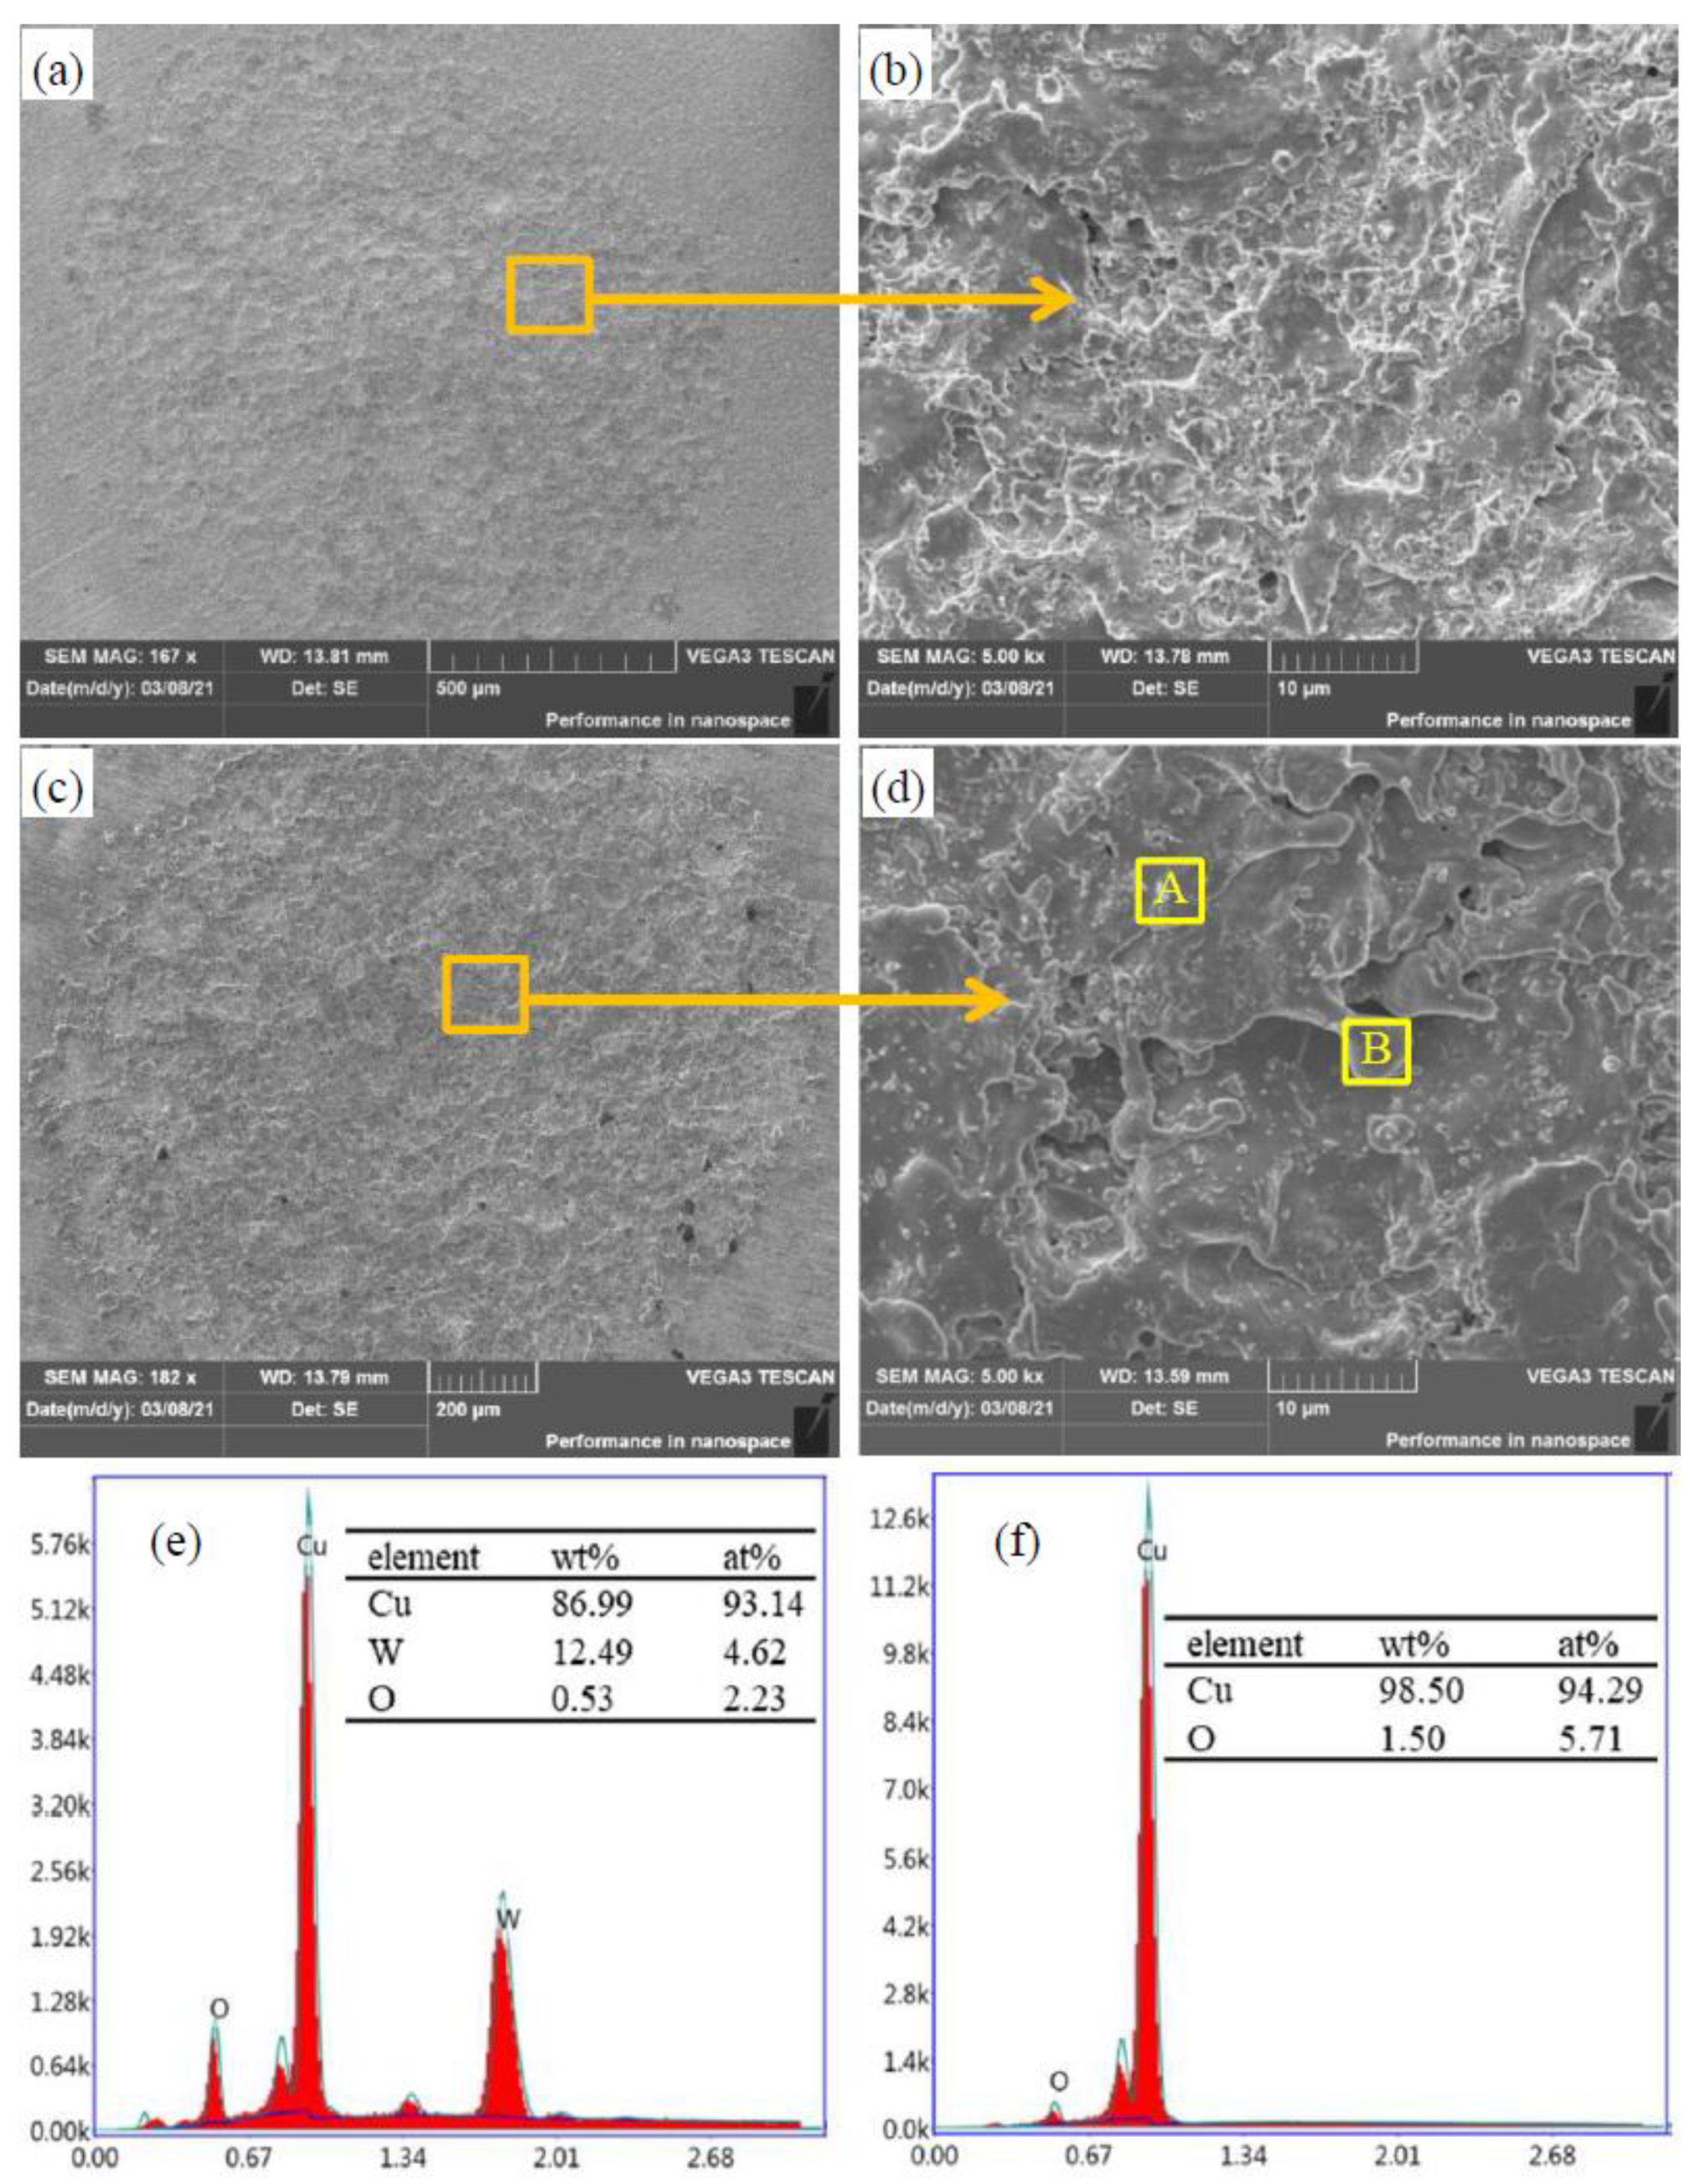
The surface morphologies of the Cu-10 wt% W composite contacts after the electrical contact test are shown in Figure 13. The burn pits of anode contacts were evenly distributed, but the arc ablation zone was slightly raised in the middle (see Figure 13a). Compared with the pure copper contacts, the spreading layer of the liquid copper phase on the surface of theCu-10 wt% W anode contact became thinner and smaller, and there were fine granular bulges on the spreading layer. The number of pores on the spreading layer was greatly reduced, as shown in Figure 13b. The molten phase on the surface of the cathode contact of the Cu-10 wt% W composite expanded to the outer layer in droplet form, as shown in Figure 13c,d.
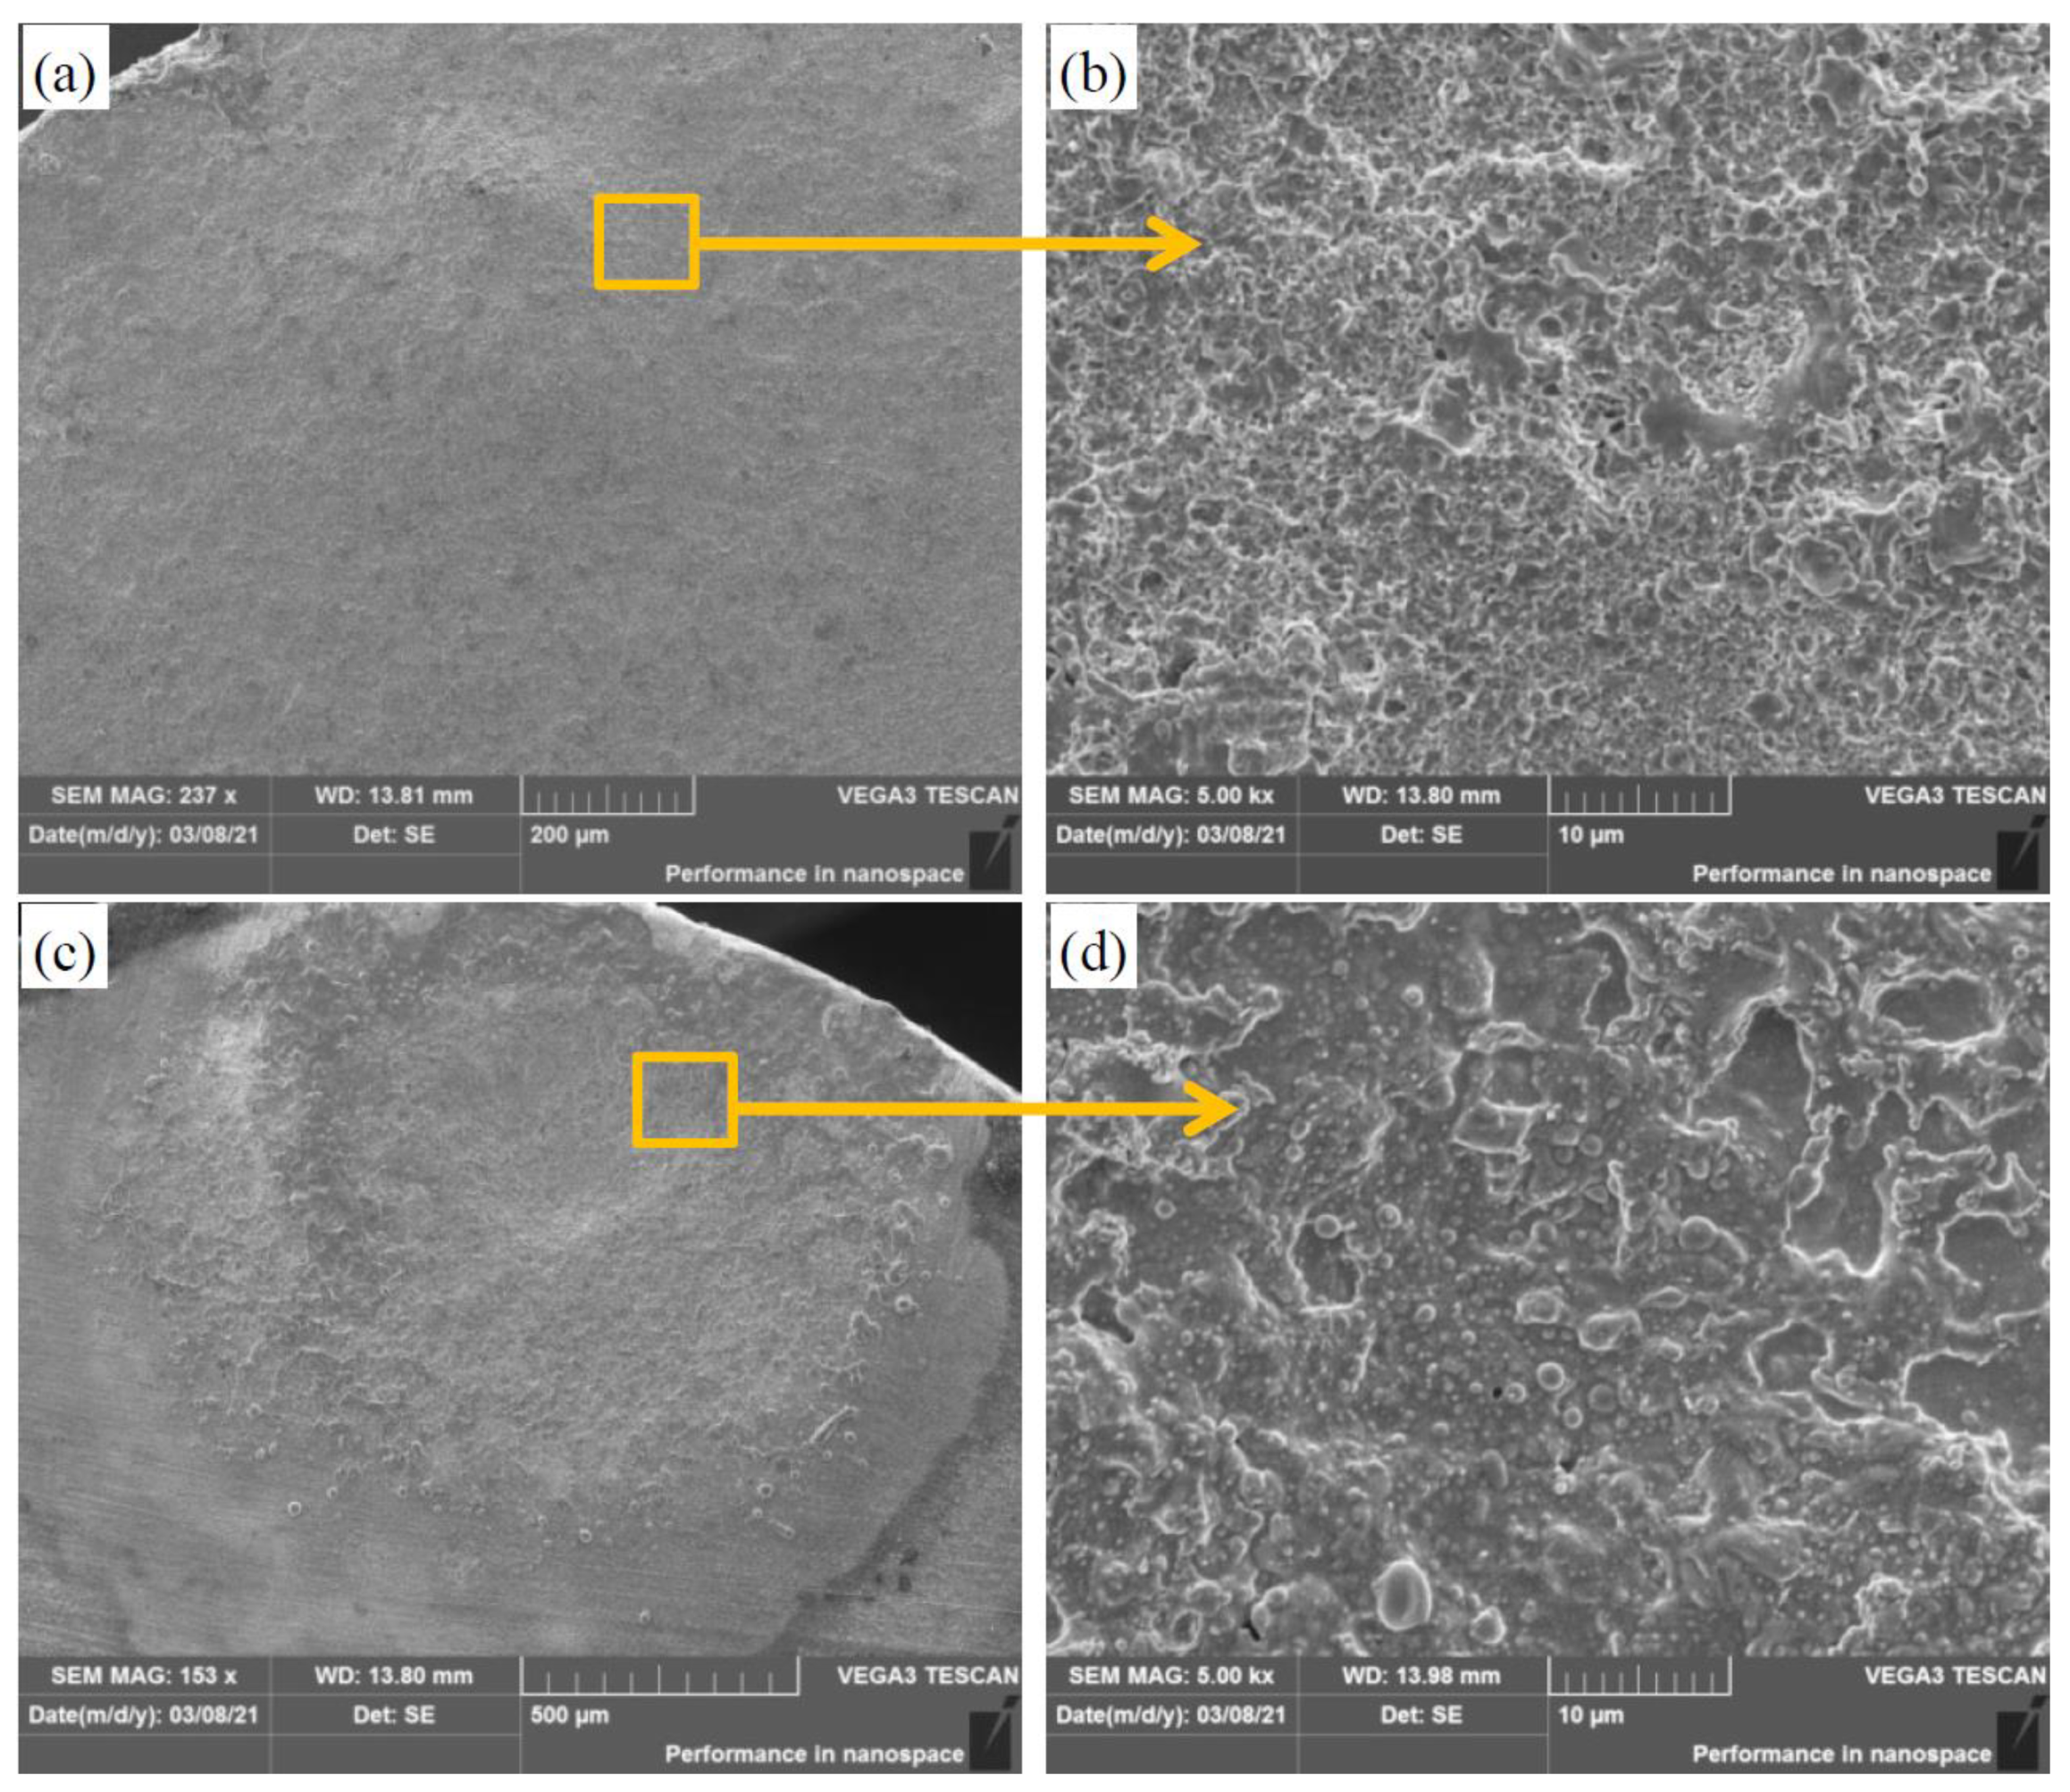
EDS analyses of the granular matter in area A and the droplets in area B in Figure 13d showed that the particle composition in area A was W, and the droplet composition in area B was copper. Slight oxidation occurred to the metal on the contact surface, as can be seen in Figure 13e,f. When the W content in the contact material increased to 20 wt%, the burning pits on the surface of both the anode and cathode contacts became smaller and more uniform. The flow of liquid copper on the contact surfaces weakened and the number of pores was less, but the mass transfer between contacts became more significant, as is shown in Figure 14.
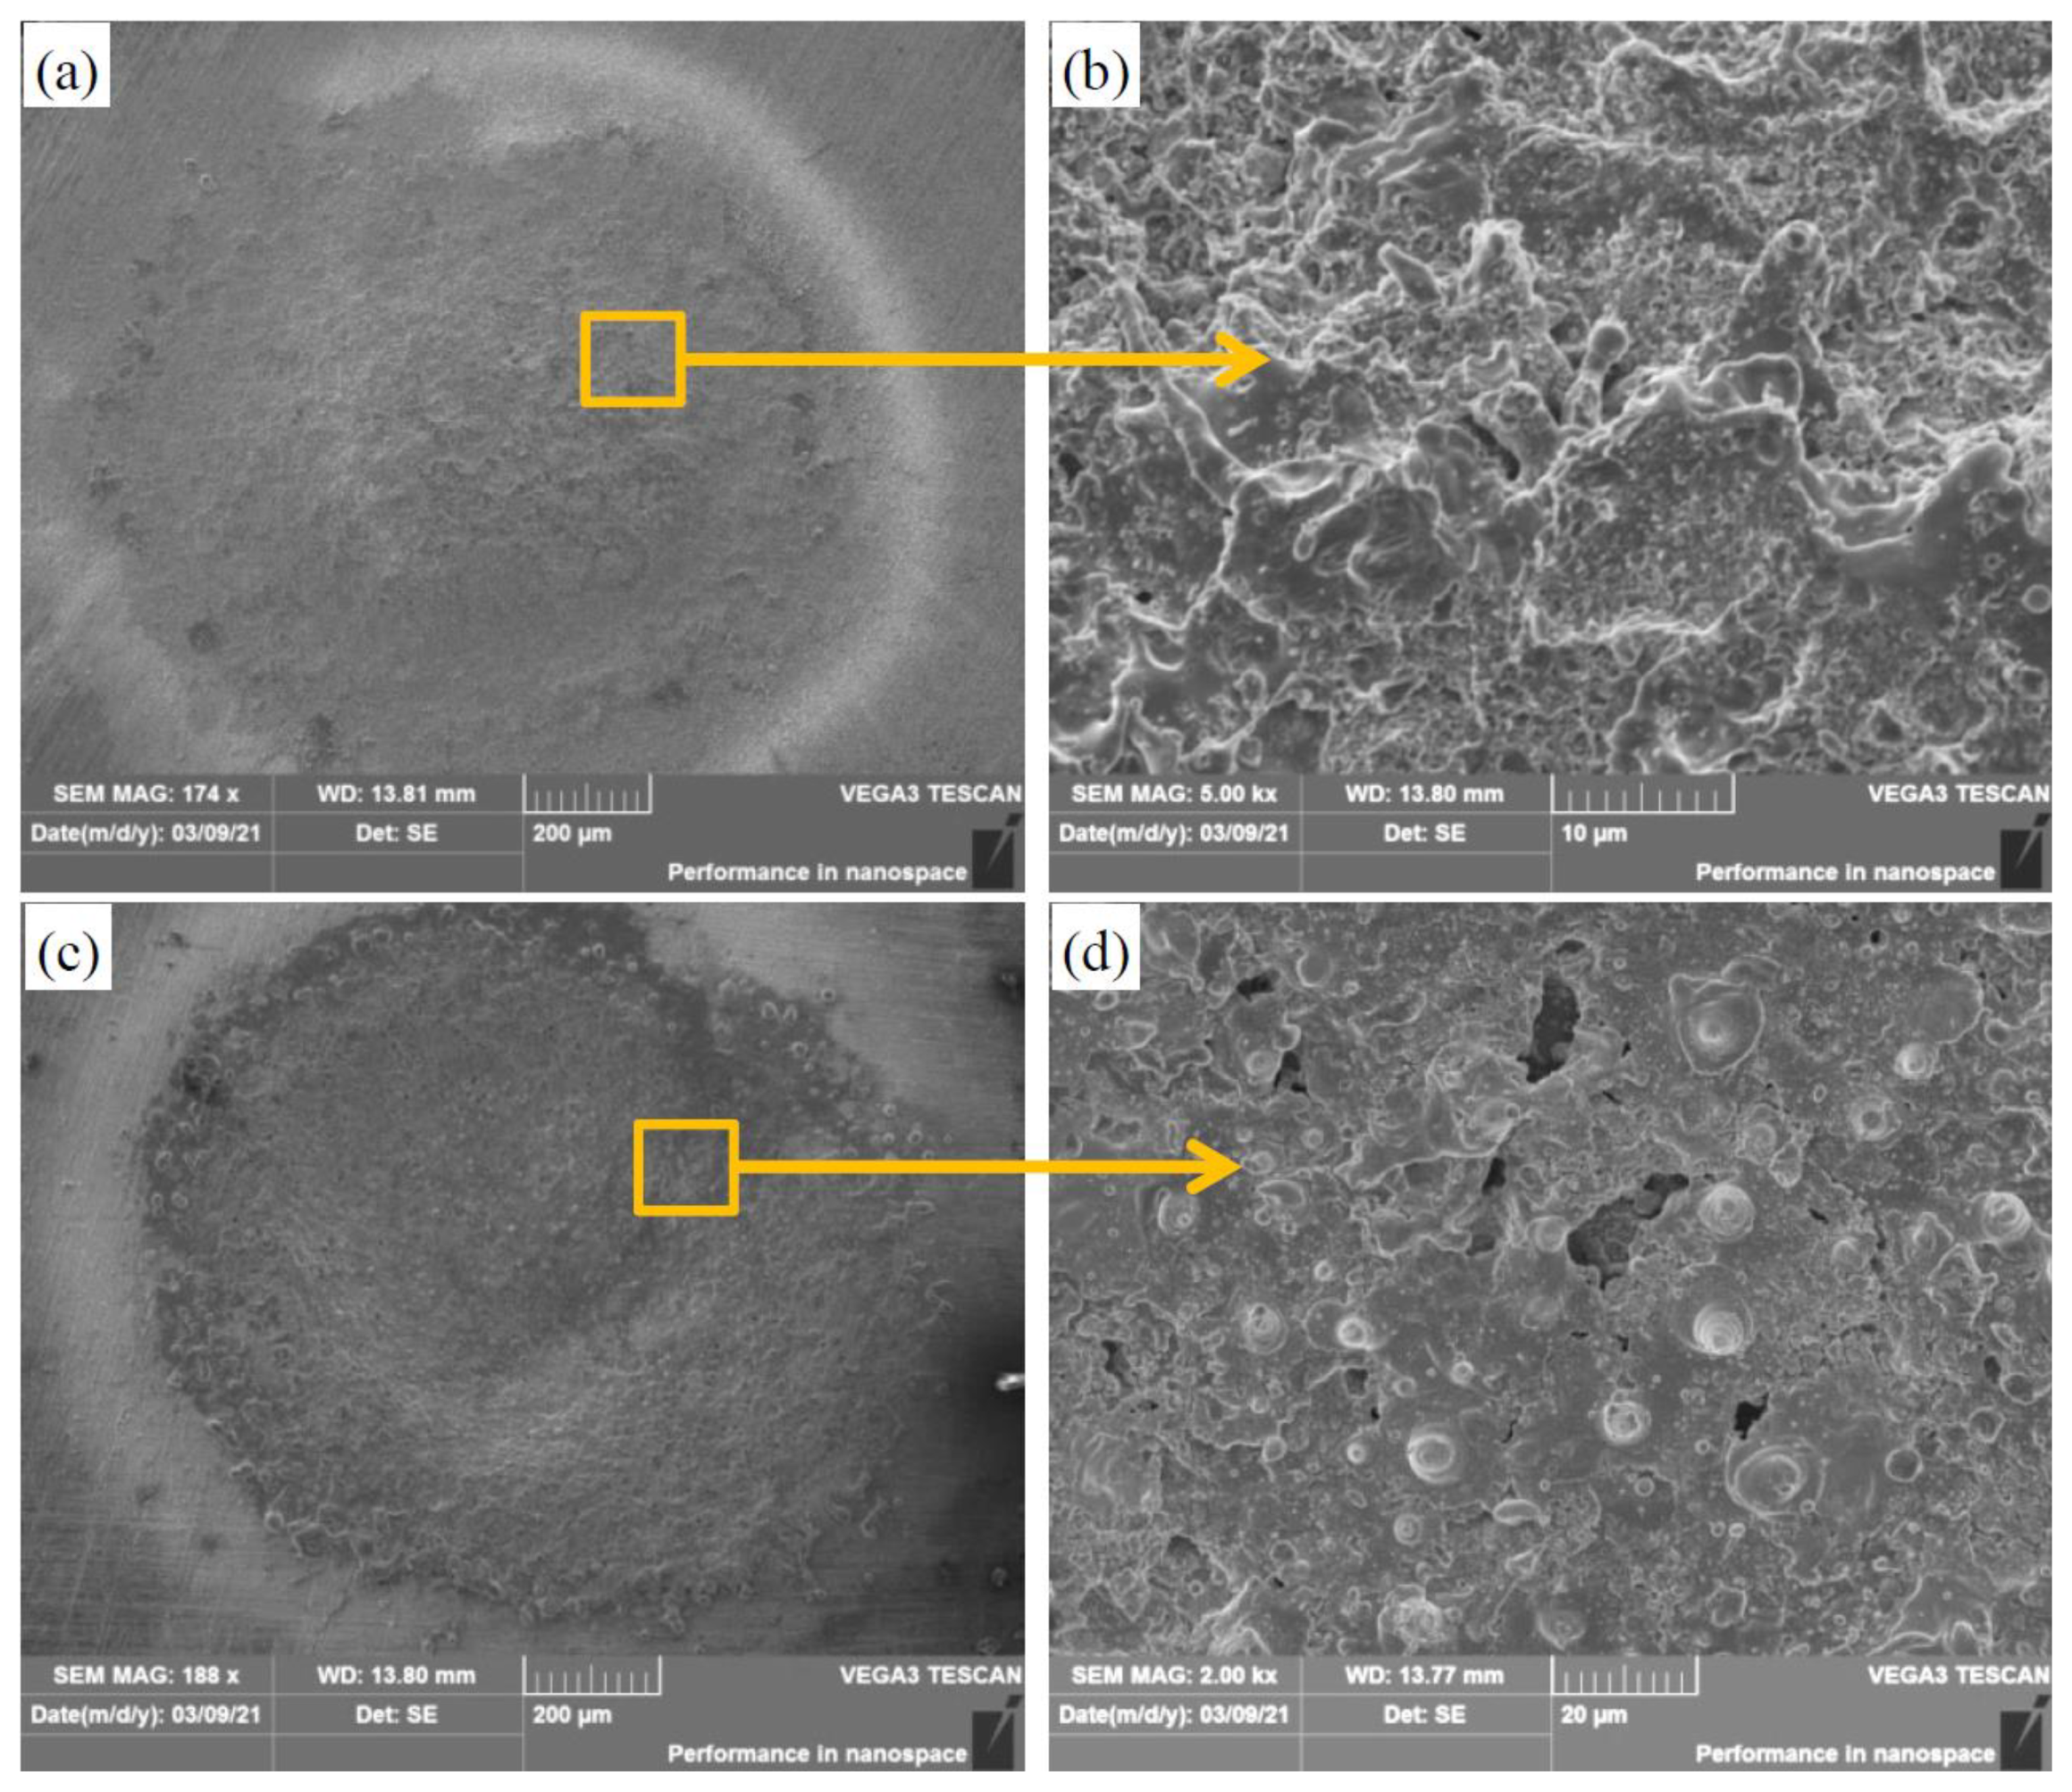
When the W content was increased to 30 wt%, the anode contact was convex and the cathode contact was concave, and some spiral particles left after the fusion bridge fracture were distributed on the surface of the cathode contact. The action of the adhesion force of the anode contact created tearing holes and cracks on the surface of the cathode contact, as is shown in Figure 15.
The main effects of the high-melting-point W particles on the electrical erosion of the copper contacts were as follows: (1) the phenomenon of local ablation of the copper contacts improved; (2) the fluidity of the molten phase reduced, while the adhesion of the metal between contacts was improved; and (3) mass was transferred between the cathode and anode contacts. In the process of contact closure, an arc was generated in the high electric field area between contacts, and the arc ran irregularly between contacts. The pure copper contacts had coarse grains, and the arc was regionally selective. The addition of the W particles effectively refined the grains and dispersed the arc, which weakened the local ablation of contacts. The W particles distributed in the outer layer of the molten copper phase effectively reduced the surface tension of the molten phase, reduced the fluidity of the molten phase, and improved the viscosity of the molten phase, which reduced the splashing of molten droplets.
The arc erosion of the contact materials areas between the metal binding force was weak for the contact materials with internal defects and with defects occurring in the process of the rapid solidification molten phase. During the cyclical impacts of the cathode and anode contacts, molten bridges formed, and the contact surface metal layers became loose due to spalling. The cathode contact ablation was more significant, causing more internal defects. As a result, the morphology of layer adhesion of the cathode material to the surface of the anode contact was formed, as is shown in Figure 14. As the anode contact hit the cathode contact, the cathode contact was subjected to the maximum pressure at the center of the ablation zone, and the metal liquid spattered around the ablation zone, forming a spattering zone of droplets around the ablation zone, as is shown in Figure 12e and Figure 13c.

4. Conclusions

(1)
With the increase in W content, the Cu matrices divided into finer and more uniform grains, but the W particles tended to agglomerate and distribute along tearing edges.
(2)
With the increase in W content, the density and electrical conductivity of the Cu-W composites decreased, while their compressive yield strengths and hardness gradually increased. When compared with the pure Cu, the hardness of the Cu-10 wt% W, Cu-20 wt% W and Cu-30 wt% W composites increased by 48.58%, 71.28% and 82.74%, respectively. When compared with the pure Cu, the yield strength of the Cu-10 wt% W, Cu-20 wt% W and Cu-30 wt% W composites increased by 172.17%, 280.15% and 338.21%, respectively.
(3)
The arc of the pure Cu contact was relatively stable. When the W content increased to 10 wt%, the discharge phenomenon weakened. As the W content continued to increase, the arc burning times of the Cu-W composite contacts began to fluctuate.
(4)
There was a mass loss in both the cathode and anode contacts of the pure Cu. However, the Cu-W composite contacts experienced the following mass transfers: the anode weight increased, while the cathode weight decreased.
(5)
The addition of the W particles changed the non-uniform ablation of the pure copper, and the surface ablation of the Cu-W composite contacts was uniform.

Author Contributions

Conceptualization, X.L.; methodology, X.L. and G.Z.; writing—original draft, X.L. and M.Z.; investigation and data curation, M.Z.; software, X.L. and M.Z.; writing—reviewing and editing, S.W., Q.W., W.L., J.L., L.C., L.X., Y.Z. and K.P. All authors have read and agreed to the published version of the manuscript.

Funding

This research was funded by the Scientific and Technological Research Project of Henan Province, grant number 212102210453.

Institutional Review Board Statement

Not applicable.

Informed Consent Statement

Not applicable.

Data Availability Statement

Not applicable.

Acknowledgments

We wish to take this opportunity to thank the Henan University of Science and Technology 2021 Young Backbone Teacher Training Program; the Provincial and Ministerial Collaborative Innovation Center of Non-ferrous Metal New Materials and Advanced Processing Technology; and the Henan Key Laboratory of Non-ferrous Materials Science & Processing Technology for their support.

Conflicts of Interest

The authors declare no conflict of interest. The funders had no role in the design of the study; in the collection, analyses, or interpretation of data; in the writing of the manuscript; or in the decision to publish the results.

References

  1. Zhang, L.; Yu, J.; Wang, W.; Xiang, Z.; Wang, E. The Effect of Electromagnetic Stirring on the Microstructure Evolution of Cu-15%Co Alloy. Metals 2018, 8, 869. [Google Scholar] [CrossRef] [Green Version]
  2. Yang, Y.; Kuang, G.; Li, R. Optimizing the Electrical and Mechanical Properties of Cu-Cr Alloys by Hf Microalloying. Metals 2022, 12, 485. [Google Scholar] [CrossRef]
  3. Hernandez, O.; Aguilar, C.; Medina, A. Effects of Mo Concentration on the Structural and Corrosion Properties of Cu-Alloy. Metals 2019, 9, 1307. [Google Scholar] [CrossRef] [Green Version]
  4. Nazeer, F.; Wu, H.; Malik, A.; Meng, X.; Li, C.; Long, J. Mechanical Properties of Cu-GO Composite by Varying GO Mesh Sizes. Metals 2022, 12, 601. [Google Scholar] [CrossRef]
  5. Han, Y.; Li, S.; Cao, Y.; Li, S.; Yang, G.; Yu, B.; Song, Z.; Wang, J. Mechanical Properties of Cu-W Interpenetrating-Phase Composites with Different W-Skeleton. Metals 2022, 12, 903. [Google Scholar] [CrossRef]
  6. Nguyen Thi Hoang, O.; Nguyen Hoang, V.; Kim, J.-S.; Dudina, D.V. Structural Investigations of TiC-Cu Nanocomposites Prepared by Ball Milling and Spark Plasma Sintering. Metals 2017, 7, 123. [Google Scholar] [CrossRef] [Green Version]
  7. Chen, H.; Liu, C.; Chu, X.; Zhang, T.; Zheng, J. Corrosion Behavior and Microstructure of Cu-Based Composite Coatings Deposited by Cold Spraying. Metals 2022, 12, 955. [Google Scholar] [CrossRef]
  8. Saodaen, R.; Janmanee, P.; Rodchanarowan, A. Characteristics of Ternary Metal (Cu-Ni-TiN) Electrodes Used in an Electrical Discharge Machining Process. Metals 2021, 11, 694. [Google Scholar] [CrossRef]
  9. Pan, S.; Zheng, T.; Yao, G.; Chi, Y.; de Rosa, I.; Li, X. High-strength and high-conductivity in situ Cu-TiB2 nanocomposites. Mater. Sci. Eng. A 2022, 831, 141952. [Google Scholar] [CrossRef]
  10. Akbarpour, M.R. Effects of mechanical milling time on densification, microstructural characteristics and hardness of Cu-SiC nanocomposites prepared by conventional sintering process. Mater. Chem. Phys. 2021, 261, 124205. [Google Scholar] [CrossRef]
  11. Câmara, N.T.; Raimundo, R.A.; Lourenço, C.S.; Morais, L.M.F.; Silva, D.D.S.; Gomes, R.M.; Morales, M.A.; Macedo, D.A.; Gomes, U.U.; Costa, F.A. Impact of the SiC addition on the morphological, structural and mechanical properties of Cu-SiC composite powders prepared by high energy milling. Adv. Powder Technol. 2021, 32, 2950–2961. [Google Scholar] [CrossRef]
  12. Shu, D.; Li, X.; Yang, Q. Effect on Microstructure and Performance of B4C Content in B4C/Cu Composite. Metals 2021, 11, 1250. [Google Scholar] [CrossRef]
  13. Pingale, A.D.; Owhal, A.; Katarkar, A.S.; Belgamwar, S.U. Fabrication and tribo-mechanical performance of Cu@Al2O3 composite. Mater. Today Proc. 2022, 64, 1175–1181. [Google Scholar] [CrossRef]
  14. Zhang, Y.-S.; Liu, Y.; Tang, Y.-Z.; Sun, Z.; Tan, Y.-H.; Fan, X.-W.; Shi, H.-J.; Du, P.-k. Preparation of ultra-thin sandwich Cu-Cu/CNTs-Cu composite foil with high tensile strength by electrodeposition. J. Electroanal. Chem. 2022, 918, 116495. [Google Scholar] [CrossRef]
  15. Yin, L.; Han, L.; Wang, J.; Zhang, A.; Liu, D.; Luo, L.; Huang, Y.; Wang, Z. Formation and properties of ZrO2-Cu composite nanoglass films. Vacuum 2020, 173, 109113. [Google Scholar] [CrossRef]
  16. Fathy, A.; Elkady, O.; Abu-Oqail, A. Synthesis and characterization of Cu-ZrO2 nanocomposite produced by thermochemical process. J. Alloys Compd. 2017, 719, 411–419. [Google Scholar] [CrossRef]
  17. Fathy, A.; Wagih, A.; Abu-Oqail, A. Effect of ZrO2 content on properties of Cu-ZrO2 nanocomposites synthesized by optimized high energy ball milling. Ceram. Int. 2019, 45 Pt A, 2319–2329. [Google Scholar] [CrossRef]
  18. Singh, M.; Ambedkar, A.K.; Tyagi, S.; Kumar, V.; Yadav, P.; Kumar, A.; Gautam, Y.K.; Singh, B.P. Room temperature photoluminescence and spectroscopic ellipsometry of reactive co-sputtered Cu-doped ZnO thin films. Optik 2022, 257, 168860. [Google Scholar] [CrossRef]
  19. Vidyuk, T.M.; Dudina, D.V.; Korchagin, M.A.; Gavrilov, A.I.; Ukhina, A.V.; Bulanova, U.E.; Legan, M.A.; Novoselov, A.N.; Esikov, M.A.; Anisimov, A.G. Manufacturing of TiC-Cu composites by mechanical milling and spark plasma sintering using different carbon sources. Surf. Interfaces 2021, 27, 101445. [Google Scholar] [CrossRef]
  20. Vidyuk, T.M.; Dudina, D.V.; Korchagin, M.A.; Gavrilov, A.I.; Bokhonov, B.B.; Ukhina, A.V.; Esikov, M.A.; Shikalov, V.S.; Kosarev, V.F. Spark plasma sintering treatment of cold sprayed materials for synthesis and structural modification: A case study using TiC-Cu composites. Mater. Lett. X 2022, 14, 100140. [Google Scholar] [CrossRef]
  21. Fan, X.; Huang, X.; Liu, Q.; Ding, H.; Wang, H.; Hao, C. The microstructures and properties of in-situ ZrB2 reinforced Cu matrix composites. Results Phys. 2019, 14, 102494. [Google Scholar] [CrossRef]
  22. Shaik, M.A.; Golla, B.R. Mechanical, tribological and electrical properties of ZrB2 reinforced Cu processed via milling and high-pressure hot pressing. Ceram. Int. 2020, 46, 20226–20235. [Google Scholar] [CrossRef]
  23. Shaik, M.A.; Golla, B.R. Two body abrasion wear behaviour of Cu–ZrB2 composites against SiC emery paper. Wear 2020, 450–451, 203260. [Google Scholar] [CrossRef]
  24. Wang, M.M.; Xie, Z.M.; Deng, H.W.; Liu, R.; Yang, J.F.; Zhang, T.; Wang, X.P.; Fang, Q.F.; Liu, C.S.; Liu, X.; et al. Thermal shock fatigue behaviors of various W-0.5wt%ZrC materials under repetitive transient heat loads. J. Nucl. Mater. 2020, 534, 152152. [Google Scholar] [CrossRef]
  25. Tan, Y.; Lian, Y.Y.; Feng, F.; Chen, Z.; Wang, J.B.; Liu, X.; Guo, W.G.; Cheng, L.; Lu, G.H. Surface modification and deuterium retention of high energy rate forging W-Y2O3 exposed to deuterium plasma. J. Nucl. Mater. 2018, 509, 145–151. [Google Scholar] [CrossRef]
  26. Qu, S.; Gao, S.; Yuan, Y.; Li, C.; Lian, Y.; Liu, X.; Liu, W. Effects of high magnetic field on the melting behavior of W–1wt%La2O3 under high heat flux. J. Nucl. Mater. 2015, 463, 189–192. [Google Scholar] [CrossRef]
  27. Hu, W.; Dong, Z.; Wang, H.; Ahamad, T.; Ma, Z. Microstructure refinement and mechanical properties improvement in the W-Y2O3 alloys via optimized freeze-drying. Int. J. Refract. Met. Hard Mater. 2021, 95, 105453. [Google Scholar] [CrossRef]
  28. Zandi shahidi, K.; Faraji, G. Fabrication of W-Cu composite by wire crumpling and subsequent melt infiltration. Mater. Lett. 2022, 321, 132432. [Google Scholar] [CrossRef]
  29. Wang, G.; Qin, Y.; Yang, S. Influence of Ni additions on the microstructure and tensile property of W-Cu composites produced by direct energy deposition. J. Alloys Compd. 2022, 899, 163272. [Google Scholar] [CrossRef]
  30. Han, T.; Hou, C.; Zhao, Z.; Huang, X.; Tang, F.; Li, Y.; Song, X. W–Cu composites with excellent comprehensive properties. Compos. Part B Eng. 2022, 233, 109664. [Google Scholar] [CrossRef]
  31. Li, X.; Zhang, M.; Zhang, G.; Wei, S.; Xu, L.; Zhou, Y. Effect of spark plasma sintering temperature on structure and performance characteristics of Cu-20wt%W composite. J. Alloys Compd. 2022, 912, 165246. [Google Scholar] [CrossRef]
  32. Li, X.; Zhang, M.; Zhang, G.; Zhang, Q.; Wang, Q.; Wei, S.; Xu, L.; Zhou, Y. Research on the hot deformation behavior of Cu-20wt%W composite under different temperatures. Mater. Sci. Eng. A 2022, 830, 142326. [Google Scholar] [CrossRef]
Figure 1. Sintering process curve of a Cu-W composite.
Metals 12 01668 g001
Figure 2. Micromorphologies of pure Cu powder and pure W powder: (a) Cu powder; (b) W powder.
Metals 12 01668 g002
Figure 3. Microstructure of Cu-W composite powders with different W contents: (a) Cu-10 wt% W; (b) Cu-20 wt% W; (c) Cu-30 wt% W; (d) EDS analysis of area A in (a); (e) XRD patterns of pure Cu, pure W and Cu-W composite powders.
Metals 12 01668 g003
Figure 4. Microstructure of Cu-W composites with different W contents: (a) Cu; (b) Cu-10 wt% W; (c) Cu-20 wt% W; (d) Cu-30 wt% W.
Metals 12 01668 g004
Figure 5. Fracture morphologies of Cu-W composites with different W contents: (a) Cu; (b) Cu-10 wt% W; (c) Cu-20 wt% W; (d) Cu-30 wt% W.
Metals 12 01668 g005
Figure 6. Properties of Cu-W composites with increasing W content: (a) relative density; (b) microhardness; (c) electrical conductivity.
Metals 12 01668 g006
Figure 7. Room temperature compression stress–strain curves with increasing W content.
Metals 12 01668 g007
Figure 8. Change in arc time of Cu-W composite contacts: (a) Cu; (b) Cu-10 wt% W; (c) Cu-20 wt% W; (d) Cu-30 wt% W.
Metals 12 01668 g008
Figure 9. Variation in arc energy of Cu-W composite contacts with different W contents: (a) Cu; (b) Cu-10 wt% W; (c) Cu-20 wt% W; (d) Cu-30 wt% W.
Metals 12 01668 g009
Figure 10. Variation in welding force of Cu-W composite contacts with different W contents: (a) Cu; (b) Cu-10 wt% W; (c) Cu-20 wt% W; (d) Cu-30 wt% W.
Metals 12 01668 g010
Figure 11. Quality change in Cu-W composite contacts with different W contents.
Metals 12 01668 g011
Figure 12. Surface observation and analysis of pure Cu contacts after electric contact test: (a) anode contact; (b) enlarged view of area A in (a); (c) enlarged view of area B in (a); (d) EDS of area C in (b); (e) cathode contact; (f) larger version of (e).
Metals 12 01668 g012
Figure 13. Surface observation and analysis of Cu-10 wt% W composite contacts after electrical contact test: (a) anode contact; (b) enlarged view of (a); (c) cathode contact; (d) enlarged view of (c); (e) EDS of area A in (d); (f) EDS of area B in (d).
Metals 12 01668 g013
Figure 14. Surface observation of Cu-20 wt% W composite contacts after electrical contact test: (a) anode contact; (b) enlarged view of (a); (c) cathode contact; (d) enlarged view of (c).
Metals 12 01668 g014
Figure 15. Surface observation of Cu-30 wt% W composite contacts after electrical contact test: (a) anode contact; (b) enlarged view of (a); (c) cathode contact; (d) enlarged view of (c).
Metals 12 01668 g015
Table 1. Parameters of the electrical contact test.
ParameterValue
Contact shape/mmΦ 4 × 10 mm
Number of contacts5000
Voltage/V20
Direct current/A20
Closing pressure/cN40
Motion frequency/(times·min−1)60
Publisher’s Note: MDPI stays neutral with regard to jurisdictional claims in published maps and institutional affiliations.