Abstract
In this paper, an Ab-initio study was employed to study the properties of interfaces of Al3Y|Al. The interface strength, shear strength, structural stability, electronic density, bonding characteristics, stacking fault energy, and plasticity were all investigated. The interface with the stacking style of ABab or CBAcba has the greatest interface strength. The Al3Y(111)|Al(111) interface has the highest tensile stress of 13.39 GPa for rigid stretching; and 9.39 GPa for relaxation stretching. In the stretching process, the Al3Y(111)|Al(111) interface is prone to break on the Al3Y side. However, the Al3Y(010)|Al(010) and Al3Y(110)|Al(110) interface systems tend to fracture at the interface and Al side, respectively. Moreover, the differential charge density, electron localization function, and partial density of states (PDOS) demonstrate the newly formed chemical bonds at the interface, and the chemical bonds were formed by s-p or s-p-d hybrid orbitals. According to the Rice ratio and shear stress, these interfaces were found to be plastic and the Al3Y(111)|Al(111) interface has the best plasticity. This is significant because the formed interfaces are all advanced structure materials, which can be potentially used in automobile and aeronautical fields, even in some special industries.
1. Introduction
The lightweight, high strength, and excellent welding properties of Al and its alloys make them very popular materials for applications related to aeronautics and weapons [1,2,3,4]. However, the strength and toughness of Al for parts and equipment operated in extreme environments need to be significantly improved, which can be achieved by providing Al with transitional elements (e.g., V, Ti, Ag, Ni, Sc, Nb, and Y) to form tri-aluminide compounds [5,6,7,8,9,10,11,12,13].
In order to increase the thermal and oxidation resistance of Al alloys, it was found that adding traces of Y to the Al matrix was an extremely effective method of fine-tuning their physicochemical qualities [14,15,16,17]. Y addition to Al results in the formation of D019, D022, and L12 intermetallic structures, among which D019 is the most stable [18]. Yet, it is the L12 structure that improves the strength and plasticity of Al alloys the best. The precipitation of the L12-structured Al3Y compound is very beneficial for the Al matrix: Al3Y forms a coherent interface, and its presence enhances the creep resistance, prevents grain coarsening and inhibits dynamic recrystallization [19,20]. Another advantage is that the addition of Y increases the elastic modulus of the Al alloy effectively. To improve the ductility and strengthen Al alloys, scientists need to understand the atomic configuration and electronic structures within the modified Al matrix [21,22].
Typically, Al alloys contain various elements and precipitations. Thus, it is a challenge to explore the characteristics of every interface between L12 structured Al3Y and the Al matrix experimentally. Al3Y and bulk Al interactions may now be properly studied using density functional theory (DFT) ab-initio simulations, as condensed matter physics and computing technology continue to progress [23].
Currently, the published literature primarily focuses on properties of the single L12- or D022- phases in the bulk. Researchers successfully demonstrated the positive influence of the L12-structured Al3Y on the Al alloy, which is even greater than the influence of the D022-Al3Y phase [17,18,19,24]. However, data on the atomic interactions at the Al3Y|Al interface are still limited. Therefore, in this work, we studied Al3Y|Al interactions at the most common (010), (110), and (111) Al3Y|Al interfaces using DFT. We believe that this analysis will help the scientific community in designing novel Al alloys with advanced properties.
The mechanical properties were analyzed using the R-W model [25,26] (which defines how the structural defects affect the overall energy of the system at the interface) and the first-principle computational tensile test [23,26] (FPCTT, (which is capable of mechanically “stretching” the interface perpendicularly to the interface). We selected two FPCTT methods to analyze the strength and fracture behavior of the matrix at its interface with the Al3Y phase which are as follows: (1) a rigid method (widely used for the analysis of W, Ni, and Al alloy grain boundaries by modeling a pre-crack state at the corresponding interface); and (2) a relaxation method (capable of describing the fracture formation and propagation at the interface by allowing atoms in several layers to relax during the fracture-induced stretching).
Al3Y|Al interfacial characteristics and interfacial interactions at low-indexed (010), (110), and (111) were further studied utilizing the Rice ratio and unstable stacking fault energy in various slip directions, respectively.
Furthermore, the electronic properties of different indexes at the Al3Y|Al interface, as well as the plasticity, were also analyzed.
2. Computations
The Vienna Ab-initio Simulation Package was used to make the calculations (VASP) [27,28,29,30]. Bulk Al3Y and Al were calculated using the Perdew–Burke–Ernzerhof [30,31] (PAW-GGA-PBE) scheme, Perdew–Wang-91 (PAW-GGA-PW91), and the local-density approximation (PAW-LDA) pseudopotential, respectively. K-mesh spacing’s sampling was set at 0.03 Å–1. We used the Heyd–Scuseria–Ernzerhof (HSE06) technique to characterize the density of states with default settings since Y has d-electrons. The energy tolerance and force, as well as plane-wave cutoff energy, were set as 5 × 10⁻⁸ eV/atom, 0.005 eV/Å, and 450 eV, respectively.
2.1. Optimization of Bulk Phases
We optimized the structures and calculated the lattice and elastic constants as well as formation enthalpy (ΔHf) for the bulk Al and Al3Y phases and compared the results with the literature data obtained experimentally (see Table 1 and Table 2). The ΔHf of Al3Y was calculated using Equation (1):
where , , and are the chemical potentials of one atom in the corresponding bulk phases.

Table 1.
ΔHf and lattice constants calculated for the bulk Al3Y phase using PW91, PBE, and LDA.

Table 2.
Elastic constants as well as Young’s (E), bulk (B), and shear(G) moduli.
The elastic constants were calculated to ensure structural stability and are shown in Table 2, satisfying the generalized stability criteria for cubic crystals: C11 + 2C12 > 0, C11 > |C12|, and C44 > 0. The shear (G), bulk (B), and Young’s (E) moduli were obtained using the Voigt–Reuss–Hill method. All values are in reasonable agreement with the literature values (see Table 2), confirming the reliability of our calculations and the stability of the optimized structure.
2.2. Low-Index Surfaces Properties
Several atomic layers of Al and Al3Y were stacked to create the slab surface, which revealed the optimal arrangement with the lowest possible slab surface energies and the most stable structure. Figure 1 shows the stacked styles of the models.
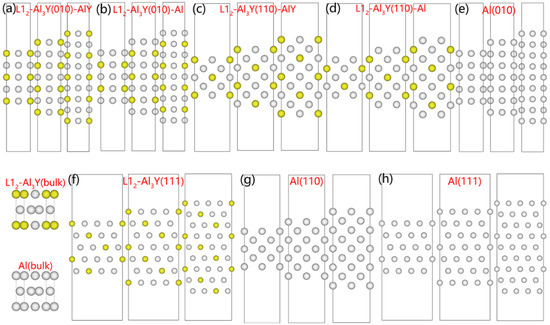
Figure 1.
Slab surface models with different layer numbers of Al3Y (a–f) and Al (g,h), and bulk Al3Y and Al models Y: yellow ball; Al: white ball.
The reasonable thickness of the surface model was judged by the change in the layer distance (Δij(%), calculated using Equation (2)) of the relaxed models. Table 3 shows the interlayer space before and after optimization.
where (j = i + 1) and are the atomic-layer spaces of the optimized and unoptimized surface models, respectively.

Table 3.
Deviation of the layer distances after optimization.
The Δ45 values for the modelled (010) and (110) surfaces are <0.5% (see Table 3). Thus, nine atomic layers should be sufficient to demonstrate the bulk properties of material during the modeling of the internal interfaces. The Δ34 values for the (111) surface were <0.5%. Therefore, a layer containing seven atomic layers should be sufficiently thick.
2.3. Interface Modeling
The interfaces Al3Y(110)|Al(110), Al3Y(111)|Al(111), and Al3Y(010)|Al(010) were developed using data from prior papers. The vacuum in each model was 14 Å. Post-optimization misfits of these models accounted for 0.74% which was <1%; therefore, we concluded that the lattice distortion was too small to destabilize the interface stability [34,35]. Figure 2 shows the atom arrangements at these various interfaces.
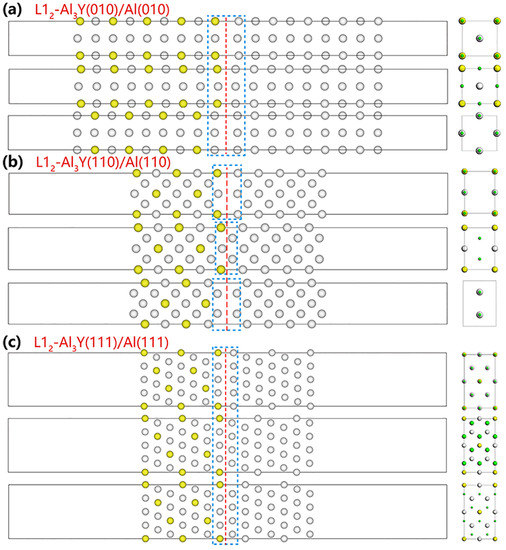
Figure 2.
Atomic arrangements at various interfaces. Green spheres show the Al atom of the Al matrix. The red dash line denotes the interface, and the atomic arrangement is in the blue dash rectangle (Green spheres show the Al atom of the Al matrix.).
3. Results and Discussion
The structural stability, electrical properties, interfacial strength, and plasticity of Al3Y|Al surfaces are examined in this section.
3.1. Micromechanics and Separation Energies of Al3|Y
To explain the Al3Y|A interface’s fracture behavior and strength, we used (1) rigid and (2) relaxed methods, respectively. The interface considered by the rigid method was separated at the pre-cracked interface by the twenty 0.03 nm steps. A rupture in the interfacial area was ensured in this situation since all atoms’ locations were fixed. When using a relaxation strategy, only the locations of terminal atoms that were set to guarantee the systems were fractured at their weakest point. In this case, the separation energy (Esep, calculated as shown in Equation (10)) and interfacial strength were calculated based on the relationship between separated (extended) distances (x) and corresponding energy.
where Esg and Einit are the energies with and without interface separation, and Ain is the interfacial area. In order to determine the correlation between Esep and x, techniques described in the literature were used [26]:
Originally, Equation (4) universally described the interactions between the atoms at the interface [26]. For metals, a better match between atomic spacing and micro stress might be achieved by varying f(x). In this case, the micro tensile stress can be expressed as:
If x = λ in Equation (5), the theoretically micro tensile stress will reach its maximum (σmax, see Equation (6). In general, the work of adhesion (Wad) defines the interfacial wettability, which determines the maximum separation energy. The greater the work of adhesion, the easier the interface is to form
Separation energies and theoretically micro tensile stresses obtained by the rigid method are presented in Figure 3 and Table 4. The maximum adhesion work for different stacked types of (010), (110), and (111) interfaces is 2.07, 2.40, and 1.93 J/m2, respectively.
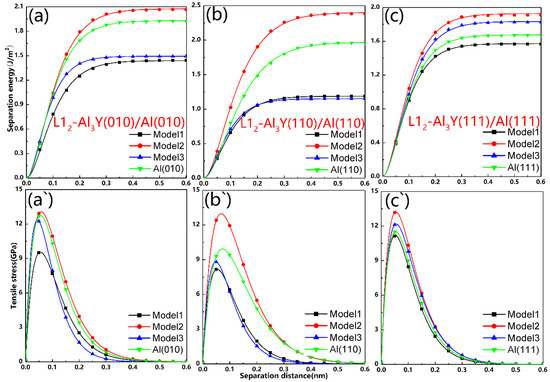
Figure 3.
Theoretical tensile stresses (σmax) and separation energies for the interfaces modeled using the rigid method: (a–c) separation energy, (a`–c`) tensile stress.

Table 4.
Separation distance (Dsep), work of adhesion (Wad), fracture energy (Efra), and maximum tensile stress (σmax) of the interfaces.
For the Al3Y(110)/Al(110), Al3Y(010)/Al(010), and Al3Y(111)/Al(111) interfaces, the σmax were calculated to be equal to 12.97, 13.28 and 13.39 GPa, respectively. The interface with the second stacking style (Model2) yielded the highest adhesion value (Wad) as well as theoretical tensile stress, which reflects good wettability and strength. Additionally, the atoms in this model were arranged similarly to the Al3Y or bulk Al. Thus, the interfacial structure determines the interfacial strength of the same low-index interface.
3.2. Interface Energy
Because the second stacking style (Model2) provided the best wettability and highest strength, we selected it for further analysis and applied a relaxation method to understand the fracture of the relevant interfaces. To further understand the stability and rationality of these interfaces, the interface energy was calculated. First of all, we calculated the surface energy of Al and Al3Y using Equations (7) and (8), respectively [36,37]:
where the Eslab is the surface energy, A is a single surface area, M expresses the amount of aluminum or the yttrium atom, and and express the chemical potential of i atom in the bulk and slab, respectively.
Since the Al3Y(111) surface is stoichiometric, Equation (4) can be simplified as follows:
Since the surfaces of Al3Y(010) and Al3Y(110) are non-stoichiometric, Equation (9) should be expanded as shown in Equation (10) [37].
The following equations (Equations (11) and (12)) were obtained from a connection between bulk Al3Y and its ΔHf:
Thus, by combining Equations (11) and (12), we obtain:
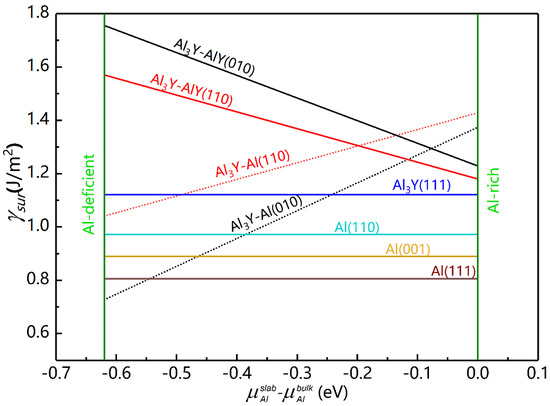
Figure 4.
Surface energies of various Al3Y/Al interfaces.

Table 5.
Interfacial (γint) energy obtained using Model 2 and calculated surface energies (γsur) of Al and Al3Y.
As shown in Figure 4, the values of the γsur for Al and Al3Y (111) were constant and did not depend on the chemical environment, which was not the case for the (010) and (110) surfaces of Al3Y. As the value increased, the γsur of Al3Y-Al decreased, while it increased for the Al3Y-AlY interface. Under Al-deficient conditions, the surface energies of Al3Y adhere to the following sequence: Al3Y-AlY(010) > Al3Y-AlY(110) > Al3Y(111) > Al3Y-Al (110) > Al3Y-Al (010); however, under the Al-rich conditions, it changes into Al3Y-Al(110) > Al3Y-Al(010) > Al3Y-AlY(010) > Al3Y-AlY(110) > Al3Y(111). So, in the Al-rich environment, the structural stability of AlY surfaces from strong to weak is (111) > (110) > (010), which agrees well with the general rule mentioned in Ref. [34] and shows that the (111) surface is most stable.
The is zero because of the Al-rich ambiance at the interface. This resulted in γsur values for the AlY surface of 1.221, 1.185 and 1.132 J/m2 for (010), (110) and (111) surfaces. According to Equation (14) [36,37], we computed the appropriate interface energies (γint) to be 0.315, 0.279, and 0.366 J/m2, respectively.
MY, MAl,AlY, and MAl,Al indicate the amount of Y and Al atoms on the Al3Y and Al sides, respectively. The surface energy of Al and Al3Y-AlY are represented by and respectively.
Further, we calculated electron migration according to the deformation charge density of these interfaces (see Figure 5). The blue cloud indicates electronic decreases; however, the yellow cloud represents the opposite. The results indicate Al and Y electrons migrated to the interface to form new chemical bonds to strengthen the interface and improve its wettability. The electrons at the interfaces of Al3Y(010)|Al(010) and Al3Y(110)|Al(110) gather closer to the Al side, while the electron cloud for the Al3Y(111)|Al(111) system is more evenly distributed at the center plane of the interface (see Figure 5a–c). Then, we analyzed the type of chemical bond by calculating the electron localization functions (ELF). The value of the green part approximates 0.5 and the yellow part approximates 0.75; therefore, the formed chemical bond at the interface contains a covalent bond and metal bond. (see Figure 5a‘–c‘).
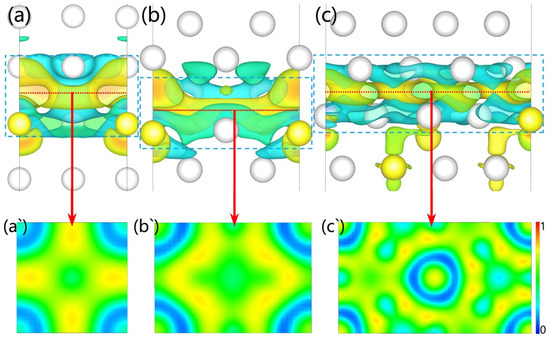
Figure 5.
Deformation charge density (a–c) and ELF (a`–c`).
3.3. Partial Density and Bonding Nature of States
At the Al3Y(010)|Al(010) interface, the projected partial density of states (PDOS) for Al and Y were equivalent to −1.72, 1.74, and 2.85 eV, which indicates the development of new chemical bonds and s-p or s-p-d hybrid orbitals. These data are also consistent with the data shown earlier in Figure 6. At Ef = 0, PDOS ≠ 0, it shows the system has significant conducting qualities and that there are several energy levels present at the Fermi level.
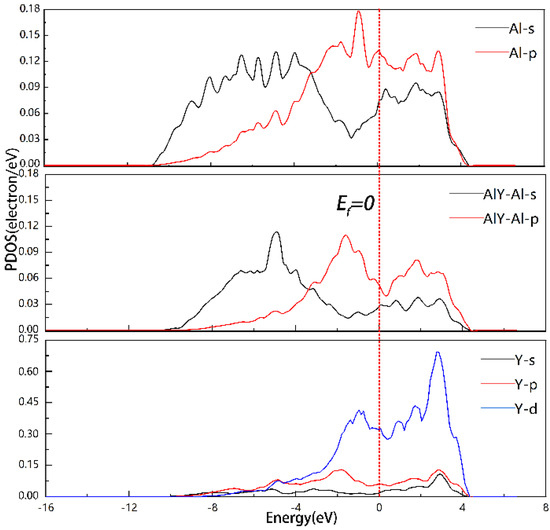
Figure 6.
PDOS of Model2 of Al3Y(010)|Al(010) interface.
The PDOS for the Al, AlY-Al, and Y at the Al3Y(110)|Al(110) interface was equal to −1.79, 1.11, and 2.76 eV (see Figure 7); this confirms the information in Figure 7 and also suggests the creation of novel chemical bonds and s-p-d hybrid orbitals (b). Similarly, for the Al3Y(110)|Al(110) interface, PDOS ≠ 0 at Ef = 0. Thus, the system is a conductor.
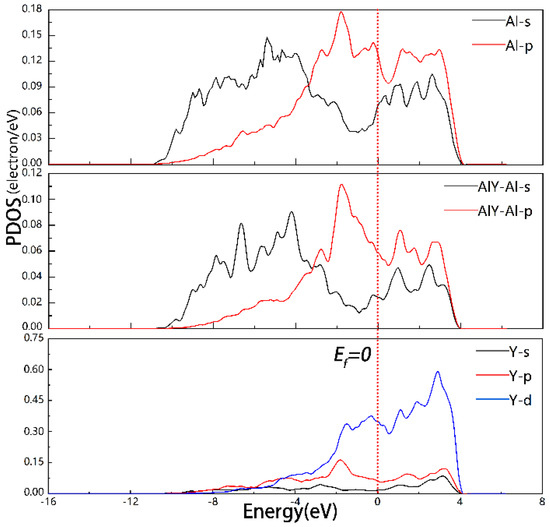
Figure 7.
PDOS of Model2 of Al3Y(110)|Al(110) interface.
In Figure 8, the PDOS for the Al, AlY-Al, and Y for the Al3Y(111)|Al(111) interface were equal to −1.82, −0.37, and 1.51, and 2.15 eV, respectively, which indicates the formation of s-p-d hybrid orbitals.
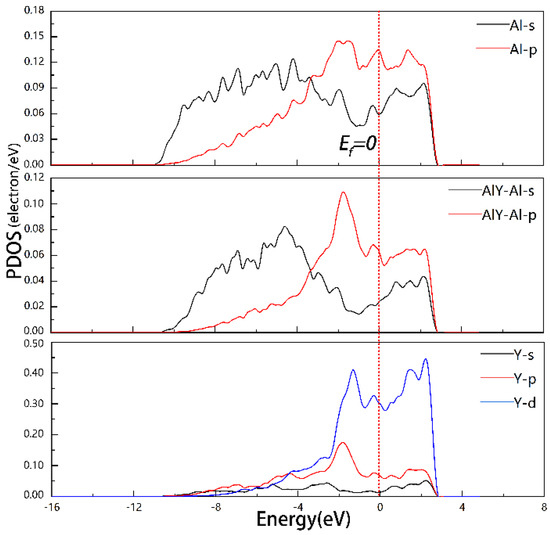
Figure 8.
PDOS of Model2 of Al3Y(111)|Al(111) interface.
3.4. Fracture Behavior and Toughness of The Interface
Although understanding the theoretical rigid tensile stress provides us with the tools to demonstrate interfacial strength, a deeper analysis of the interfacial fracture progression, consequently, is still needed to discover the weakest point. For this purpose, we graphed the fracture process for the Al3Y(010)/Al(010) interface (see Figure 9). While a bilayer of Al atoms adhered to the Al3Y side, the fracture path was concentrated on the Al side (see Figure 9a’–e’ for specific electronic configurations). The electron cloud density on the Al3Y side drops due to the continuous stretching in response to the applied stress. Fractures begin to spread on the Al side as the straining proceeds.
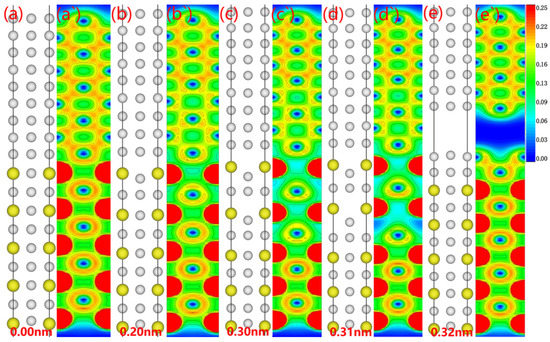
Figure 9.
Fracture behavior and corresponding electron density of stretched Al3Y(010)|Al(010) system: (a–e) atomic site of the interface system, (a`–e`) electron density of the interface.
No modifications to the atom configurations were seen in the electronic alterations of the Al3Y(110)|Al(110) interface throughout the fracture propagation as determined by the relaxation approach (see Figure 10). During stretching, the interface electron cloud first decreases, forming electron-hole pairs at the interface. When the electronic hole cloud expands substantially, the interface breaks.
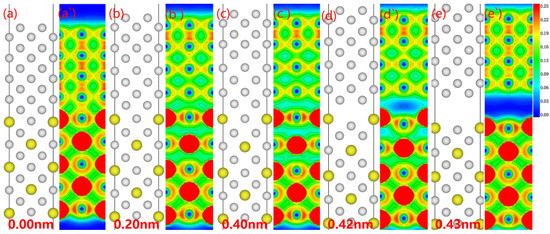
Figure 10.
Fracture behavior and corresponding electron density of stretched Al3Y(110)|Al(110) system: (a–e) atomic site of the interface system, (a`–e`) electron density of the interface.
The electron density changes during the fracturing of the Al3Y(111)|Al(111) interface obtained using the relaxation method are shown in Figure 11. The atomic arrangement of the Al3Y side changed significantly with the fractured surface appearing on the Al3Y side. The electron cloud density decreases substantially in several places (see Figure 11b). Upon continuous stretching, three of these places converted into electron holes (marked as blue dotted circles in Figure 11). Finally, a fracture surface formed along the electron-hole between the third and fourth layers on the Al3Y side.
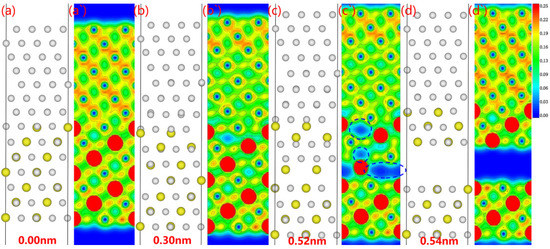
Figure 11.
Fracture behavior and corresponding electron density of stretched Al3Y(111)|Al(111) system: (a–d) atomic site of the interface system, (a`–d`) electron density of the interface.
Then, we calculated the separation energy and tensile stress using the relaxation method and the results are shown in Figure 12 and Table 6.
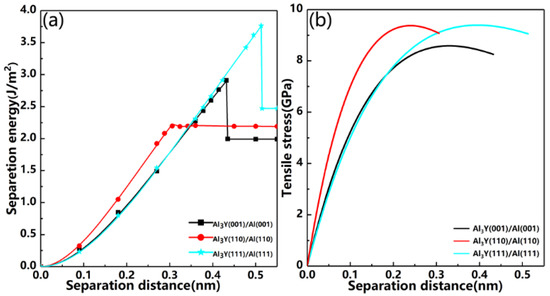
Figure 12.
Separation energy and tensile stress versus the separation distance in the relaxation method. (a) Separation energy, (b) Tensile stress.

Table 6.
Separation distance (Dsep), maximum separation energy (Efra), and maximum tensile stress (σmax) of the interfaces.
Combing Figure 12b and Table 6, we can find the Al3Y(111)|Al(111) system has the maximum tensile stress (9.39 GPa), and the tensile stress values for Al3Y(001)|Al(001) and Al3Y(110)|Al(110) systems are 8.59 Gpa and 9.34 Gpa, respectively. These results indicate that the Al3Y(111)|Al(111) system greatly improves the strength and toughness of the alloy.
To comprehend the intrinsic characteristics of the toughness of different Al|Al3Y interfaces, we investigated the stacking fault energies (γsf) and Rice ratios (DR) [38,39,40]. Upon applied forced and during deformation, the interfaces were expected to either form (1) interfacial cleavage or (2) dislocations to propagate the interfacial slip [41]. It is reasonable to assume that the interfacial dislocation at critical energy (Gd) is lower than Wad. The maximum γsf and critical energy (Gd) are often equivalent. The critical energy must be overcome during the slide.
where is the interface system’s total energy with stacking faults, and E0 is the energy without, respectively. Therefore, the Rice ratio (DR) can be used to determine the plasticity of the interface system. The interface exhibits plasticity unless DR < 1, in which case the interface is brittle. γms is the maximum γsf.
To better understand the investigated properties, we calculated two additional parameters (shear stress (FS) and stress ratio (SR)) according to Equations (17) and (18).
where x is the displacement and SS is the max value of the FS.
Figure 13 shows the stacking fault energies we used to define the flexibility of our surfaces, and Table 7 summarizes γms, DR, SS and SR. When the slippage at the Al3Y(010)|(010) interface occurs in the <100> and <101> directions, γms and DR will be equal to 1.26 and 0.07 J/m2, and 1.64 and 2.95, respectively, which indicates that the higher plasticity in the <101> direction. Additionally, the SS in <101> direction is less than that in <100>; therefore, the slippage initiation will occur more easily in the <101> direction. γms and DR values for the Al3Y(110)|Al(110) interface in the <001> and <1−10> directions will be equal to 1.25 J/m2 and 1.28 J/m2, and 1.92 and 1.87, respectively. Similar DR values indicate a similar toughness along the <001>and <1−10> directions, and the SS value also supports this conclusion.
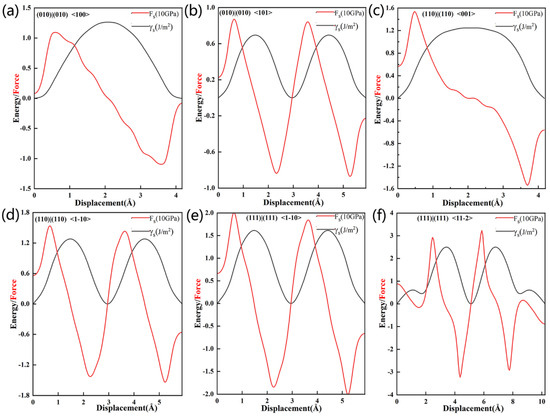
Figure 13.
Stacking fault energy and maximum shear stress of interfacial systems slipping in different directions.

Table 7.
Maximum generalized unstable stacking fault energy, shear stress and corresponding Rice ratio (DR) and stress ratio for Al3Y(001)|Al(001), Al3Y(110)|Al(110), and Al3Y(111)|Al(111).
Analysis of the stacking fault energy at the Al3Y(111)|Al(111) interface (shown in Figure 13e,f) revealed that slippage will occur more easily in the <1−10> direction (since the corresponding max shear stress is 20.08 GPa).
All DR values were greater than 1 (see Table 7). Thus, slippage at the Al3Y|Al will occur more easily than cleavage. The best plasticity (judging by the corresponding D (equal to 3.27) and μ/b < 0.711) would be in the <11–2> direction. The max tensile strength of Al3Y(010)|Al(010) is greater than the shear stress; however, the result of Al3Y(110)|Al(110) and Al3Y(111)|Al(111) is the opposite. Additionally, Al3Y(111)|Al(111) has the largest shear stress in the <11−2> direction. The Al3Y(111)|Al(111) interface is strongly recommended as it will increase the strength and improve the plasticity of Al alloys.
4. Conclusions
First-principles DFT simulations were used to develop an Al alloy with the required qualities by calculating the thermodynamics, mechanics, and electronic structure of the Al3Y|Al interface. The simulation results and conclusions are outlined below.
- FPCTTs performed using the rigid method demonstrated the highest Wad value for the Al3Y|Al with a bulk-like stacked style. The Al3Y(110)/Al(110) has the highest Wad, which indicates that it is easiest to form.
- The Al3Y(010)|Al(010) interface configuration would break on the Al side of the interface, while Al3Y(110)|Al(110) and the Al3Y(111)|Al(111) interfaces would very likely dissociate at the interface and on the Al3Y side, respectively.
- The ELF and deformation charge density confirmed the existence of both metallic and covalent connections. The partial density of the states shows that s-p and s-p-d hybrid orbitals are formed among the Al and Y atoms at the interface.
- The DR, FPCTT values validated the Al3Y|Al interface’s superior toughness, tensile strength and shear strength. The results confirmed that Al3Y(111)|Al(111) possessed the highest interfacial strength and plasticity. The results are significant because they can be potentially used in automobile and aeronautical fields, and even in some special industries.
Author Contributions
Y.L.: conceptualization, methodology, writing-original draft; X.Z.: investigation; Y.H.: methodology. All authors have read and agreed to the published version of the manuscript.
Funding
This work was financially supported by The National Natural Science Foundation of China (U1837207). This work was supported in part by the High-Performance Computing Center of Central South University.
Data Availability Statement
The datasets generated during and/or analyzed during the current study are available from the corresponding author on reasonable request.
Conflicts of Interest
The authors declare no conflict of interest.
References
- Luo, H.; Fu, J.; Wu, T.; Chen, N.; Li, H. Numerical Simulation and Experimental Study on the Drilling Process of 7075-t6 Aerospace Aluminum Alloy. Materials 2021, 14, 553. [Google Scholar]
- Schubert, E.; Klassen, M.; Zerner, I.; Walz, C.; Sepold, G. Light-weight structures produced by laser beam joining for future applications in automobile and aerospace industry. J. Mater. Process. Technol. 2001, 115, 2. [Google Scholar] [CrossRef]
- Miller, W.S.; Zhuang, L.; Bottema, J.; Wittebrood, A.; De Smet, P.; Haszler, A.; Vieregge, A.J.M.S. Recent development in aluminium alloys for the automotive industry. Mater. Sci. Eng. A 2000, 280, 37. [Google Scholar]
- Ezuber, H.; El-Houd, A.; El-Shawesh, F. A study on the corrosion behavior of aluminum alloys in seawater. Mater. Des. 2008, 29, 801–805. [Google Scholar] [CrossRef]
- Jun, J.H.; Kim, J.M.; Seong, K.D.; Kim, K.T.; Jung, W.J. Enhanced Mechanical Properties of A206 Aluminum Casting Alloy by Addition of Rare Earth Elements. Mater. Sci. Forum 2005, 441, 475–479. [Google Scholar]
- Wang, M.; Knezevic, M.; Chen, M.; Li, J.; Liu, T.; Wang, G.; Zhao, Y.; Wang, M.; Liu, Q.; Huang, Z.; et al. Microstructure design to achieve optimal strength, thermal stability, and electrical conductivity of Al-7.5wt.%Y alloy. Mater. Sci. Eng. A 2022, 852, 5. [Google Scholar]
- He, Y.; Peng, C.; Feng, Y.; Wang, R.; Zhong, J. Effects of alloying elements on the microstructure and corrosion behavior of Mg–Li–Al–Y alloys. J. Alloy. Compd. 2020, 834, 154344. [Google Scholar]
- Yan, P.; Zhang, Z.; Zhou, C.; Xiao, Q.; Fang, J.; Si, H.; Wang, W.; Yang, Y. Enhancement of corrosion resistance of a high Zn-yttrium aluminum alloy. J. Alloy. Compd. 2020, 817, 152744. [Google Scholar] [CrossRef]
- Chen, Z.; Bao, C.; Wu, G.; Jian, Y.; Zhang, L. Effect of YAl2 Particles on the Corrosion Behavior of Mg–Li Matrix Composite in NaCl Solution. Materials 2019, 12, 549. [Google Scholar] [CrossRef]
- Mihara, M.; Marioara, C.D.; Andersen, S.J.; Holmestad, R.; Kobayashi, E.; Sato, T. Precipitation in an Al-Mg-Cu alloy and the effect of a low amount of Ag. Mater. Sci. Eng. A 2016, 658, 91. [Google Scholar]
- Grandfield, J.F.; Taylor, J.A. The Impact of Rising Ni and V Impurity Levels in Smelter Grade Aluminium and Potential Control Strategies. Mater. Sci. Forum 2009, 630, 129. [Google Scholar] [CrossRef]
- Wang, M.; Knezevic, M.; Gao, H.; Wang, J.; Kang, M.; Sun, B. Phase interface induced stacking faults in Al-7.5Y alloy revealed by in-situ synchrotron X-ray diffraction and ex-situ electron microscopy. Mater. Charact. 2021, 111, 179. [Google Scholar]
- Zhang, Y.-Z.; Gao, H.-Y.; Wang, Y.-F.; Wang, J.; Sun, B.-D.; Gu, S.-W.; You, W.-R. Effects of Y addition on microstructure and properties of Al-Zr alloys. Trans. Nonferrous Met. Soc. China 2014, 24, 2239. [Google Scholar] [CrossRef]
- Wang, M.; Lv, H.; Zhang, C.; Li, M.; Gao, H.; Wang, J.; Sun, B. High strength high electrical conductivity ultrafine-grained Al–Y alloy processed via cold drawing. Mater. Sci. Eng. A 2020, 772, 138824. [Google Scholar] [CrossRef]
- Zhang, Y.-D.; Zhang, C.; Lan, H.; Hou, P.Y.; Yang, Z.-G. Improvement of the oxidation resistance of Tribaloy T-800 alloy by the additions of yttrium and aluminium. Corros. Sci. 2011, 53, 1035. [Google Scholar] [CrossRef]
- Huang, K.; Feng, Q.; Zhou, W.; Ren, Y.; Huang, L.; Xiang, J.; Tang, H.; Zhu, Y.; Wei, Y. Enhancement of strength mechanical and corrosion resistance of 7055 alloy with minor Sc and Y addition. Mater. Res. Express 2021, 8, 016524. [Google Scholar] [CrossRef]
- Duan, Y.; Sun, Y.; Peng, M.; Zhou, S. Ab-initio investigations on elastic properties in L12 structure Al3Sc and Al3Y under high pressure. J. Alloy. Compd. 2014, 585, 587. [Google Scholar] [CrossRef]
- Popov, N.A.; Akashev, L.A.; Kochedykov, V.A.; Shevchenko, V.G. Thermal oxidation of the intermetallic Al3Y surface. Russ. Metall. Met. 2013, 2013, 553–556. [Google Scholar] [CrossRef]
- Pozdniakov, A.; Barkov, R. Microstructure and mechanical properties of novel Al-Y-Sc alloys with high thermal stability and electrical conductivity. J. Mater. Sci. Technol. 2019, 36, 006. [Google Scholar] [CrossRef]
- Duan, Y.H.; Huang, B.; Sun, Y.; Peng, M.J.; Zhou, S.G. The Phase Stability, Thermodynamics Properties and Electronic Structures of L12-Type Al3Sc and Al3Y under High Pressures. Chin. Phys. Lett. 2014, 8, 155. [Google Scholar]
- Zhang, Y.; Gu, J.; Tian, Y.; Gao, H.; Wang, J.; Sun, B. Microstructural evolution and mechanical property of Al–Zr and Al–Zr–Y alloys. Mater. Sci. Eng. A 2014, 616, 132. [Google Scholar]
- Gao, H.; Feng, W.; Wang, Y.; Gu, J.; Zhang, Y.; Wang, J.; Sun, B. Structural and compositional evolution of Al3(Zr,Y) precipitates in Al-Zr-Y alloy. Mater. Charact. 2016, 121, 195. [Google Scholar] [CrossRef]
- Gao, X.; Wang, J.; Wu, X.; Wang, R.; Jia, Z. Effects of Alloying Atoms on Antiphase Boundary Energy and Yield Stress Anomaly of L12 Intermetallics: First-Principles Study. Crystals 2018, 8, 96. [Google Scholar] [CrossRef]
- Xu, J. Electronic structure and crystal structure in Al3Y. Acta Phys. Sin. 1990, 39, 278. [Google Scholar]
- Hyland, R.W., Jr.; Rohrer, C.L.; Asta, M.; Foiles, S.M. Al(f.c.c.):Al3Sc(L12) interphase boundary energy calculations. Acta Mater. 1998, 46, 3667. [Google Scholar]
- Wu, X.; You, Y.-W.; Kong, X.-S.; Chen, J.-L.; Luo, G.-N.; Lu, G.-H.; Liu, C.; Wang, Z. First-principles determination of grain boundary strengthening in tungsten: Dependence on grain boundary structure and metallic radius of solute. Acta Mater. 2016, 120, 315. [Google Scholar] [CrossRef]
- Zhang, X.; Wei, J. First-principles investigations on vibrational, thermodynamic, mechanical properties and thermal conductivity of L12-Al3X (X = Sc, Er, Tm, Yb) intermetallics. Phys. Scr. 2015, 90, 1351. [Google Scholar]
- Hafner, J. ChemInform Abstract: Ab-initio Simulations of Materials Using VASP: Density-functional Theory and Beyond. ChemInform 2008, 29, 2044. [Google Scholar] [CrossRef]
- Kresse, G.G.; Furthmüller, J.J. Efficient Iterative Schemes for Ab Initio Total-Energy Calculations Using a Plane-Wave Basis Set. Phys. Rev. B 1996, 54, 11169. [Google Scholar]
- Bellafont, N.P.; Viñes, F.; Hieringer, W.; Illas, F. Predicting core level binding energies shifts: Suitability of the projector augmented wave approach as implemented in VASP. J. Comput. Chem. 2017, 38, 518. [Google Scholar] [CrossRef]
- Zhang, M.; Fournier, R. Self-consistent charge equilibration method and its application to Au13Na(n) (n = 1,10) clusters. J. Phys. Chem. 2009, 113, 3162. [Google Scholar]
- Tian, T.; Wang, X.; Li, W. Ab initio calculations on elastic properties in L12 structure Al3X and X3Al-type (X = transition or main group metal) intermetallic compounds. Solid State Commun. 2013, 156, 69. [Google Scholar] [CrossRef]
- Chen, H.; Lin, L.; Mao, P.; Liu, Z. Phase stability, electronic, elastic and thermodynamic properties of Al-RE intermetallics in Mg-Al-RE alloy: A first principles study. J. Magnes. Alloy. 2015, 3, 197. [Google Scholar] [CrossRef]
- Liu, Y.; Wen, J.-C.; Zhang, X.-Y.; Huang, Y.C. A comparative study on heterogeneous nucleation and mechanical properties of the fcc-Al/L12-Al3M (M = Sc, Ti, V, Y, Zr, Nb) interface from first-principles calculations. Phys. Chem. Chem. Phys. 2021, 65, 1125. [Google Scholar]
- Feng, J.; Xiao, B.; Wan, C.L.; Qu, Z.X.; Huang, Z.C.; Chen, J.C.; Zhou, R.; Pan, W. Electronic structure, mechanical properties and thermal conductivity of Ln2Zr2O7 (Ln = La, Pr, Nd, Sm, Eu and Gd) pyrochlore. Acta Mater. 2011, 59, 1742. [Google Scholar] [CrossRef]
- Bramfitt, B. The effect of carbide and nitride additions on the heterogeneous nucleation behavior of liquid iron. Metall. Trans. 1970, 1, 1987. [Google Scholar]
- Sun, S.; Li, X.; Wang, H.; Jiang, H.; Lei, W.; Jiang, Y.; Yi, D. First-principles investigations on the electronic properties and stabilities of low-index surfaces of L12–Al3Sc intermetallic. Appl. Surf. Sci. 2014, 288, 609–618. [Google Scholar] [CrossRef]
- Medvedeva, N.; Gornostyrev, Y.; Kontsevoi, O.; Freeman, A. Ab-initio study of interfacial strength and misfit dislocations in eutectic composites: NiAl/Mo. Acta Mater. 2004, 52, 675. [Google Scholar] [CrossRef]
- Rice, J.R. Dislocation nucleation from a crack tip: An analysis based on the Peierls concept. J. Mech. Phys. Solids 1992, 40, 239. [Google Scholar]
- Vitek, V. Intrinsic stacking faults in body-centred cubic crystals. Philos. Mag. 1968, 18, 773. [Google Scholar]
- Rice, J.R.; Thomson, R. Ductile Versus Brittle Behavior of Crystals. Philos. Mag. A 1974, 29, 73. [Google Scholar]
Publisher’s Note: MDPI stays neutral with regard to jurisdictional claims in published maps and institutional affiliations. |
© 2022 by the authors. Licensee MDPI, Basel, Switzerland. This article is an open access article distributed under the terms and conditions of the Creative Commons Attribution (CC BY) license (https://creativecommons.org/licenses/by/4.0/).