The structural stability, electrical properties, interfacial strength, and plasticity of Al3Y|Al surfaces are examined in this section.
3.2. Interface Energy
Because the second stacking style (Model2) provided the best wettability and highest strength, we selected it for further analysis and applied a relaxation method to understand the fracture of the relevant interfaces. To further understand the stability and rationality of these interfaces, the interface energy was calculated. First of all, we calculated the surface energy of Al and Al
3Y using Equations (7) and (8), respectively [
36,
37]:
where the
Eslab is the surface energy,
A is a single surface area, M expresses the amount of aluminum or the yttrium atom, and
and
express the chemical potential of
i atom in the bulk and slab, respectively.
Since the Al
3Y(111) surface is stoichiometric, Equation (4) can be simplified as follows:
Since the surfaces of Al
3Y(010) and Al
3Y(110) are non-stoichiometric, Equation (9) should be expanded as shown in Equation (10) [
37].
The following equations (Equations (11) and (12)) were obtained from a connection between bulk Al
3Y and its Δ
Hf:
Thus, by combining Equations (11) and (12), we obtain:
The surface energy of Al and Al
3Y was calculated and is detailed in
Figure 4 and
Table 5.
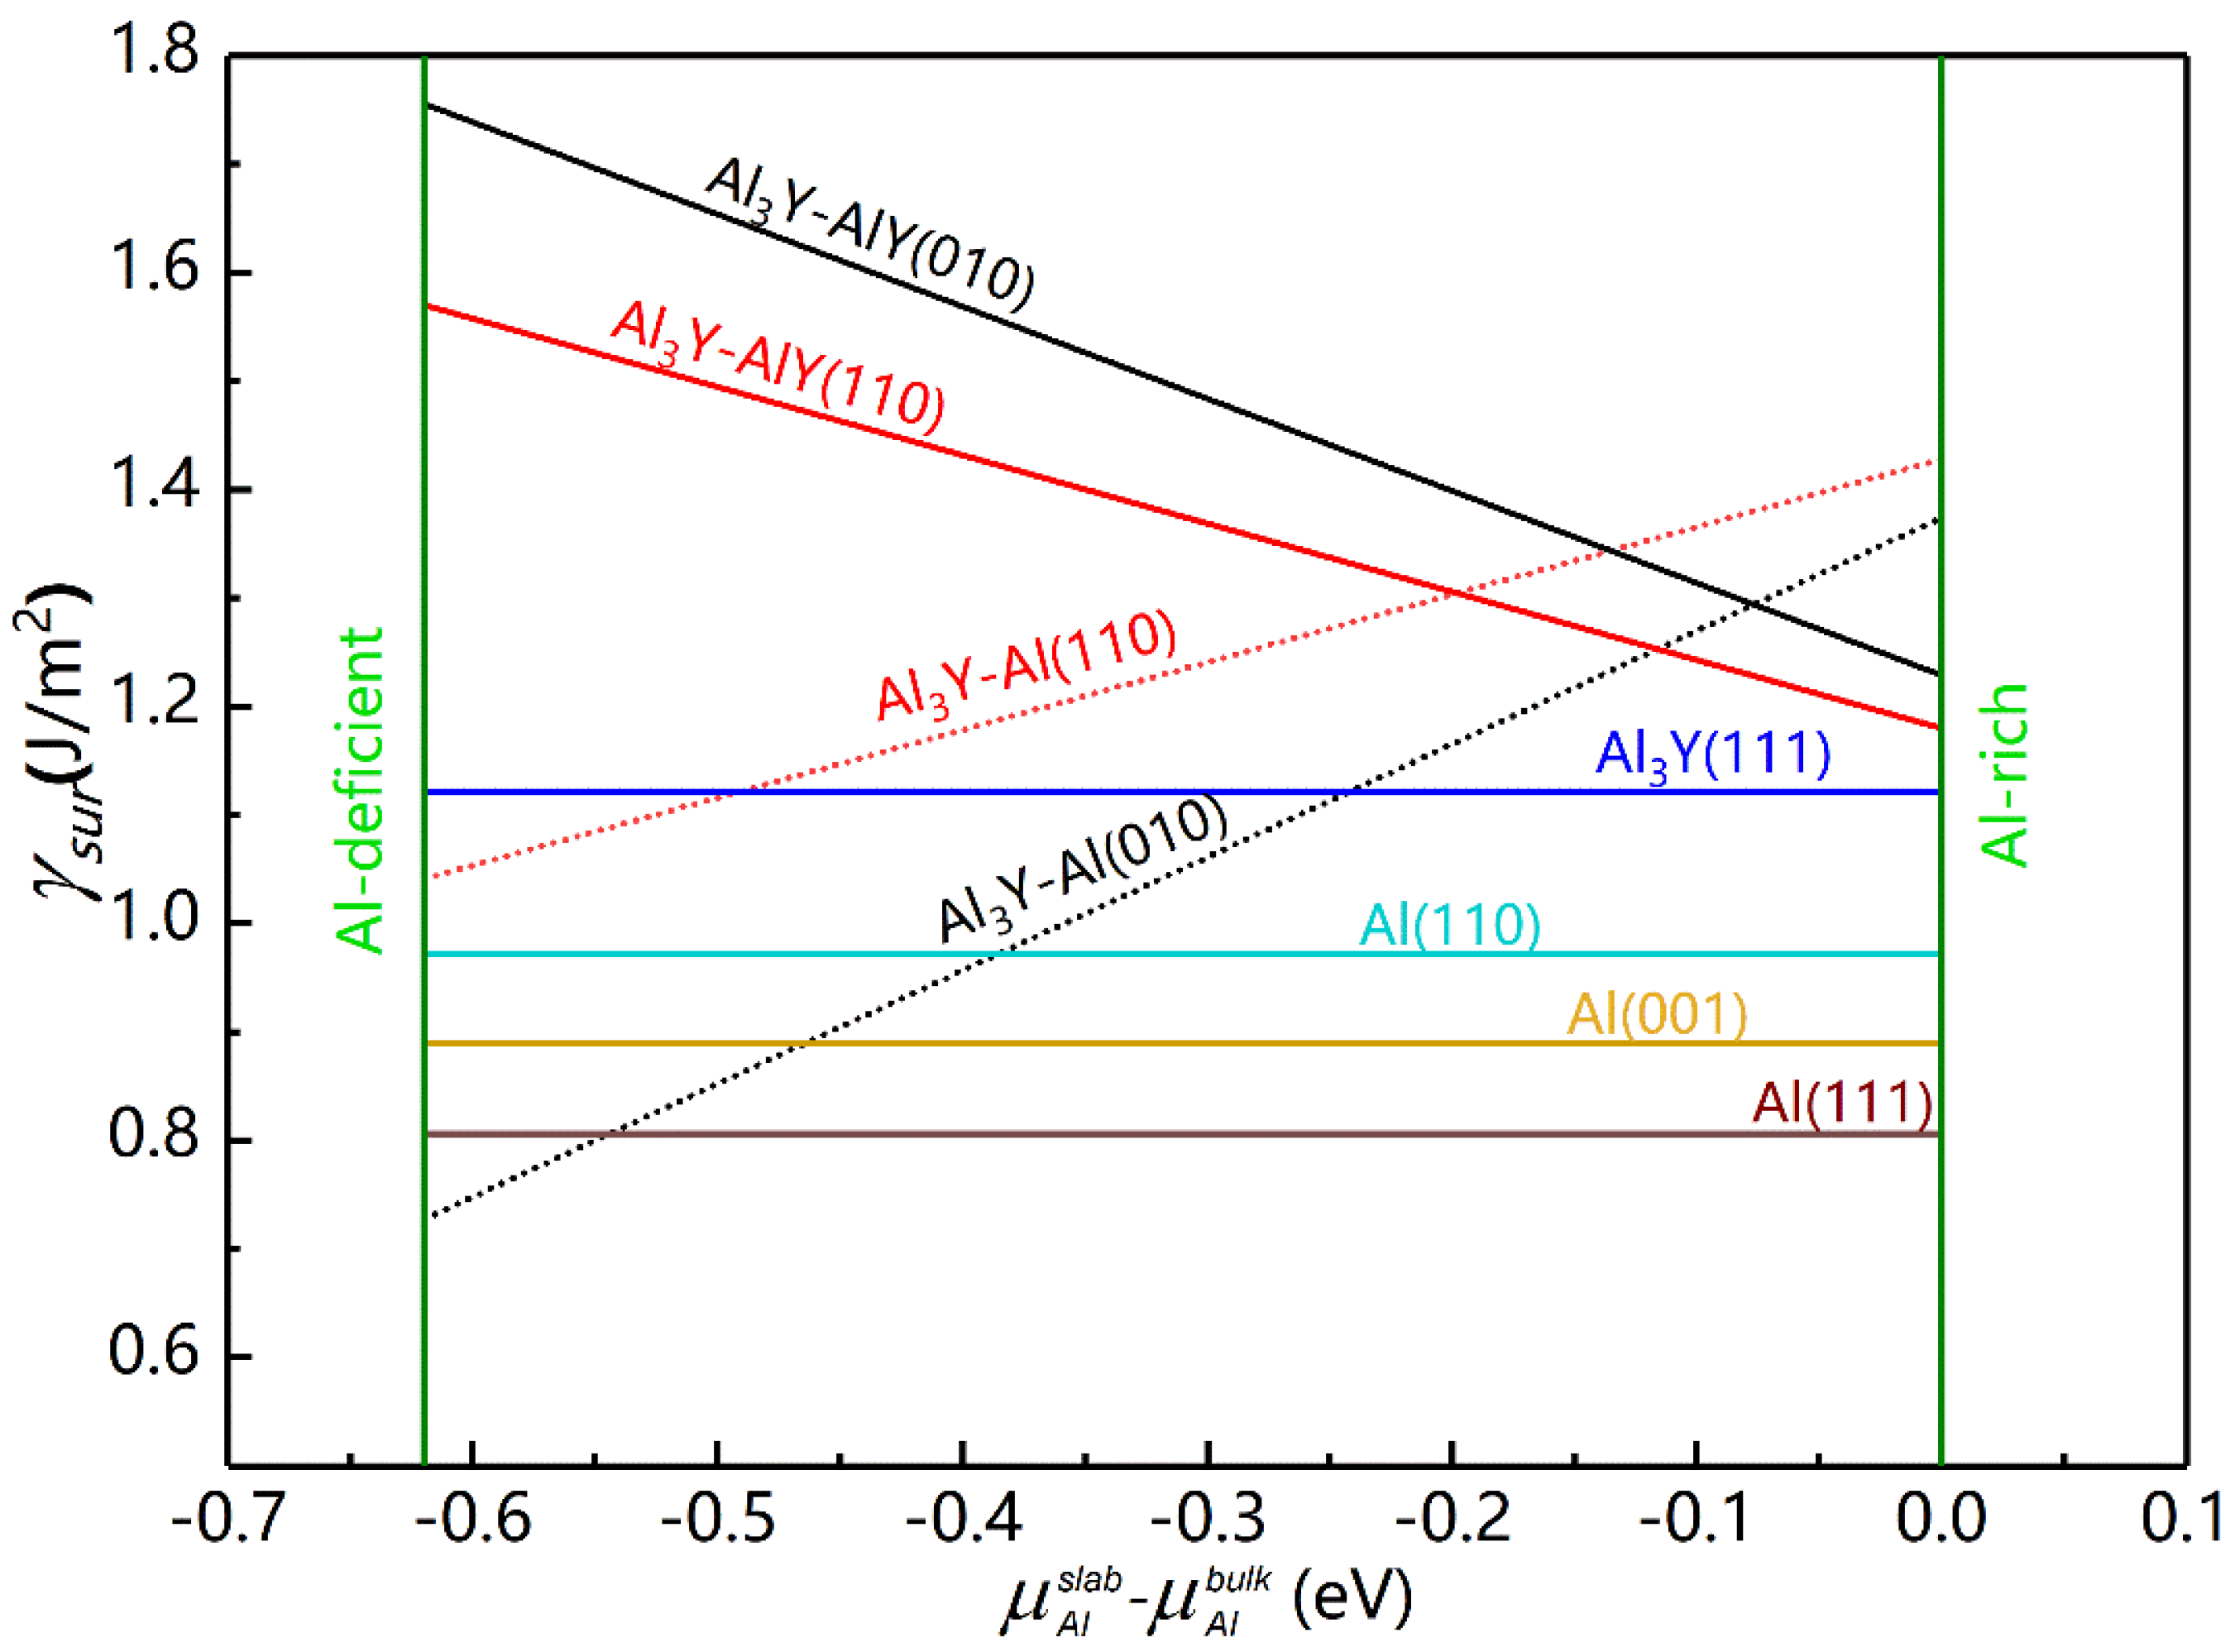
As shown in
Figure 4, the values of the
γsur for Al and Al
3Y (111) were constant and did not depend on the chemical environment, which was not the case for the (010) and (110) surfaces of Al
3Y. As the
value increased, the
γsur of Al
3Y-Al decreased, while it increased for the Al
3Y-AlY interface. Under Al-deficient conditions, the surface energies of Al
3Y adhere to the following sequence: Al
3Y-AlY(010) > Al
3Y-AlY(110) > Al
3Y(111) > Al
3Y-Al (110) > Al
3Y-Al (010); however, under the Al-rich conditions, it changes into Al
3Y-Al(110) > Al
3Y-Al(010) > Al
3Y-AlY(010) > Al
3Y-AlY(110) > Al
3Y(111). So, in the Al-rich environment, the structural stability of AlY surfaces from strong to weak is (111) > (110) > (010), which agrees well with the general rule mentioned in Ref. [
34] and shows that the (111) surface is most stable.
The
is zero because of the Al-rich ambiance at the interface. This resulted in
γsur values for the AlY surface of 1.221, 1.185 and 1.132 J/m
2 for (010), (110) and (111) surfaces. According to Equation (14) [
36,
37], we computed the appropriate interface energies (
γint) to be 0.315, 0.279, and 0.366 J/m
2, respectively.
MY, MAl,AlY, and MAl,Al indicate the amount of Y and Al atoms on the Al3Y and Al sides, respectively. The surface energy of Al and Al3Y-AlY are represented by and respectively.
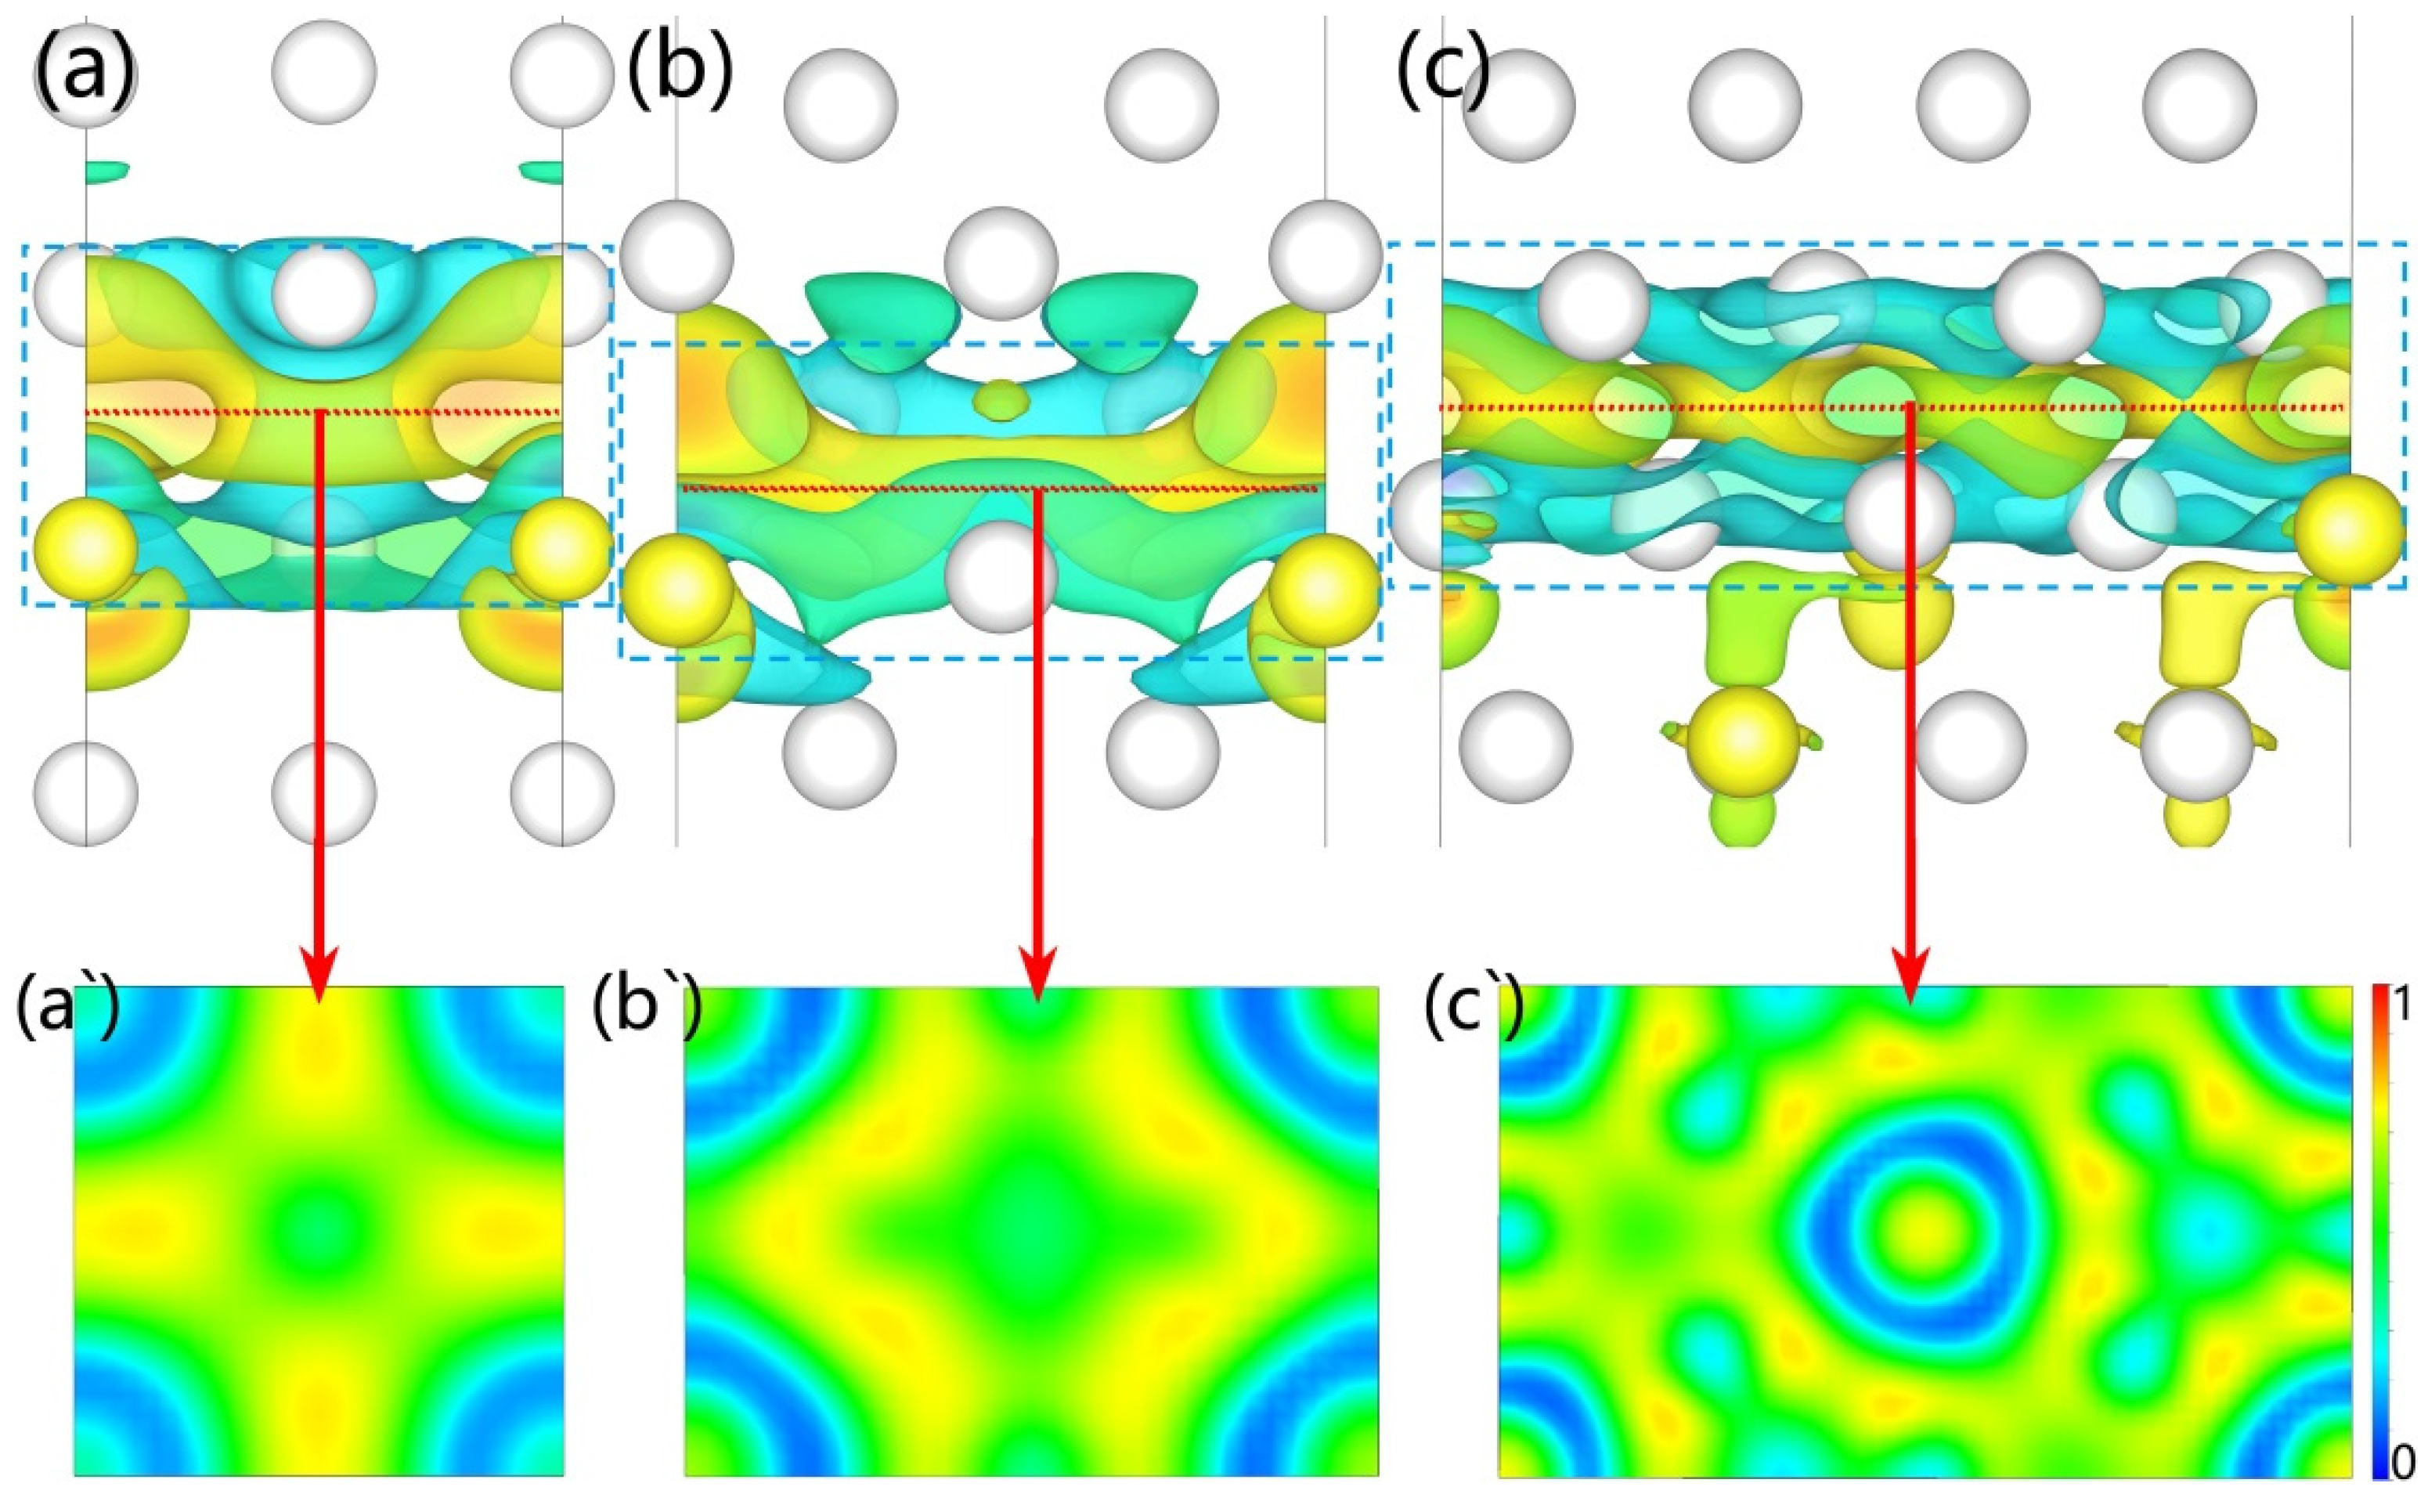
Further, we calculated electron migration according to the deformation charge density of these interfaces (see
Figure 5). The blue cloud indicates electronic decreases; however, the yellow cloud represents the opposite. The results indicate Al and Y electrons migrated to the interface to form new chemical bonds to strengthen the interface and improve its wettability. The electrons at the interfaces of Al
3Y(010)|Al(010) and Al
3Y(110)|Al(110) gather closer to the Al side, while the electron cloud for the Al
3Y(111)|Al(111) system is more evenly distributed at the center plane of the interface (see
Figure 5a–c). Then, we analyzed the type of chemical bond by calculating the electron localization functions (ELF). The value of the green part approximates 0.5 and the yellow part approximates 0.75; therefore, the formed chemical bond at the interface contains a covalent bond and metal bond. (see
Figure 5a‘–c‘).
3.4. Fracture Behavior and Toughness of The Interface
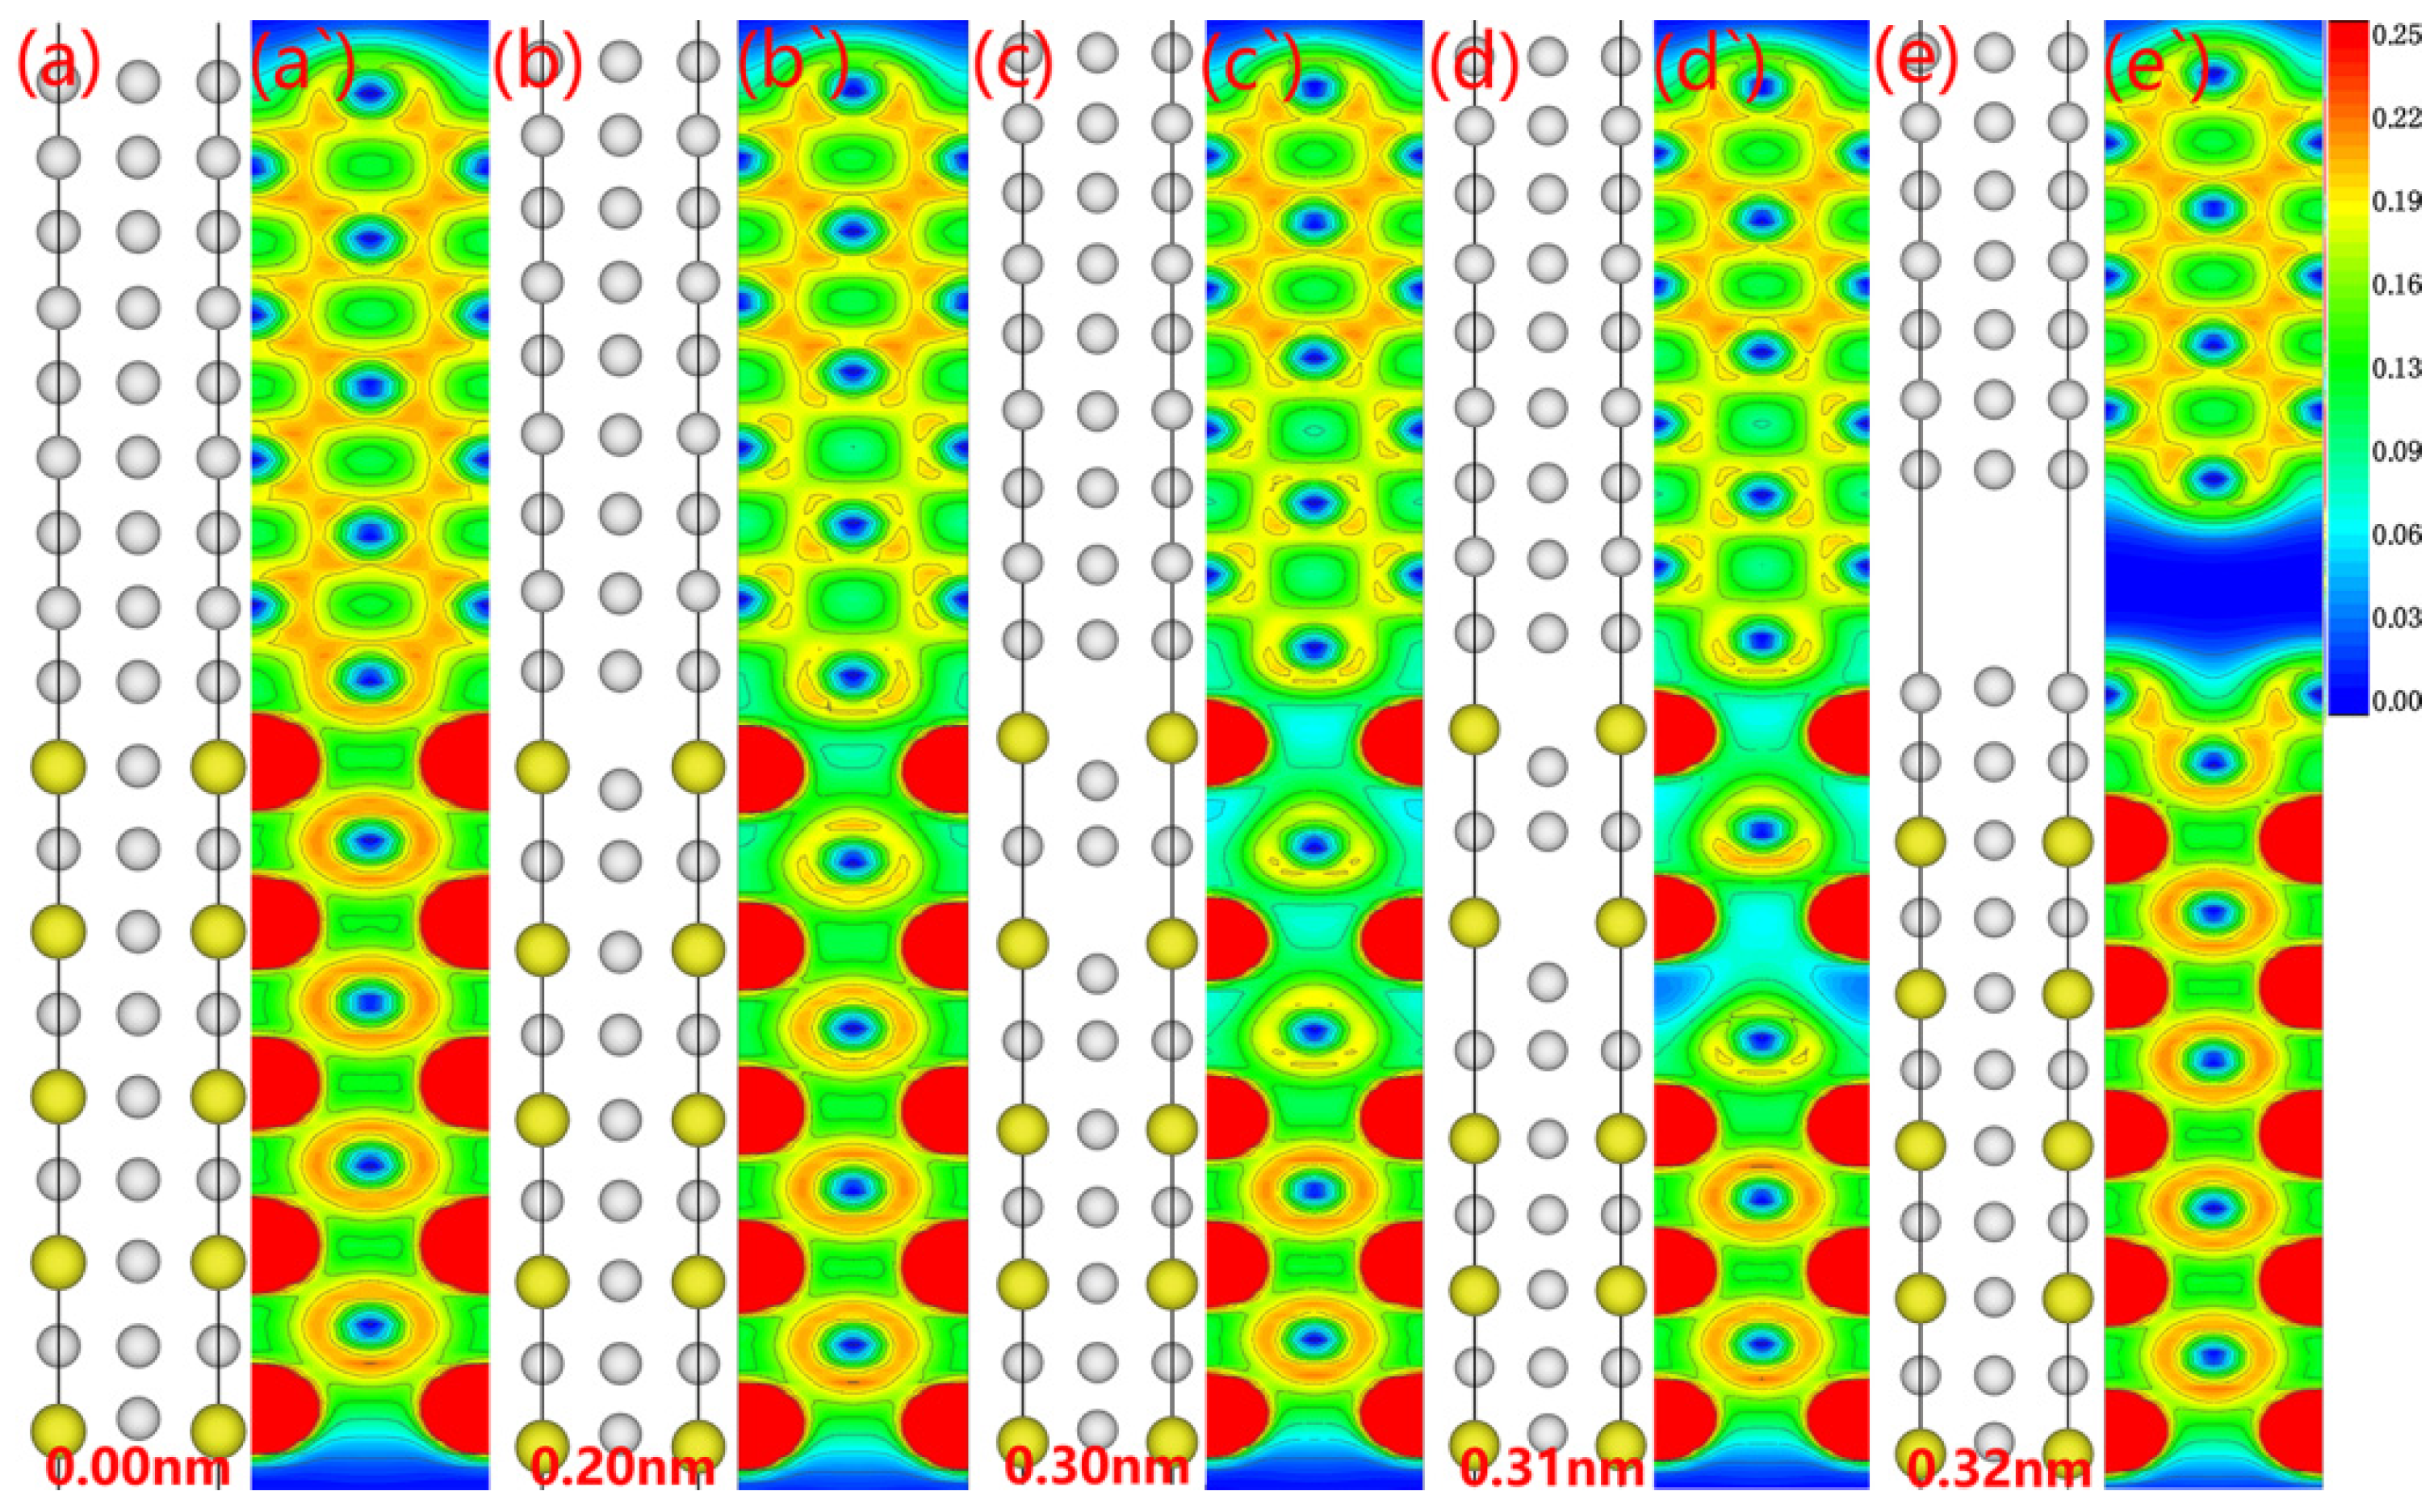
Although understanding the theoretical rigid tensile stress provides us with the tools to demonstrate interfacial strength, a deeper analysis of the interfacial fracture progression, consequently, is still needed to discover the weakest point. For this purpose, we graphed the fracture process for the Al
3Y(010)/Al(010) interface (see
Figure 9). While a bilayer of Al atoms adhered to the Al
3Y side, the fracture path was concentrated on the Al side (see
Figure 9a’–e’ for specific electronic configurations). The electron cloud density on the Al
3Y side drops due to the continuous stretching in response to the applied stress. Fractures begin to spread on the Al side as the straining proceeds.
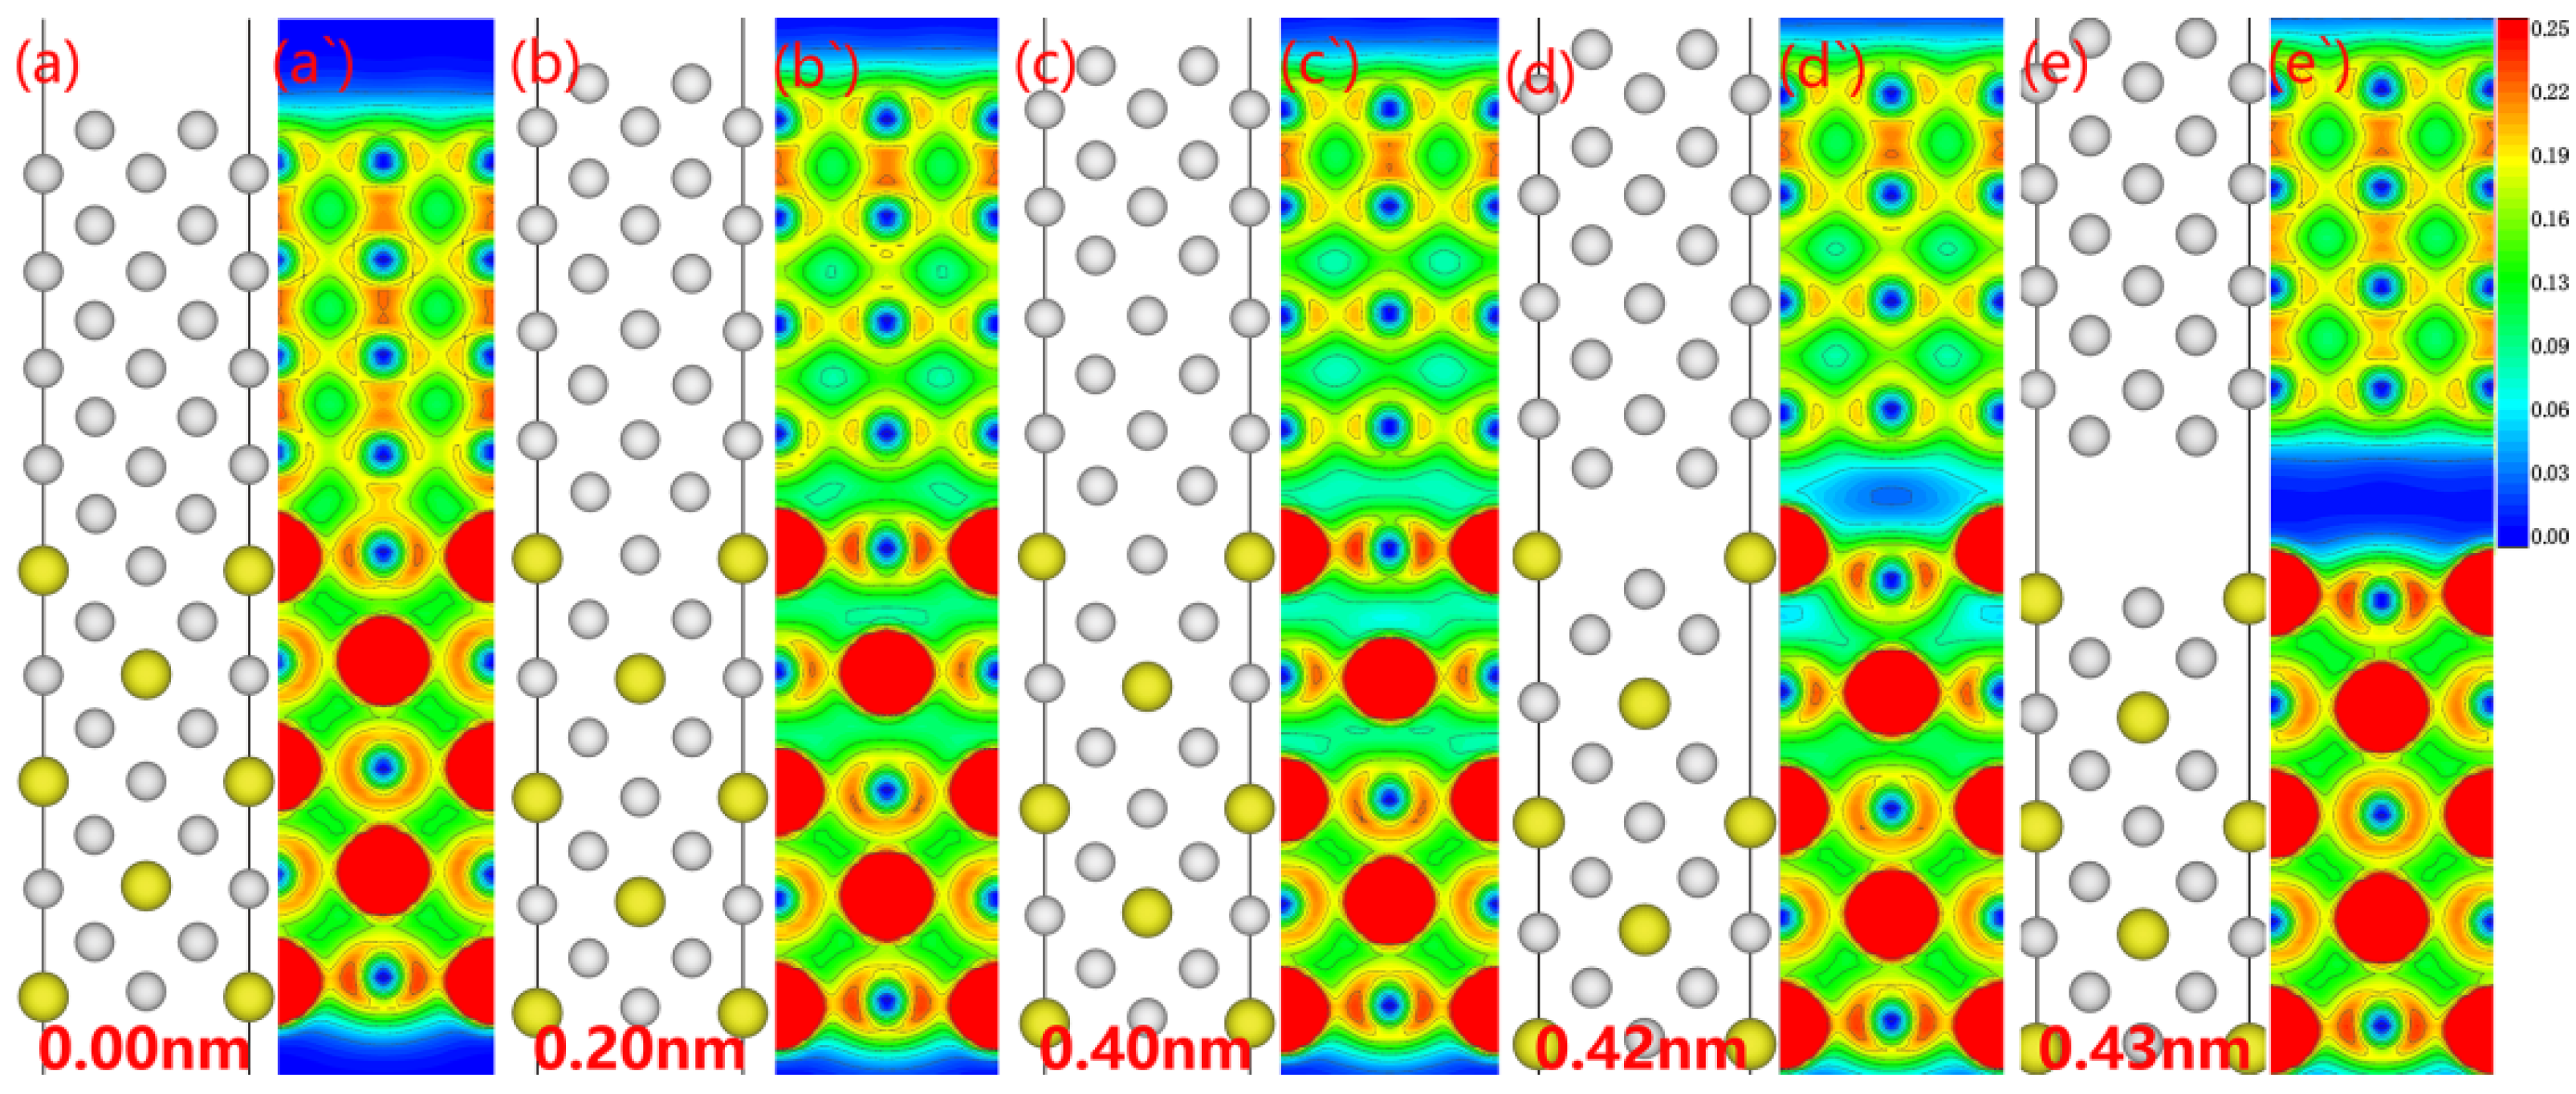
No modifications to the atom configurations were seen in the electronic alterations of the Al
3Y(110)|Al(110) interface throughout the fracture propagation as determined by the relaxation approach (see
Figure 10). During stretching, the interface electron cloud first decreases, forming electron-hole pairs at the interface. When the electronic hole cloud expands substantially, the interface breaks.
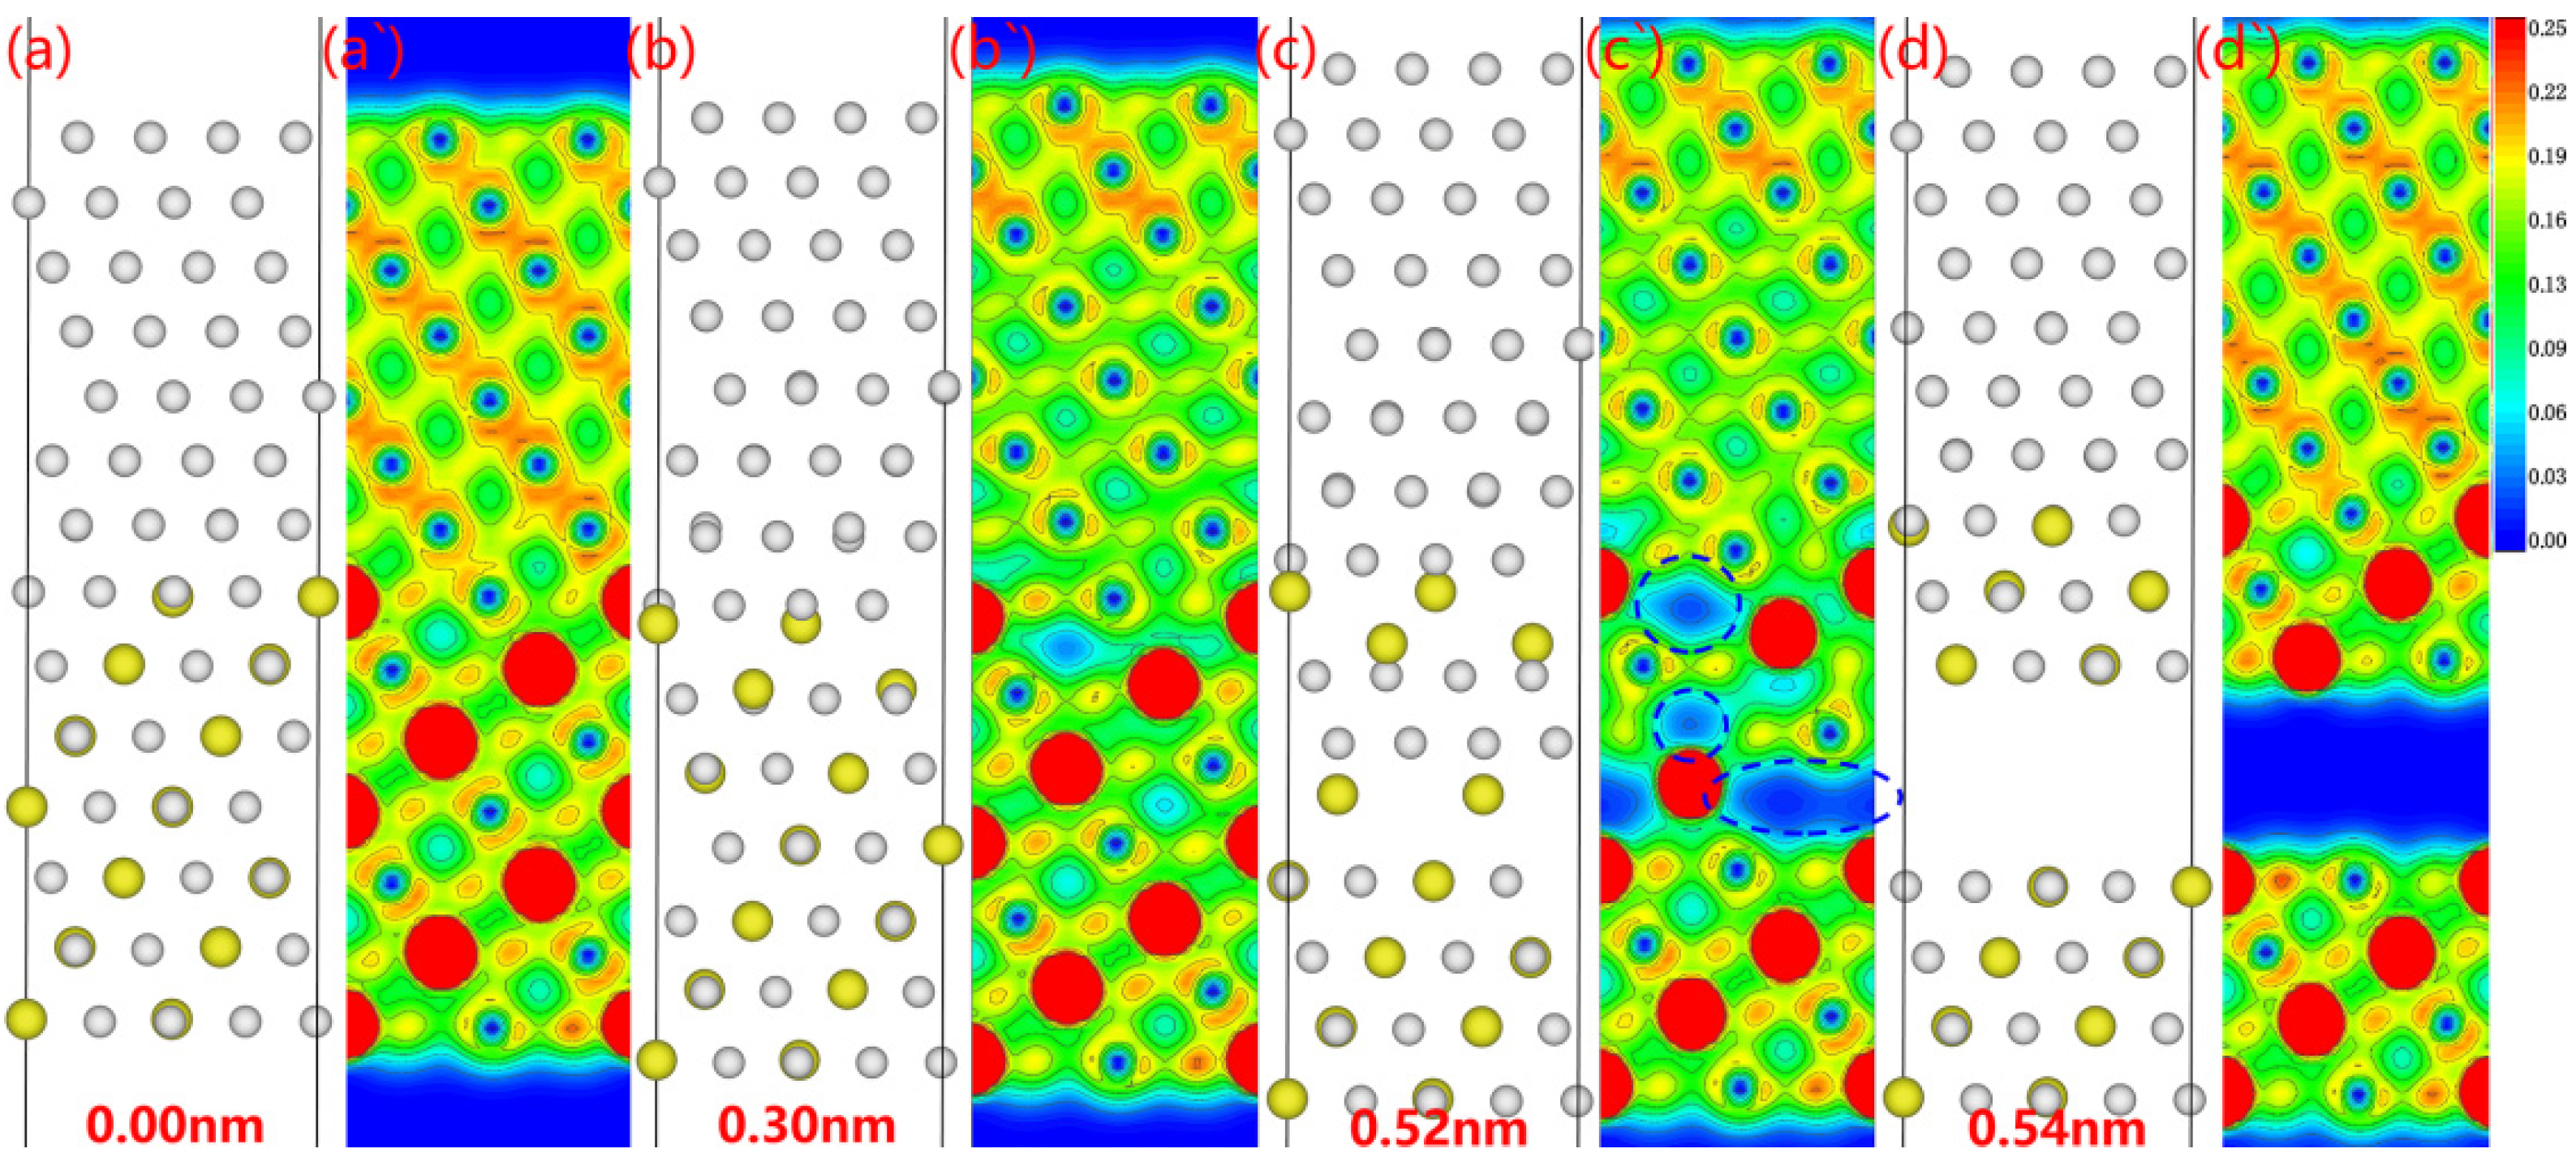
The electron density changes during the fracturing of the Al
3Y(111)|Al(111) interface obtained using the relaxation method are shown in
Figure 11. The atomic arrangement of the Al
3Y side changed significantly with the fractured surface appearing on the Al
3Y side. The electron cloud density decreases substantially in several places (see
Figure 11b). Upon continuous stretching, three of these places converted into electron holes (marked as blue dotted circles in
Figure 11). Finally, a fracture surface formed along the electron-hole between the third and fourth layers on the Al
3Y side.
Then, we calculated the separation energy and tensile stress using the relaxation method and the results are shown in
Figure 12 and
Table 6.
Combing
Figure 12b and
Table 6, we can find the Al
3Y(111)|Al(111) system has the maximum tensile stress (9.39 GPa), and the tensile stress values for Al
3Y(001)|Al(001) and Al
3Y(110)|Al(110) systems are 8.59 Gpa and 9.34 Gpa, respectively. These results indicate that the Al
3Y(111)|Al(111) system greatly improves the strength and toughness of the alloy.
To comprehend the intrinsic characteristics of the toughness of different Al|Al
3Y interfaces, we investigated the stacking fault energies (
γsf) and Rice ratios (
DR) [
38,
39,
40]. Upon applied forced and during deformation, the interfaces were expected to either form (1) interfacial cleavage or (2) dislocations to propagate the interfacial slip [
41]. It is reasonable to assume that the interfacial dislocation at critical energy (
Gd) is lower than
Wad. The maximum
γsf and critical energy (
Gd) are often equivalent. The critical energy must be overcome during the slide.
where
is the interface system’s total energy with stacking faults, and
E0 is the energy without, respectively. Therefore, the Rice ratio (
DR) can be used to determine the plasticity of the interface system. The interface exhibits plasticity unless
DR < 1, in which case the interface is brittle.
γms is the maximum
γsf.To better understand the investigated properties, we calculated two additional parameters (shear stress (
FS) and stress ratio (
SR)) according to Equations (17) and (18).
where
x is the displacement and
SS is the max value of the
FS.
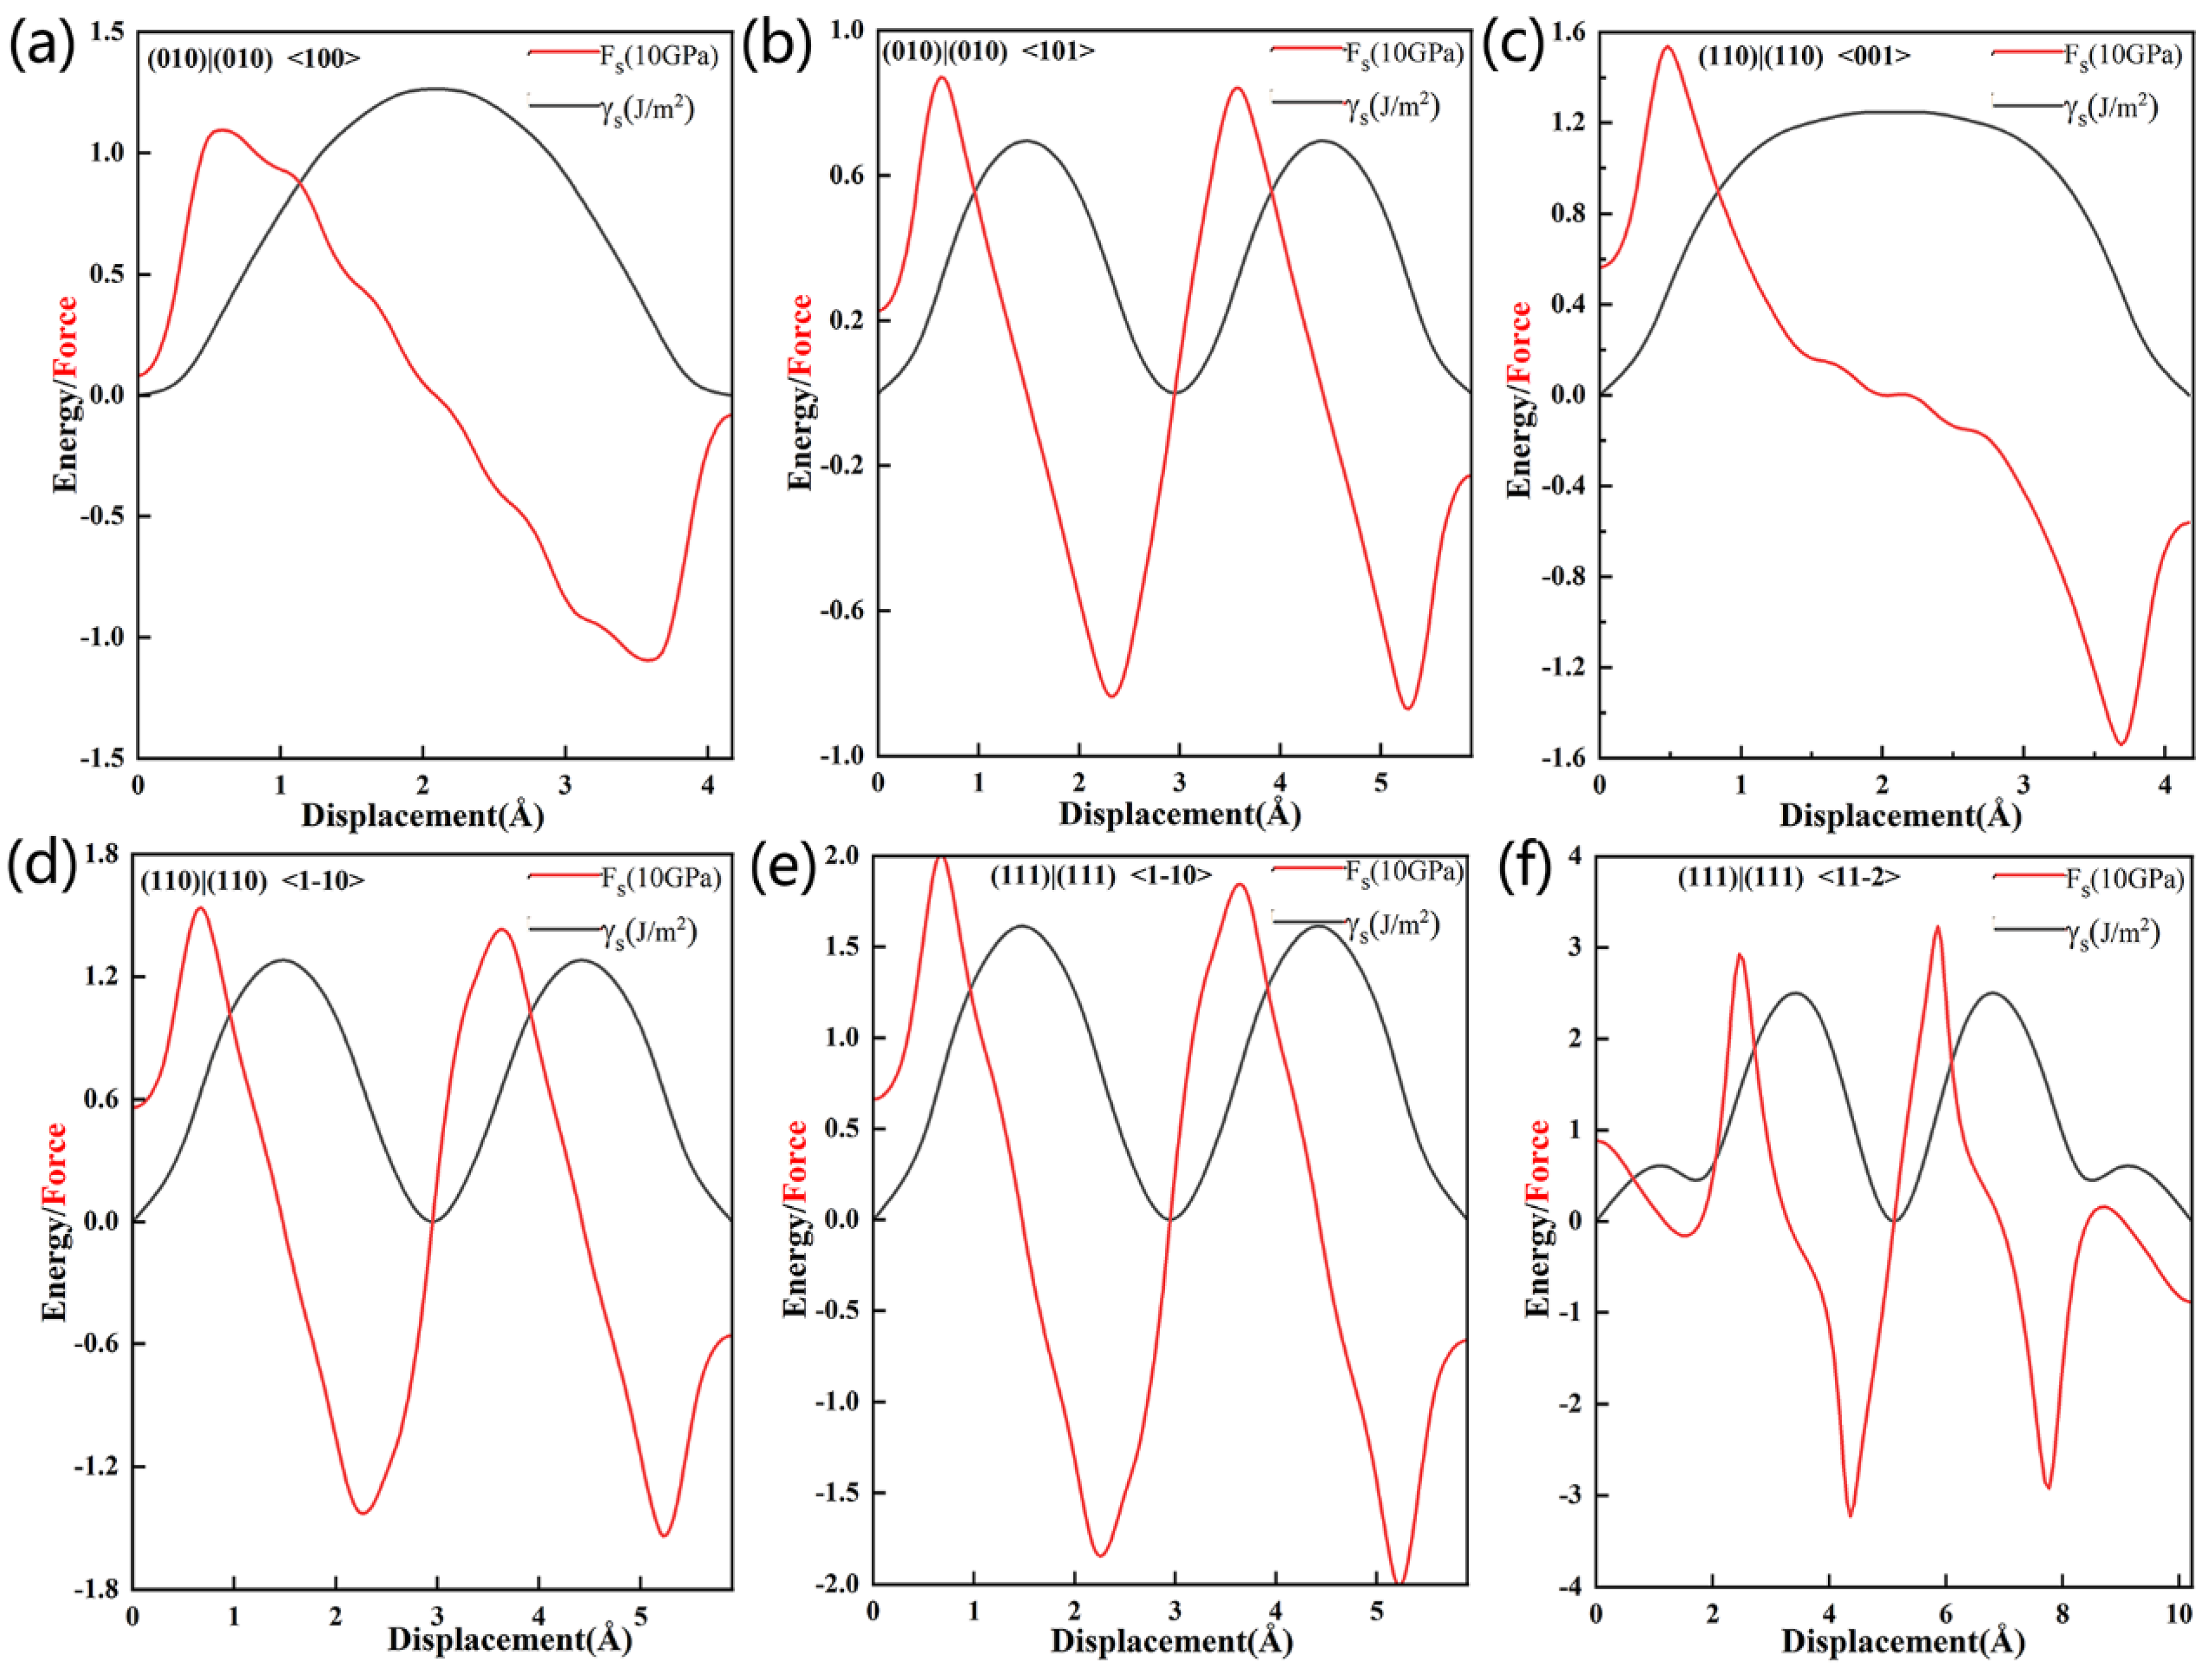
Figure 13 shows the stacking fault energies we used to define the flexibility of our surfaces, and
Table 7 summarizes
γms,
DR,
SS and
SR. When the slippage at the Al
3Y(010)|(010) interface occurs in the <100> and <101> directions,
γms and
DR will be equal to 1.26 and 0.07 J/m
2, and 1.64 and 2.95, respectively, which indicates that the higher plasticity in the <101> direction. Additionally, the S
S in <101> direction is less than that in <100>; therefore, the slippage initiation will occur more easily in the <101> direction.
γms and
DR values for the Al
3Y(110)|Al(110) interface in the <001> and <1−10> directions will be equal to 1.25 J/m
2 and 1.28 J/m
2, and 1.92 and 1.87, respectively. Similar
DR values indicate a similar toughness along the <001>and <1−10> directions, and the S
S value also supports this conclusion.
Analysis of the stacking fault energy at the Al
3Y(111)|Al(111) interface (shown in
Figure 13e,f) revealed that slippage will occur more easily in the <1−10> direction (since the corresponding max shear stress is 20.08 GPa).
All
DR values were greater than 1 (see
Table 7). Thus, slippage at the Al
3Y|Al will occur more easily than cleavage. The best plasticity (judging by the corresponding
D (equal to 3.27) and
μ/
b < 0.711) would be in the <11–2> direction. The max tensile strength of Al
3Y(010)|Al(010) is greater than the shear stress; however, the result of Al
3Y(110)|Al(110) and Al
3Y(111)|Al(111) is the opposite. Additionally, Al
3Y(111)|Al(111) has the largest shear stress in the <11−2> direction. The Al
3Y(111)|Al(111) interface is strongly recommended as it will increase the strength and improve the plasticity of Al alloys.


