Article

Optimization of Residual Stress Field and Improvement of Fatigue Properties of Thin-Walled Pipes by Filling Laser Shock Peening

Science and Technology on Plasma Dynamics Laboratory, Air Force Engineering University, Xi’an 710038, China
*
Author to whom correspondence should be addressed.
Metals 2022, 12(10), 1733; https://doi.org/10.3390/met12101733
Submission received: 29 August 2022 / Revised: 10 October 2022 / Accepted: 12 October 2022 / Published: 16 October 2022

Abstract

:
In the present work, a filling and laser shock peening (LSP) method is put forward and applied to a thin-walled pipe. Specimens were experimentally and numerically investigated to identify the residual stress field and fatigue properties of a pipe with and without LSP treatment. The numerical simulation indicated that the residual compressive stress first increased and subsequently dropped as the laser power density increased, and the extent of influence of the stretching wave, reflected from the lower surface on the unloaded area, increased with the spot diameter, causing surface tensile stress in the unloaded area. By filling the pipe with the guided-wave material, the residual stress field of the pipe that was treated with LSP was optimized, and the influence of the stress wave reflection on the residual stress field was effectively decreased. The surface residual stress of the filled guided wave material was −326 MPa, improving it by 57.6% compared with the pipe not filled with guided wave materials. The fatigue life of the pipe with the filled waveguide material that was treated by LSP was extended by 48.9%, compared with the untreated pipe.

1. Introduction

Thin-walled aero-engine pipes represent a crucial pipeline for delivering fuel, hydraulic oil, and other media to the aircraft. When a pipe splits and undergoes an oil leakage failure during a flight, this will lead to catastrophic repercussions and pose a serious threat to flight safety. Pipe cracking is a prevalent problem in aero engines, according to previous statistical fault studies [1]; the failure mode is mostly in the form of high-cycle fatigue fractures [2].
Traditional surface-strengthening technologies, such as rolling, shot peening, and other mechanical hardening methods, are difficult to utilize in parts with poor rigidity, such as thin-walled pipes, or to improve the surface roughness of pipe fittings, which affects the pipe’s sealing performance [3,4].
Laser shock peening (LSP) is a surface modification method that uses a high-energy laser beam to generate high-pressure plasma to alter the material and generate residual compressive stress on the surface and subsurface that is beneficial to the fatigue performance of the part [5,6,7,8,9,10]. Compared to the typical shot-peening procedure, the residual compressive stress layer that is generated has significant depth and has little influence on surface roughness [7,8,9]. Residual compressive stress can enhance the fracture initiation and propagation limits, as well as increase the component’s fatigue resistance [9,10,11,12,13]. The use of LSP technology in aircraft pipes was investigated on the basis of these properties of LSP. For example, Rodopoulos et al. [14] investigated the effect of controlled shot peening and laser shock peening on the fatigue performance of a 2024-T351 aluminum alloy. Tests showed a fatigue life improvement with laser shock peening that was superior to shot peening. Granados-Alejo et al. [15] investigated the influence of specimen thickness on fatigue crack initiation in 2205 duplex stainless-steel notched specimens that were subjected to LSP. A fatigue life extension of up to 300% was observed on thin specimens with the use of LSP. Nalla et al. [16] investigated the effect of LSP on the fatigue behavior of Ti–6Al–4V; it was shown that the near-surface microstructures, which consist of a layer of work-hardened nanoscale grains of Ti–6Al–4V, play a critical role in the enhancement of fatigue life by LSP. Xiaotai Feng et al. [17] investigated the high-cycle fatigue performance of gas tungsten arc-welded Ti–6Al–4V titanium alloy using warm laser shock peening; a significant 42.3% increase in high-cycle vibration fatigue limit was achieved.
However, there are several laser-loading parameters to select, and the effort of process testing is large. Numerical simulation can reduce the process-test workload and optimize residual stress control when using LSP. In 1999, Braisted and Brockman [18] investigated the finite element simulation approach of LSP for the first time. When combined with the experimental data, it was shown that a finite element simulation could estimate the residual stress of LSP. Hu [19] employed the numerical modeling approach to investigate the technological process of LSP in depth. The effectiveness of the numerical simulation method of LSP was verified by the experimental measurements of the residual stress field of lap impact. Using numerical simulation, many scholars have studied the LSP of curved surfaces or thin-walled components. Yang et al. [20] used finite element simulation to investigate the geometric effect of residual stress on a 7050-T7451 aluminum alloy rod using LSP; the findings revealed that the geometric effect of a curved surface has a significant impact on the residual stress field. Vasu et al. [21] examined the impact of curvature on residual stress in a two-dimensional model and bottomless reflection. It was discovered that, compared with flat components, increasing the curvature radius of the concave model decreased the compressive residual stress in components, while increasing the curvature of the convex model increased the compressive residual stress in materials. Ivetic [22] investigated the influence of input parameters and boundary conditions on final residual stress and in-depth distribution in a thin LSP-treated specimen. It was discovered that increasing the power density did not bring any advantages due to shock reflections in a configuration without bottom-placed damping material. Cellard et al. [23] investigated the influence of LSP process parameters on Ti-17 titanium alloy. It was discovered that residual tensile stress occurred on the surface of thin-walled parts after LSP. Shi et al. [24] investigated the fatigue strength of a 3 mm thin-walled Ti–6A1–4V alloy plate that was strengthened by laser shock peening. It was discovered that the fatigue strength was enhanced by 19.82%.
However, the propagation law of the stress wave in a thin, curved wall is still unclear, and the methods of enhancing LSP for thin-walled pipes are limited. Improving the fatigue performance of thin-walled pipes, which are widely used in aero engines, is of great significance in terms of aircraft safety. ABAQUS software was used in this research to conduct a numerical simulation of stainless-steel thin-walled pipes that were treated using LSP. The propagation law of shock waves and the effects of power density, spot size, and guided wave material filling on the stress field were investigated. A filling LSP method was applied to the thin-walled pipes. Lastly, the surface residual stress field and fatigue property of thin-walled pipes treated using LSP were tested.

2. Materials and Methods

2.1. Experimental Materials

An aircraft 1Cr–18Ni–10Ti stainless-steel hydraulic thin-walled pipe was selected for the experiment, as shown in Figure 1. The diameter of the pipe was 8 mm, and the wall thickness was 0.8 mm. The mechanical characteristics of stainless steel, referring to GB/T 3280-2007 “cold rolled stainless steel plate, sheet and strip”, are shown in Table 1. ρ is the density of the material, σ is the tensile strength, σ0.2 is the yield strength, E is the elastic modulus, and ν is the Poisson’s ratio.

2.2. Experiment

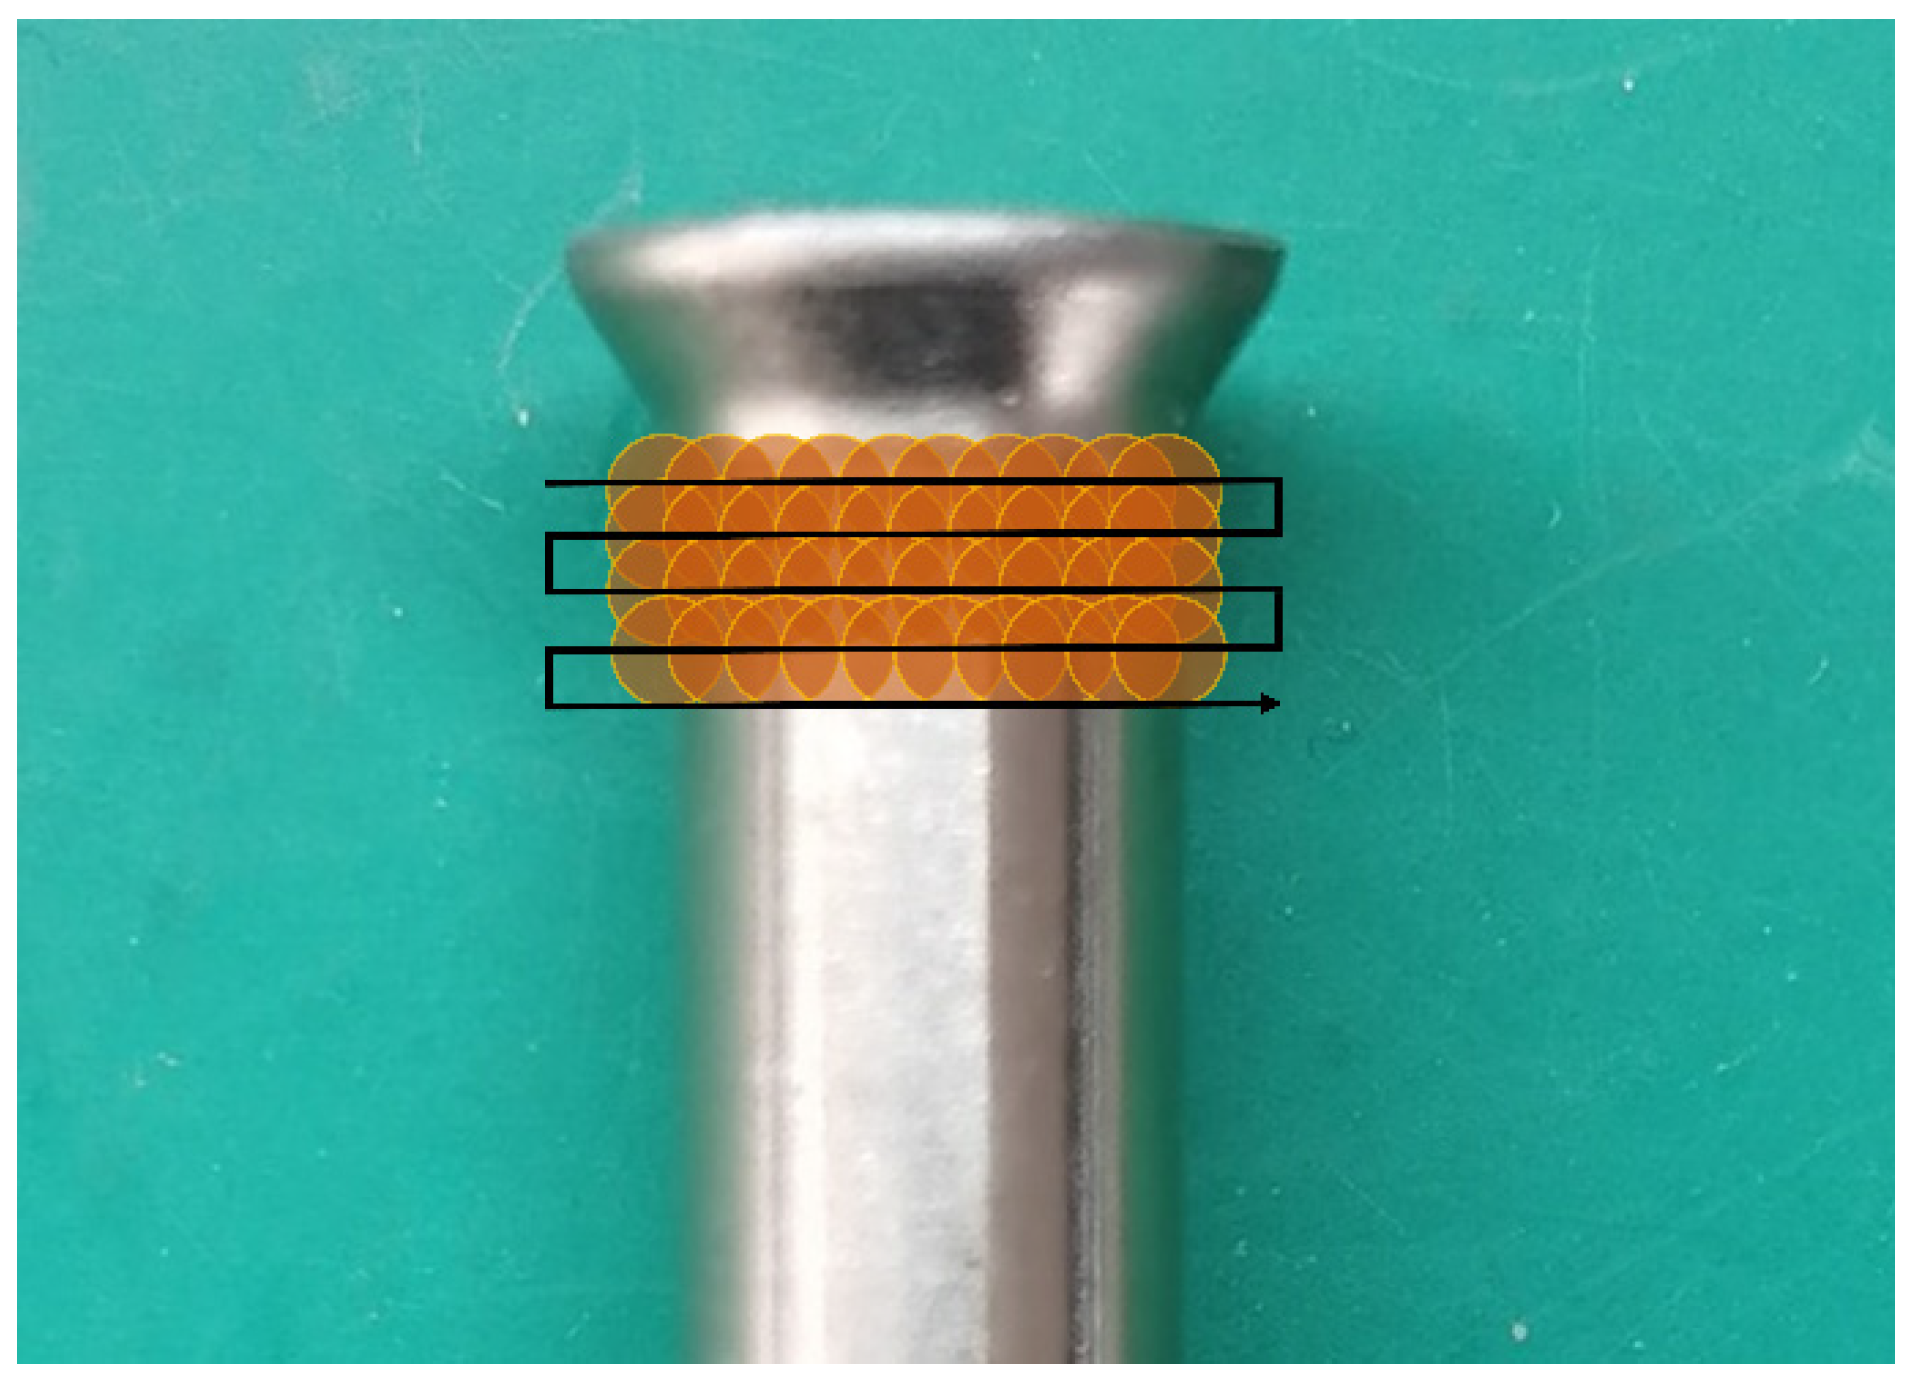
The yd60-r200b LSP equipment manufactured by the Tyrida Optic Electric Technology (Xi’an, China) company was used in the experiment. The pulse was 20 ns, the wavelength was 1064 nm, and the repetition was 1.5 Hz. Laser parameters were set to 3 J of energy and a 1.1 mm spot diameter for the LSP. The scanning route was a zigzag laser path, and the light-spot overlap rate was 50%, as shown in Figure 2.
The acoustic impedance of the laser shock wave in a single medium is the same, and there is no reflected wave. When a laser shock wave propagates from one medium to another, due to the change in the acoustic impedance of the medium, a refracted wave is generated and the propagation direction of the laser shock wave also changes. Therefore, it is necessary to configure the material with the same acoustic impedance as the conduit; the material impedance-matching formula is as follows:
Z = Z 1 Z 2 c o s k 2 l + i Z 1 c o s k 1 l Z 1 c o s k 1 l + i Z 2 c o s k 2 l ,
where Z1 is the acoustic impedance in the pipe, Z2 is the acoustic impedance in the air, l is the medium distance, k1 is the incidence angle from the pipe to the filling materials, k2 is the incidence angle from the filling materials to the air, and i is the imaginary component.
The following materials were mixed and cured to make the waveguide body: copper powder, titanium powder, nickel powder, tungsten powder, polyamide resin, epoxy resin, acetone, and graphene, in the ratio of 5:5:14:6:2:3:5:10.
To ensure that the filled guided-wave body fitted closely with the inner wall of the catheter, the air between the guided-wave body and the inner wall was eliminated, and the guided-wave body material could be removed more easily at a later date. Before filling with the guided-wave body material, the inner wall of the pipe was coated with a coupling agent; a medical coupling agent is generally used. Then, the uniform guided-wave material was quickly filled into the thin-walled pipe and was fully solidified in the pipe before use.

2.3. Measurements

The residual stress test and rotational bending fatigue test were performed on the thin-walled pipe to evaluate the distribution of residual stress and fatigue performance after LSP, and the fractures were observed using SEM.
For residual stress testing, a Canadian PROTO-LXRD residual stress tester manufactured by the Proto Manufacturing Ltd. (Canada)was employed. The target head used was a Mn target head, the direction of the diffraction plane was {211}, the diffraction angle was 152°, and the K filter was Cr. The diffraction spot was a circular spot of 1 mm in diameter. The equipment’s operational voltage was 20 kV, and the current was 25 mA.
The rotary bending fatigue test was based on the HB6442-1990 standard, “Bending fatigue test of aircraft hydraulic pipes and connectors”. The rotation speed was set to 2160 r/min.
The fracture was observed using a ZEISS-Sigma-500 tungsten filament SEM manufactured by the Carl Zeiss AG (Oberkochen, Germany).

2.4. Numerical Simulation Model of Pipe

The LSP numerical simulation was separated into two parts: the dynamic plastic deformation of the material during impact, and the static rebound after impact. The dynamic calculation findings were reset to the original conditions of static analysis. To determine the stress distribution according to the internal stability of the material, the dynamic calculation of laser shock-wave loading was performed using ABAQUS/explicit (ABAQUS2020, Dassault, France), and the static analysis was performed using ABAQUS/standard (ABAQUS2020, Dassault, France) [25]. Previous researchers [26] developed a continuous and explicit dynamic impact simulation approach, wherein the implicit analysis in the traditional analysis method was replaced by explicit analysis over an extended time. The continuous display, dynamic impact simulation approach was employed for computation in this work.
Under the impact of a laser shock wave, materials experience ultrahigh-strain-rate dynamic plastic deformation. The J–C constitutive model is a macro-empirical constitutive model that is commonly used to characterize the material’s response under dynamic loads such as impact and explosion [27]. The J–C model is the most widely used constitutive model for LSP simulation [28,29,30]. This study employed the J–C model for numerical simulation, and its constitutive model is expressed as follows:
σ y = ( A + B ε n ) ( 1 + C l n ε * ) [ 1 ( t * ) m ] ,
where σy is the flow stress, ε represents the corresponding plastic strain, ε* = ε/ε0 is the dimensionless plastic strain rate, t* = (tt0)/(tmt0) is the dimensionless temperature, t0 is the ambient temperature, and tm is the melting point. The initial yield stress is represented by parameter A, while the strain hardening modulus and hardening index are represented by parameters B and n. C is the strain rate strengthening parameter, while m is the thermal softening index. Table 2 provides the stainless-steel J–C model parameters [31,32].
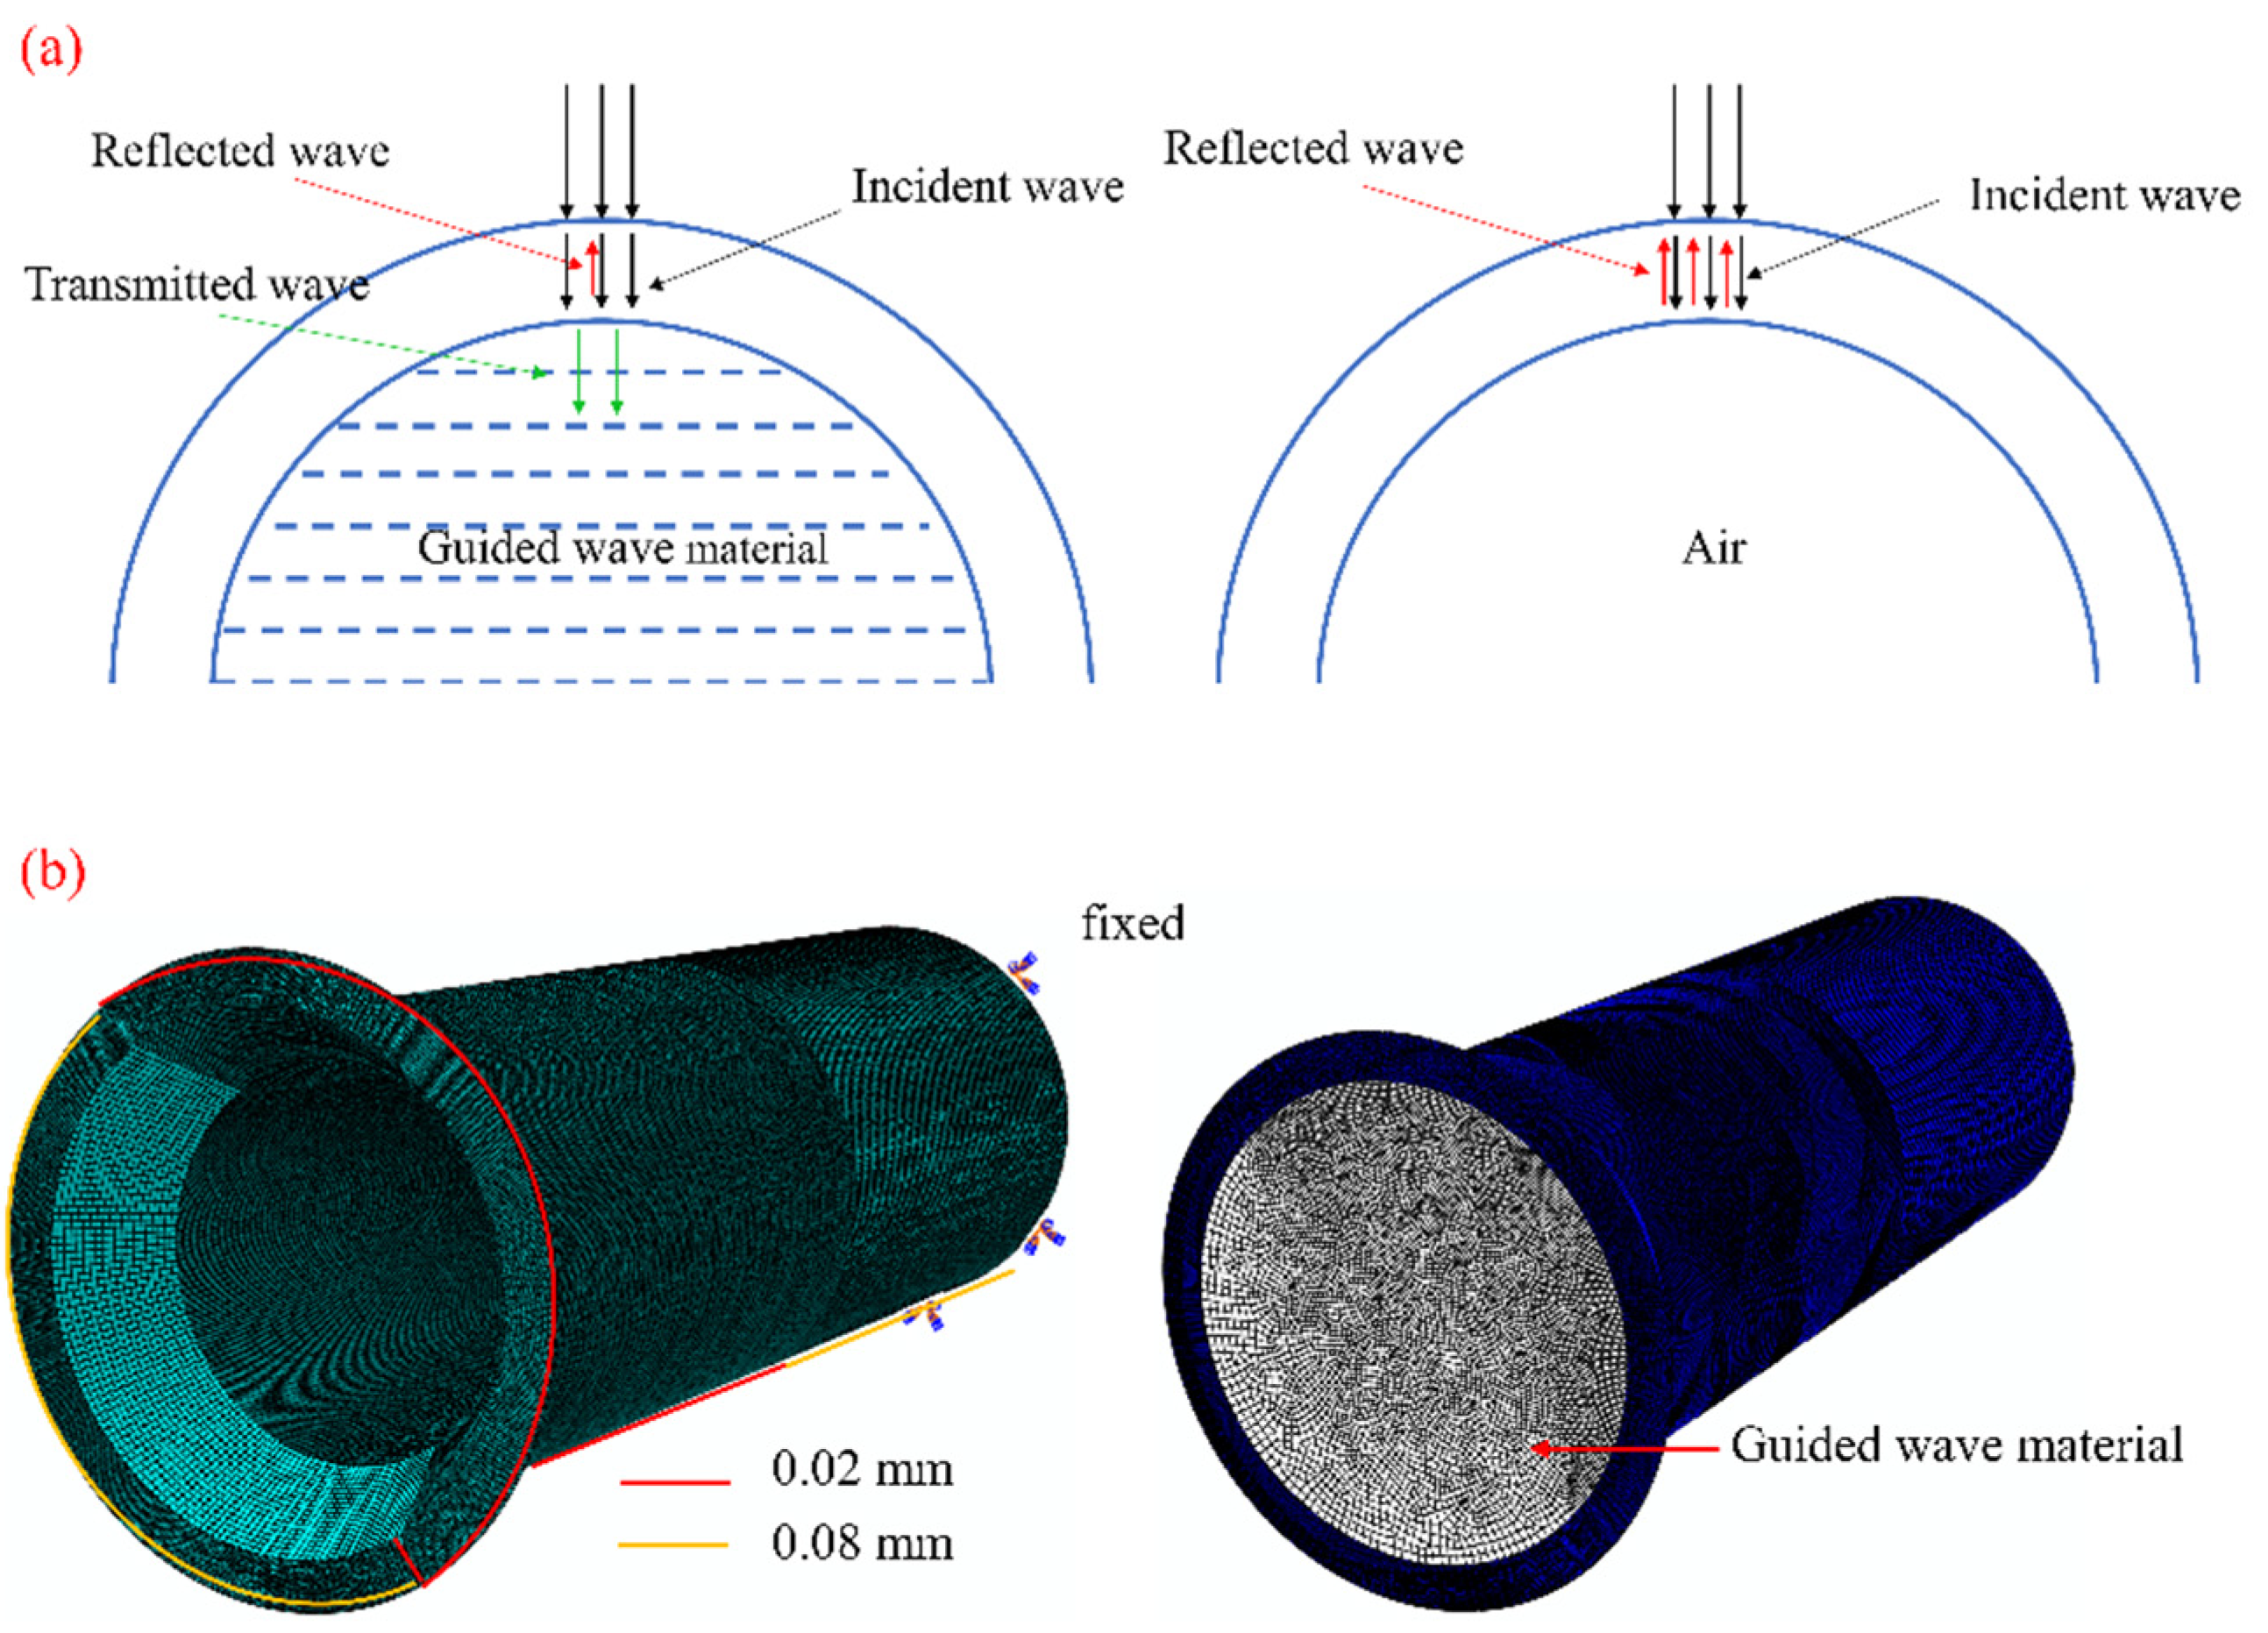
Because the stress wave is reflected and coupled several times within the thin-walled part to generate a complicated wave system, the effect of LSP is also influenced by the stress wave. As a result, the elastomer-guided wave material was filled in the pipe to lessen the negative effect induced by stress wave reflection. Figure 3 depicts a schematic model of the shock wave propagation of LSP when packed with guided-wave material (a). To lower the interface’s reflected acoustic impedance, the material should have qualities comparable to stainless steel. The guided wave material in the simulation was specified to be an elastomer with the same density, elastic modulus, and Poisson’s ratio as stainless steel, and the parameter values are provided in Table 3.
The model of the stainless-steel pipe was 20 mm in length, 0.8 mm in thickness, and 8.0 mm in outer diameter. Figure 3b depicts the grid and boundary conditions. The C3D8R finite element grid was used. The loading area grid size was 0.02 mm, the non-loading area grid size was 0.08 mm, and the number of grid cells was 4.63 million.

2.5. Laser Impact Parameters

The loading process of LSP was simplified according to Fabbro’s theory [33]; the process is equal to a mechanical wave operating on the material surface, and its peak pressure Pmax can be calculated as follows:
p m a x = 0.01 2 α 3 ( 2 α + 3 ) Z β I ,
2 Z = 1 Z 1 + 1 Z 2 ,
I = E τ π r 2 ,
where α is the internal energy thermal energy conversion coefficient, with a value range of 0.10–0.15, Z is the reduced acoustic impedance, which depends on the target acoustic impedance Z1 and the acoustic impedance Z2 of the constraint layer, where impedance Z = 0.9 × 10⁶ g(cm2·s)−1, I is the laser power density, β is the absorption rate, where the binding layer is a black tape and the rate is 0.87, E is the laser energy, τ is the pulse width, and r is the spot diameter.
Only when the peak pressure of the laser shock wave exceeds the material’s Hugoniot elastic limit can the material create persistent plastic deformation and residual compressive stress on the surface and within it. According to Johnson’s research, LSP has the greatest effect when P = 2–2.5 σHEL [34]. Because stainless steel’s dynamic elastic limit σHEL is 1.6 GPa, the ideal range of the shock wave pressure peak is 3.2 to 4 GPa.
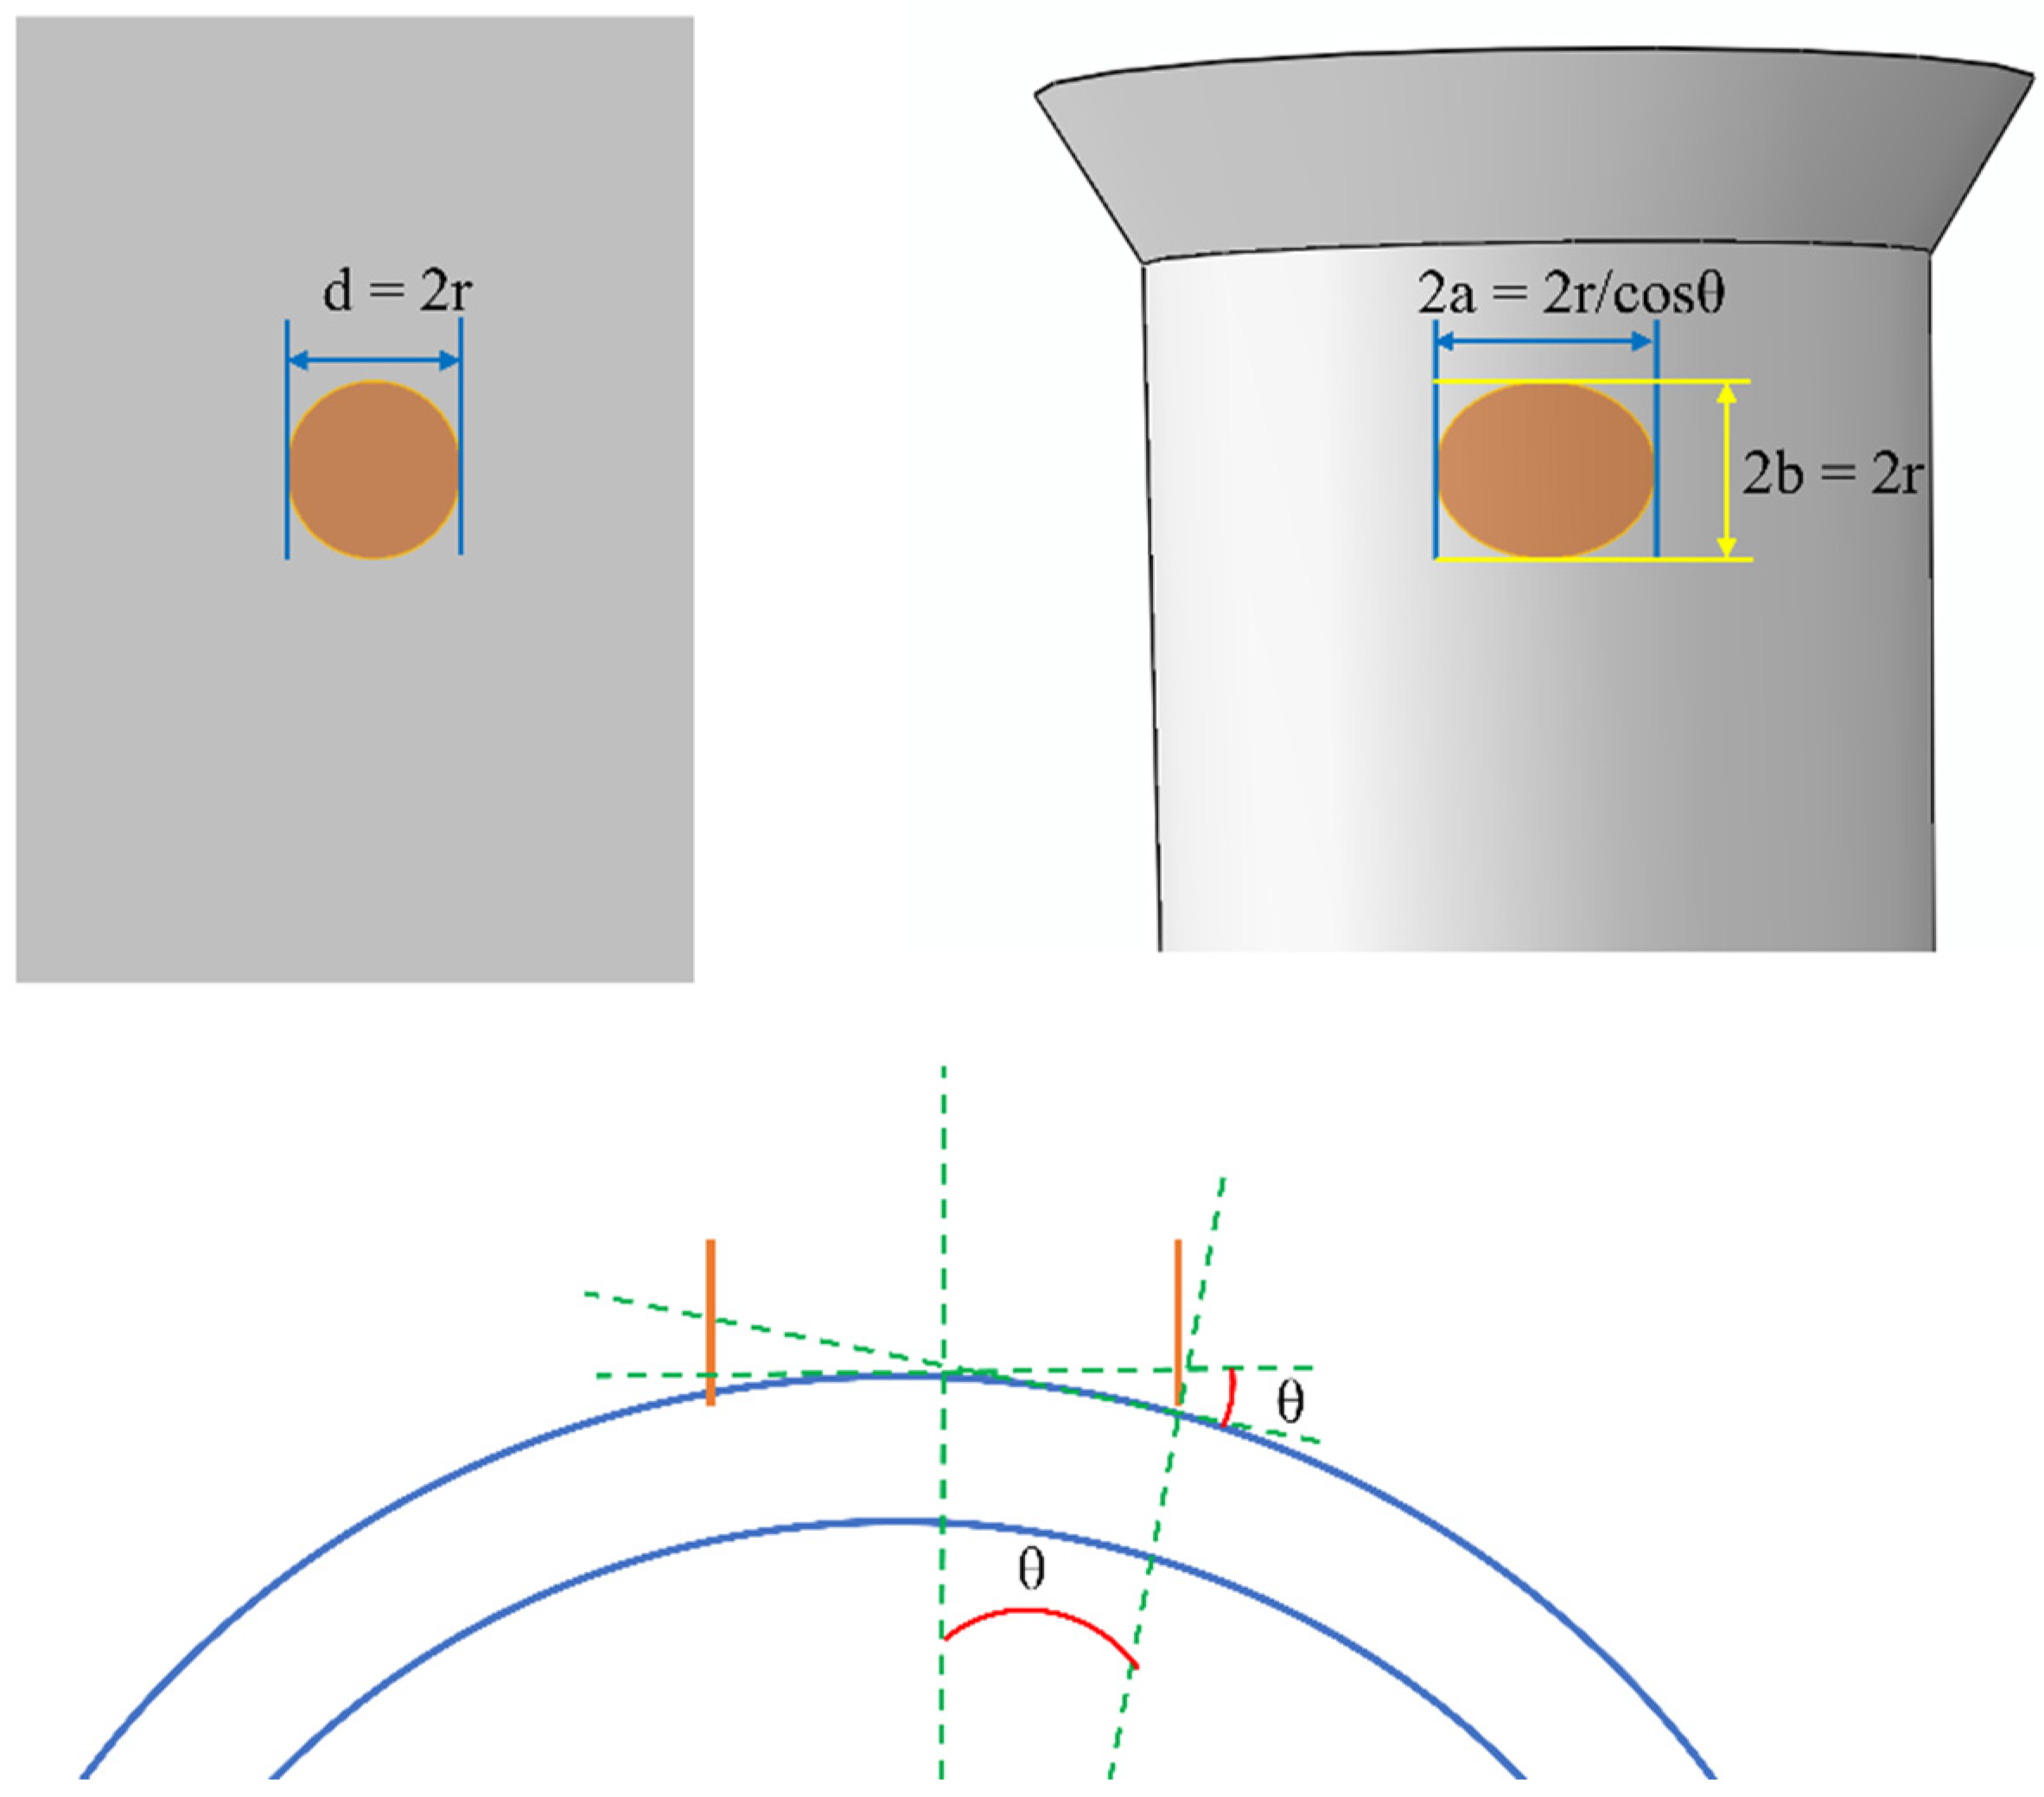
The laser causes geometric distortion on the curved surface, elongating the projection shape of the laser spot into an ellipse on the curved surface. Figure 4 is a schematic diagram of the spot distortion. When the same laser parameters are used, the laser energy, acting via a single pulse, remains constant, resulting in variations in the real laser power density. According to the principle of equal energy, the power density calculation formula is modified as follows:
I c u r v y = I f l a t π r 2 π a b = I f l a t cos θ ,
where a is the major axis radius and b is the minor axis radius of the elliptical spot (a = r/cosθ, and b = r), and θ is the angle between the “edge normal” of the spot and the “center normal” of the spot.
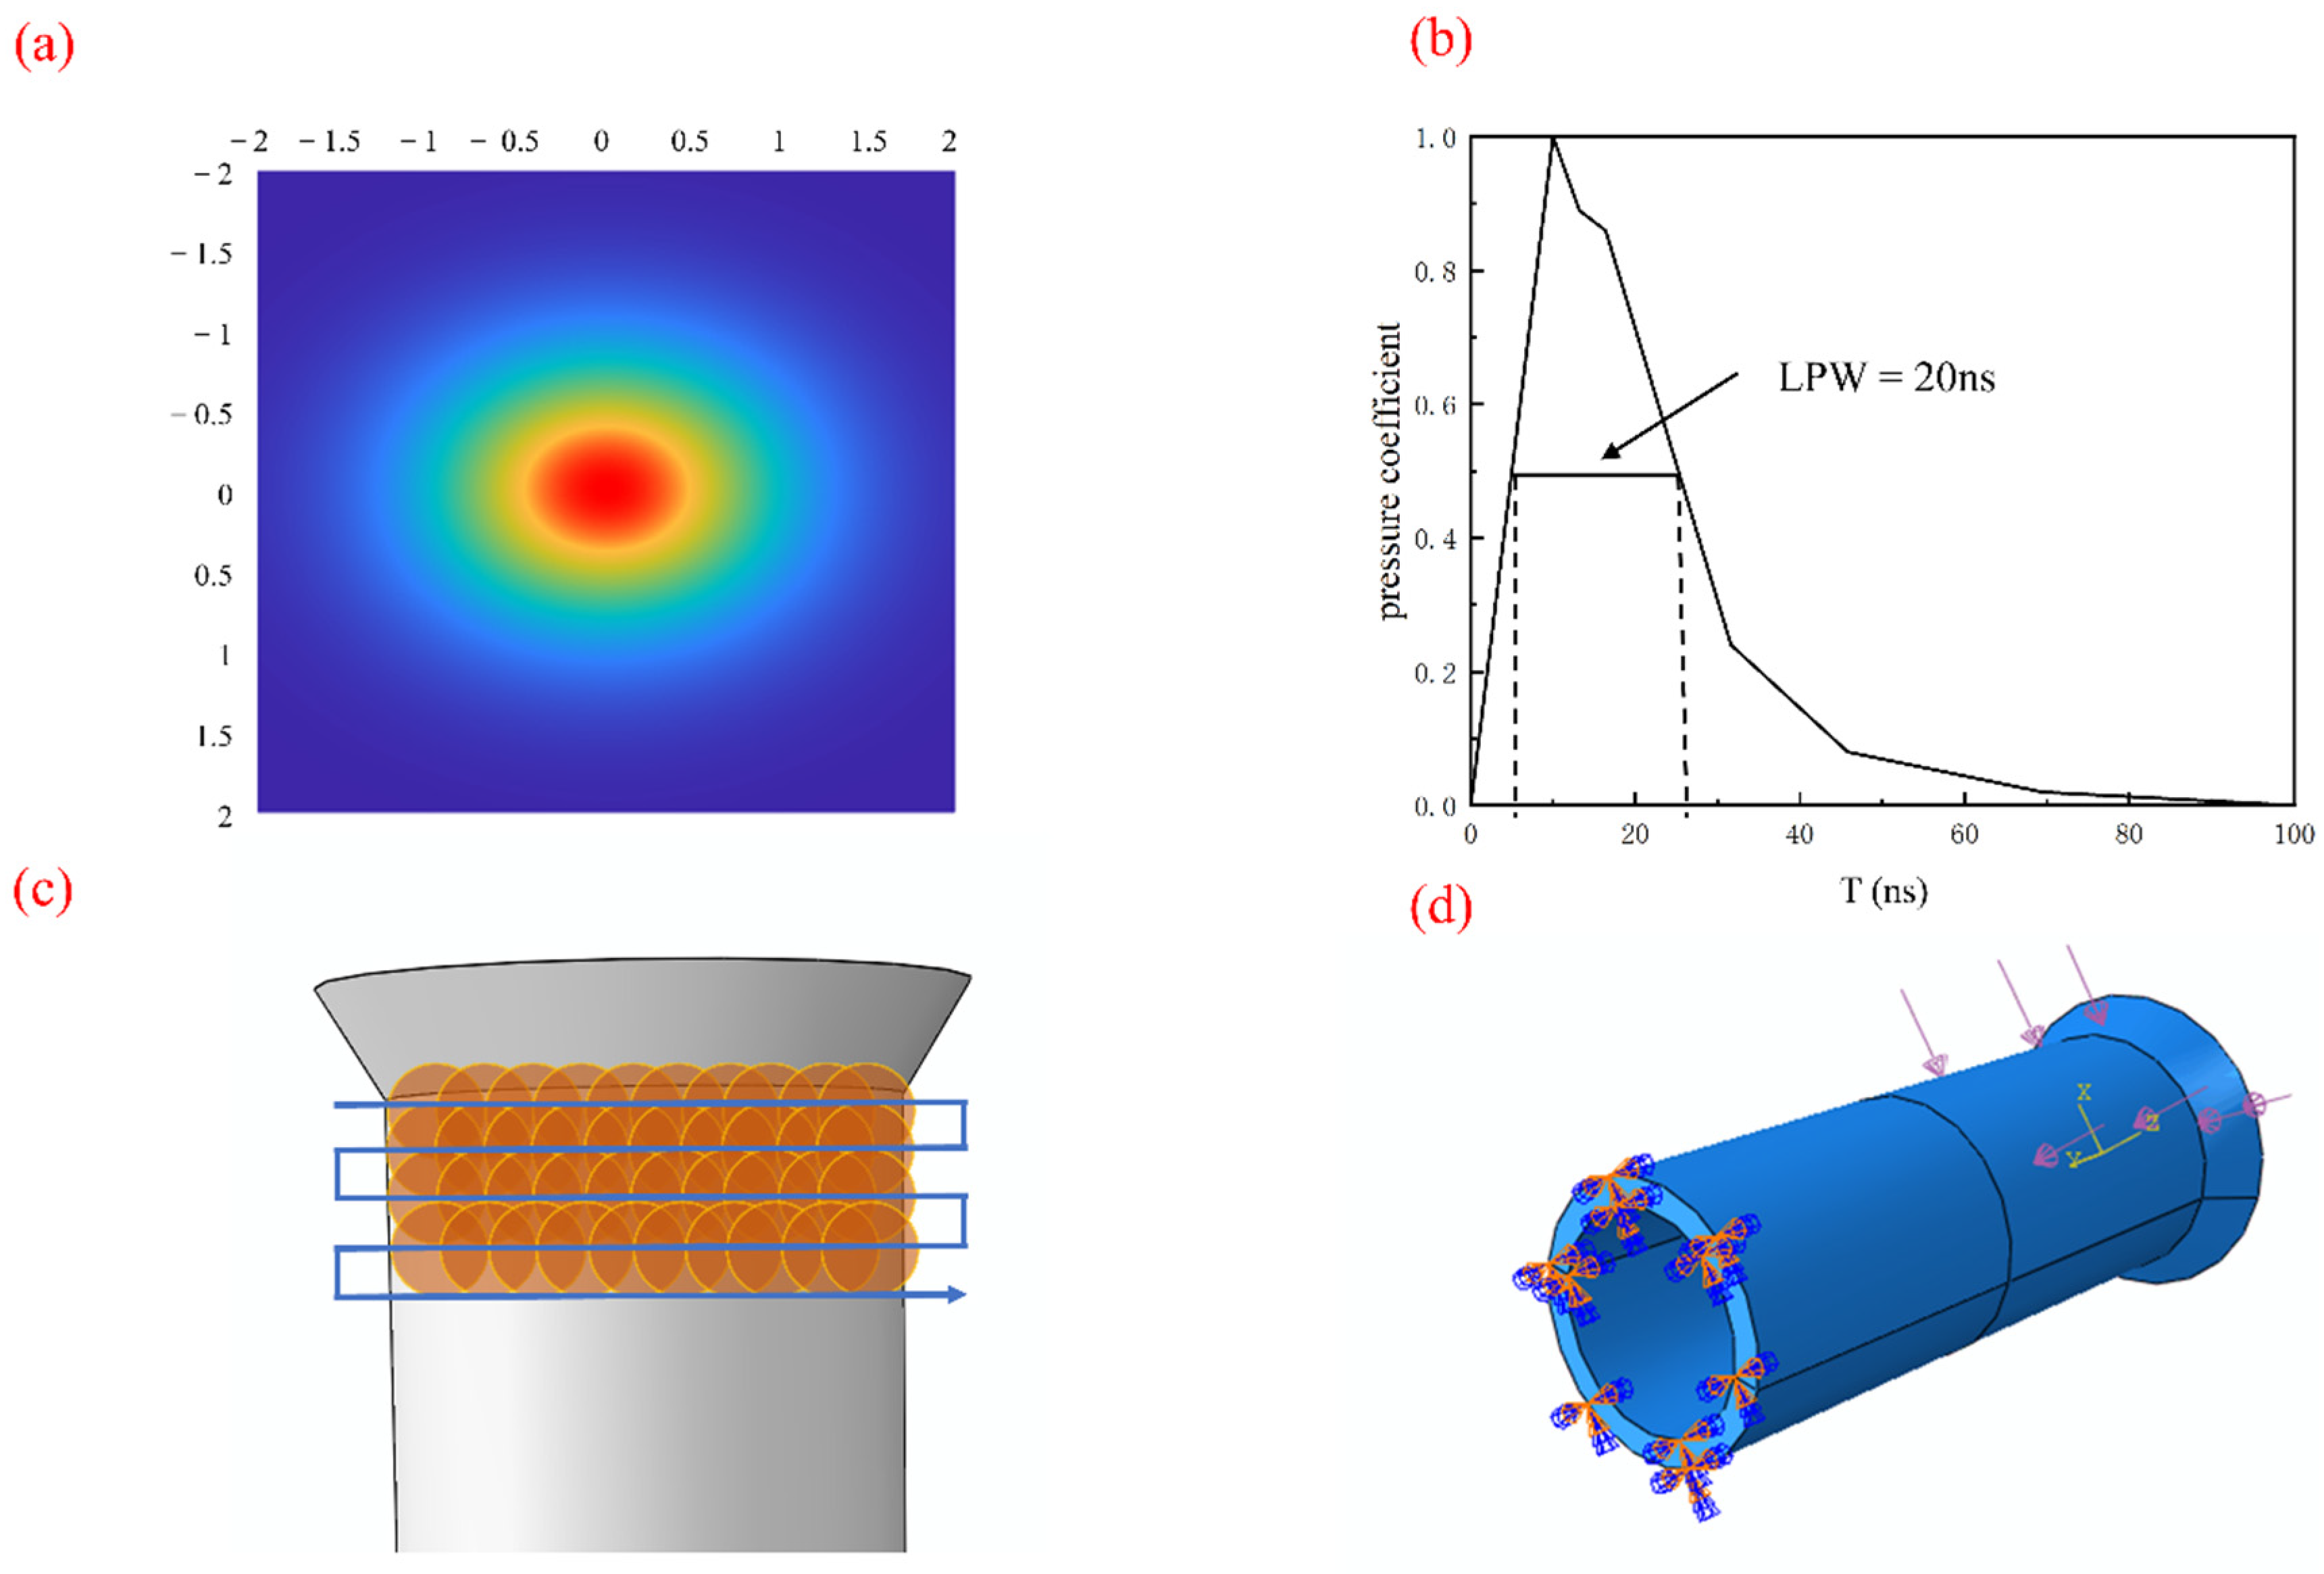
The pressure exhibits a Gaussian profile along the radial direction of the spot [35]. Due to the distortion of the light spot, the Gaussian profile is modified to some extent. The modified light spot is shown in Figure 5a, and the pressure formula is as follows:
P ( r , t ) = P m a x P ( t ) e x p { { ( x c o s θ ) 2 + y 2 } 2 r 2 } ,
where P (r,t) is the shock wave pressure at a certain point and moment, Pmax is the peak pressure of the shock wave, and P(t) is the time amplitude curve (Figure 5b), simplified according to the study findings of laser impulse pressure by Peyre [36], r is the spot radius, and r is the distance from a certain point to the spot center. A VDLOAD Fortran subroutine was used to apply the pressure-loading of the laser impacts, considering the zigzag laser path (Figure 5c), with a 50% spot overlap rate. The boundary conditions are shown in Figure 5d; the cross-section of one side of the pipe was set to ENCASTRE (U1 = U2 = U3 = UR1 = UR2 = UR3 = 0), with user-defined pressure being applied to the pipe’s surface.

3. Results

3.1. Numerical Simulation Results and Discussion

3.1.1. Influence of LSP Power Density on the Residual Stress Field

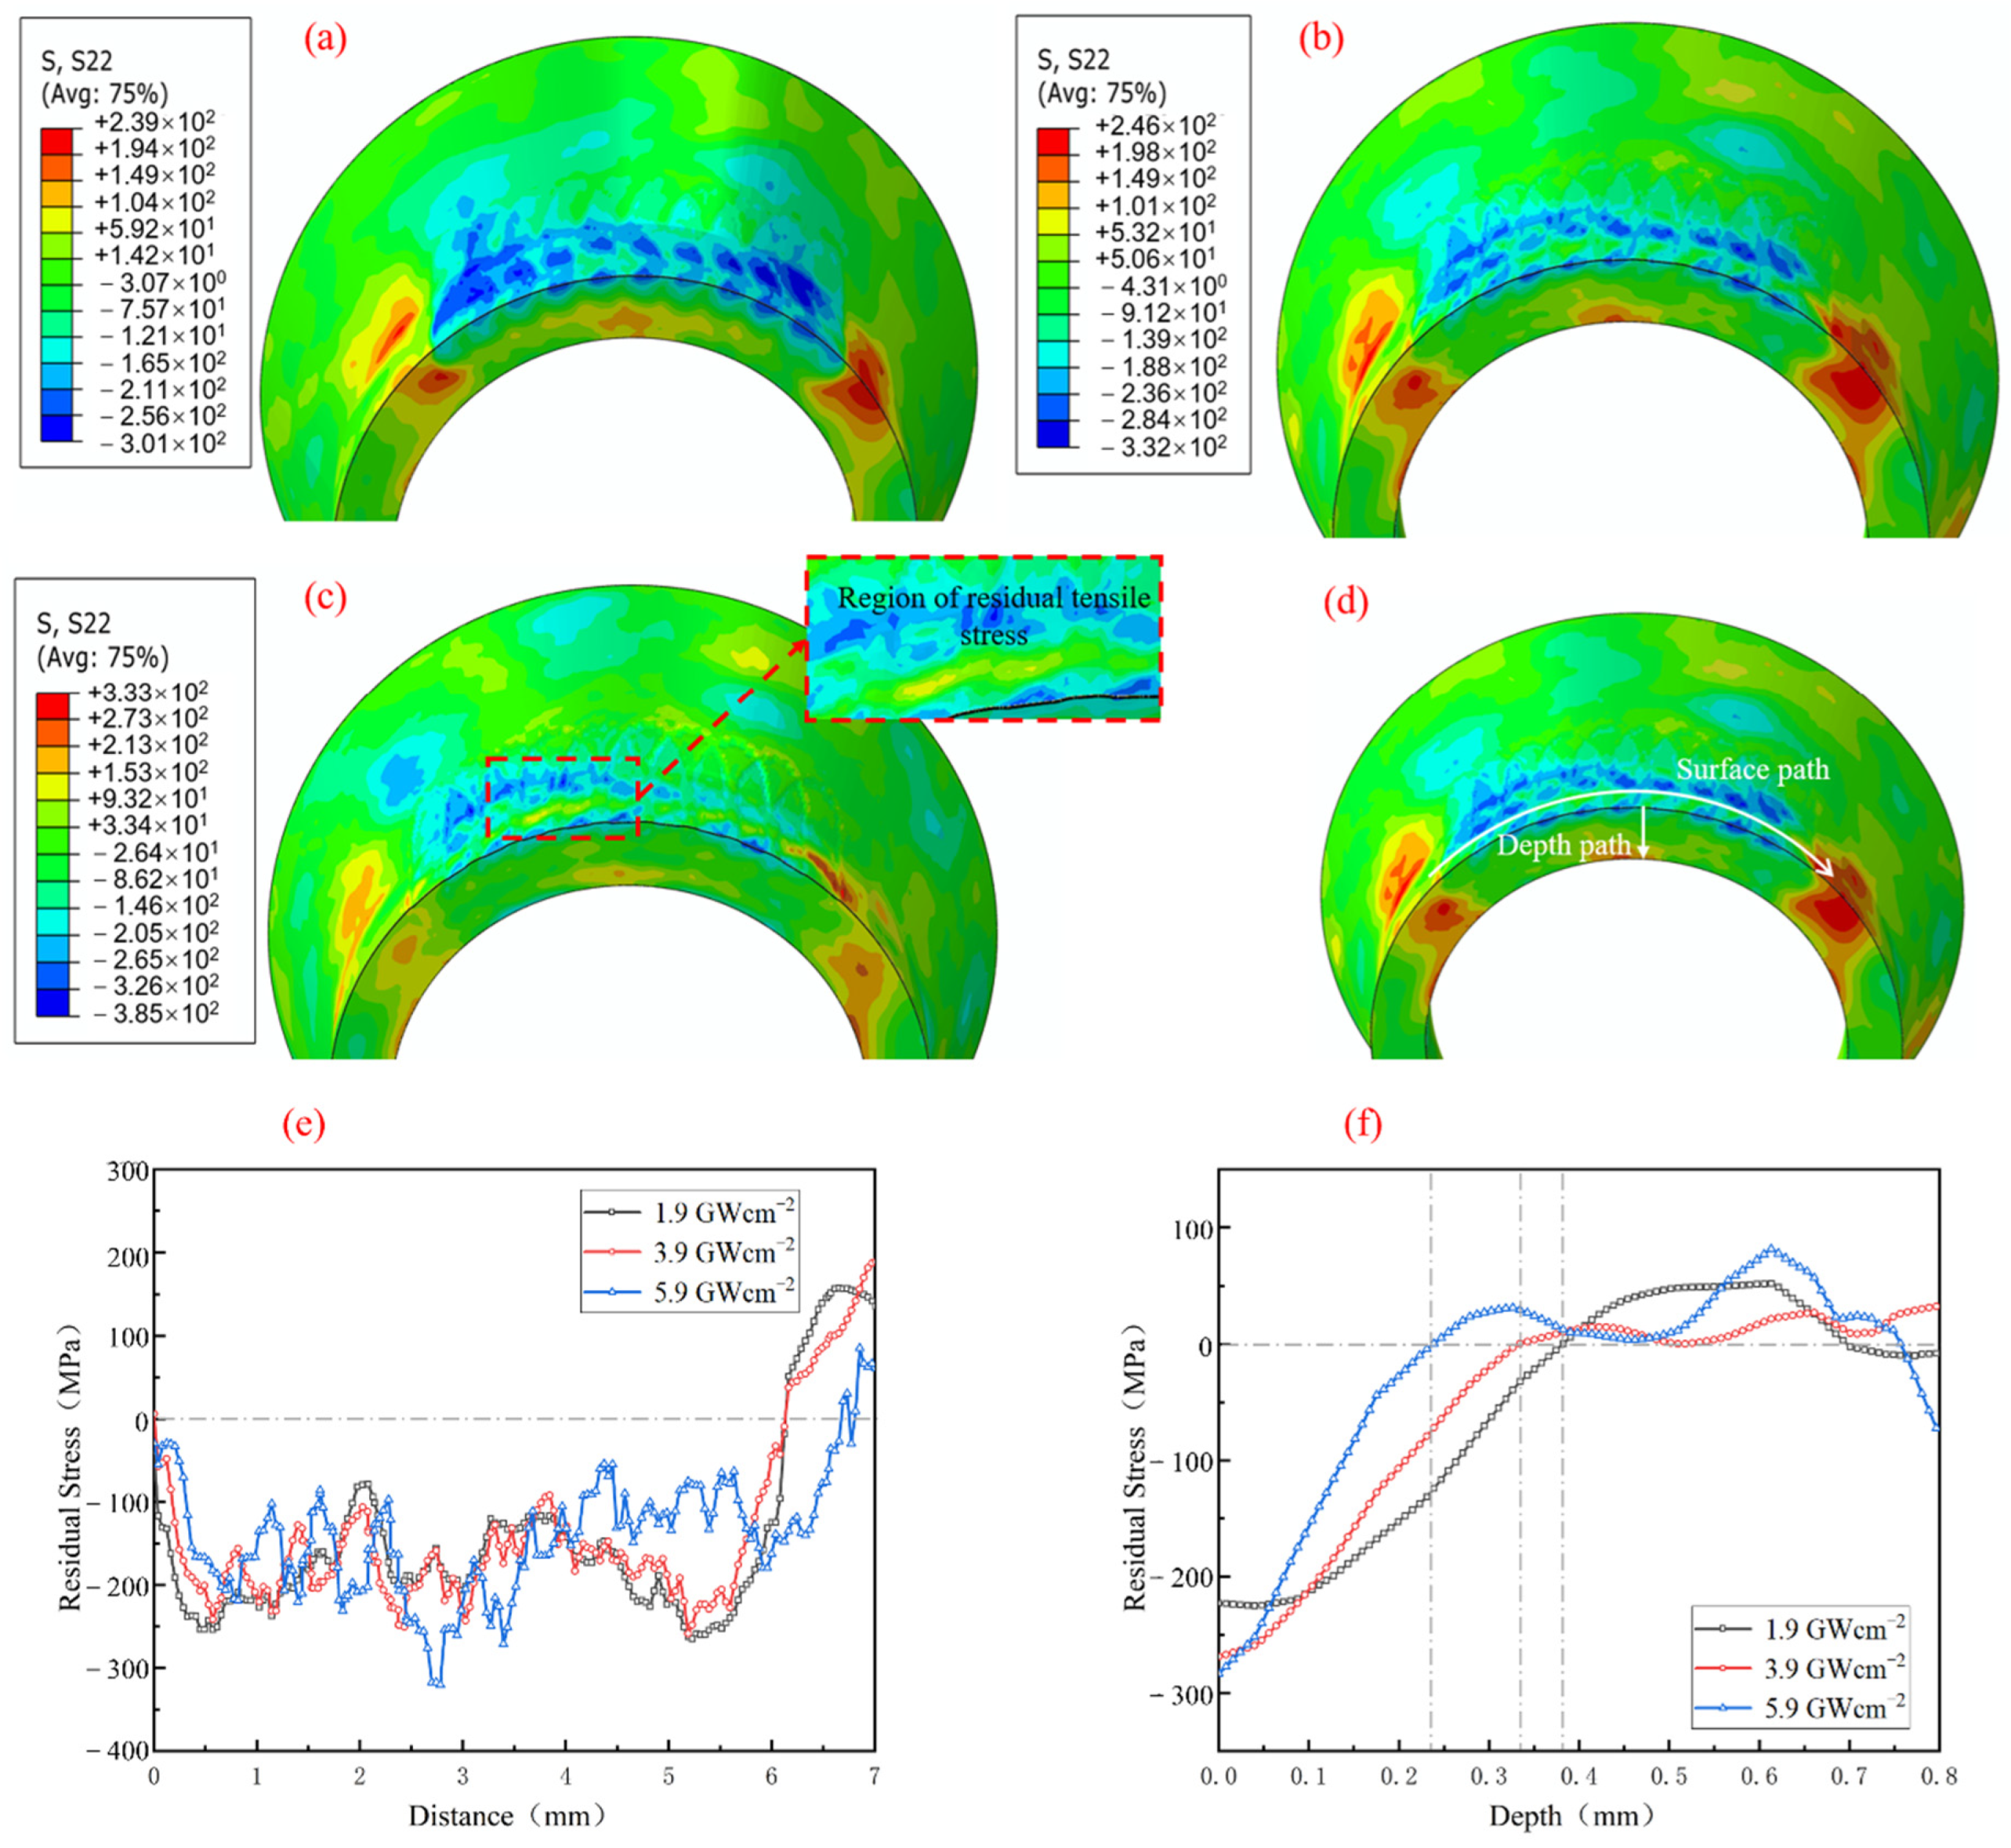
Three distinct power densities of 1.9, 3.9, and 5.2 GW·cm−2 were chosen for the numerical simulation, according to the best peak range of shock wave pressure. Figure 6 depicts the residual stress nephogram and residual stresses in the surface and depth directions of the different power densities. As laser power density increased, the maximum surface residual compressive stresses were −300 MPa, −332 MPa, and −385 MPa, respectively, while the uniformity of its distribution declined. At a power density impact of 5.9 GW·cm−2, the residual tensile stress could even be seen in certain areas of the surface (Figure 6c).
Figure 6d depicts the residual stress numerical extraction path in the direction of surface and depth. From low to high power densities, the average surface residual stresses were −182.14 MPa, −180.92 MPa, and −159.61 MPa. The residual stress on the surface was clearly reduced as the power density increased. When compared to the residual stress in the depth direction, it can be discovered that, while the maximum residual compressive stress on the surface at 5.9 GW·cm−2 was the greatest, the compressive stress layer on the surface at 5.9 GW·cm−2 was the shallowest, whereas 3.9 GW·cm−2 showed a larger surface compressive stress and a deeper surface compressive stress layer. In general, as the laser power increased, the overall strengthening effect showed a trend of first increasing and then decreasing. The laser power density was estimated to be about 3.9 GW·cm−2, according to the computed findings.
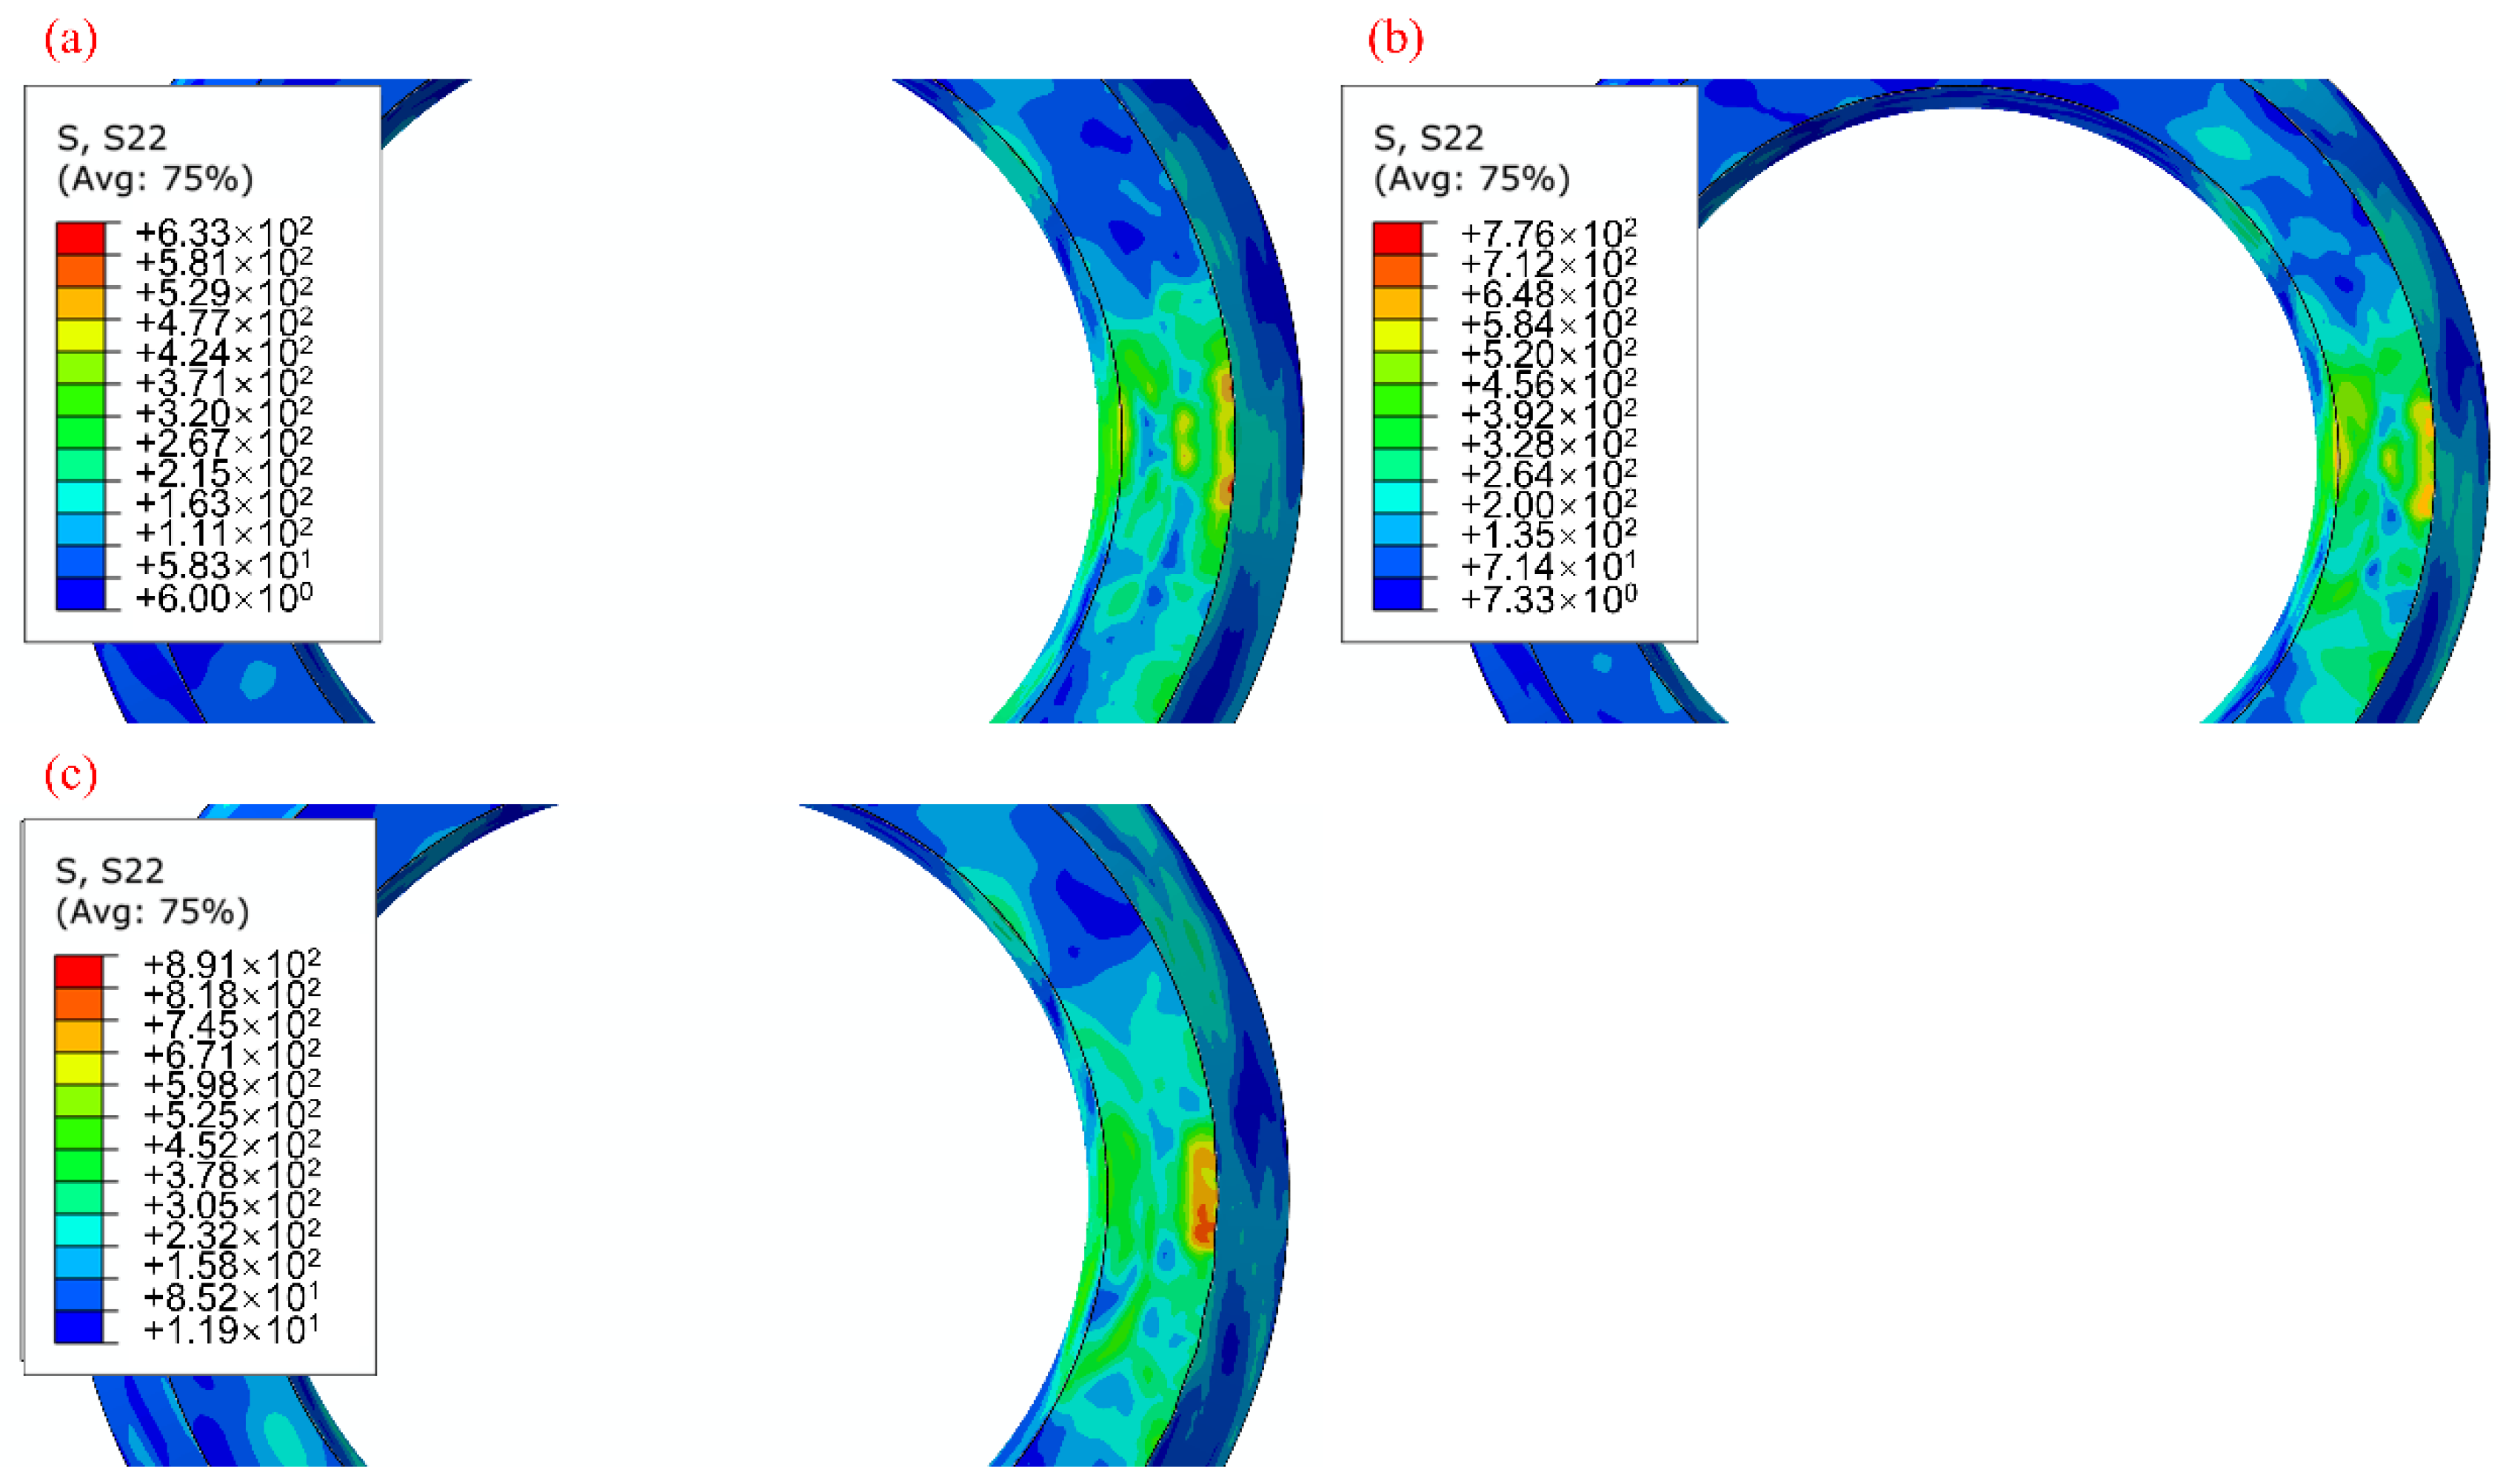
Higher laser-power density increased the plastic strain and, therefore, increased the residual compressive stress. However, the component was a thin-walled pipe and the propagation of stress waves within the component was extremely complicated, resulting in an uneven distribution of residual stress. The stress wave propagation of the final hit was chosen for study, and the findings are illustrated in Figure 7. It can be seen that the maximum von Mises stress on the top surface, as reflected by 5.9, 3.9, and 1.9 GW·cm−2, was 891, 776, and 633 MPa. It is clear that the larger power density still had a stronger stress wave after reflection, thereby still producing plastic strain on the material; thus, some residual tensile strain occurred on the surface under the operation of 5.9 GW·cm−2.

3.1.2. Effect of Spot Size on Residual Stress Field by LSP

From the simulation findings of LSP at various power densities, while the residual stress distribution at 3.9 GW·cm−2 power density was the best, it still had the disadvantages of uneven distribution and small value. Vasu et al. [21] discovered that increasing the curvature of the convex model increased the compressive residual stress in materials. However, it is impossible to modify the curvature of real pipe fittings, such as aircraft pipes.
Figure 8 shows the stress wave propagation of the pipe (Figure 8b), compared with the plane member (Figure 8a). It is obvious that the stress wave propagating over the curved surface had a horizontal extrusion; the horizontal component decreased as the diameter of the spot decreased (Figure 8c). The effect of various spot sizes on the pipe’s residual stress has been investigated in this paper.
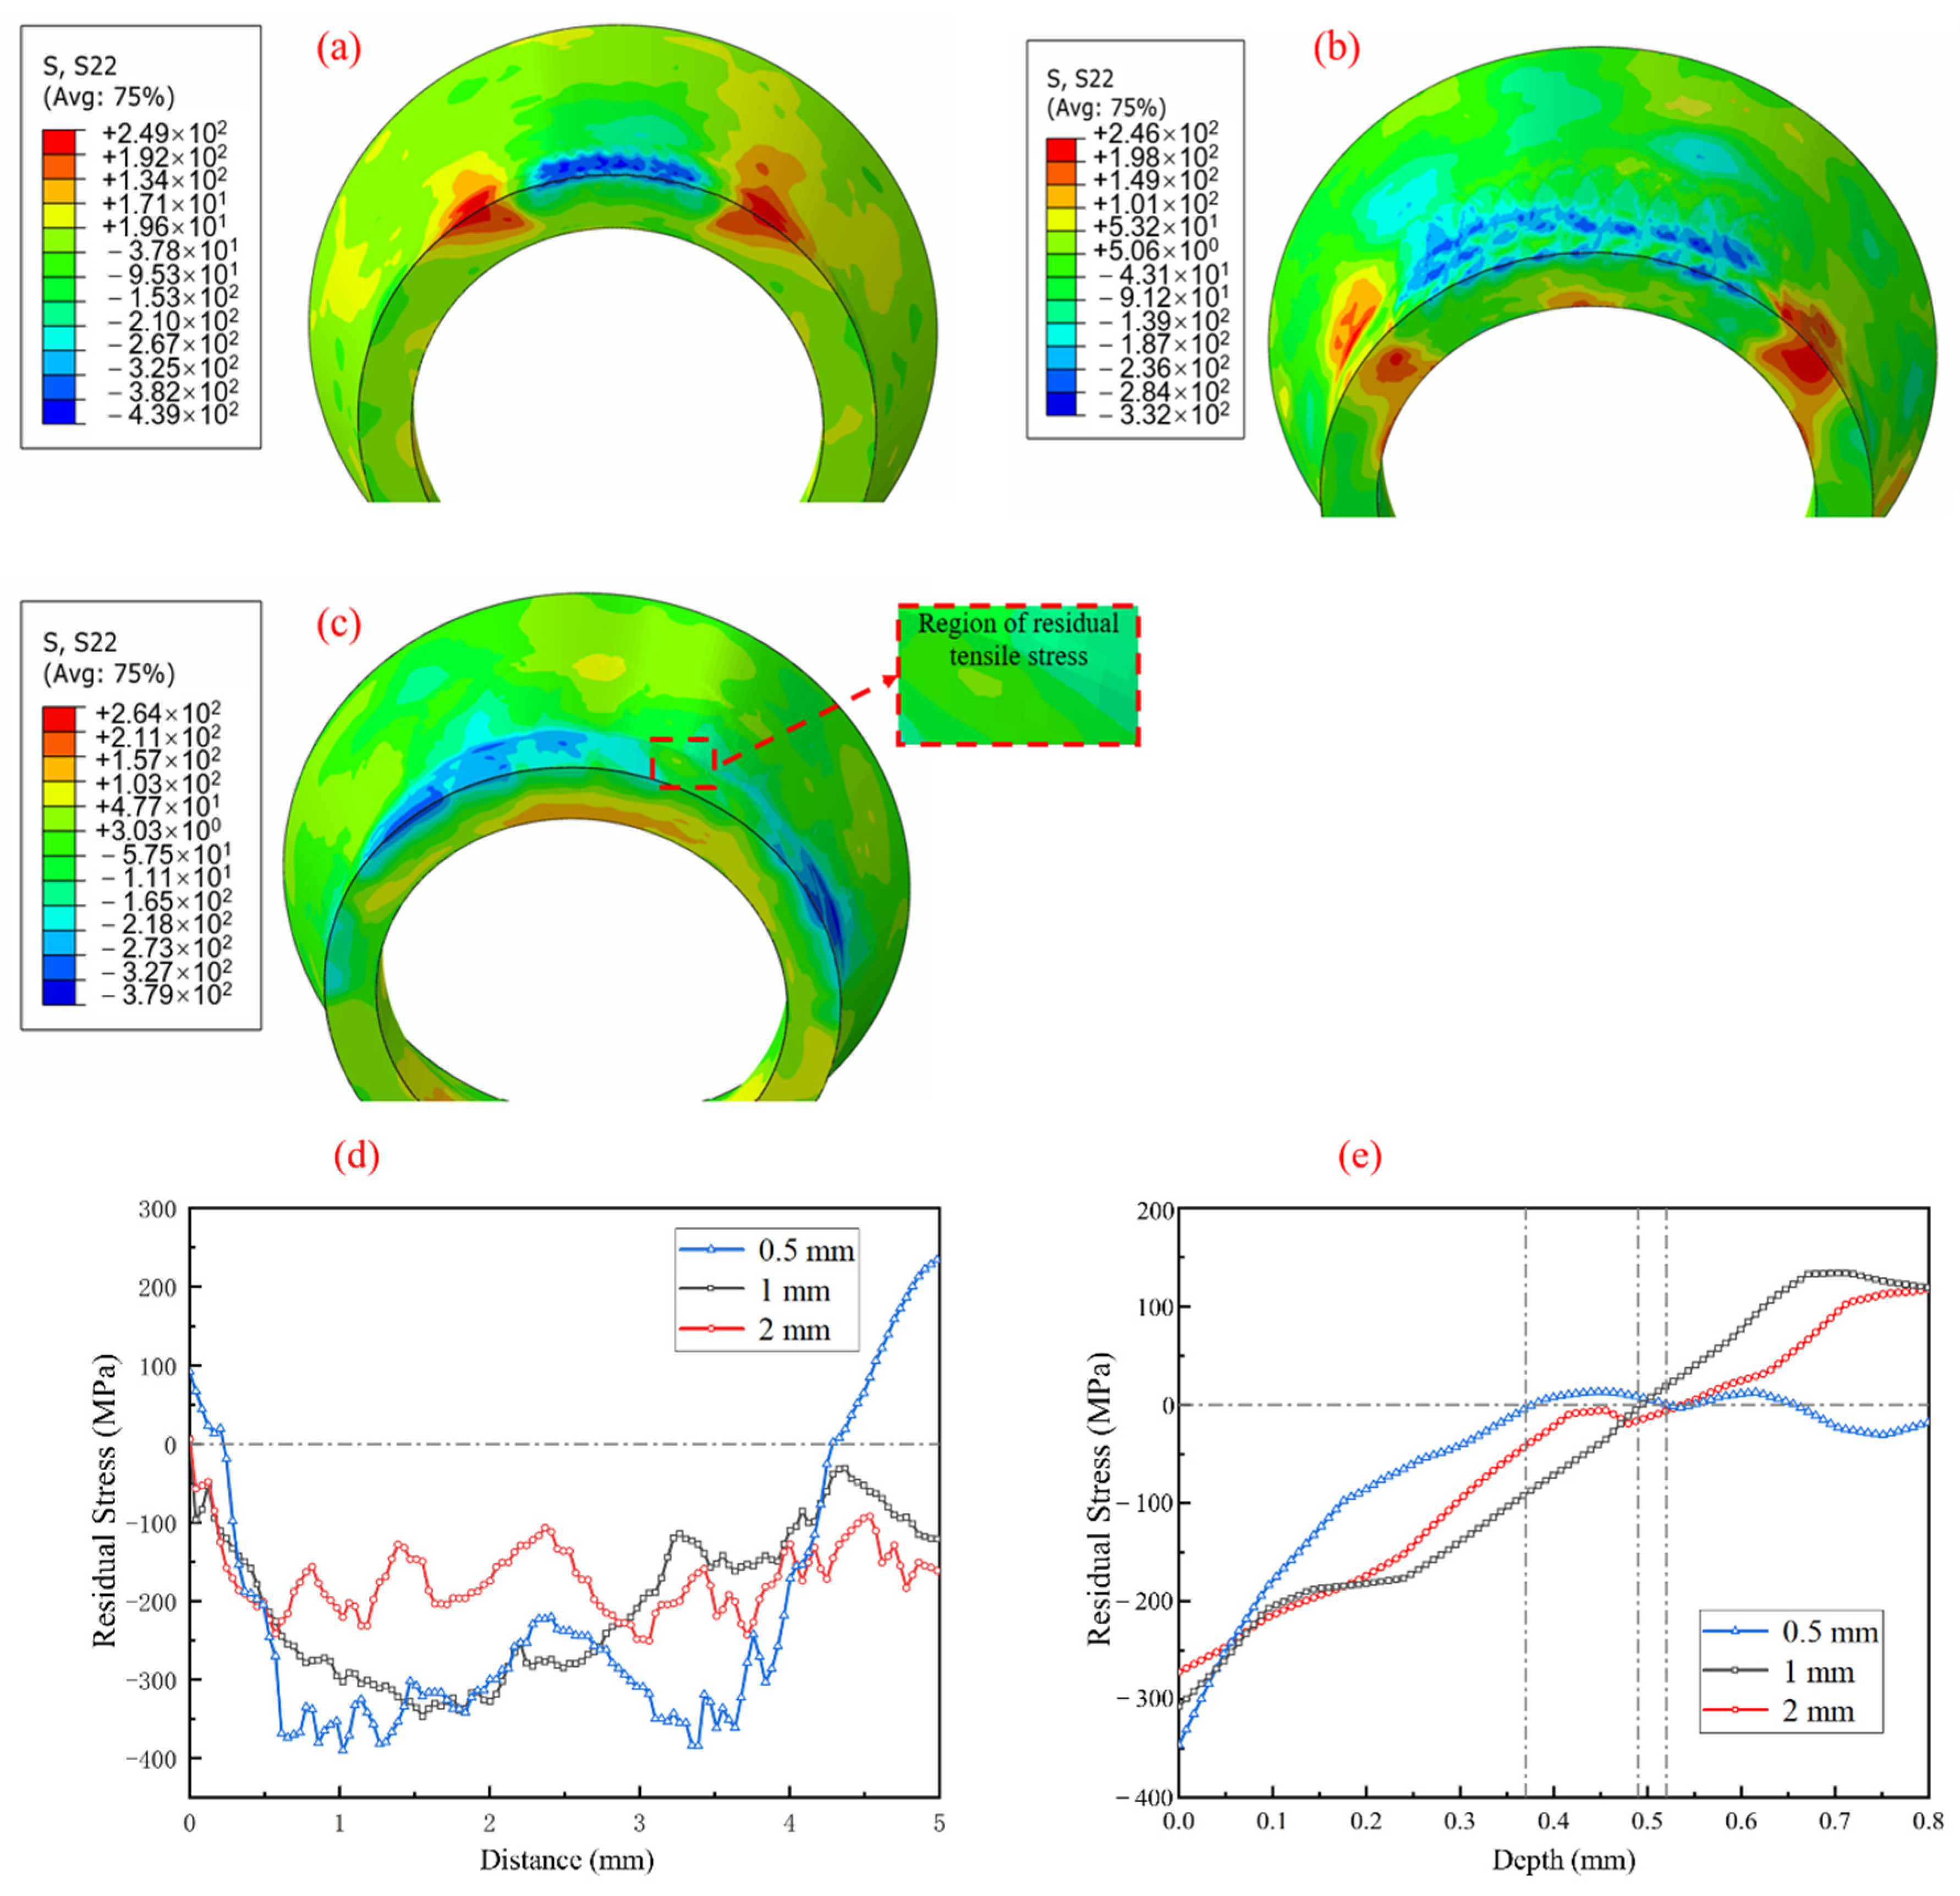
The numerical simulation of LSP with spot diameters of 0.5, 1, and 2 mm was carried out. Figure 9 illustrates the residual stress nephogram and residual stresses in the surface and depth directions of different spot diameters. The residual stress distribution was more uniform over the surface of the 0.5 mm spot, with a maximum residual compressive stress of −439.9 MPa. The highest residual compressive stress was −332.0 MPa on the surface of the 1 mm spot. The highest residual compressive stress was −378.5 MPa on the surface of the 2 mm spot, while certain parts of the surface exhibited residual tensile stress.
The mean values of surface residual stress were −301.56, −180.92, and −156.49 MPa. As the diameter of the spot increased, the residual stress on the surface decreased dramatically. It was found that the residual compressive stress on the surface of the 0.5 mm spot was the largest, but the thickness of the compressive stress layer was the shallowest. Conversely, the compressive stress and the compressive stress layer on the surface of the 1 mm spot were relatively large and deep.
A larger spot created a stronger squeezing component, which inhibited the downward propagation of the stress wave, resulting in lesser residual stress than that of the small light spot in the surface and subsurface region. The stress wave was reflected several times in the depth direction by the thin-walled member, and the hindrances of large laser spots with respect to downward propagation reduced the intensity of the stress wave after reflection, weakening the influence of the wave system after multiple reflection coupling on the residual stress field. Therefore, the depth of residual compressive stress was greater than that of the small spot.
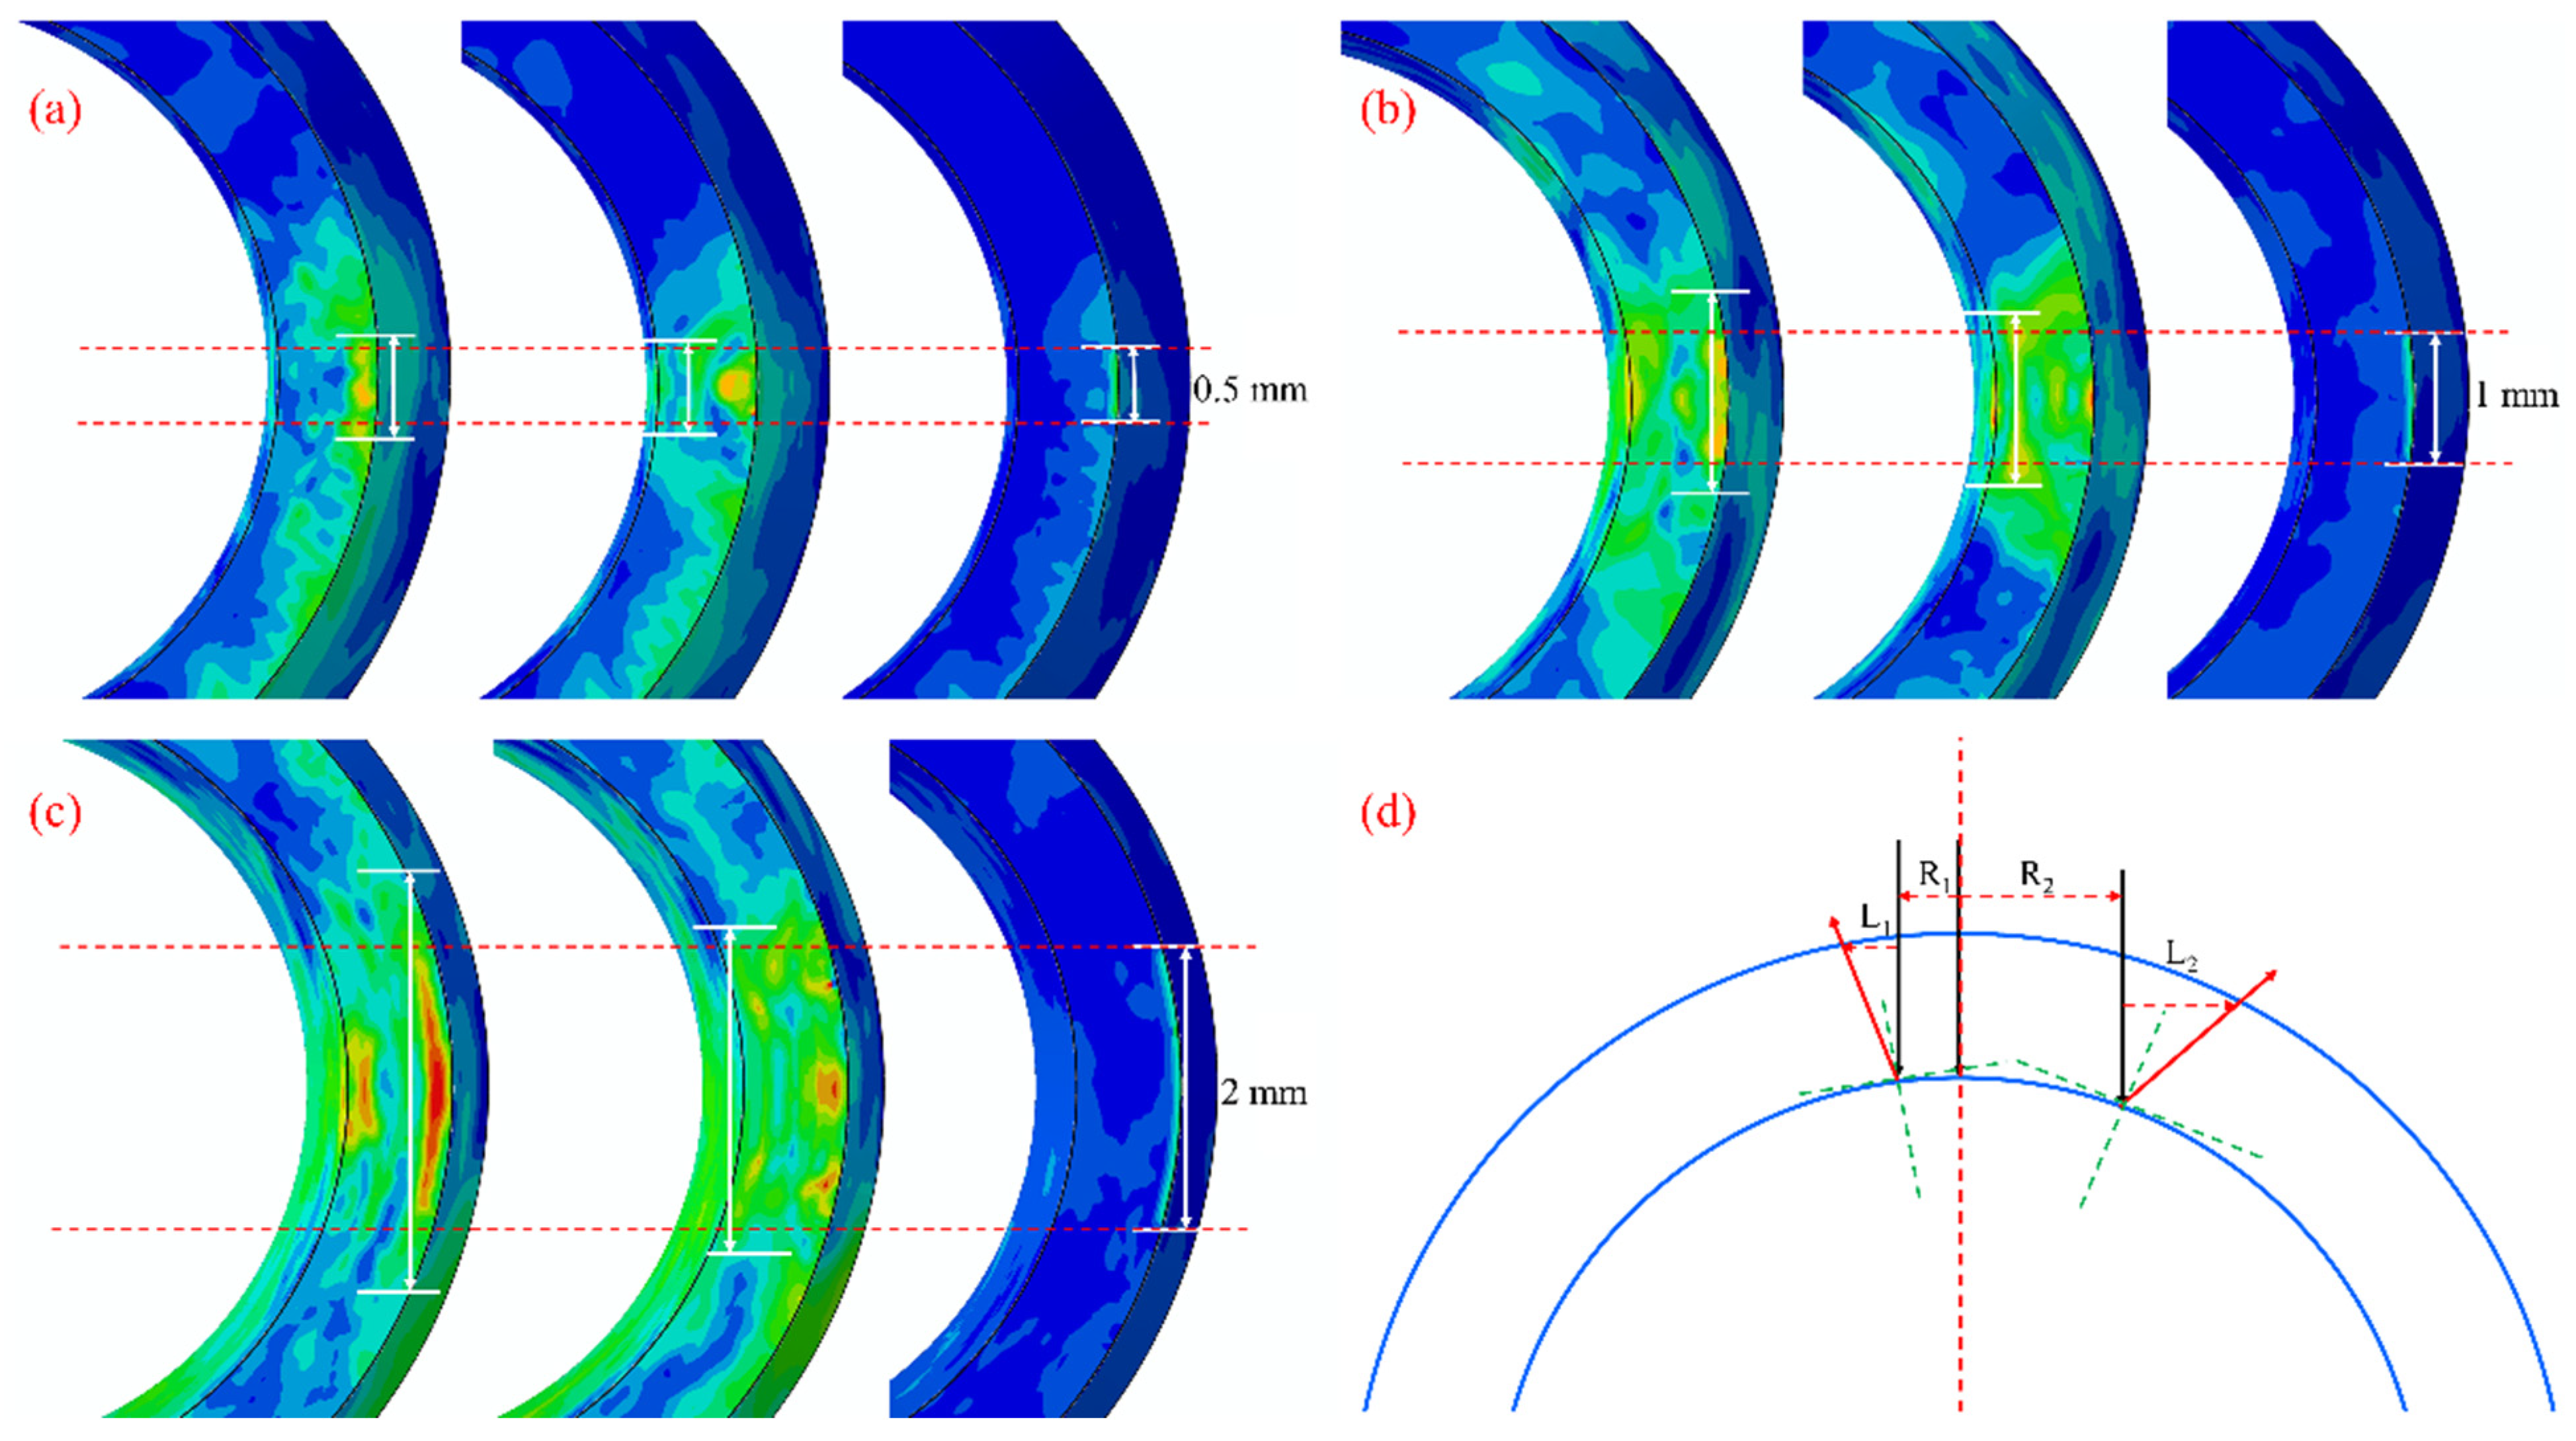
The stress wave propagation of the final hit was chosen for further study. Figure 10 illustrates the stress waves examined at the time of surface loading, at the time when the waves reach the bottom surface, and at the time when the waves reach the top surface. It can be seen that, when the diameter of the spot increased, the area of the reflected stress wave on the top surface increased. When the diameter of the spot increased, the diameter of the stress wave reflected on the top surface increased by 32%, 47%, and 50%. As shown in Figure 10d, in the case of a larger light spot, the influence range of the reflected wave increased, resulting in a greater effect on the unloaded region from the reflected tensile wave. Certain regions were impacted by the surrounding area’s loading, leaving a residual tensile stress area. As a result, this effect could be reduced using a smaller spot.

3.1.3. Influence of the Guided-Wave Material on the Residual Stress Field by LSP

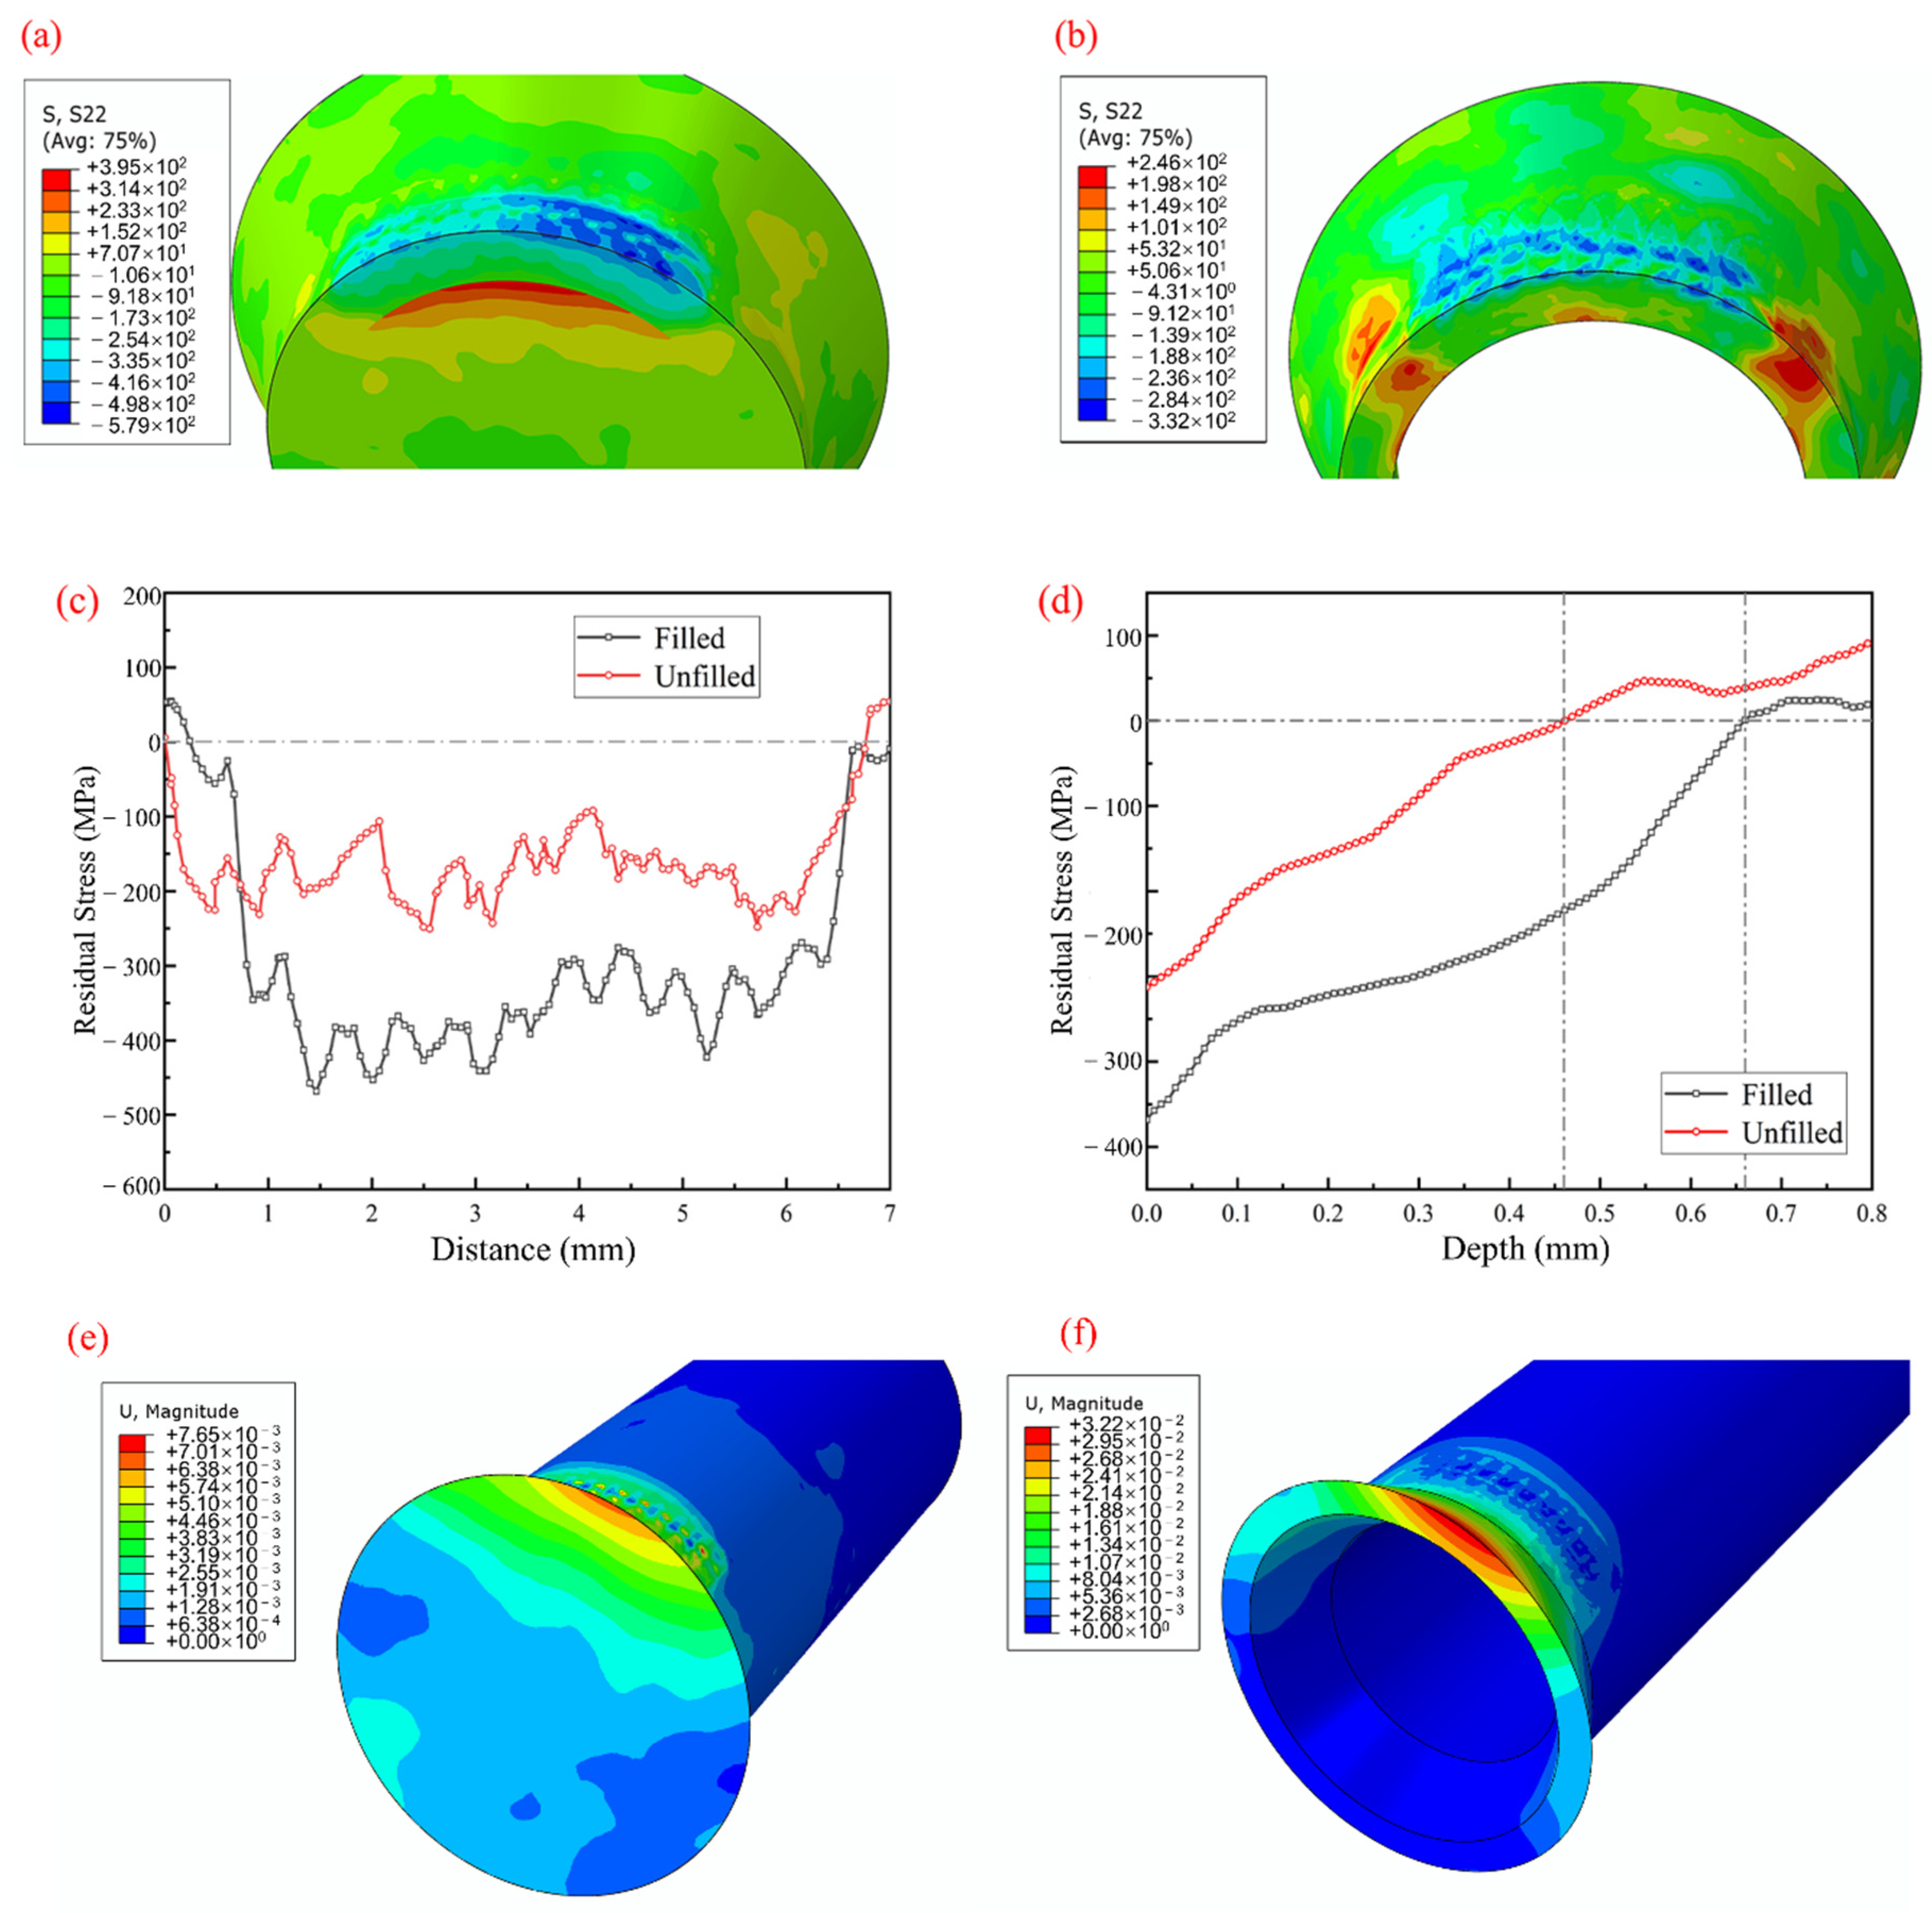
Although various power densities and spot sizes were investigated, seeking the optimal laser parameters, the intense stress wave after reflection in the thin-walled pipe resulted in an uneven distribution of the residual compressive stress field. As a result, the pipe was filled with a guided wave material to minimize stress-wave reflection and enhance the residual stress field. The residual stress nephogram and residual stresses in the surface and depth directions of filled and unfilled guided wave materials are presented in Figure 11. As can be seen in the image, the filled guide material increased the maximum residual stress of the surface residual stress to −578 MPa, which was 70% more than the value for the pipe without the filled guide material.
The mean surface residual stress distributions of the filled and unfilled guided-wave materials were −351.76 MPa and −180.92 MPa. After filling with the guided-wave material, the surface’s residual stress was significantly reduced. When the residual stress was compared in the depth direction, it could be seen that the maximum residual compressive stress on the surface of the filled wave-guide material was significantly enhanced, while the compressive stress layer increased by about 0.2 mm in depth.
The maximum deformation of the sample filled with guided-wave material was 0.0076 mm, while the maximum deformation of the sample filled with guided-wave material was 0.032 mm. The maximum deformation of the sample not filled with guided-wave material was 4.2 times that of the sample filled with guided-wave material. The deformation of the pipe was further reduced by filling with the guided-wave material.
After filling with the guided-wave material, the reflection of stress waves in the thin-walled pipe was minimized. As shown in Figure 12, the stress wave propagation of the most recent hit was chosen for investigation. When the stress wave reached the bottom surface, the majority of the wave propagated through the interface and into the guided-wave material. With continuous stress wave propagation, the energy of the stress wave was lost throughout the propagation process in the guided-wave material, and it was difficult to affect the material’s plastic strain during subsequent propagation. Thus, the LSP’s effect on the thin-walled pipe could effectively be improved by filling it with guided-wave material.

3.2. Experimental Results and Discussion

3.2.1. Residual Stress Results

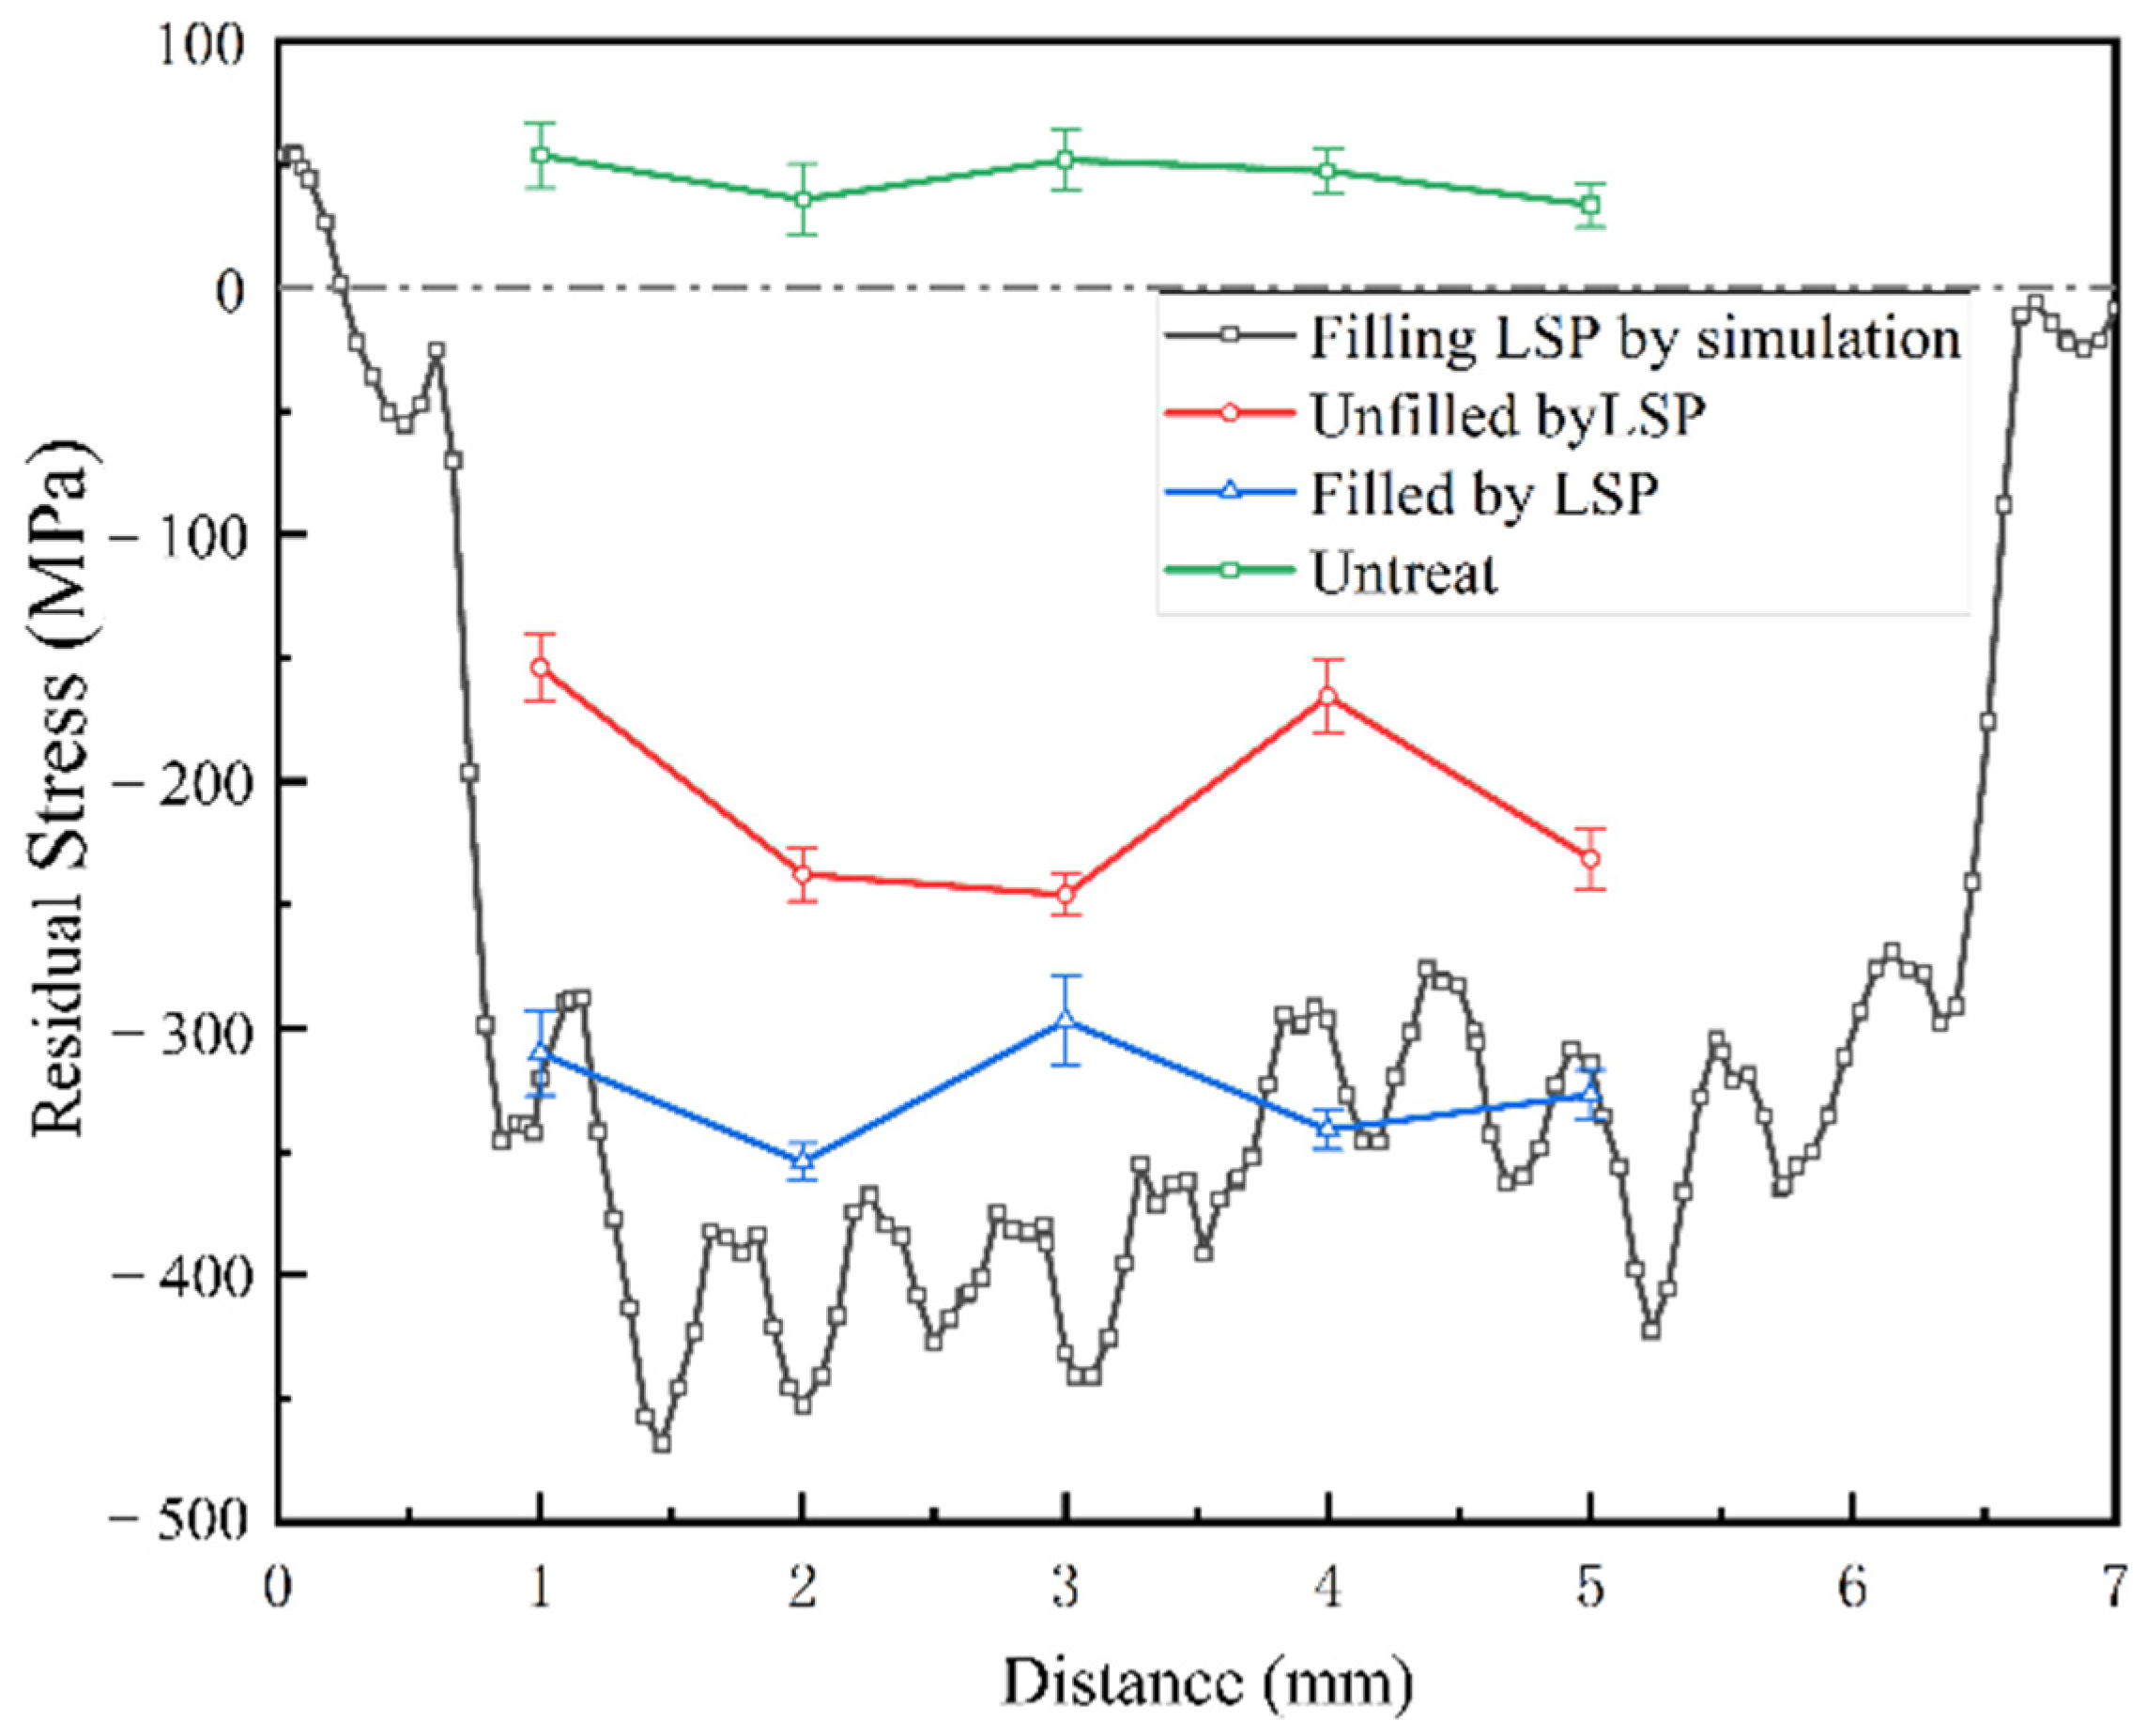
Figure 13 depicts the experimental and simulation findings for surface residual stress; five test points were selected in the circumferential direction of the surface with an interval of 1 mm. LSP caused a significant residual compressive stress in the impact zone. The untreated samples had an average surface residual stress of 44.22 MPa. The unfilled guided-wave material samples had an average surface residual stress of −206.93 MPa. The average surface residual stress of the filled guided-wave material samples was −326.06 MPa, with a 7.8% inaccuracy when compared to the numerical simulation’s average surface residual stress of −351.76 MPa. Overall, the numerical simulation results were mostly similar to those of the experiments. The numerical value of the residual stress and the uniformity of residual stress distribution on the surface of the thin-walled pipe were effectively improved by filling with LSP.

3.2.2. Fatigue Test Results

According to standard HB6442-1990, “Bending fatigue test of aircraft hydraulic pipes and connectors”, due to the fatigue cycles of all differently treated pipes reaching 107 times (the maximum cycles of the rotary bending fatigue-testing machine) at a stress of 25%σb, we increased the stress level of the test. The pipe’s fatigue performance was examined at a stress of 60%σb (312 MPa).
Fatigue stress S represents the combined stress, consisting of tensile stress S1 and bending stress S2:
S = S 1 + S 2 ,
S 1 = P d 2 ( D 2 d 2 ) ,
where P is the internal pressure of the experimental pipe, D is the outer diameter of the pipe, and d is the inner diameter of the tube. The bending stress S2 was obtained from strain-gauge testing.
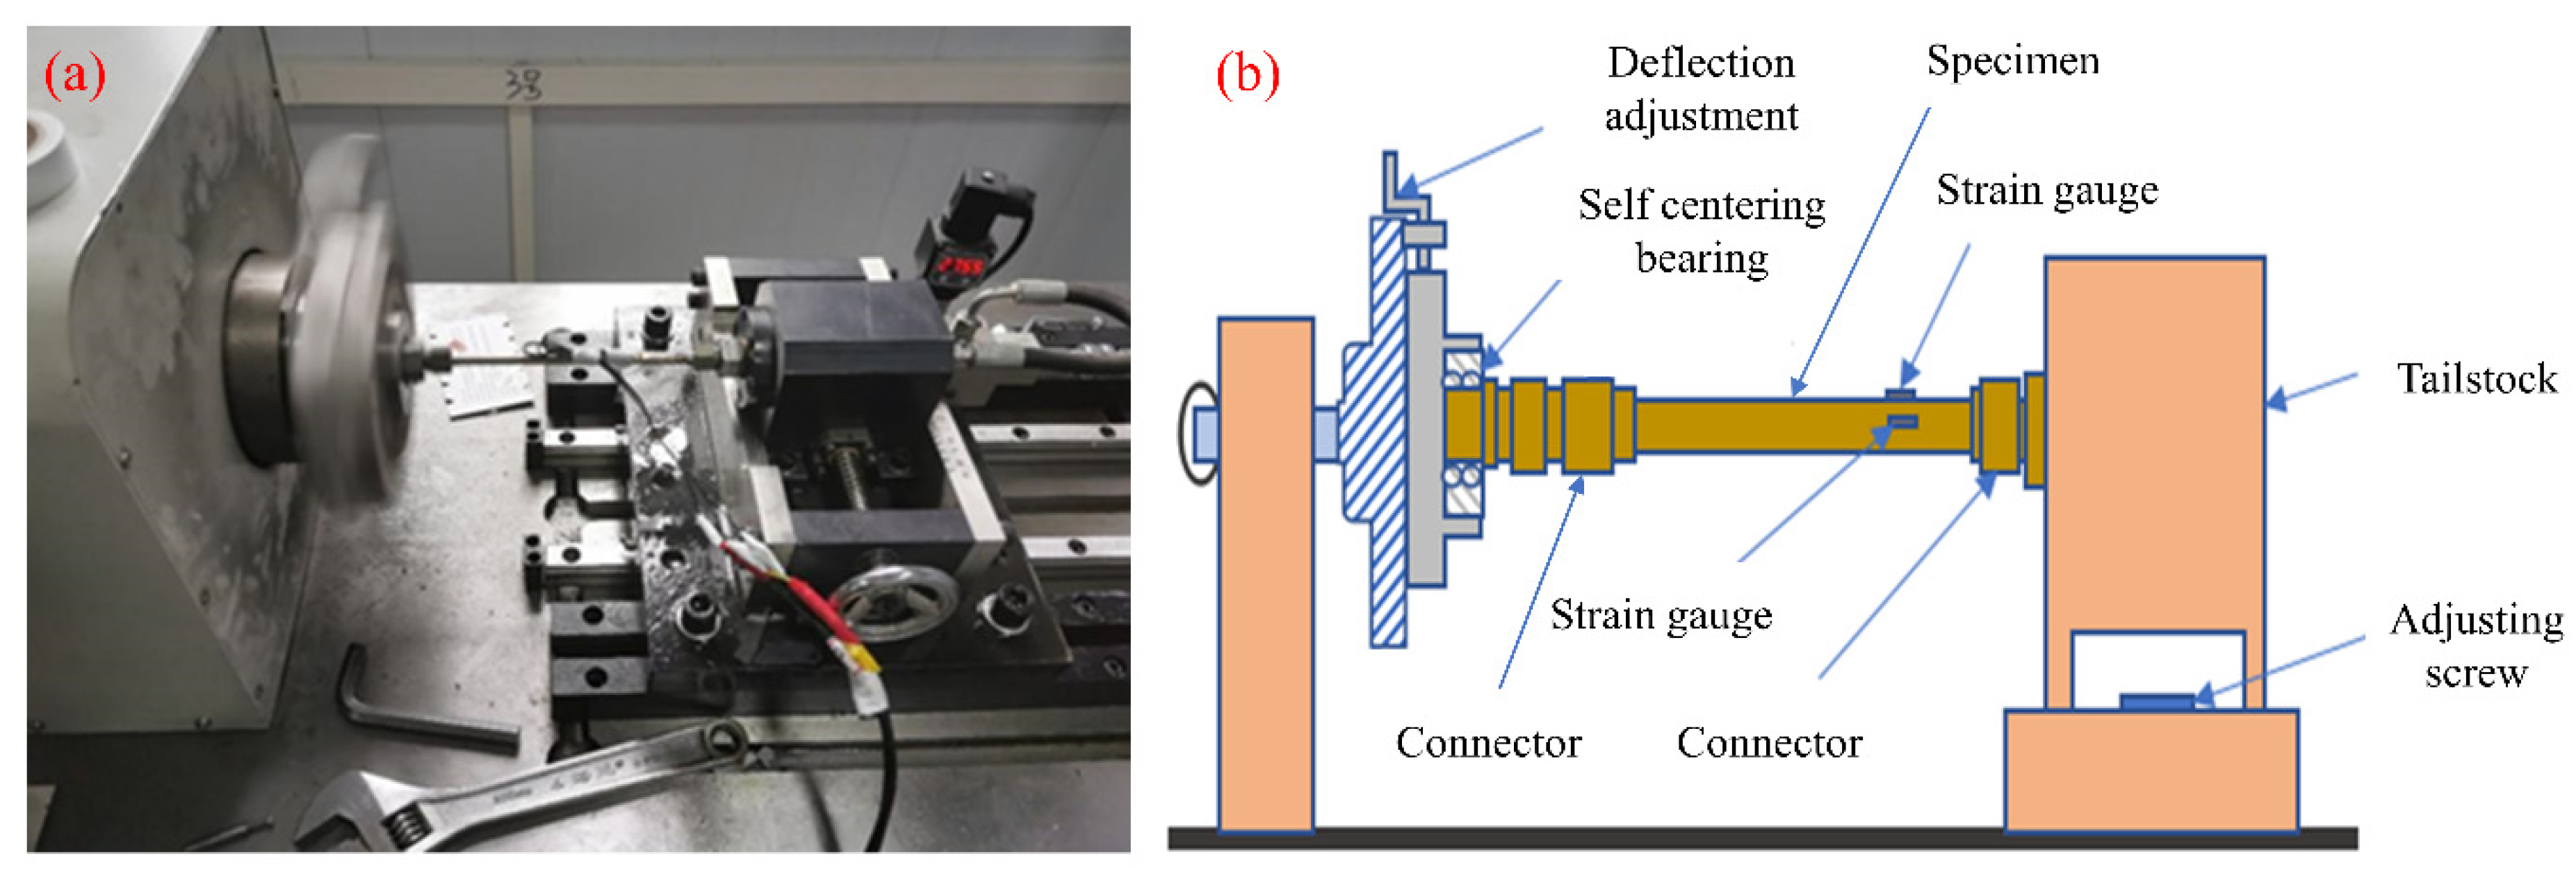
Firstly, the pipe was secured to the connectors at both ends using the nut on the pipe. Secondly, the deflection was adjusted in a static state, and the specimen was bent under the required bending stress level, according to the value of the strain gauge. Then, the test pipe was pressurized using an external hydraulic pump. Since the working pressure of this type of conduit is 28 MPa, the internal pressure of the test pipe was selected as 28 MPa. Lastly, the machine was rotated at a constant speed. There were three samples in each group under different treatment conditions. The test device and scheme of loading and fastening of the specimen are shown in Figure 14.
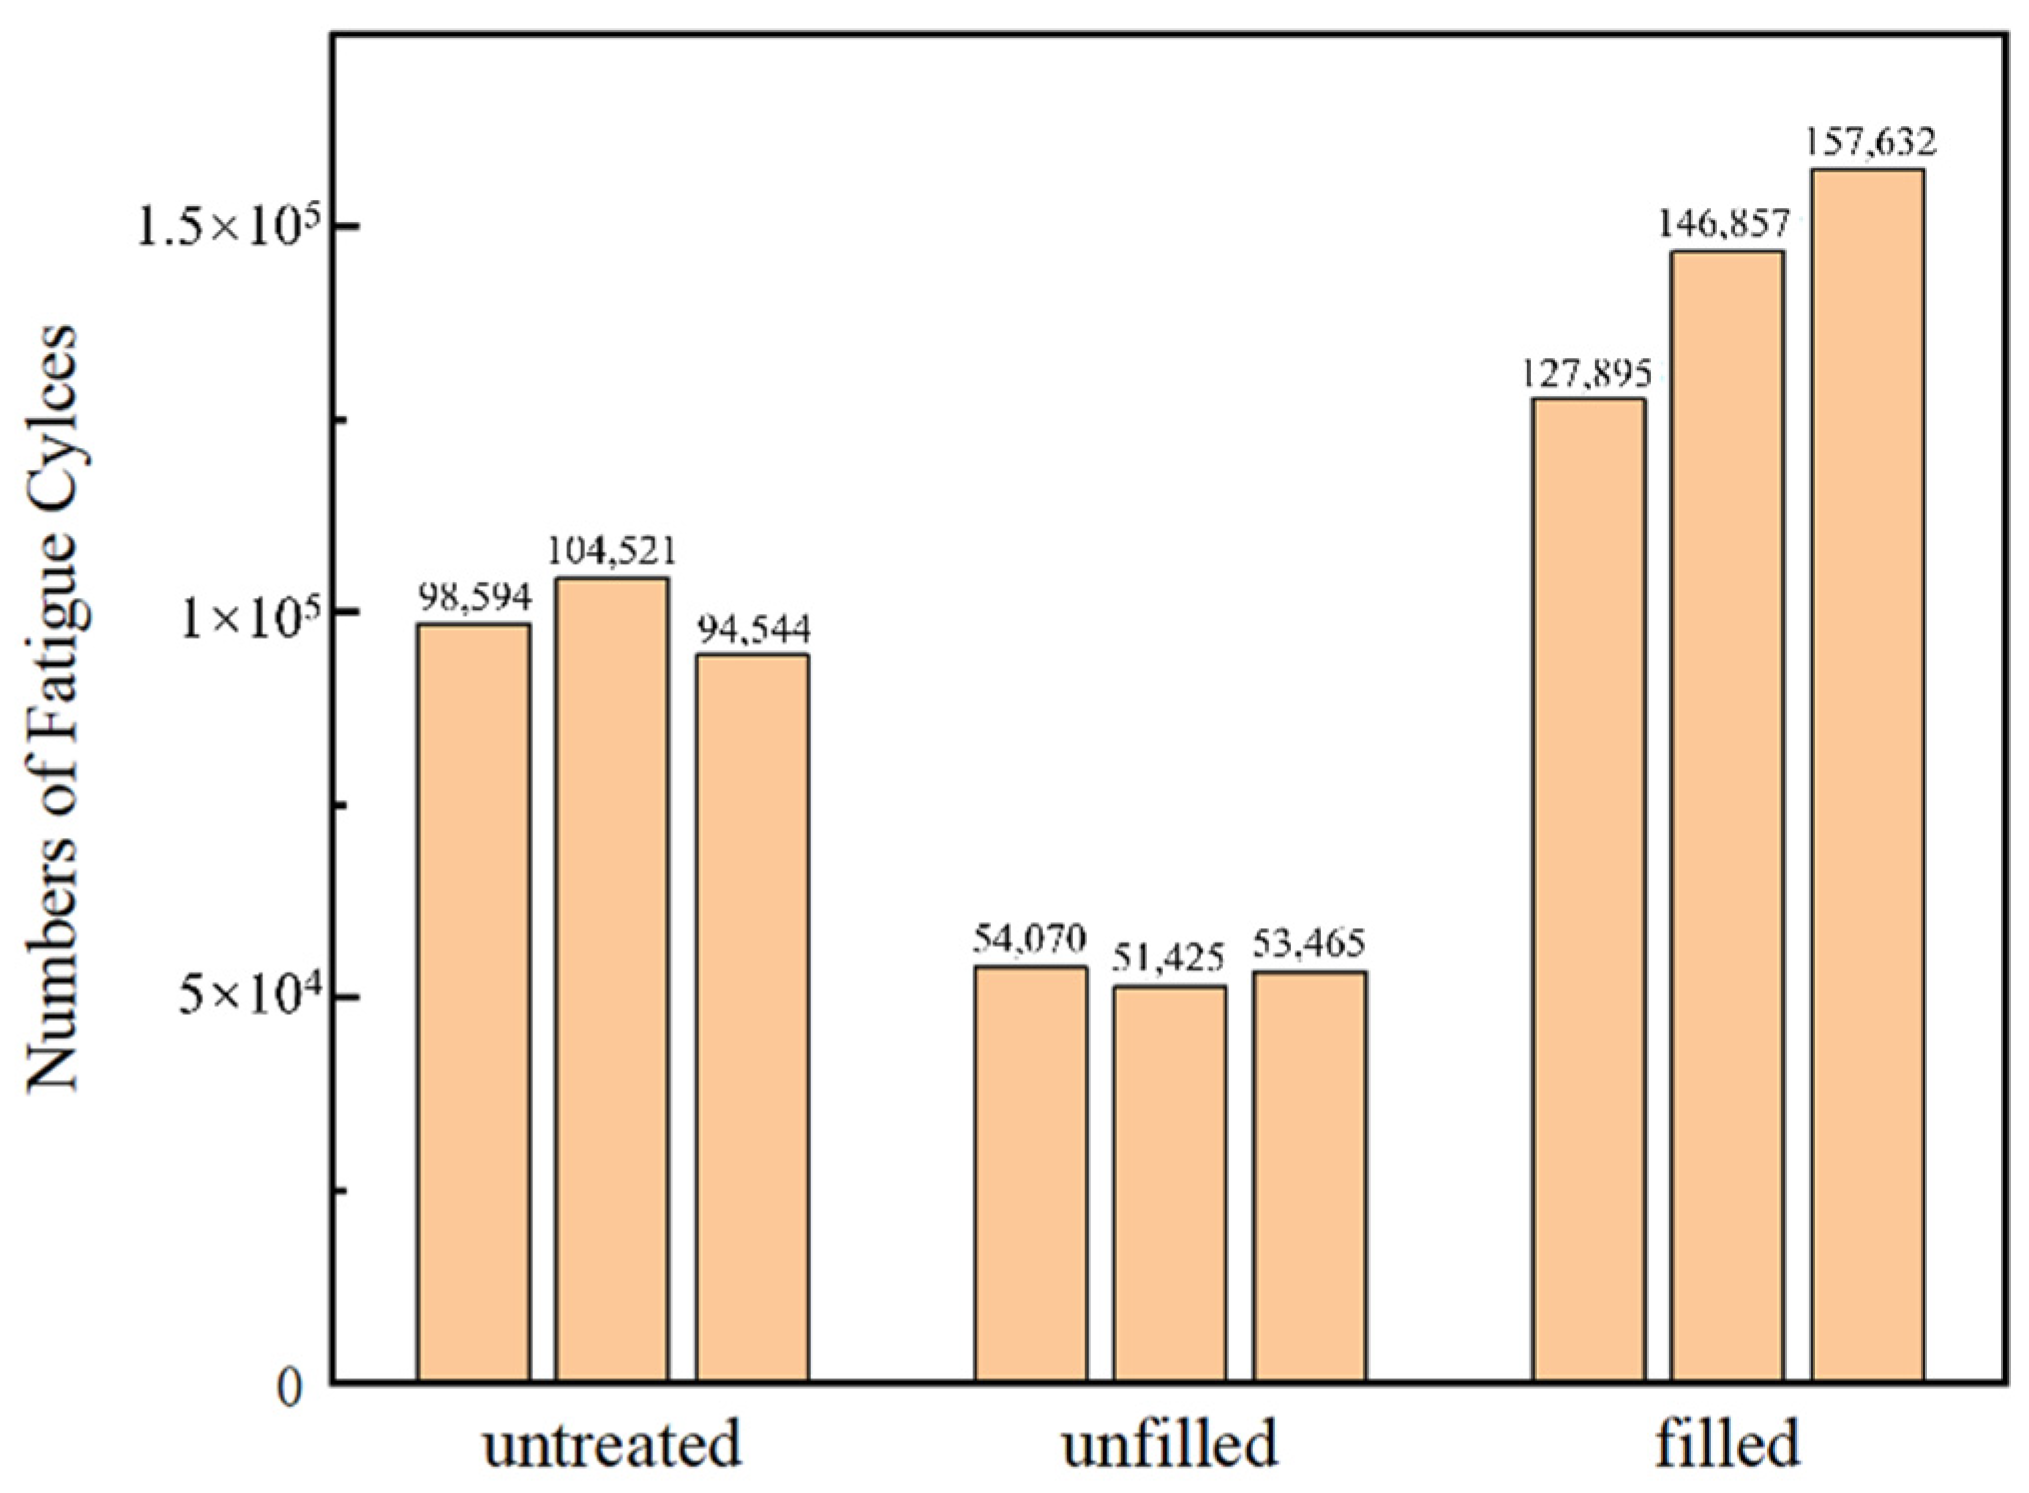
The fatigue test results of the thin-walled pipe are shown in Figure 15. When compared to untreated specimens, the fatigue-cycle number of the filled specimens treated with LSP was 144,128 (48.9% increase); when compared to unfilled specimens treated with LSP, the fatigue-cycle number of filled specimens treated with LSP increased by 172.0%. When LSP was directly applied to the thin-walled pipes, the fatigue performance was significantly lower, this being related to the chaotic residual stress field after LSP.

3.2.3. SEM Observation Results of the Fracture

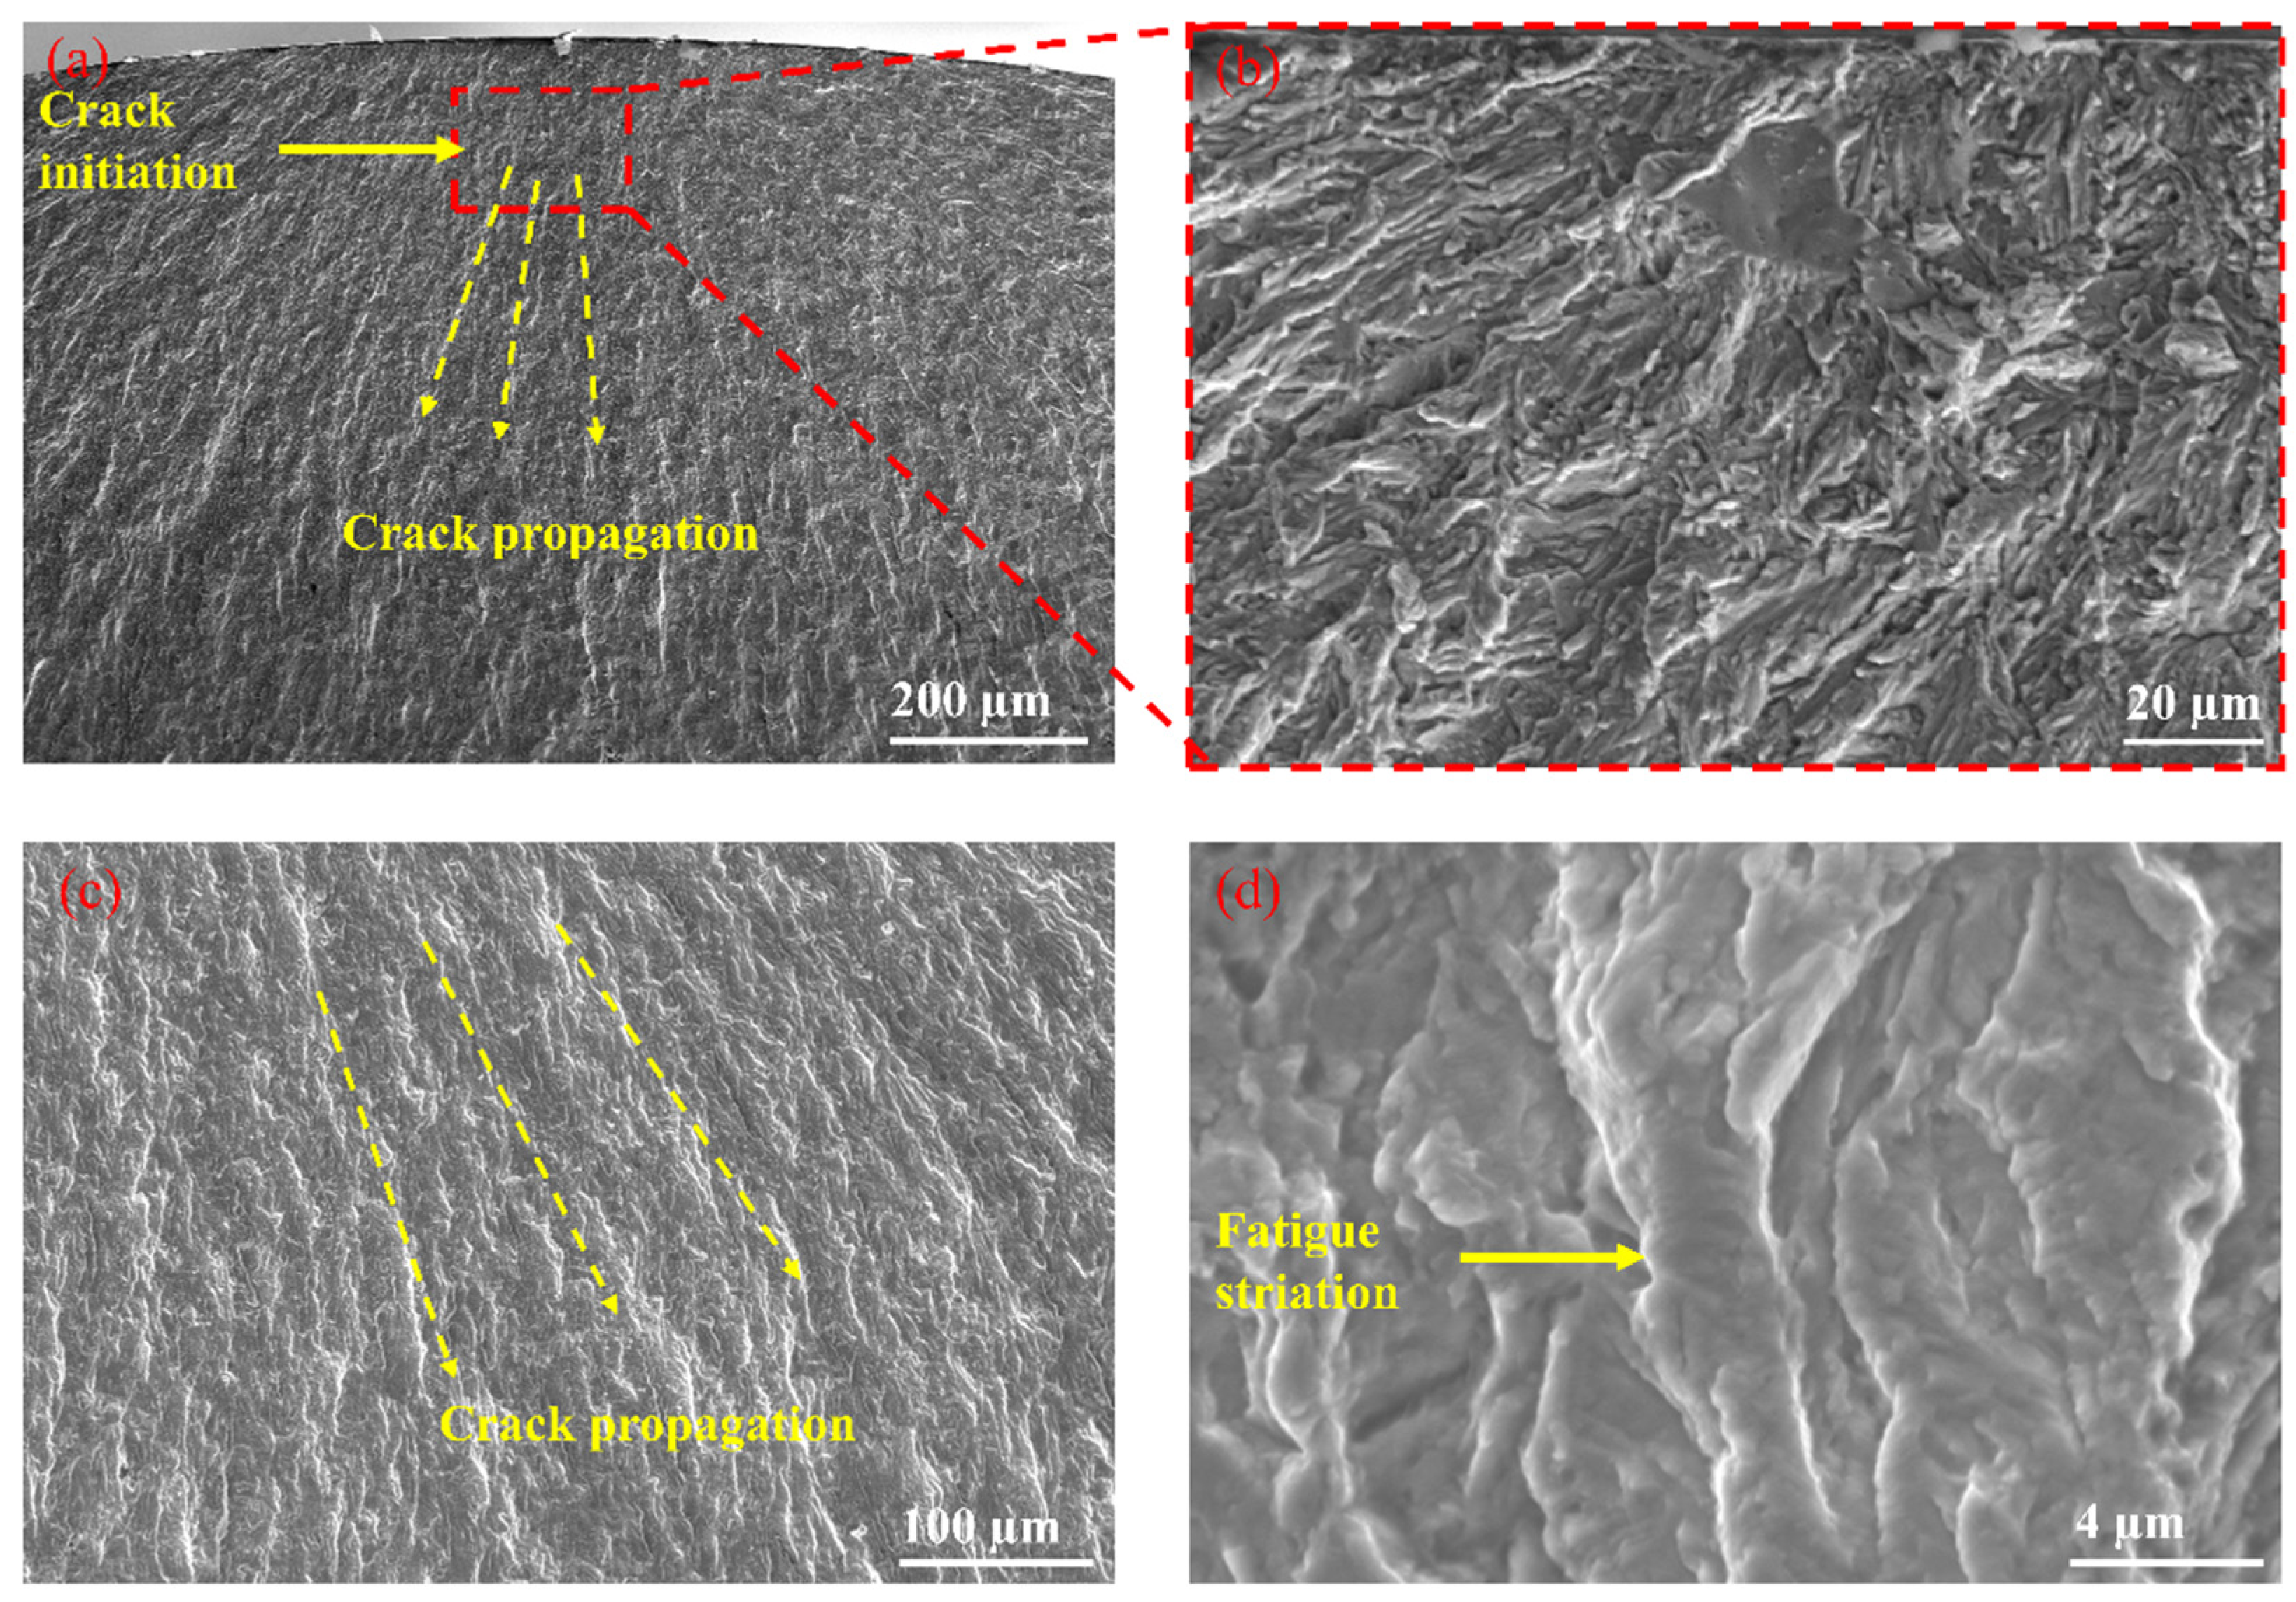
The fracture morphology of an untreated stainless-steel thin-walled pipe is shown in Figure 16. The fatigue source of the untreated pipe began on the surface of the specimen and then progressively extended to the surrounding region, as shown in Figure 16a,b. In the fracture source region, a typical river pattern morphology can be seen. The fracture morphology in the crack propagation region, as illustrated in Figure 16c,d, was primarily characterized by uneven fatigue striation, while the crack grew swiftly toward the inner material.
The fracture morphology of a stainless-steel thin-walled pipe treated with filling LSP is shown in Figure 17. There were many tearing ridges, and the initial location of the crack source of the specimen fracture was on the pipe’s subsurface, as shown in Figure 17a,b. The fracture spread in a divergent way in the crack propagation zone, as illustrated in Figure 17c,d, while the fatigue striation of the specimen treated with filling LSP grew thinner and denser. Furthermore, it was also noted that many tearing ridges were formed in the crack propagation regions of those specimens treated with filling LSP, representing the typical fracture characteristic of a specimen with a complicated stress state.
The reason for the crack sources being located in different regions is that the high-amplitude compressive residual stress and nanograin layer on the surface effectively delayed fatigue crack initiation from the specimen surface treated with filling LSP. During the fatigue experiments, part of the working tensile residual stress was offset by the compressive residual stress created on the surface with filling LSP, which initiated the fatigue fracture from the subsurface, where the compressive residual stress was relatively low. However, there were constraints on the deformation of the surface, thus limiting the initiation of fatigue fractures. The fatigue striation in specimens treated with filling LSP was much thinner than that in untreated specimens, demonstrating the finding that filling LSP substantially decreased the fatigue-crack growth rate. When the fatigue crack was propagated, the stress intensity factor range and stress ratio, R, dropped due to the existence of compressive residual stress, which could reduce the fatigue-crack growth rate. The fatigue-crack propagating rate was also reduced because of the closing effects of microscopic cracks caused by compressive residual stress [37].

4. Conclusions

This article combined experimental and numerical studies of the residual stress field and fatigue performance in a stainless-steel thin-walled pipe treated with LSP. The effects of power density, spot size, and guided wave material filling on the stress field were investigated. Then, the surface residual stress field and fatigue performance of the pipes treated with LSP were tested. The main findings can be summarized as follows:
(1)
It was found that, with the increase in laser power density, the residual compressive stress first increased first and then decreased according to the numerical simulation, while the residual compressive stress field had a higher value and a more uniform distribution at 3.9 GW·cm−2.
(2)
The numerical simulation results showed that, with the increase in the spot diameter, the reflected wave’s effect range expanded, causing the unloaded region to be increasingly influenced by the reflected tensile wave. The tensile wave that was reflected could result in a residual tensile stress area in the surrounding region.
(3)
After filling with the guided wave material, the effect of the stress wave reflection on the residual stress field could be greatly reduced. The residual compressive stress on the pipe’s surface increased by 57.6%, while the influence depth increased by 43%.
(4)
The fatigue performance of a pipe treated with filling LSP was 48.9% better than that of an untreated pipe, according to the bending fatigue test. Through fracture observation, it could be seen that the crack initiation of the specimen after LSP was initiated from the subsurface.

Author Contributions

Conceptualization, L.Z. and K.Y.; methodology, L.Z.; validation, K.Y. and L.W.; formal analysis, L.Z. and K.Y.; investigation, L.Z. and K.Y.; resources, L.Z., L.W. and T.Z.; data curation, L.W.; writing—original draft preparation, K.Y.; writing—review and editing, L.Z. and L.W.; visualization, T.Z. and S.S.; supervision, L.Z.; project administration, L.Z. All authors have read and agreed to the published version of the manuscript.

Funding

This work was supported by the National Major Science and Technology Project of China (grant number J2019-IV-0014-0082) and the National Natural Foundation of China (grant number No. 51875574).

Institutional Review Board Statement

Not applicable.

Informed Consent Statement

Not applicable.

Data Availability Statement

The data used to support the findings of this study are available from the corresponding author upon request.

Conflicts of Interest

The authors declare no conflict of interest.

References

  1. Zhang, J.; Li, W.; Lin, J.; Qiu, Y.; Yuan, Y.; Zhou, T. Failure analysis of a high-pressure fuel pipe of engine. Eng. Fail. Anal. 2019, 103, 70–81. [Google Scholar] [CrossRef]
  2. Peng, X.; Yu, H.; Lian, Z.; Dong, B.; Zhong, W.; Zhang, Y.; Hu, Z. Material optimization of drill pipe in complex wellbore environments by comparing fatigue life and cost. Energy Rep. 2021, 7, 5420–5430. [Google Scholar] [CrossRef]
  3. Wang, Z.; Wang, X.; Huang, H.; Gan, J.; Yang, Y.; He, J.; Shi, M. Effect of High-Energy Shot Peening on Surface Nanocrystallization and Integrity of AISI 4140 Steel: A Numerical and Experimental Investigation. J. Mater. Eng. Perform. 2021, 30, 5579–5592. [Google Scholar] [CrossRef]
  4. Jian-Bin, Z.; Ding, F.; Shu-Rong, Y.; Jing-Yi, W. Influence of mechanical surface treatments on fatigue strength of commercial purity titanium. J. Mater. Sci. 2003, 38, 3455–3459. [Google Scholar] [CrossRef]
  5. Inamke, G.V.; Pellone, L.; Ning, J.; Shin, Y.C. Enhancement of weld strength of laser-welded joints of AA6061-T6 and TZM alloys via novel dual-laser warm laser shock peening. Int. J. Adv. Manuf. Technol. 2019, 104, 907–919. [Google Scholar] [CrossRef]
  6. Xin, R.; Lan, L.; Bai, C.; Gao, S.; He, B.; Wang, J. Fatigue properties of selective laser melted Ti-6Al-4V alloy subjected to laser shock processing. J. Mater. Sci. 2022, 57, 9619–9630. [Google Scholar] [CrossRef]
  7. Peyre, P.; Carboni, C.; Forget, P.; Beranger, G.; Lemaitre, C.; Stuart, D. Influence of thermal and mechanical surface modifications induced by laser shock processing on the initiation of corrosion pits in 316L stainless steel. J. Mater. Sci. 2007, 42, 6866–6877. [Google Scholar] [CrossRef]
  8. Irizalp, S.G.; Saklakoglu, N.; Akman, E.; Demir, A. Pulsed Nd:YAG laser shock processing effects on mechanical properties of 6061-T6 alloy. Opt. Laser Technol. 2014, 56, 273–277. [Google Scholar] [CrossRef]
  9. Gao, Y.; Yang, W.; Huang, Z.; Lu, Z. Effects of residual stress and surface roughness on the fatigue life of nickel aluminium bronze alloy under laser shock peening. Eng. Fract. Mech. 2021, 244, 107524. [Google Scholar] [CrossRef]
  10. Kattoura, M.; Mannava, S.R.; Qian, D.; Vasudevan, V.K. Effect of laser shock peening on residual stress, microstructure and fatigue behavior of ATI 718Plus alloy. Int. J. Fatigue 2017, 102, 121–134. [Google Scholar] [CrossRef]
  11. Qin, Z.; Li, B.; Huang, X.; Zhang, H.; Chen, R.; Adeel, M.; Xue, H. The effect of laser shock peening on surface integrity and high and very high cycle fatigue properties of 2024-T351 aluminum alloy. Opt. Laser Technol. 2022, 149, 107897. [Google Scholar] [CrossRef]
  12. Peyre, P.; Berthe, L.; Scherpereel, X.; Fabbro, R. Laser-shock processing of aluminium-coated 55C1 steel in water-confinement regime, characterization and application to high-cycle fatigue behaviour. J. Mater. Sci. 1998, 33, 1421–1429. [Google Scholar] [CrossRef]
  13. Luo, S.; Zhou, L.; Nie, X.; Li, Y.; He, W. The compound process of laser shock peening and vibratory finishing and its effect on fatigue strength of Ti-3.5Mo-6.5Al-1.5Zr-0.25 Si titanium alloy. J. Alloy Compd. 2019, 783, 828–835. [Google Scholar] [CrossRef]
  14. Rodopoulos, C.A.; Romero, J.S.; Curtis, S.A.; Rios, E.R.D.L.; Peyre, D.P. Effect of Controlled Shot Peening and Laser Shock Peening on the Fatigue Performance of 2024-T351 Aluminum Alloy. J. Mater. Eng. Perform. 2003, 12, 414–419. [Google Scholar] [CrossRef]
  15. Granados-Alejo, V.; Rubio-González, C.; Vázquez-Jiménez, C.; Banderas, J.; Gómez-Rosas, G. Influence of specimen thickness on the fatigue behavior of notched steel plates subjected to laser shock peening. Opt. Laser Technol. 2018, 101, 531–544. [Google Scholar] [CrossRef]
  16. Nalla, R.K.; Altenberger, I.; Noster, U.; Liu, G.Y.; Scholtes, B.; Ritchie, R.O. On the influence of mechanical surface treatments—deep rolling and laser shock peening—on the fatigue behavior of Ti-6Al-4V at ambient and elevated temperatures. Mater. Sci. Eng. A 2003, 355, 216–230. [Google Scholar] [CrossRef]
  17. Feng, X.; Pan, X.; He, W.; Liu, P.; An, Z.; Zhou, L. Improving high cycle fatigue performance of gas tungsten arc welded Ti6Al4V titanium alloy by warm laser shock peening. Int. J. Fatigue 2021, 149, 106270. [Google Scholar] [CrossRef]
  18. William, B.; Robert, B. Finite element simulation of laser shock peening. Int. J. Fatigue 1999, 21, 719–724. [Google Scholar]
  19. Hu, Y.; Yao, Z.; Hu, J. 3-D FEM simulation of laser shock processing. Surf. Coatings Technol. 2006, 201, 1426–1435. [Google Scholar] [CrossRef]
  20. Yang, C.; Hodgson, P.D.; Liu, Q.; Ye, L. Geometrical effects on residual stresses in 7050-T7451 aluminum alloy rods subject to laser shock peening. J. Mater. Process. Technol. 2008, 201, 303–309. [Google Scholar] [CrossRef]
  21. Vasu, A.; Grandhi, R.V. Effects of curved geometry on residual stress in laser peening. Surf. Coat. Technol. 2013, 218, 71–79. [Google Scholar] [CrossRef]
  22. Ivetic, G. Three-dimensional FEM analysis of laser shock peening of aluminium alloy 2024-T351 thin sheets. Surf. Eng. 2011, 27, 445–453. [Google Scholar] [CrossRef]
  23. Cellard, C.; Retraint, D.; Francois, M.; Rouhaud, E.; Le Saunier, D. Laser shock peening of Ti-17 titanium alloy: Influence of process parameters. Mater. Sci. Eng. A 2012, 532, 362–372. [Google Scholar] [CrossRef]
  24. Shi, X.; Feng, X.; Teng, J.; Zhang, K.; Zhou, L. Effect of laser shock peening on microstructure and fatigue properties of thin-wall welded Ti-6Al-4V alloy. Vacuum 2021, 184, 109986. [Google Scholar] [CrossRef]
  25. Fang, Y. Simulation and Experiment of Impact Effects of Nanosecond Pulse Laser-Generated Processing Ti-6Al-4V Alloy. J. Mater. Eng. Perform. 2021, 30, 5515–5523. [Google Scholar] [CrossRef]
  26. Vasu, A.; Hu, Y.; Grandhi, R.V. Differences in plasticity due to curvature in laser peened components. Surf. Coatings Technol. 2013, 235, 648–656. [Google Scholar] [CrossRef]
  27. Johnsin, G.R.; Cook, W.H. A constitutive model and data for metals subjected to large Strains, high strain rates and high temperatures. Eng. Fract. Mech. 1983, 21, 541–548. [Google Scholar]
  28. Zhou, W.; Ren, X.; Yang, Y.; Tong, Z.; Larson, E.A. Finite element analysis of laser shock peening induced near-surface deformation in engineering metals. Opt. Laser Technol. 2019, 119, 105608. [Google Scholar] [CrossRef]
  29. Li, X.; He, W.; Luo, S.; Nie, X.; Tian, L.; Feng, X.; Li, R. Simulation and Experimental Study on Residual Stress Distribution in Titanium Alloy Treated by Laser Shock Peening with Flat-Top and Gaussian Laser Beams. Materials 2019, 12, 1343. [Google Scholar] [CrossRef] [Green Version]
  30. Giddaluri, R.; Rajyalakshmi, G. FE simulation for stress distribution and surface deformation in Ti-6Al-4V induced by interaction of multi scale laser shock peening parameters. Optik 2020, 206, 164280. [Google Scholar]
  31. Laakso, S.V.; Agmell, M.; Ståhl, J.-E. The mystery of missing feed force—The effect of friction models, flank wear and ploughing on feed force in metal cutting simulations. J. Manuf. Process. 2018, 33, 268–277. [Google Scholar] [CrossRef]
  32. Lee, S.; Barthelat, F.; Hutchinson, J.W.; Espinosa, H.D. Dynamic Failure of Metallic Pyramidal Truss Core Materials-Experiments and Modeling. Int. J. Plast. 2006, 22, 2118–2145. [Google Scholar] [CrossRef]
  33. Fabbro, R.; Fournier, J.; Ballard, P.; Devaux, D.; Virmont, J. Physicl study of laser produced plasma in confined geometry. J. Appl. Phys. 1990, 68, 775–784. [Google Scholar] [CrossRef]
  34. Ballard, P.; Fournier, J.; Fabbro, R. Residual stresses induced by laser-shock. J. Phys. IV 1991, 1, 132. [Google Scholar] [CrossRef]
  35. Fabbro, R.; Peyre, P.; Berthe, L.; Scherpereel, X. Physics and applications of laser-shock processing. J. Laser Appl. 1998, 10, 265–279. [Google Scholar] [CrossRef]
  36. Peyre, P.; Berthe, L.; Fabbro, R.; Sollier, A. Experimental determination by PVDF and EMV techniques of shock waves induced by 0.6 to 3 ns laser pulses in confined regime with water. J. Phys. D Appl. Phys. 2000, 33, 498–503. [Google Scholar] [CrossRef]
  37. Sano, Y.; Masaki, K.; Gushi, T.; Sano, T. Improvement in fatigue performance of friction stir welded A6061-T6 aluminum alloy by laser peening without coating. Mater. Des. 2012, 36, 809–814. [Google Scholar] [CrossRef]
Figure 1. Experimental stainless-steel hydraulic pipe.
Metals 12 01733 g001
Figure 2. Laser scanning path.
Metals 12 01733 g002
Figure 3. (a) Schematic diagram of shock wave propagation; (b) finite element model.
Metals 12 01733 g003
Figure 4. Schematic diagram showing spot distortion.
Metals 12 01733 g004
Figure 5. (a,b) Temporal and spatial distribution of laser pressure, with a laser pulse width (LPW) of 20 ns; (c) scanning path; (d) boundary conditions.
Metals 12 01733 g005
Figure 6. Residual stress nephogram and residual stresses in surface and depth directions of different power density: (a) 1.9 GW·cm−2, (b) 3.9 GW·cm−2, and (c) 5.9 GW·cm−2; (d) residual stress numerical extraction path; (e) residual stresses in the surface direction; (f) residual stresses in the depth direction.
Metals 12 01733 g006
Figure 7. The von Mises stress nephogram of shock waves with different power densities reaching the upper surface: (a) 1.9 GW·cm−2, (b) 3.9 GW·cm−2, and (c) 5.9 GW·cm−2.
Metals 12 01733 g007
Figure 8. (a,b) Stress propagation nephogram of pipe fittings and flat components; (c) schematic diagram of the influence of different spot diameters on stress wave propagation.
Metals 12 01733 g008
Figure 9. Residual stress nephogram and residual stresses in the surface and depth directions of different spot diameters: (a) 0.5 mm, (b) 1 mm, and (c) 2 mm; (d) residual stresses in the surface direction; (e) residual stresses in the depth direction.
Metals 12 01733 g009
Figure 10. (ac) Stress wave propagation nephogram of different spot diameters: (a) 0.5 mm, (b) 1 mm, and (c) 2 mm; (d) stress wave reflection diagram of different spot diameters.
Metals 12 01733 g010
Figure 11. Residual stress in the surface and depth directions and the deformation of filled and unfilled guided-wave materials: (a) filled guided-wave materials; (b) unfilled guided-wave materials; (c) residual stresses in the surface directions; (d) residual stresses in the depth directions; (e) deformation of the filled guided-wave materials; (f) deformation of the unfilled guided-wave materials.
Metals 12 01733 g011
Figure 12. Stress propagation nephogram of filled guided-wave material (a) when the stress wave has just entered the guided-wave material, and (b) after the stress wave propagates in the guided-wave material for a set period of time.
Metals 12 01733 g012
Figure 13. Residual stress on the test surface.
Metals 12 01733 g013
Figure 14. Rotary bending fatigue test and the scheme of loading and fastening of the specimen. (a) testing equipment, (b) Schematic diagram of equipment.
Metals 12 01733 g014
Figure 15. Fatigue test experimental results.
Metals 12 01733 g015
Figure 16. Fracture morphology of the untreated specimen: (a,b) fracturing source; (c) crack propagation region; (d) fatigue striation.
Metals 12 01733 g016
Figure 17. Fracture morphology specimen with LSP: (a,b) fracture source; (c) crack propagation region; (d) fatigue striation.
Metals 12 01733 g017
Table 1. Mechanical properties parameters of stainless steel.
ρ (kg/m3)Σ (MPa)σ0.2 (MPa)E (GPa)ν
78005202052000.29
Table 2. The J–C model parameters of stainless steel [31,32].
A (MPa)B (MPa)Cnmt0 (K)tm (K)
31010000.070.6512931673
Table 3. Parameters of the guided wave material.
ρ (kg/m3)E (GPa)ν
78002000.29
Publisher’s Note: MDPI stays neutral with regard to jurisdictional claims in published maps and institutional affiliations.