Article

Corrosion Resistance of Mg(OH)2/Mn(OH)2 Hydroxide Film on ZK60 Mg Alloy

1
School of Materials Science and Engineering, Nanjing Institute of Technology, Nanjing 211167, China
2
Jiangsu Key Laboratory of Advanced Structural Materials and Application Technology, Nanjing 211167, China
*
Author to whom correspondence should be addressed.
Metals 2022, 12(10), 1760; https://doi.org/10.3390/met12101760
Submission received: 5 September 2022 / Revised: 15 October 2022 / Accepted: 18 October 2022 / Published: 19 October 2022
(This article belongs to the Special Issue Advanced Biomedical Materials)

Abstract

:
This study aims to prepare hydroxide films on the surface of ZK60 magnesium alloy to improve the corrosion resistance of the latter. The hydroxide films were fabricated with a facile hydrothermal method using Mg(NO3)2 and Mn(NO3)2 aqueous solutions. The treatment temperature was maintained at 353 K, while the treatment time was 6 h, 12 h, and 24 h. X-ray diffraction (XRD) and Fourier transform-infrared (FT-IR) spectroscopy demonstrated that the films were composed of a mixture of Mg(OH)2 and Mn(OH)2. As revealed by scanning electron microscopy (SEM), each film grew from an incomplete lamellar structure to a thick lamellar structure at changing treatment times. The corrosion current density of the 12 h film sample immersed in a simulated body fluid (SBF) reached 3.07 × 10⁻⁷ A·cm−2, which was approximately two orders of magnitude lower than that of the ZK60 magnesium alloy substrate (3.04 × 10⁻⁵ A·cm−2). In addition, the hydrogen evolution experiment showed that, even after 168 h of immersion, the 12 h film sample could still provide protection for the substrate.

1. Introduction

Magnesium (Mg) alloys have a variety of excellent properties, including a high strength-to-weight ratio, environmentally friendly characteristics, outstanding mechanical properties, and perfect biocompatibility, making them appealing for biological materials [1,2,3]. Furthermore, the elastic moduli of Mg alloys are closer to those of human bones, compared with titanium alloy and stainless steel, so Mg alloys have good development prospects in implant biomaterial applications [4,5]. However, Mg alloys are vulnerable to corrosion, which easily occurs in use. Unlike the dense passivation film formed on the surface of titanium and stainless steel in a corrosive environment, which, on the surface of Mg alloys in a humid environment, has a porous structure composed primarily of MgO and Mg(OH)2, ensuring no effective protection in the physiological environment [6,7]. Surface treatment is an effective method to improve the corrosion resistance of such alloys by isolating Mg metals from the corrosive environment. The common surface protection approaches include chemical conversion treatment, organic coating, anodic oxidation, electrochemical plating, etc. [8,9,10,11]. However, the films obtained by using these methods exhibit poor biocompatibility.
Notably, MgO or Mg(OH)2 serves as a protective film owing to its nontoxicity and biocompatible properties. Feng et al. [12] fabricated Mg(OH)2 films using an in situ hydrothermal method, simultaneously studying the effect of pH value and treatment time on the morphologies and corrosion properties of the films. The results indicated that the uniform and compact films could effectively improve the corrosion resistance of the AZ91 Mg alloy. In the in situ hydrothermal preparation process, the substrate chemically reacts with the solution to produce the film. Thus, the adhesion force is enhanced through chemical bonding between the film layer and the substrate. However, the corrosion resistance of a single Mg(OH)2 film is insufficient to protect Mg alloys as biomedical magnesium alloys, so further alignment modification is required. Tan et al. [13] synthesized a Mg(OH)2/Mg-Fe layered double hydroxide (LDH) composite film on the surface of AZ31 Mg alloy by using a hydrothermal method in NaOH solution, which effectively reduced the corrosion rate of Mg-based materials. Zhang et al. [14] obtained a superhydrophobic Mg(OH)2/Mg-Al LDH composite film by combining co-precipitation and hydrothermal process. The results demonstrated a significant improvement in corrosion resistance for the AZ31 alloy substrate due to the synergistic effect of the composite film. Moreover, as one of the most significant trace elements in human metabolism, manganese (Mn) has a variety of biological functions, including the synthesis of proteins and nucleic acids, as well as carbohydrates and mucopolysaccharides, which is conducive to the growth and development of the bone structure [15]. Certainly, there are also some reports on Mn-induced cytotoxicity. Lüthen et al. [16] discovered that cell growth and proliferation were greatly inhibited by introducing high concentrations of MnCl2 (more than 0.1 mM) into a cell culture media, while low concentrations had no such effect. Thus, it was implied that the Mn content could affect cell responses. Therefore, the fabrication of Mn-containing films for biomedical applications seems promising as long as the Mn level is adequately controlled. Li et al. [17] prepared Mg-Mn LDH on pure Mg by using an in situ growth method, which could protect the substrate from corrosion to some extent, but the corrosion resistance of alloy still needed to be improved. Furthermore, to the best of our knowledge, no studies on the corrosion resistance of Mg(OH)2/Mn(OH)2 hydroxide films produced on the surface of Mg alloys through a simple hydrothermal method have been conducted.
In view of the above, Mg(OH)2/Mn(OH)2 hydroxide films were synthesized in this work on the surface of ZK60 magnesium alloy via a facile hydrothermal process. Additionally, the effects of the hydrothermal crystallization time on the film quality and corrosion resistance were investigated.

2. Materials and Methods

2.1. Materials

The experimental materials were ZK60 Mg alloys (their nominal compositions were Zn 5.0–6.0 wt.%-Zr 0.3–0.9 wt.%-balanced Mg), and the dimensions of the samples were 20 mm × 15 mm × 5 mm. Prior to the preparation of the hydroxide films, the alloy substrates were mechanically ground with SiC paper (up to 1800 grit) until their surface was smooth and flat. The substrates were then ultrasonically cleaned with anhydrous ethanol for 10 min and dried in cold air.

2.2. Fabrication of Mg(OH)2/Mn(OH)2 Hydroxide Film

The hydroxide films were grown through a simple hydrothermal process on the ZK60 Mg alloys. The reaction solution was prepared by mixing two solutions to form a slurry. The first solution (hereafter referred to A) was obtained by dissolving Mg(NO3)2∙6H2O and Mn(NO3)2 (50 wt.%) in deionized water so that the molar ratio of Mg2+ ions was 3:1 (0.03 and 0.01 mol/L, respectively). The second solution (hereafter referred to as B) was formed by dissolving NaOH in deionized water with a concentration of 1.25 mol/L. The reaction slurry was obtained by dropping solution B into solution A until the pH value of the blend was about 10 (±0.3). Afterward, the pretreated Mg alloy substrates were transferred into a Teflon-lined autoclave and immersed in the prepared slurry. The Teflon-lined autoclave was then heated at 353 K with an immersion time of 6 h, 12 h, or 24 h to form the film. The as-prepared samples were rinsed ultrasonically with deionized water and dried in cold air. The specimens were labeled as 6 h, 12 h, and 24 h according to the corresponding immersion time. In addition, a Mg(OH)2 film as a control sample was produced through immersion in the reaction solution for 12 h.

2.3. Characterization

The phase compositions of the films were investigated by using X-ray diffraction (XRD, Rigaku UltimaIV, Matsushihara, Japan) with a Cu target as a radiation source, and the obtained data were processed in MDI Jade software (version 6.0, ICCD, Newtown Square, PA, USA) The types of chemical bonds in the films were determined by Fourier transform-infrared spectroscopy (FT-IR, Nicolet Is 10, Thermo, Waltham, MA, USA) within the spectral range from 4000 to 500 cm−1. The surface morphology and elementary composition were characterized by using scanning electron microscopy (SEM, JSM-6360LV, JEOL, Toshima, Japan) coupled with energy-dispersive X-ray spectroscopy (EDS, JEOL, Toshima, Japan).
The corrosion resistance of the samples was assessed through electrochemical tests and immersion experiments. All corrosion resistance tests were performed at 37 °C in a simulated body fluid (SBF) with the following composition: NaCl (8.0 g/L), Na2CO3 (2.036 g/L), KCl (0.4 g/L), NaHCO3 (0.35 g/L), MgCl2·7H2O (0.2 g/L), CaCl2 (0.14 g/L), KH2PO4 (0.06 g/L), Na2HPO4 (0.06 g/L), and glucose (1 g/L). The electrochemical tests, including potentiodynamic polarization (PDP) and electrochemical impedance spectroscopy (EIS), were conducted using an Ametek Parstat2273 workstation with PowerSuit software (version 2.2.1, Ametek, San Diego, CA, USA). During the measurements, each sample served as the working electrode, a platinum plate was used as the counter electrode, and a saturated calomel electrode (SCE) was the reference electrode. Before starting the experiments, the samples were kept at an open circuit potential (OCP) for 10 min to stabilize them. The potential range of potentiodynamic polarization curves was from −500 to +800 mV, compared with the OCPs at a scanning rate of 3 mV·s−1. The EIS tests were carried out at the frequencies changing from 100 kHz to 100 mHz and the ac amplitude of 10 mV. The test area exposed to the solution was 1 cm2.
The immersion tests were conducted for 168 h; in the course of the measurements, the SBF solution was changed every 24 h. The samples were suspended in an inverted triangular funnel through suspension, and the centrifuge tube was buckled above the funnel. The temperature was maintained at about 37 °C, and the ratio of the contact area to the solution volume was 1 cm2:60 mL.

3. Results and Discussions

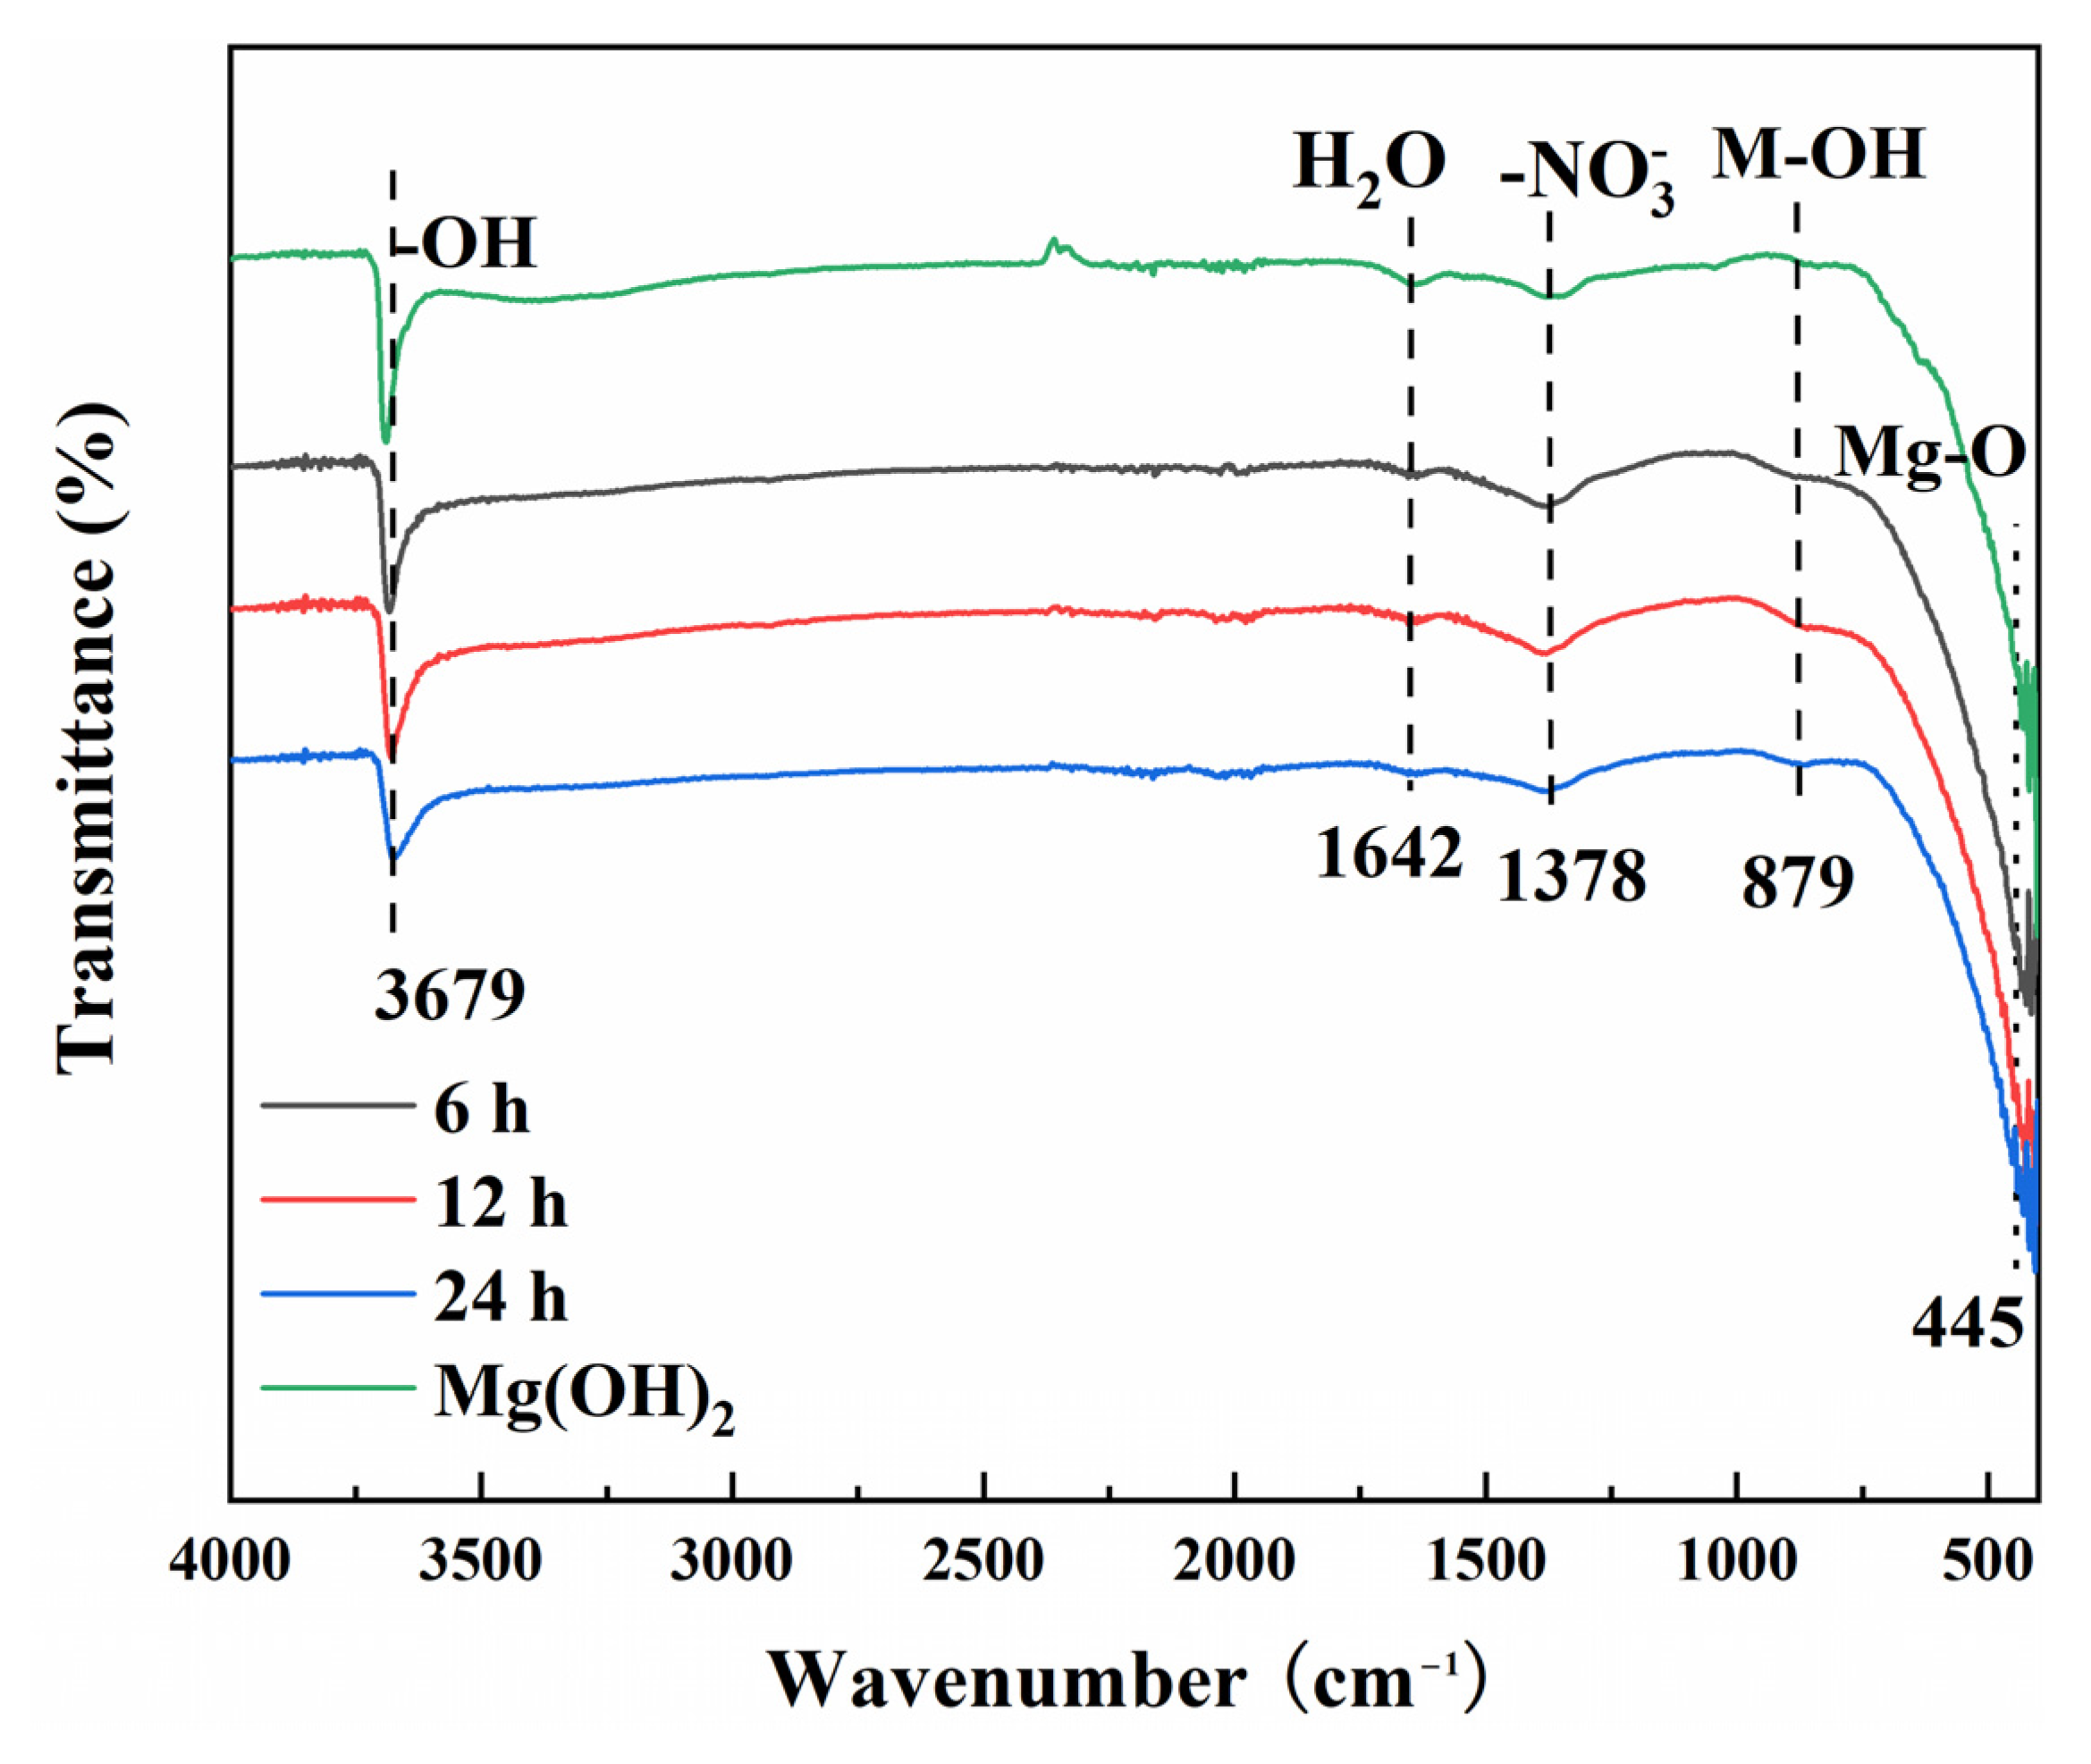
3.1. Composition of Films
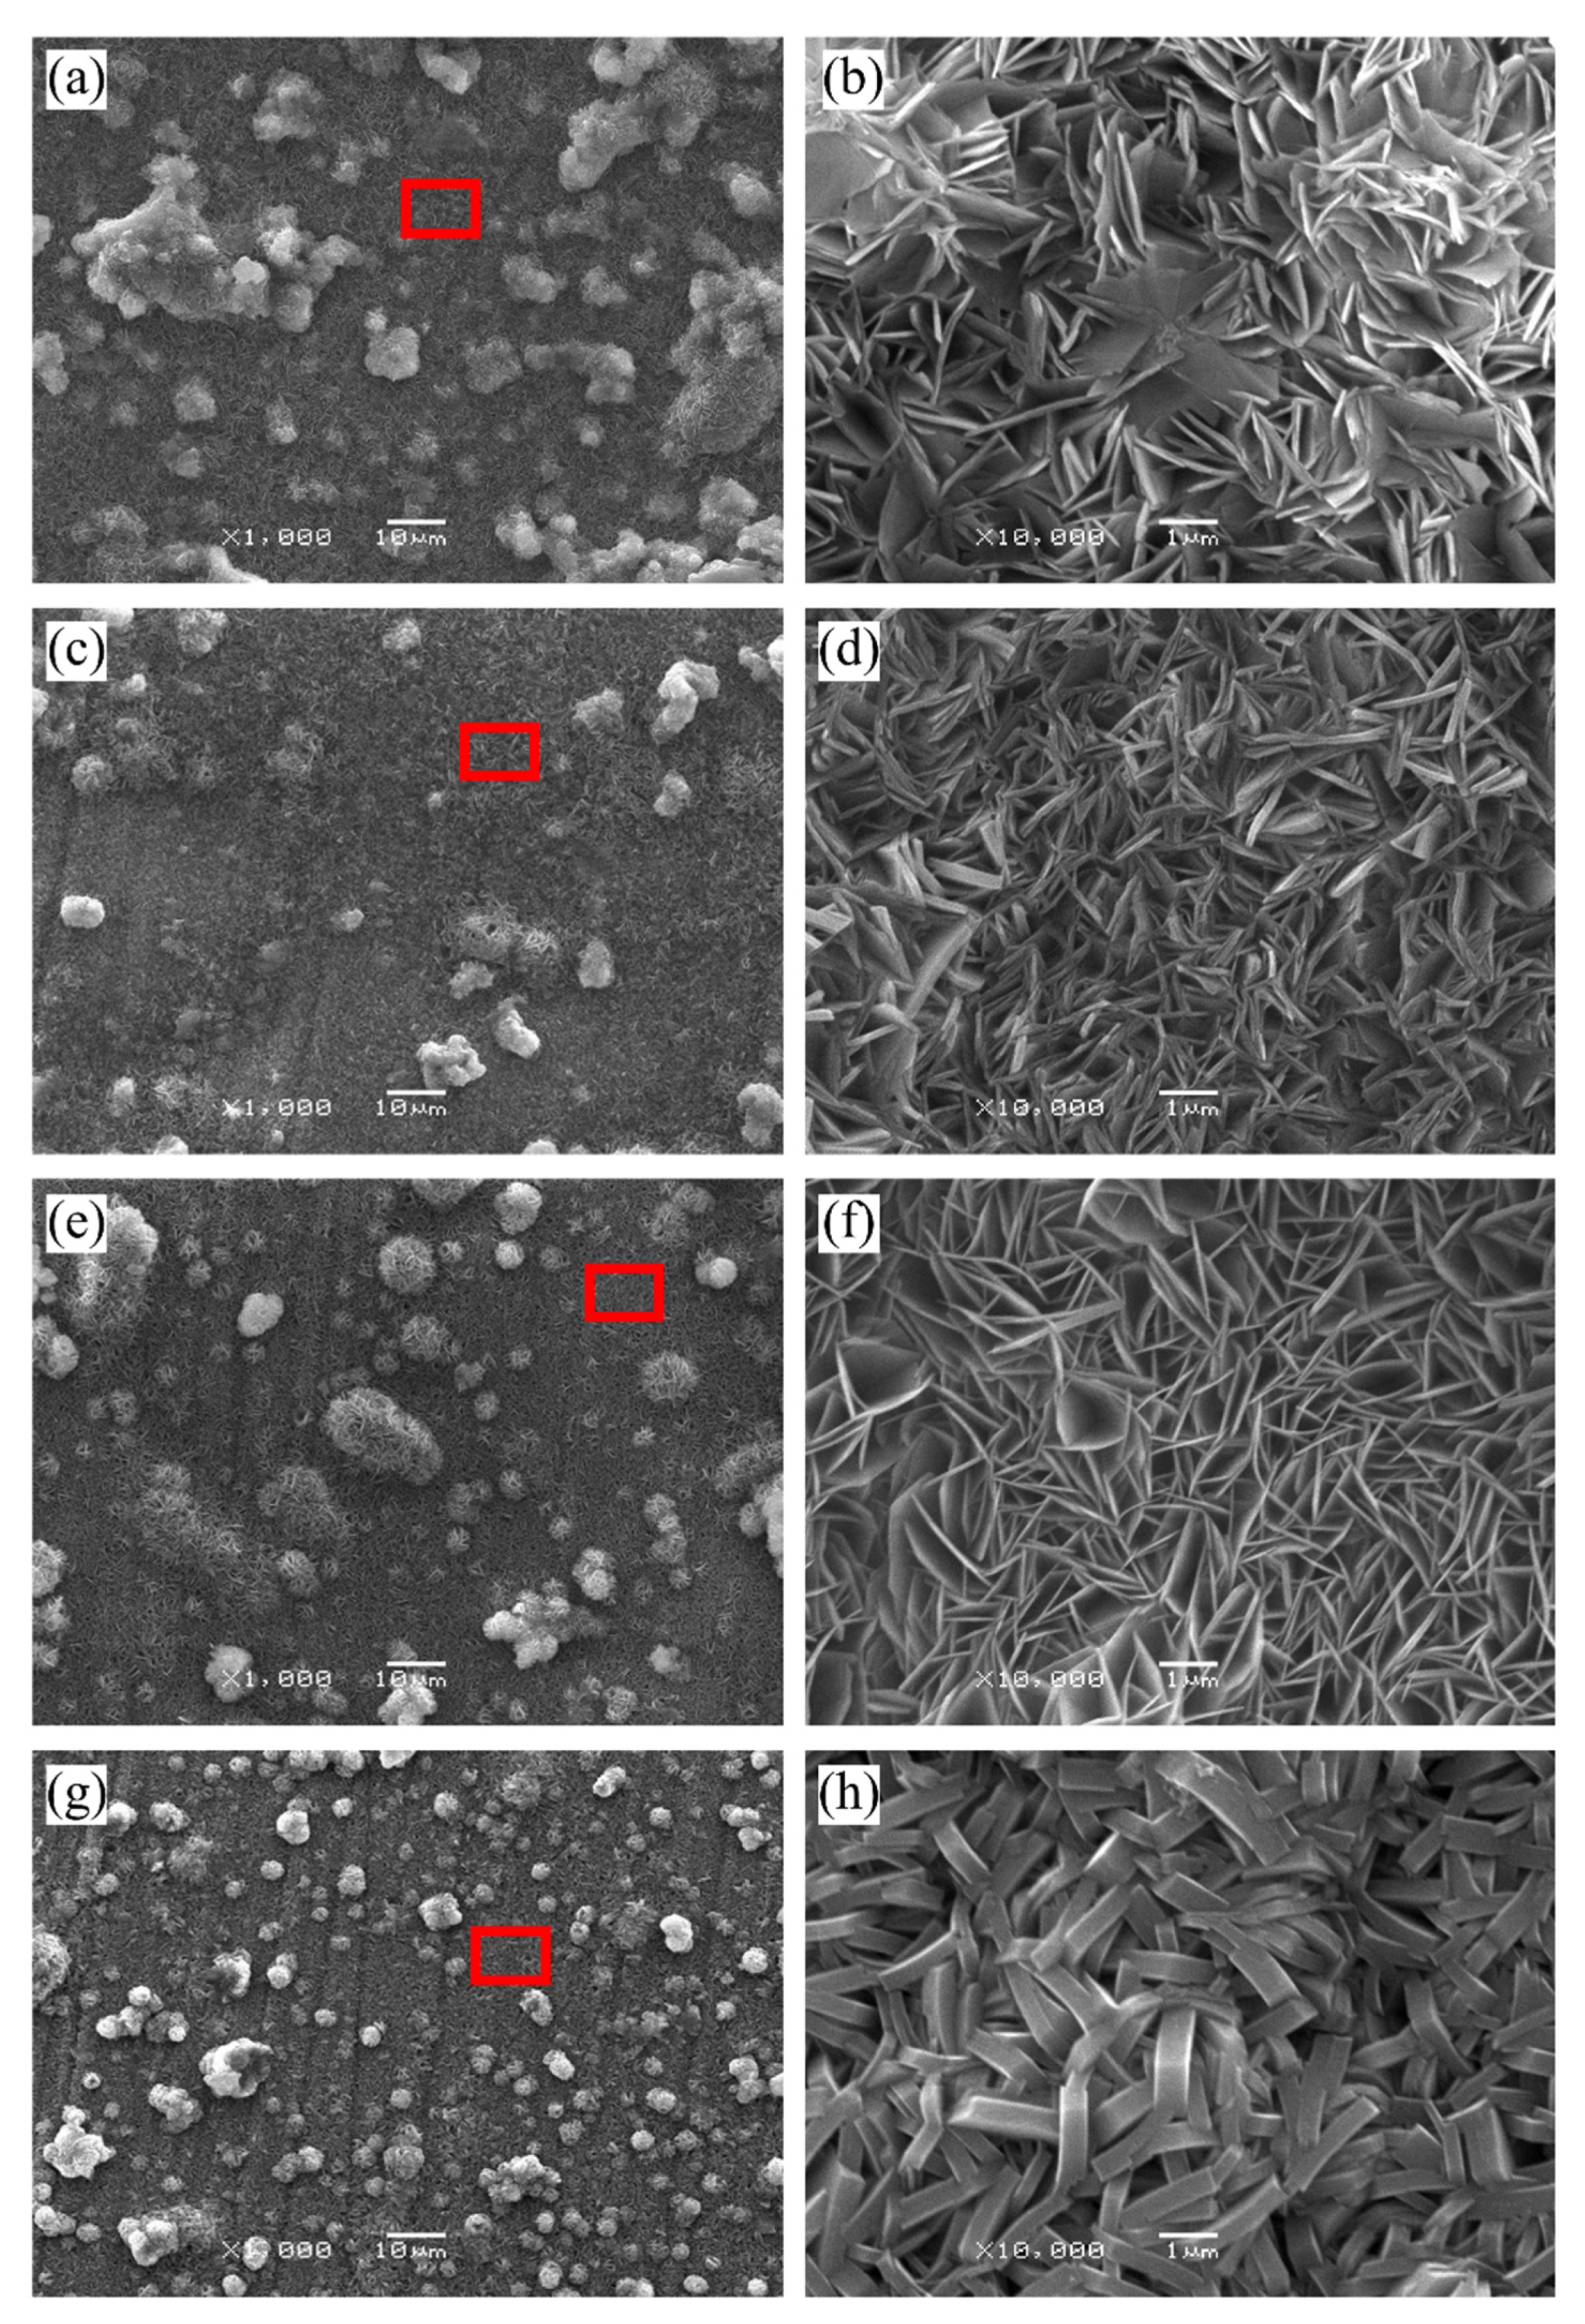
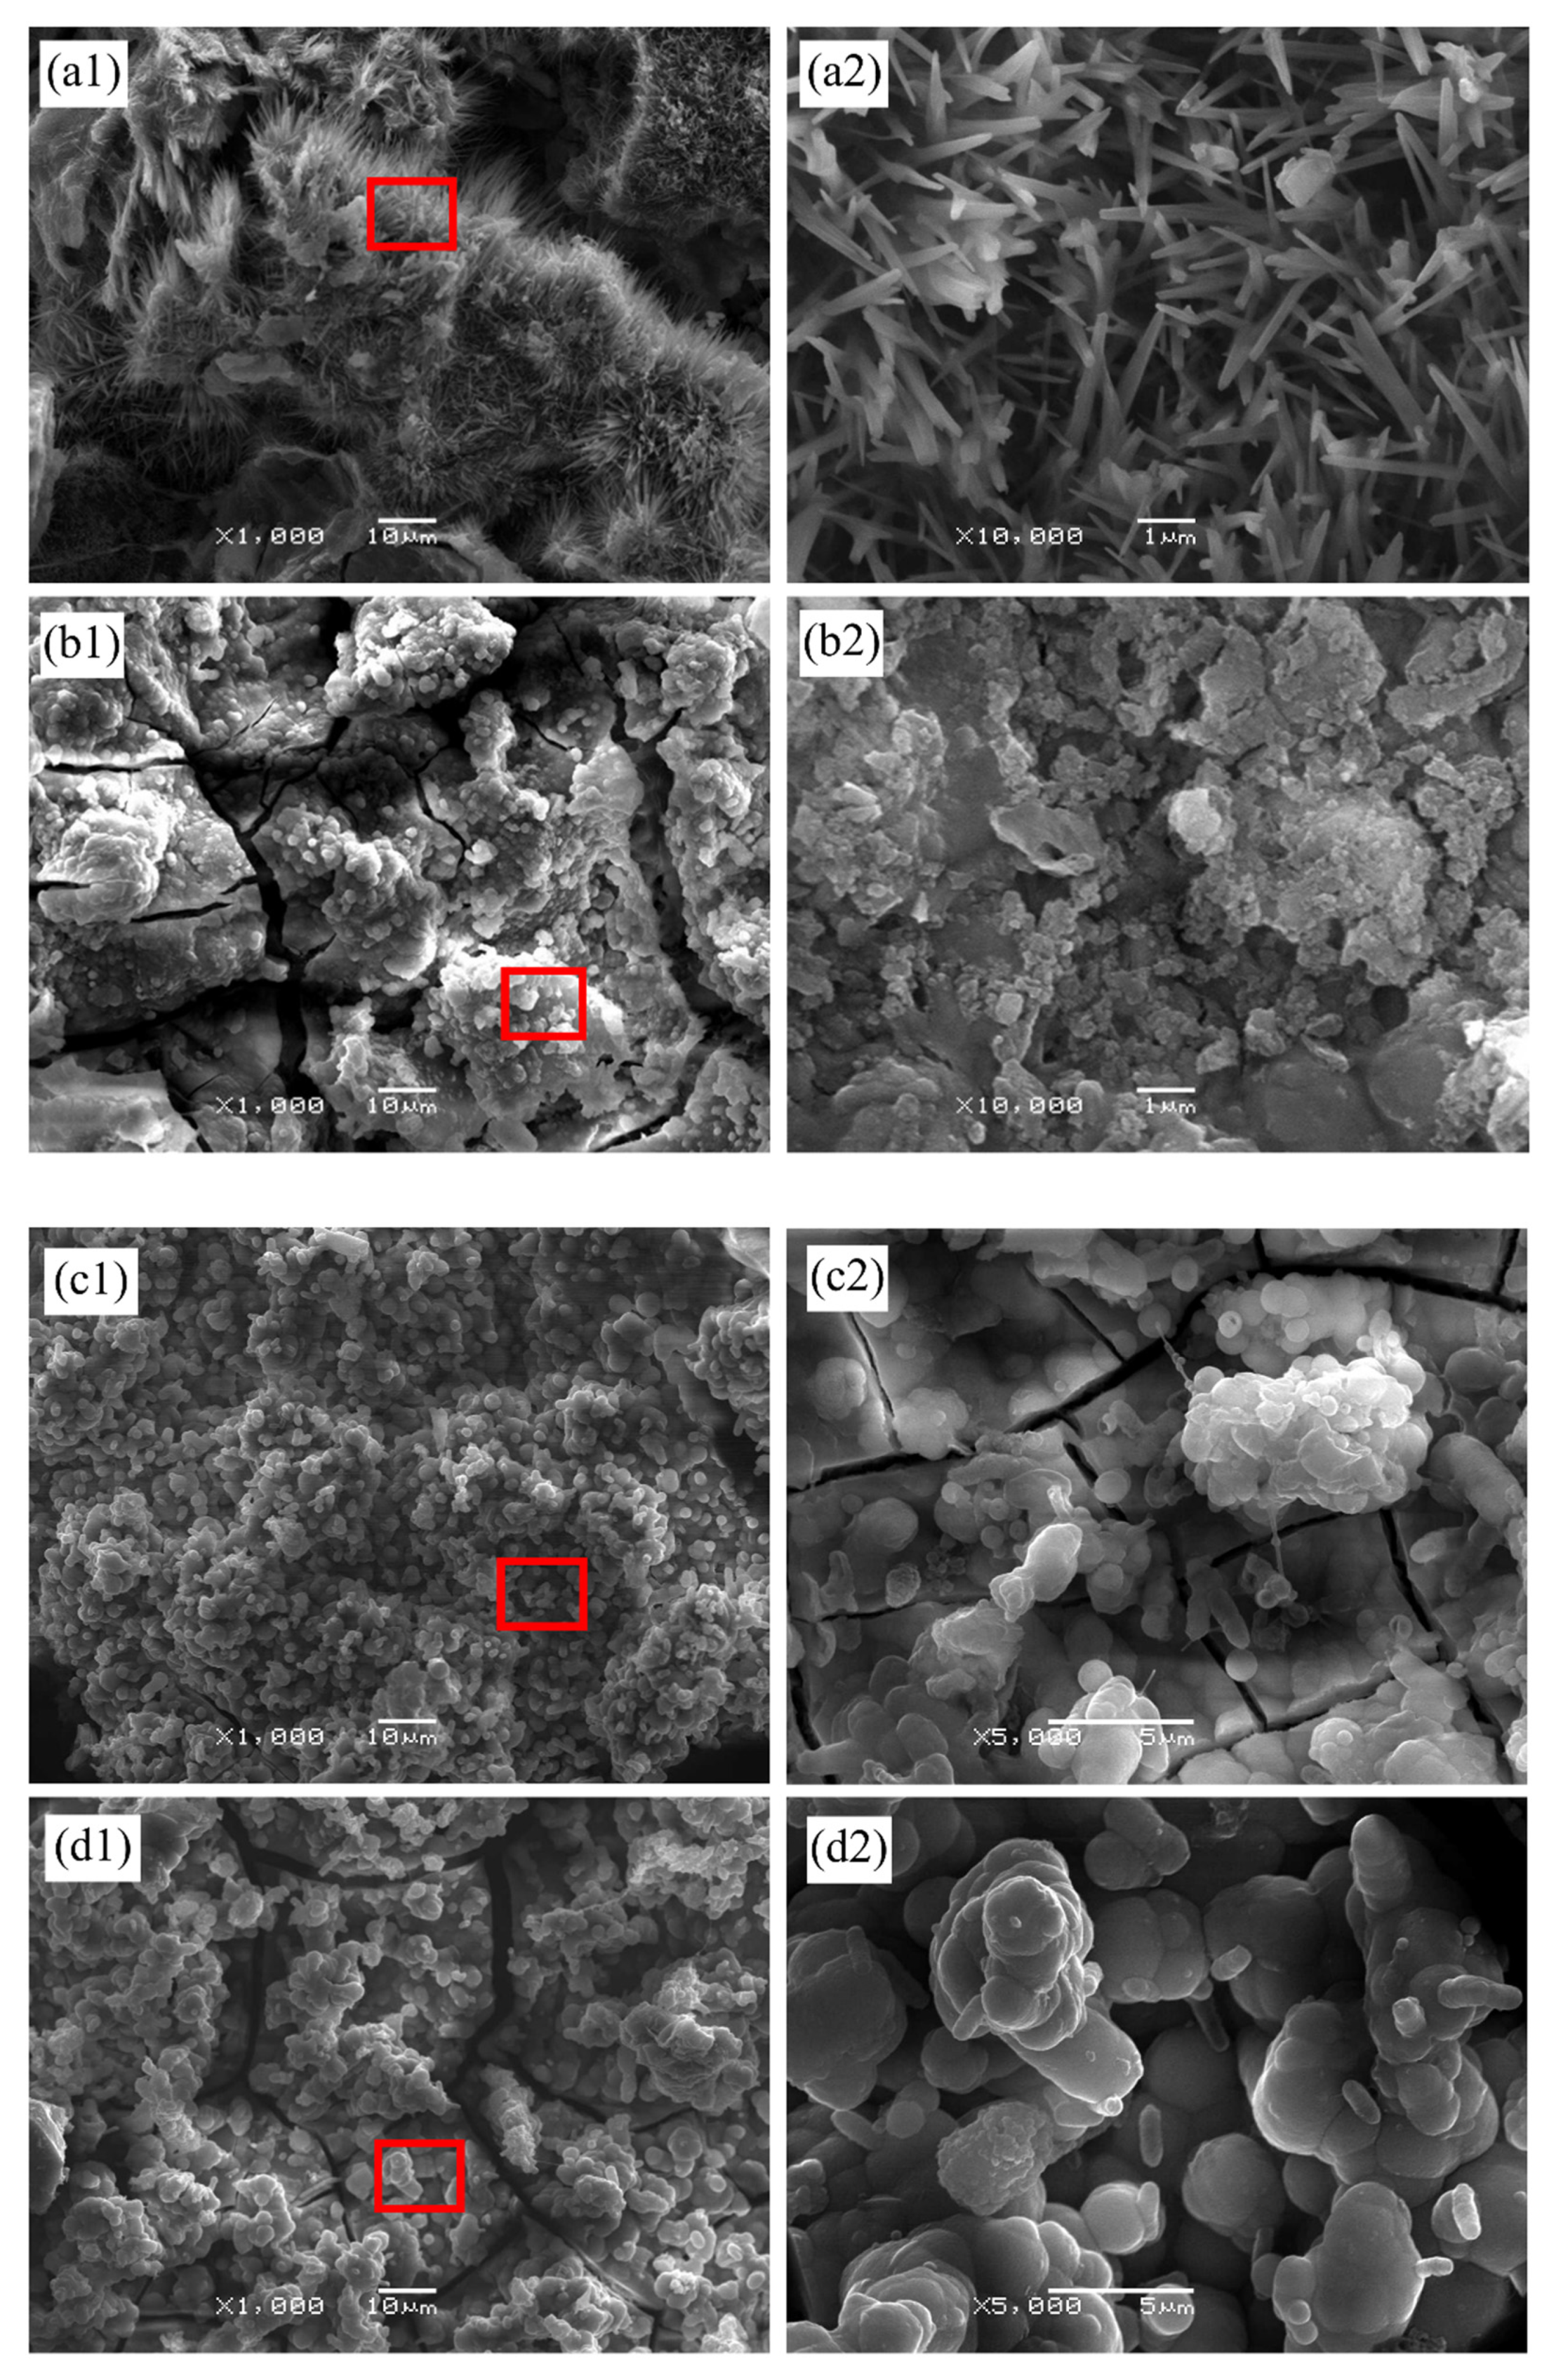
Figure 1 displays the XRD patterns of different samples. Three sharp diffraction peaks associated with Mg (the 2θ positions close to 32.2°, 34.4°, and 36.6°) were identified in all films. For the Mg(OH)2 sample, the peaks of Mg(OH)2 (at 2θ of 18.6°, 38.0°, 50.90°, and 68.3°) were observed. In addition to the Mg(OH)2-related reflections, the hydroxide samples contained the characteristic Mn(OH)2 peaks (at 18.8°, 36.7°, and 49.90°), indicating that the films were primarily composed of Mg(OH)2 and Mn(OH)2 phases, which accounted for the reaction of the Mg alloy substrate in the slurry. Once the post-treatment time was extended from 6 h to 12 h, the peak intensities of Mg(OH)2 and Mn(OH)2 phases changed little. However, as the reaction time was extended to 24 h, the intensity of the peaks slightly decreased, indicating that the content of Mg(OH)2 and Mn(OH)2 decreased. This meant that the Mg(OH)2/Mn(OH)2 hydroxide films were successfully formed on the substrate with different processing times.
Figure 2 depicts the FT-IR spectra of the different samples. The films with varying processing times exhibited similar chemical bonds. The intense absorption bands at 3679 cm−1 were assigned to the stretching vibrations of hydroxyl groups (-OH), indicating the presence of -OH moieties corresponding to Mg(OH)2 and Mn(OH)2 [18,19]. The bending mode of the water molecules absorbed during the preparation of the films was detected at 1642 cm−1 [20]. The spectral features at 1378 cm−1 originated from the stretching vibrations of NO3 that were absorbed from the slurry and existed in the hydroxide films [21]. The broad peaks at 879 cm−1 were ascribed to the Mg-OH and Mn-OH translational modes in the films [22]. For the Mg (OH)2 sample, the band at 445 cm−1 was attributed to the Mg-O stretching vibration [23]. The bands associated with NO3- changed inconspicuously as the processing time increased, but the intensity of -OH absorption bonds increased first and then decreased, demonstrating that the Mg(OH)2/Mn(OH)2 content varied accordingly.

3.2. Morphology

The SEM images and EDS results for the different samples are presented in Figure 3 and Table 1, respectively. The energy spectrum and amplification range are marked by the red rectangular region. Figure 3a,b show the typical needle-like structure of Mg(OH)2. Furthermore, according to the EDS data, the film was primarily made up of O and Mg elements, indicating the formation of Mg(OH)2. As shown in Figure 3c, the surface of the film was uneven after 6 h of immersion, exhibiting a flat morphology below and a bump above. A rough and incomplete surface lamellar structure was observed from the partially enlarged drawing in Figure 3d. The EDS result demonstrated that the metal cations Mg2+ and Mn2+ took part in the formation of the film, which coincided with the XRD and FT-IR data. As the reaction progressed to 12 h, the incomplete lamellar structure grew into a dense lamellar and convex structure, and the surface of the film became uniform and compact, as can be seen in Figure 3e,f. Based on the EDS analysis, the relative content of Mn elements increased, and that of Mg elements decreased with the extension of treatment time. The dense structure of Mg(OH)2 changed from interlaced nanosheets to more cracks and a looser structure as the hydrothermal reaction time increased [12]. As soon as the processing time was prolonged to 24 h, the microstructure changed greatly, from lamellae to overlapping strips of about 0.5 µm with large pores between them, which might be related to the extension of hydrothermal time and the increase in Mn content (Figure 3h). The above results indicated that as the processing time was prolonged, the structure of the hydroxide film was transformed from incomplete lamellae to complete and thick lamellae.

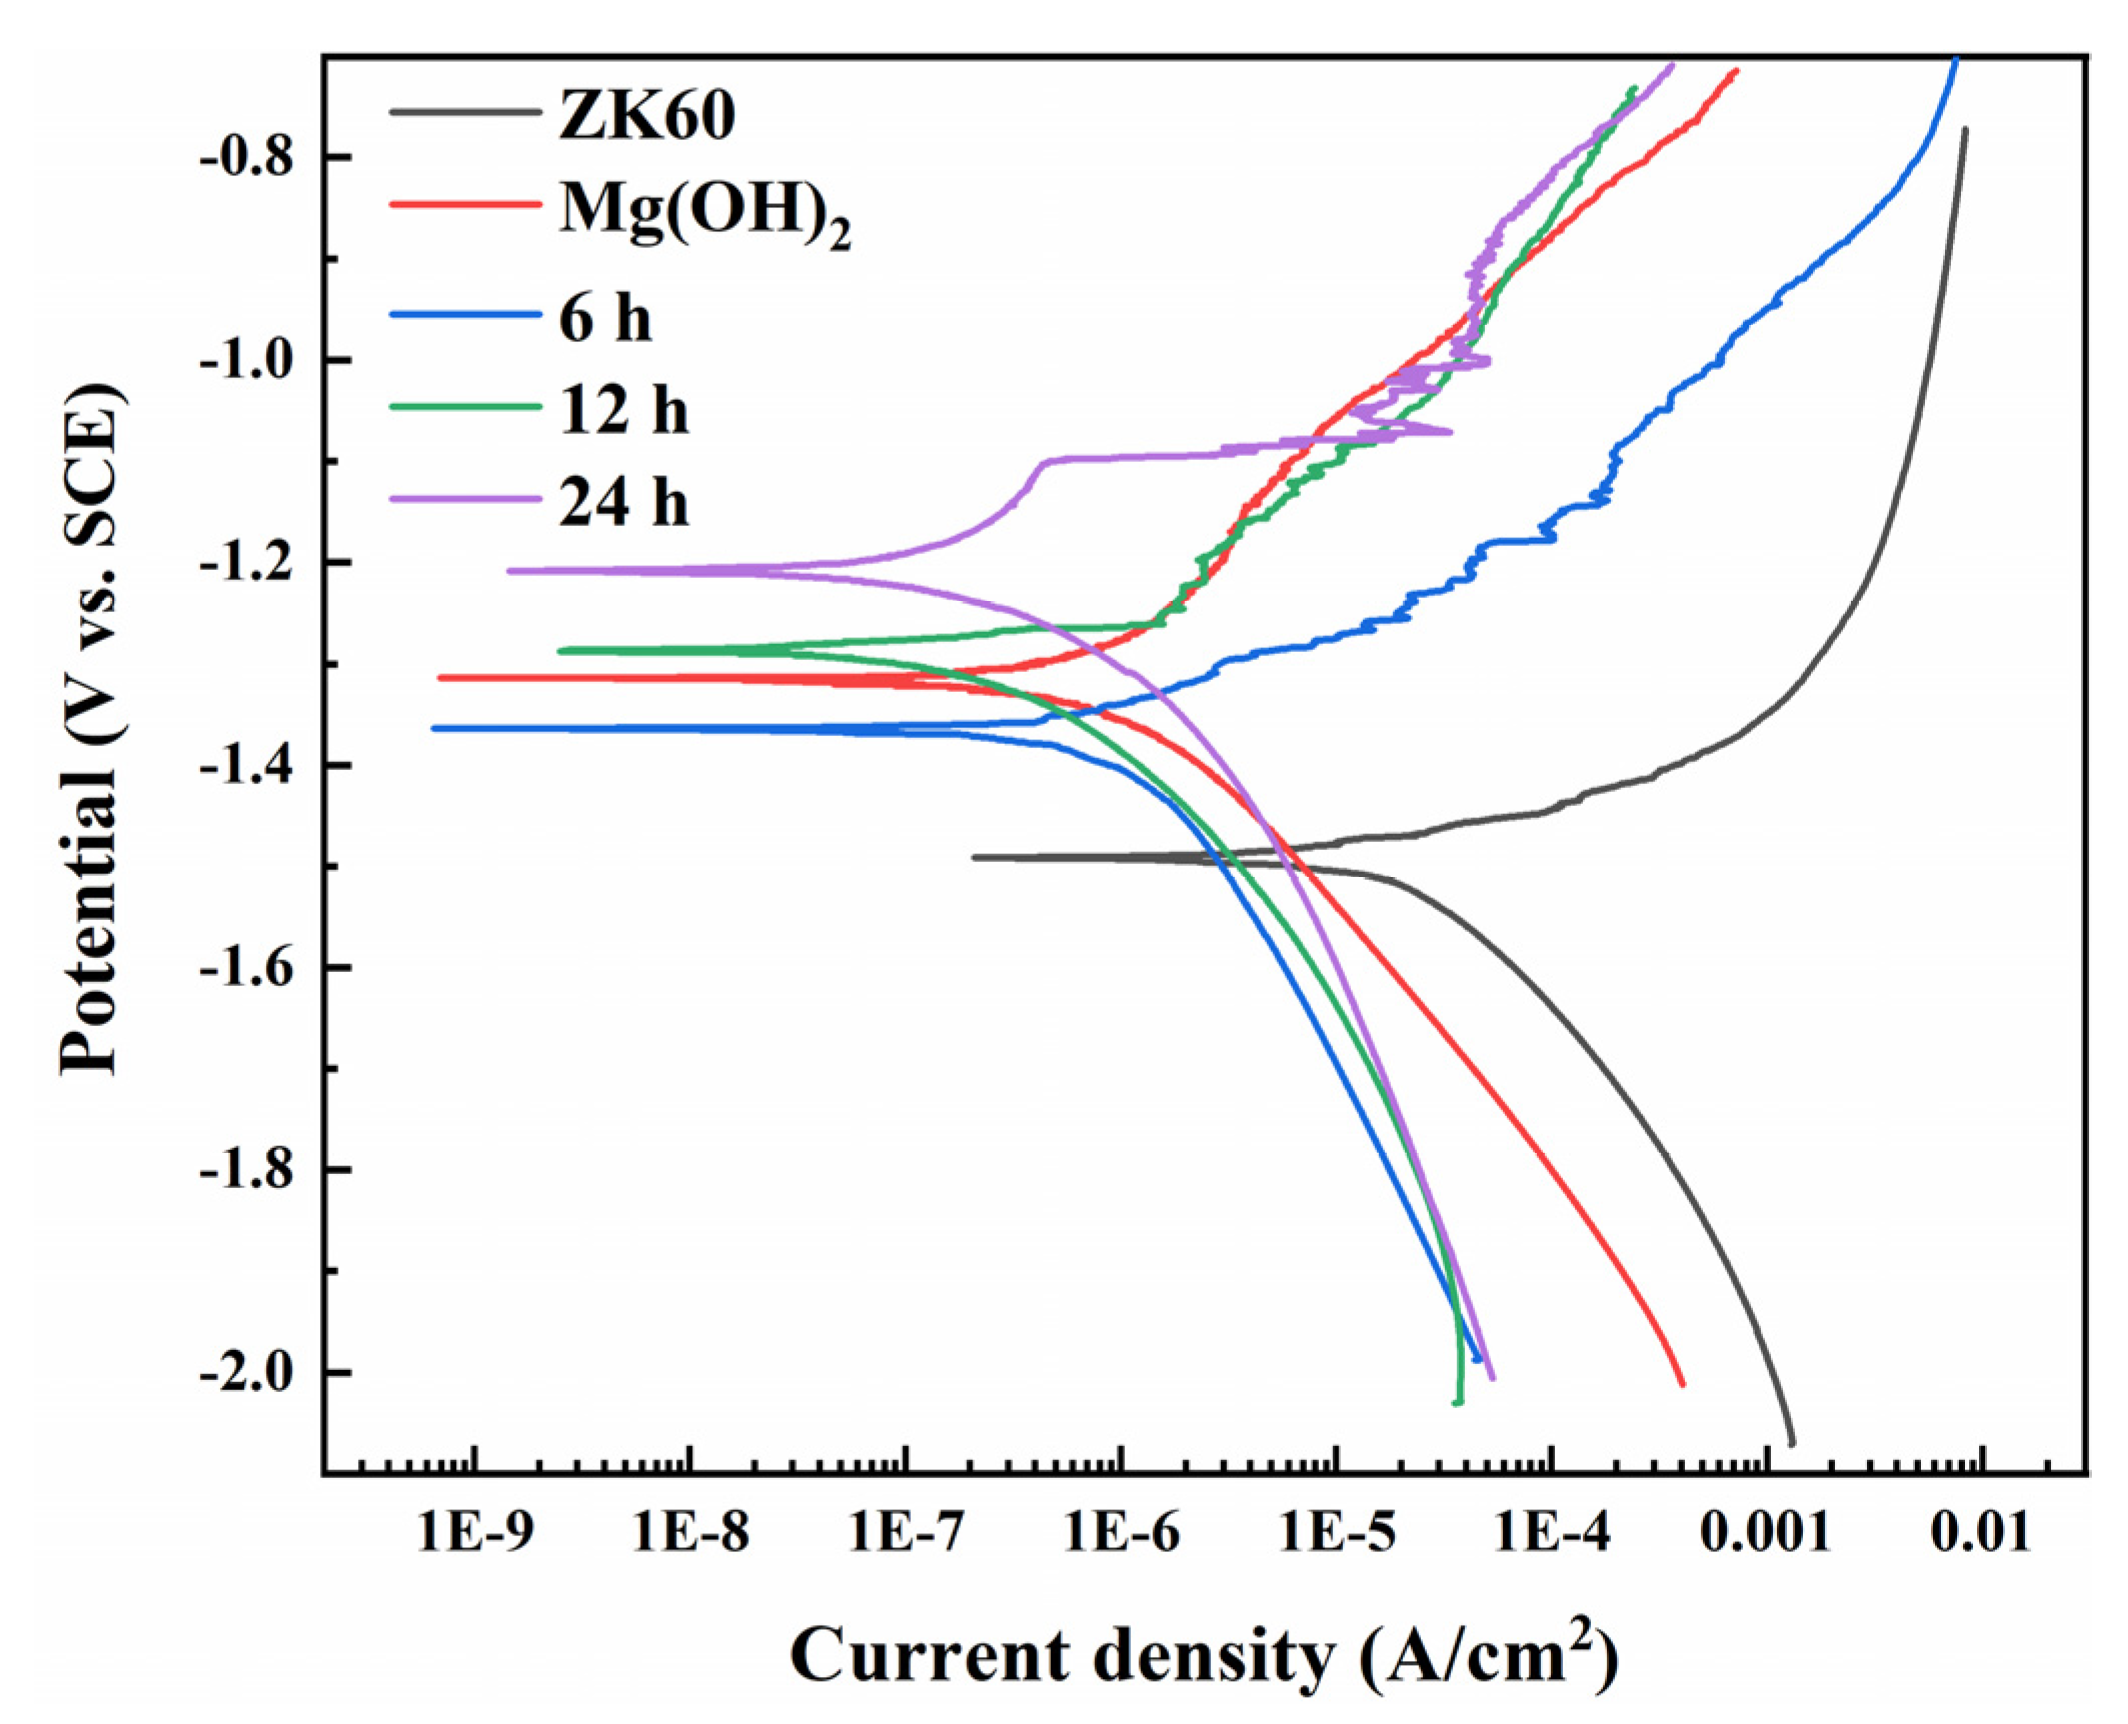
3.3. Corrosion Resistance

In order to characterize the instantaneous corrosion resistance of the samples in a physiological environment, the PDP curves were recorded (see Figure 4). Table 2 summarizes the values of OCPs, corrosion potential (Ecorr), corrosion current density (icorr), and corrosion rate (Pi and PH), which were determined according to the Tafel extrapolation method. The Ecorr and icorr represent the thermodynamics and kinetics of corrosion, respectively. In general, the higher Ecorr and the lower Icorr indicate better corrosion resistance; that is, the sample had higher thermodynamics and lower kinetics during the corrosion process. Compared with the ZK60 Mg substrate, the Ecorr of the film samples had a positive shift, meaning that post-processing exerted a positive impact on corrosion resistance. However, the actual corrosion rate was determined by icorr when corrosion occurred, which was consistent with the kinetics. It can be seen from Figure 4 that the anode current density of the samples significantly increased with the increase in potential, indicating that the samples were actively dissolved in the anode region. Moreover, the anode passivation region of the 24 h sample was inconspicuous, and the current density rapidly increased as a function of potential. As can be seen from Table 2, once the reaction time was prolonged from 6 h to 12 h, the value of icorr was decreased by about an order of magnitude. However, when the reaction time was further extended to 24 h, the icorr increased a little, and the reaction time was doubled. The value of Pi varied in descending order as follows: ZK60, 6 h, Mg(OH)2, 24 h, and 12 h, and the Pi of ZK60 was close to the values reported in other studies [24]. Therefore, the hydrothermal reaction time of 12 h was the best preparation process for the hydroxide film. The icorr of the 12 h sample was 3.07 × 10⁻⁷ A·cm−2, being about two orders and one order of magnitude lower than that of the substrate (3.04 × 10⁻⁵ A·cm−2) and Mg(OH)2 (1.31 × 10⁻⁶ A·cm−2), respectively, which might be related to the lack of pores in the microstructure of the film (Figure 3h). It is noteworthy that a similar decrease in the corrosion resistance of the 12 h film relative to that of the Mg(OH)2 film on ZK60 Mg alloy has also been obtained in Ref. [25]. The results suggested that the hydroxide film could effectively reduce the corrosion rate and improve the corrosion resistance of the alloy.
The hydrogen evolution experiment was carried out over 168 h to investigate the long-term corrosion behavior of the film samples. The curves revealing the hydrogen evolution with the immersion time are shown in Figure 5. During 168 of immersion, the hydrogen evolution volume of ZK60, Mg(OH)2, 6 h, and 24 h samples increased, while the 12 h sample exhibited a relatively low corrosion rate. The lowest PH value was obtained in the 12 h sample, followed by those of 24 h, 6 h, Mg(OH)2, and the ZK60 samples, meaning that the dense structure of the 12 h film could provide efficient protection, which also agreed with the PDP results. Similarly, the hydrogen evolution experiment demonstrated that the best hydroxide film could significantly improve the corrosion resistance of the substrate when compared with a single Mg(OH)2 film.

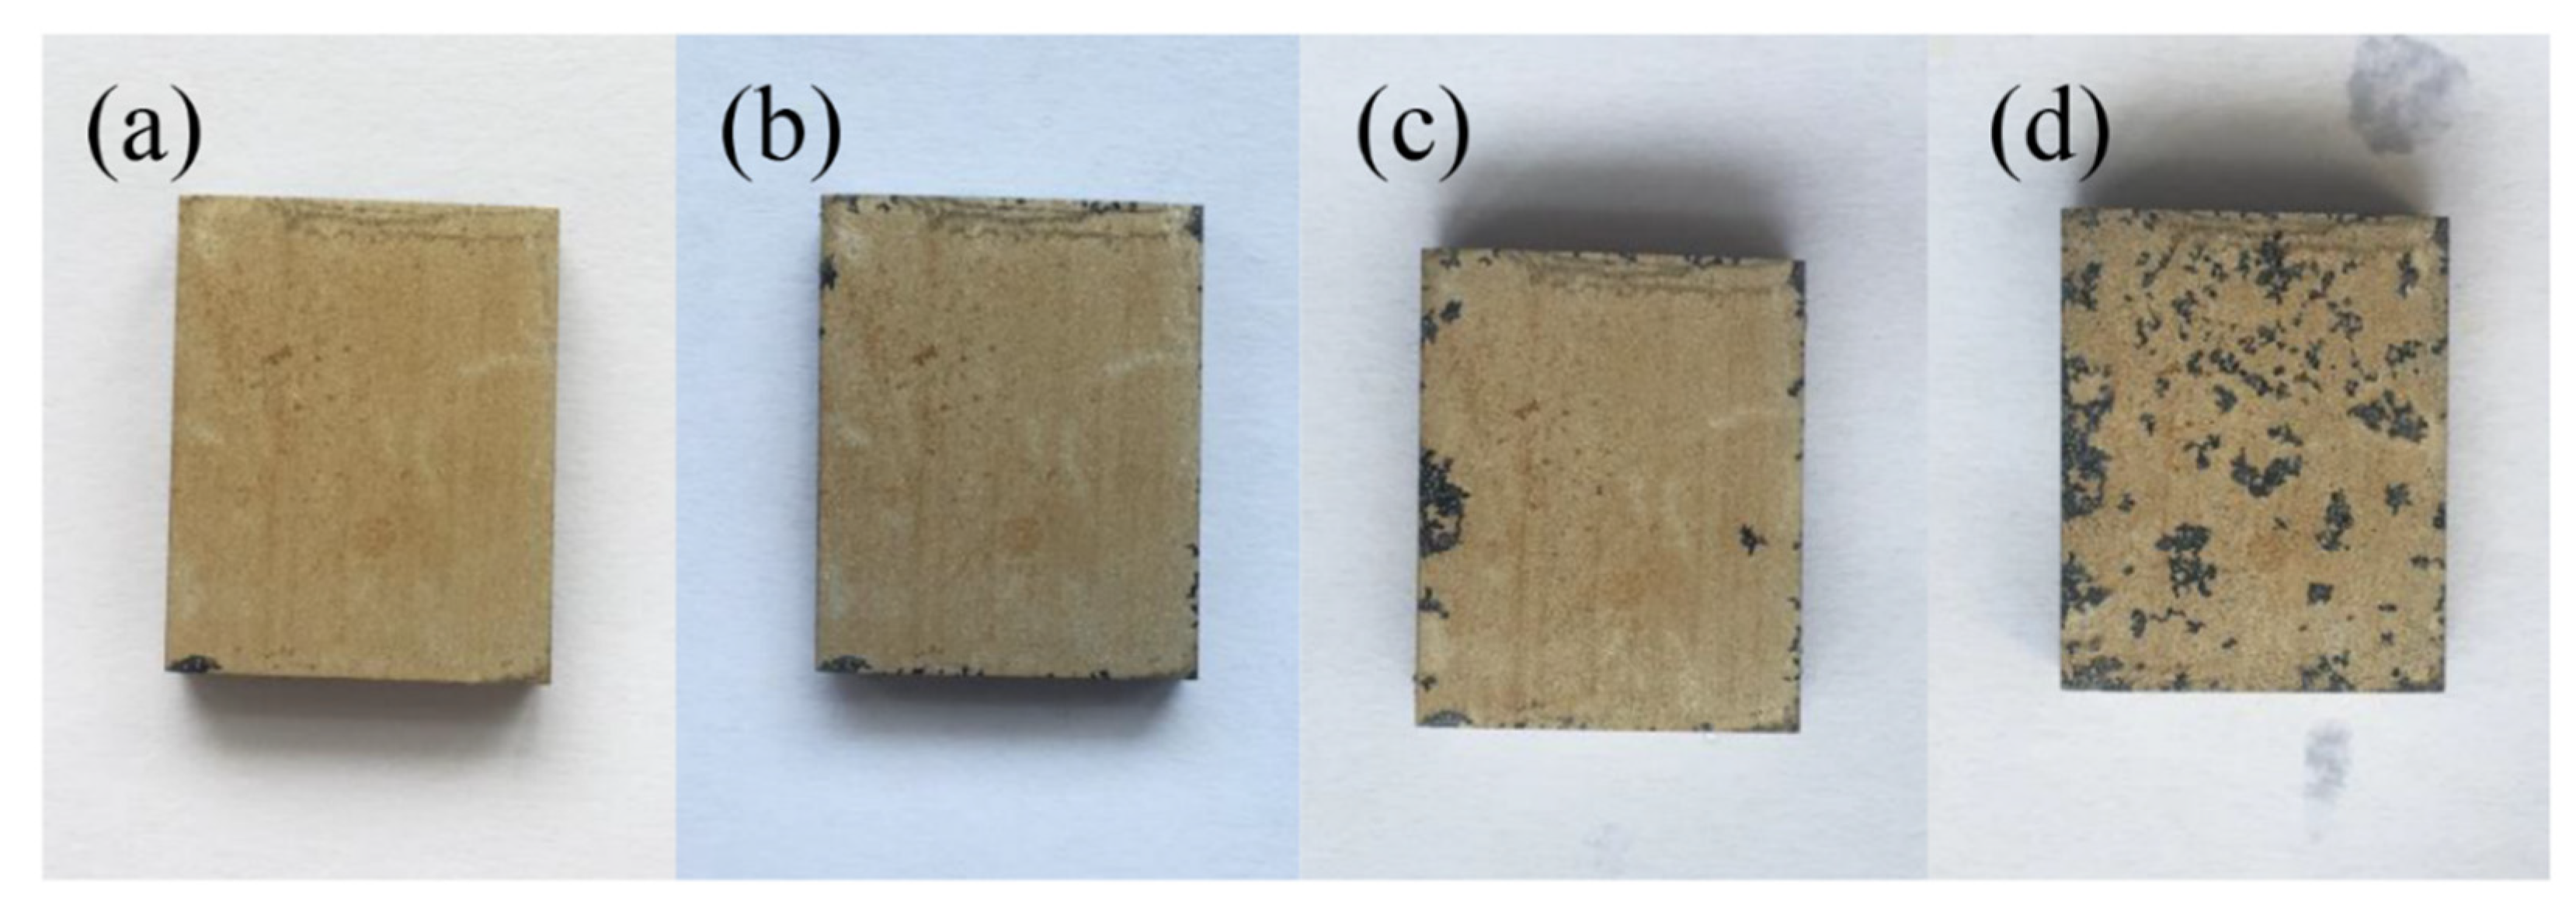
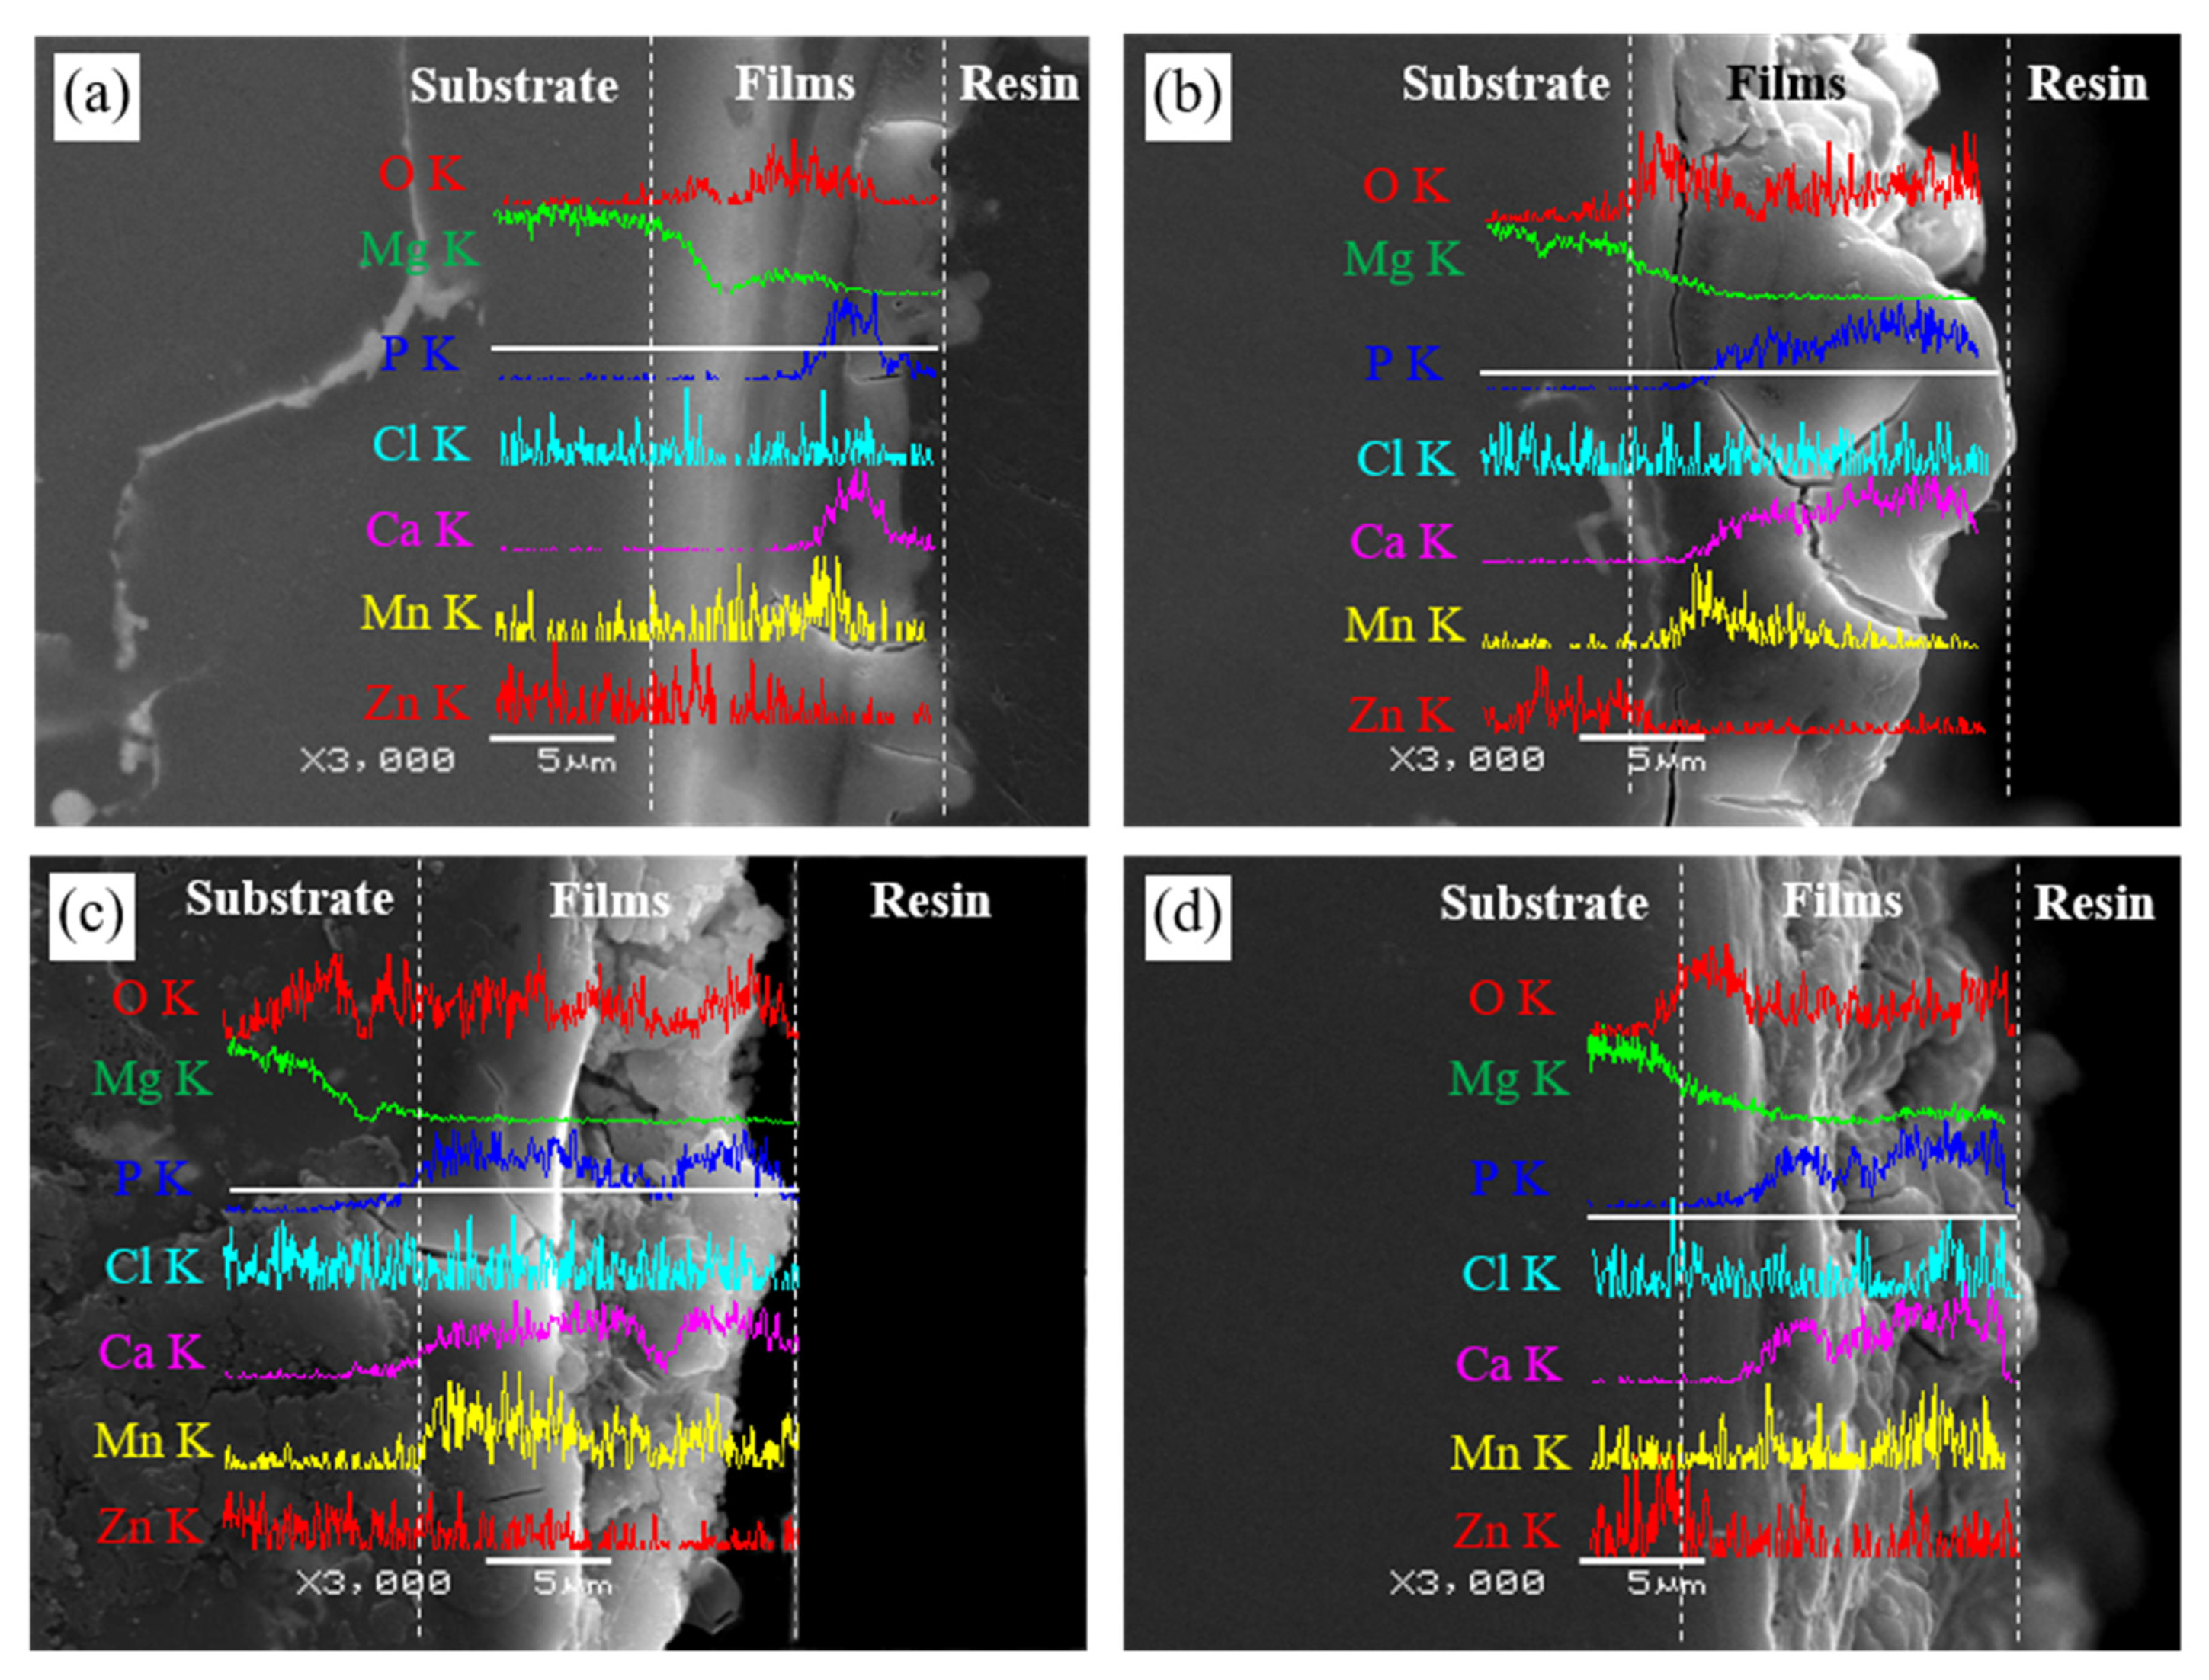
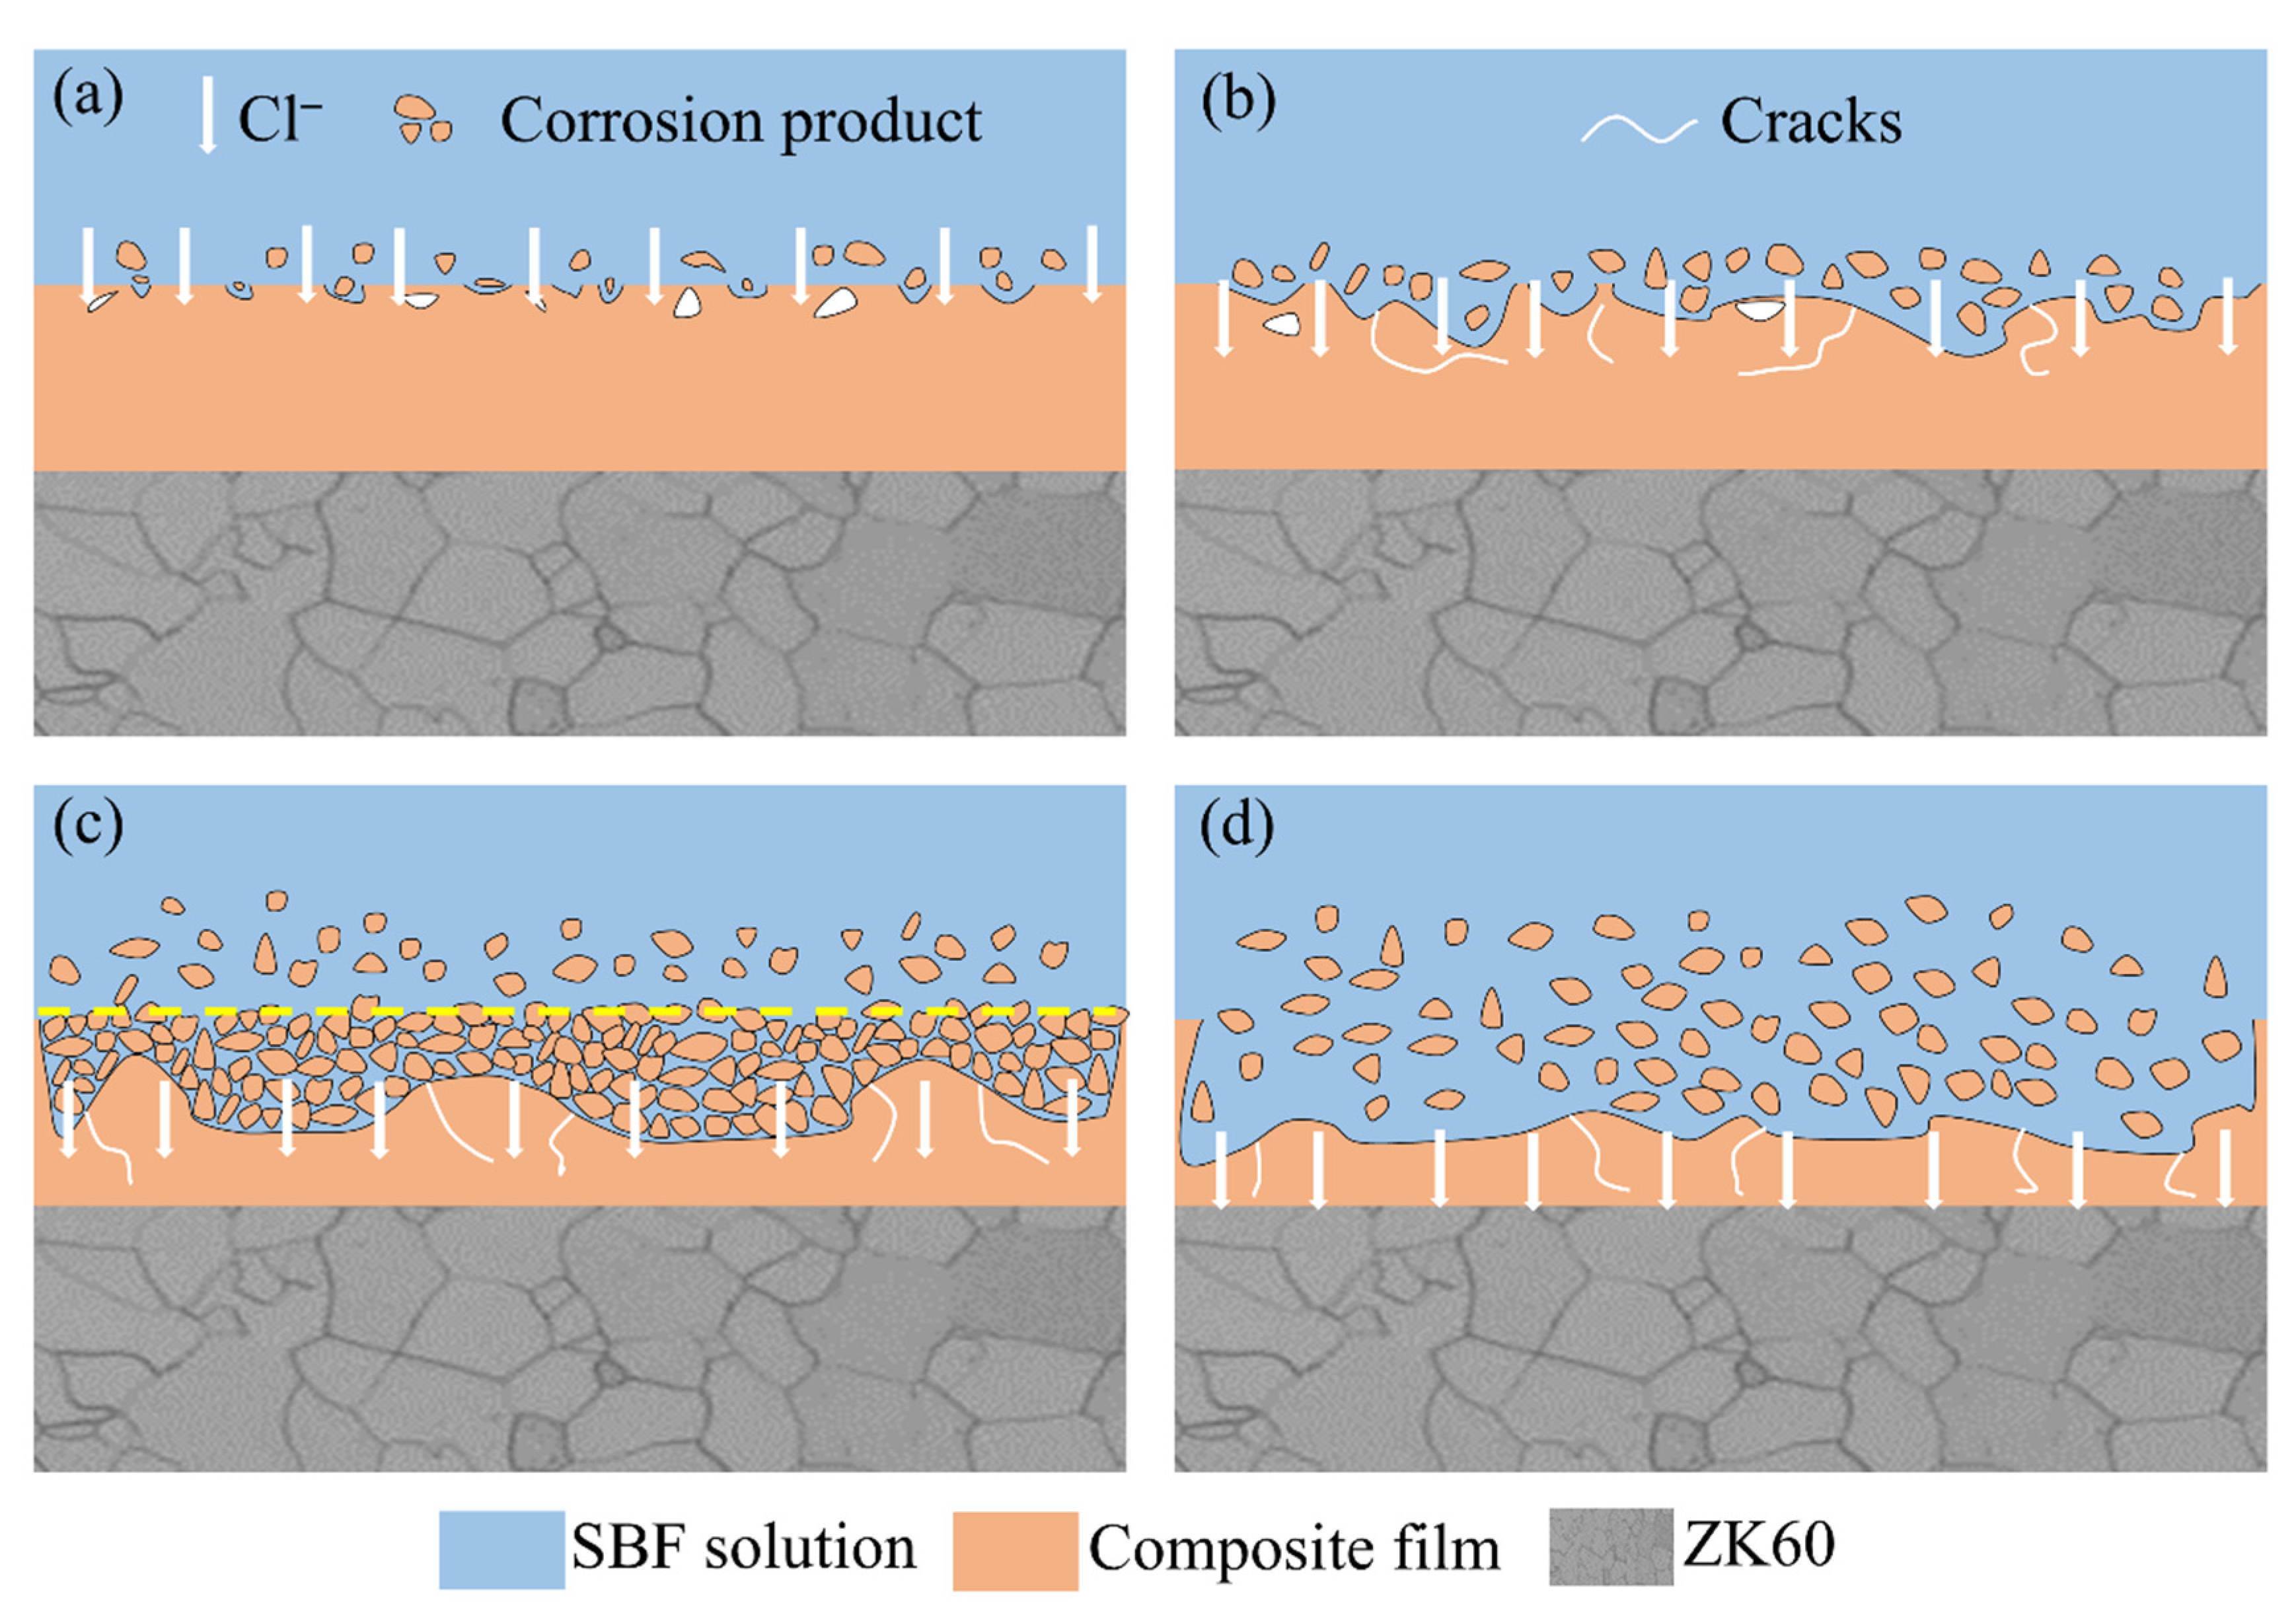
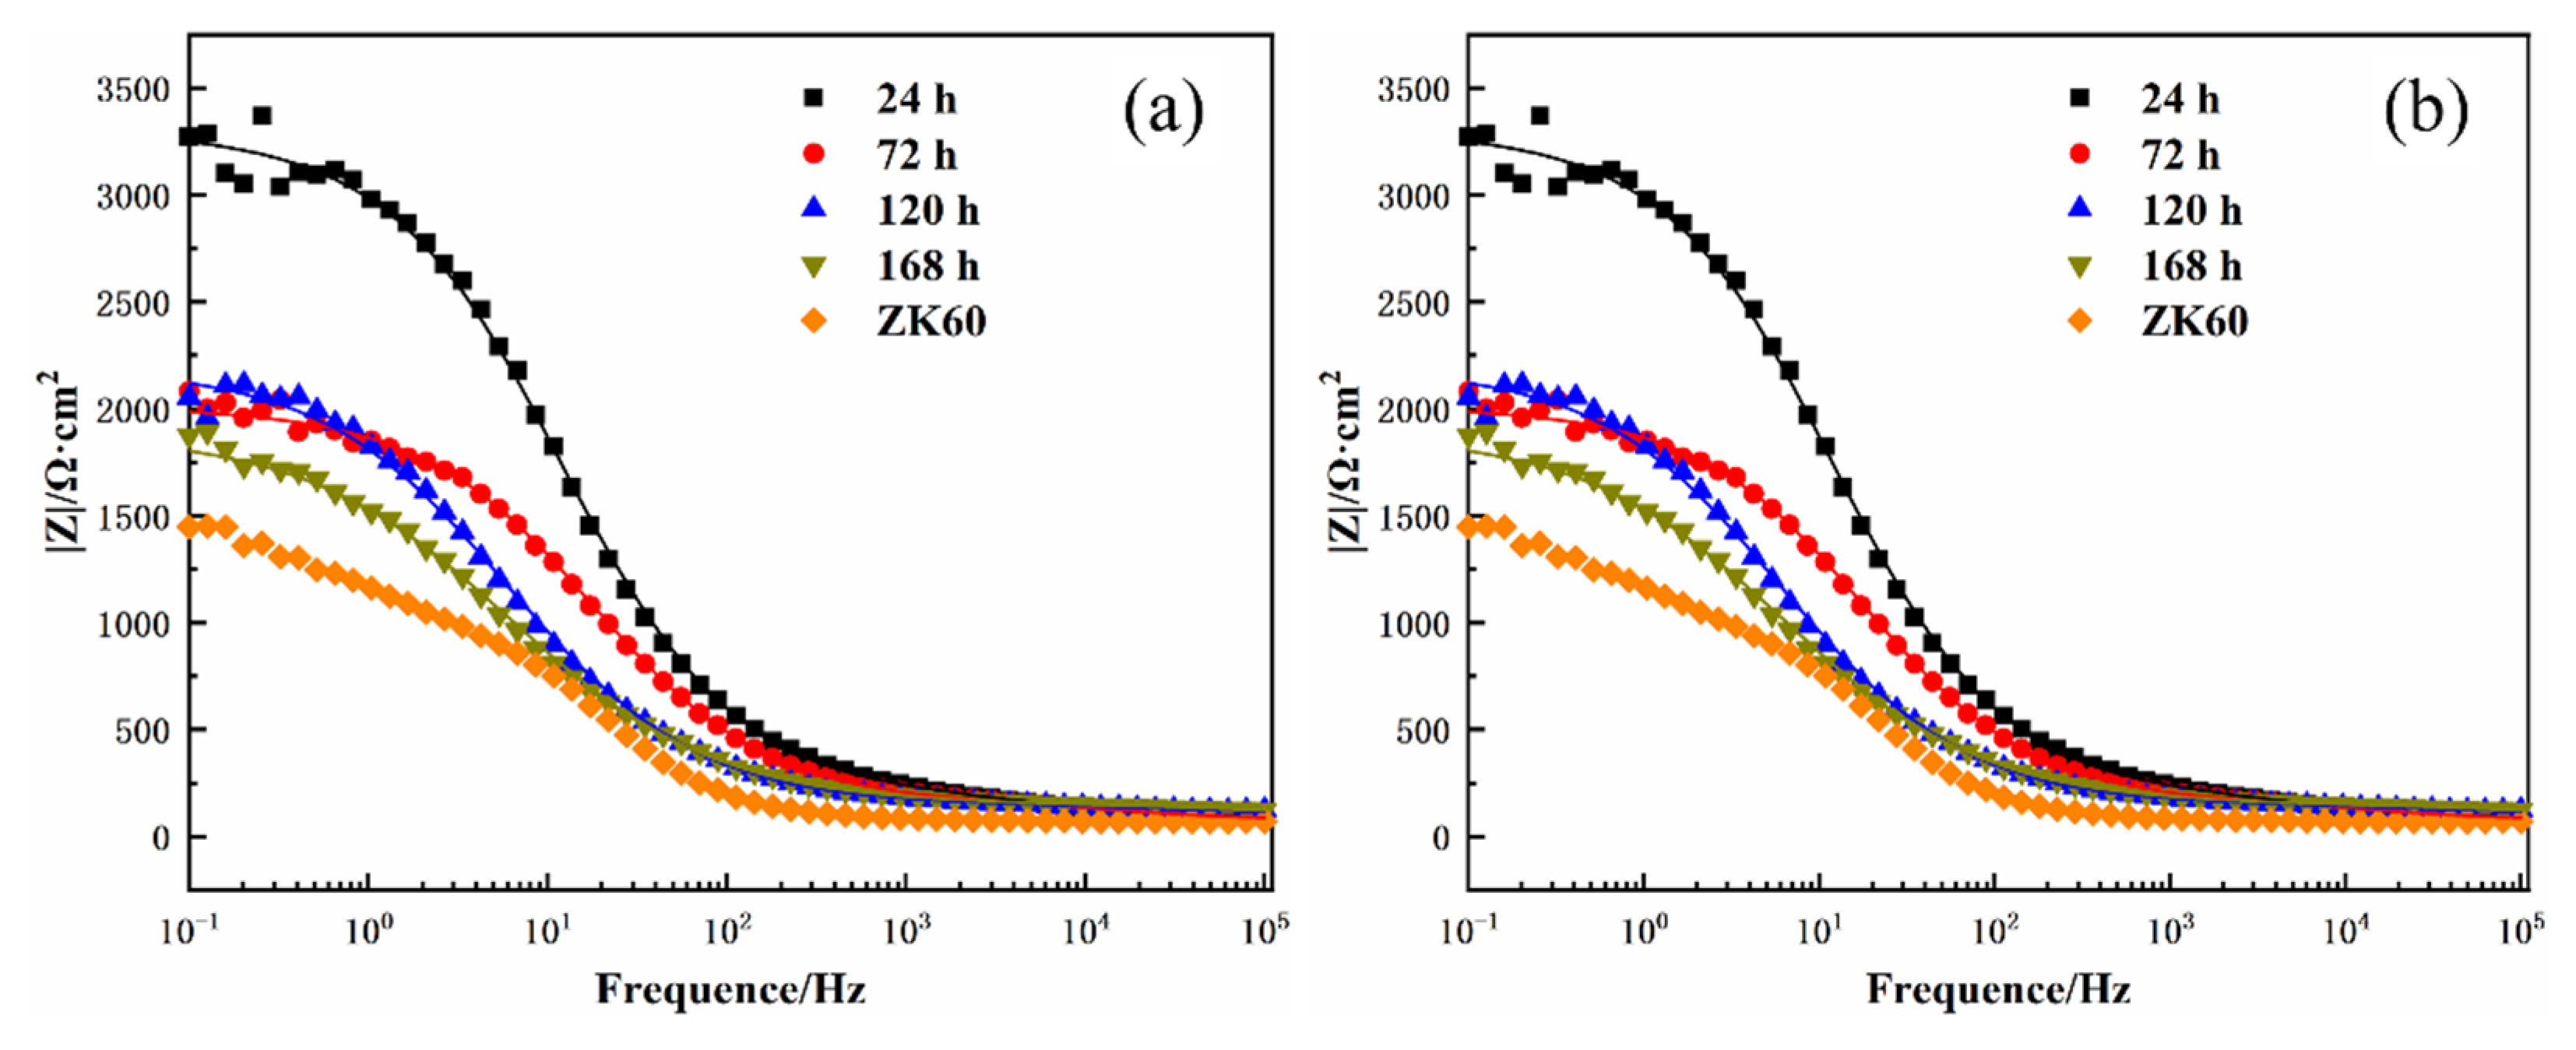
3.4. Corrosion Resistance of the 12 h Sample at Different Immersion Times

The PDP and immersion experiments showed that the 12 h film had the best corrosion resistance. For this reason, the film was selected for further testing its corrosion behavior at different immersion times. The macroscopic and microscopic corroded areas on the surface are presented in Figure 6 and Figure 7, respectively, and the red boxes are the magnified areas. The EDS results are given in Table 3. When immersed for 24 h, a small area of corrosion appeared on the surface (Figure 6a), the lamellar structure was destroyed into thin strips, and corrosion pits covered the surface of the film (Figure 7(a1,a2)). According to the EDS data on the corroded area, Cl ions were detected in addition to the original composition of the film, indicating that the corrosion of the film was mainly caused by Cl. As the immersion time increased to 72 h, the corrosion area of the film expanded (Figure 6b), and the structure became loose. Additionally, some microcracks appeared on the surface and more corrosion products were identified (Figure 7(b1,b2)). The EDS results revealed that the corrosion products were mainly composed of O, Mg, and Ca, whereas Cl almost disappeared. Once the immersion time was extended to 120 h, the corrosion area continued to increase (Figure 6c), and the granular corrosion products, mainly composed of O, P, Ca, and a small amount of Mg, accumulated on the surface (Figure 7(c1,c2)). In comparison, after 168 h of immersion, apparent corrosion pits were observed in approximately one-fourth of the sample (Figure 6d); in addition, more granular loose corrosion products and wider cracks emerged (Figure 7(d1,d2)). The above results indicated that the barrier effect of the film and the corrosion products generated by the reaction with the corrosive medium during the long-term immersion of the film could provide effective protection for the substrate.
The corrosion rate of hydroxide films is closely related to their surface phase compositions and morphology. When the 12 h sample was immersed in the SBF solution for 24 h, the lamellar structure on the surface of the film was destroyed by Cl ions, and the hydrogen evolution volume increased, indicating that corrosion occurred. Once the immersion time was prolonged for 72 h, cracks appeared on the film along with the loose corrosion products, which led to an increase in hydrogen evolution volume by analogy with the corrosion rate. As the corrosion proceeded, Cl continued to degrade the film, and only a small amount of residues was found on the surface of the corrosion products. After immersion for 120 h, the corrosion products accumulated, providing some protection, which was the reason for the decreasing trend of hydrogen evolution volume. After 168 h of immersion, the accumulated corrosion products fell off, and big cracks emerged. As a result, the hydroxide film was constantly corroded, and the decrease in the protective effect on the substrate was mainly manifested by the increase in hydrogen evolution.
Figure 8 displays the cross-sectional view of the 12 h sample immersed in SBF solution for 24 h, 72 h, 120 h, and 168 h. In the first 24 h of immersion (Figure 8a), the surface of the film was relatively flat. The P and Ca elements were mainly concentrated near the surface, whereas the Cl elements were located deeper, indicating that Cl ions were the first to cause corrosion. As the immersion time was prolonged, the film underwent the three following processes: (i) cracks appeared in the film, and the same areas fell off (Figure 8b); (ii) corrosion products accumulated on the outer layer to form a loose structure with cracks in the inner layer (Figure 8c); (iii) most of the film was corroded, and only a small part fell off (Figure 8d). These findings suggested that the Mg(OH)2/Mn(OH)2 hydroxide film could function as the barrier to protect the substrate from the corrosive solution. This was because the Cl ions were prevented from diffusing through the film, and the corrosion resistance of the substrate was efficiently improved.
Figure 9 depicts the corrosion protection mechanism model of the Mg(OH)2/Mn(OH)2 hydroxide film, which was used in this study to illustrate the changes in surface structure during the corrosion process. According to the model, the corrosion of the film experienced four stages. Firstly, Cl invaded the surface of the film and generated a few corrosion products (Figure 9a). With the extension of immersion time, microcracks began to appear on the surface of the film, resulting in a looser film structure and more corrosion products (Figure 9b). Then, the hydroxide film reacted with the corrosion environment, and numerous corrosion products accumulated on the surface of the film, providing protection and delaying the penetration of the corrosion medium into the substrate (Figure 9c). Finally, due to the intensification of corrosion, corrosion products fell off from the surface, and thus the corrosion medium invaded the substrate (Figure 9d).
EIS tests were performed to monitor the corrosion behavior of the 12 h sample at different immersion times in the SBF solution. In order to further analyze the corrosion mechanism of the hydroxide films, the EIS data were further fitted in ZSimpWin software to obtain a simplified equivalent circuit. The results of EIS curve fitting are shown in Figure 10 and Figure 11, where the points and lines represent the experimental and fitting data, respectively. The Nyquist plots of the ZK60 Mg alloy and 12 h film samples immersed for various times are shown in Figure 10. In general, the larger the diameter of the Nyquist semicircle is, the better the corrosion resistance is. At the beginning of immersion, the diameter of the impedance loop was significantly reduced because the hydroxide film was continuously degraded by the corrosive medium. However, the diameter of the impedance loop after 120 h was greater than that after 72 h, which might be due to the generation of corrosion products enhancing the corrosion resistance. With the further increase in time, the generation of H2 led to cracks on the film and the shedding of corrosion products, deteriorating the film quality and aggravating the corrosion, so the diameter of the impedance loop continuously decreased. Although the 12 h sample underwent a series of corrosion reactions during the immersion process, the corresponding Nyquist curves were similar in shape, exhibiting two depressive arcs in the high- and medium-frequency regions and some scattered points in the low-frequency range. The high-frequency and medium-frequency arcs were attributed to the electric double layer at the interface between the solution and the loose outer hydroxide film, as well as that at the interface between the dense inner hydroxide film and the substrate, respectively. The results illustrated that the protective structure of the hydroxide film remained unchanged with the extension of immersion time.
Figure 11 depicts the Bode and phase plots of the ZK60 Mg alloy and 12 h film samples. In the Bode chart (Figure 11a), the middle-frequency region represents the capacitance of the film [26]. At the beginning of the process, there was a good linear relationship in the frequency range, which meant that the film was relatively complete, and there was no serious corrosion damage. However, with the extension of the time of immersion, the linear relationship of the film became similar to that of the substrate, indicating film degradation. Typically, corrosion resistance is mainly reflected in the low-frequency region, and the impedance value |Z|(f = 0.1 Hz) is an indicator of the barrier effect of the film on the charge transfer during the corrosion process. After 120 h of immersion, the |Z| value of the sample showed a little increase relative to that of the sample immersed for 72 h, suggesting the accumulation of corrosion products and improvement in the corrosion resistance of the substrate. The EIS test data revealed the same change rule as the hydrogen evolution experiment. After immersion for 168 h, the |Z| value of the 12 h sample (1.87 × 10³ Ω·cm2) was still greater than that of the ZK60 alloy (1.45 × 10³ Ω·cm2), indicating that the hydroxide film could still provide protection for the substrate. As shown in Figure 11b, the phase diagram after 24 h of immersion had a wide peak and a high angle at the medium and high frequencies, respectively, providing evidence of the barrier property to the corrosive medium and the accumulation of corrosion products [27]. As the experiment time increased, the quality of the film decreased, but the corrosive ions were still relatively difficult to penetrate into the substrate.
The equivalent circuit is shown in Figure 12, and the corresponding parameters are listed in Table 4. In this model, Rs represents the resistance of the SBF solution, and Rout and Rin are related to the loose outer hydroxide film and the dense inner hydroxide film resistance, respectively. Since the film had a rough surface, which might have led to a constant dispersion effect, it was necessary to connect two constant phase elements (Qout and Qin) in parallel [26]. A constant phase element (Q) is defined by two values, which are modulus Yo and phase number n ( Z Q = 1 Y 0 ( jw ) n , 0 < n < 1) [28]. The total values of Rout and Rin are major parameters that reflect the protection of the hydroxide film on the Mg substrate. As the immersion time was extended, the value had the same tendency of change as that of the hydrogen evolution volume and the |Z| value, indicating that the equivalent circuits could better reflect the corrosion state of the hydroxide films. This situation exerted a positive effect on the corrosion resistance of hydroxide films in a physiological environment.

4. Conclusions

(1)
A simple hydrothermal process was demonstrated for the growth of Mg(OH)2/Mn(OH)2 hydroxide films on the ZK60 magnesium alloy substrates. The films were mainly composed of Mg(OH)2 and Mn(OH)2 phases;
(2)
By increasing the hydrothermal crystallization time from 6 h to 24 h, the structure of the hydroxide films changed from incomplete lamellae to complete lamellae and then to thick lamellae while decreasing the relative concentration of Mg and increasing the content of Mn elements;
(3)
After a 12 h hydrothermal crystallization, the Mg(OH)2/Mn(OH)2 hydroxide film exhibited the best corrosion resistance with a corrosion current density of 3.07 × 10⁻⁷ A·cm−2, which was approximately two orders and one order of magnitude lower than those of ZK60 magnesium alloy (3.04 × 10⁻⁵ A·cm−2) and Mg(OH)2 (1.31 × 10⁻⁶ A·cm−2), respectively. During the hydrogen evolution experiments, the 12 h sample had the least amount of hydrogen evolution, followed by 24 h, 6 h, Mg(OH)2, and ZK60 substrate, respectively, indicating that the hydroxide film could effectively improve the corrosion resistance of the substrate;
(4)
The experiments on the 12 h sample at various immersion times revealed that the corrosion rate of the hydroxide film was closely related to the surface phase composition and morphology. Even after immersion for 168 h, the hydroxide film could still provide protection for the substrate.

Author Contributions

Conceptualization, Y.W. (Yongmin Wang) and Z.L.; methodology, Y.W. (Yongmin Wang) and Z.L.; software, Y.W. (Yongmin Wang); validation, Y.W. (Yongmin Wang), Y.W. (Yan Wang) and T.S.; formal analysis, Y.W. (Yongmin Wang); investigation, Y.W. (Yongmin Wang); resources, Y.W. (Yongmin Wang); data curation, Y.W. (Yongmin Wang); writing—original draft preparation, Y.W. (Yongmin Wang); writing—review and editing, Y.W. (Yongmin Wang); visualization, Y.W. (Yongmin Wang); supervision, Z.B.; project administration, Z.B.; funding acquisition, Z.B. All authors have read and agreed to the published version of the manuscript.

Funding

This research was funded by the National Natural Science Foundation of China (Grant NO. 51701093), the Qing Lan Project of Jiangsu Province, the Jiangsu Students’ innovation and entrepreneurship training program (202211276004Z), and the College Student Science and Technology Innovation Fund Project of Nanjing Institute of Technology (TB202202015).

Data Availability Statement

Research data are available upon reasonable request to the authors.

Acknowledgments

This work was supported by School of Materials Science and Engineering, Nanjing Institute of Technology, and Jiangsu Key Laboratory of Advanced Structural Materials and Application Technology.

Conflicts of Interest

The authors declare no conflict of interest.

References

  1. Yao, W.H.; Chen, Y.H.; Wu, L.; Zhang, J.K.; Pan, F.S. Effective corrosion and wear protection of slippery liquid-infused porous surface on AZ31 Mg alloy. Surf. Coat. Technol. 2022, 429, 127953. [Google Scholar] [CrossRef]
  2. Lu, K. The future of metals. Science 2010, 328, 319–320. [Google Scholar] [CrossRef] [PubMed]
  3. Chen, L.Y.; Xu, J.Q.; Choi, H.; Pozuelo, M.; Ma, X.; Bhowmick, S.; Yang, J.M.; Mathaudhu, S.; Li, X.C. Processing and properties of magnesium containing a dense uniform dispersion of nanoparticles. Nature 2015, 528, 539–543. [Google Scholar] [CrossRef]
  4. Zhao, D.W.; Witte, F.; Lu, F.Q.; Wang, J.L.; Li, J.L.; Qin, L. Current status on clinical applications of magnesium-based orthopaedic implants: A review from clinical translational perspective. Biomaterials 2017, 112, 287–302. [Google Scholar] [CrossRef] [PubMed]
  5. Wang, X.; Yan, H.G.; Hang, R.Q.; Shi, H.X.; Wang, L.F.; Ma, J.C.; Liu, X.P.; Yao, X.H. Enhanced anticorrosive and antibacterial performances of silver nanoparticles/polyethyleneimine/MAO composite coating on magnesium alloys. J. Mater. Res. Technol. 2021, 11, 2354–2364. [Google Scholar] [CrossRef]
  6. Witte, F.; Fischer, J.; Nellesen, J.; Crostack, H.A.; Kaese, V.; Pisch, A.; Beckmann, F.; Windhagen, H. In vitro and in vivo corrosion measurements of magnesium alloys. Biomaterials 2006, 27, 1013–1018. [Google Scholar] [CrossRef] [PubMed]
  7. Nordlien, J.H.; Ono, S.; Masuko, N. A TEM investigation of naturally formed oxide films on pure magnesium. Corros. Sci. 1997, 39, 1397–1414. [Google Scholar] [CrossRef]
  8. Arrabal, R.; Pardo, A.; Merino, M.C.; Mohedano, M.; Casajús, P.; Matykina, E. Corrosion of Magnesium-Aluminum Alloys with Al-11Si/SiC Thermal Spray Composite Coatings in Chloride Solution. J. Therm. Spray Technol. 2011, 20, 569–579. [Google Scholar] [CrossRef] [Green Version]
  9. Hu, R.G.; Zhang, S.; Bu, J.F.; Lin, C.J.; Song, G.L. Recent progress in corrosion protection of magnesium alloys by organic coatings. Prog. Org. Coat. 2012, 73, 129–141. [Google Scholar] [CrossRef]
  10. Ba, Z.X.; Dong, Q.S.; Yin, J.H.; Wang, J.X.; Ma, B.; Zhang, X.B.; Wang, Z.Z. Surface properties of Mg-Gd-Zn-Zr alloy modified by Sn ion implantation. Mater. Lett. 2016, 190, 90–94. [Google Scholar] [CrossRef]
  11. Jiang, S.Q.; Zhang, Z.Y.; Wang, D.; Wen, Y.Q.; Peng, N.; Shang, W. ZIF-8-based micro-arc oxidation composite coatings enhanced the corrosion resistance and superhydrophobicity of a Mg alloy. J. Magnes. Alloys 2021, 13, 1–14. [Google Scholar] [CrossRef]
  12. Feng, J.; Chen, Y.; Liu, X.H.; Liu, T.D.; Zou, L.Y.; Wang, Y.T.; Ren, Y.M.; Fan, Z.J.; Lv, Y.Z.; Zhang, M.L. In-situ hydrothermal crystallization Mg(OH)2 films on magnesium alloy AZ91 and their corrosion resistance properties. Mater. Chem. Phys. 2013, 143, 322–329. [Google Scholar] [CrossRef]
  13. Tan, J.K.E.; Balan, P.; Birbilis, N.; Manivasagam, G. Corrosion-resistant Mg(OH)2/Mg-Fe layered double hydroxide (LDH) composite films on magnesium alloy WE43. J. Taiwan Inst. Chem. Eng. 2022, 131, 104169. [Google Scholar] [CrossRef]
  14. Zhang, F.; Zhang, C.L.; Zeng, R.C.; Song, L.; Guo, L.; Huang, X.W. Corrosion Resistance of the Superhydrophobic Mg(OH)2/Mg-Al Layered Double Hydroxide Coatings on Magnesium Alloys. Metals 2016, 6, 85. [Google Scholar] [CrossRef] [Green Version]
  15. Yu, L.; Qian, S.; Qiao, Y.Q.; Liu, X.Y. Multifunctional Mn-containing titania coatings with enhanced corrosion resistance, osteogenesis and antibacterial activity. J. Mater. Chem. B. 2014, 2, 5397–5408. [Google Scholar] [CrossRef]
  16. Lüthen, F.; Bulnheim, U.; Müller, P.D.; Rychly, J.; Jesswein, H.; Nebe, J.G.B. Influence of manganese ions on cellular behavior of human osteoblasts in vitro. Biomol. Eng. 2007, 24, 531–536. [Google Scholar] [CrossRef] [PubMed]
  17. Li, Z.; Ba, Z.; Wang, T.; Kuang, J.; Jia, Y. Fabrication and characterization of Mg–Mn hydrotalcite films on pure Mg substrates. Mater. Res. Express. 2019, 6, 116440. [Google Scholar] [CrossRef]
  18. Zhou, M.; Yan, L.C.; Ling, H.; Diao, Y.P.; Pang, X.L.; Wang, Y.L.; Gao, K.W. Design and fabrication of enhanced corrosion resistance Zn-Al layered double hydroxides films based anion-exchange mechanism on magnesium alloys. Appl. Surf. Sci. 2017, 404, 246–253. [Google Scholar] [CrossRef]
  19. Fahami, A.; Beall, G.W. Mechanosynthesis and characterization of Hydrotalcite like Mg-Al-SO4-LDH. Mater. Lett. 2016, 165, 192–195. [Google Scholar] [CrossRef] [Green Version]
  20. Wu, L.; Zhang, G.; Tang, A.T.; Chen, X.B.; Ma, Y.L.; Ying, L.; Peng, P.; Ding, X.X.; Pan, H.L.; Pan, F.S. Growth behavior of MgAl-layered double hydroxide films by conversion of anodic films on magnesium alloy AZ31 and their corrosion protection. Appl. Surf. Sci. 2018, 456, 419–429. [Google Scholar]
  21. Zhang, F.; Zhang, C.L.; Song, L.; Zeng, R.C.; Liu, Z.G.; Cui, H.Z. Corrosion of in-situ grown MgAl-LDH coating on aluminum alloy Trans. Nonferrous Met. Soc. China. 2015, 25, 3498–3504. [Google Scholar] [CrossRef]
  22. Zhang, F.; Liu, Z.G.; Zeng, R.C.; Li, S.Q.; Cui, H.Z.; Song, L.; Han, E.H.J.S.; Technology, C. Corrosion resistance of Mg-Al-LDH coating on magnesium alloy AZ31. Surf. Coat. Technol. 2014, 258, 1152–1158. [Google Scholar] [CrossRef]
  23. Qiu, L.; Xie, R.; Ding, P.; Qu, B. Preparation and characterization of Mg(OH)2 nanoparticles and flame-retardant property of its nanocomposites with EVA. Compos. Struct. 2003, 62, 391–395. [Google Scholar] [CrossRef]
  24. Li, Z.; Peng, Z.; Qi, K.; Li, H.; Qiu, Y.; Guo, X. Microstructure and Corrosion of Cast Magnesium Alloy ZK60 in NaCl Solution. Materials 2020, 13, 3833. [Google Scholar] [CrossRef] [PubMed]
  25. Xu, R.; Shen, Y.; Zheng, J.; Wen, Q.; Li, Z.; Yang, X.; Chu, P.K. Effects of one-step hydrothermal treatment on the surface morphology and corrosion resistance of ZK60 magnesium alloy. Surf. Coat. Technol. 2017, 309, 490–496. [Google Scholar] [CrossRef]
  26. Shang, W.; Wang, Y.; Wen, Y.; Zhan, X.; Kong, D. Study on the Properties of Micro-arc Oxidation Self-assembled Composite coatings on Magnesium Alloy. Int. J. Electrochem. Sci. 2017, 12, 11875–11891. [Google Scholar] [CrossRef]
  27. Yin, X.; Mu, P.; Wang, Q.; Li, J. Superhydrophobic ZIF-8-Based Dual-Layer Coating for Enhanced Corrosion Protection of Mg Alloy. ACS Appl. Mater. Interfaces. 2020, 12, 35453–35463. [Google Scholar] [CrossRef]
  28. Huang, M.; Lu, G.; Pu, J.; Qiang, Y. Superhydrophobic and smart MgAl-LDH anti-corrosion coating on AZ31 Mg surface. J. Ind. Eng. Chem. 2021, 103, 154–164. [Google Scholar] [CrossRef]
Figure 1. XRD patterns of different samples.
Metals 12 01760 g001
Figure 2. FT-IR spectra of different samples.
Metals 12 01760 g002
Figure 3. SEM images of different samples: (a,b) Mg(OH)2, (c,d) 6 h, (e,f) 12 h, (g,h) 24 h.
Metals 12 01760 g003
Figure 4. Polarization curves of ZK60 magnesium substrate and film samples.
Metals 12 01760 g004
Figure 5. Hydrogen evolution curves of different samples at different immersion times.
Metals 12 01760 g005
Figure 6. Macromorphologies of 12 h sample immersed in SBF solution: (a) 24 h; (b) 72 h; (c) 120 h; (d) 168 h.
Metals 12 01760 g006
Figure 7. Microcorrosion morphologies of 12 h sample immersed in SBF solution: (a1,a2) 24 h, (b1,b2) 72 h, (c1,c2) 120 h, (d1,d2) 168 h.
Metals 12 01760 g007
Figure 8. The cross-sectional view of the 12 h sample immersed in SBF solution: (a) 24 h, (b) 72 h, (c) 120 h, (d) 168 h, white lines correspond to the EDS-scanned area.
Metals 12 01760 g008
Figure 9. The proposed corrosion protection mechanism model of the hydroxide film. (a) Cl invaded the film, (b) Microcracks appeared, (c) Numerous corrosion products accumulated, (d) Corrosion products fell off.
Metals 12 01760 g009
Figure 10. EIS spectra of ZK60 and 12 h samples at different immersion times: Nyquist plots.
Metals 12 01760 g010
Figure 11. EIS spectra of ZK60 and 12 h samples at different immersion times: (a) Bode plots; (b) phase plots.
Metals 12 01760 g011
Figure 12. Equivalent circuit used to fit EIS plots and physical model of 12 h sample immersed for different times.
Metals 12 01760 g012
Table 1. EDS results on different samples.
SampleElementary Composition (at.%)
OMgMnZn
Mg(OH)234.2464.48-01.28
6 h29.4663.7104.6702.17
12 h29.4457.8811.5701.12
24 h29.2756.0713.9200.73
Table 2. The corrosion potential (Ecorr) and corrosion current density (icorr) of samples.
SampleOCPs/VEcorr/V(vs. SCE)icorr/A·cm2Pi/mm/yPH/mm/y
ZK60−1.62−1.493.04 × 10−50.700.34
Mg(OH)2−1.42−1.321.31 × 1062.99 × 10−20.19
6 h−1.40−1.361.51 × 10−63.45 × 10−20.14
12 h−1.35−1.293.07 × 10−77.02 × 10−39.6 × 10−2
24 h−1.30−1.213.83 × 10−78.75 × 10−30.12
Table 3. EDS results on 12 h sample immersed in SBF solution.
SampleElementary Composition (at.%)
ONaMgPClCaMn
24 h41.2001.0544.33-12.88-00.54
72 h28.8401.7424.9321.7900.4121.5800.71
120 h34.9902.0004.4922.1600.2435.8500.28
168 h28.8501.4004.7423.9400.4040.4200.53
Table 4. Fitting results of EIS plots for 12 h samples at different immersion times.
SampleRs/Ω·cm2Y0-out/μΩ–1⋅cm–2⋅s–1noutRout/Ω·cm2Y0-in/μΩ–1⋅cm–2⋅s–1ninRin/Ω·cm2
24 h81.517.400.67208.312.020.743018
72 h70.827.760.64136.517.450.731807
120 h104.37.920.6659.9545.790.682038
168 h0.013.000.50158.368.050.631735
Publisher’s Note: MDPI stays neutral with regard to jurisdictional claims in published maps and institutional affiliations.

