Article

External Illumination Enables Coaxial Sensing of Surface and Subsurface Molten Pool Geometry in LPBF

Department of Mechanical Engineering, Politecnico di Milano, Via La Masa 1, 20156 Milan, Italy
*
Author to whom correspondence should be addressed.
Metals 2022, 12(10), 1762; https://doi.org/10.3390/met12101762
Submission received: 6 August 2022 / Revised: 9 October 2022 / Accepted: 17 October 2022 / Published: 20 October 2022
(This article belongs to the Special Issue Additive Manufacturing of Architected Metallic Materials)

Abstract

:
Laser powder bed fusion (LPBF) attracts the attention of high-end manufacturing sectors for its capability of depositing free-form components with elevated mechanical properties. However, due to the intrinsic nature of the feedstock material and the interaction with the laser beam, the process is prone to defect formation and manufacturing inaccuracies. Therefore, the development of a monitoring architecture capable of measuring the geometrical features of the process tool (i.e., the melt pool generated by the laser-material interaction) is of paramount importance. This information may then be exploited to evaluate process stability. In this work, a high-speed camera was implemented coaxially in the optical chain of an LPBF system to extrapolate the geometrical features of the molten pool surface and its oscillatory behaviour, with elevated spatial and temporal resolution. A secondary light source was tested in both coaxial and off-axis configuration to dominate process emission and assess optimal illumination conditions for extracting the molten pool’s geometrical features. Preliminary results showed that the off-axis configuration of the illumination light enabled direct measurement of the molten pool surface geometry. A newly developed image processing algorithm based on illuminated images obtained via the coaxial observation frame was employed to provide automated identification of the melt pool geometry. Moreover, bright reflections of the external illumination over the melt surface could be clearly observed and used to characterise the oscillatory motion of the molten material. This information may therefore be taken as an indirect indicator of the molten pool penetration depth, hence providing information regarding the subsurface geometry. A successive experimental investigation showed the capability of the monitoring architecture to resolve the molten pool’s length, width and area with elevated acquisition frequency. Molten pool surface oscillations in the kHz range could be correlated to the penetration depth while the molten pool width measured via the high-speed imaging setup corresponded to the track width of the depositions. Hence, the methodological approach for the concurrent measurement of the molten pool’s geometry in three spatial dimensions was demonstrated and may be used to track the stability of LPBF depositions.

1. Introduction

Laser powder bed fusion (LPBF), as one of the established metal additive manufacturing (AM) processes, makes the production of high-end components for the biomedical and aerospace industries possible [1]. Considering the critical applications of such segments, inline qualification of production has high appeal. Various sensors can provide different cues for assessing process stability and possibly the physical properties of the final manufactured item. These themes are of great interest to both the scientific and industrial community. Several high-value products produced by LPBF for biomedical, aerospace, energy, and tooling industries require high geometrical precision [2] and adequate part density [3]. Monitoring the melt pool geometry throughout the process can provide the means for ensuring product quality, especially considering thin-walled or strut-based components [4,5] used for instance in lattices [6,7], biomedical devices such as stents [8,9] and heat exchangers [10,11]. This topic has been widely explored throughout scientific literature with the implementation of various sensing approaches [12,13]. Based on the working principle of the sensor, the different techniques make it possible to identify specific process characteristics. Further enhancement of in situ monitoring may be achieved via sensor fusion approaches as shown by different contributions [14,15]. While observation of the melt pool geometry parallel to the build plane has been widely investigated, approaches combining molten pool depth measurements with other significant geometrical parameters (such as area, width and length) require further attention.
The geometrical features of the melt pool along the build plane are typically obtained using high-speed imaging equipment. Spatially resolved sensors with high temporal resolution can be readily implemented within the off-axis and coaxial architecture of an LPBF system. Throughout the scientific literature, process observation relies on the acquisition of emission-based images which, however, consists of indirect measurement of the molten pool’s geometry [13]. Emission-based images provide spatially resolved information regarding the planar geometry of the melt only after thresholding or via more complex calibration procedures. On the other hand, imaging techniques that exploit external illumination sources provide direct observation of the melt by dominating the emission process and exposing the actual melt geometry. From a hardware perspective, these approaches are challenging due to the elevated intensity of the secondary light source, which must be directed towards the laser-material interaction area.
Nonetheless, imaging approaches to capturing the emission process are among the most commonly implemented systems used to extract information regarding process stability. These techniques have been initially employed in studies to characterise the laser–material interaction in advanced laser manufacturing processes such as laser drilling and ablation [16,17,18]. For instance, visualisation of the subsurface geometry of the melt may be achieved by processing transparent material during ablation processes [19].
Early work by KU Leuven University demonstrated the potential of camera-based approaches for feedback control of the LPBF process [20,21]. Emission-based images represent the geometrical and temperature-based features of the melt pool and may be employed to determine qualitative metrics of the deposition [22]. Thombansen et al. correlated the process emission acquisitions to pyrometric data [23]. Accordingly, Demir et al. were capable of detecting overheated regions with protrusions from the powder bed by tracking the melt pool area throughout the deposition process [24].
As previously mentioned, measuring the geometrical indicators from the process images poses significant challenges in terms of the monitoring architecture since dedicated calibration of the imaging equipment is required. Thermographic measurements of the melt pool were conducted by Criales et al. on IN625 alloy while Hooper observed the LPBF deposition of Ti6Al4V via two coaxial high-speed cameras, observing the emission at different wavelengths to determine the melt pool temperature distribution [25,26]. High-speed thermographic measurements were exploited by Krishna et al. to predict metallographic properties of single-track depositions [27]. Further innovative developments in the field of thermographic measurements were reported by Ma et al. [28]. Direct process monitoring via a single high-speed camera could be achieved by projecting the observed object (at two different wavelengths) over the same sensor separately. Over and above the issues correlated to instrument calibration, the use of coaxial melt pool images for a layer-wise process control was also demonstrated to be effective in avoiding part swelling [29] and improving overhang distance without the use of supports [30]. Moreover, statistical control charts for guaranteeing stable process conditions based on data extracted via in situ monitoring approaches may be envisioned in the near future. For instance, Yang et al. exploited thermographic measurements of the melt pool to determine overmelting and spatter formation [31].
On the other hand, the use of secondary external illumination provides a clear vision of the molten pool’s geometrical features instead of deriving them from images of the emission process. A secondary light source is employed to dominate the emission process, thereby allowing a clear view of the actual melt geometry. Early examples of the application of these monitoring approaches may be found in established laser-based processes [32]. Naturally, this technique has also been utilised to monitor the laser powder bed fusion process. Cooling rates of the process were estimated via high-speed imaging acquisitions by Scipioni Bertoli et al. [33]. Gunenthiram et al. observed the spatter generation dynamics and molten pool motion during the deposition of AISI316L and Al-12Si [34]. Bidare et al. developed an open architecture LPBF system for examining the LPBF process at different levels of atmospheric pressure using high-speed imaging [35,36]. The combined use of a high-speed camera with a secondary illumination light technique was employed by Caprio et al. to measure the oscillation frequency of the melt and thus provide an indirect measurement of the penetration depth [37].
At this time, approaches to providing the subsurface geometry of the melt rely on X-ray imaging techniques, which are, however, difficult to implement in industrial LPBF machines [38]. The surface geometry of the melt can be correlated to the swelling phenomena in overheated regions [24] or lack of fusion [39,40,41]. However, information regarding the penetration depth may be of interest in determining the formation of gas-entrapment porosity [14] or an indication regarding the mechanical properties of the material correlated to intra-layer bonding [42]. Combined measurements of these quantities may thus provide a complete set of information for assessing process stability and could eventually be correlated to defect formation. Within scientific literature few approaches that achieve this scope are reported. Boley et al. showed that a three-dimensional reconstruction of the melt geometry in laser welding is possible via the combined use of X-ray and high-speed imaging techniques [43]. In LPBF, Goossens et al. measured the melt pool width and length while simultaneously estimating the molten depth by observing process emission images and correlating this information to the penetration depth via an analytical thermal model [44].
Hence, the possibility of employing a single high-speed imaging system to extract both the surface and subsurface geometry of the melt is of interest to the scientific and industrial community. To the authors’ knowledge, simultaneous measurement via a camera-based approach of melt pool width, length, and depth has not been reported in the literature. For this reason, in this work, by implementing an external illumination light in the optical chain of an LPBF system, a monitoring environment was developed combining direct measurement of the molten pool’s geometrical surface features and extrapolation of the penetration depth via an indirect measurement approach based on the detection of the molten pool’s surface oscillations.
The great potential of high-speed imaging techniques in providing direct observation of the molten pool’s features is, however, in contrast with challenges related to the architecture of the system within a coaxial configuration. Both the configuration of the illumination and imaging system play an important role. The use of a coaxial illumination light (such as a diode laser source) was tested by Mazzoleni et al., yet issues correlated to speckle generation were found to be a significant obstacle in providing a clear vision of the melt [45]. Open points related to the most appropriate configuration of the illumination system remain, especially with regards to the possibility of detecting the melt surface’s oscillations by coaxial configuration of the imaging sensor. As a matter of fact, detection of the melt surface oscillations using a camera positioned coaxially in the process has not yet been attempted in the scientific literature. Moreover, a structured approach to the design of coaxial monitoring equipment may be beneficial for future developments of approaches to monitoring LPBF systems.
This work firstly reports the design criteria for setting up the monitoring architecture required to measure both the molten pool’s surface geometry and melt surface oscillations. The Materials and Method section reports the implementation of a coaxial monitoring system in a prototypal LPBF system, along with the design of the experimental campaigns successively conducted. Direct observation of the molten pool is enabled by combining a high-speed camera with a secondary illumination light, thus allowing extraction of the molten pool’s various geometrical features. The Results section is divided into two parts. Firstly, the outcome of an experimental campaign to evaluate the effect of different illumination conditions is reported. The second part of the Results reports acquisitions that belong to two different sets of process parameters, showing the applicability of the monitoring architecture to providing spatially resolved information on the melt pool in three dimensions.

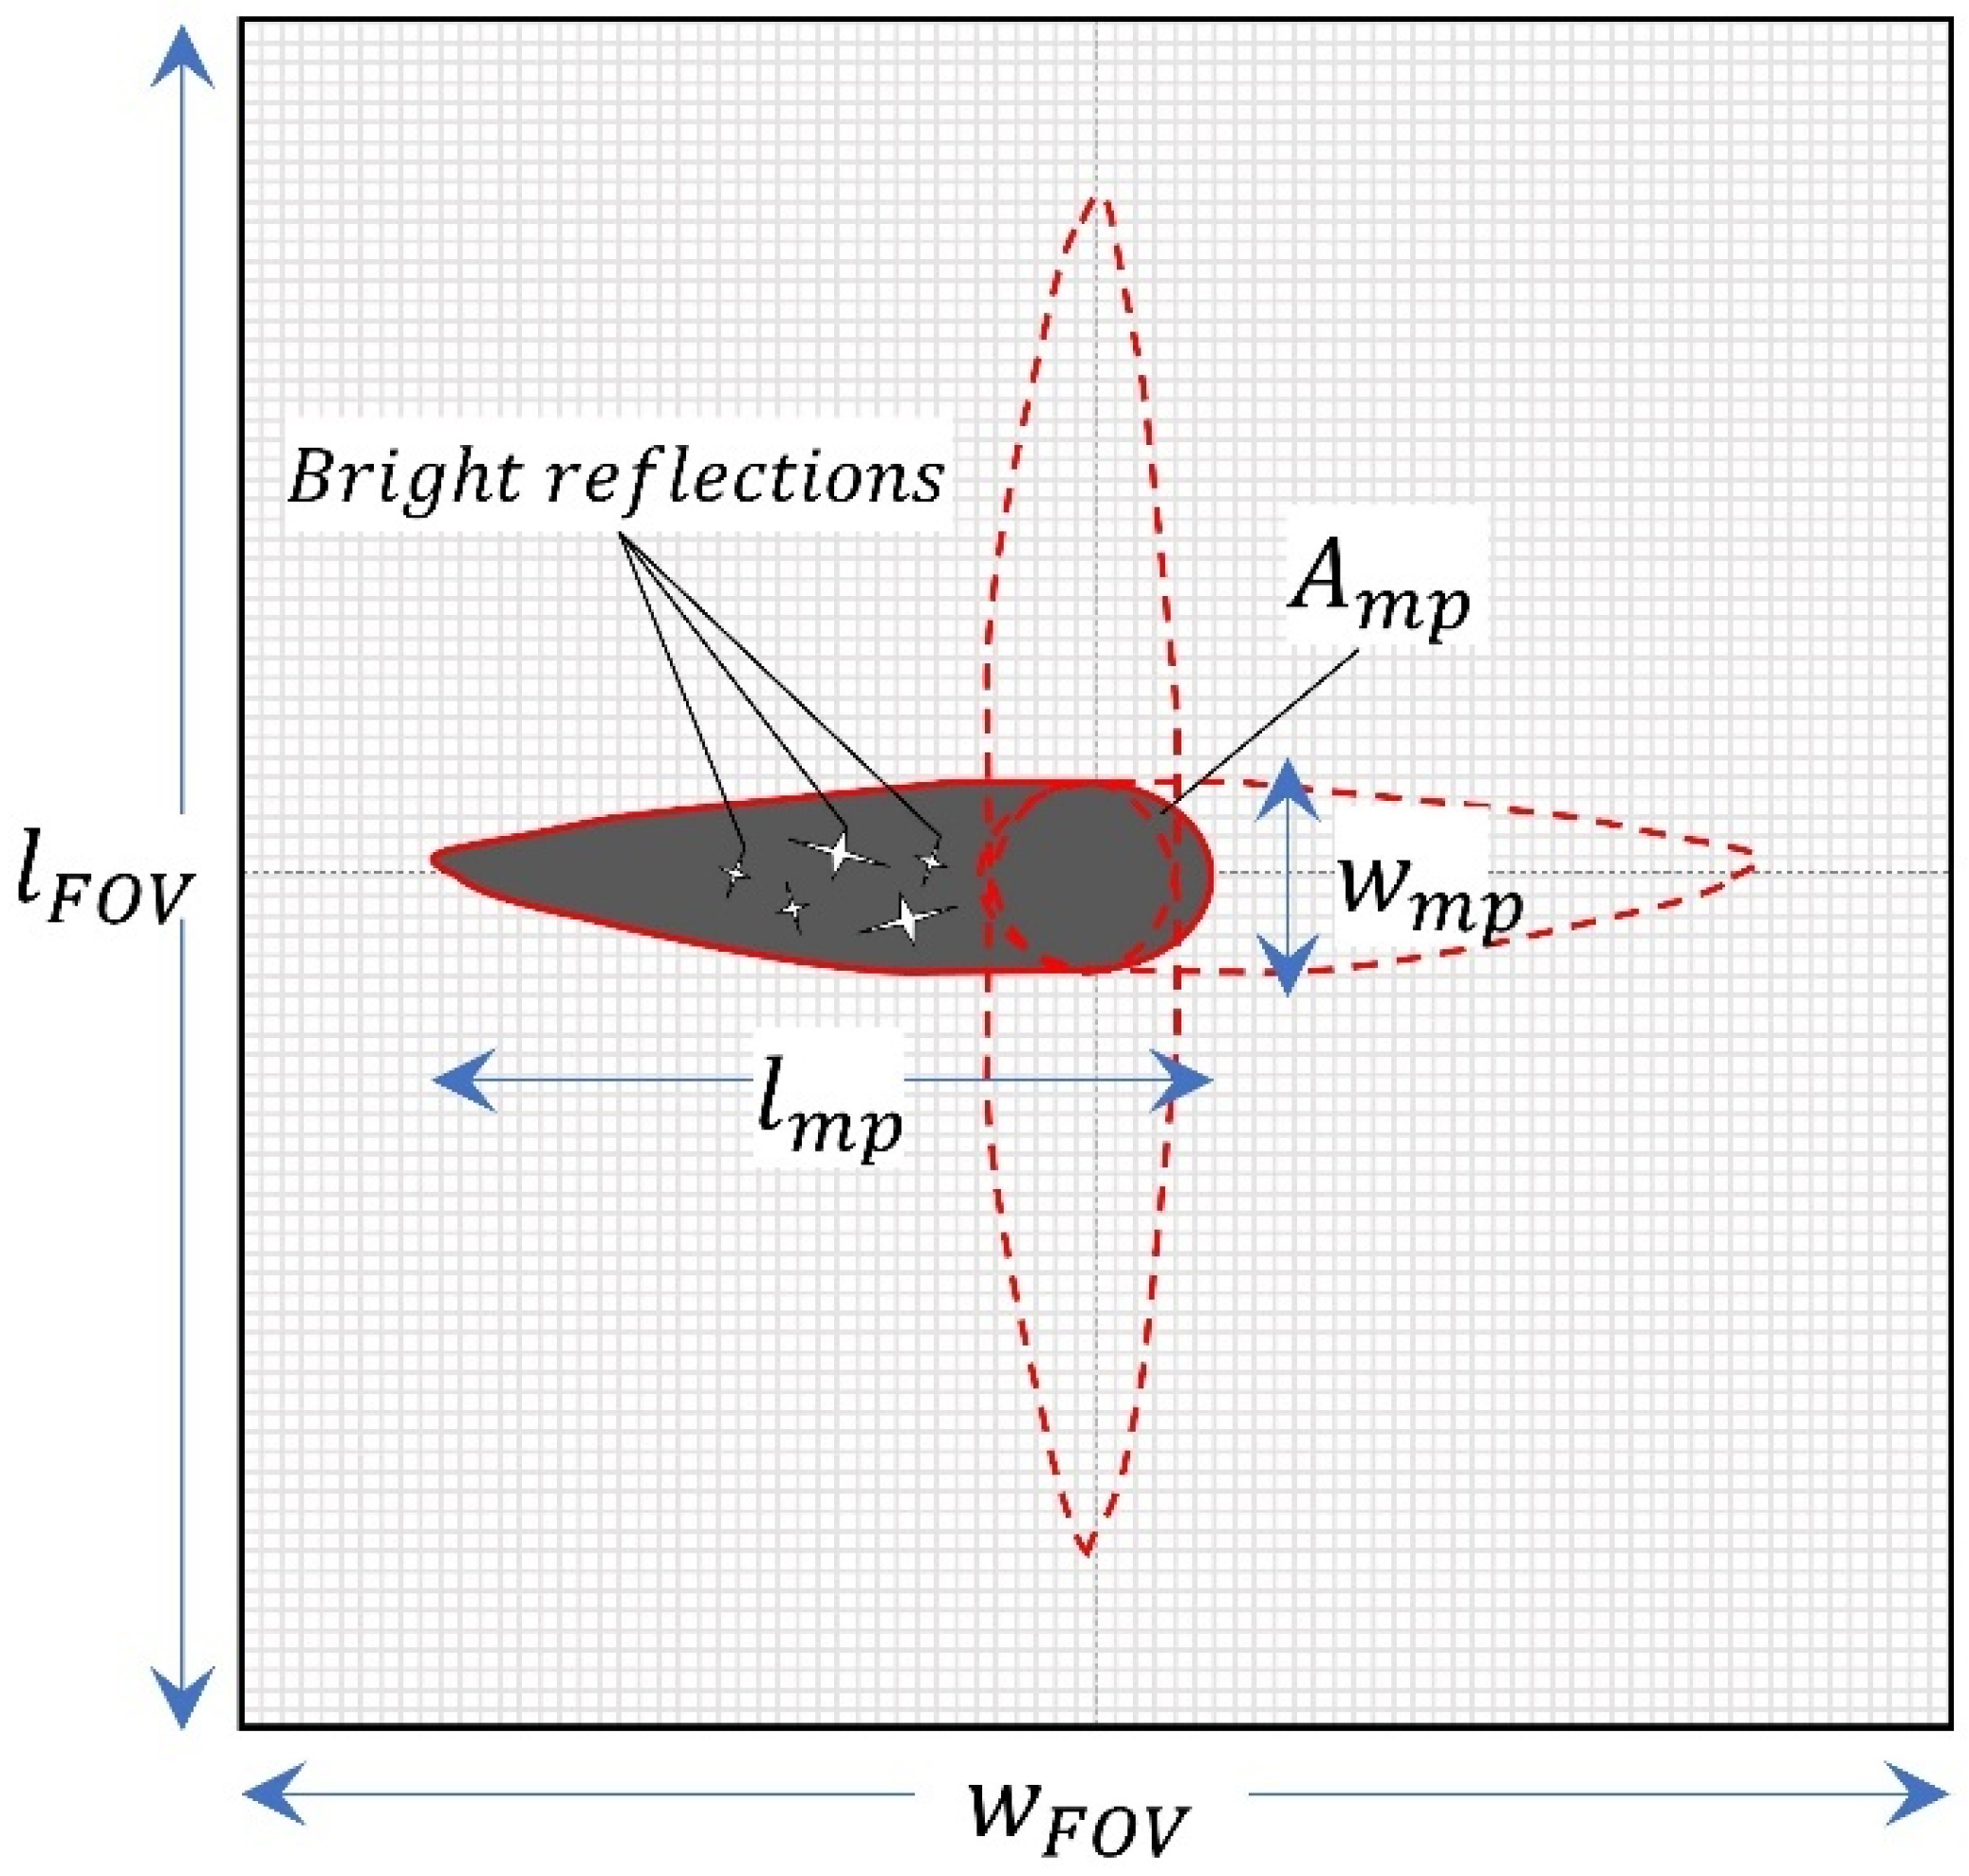
2. Design Criteria for a Coaxial Monitoring System for the Simultaneous Estimation of the Molten Pool’s Surface and Subsurface Geometry

Design cues provide a useful framework for robust implementation of data acquisition architecture. Mazzoleni et al. previously reported the main indications for developing a coaxial monitoring system to measure the surface geometry of the melt pool in the LPBF process [22]. This chapter expands the design cues defined by Mazzoleni et al. and joins them to the approach for estimating the penetration depth developed by Caprio et al. [22,37]. The innovation of this work consists in combining these techniques to provide a simultaneous estimate of the melt pool’s surface and subsurface geometry. Moreover, the methodology for estimating the penetration depth was developed for an off-axis monitoring system. In the current chapter, considerations to extend it to a coaxial configuration of the imaging system are therefore developed.
The monitoring architecture proposed relies on a high-speed imaging camera with secondary illumination to provide a clear view of the molten pool’s surface and concurrent measurement of the molten pool’s surface oscillations. This approach was initially conceived by Semak et al. [46]. A secondary light source is employed to dominate the emission process, making it possible to observe the melt pool’s surface geometry and the bright surface reflections present over the melt surface with elevated temporal and spatial resolutions.
When the LPBF process is observed via a coaxial configuration with a camera sensor, the field of view should be square-shaped and centred on the position of the laser–material interaction. This condition makes it possible to monitor the molten pool’s geometry independently of the direction a layer is scanned. The field of view is therefore characterised by its width (wFOV) and length (lFOV). Accordingly, in terms of the relationships defined by Mazzoleni et al. the size of each side of the field of view should hence be at least twice the size of the molten pool’s length (lmp). The area of the melt pool (Amp) is another significant parameter which may be measured using the coaxial imaging configuration.
On the other hand, the data transfer rate limitations of the monitoring system must be taken into account when defining the number of active pixels of the imaging sensor and consequently the acquisition frequency. Hence, the spatial resolution of the imaging chain must be taken into account in order to comply with the requirements of the achievable field of view, while maintaining sufficient resolution to distinguish the bright reflections that indicate the molten pool’s surface oscillations. Concerning the measurement of the geometrical parameters of the melt pool’s surface, the spatial resolution (SR) required is generally of an order of magnitude smaller than the minimum characteristic (which is usually the molten pool’s width (wmp)) [45].
Figure 1 shows the principal geometrical features of the melt pool and of the imaging sensor, which must be taken into account when designing the monitoring system schematically.
In order to estimate the penetration depth of the molten pool, as indicated in previous work by Caprio et al., the bright reflections symptomatic of the oscillatory motion of the melt surface must be captured at different time instants [37]. This information must then be analysed by spectral analysis and for this reason it is important to keep both the frequency resolution and the acquisition frequency as high as possible. This respectively makes it possible to minimise errors related to redistribution of the signal energy and aliasing. Oscillation frequencies in the kHz range have been often detected for laser-based processes [37,47,48]. On the other hand, it is essential to maintain a high spatial resolution in order to detect the molten pool’s features [22]. To maximise the acquisition frequency of a high-speed camera, the number of active pixels of the sensor must be minimised due to data transfer rate limits. The most important aspect is that the acquisition frequency (facq) of the high-speed imaging camera should be at least twice the frequency of the phenomenon (fphenomenon) in order to avoid aliasing of the phenomenon.
The leakage effect may also cause errors in identifying the oscillation frequency, especially when neighbouring peaks are within the narrow bandwidth of the power spectral density (PSD) estimate. Therefore, the frequency resolution Δfres must be selected below a value estimated a priori of the minimum change in frequency between two successive oscillation peaks (Δfmin,peaks) (in the case where more than one pole is expected in the transfer function of the oscillating system). Another aspect to take into account is that an off-axial setup, often employed for high-speed imaging, observes the process from a fixed point of view (contrarily to coaxial monitoring setups which view the process from a Lagrangian perspective) and hence introduces a limitation in terms of the acquisition time (Tacq). This generates a constraint in the frequency resolution of the periodogram estimate (Δfres,PD) of the power spectral density [49].
The frequency resolution of the PSD estimate is also affected by the window functions employed to reduce the leakage error. In the case of a coaxial imaging approach, the frequency resolution is limited by the length of the scan vector being observed (lobs). Hence, the moving observation frame removes the constraints imposed by a fixed observation frame reported in previous investigations. Considering a fixed scanning velocity v of the process light, the defining relationship for the frequency resolution estimated by means of the power spectral density can thus be expressed as follows:
Δ f r e s , P D = v l o b s
This relationship implies that a compromise must be achieved between the number of estimations of the penetration depth along a scan vector. The design criteria presented in this work, combined with the design cues reported in previous publications on the topic, are summarised in Table 1.
The illumination light is another aspect that should be considered in the design of the coaxial monitoring chain. In the case of an off-axis monitoring system, the illumination is maintained fixed in a certain position. On the other hand, in the case of a Lagrangian observation configuration, the light may be implemented once again in a fixed off-axis configuration or coaxially. The advantage of installing the secondary light source coaxially is that it may be possible to obtain uniform illumination throughout the whole scanning field. This also implies lower power consumption due to the fact that a light concentrated only in the region of interest can be employed. However, in this configuration challenges remain due to the presence of internal back-reflections in the imaging chain and the possible presence of speckles if a coherent illumination light is used.
Off-axis illumination allows for an easier setup of the system (in terms of configuration and implementation). Still, considering the difficulties related to achieving uniform illumination of sufficient intensity throughout the observation region, there are great drawbacks correlated to industrial applicability. The advantages and disadvantages which must be taken into account when configuring the illumination system are summarised in Table 2.

3. Materials and Method

3.1. LPBF System

A single mode laser source provided by IPG Photonics (IPG YLR-300-AC, IPG Photonics, Oxford, MA, USA) was employed as process light together with an optical chain provided by Raylase (AM Module, Raylase, Weßling, Germany). The system made it possible to deflect the laser beam onto the work area of a prototypal LPBF system. This equipment enables flexible configuration of processing and monitoring equipment. The prototypal LPBF system was presented in greater detail in previous publications [24,50,51]. For the scope of this work, the scanner head was equipped with a monitoring module which enables coaxial integration of imaging sensors as well as the illumination light.
The laser beam exiting the transport fibre from the source was collimated to a 5 mm diameter. The beam was successively expanded through the use of a Galilean 2X beam expander provided by Optogama (Vilnius, Lithuania). The process module of the scanner head hence makes it possible to focus the input light to a beam waist diameter of 43 µm. The galvanometric scanner head and laser emission were controlled by means of a scanner controller card (SP-ICE 3, Raylase, Weßling, Germany) which was programmed using the DMC software (Vilnius, Lithuania). Table 3 shows the main properties of the laser system and its beam propagation characteristics.
In Figure 2 the schematic representation and implementation of the system is shown. Figure 2a shows the schematics of the light paths with a coaxial configuration of the illumination system while Figure 2b reports the condition with an off-axis configuration of the light source.

3.2. Imaging and Illumination Equipment

A high-speed camera (Fastcam Mini AX200, Photron, Tokyo, Japan) was employed to capture the frames at elevated data rates by means of a 1 mega pixel CMOS sensor. The principal specifications of the high-speed imaging setup are reported in Table 4. A region of interest (ROI) could be selected flexibly, making it possible to reduce the number of active pixels of the sensor, thus enabling the user to increase the acquisition frequency. The system’s acquisition frequency and field of view are thus interdependent and were selected according to the design cues presented previously. A complete vision of the melt pool was thus ensured with sufficiently high-acquisition frequency for measuring the melt oscillations. The high-speed camera was positioned coaxially in the monitoring module of the scanner head. The imaging chain allowed us to achieve a spatial resolution of 12.4 µm/pixel. In order to dominate the emission process during the high-speed imaging acquisitions, a secondary illumination light was employed. The system used was a non-coherent laser source emitting at 640 nm (Cavilux HF, Cavitar, Tampere, Finland) with a pulsed wave emission characterised by a pulse duration which could be regulated flexibly (tillumination). The exposure time (texposure) of the high-speed camera was synchronised with the illumination pulse and could be regulated flexibly in order to ensure complete exposure to the illumination light reflected from the region observed, while limiting the capture of the light emitted by the process (in accordance with the design guidelines by Mazzoleni et al.) [22]. The final implementation of the monitoring system into the scanner module of the LPBF prototype is shown in Figure 2c. The illumination light could be implemented either coaxially (as shown in Figure 2a) or off-axis (Figure 2b). In order to enable the use of coaxial illumination, a 50R/50T beam splitter (Edmund Optics, Barrington, NJ, USA) in the visible range was inserted in the optical chain of the monitoring module. The overall specifications of the monitoring system developed are reported in Table 4.

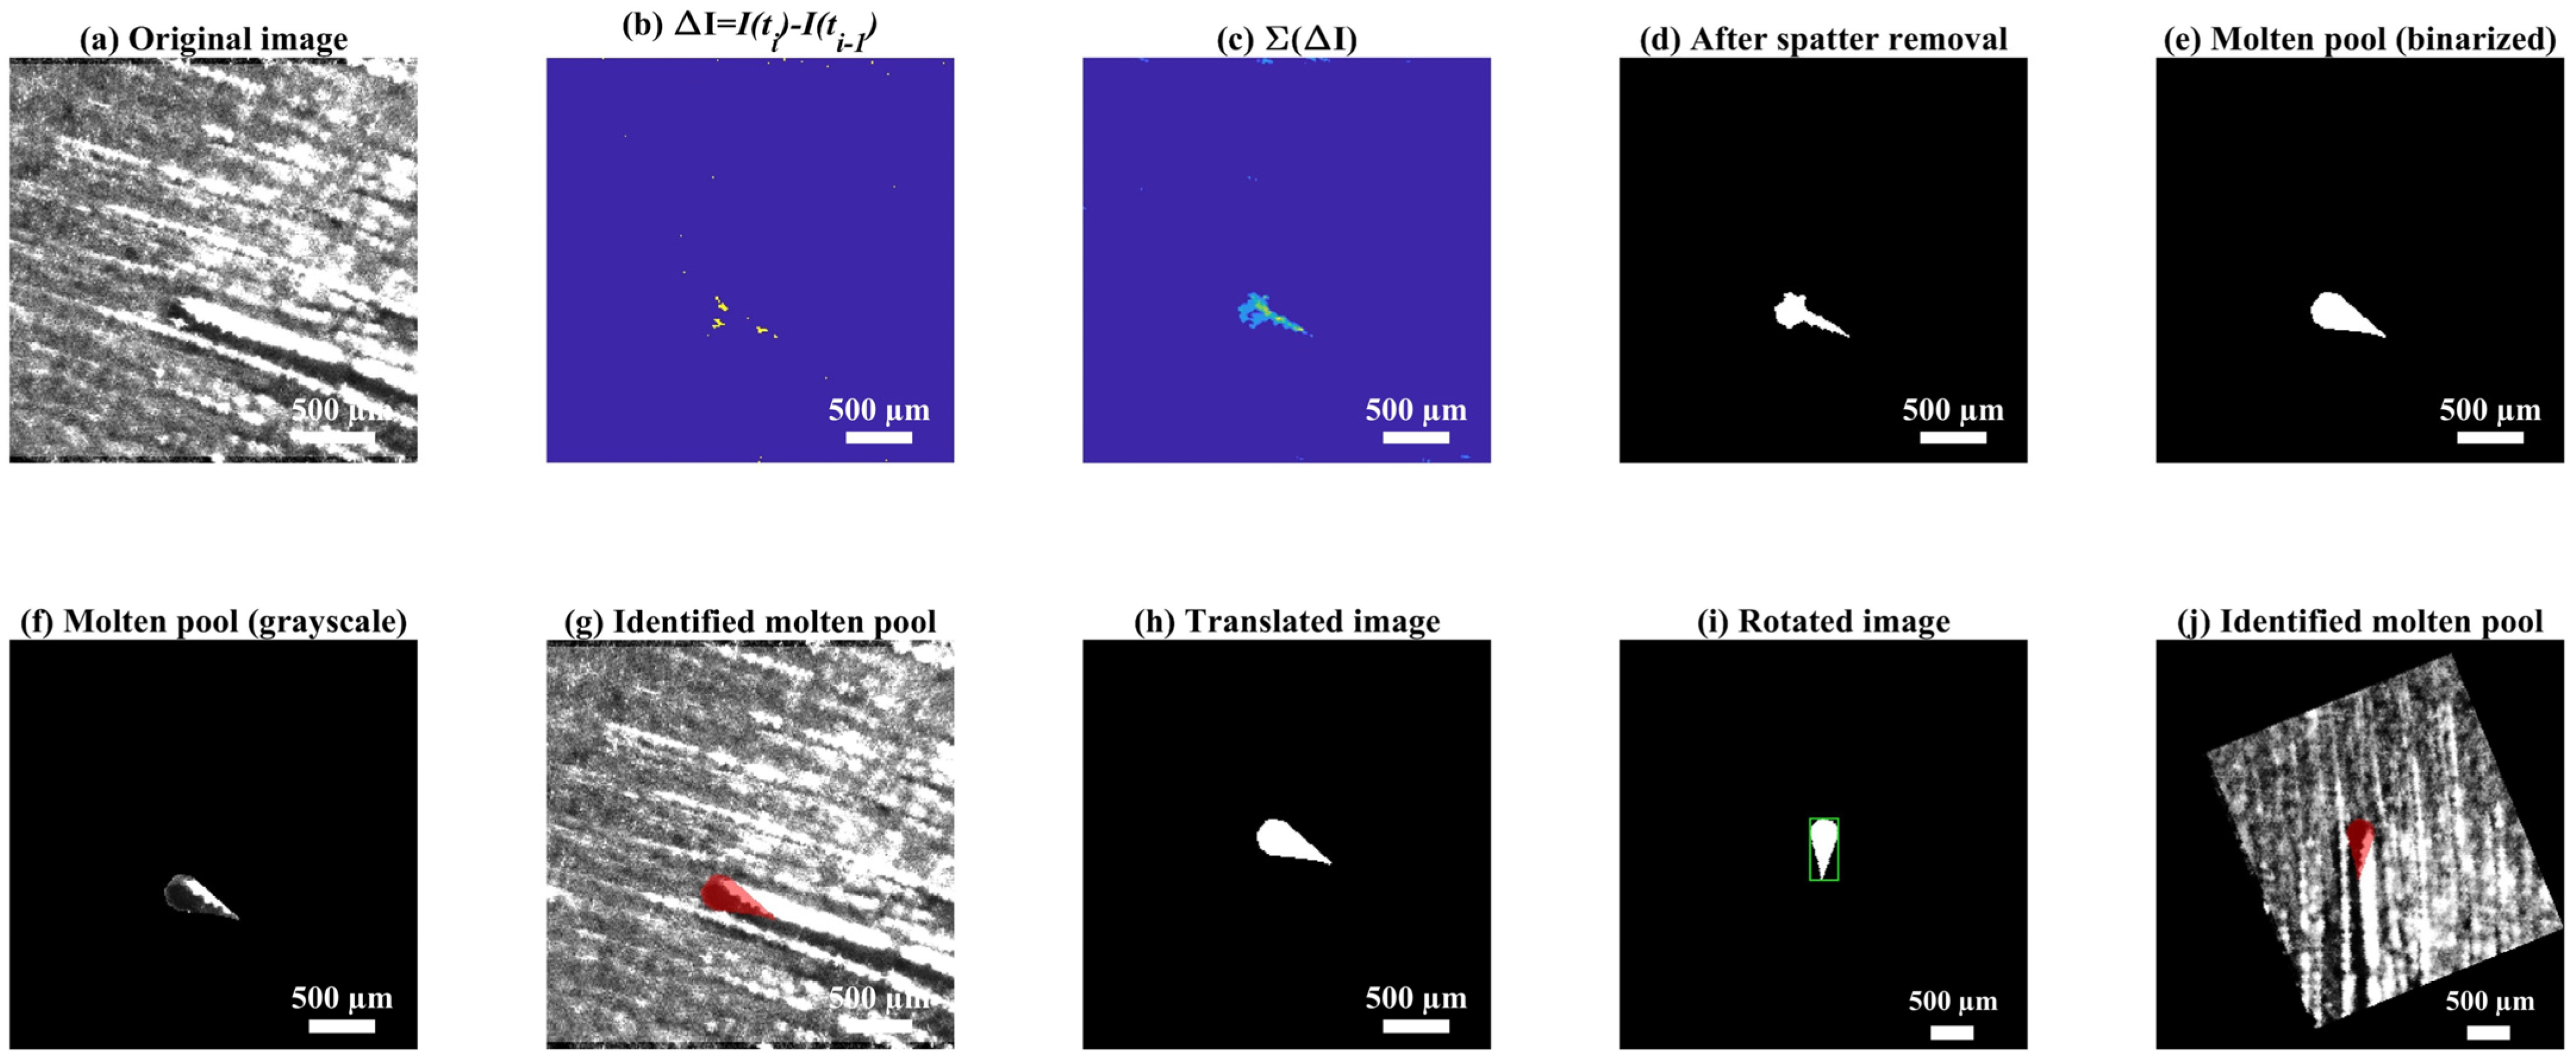
3.3. Image Processing Algorithm

Once the architecture of the monitoring chain was defined, a molten pool identification algorithm was developed. Starting from the acquired frames, it was possible to extract the geometrical features of the melt pool and the intensity of the bright reflections of the illumination light. The algorithm was developed using the Matlab Image Processing Toolbox, and the various steps of the image processing algorithm are reported graphically in Figure 3. By exploiting the motion of the bright reflections, the molten pool could be identified. The mathematical difference between two successive frames (ΔI) makes it possible to identify the motion of these reflections over the molten pool’s surface. This is possible thanks to the highly dynamic nature of these features and elevated acquisition frequency of the imaging chain in relation to the velocity of the laser beam. This operation may thus be indicated as the difference between a frame at a specific time instant I(ti) and a frame at the previous time instant I(ti−1) and is shown graphically in Figure 3b:
Δ I = I ( t i ) I ( t i 1 )
The difference between two successive frames may not be sufficient to correctly identify the melt pool. Hence, an averaging operation over 10 successive differences is required:
I a v g = j = 1 10 Δ I j
The result of this averaging operation is shown in Figure 3c. Successively an image dilation and erosion operation is conducted alongside filtering of the image blob with the greatest area in order to ensure the removal of spatter or noise from the frame being processed (Figure 3d). The molten pool is thus identified as shown in Figure 3e–g. In order to extract the geometrical features, the blob representing the molten pool being identified must be transposed and rotated onto a new reference system. This step is required to simplify the estimation of the melt pool’s width and length as well as to extract the intensity of the surface reflections. In accordance with previous work by the authors, the reflection intensity was computed in a region of interest (ROI) of 150 µm × 150 µm positioned just behind the laser–material interaction position [52]. The intensity indicator Isum,ROI was thus calculated as the sum of the intensity Ik of the pixels belonging to this region of interest (i.e., summing all the pixels belonging to the ROI from 1 to the last pixel, NROI).
I s u m , R O I = k = 1 N R O I I k
The molten pool identified in the new reference frame is shown in Figure 3j. The reader is referred to Supplementary Video S1 to appreciate the dynamics of the molten pool identification algorithm.

3.4. Material

AISI316L stainless steel powder was employed as feedstock material (Cogne Acciai, Brescia, Italy). The powder exhibited a granulometry of between 15 and 45 µm. The same alloy was employed to manufacture the substrates upon which the material remelting and single-track experiments were conducted.

3.5. Characterisation Equipment

Single-track depositions were characterised by means of metallographic analysis to determine the subsurface geometry of the melt. The single tracks were cut transversally to the laser advancement direction and were prepared through grinding and polishing procedures. Chemical etching with a tripartite solution of nitric acid (65% concentration), hydrochloric acid (37% concentration) and distilled water was used to expose the cross-sectional geometry of the melt. After exposure to the acid solution, the cross-sections were acquired by means of an optical microscope (Ergolux 200, Leitz, Leica, Wetzlar, Germany).

3.6. Experimental Design

Preliminary experiments were designed to evaluate the capability to detect the bright reflections on the molten pool’s surface by means of the high-speed camera positioned coaxially. Two different configurations of the illumination light were assessed, consisting of coaxial and an off-axis conditions. The process light was scanned at a velocity v = 900 mm/s with a continuous wave emission power of 300 W to perform single-track material remelting of the substrate. The beam waist diameter was positioned on the surface of the substrate. Due to the preliminary nature of this investigation, powder was not used for the experimentation. Previous work by Caprio et al. showed that the effectiveness of the monitoring equipment may be evaluated independently of the presence of powder [37]. The material of the substrate consisted of AISI 316L and localised shielding of the laser–material interaction was achieved by means of Ar gas to prevent oxidation and remove any process debris. The pulse duration of the illumination light was set to 0.55 µs while the exposure time of the imaging sensor slightly exceeded this value in order to capture all the reflected light (texp = 0.66 µs). The field of view corresponded to 384 pixels × 384 pixels (i.e., 4.76 mm × 4.76 mm considering the spatial resolution) with an acquisition frequency of 36 kHz. The experimental design is summarised in Table 5.
A second experimental campaign was then designed to assess the capability of the monitoring system in determining the geometrical features and the oscillatory behaviour of the melt during the deposition of single tracks. The choice of the illumination configuration in an off-axis condition was made in accordance with the results of the first experimental campaign. The acquisition frequency was increased (facq = 50 kHz) in order to reduce the risk of aliasing errors in the measurement of the oscillatory motion of the melt. A smaller field of view was thus selected (FOV = 3.15 mm × 3.15 mm). Exposure time and the duration of the illumination time were thus selected accordingly to provide clear vision of the process (texposure = 0.49 µs and tillumination = 0.39 µs respectively). A layer of powder with a thickness of 50 µm was spread by means of a mechanical roller over the AISI316L baseplate prior to scanning the process light to deposit the 20 mm long single tracks. Localised shielding of the process was obtained by means of argon gas. Experiments were conducted with two different combinations of process parameters consisting of Condition A, with p = 275 W, v = 225 mm/s and Condition B, with p = 300 W and v = 450 mm/s. Each condition was replicated twice. The two experimental conditions resulted in a similar line per energy value but different energetic coupling during the LPBF may be expected, thus inducing a variation in the geometrical features of the melt (as discussed in past work by Scipioni et al.) [53]. The details of the experimental design are summarised in Table 6.
The depositions of the second experimental campaign were characterised in terms of the geometrical features of the melt pool observed from the coaxial perspective corresponding to width (wmp), length (lmp) and area (Amp), as reported in Figure 4a. As indicated previously, it was also possible to extract the oscillation indicator Isum,ROI for each time instant, which could be correlated to the penetration depth h of the molten pool. The penetration depth h and width wcs could be measured by means of metallographic cross-sections, as schematised in Figure 4b.

4. Results

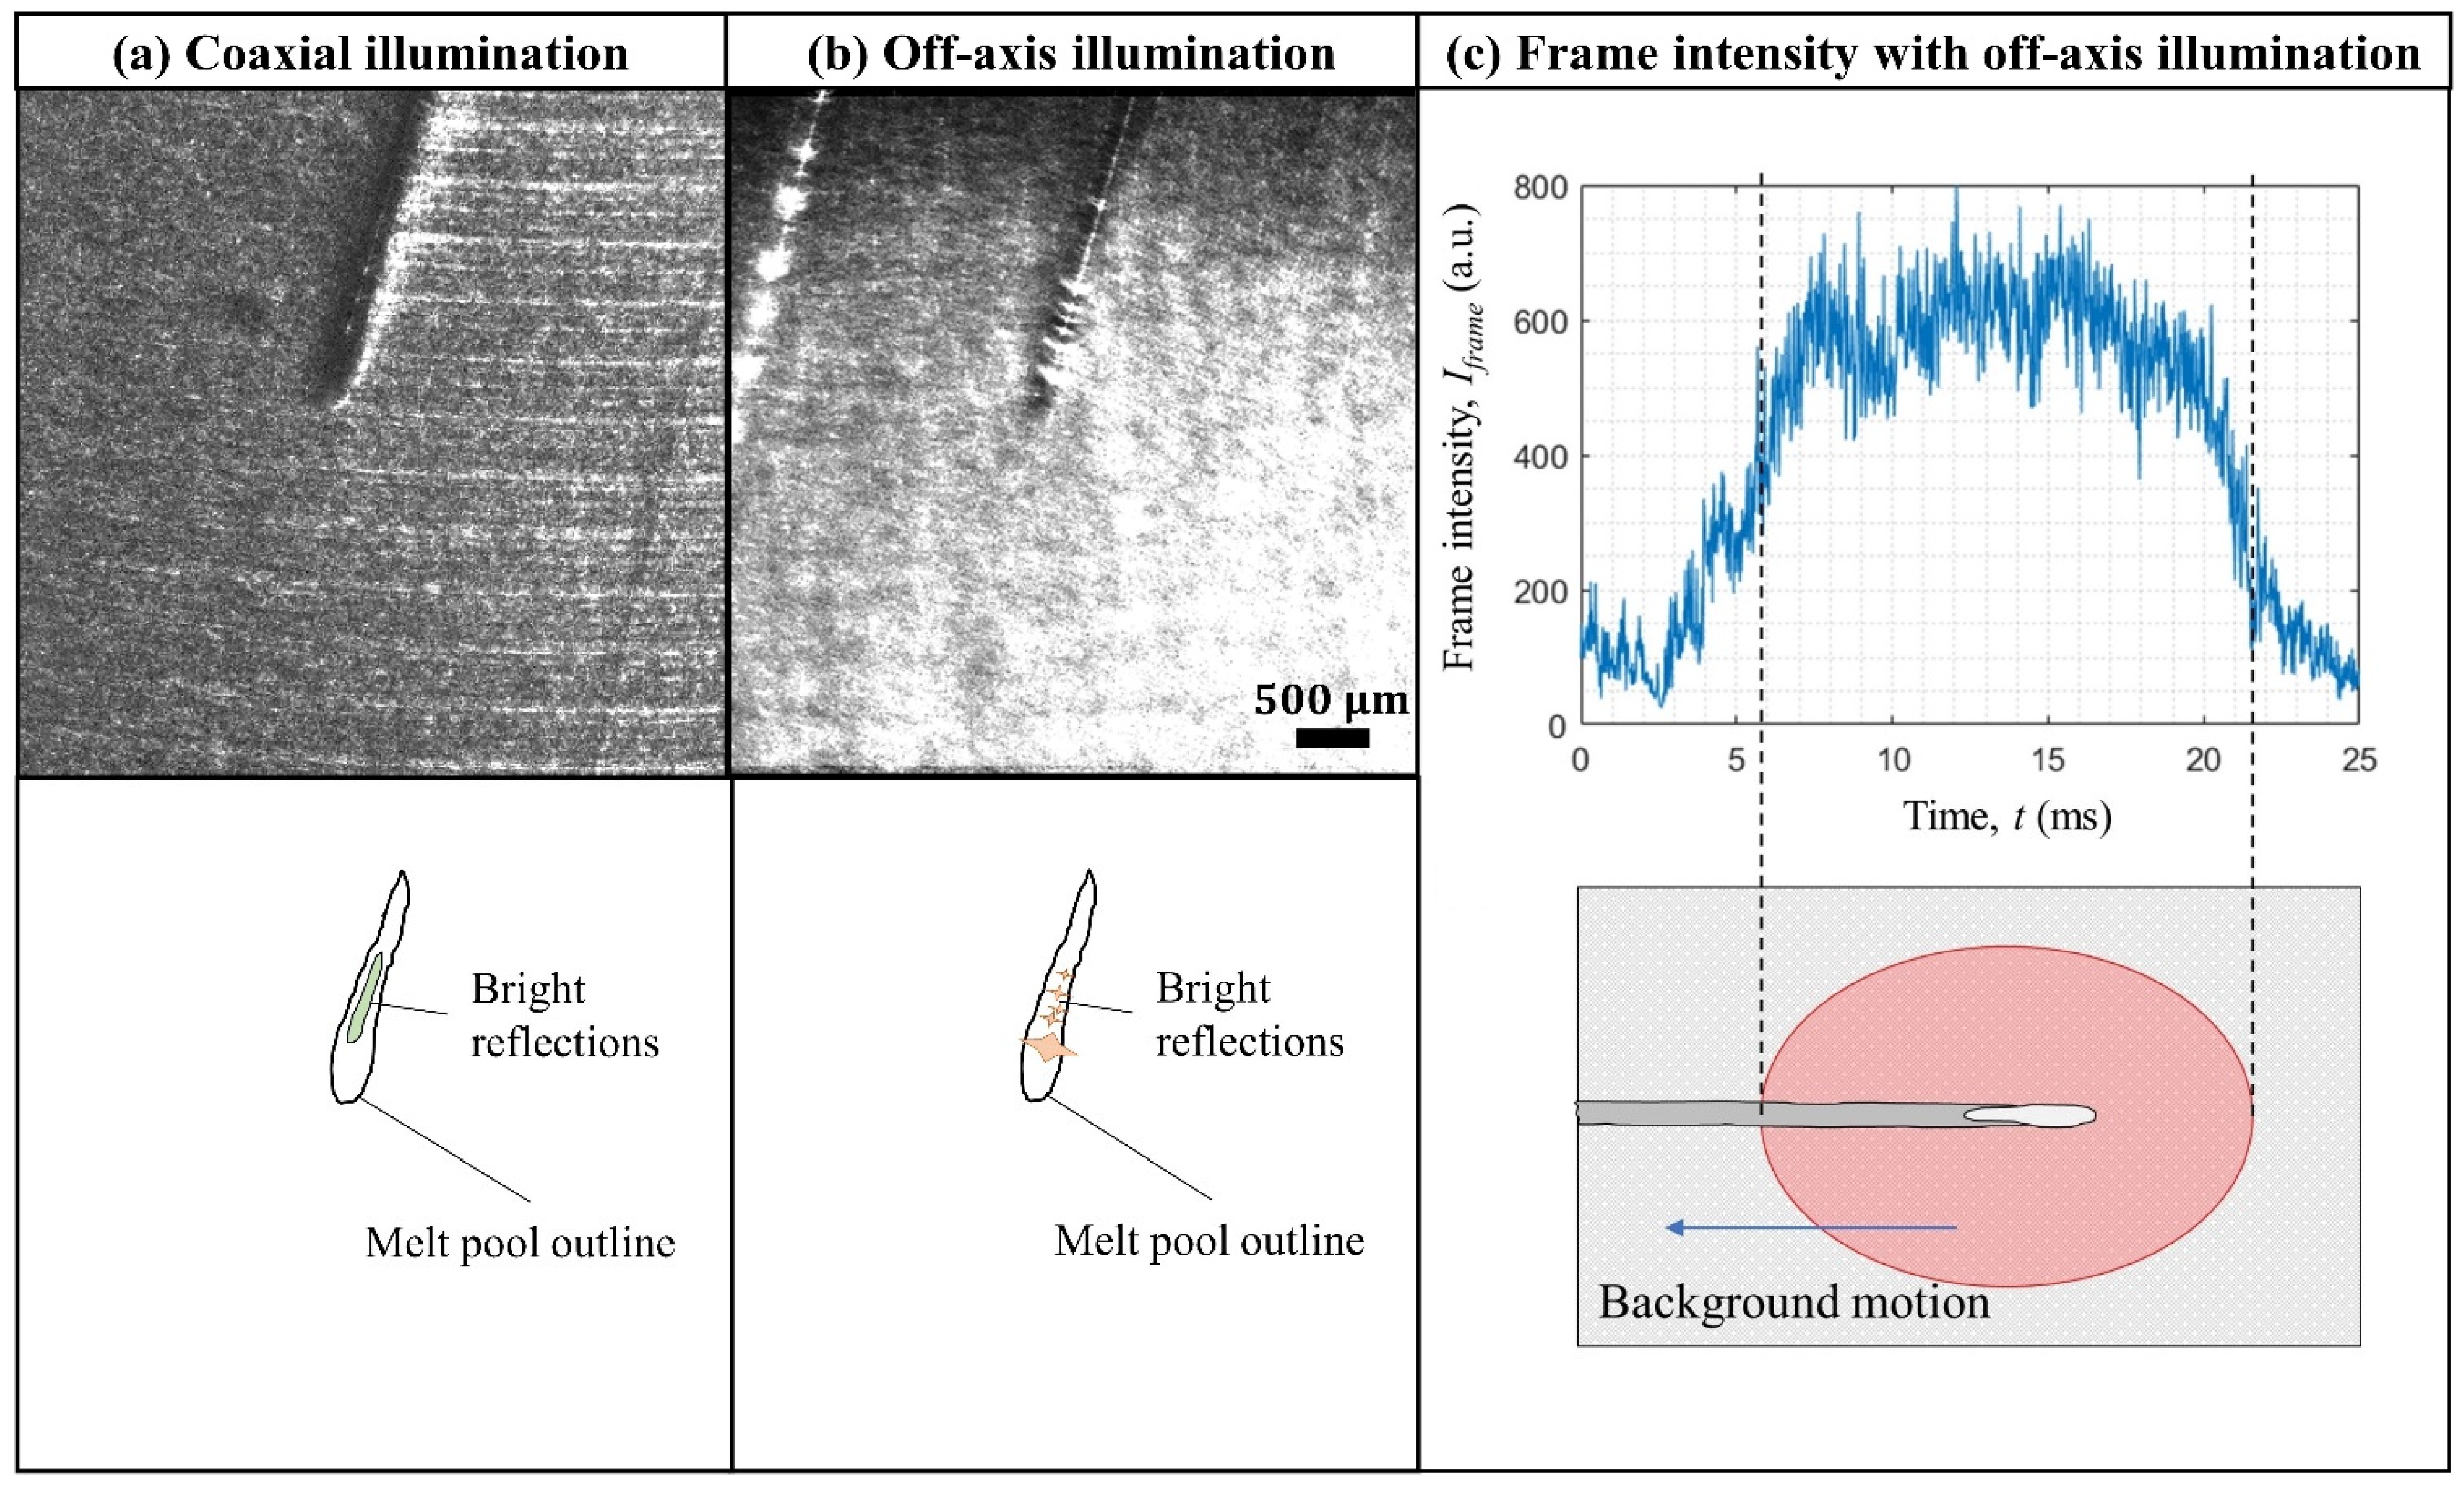
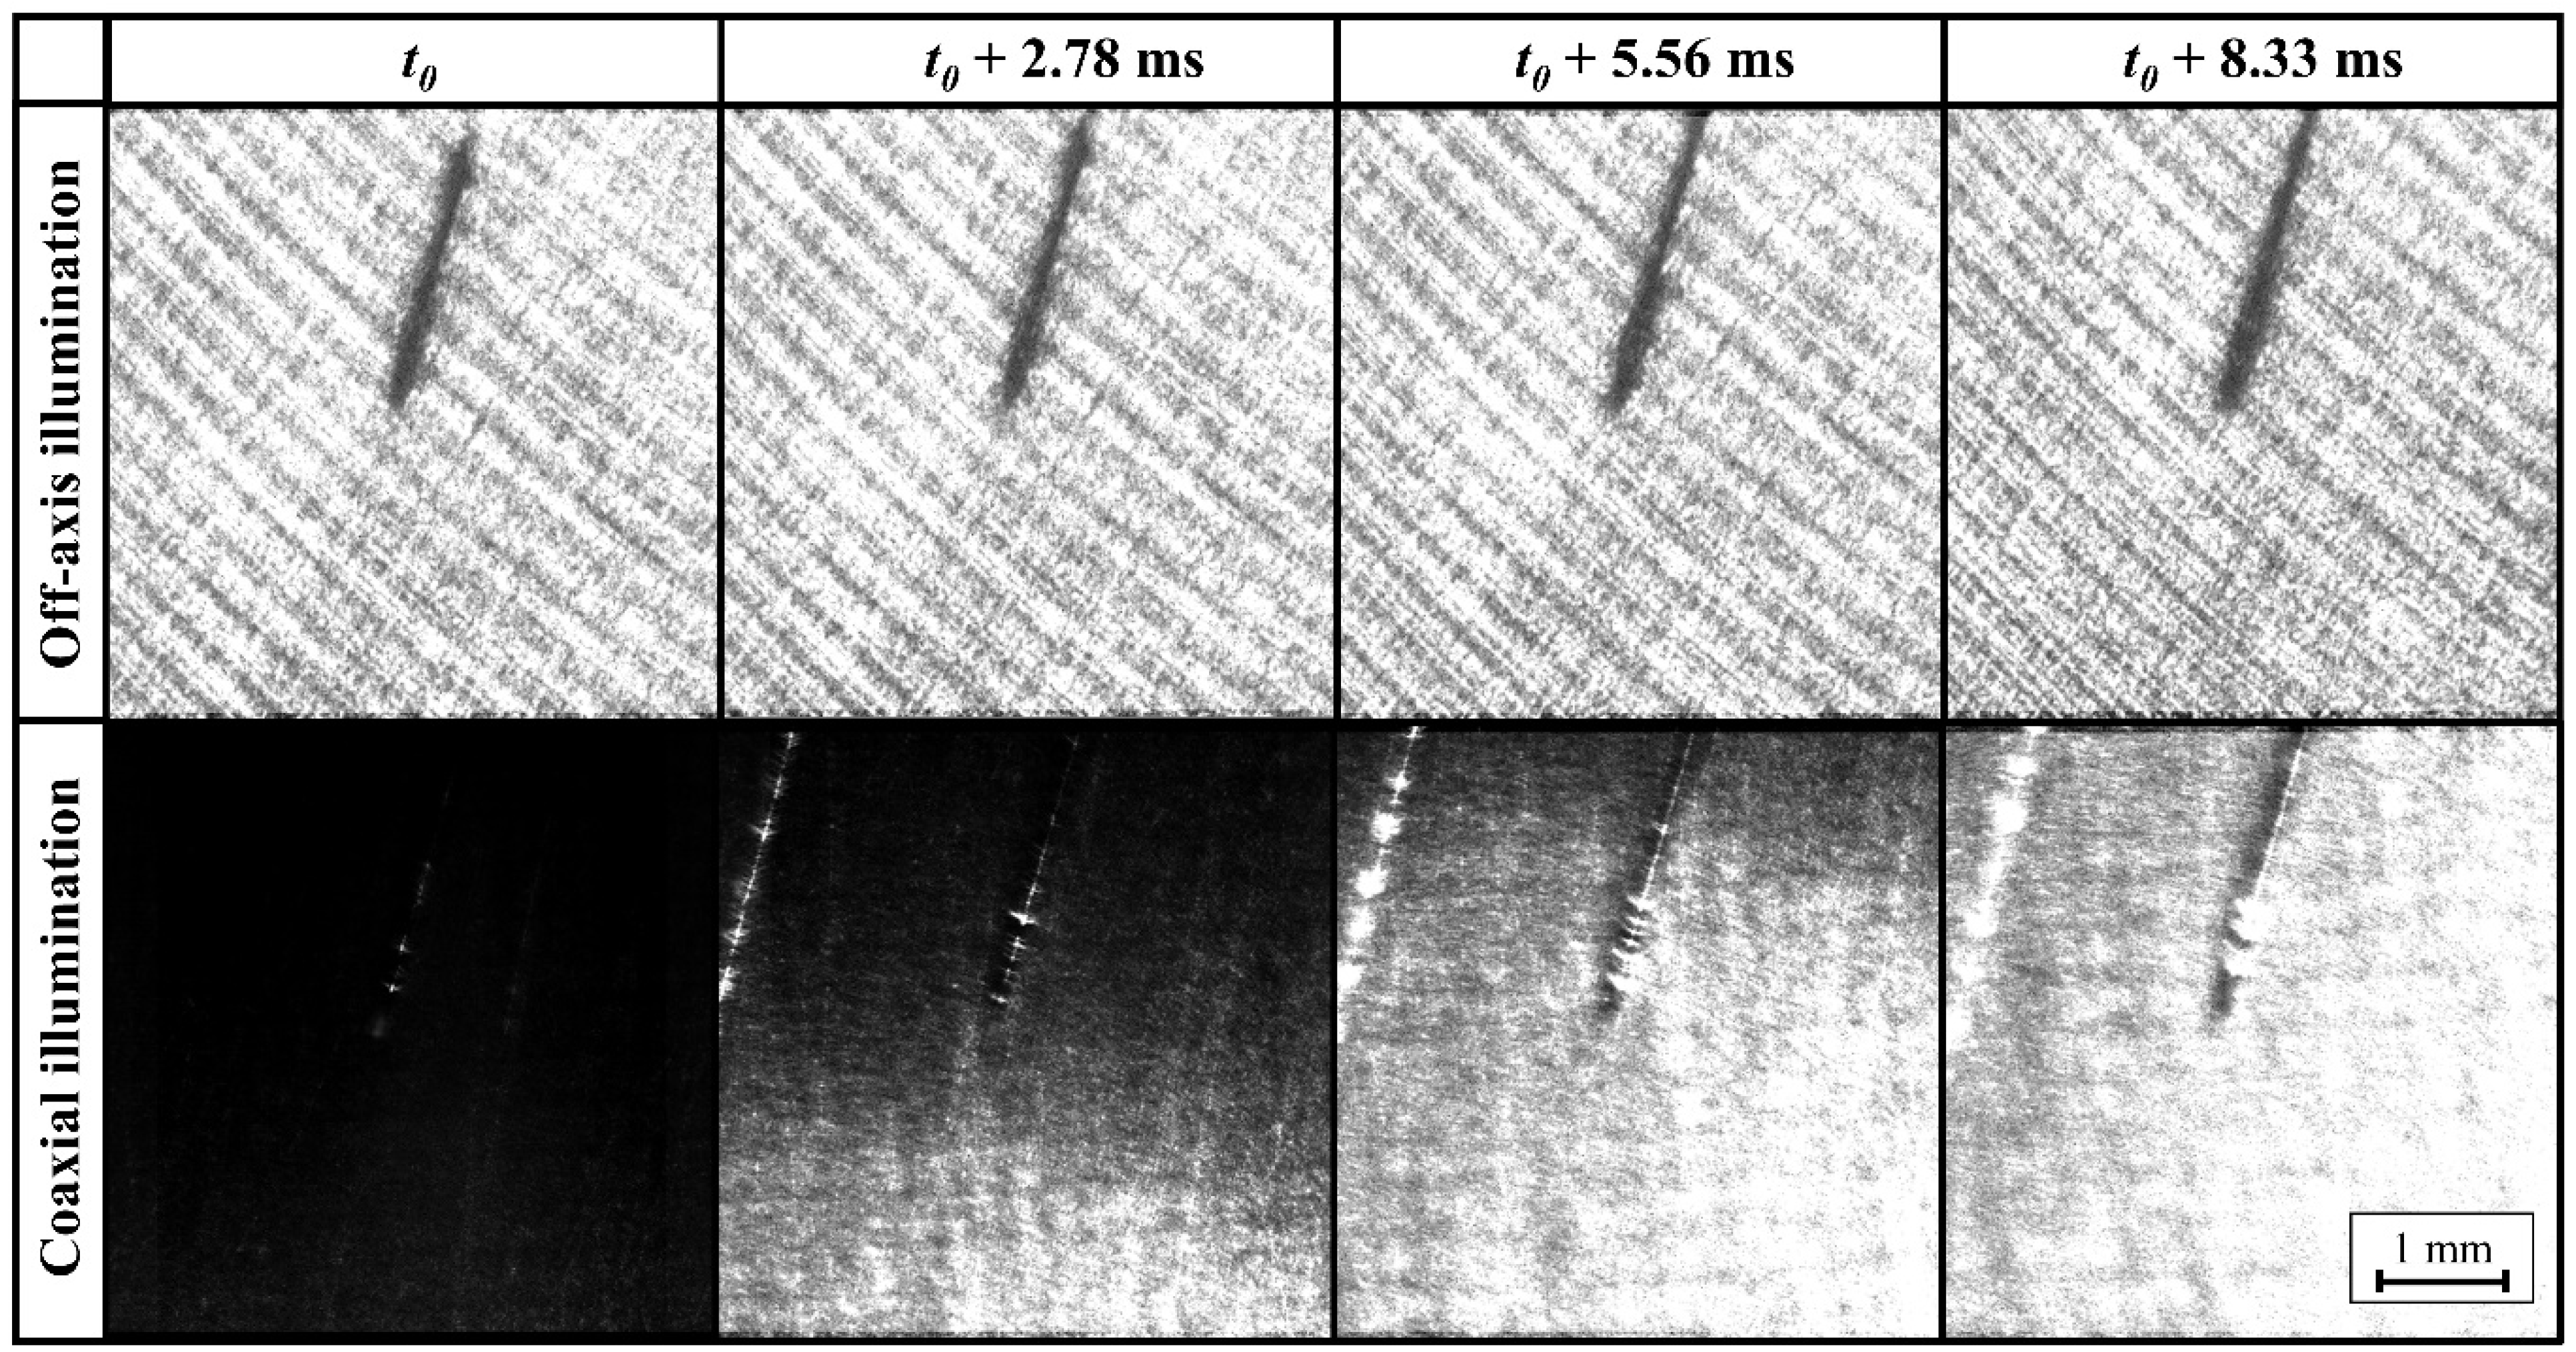
4.1. Effect of Different Illumination Configurations on the High-Speed Imaging Acquisitions

In order to assess the detectability of the surface reflections which are symptomatic of the melt pool’s oscillations, a qualitative evaluation of the process was conducted. Figure 5a shows a frame from an acquisition with the coaxial illumination while its schematic representation is shown below. Although details of the process are discernible (i.e., the melt pool contours), the imaging chain had difficulties in capturing the reflections of the illumination light which are considered to be symptomatic of the melt’s oscillations. The reflections were scarcely visible over the melt surface and indicate the need of a higher-intensity light to generate a greater contrast for more effective detection of the oscillatory motion.
Figure 5b shows the acquisition with the illumination light in an off-axis configuration. It thus appears clearly that the angle of incidence of the illumination light plays a significant role in determining the quality of the high-speed imaging acquisitions. On the other hand, the off-axis configuration of the secondary light source introduces limitations due to the fact that the beam is stationary in relation to the motion of the process.
Hence, the greatest drawback of the off-axis illumination configuration is the size of the light field. This eventually causes the issue of non-uniform illumination during high-speed imaging acquisition. Hence, the images acquired exhibit a varying level of frame intensity throughout the acquisition (the variation of frame intensity for the coaxial illumination is shown in Figure 5c). In the central area of the illuminated field, the images acquired reach the level required to promote correct identification of the molten pool’s geometrical features and the bright reflections which are a proxy of the melt surface’s oscillations. The dynamic effect of the variation in illumination condition is clearly visible at different time instants of the acquired high-speed videos in the two conditions (shown in Figure 6). Even considering the significant issues with the changing frame intensity, the bright reflections are clearly evidenced with off-axis illumination indicating that it may be employed to estimate according to the methodology developed by Caprio et al. [37,52].
According to the results obtained in this preliminary investigation, the off-axis illumination appears to be the most promising solution for validating coaxial detection of surface oscillations and thus measurement of the penetration depth. Nonetheless, for future industrial applicability, other solutions in terms of light source to be implemented coaxially may be explored.

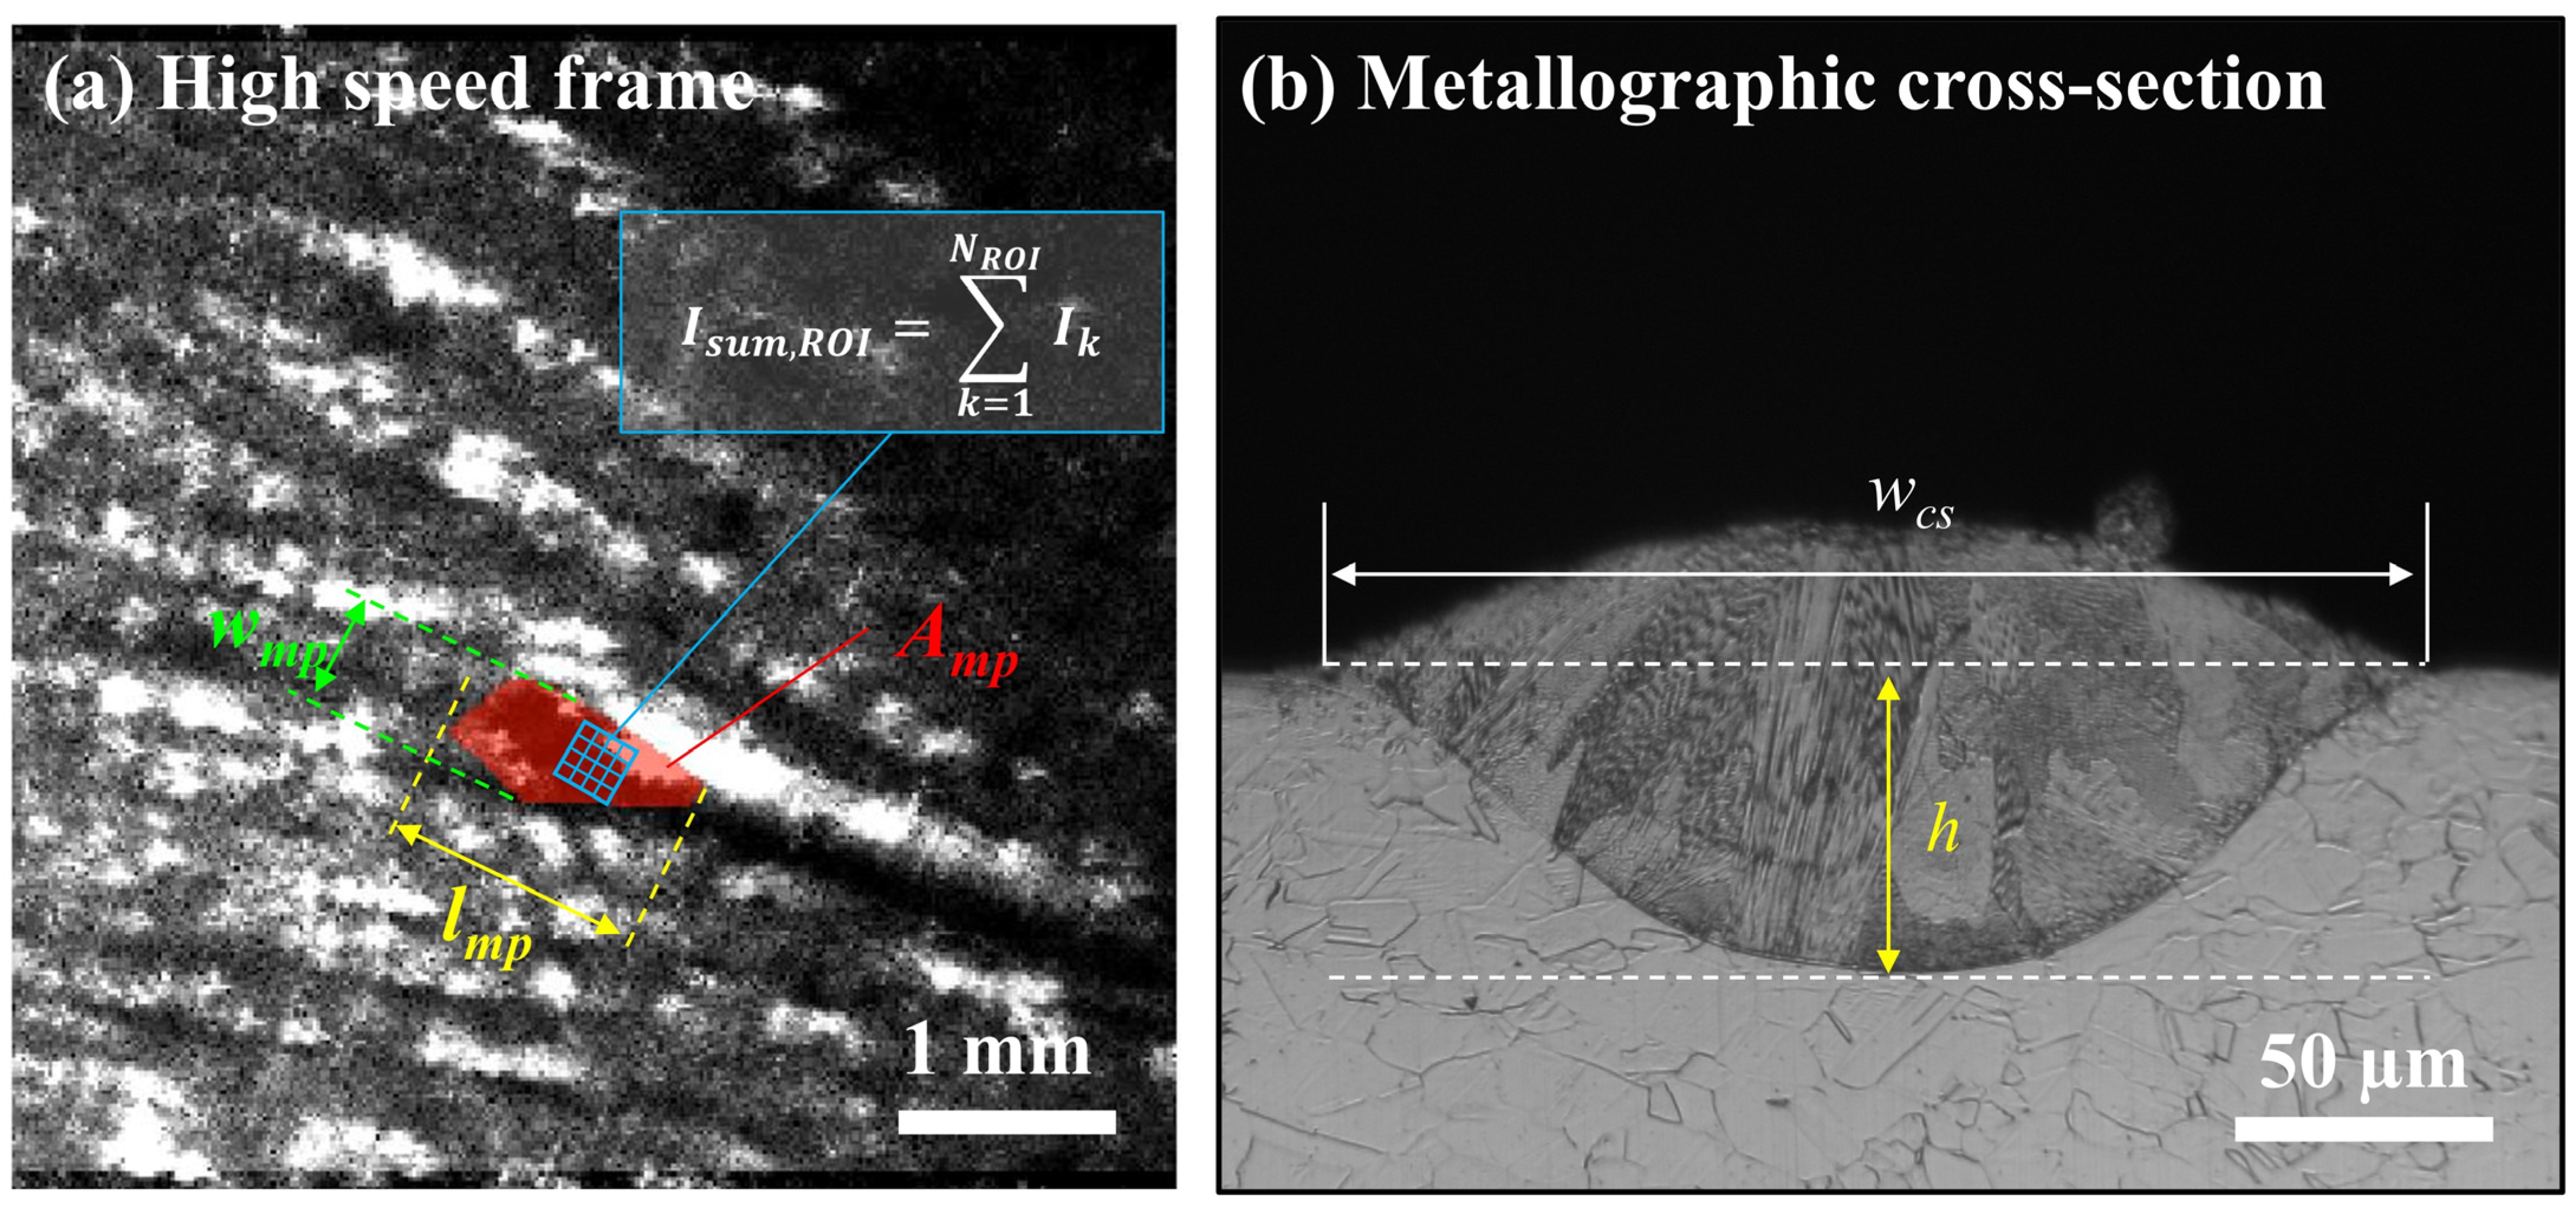
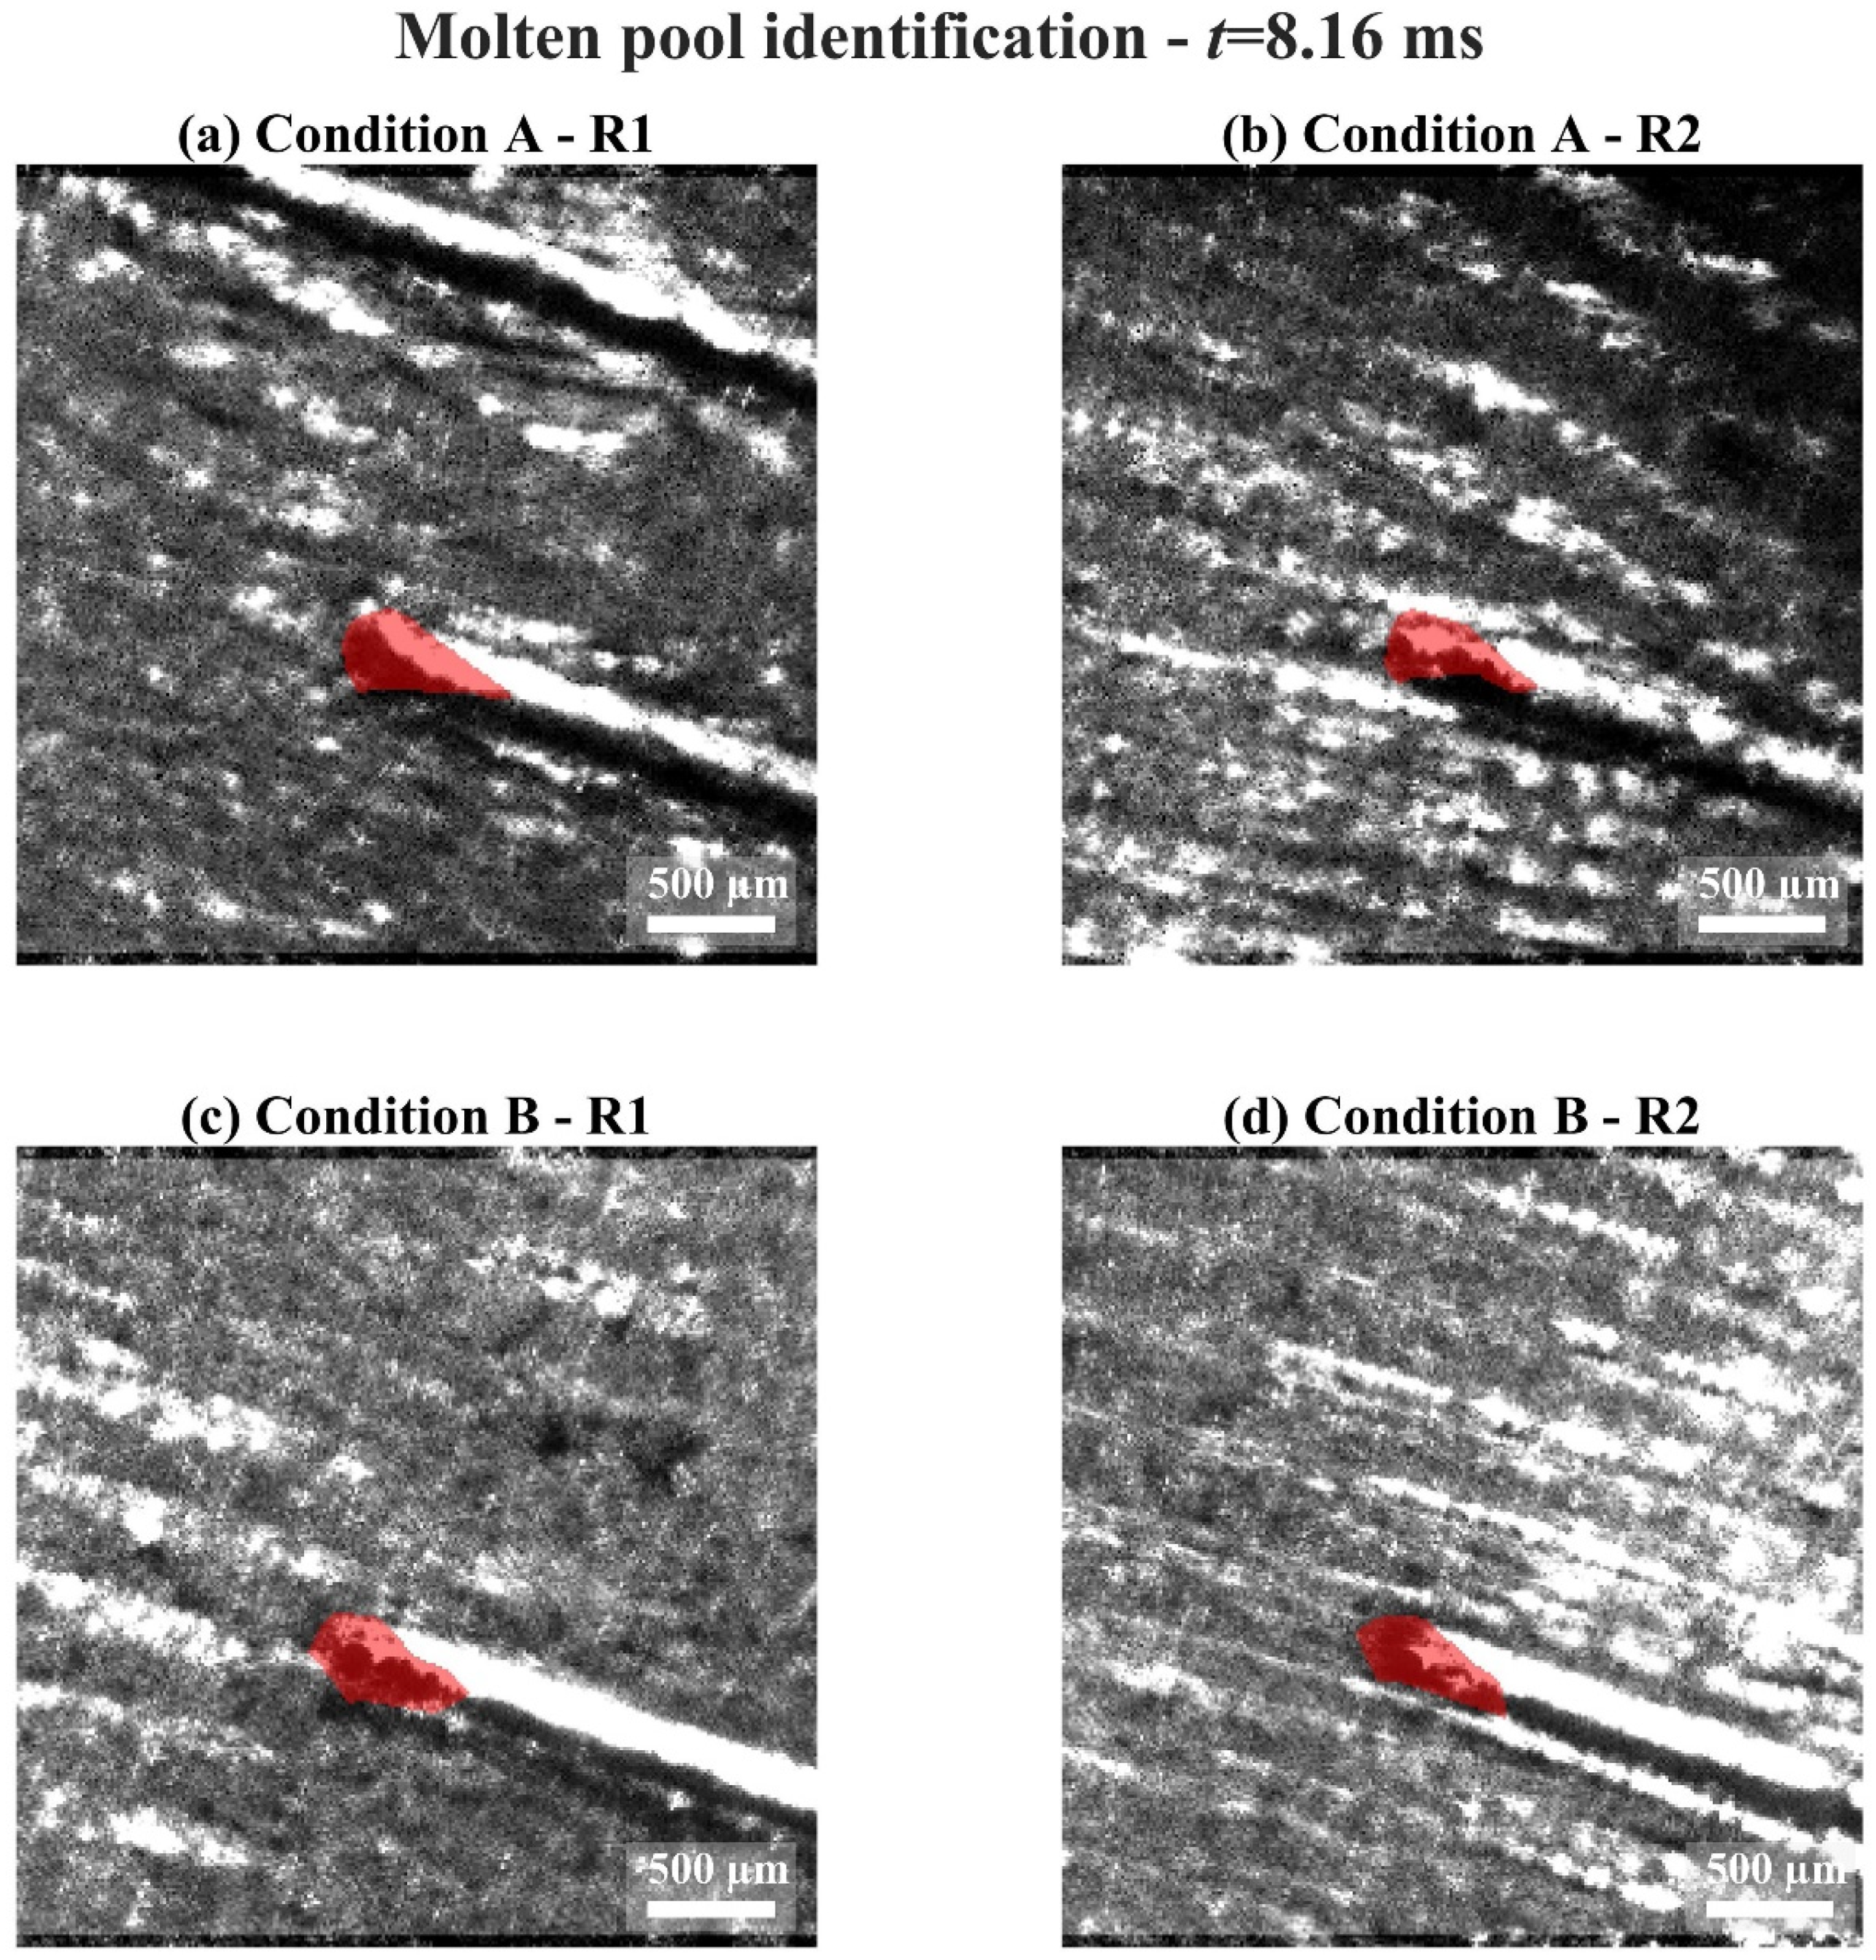
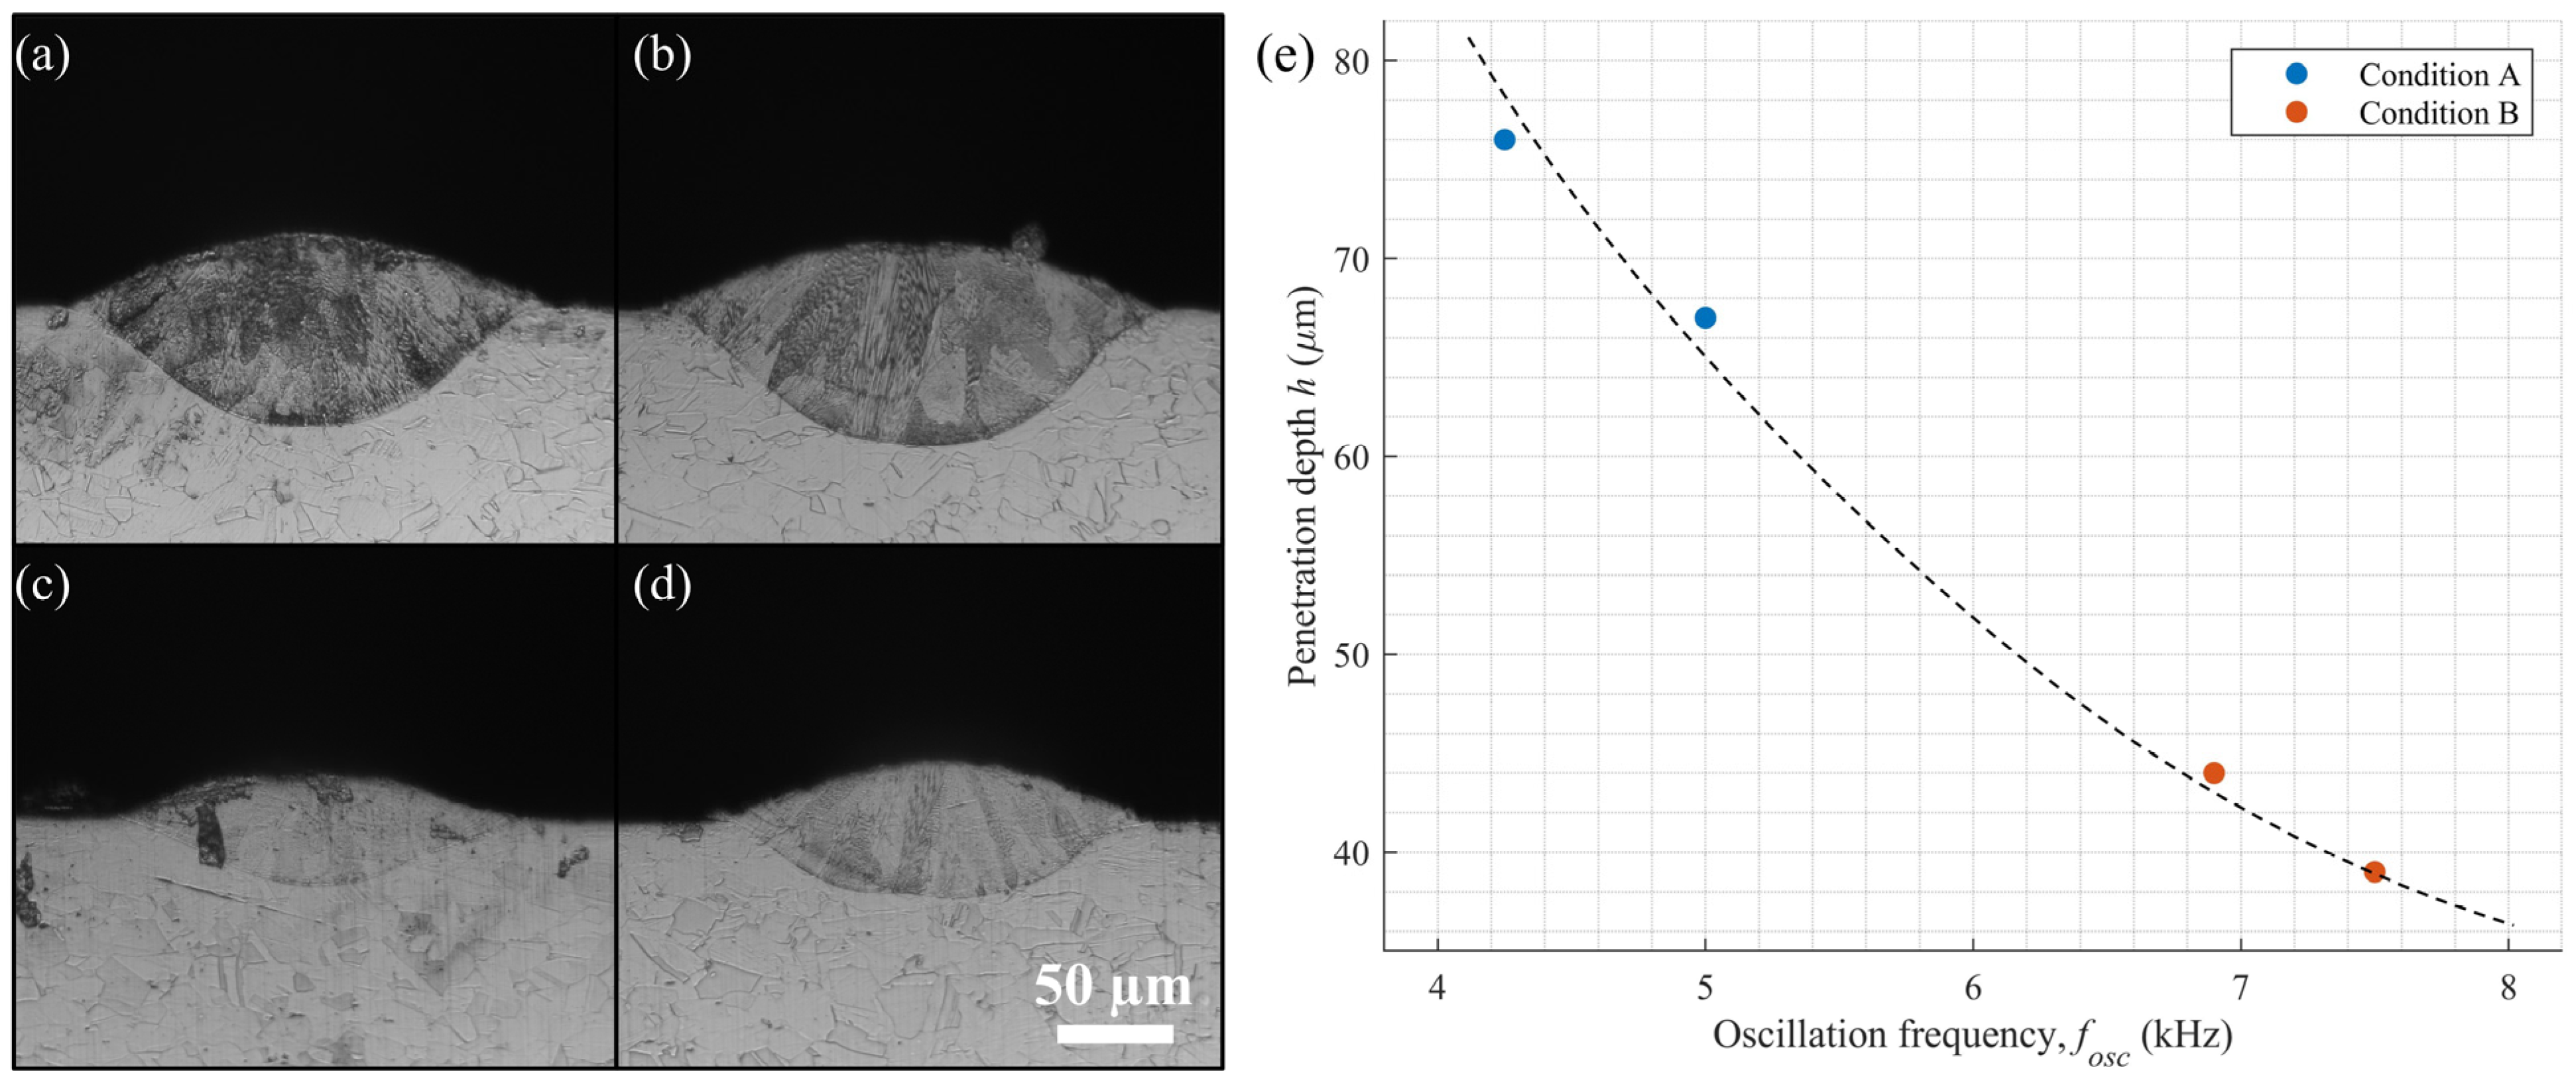
4.2. Measurement of Molten Pool Geometrical Features

Having assessed the most effective illumination condition for the scope of this work, the research proceeded with evaluating the molten pool identification algorithm developed to extract the geometrical parameters of the melt. High-speed imaging acquisitions during single-track deposition in the two different conditions are reported in representative frames in Figure 7 (in order to appreciate the dynamical effects the reader is referred to Supplementary Video S2). The molten pool identified by means of the algorithm presented previously is shown in red in Figure 7. The typical tear-drop shape of the melt can be identified instant by instant and the code is thus capable of extracting the geometrical features as well as the intensity of the bright reflections.
The temporal variation in the various geometrical parameters of the molten pool’s surface, extrapolated via the algorithm, is reported in Figure 8. Although low-frequency variations were present in the various signals it was possible to observe that stable melting conditions were obtained in both Condition A and B whereby the geometrical features oscillated around an average value. The dimensions of the molten pool’s features were in accordance with values previously reported in the scientific literature [33,54]. Moreover, the molten pool’s width measured via the metallographic cross-sections wcs shown in dashed lines in Figure 8b for Condition A and in Figure 8e for Condition B was in good agreement with the measurements performed via the molten pool identification algorithm.
Figure 9 shows a comparison between the value of the molten pool’s width measured via the metallographic cross-sections and the measurements obtained using the molten pool identification algorithm. It clearly appears that there is strong agreement between the average value estimated using the two approaches. On the other hand, the molten pool identification algorithm exhibits variability with a standard deviation of about 50 µm. This value appears to be significant if compared to the average values detected (between 250 and 300 µm). On the other hand, temporal variations of the molten pool’s width on an instant-by-instant basis can be expected as reported in previous work by Criales et al. [25]. Moreover, considering the spatial resolution of the monitoring system, the variability relies on a range of less than 5 pixels. Hence, this indicates that future investigation may improve the performance of the algorithm by increasing the spatial resolution of the imaging chain (although this might impinge on the overall temporal resolution achievable).
The power spectral density estimate of the experimental conditions is reported in Figure 10. These graphs are analogous to the results reported by Klein et al., showing that the oscillatory motion of the melt pool during laser-based material processing is once again confirmed [55]. From the PSD estimate it is possible to see that the method to determine the melt’s oscillation frequency is repeatable and that oscillation frequency peaks were determined around 7 kHz for Condition B and near 5 kHz for Condition A. The variation in the oscillatory behaviour of the melt between the two conditions tested may be correlated to changes in the subsurface geometry of the melt given that the molten pools’ width and length were similar. Andersen et al. indicated the correlation between the melt pool’s mass and its oscillatory motion [56]. The relationship correlating the melt geometry to the motion of the liquid pool has been investigated extensively in the literature to establish the causal relationship between the different dynamic components [57,58]. Although the experimental campaign designed in this work does not allow us to determine such trends, the variations in terms of oscillatory motion appear to be symptomatic of changes in the subsurface geometry.
The analysis of the metallographic cross-section of the single-track depositions makes it possible to retrieve information regarding the penetration depth of the melt. The values are reported in Figure 11 as a function of the oscillation frequency. For both replicates, the bead shape corresponds to the form typically obtained in conduction mode processing, hence indicating that the tests were conducted in stable conditions. The relationship between the melt oscillation frequency and the penetration depth is reported in Figure 10e. The trend line shows that for increasing values of levels of oscillation frequency, a lower penetration depth is achieved in accordance with previous observations by the authors conducted using off-axis monitoring of single-track LPBF depositions of AISI316L [37]. This trend may be expected considering that a smaller mass of material is molten in agreement with the predictions by Andersen et al. for the gas tungsten arc welding process [56].
Most interestingly, the results of this investigation show that coaxial sensing can be employed to detect the surface oscillations and correlate them to the penetration depth. In a configuration like this, the sensing device certainly has greater appeal for integration into industrial systems. However, the sensing device still relies on high-cost equipment and the need for off-axis illumination with intensity is still a strong limitation. Given the relationship between the surface fluctuations and subsurface melt geometry, an alternative approach to measuring surface oscillations could be monitoring the emission process or the specific wavelength of the illumination light by means of photodetectors. This information may then be analysed in the frequency domain to estimate the penetration depth. Further studies on these aspects are required but are beyond the scope of this work. This investigation shows the possibility of detecting surface oscillations in a coaxial configuration alongside with determination of the geometrical features of the melt pool’s surface. Future studies will look at exploiting the hardware architecture and methodological framework developed, and validating the relationship on multitrack and multilayer components.

5. Conclusions

In this research, a high-speed imaging system was integrated in a coaxial configuration in a laser powder bed fusion system to provide simultaneous estimations of the molten pool’s geometrical features during deposition. The process was observed employing a secondary illumination light positioned both in coaxial and off-axis configurations. Although the coaxial illumination provided a constant illumination condition independently of the location, bright reflections symptomatic of the melt surface’s oscillations were more effectively detected by means of the off-axis illumination configuration. The system could thus provide a direct measurement of the molten pool’s surface geometrical features and an indirect measurement of the penetration depth via its correlation to the oscillatory behaviour.
In a second phase, the monitoring system was tested in different conditions and the image processing algorithm developed allowed us to extract temporal information regarding the molten pool’s surface geometry. Surface reflections of the illumination light, symptomatic of the melt oscillations, were measured and analysed in the frequency domain to provide measurements of the oscillation frequency of the molten pool (which ranged in the kHz order). The oscillatory motion was confirmed to be a valid predictor of the molten pool’s penetration depth, demonstrating the possibility of monitoring the melt geometry in three dimensions by means of a single sensor at a proof-of-concept stage.
Future works will aim at improving the precision of the monitoring system presented in this work and extending the experimental campaign to a greater number of conditions. Moreover, industrialisation of the monitoring system aimed at employing lower-cost monitoring hardware is envisaged. Finally, the results reported in this still require a fundamental understanding of the underlying process physics. Especially, the physical phenomenon which generates the correlation between the molten pool’s surface oscillatory motion to the penetration depth requires further attention.

Supplementary Materials

The following supporting information can be downloaded at: https://www.mdpi.com/article/10.3390/met12101762/s1, Video S1: Supplementary Video n.1; Video S2: Supplementary Video n.2.

Author Contributions

Conceptualization, L.C. and A.G.D.; Data curation, L.C.; Formal analysis, L.C.; Funding acquisition, B.P.; Investigation, L.C.; Methodology, L.C.; Project administration, A.G.D. and B.P.; Resources, B.P.; Software, L.C.; Supervision, B.P.; Visualization, A.G.D.; Writing—original draft, L.C.; Writing—review & editing, L.C., A.G.D. and B.P. All authors have read and agreed to the published version of the manuscript.

Funding

The Italian Ministry of Education, University and Research is acknowledged for the support provided through the Project Department of Excellence LIS4.0—Lightweight and Smart Structures for Industry 4.0.

Institutional Review Board Statement

Not applicable.

Informed Consent Statement

Not applicable.

Data Availability Statement

Data is available upon reasonable request.

Acknowledgments

The technical assistance and collaboration of Raylase is gratefully acknowledged. The authors are also grateful to IPG Photonics for their longstanding collaboration. The authors would like to thank BLM Group for providing the high-speed imaging camera and illumination light. DMC is acknowledged for providing support in integrating the laser-based processing software. The project presented in this paper was funded with a contribution by the Autonomous Province of Trento, Italy, in terms of Regional Law 6/98 (Project LT 4.0). Tommaso Corti is thanked for his support in conducting the experiments.

Conflicts of Interest

The authors declare no conflict of interest.

References

  1. Ghidini, T. Materials for space exploration and settlement. Nat. Mater. 2018, 17, 846–850. [Google Scholar] [CrossRef] [PubMed]
  2. Caltanissetta, F.; Grasso, M.; Petrò, S.; Colosimo, B.M. Characterization of in-situ measurements based on layerwise imaging in laser powder bed fusion. Addit. Manuf. 2018, 24, 183–199. [Google Scholar] [CrossRef]
  3. Clijsters, S.; Craeghs, T.; Buls, S.; Kempen, K.; Kruth, J.-P. In situ quality control of the selective laser melting process using a high-speed, real-time melt pool monitoring system. Int. J. Adv. Manuf. Technol. 2014, 75, 1089–1101. [Google Scholar] [CrossRef]
  4. Wu, Z.; Narra, S.P.; Rollett, A. Exploring the fabrication limits of thin-wall structures in a laser powder bed fusion process. J. Adv. Manuf. Technol. 2020, 110, 191–207. [Google Scholar] [CrossRef]
  5. Bruna-Rosso, C.; Caprio, L.; Mazzoleni, L.; Pacher, M.; Demir, A.G.; Previtali, B. Influence of Temporal Laser Emission Profile on the Selective Laser Melting (SLM) of Thin Structures. Lasers Eng. 2020, 47, 161–182. [Google Scholar]
  6. Zadpoor, A.A. Additively manufactured porous metallic biomaterials. J. Mater. Chem. B 2019, 7, 4088–4117. [Google Scholar] [CrossRef] [Green Version]
  7. Guaglione, F.; Caprio, L.; Previtali, B.; Demir, A.G. Demir, Single point exposure LPBF for the production of biodegradable Zn-alloy lattice structures. Addit. Manuf. 2021, 48, 102426. [Google Scholar] [CrossRef]
  8. Maffia, S.; Finazzi, V.; Berti, F.; Migliavacca, F.; Petrini, L.; Previtali, B.; Demir, A.G. Selective laser melting of NiTi stents with open-cell and variable diameter. Smart Mater. Struct. 2021, 30, 105010. [Google Scholar] [CrossRef]
  9. Finazzi, V.; Demir, A.G.; Biffi, C.A.; Migliavacca, F.; Petrini, L.; Previtali, B. Design and functional testing of a novel balloon-expandable cardiovascular stent in CoCr alloy produced by selective laser melting. Manuf. Process. 2020, 55, 161–173. [Google Scholar] [CrossRef]
  10. Jafari, D.; Wits, W.W. The utilization of selective laser melting technology on heat transfer devices for thermal energy conversion applications: A. review. Renew. Sustain. Energy Rev. 2018, 91, 420–442. [Google Scholar] [CrossRef]
  11. Catchpole-Smith, S.; Sélo, R.R.J.; Davis, A.W.; Ashcroft, I.A.; Tuck, C.J.; Clare, A. Thermal conductivity of TPMS lattice structures manufactured via laser powder bed fusion. Addit. Manuf. 2019, 30, 100846. [Google Scholar] [CrossRef]
  12. McCann, R.; Obeidi, M.A.; Hughes, C.; McCarthy, É.; Egan, D.S.; Vijayaraghavan, R.K.; Joshi, A.M.; Garzon, V.A.; Dowling, D.P.; McNally, P.J.; et al. In-situ sensing, process monitoring and machine control in Laser Powder Bed Fusion: A review. Addit. Manuf. 2021, 45, 102058. [Google Scholar] [CrossRef]
  13. Grasso, M.L.G.; Remani, A.; Dickins, A.; Colosimo, B.M.; Leach, R.K. In-situ measurement and monitoring methods for metal powder bed fusion: An updated review. Meas. Sci. Technol. 2021, 32, 112001. [Google Scholar] [CrossRef]
  14. Forien, J.-B.; Calta, N.P.; DePond, P.J.; Guss, G.M.; Roehling, T.T.; Matthews, M.J. Detecting keyhole pore defects and monitoring process signatures during laser powder bed fusion: A correlation between in situ pyrometry and ex situ X-ray radiography. Addit. Manuf. 2020, 35, 101336. [Google Scholar] [CrossRef]
  15. Gutknecht, K.; Cloots, M.; Sommerhuber, R.; Wegener, K. Mutual comparison of acoustic, pyrometric and thermographic laser powder bed fusion monitoring. Mater. Des. 2021, 210, 110036. [Google Scholar] [CrossRef]
  16. Domankevitz, Y.; Nishioka, N.S. Measurement of Laser Ablation Threshold with a High-Speed Framing Camera. IEEE J. Quantum Electron. 1990, 26, 2276–2278. [Google Scholar] [CrossRef]
  17. Dietrich, J.; Brajdic, M.; Walther, K.; Horn, A.; Kelbassa, I.; Poprawe, R. Investigation of increased drilling speed by online high-speed photography. Opt. Lasers Eng. 2008, 46, 705–710. [Google Scholar] [CrossRef]
  18. Leung, B.Y.C.; Webster, P.J.L.; Fraser, J.M.; Yang, V.X.D. Real-time guidance of thermal and ultrashort pulsed laser ablation in hard tissue using inline coherent imaging. Lasers Surg. Med. 2012, 44, 249–256. [Google Scholar] [CrossRef]
  19. Hosoya, N.; Umino, R.; Kajiwara, I.; Maeda, S.; Onuma, T.; Mihara, A. Damage Detection in Transparent Materials Using Non-Contact Laser Excitation by Nano-Second Laser Ablation and High-Speed Polarization-imaging Camera. Exp. Mech. 2016, 56, 339–343. [Google Scholar] [CrossRef]
  20. Craeghs, T.; Bechmann, F.; Berumen, S.; Kruth, J.-P. Feedback control of Layerwise Laser Melting using optical sensors. Phys. Proc. 2010, 5, 505–514. [Google Scholar] [CrossRef] [Green Version]
  21. Craeghs, T.; Clijsters, S.; Yasa, E.; Bechmann, F.; Berumen, S.; Kruth, J.-P. Determination of geometrical factors in Layerwise Laser Melting using optical process monitoring. Opt. Lasers Eng. 2011, 49, 1440–1446. [Google Scholar] [CrossRef]
  22. Mazzoleni, L.; Demir, A.G.; Caprio, L.; Pacher, M.; Previtali, B. Real-Time Observation of Melt Pool in Selective Laser Melting: Spatial, Temporal and Wavelength Resolution Criteria. IEEE Trans. Instrum. Meas. 2019, 69, 1179–1190. [Google Scholar] [CrossRef]
  23. Thombansen, U.; Abels, P. Observation of melting conditions in selective laser melting of metals (SLM). High-Power Laser Mater. Process. Lasers. Beam Deliv. Diagn. 2016, 9741, 209–215. [Google Scholar] [CrossRef]
  24. Demir, A.G.; Mazzoleni, L.; Caprio, L.; Pacher, M.; Previtali, B. Complementary use of pulsed and continuous wave emission modes to stabilize melt pool geometry in laser powder bed fusion. Opt. Laser Technol. 2018, 113, 15–26. [Google Scholar] [CrossRef]
  25. Criales, L.E.; Arısoy, Y.M.; Lane, B.; Moylan, S.; Donmez, A.; Özel, T. Laser powder bed fusion of nickel alloy 625: Experimental investigations of effects of process parameters on melt pool size and shape with spatter analysis. Int. J. Mach. Tools Manuf. 2017, 121, 22–36. [Google Scholar] [CrossRef]
  26. Hooper, P.A. Melt pool temperature and cooling rates in laser powder bed fusion. Addit. Manuf. 2018, 22, 548–559. [Google Scholar] [CrossRef]
  27. Krishna, C.; Vallabh, P.; Sridar, S.; Xiong, W.; Zhao, X. Predicting melt pool depth and grain length using multiple signatures from in-situ single camera two-wavelength imaging pyrometry for laser powder bed fusion. J. Mater. Process. Tech. 2022, 308, 117724. [Google Scholar]
  28. Ma, H.; Mao, Z.; Feng, W.; Yang, Y.; Hao, C.; Zhou, J.; Liu, S.; Xie, H.; Guo, G.; Liu, Z. Online in-situ monitoring of melt pool characteristic based on a single high-speed camera in laser powder bed fusion process. Appl. Therm. Eng. 2022, 211, 118515. [Google Scholar] [CrossRef]
  29. Vasileska, E.; Demir, A.G.; Colosimo, B.M.; Previtali, B. Layer-Wise Control of Selective Laser Melting By Means of Inline Melt Pool Area Measurements. J. Laser Appl. 2020, 32, 022057. [Google Scholar] [CrossRef]
  30. Vasileska, E.; Demir, A.G.; Colosimo, B.M.; Previtali, B. Previtali, A novel paradigm for feedback control in LPBF: Layer-wise correction for overhang structures. Adv. Manuf. 2022, 10, 326–344. [Google Scholar] [CrossRef]
  31. Yang, L.; Lo, L.; Ding, S.; Özel, T. Monitoring and detection of meltpool and spatter regions in laser powder bed fusion of super alloy Inconel 625. Prog. Addit. Manuf. 2020, 5, 367–378. [Google Scholar] [CrossRef]
  32. Eriksson, I.; Powell, J.; Kaplan, A.F.H. Ultra high speed camera investigations of laser beam welding. In Proceedings of the 29th International Congress on Applications of Lasers and Electro-Optics, ICALEO 2010, Anaheim, CA, USA, 26–30 September 2010; pp. 172–178. [Google Scholar] [CrossRef]
  33. Bertoli, U.S.; Guss, G.; Wu, S.; Matthews, M.J.; Schoenung, J.M. In-situ characterization of laser-powder interaction and cooling rates through high-speed imaging of powder bed fusion additive manufacturing. Mater. Des. 2017, 135, 385–396. [Google Scholar] [CrossRef]
  34. Gunenthiram, V.; Peyre, P.; Schneider, M.; Dal, M.; Coste, F.; Koutiri, I.; Fabbro, R. Experimental analysis of spatter generation and melt-pool behavior during the powder bed laser beam melting process. J. Mater. Process. Technol. 2018, 251, 376–386. [Google Scholar] [CrossRef]
  35. Bidare, P.; Maier, R.R.J.; Beck, R.; Shephard, J.; Moore, A. An open-architecture metal powder bed fusion system for in-situ process measurements. Addit. Manuf. 2017, 16, 177–185. [Google Scholar] [CrossRef]
  36. Bidare, P.; Bitharas, I.; Ward, R.; Attallah, M.; Moore, A. Laser powder bed fusion at sub-atmospheric pressures. Int. J. Mach. Tools Manuf. 2018, 130–131, 65–72. [Google Scholar] [CrossRef]
  37. Caprio, L.; Demir, A.G.; Previtali, B. Observing molten pool surface oscillations during keyhole processing in laser powder bed fusion as a novel method to estimate the penetration depth. Addit. Manuf. 2020, 36, 101470. [Google Scholar] [CrossRef]
  38. Parab, N.D.; Zhao, C.; Cunningham, R.; Escano, L.I.; Fezzaa, K.; Everhart, W.; Rollett, A.D.; Chen, L.; Sun, T. Ultrafast X-ray imaging of laser–metal additive manufacturing processes. J. Synchrotron Radiat. 2018, 25, 1467–1477. [Google Scholar] [CrossRef] [Green Version]
  39. Bruna-Rosso, C.; Demir, A.G.; Previtali, B. Selective laser melting finite element modeling: Validation with high-speed imaging and lack of fusion defects prediction. Mater. Des. 2018, 156, 143–153. [Google Scholar] [CrossRef] [Green Version]
  40. Malekipour, E.; El-Mounayri, H. Common defects and contributing parameters in powder bed fusion AM process and their classification for online monitoring and control: A review. Int. J. Adv. Manuf. Technol. 2017, 95, 527–550. [Google Scholar] [CrossRef]
  41. Cunningham, R.; Narra, S.P.; Montgomery, C.; Beuth, J.; Rollett, A.D. Synchrotron-Based X-ray Microtomography Characterization of the Effect of Processing Variables on Porosity Formation in Laser Power-Bed Additive Manufacturing of Ti-6Al-4V. JOM 2017, 69, 479–484. [Google Scholar] [CrossRef]
  42. Yu, G.; Gu, D.; Dai, D.; Xia, M.; Ma, C.; Chang, K. Influence of processing parameters on laser penetration depth and melting/re-melting densification during selective laser melting of aluminum alloy. Appl. Phys. A 2016, 122, 891. [Google Scholar] [CrossRef]
  43. Boley, M.; Abt, F.; Weber, R.; Graf, T. X-ray and optical videography for 3D measurement of capillary and melt pool geometry in laser welding. Phys. Procedia 2013, 41, 488–495. [Google Scholar] [CrossRef] [Green Version]
  44. Goossens, L.R.; Hooreweder, B.V. A virtual sensing approach for monitoring melt-pool dimensions using high speed coaxial imaging during laser powder bed fusion of metals. Addit. Manuf. 2021, 40, 101923. [Google Scholar] [CrossRef]
  45. Mazzoleni, L.; Caprio, L.; Pacher, M.; Demir, A.G.; Previtali, B. External Illumination Strategies for Melt Pool Geometry Monitoring in SLM. JOM 2018, 71, 928–937. [Google Scholar] [CrossRef]
  46. Semak, V.; Hopkins, J.A.; McCay, M.H. A technique for melt pool oscillation monitoring during laser spot welding. In Proceedings of the International Congress on Applications of Lasers and Electro-Optics, San Diego, CA, USA, 17–20 November 1997; pp. C11–C20. [Google Scholar] [CrossRef]
  47. Richter, B.; Blanke, N.; Werner, C.; Parab, N.; Sun, T.; Vollertsen, F.; Pfefferkorn, F.E. High-speed X-ray investigation of melt dynamics during continuous-wave laser remelting of selective laser melted Co-Cr alloy. CIRP Ann. 2019, 68, 229–232. [Google Scholar] [CrossRef]
  48. Huang, Y.; Shen, C.; Ji, X.; Li, F.; Zhang, Y.; Hua, X. Correlation Between Gas-Dynamic Behaviour of a Vapour Plume and Oscillation of Keyhole Size During Laser Welding of 5083 Al-Alloy; Elsevier: Amsterdam, The Netherlands, 2020. [Google Scholar] [CrossRef]
  49. Carter, G.; Nuttall, A.H. A brief summary of a generalized framework for power spectral estimation. Signal Process. 1980, 2, 387–390. [Google Scholar] [CrossRef]
  50. Caprio, L.; Demir, A.G.; Previtali, B.; Colosimo, B.M. Determining the feasible conditions for processing lunar regolith simulant via laser powder bed fusion. Addit. Manuf. 2019, 32, 101029. [Google Scholar] [CrossRef]
  51. Demir, A.G.; Monguzzi, L.; Previtali, B. Selective laser melting of pure Zn with high density for biodegradable implant manufacturing. Addit. Manuf. 2017, 15, 20–28. [Google Scholar] [CrossRef]
  52. Caprio, L.; Demir, A.G.; Previtali, B. Non-intrusive estimation of subsurface geometrical attributes of the melt pool through the sensing of surface oscillations in laser powder bed fusion. J. Laser Appl. 2021, 33, 012035. [Google Scholar] [CrossRef]
  53. Bertoli, U.S.; Wolfer, A.J.; Matthews, M.J.; Delplanque, J.P.R.; Schoenung, J.M. On the limitations of Volumetric Energy Density as a design parameter for Selective Laser Melting. Mater Des. 2017, 113, 331–340. [Google Scholar] [CrossRef] [Green Version]
  54. Rombouts, M.; Kruth, J.P.; Froyen, L.; Merce, P. Fundamentals of Selective Laser Melting of alloyed steel powders Fundamentals of Selective Laser Melting of alloyed steel powders. CIRP Ann. Manuf Technol. 2006, 55, 187–192. [Google Scholar] [CrossRef]
  55. Klein, T.; Vicanek, M.; Simon, G. Oscillations of the keyhole in penetration laser beam welding. J. Phys. D Appl. Phys. 1994, 29, 322–332. [Google Scholar] [CrossRef]
  56. Andersen, K.; Cook, G.E.; Barnett, R.J.; Strauss, A.M. Synchronous weld pool oscillation for monitoring and control. IEEE Trans. Ind. Appl. 1997, 33, 464–471. [Google Scholar] [CrossRef]
  57. Sorensen, C.D.; Eagar, T.W. Modeling of oscillations in partially penetrated weld pools. J. Dyn. Syst. Meas. Control. 1990, 112, 469–474. [Google Scholar] [CrossRef]
  58. Xiao, Y.H.; Ouden, G.d. A Study of GTA Weld Pool Oscillation. Weld J. 1990, 69, 289–293. [Google Scholar]
Figure 1. Schematic representation of an acquisition of the melt pool with the imaging chain in coaxial configuration. The geometrical characteristics of the surface of the molten pool are indicated alongside the bright reflections which occur behind the laser–material interaction position generated by the illumination.
Metals 12 01762 g001
Figure 2. Schematic representation of the experimental setup (a) with coaxial illumination and (b) off-axis illumination. (c) Effective implementation of the laser and monitoring system.
Metals 12 01762 g002
Figure 3. Different steps of the image processing algorithm developed to extract the oscillation indicator and the geometrical features of the melt pool. (a) Original frame; (b) difference between successive frames; (c) sum of the difference of different frames; (d) spatter removal via image erosion; (e) reconstructed molten pool in binarized frame; (f) with grayscale values. (g) Identified molten pool in red over original frame; (h) translation; (i) rotation of the molten pool to extract geometrical parameters such as width and length; and (j) translated and rotated image over the original frame. The reader is referred to Supplementary Video S1 to appreciate the dynamics of the process.
Metals 12 01762 g003
Figure 4. Schematisation of the principal parameters acquired to characterise the geometrical features of the melt: (a) width (wmp), length (lmp), area (Amp) and oscillation indicator Isum,ROI and (b) metallographic cross-section indicating the penetration depth h and width wcs.
Metals 12 01762 g004
Figure 5. Representative frame and its schematic representation of the tests conducted (ac) trend of the frame intensity for the videos with off-axis illumination and schematic representation of the condition tested.
Metals 12 01762 g005
Figure 6. Series of frames of the molten pool at different time instants obtained when employing the illumination light in off-axis configuration.
Metals 12 01762 g006
Figure 7. Single frame from the high-speed imaging acquisition with coaxial imaging and off-axis illumination in the different conditions of the experimental design.. Molten pool identified via image processing algorithm highlighted in transparent red. The reader is referred to Supplementary Video S2 to appreciate the dynamic effects of the acquisition.
Metals 12 01762 g007
Figure 8. Temporal variation of the different geometrical parameters extracted by means of the image processing algorithm for Condition A, (ac) and for Condition B, (df). Width from cross-sectional measurements wcs in dashed lines.
Metals 12 01762 g008
Figure 9. Molten pool width measured using the metallographic cross-sections (wcs) and the molten pool identification algorithm (wmp). Error bars are one standard deviation from the mean.
Metals 12 01762 g009
Figure 10. Power spectral density estimate of the LPBF depositions. Replicates in different colours (orange and blue).
Metals 12 01762 g010
Figure 11. Metallographic cross-sections of the two samples: (a) Condition A, replicate 1, (b) Condition A, replicate 2; (c) Condition B, replicate 1; (d) Condition B, replicate 2; and (e) penetration depth h against oscillation frequency, fosc.
Metals 12 01762 g011
Table 1. Design cues for the design of a coaxial monitoring system to determine the surface geometrical parameters and the oscillations of the melt pool during the LPBF process.
ParameterLower LimitUpper LimitDefining Eq.
Field of view width, wFOV>2·lmpData transfer rate limited-
Field of view length, lFOV>2·lmpData transfer rate limited l F O V = n p i x , x · S R
Spatial resolution, SROptically limited S R < w m p 10 -
Acquisition frequency, facq > 2 · f p h e n o m e n o n Data transfer rate limited-
Frequency resolution, ΔfresAs small as possible Δ f r e s Δ f m i n , p e a k s , Process limited Δ f r e s , P D = v l o b s
Table 2. Advantages and disadvantages of the different configurations of the external illumination light.
ConfigurationCoaxialOff-Axis
Advantage
-
Uniform illumination
-
Lower power consumption
-
No imaging field limitations
-
Easier set up
Disadvantage
-
Internal back reflections
-
Speckle formation
-
Difficult to achieve uniform illumination
-
High intensity required over large area
Table 3. Specifications of the laser system employed in the prototypal LPBF system.
ParameterValue
Maximum laser power, Pmax (W)300
Emission wavelength, λ (nm)1070
Beam quality factor, M21.05
Collimated beam diameter, dcol (mm)5
Beam expander magnification, m2
Expanded beam diameter, dexp (mm)10
Beam divergence, θ (mrad)20.9
Beam waist diameter, d0 (µm)43
Table 4. Specifications of the monitoring chain developed.
ParameterValue
High-speed camera configurationCoaxial
Illumination and observation wavelength, λobs640 nm
Exposure time, texpVariable (260 ns–1/facq)
Illumination time, tilluminationVariable
Spatial resolution, SR12.4 µm/pixel
Max. field of view, FOV1024 pixels × 1024 pixels
Max. acquisition frequency at full frame, facq,max6.4 kHz
Table 5. Configuration of the high-speed imaging acquisition system on the Raylase AM module to evaluate the detectability of surface oscillations with different illumination conditions.
Fixed Factors (Imaging System)Value
Exposure time, texp0.66 µs
Illumination time, tillumination0.55 µs
Field of View, FOV384 pixels × 384 pixels
4.76 mm × 4.76 mm
Acquisition frequency, facq36 kHz
Fixed Factors (Process)Value
ProcessMaterial remelting
Process gasArgon
MaterialAISI316L
Power, P (W)300
Scan speed, v (mm/s)900
Focal position, Δf0
Variable FactorValue
Illumination lightCoaxial—Off-axis
Table 6. Fixed and variable factors for the experimental campaign to determine molten pool surface oscillations and geometrical features.
Fixed Factors (Imaging System)Value
Illumination light configurationOff-axis
Exposure time, texp0.49 µs
Illumination time, tillumination0.39 µs
Field of View, FOV256 pixels × 256 pixels
3.15 mm × 3.15 mm
Acquisition frequency, facq50 kHz
Fixed Factors (Process)Value
ProcessSingle-track LPBF
Process gasArgon
MaterialAISI316L
Layer thickness, lt (µm)50
Focal position, Δf (mm)0
Replicates, n2
Variable FactorsValue
Condition Ap = 275 W, v = 225 mm/s
Condition Bp = 300 W, v = 450 mm/s
Publisher’s Note: MDPI stays neutral with regard to jurisdictional claims in published maps and institutional affiliations.

