Article

Effects of Alloying Elements on Solidification Structures and Macrosegregation in Slabs

1
National Engineering Research Center of Continuous Casting Technology, Central Iron and Steel Research Institute, Beijing 100081, China
2
Material Digital R&D Center, Central Iron & Steel Research Institute Group, Beijing 100081, China
*
Authors to whom correspondence should be addressed.
Metals 2022, 12(11), 1826; https://doi.org/10.3390/met12111826
Submission received: 9 September 2022 / Revised: 18 October 2022 / Accepted: 24 October 2022 / Published: 27 October 2022
(This article belongs to the Special Issue Numerical Simulation of Solidification Processes)

Abstract

:
A Cellular Automaton-Finite Element (CAFE) model and a secondary dendrite arm spacing (SDAS) model are established to study the evolutionary behavior of the macrostructure and the secondary dendrites on a 295 × 2270 mm2 slab cross-section of experimental steel, respectively. The relationship between the element content, SDAS, equiaxed crystal ratio (ECR) and macrosegregation in continuously cast experimental slabs was studied comprehensively. It is found that with the increase in carbon content, the ECR increases at first and then decreases, and the ECR reaches the maximum value when the carbon content is 0.3%. With the increase in carbon content, the SDAS and average grain size of the equiaxed crystal zone increase, whereas the Si and Al content evidently affects the SDAS and average grain size of the equiaxed crystal zone to a greater extent than the Mn content. In addition, the SDAS can be reduced by reducing the content of C and Si within the acceptable range of alloy composition.

1. Introduction

The cast structure and segregation in continuously cast carbon steel billets can affect the quality of finished products [1]. The solidification microstructure is closely related to the quality and properties of the casting products [2], and macrosegregation is closely related to the macro- and micro-solidification structures [3,4]. Both primary dendritic arms spacing (PDAS) and SDAS are significant parameters that characterize the solidification structure [5]. Centre segregation is chiefly caused by the interdendritic liquid rich in impurity elements flowing along V-channels and towards the centerline [6]; the fluid flow in the interdendritic channels depends on the PDAS and SDAS, and the smaller the PDAS and SDAS, the denser the solidification microstructure of the bloom, which can contribute to reducing the occurrence frequency of center segregation [7].
The main factors affecting dendrite spacing include the dendrite growth rate, cooling rate, temperature gradient, local solidification time, and steel composition [8,9]. Many studies on the effect of the CC process parameters on the SDAS and ECR have been carried out using experimental and numerical simulation methods [10,11,12]. In the bloom continuous casting process, the major factor influencing the values of SDAS in different locations of a bloom is the local cooling rate under the condition of defined alloy elements composition [13]. Therefore, in the continuous casting process, under the same specific water flow, the main factor affecting the PDAS and SDAS of the billet is the steel composition. However, there are few studies on the influence of element content on the ECR and SDAS in the billet [8,10,14], especially the impact of C content on the ECR [15,16]. In addition, there are fewer studies on slabs, especially on the effect of element content on the ECR. To study the effect of element content on the ECR and SDAS, it is necessary to ensure that the slab has the same continuous casting process parameters. The continuous casting process for five kinds of steel is studied with an industrial experiment, and the macrostructure and microstructure of different kinds of steel are analyzed. Compared with previous research, the influence of element content on the slab microstructure is further studied by numerical simulation.
In the present study, the CAFE model of ProCAST was used to predict the solidification process of different slabs with an area of 2270 × 295 mm2, based on the continuous casting production process conditions. The solidification structure of the continuous casting slab was numerically simulated, and the microstructure of the slab during the solidification process was analyzed and verified by nail shooting, surface temperature measurement, and acid etching experiments. The effect of C content on the ECR is studied. Based on the simulation of the slab temperature field, a SDAS model was established. Combined with the PDAS model, the effect of element content on the SDAS and grain size of the equiaxed zone is investigated. Then, the macrostructure, microstructure, and carbon segregation in different slabs are analyzed. The influences of element content on the ECR, SDAS, and carbon segregation are further studied. Finally, ways to reduce carbon segregation are suggested.

2. Model Descriptions

2.1. Solidification Heat Transfer Model

When establishing the slab solidification model, in order to ensure the accuracy of the calculation process, it is necessary to remove some secondary factors that have little effect on the model. According to the heat transfer characteristics of continuous casting slabs and the actual production situation, the following assumptions are made in the mathematical model [17]:
(1)
Heat transfer along the casting direction is ignored.
(2)
The effect of the fluid flow of molten steel on the internal heat transfer and structure is ignored during the calculations.
(3)
The heat transfer of each part of the secondary cooling zone is uniform, and the heat transfer coefficient can be used to describe the heat exchange of the slab in the secondary cooling zone.
(4)
The heat transfer in the mold is calculated by the average heat flux.
(5)
The influence of mold vibration and protective slag film on heat transfer was ignored.
Equations (1) and (2) are the two-dimensional heat transfer governing equations for slab continuous casting.
x ( λ T x ) + y ( λ T y ) = ρ H T
H = 0 T C P d T + L   (   1     f s   )
where T is the temperature, t is the time, ρ is the liquid density, CP is the heat capacity, λ is the effective thermal conductivity, L is the latent heat of fusion, and fs is the solid fraction.

2.2. Nucleation Model

In 1989, Rappaz [18] proposed a continuous nucleation model based on the Gaussian distribution, as shown in Equations (3) and (4):
n ( Δ T ) = 0 Δ T d n d ( Δ T ) d ( Δ T )
d n d ( Δ T ) = n m a x 2 π Δ T σ e x p [ ( Δ T Δ T n ) 2 Δ T σ 2 ]
where ΔT is the undercooling, K; nmax represents the maximum nucleation density, the unit of volume nucleation density is m−3 and the unit of surface nucleation density is m−2; ΔTσ is the standard deviation undercooling, K; ΔTn represents the mean undercooling, K. The compositions of the experimental steels are shown in Table 1. The surface and volume nucleation (ΔTS, ΔTV), standard deviation undercooling (ΔTS,σ, ΔTV,σ), surface and volume nucleation density (nS, nV), and the liquidus and solidus temperature of the experimental steels are shown in the Table 2.

2.3. Dendrite Tip Growth Kinetics Model

In continuous casting, dendrite tip growth kinetics, namely the KGT model [19,20], are used to calculate the growth kinetics of columnar crystals and equiaxed crystals. Based on the marginal stability criterion, Equation (5) is obtained:
V 2 π 2 Γ P 2 D 2 + V m C 0 ( 1 k 0 ) D [ 1 ( 1 k 0 ) I v ( P ) ] + G = 0  
where V is the dendritic tip growth rate, m∙s−1; Γ represents the Gibbs–Thomson coefficient; P is the solutal Peclet number; D is the solute diffusion coefficient; m is the liquidus slope; C0 is the nominal concentration; k0 is the partition coefficient; G is the temperature gradient; Iv(P) is the Ivantsov function, Iv(P) = Pexp(P)E1(P), and E1 is the exponential integral.
In the actual calculation process, to accelerate the calculation process, the KGT model is fitted to obtain the following equation (Equations (6)–(8)) [21]:
V ( Δ T ) = α 2 Δ T 2 + α 3 Δ T 2  
α 2 = [ ρ 2 m C 0 ( 1 k ) 2 Γ k + 1 m C 0 ( 1 k ) D ] D 2 π 2 Γ  
α 3 = D π Γ · 1 ( m C 0 ) 2 ( 1 k )  
where α2 and α3 are the fitting polynomial coefficients of dendrite tip growth kinetic parameters, and the units are m·s−1·K−2 and m·s−1·K−3, respectively; and ρ is the density of steel.
Five processed steels are selected in the current experimental study. Their chemical compositions (in mass%) are listed in Table 2. The distribution coefficient k, liquidus slope m, solute diffusion coefficient D [22] and Gibbs–Thompson coefficient Γ [23] of Fe-X alloys are shown in Table 3.

2.4. SDAS Model

Pequet et al. [24] established a SDAS model at the mushy zone, as follows (Equation (9)):
λ 2 = [ M ( t ) t f ] 1 / 3  
where λ2 represents the SDAS, M(t) is the SDAS factor which mainly depends upon the properties of the alloy elements, and tf is the local solidification time (LST).

3. Solution Conditions and Model Validation

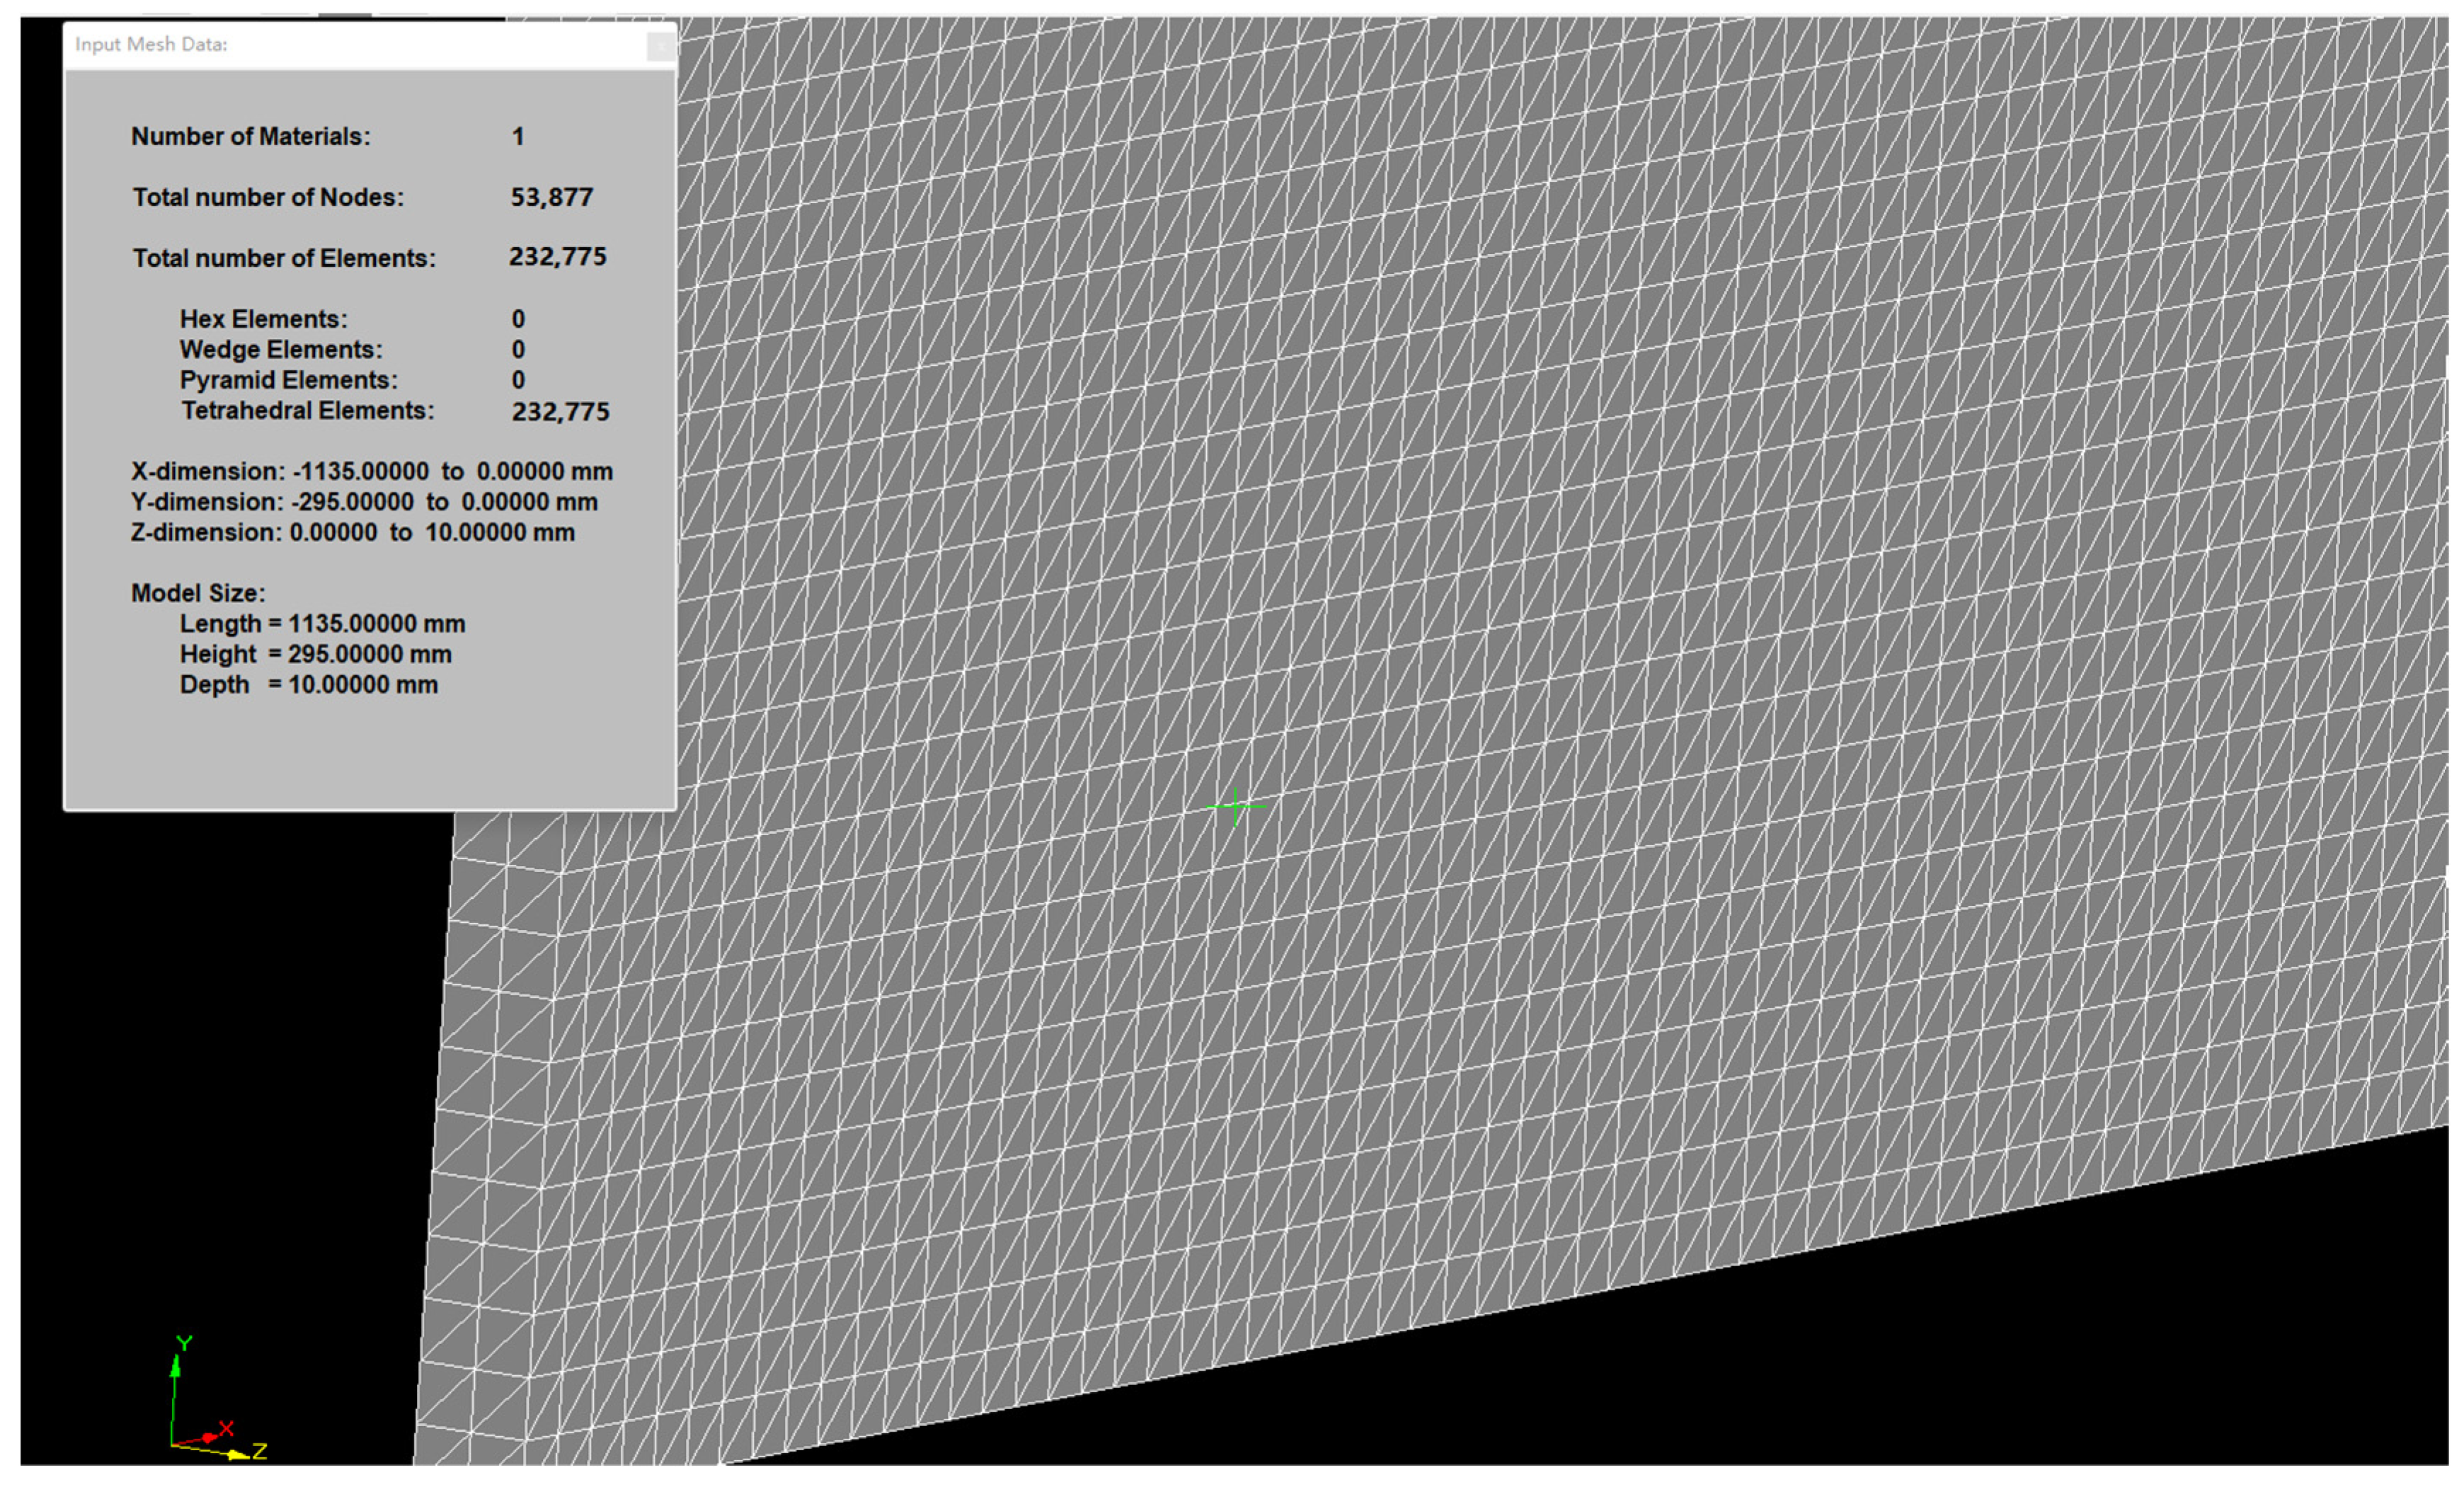
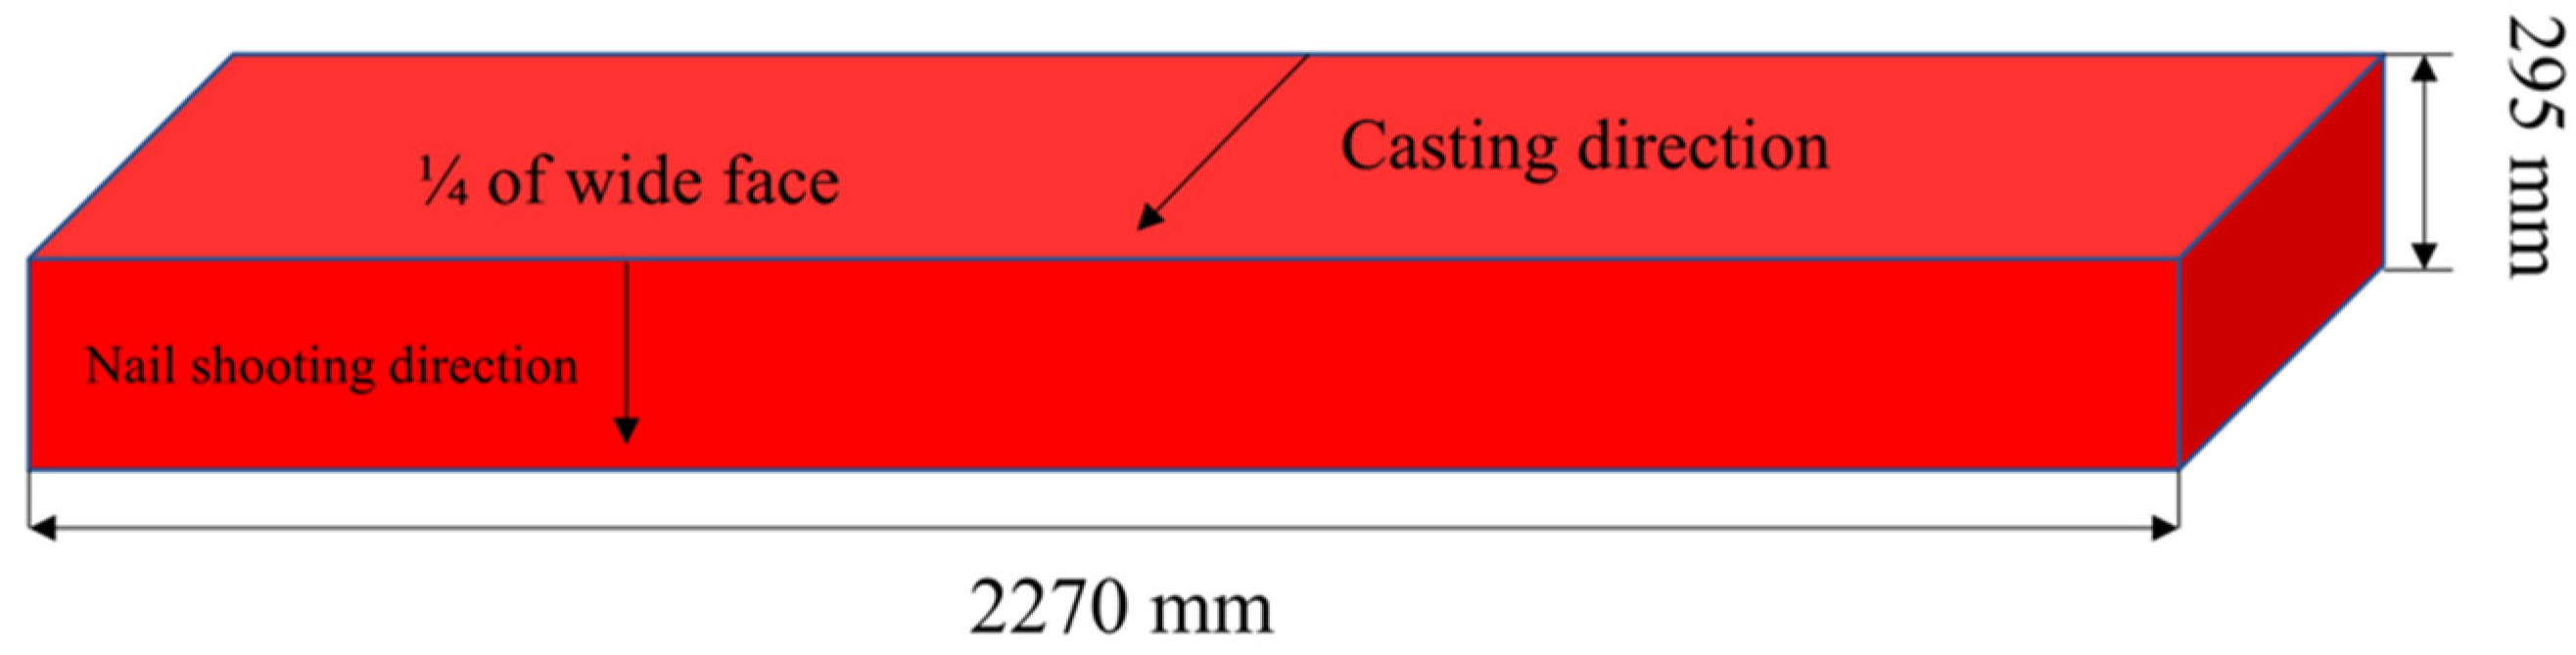
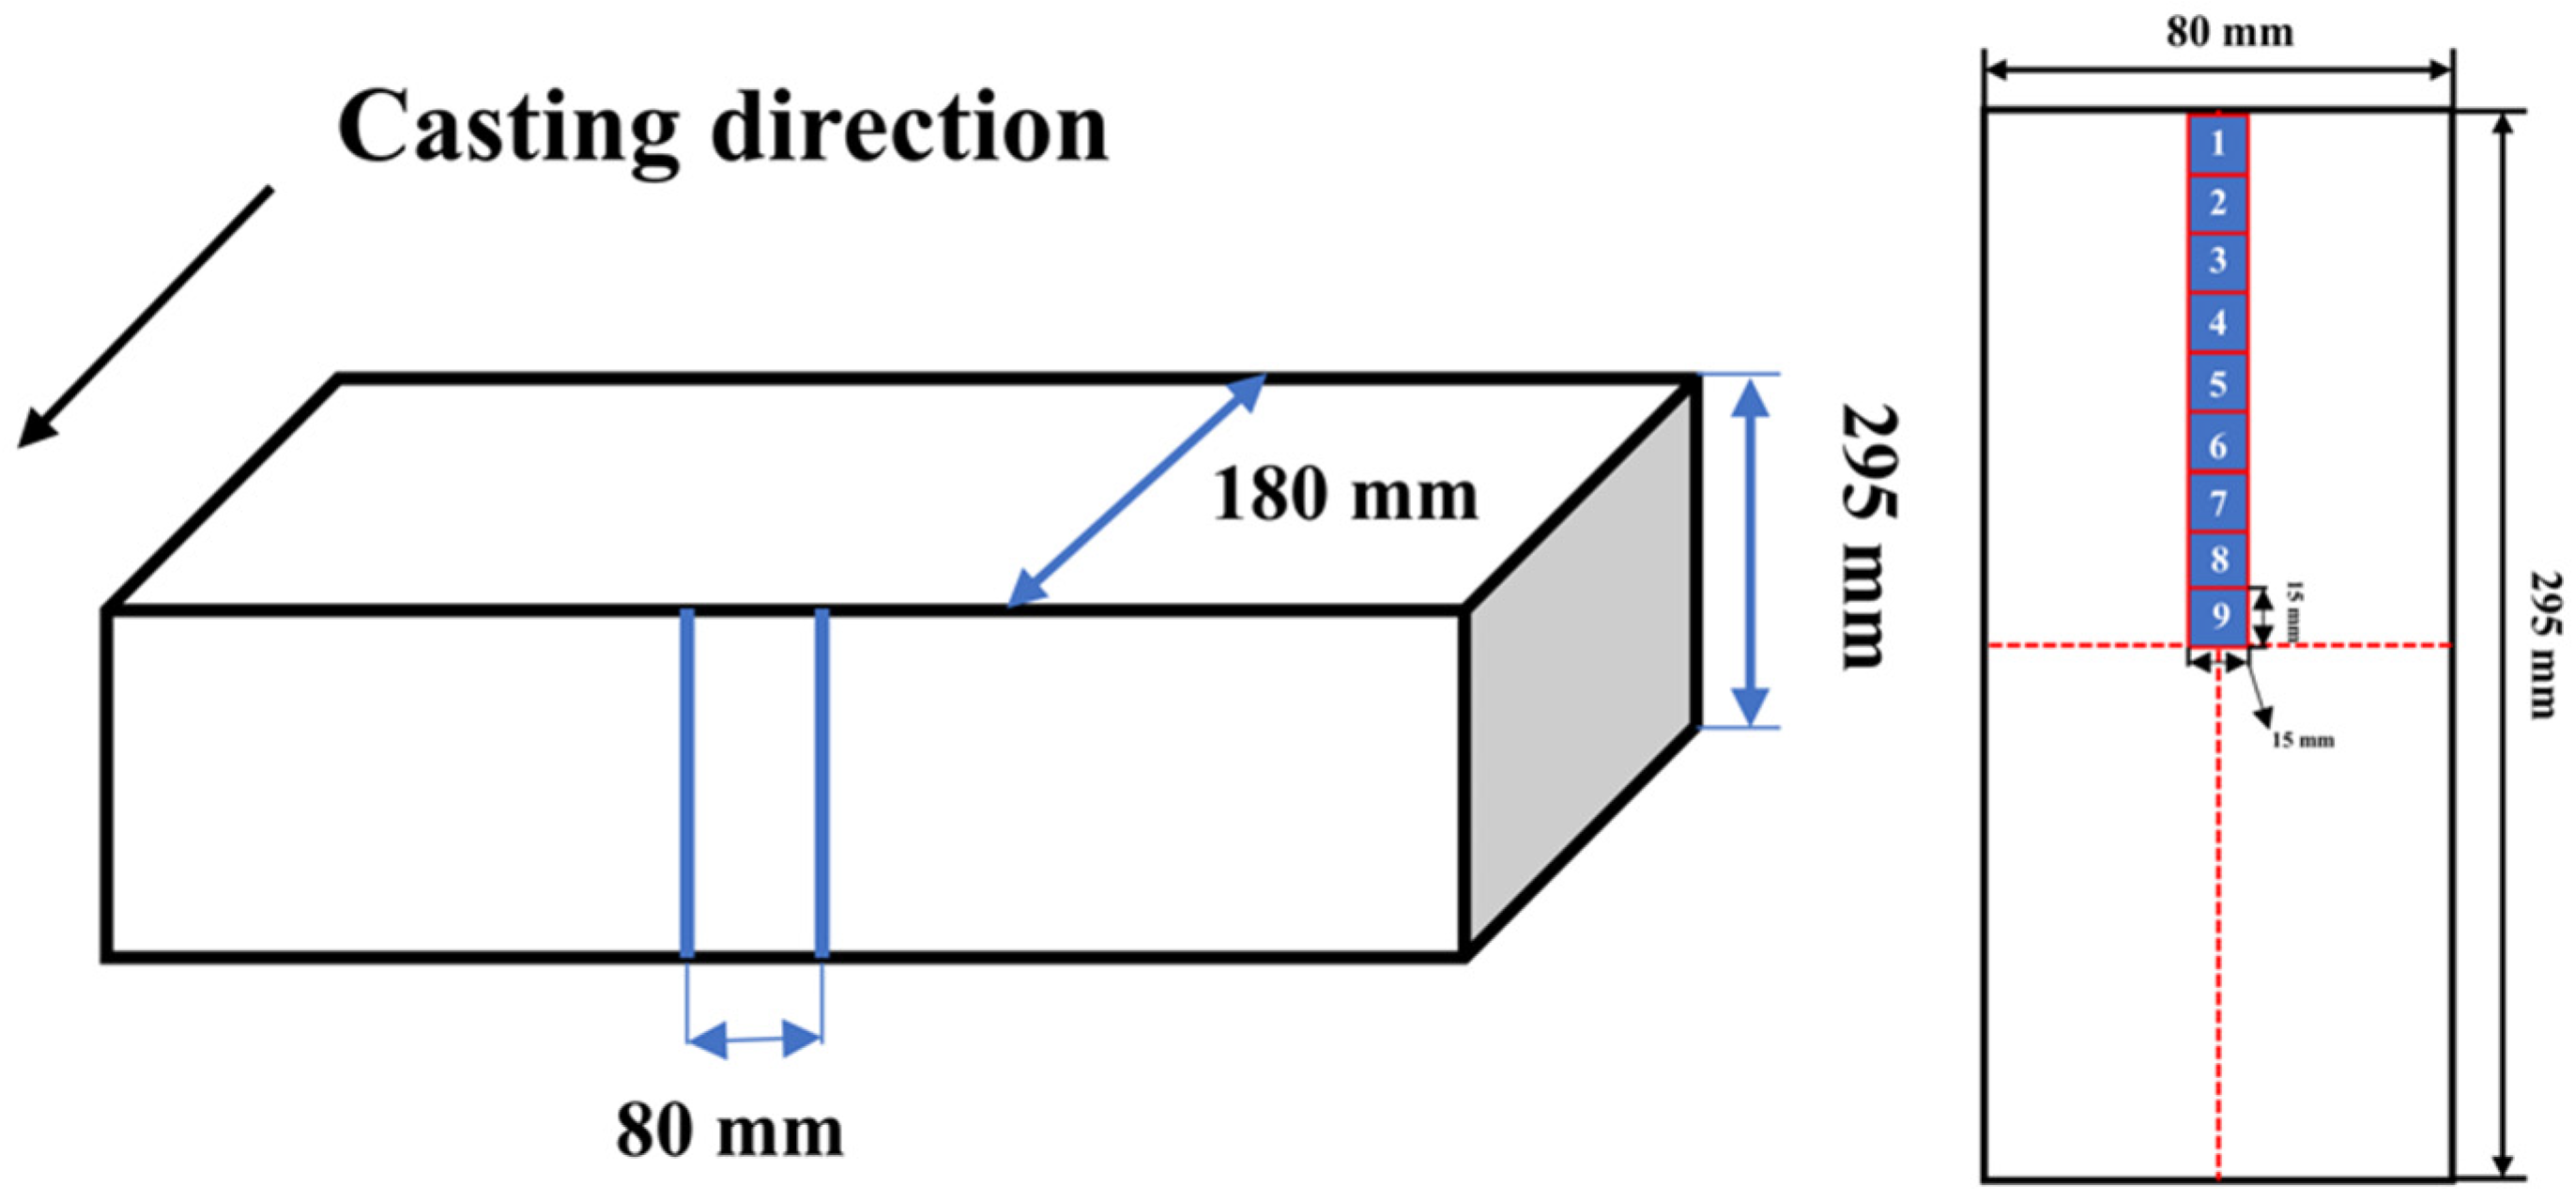
3.1. Geometric Model

The solidification process of the slab is simulated by the thin-slicing method. In order to save computing time and simplify the calculation process, half of the slab section is used for calculation, and the slice size is 1135 mm × 295 mm × 10 mm. Then, ProCAST software is used for grid division. The geometric model and mesh are shown in Figure 1.

3.2. Selection of the Calculation Parameters

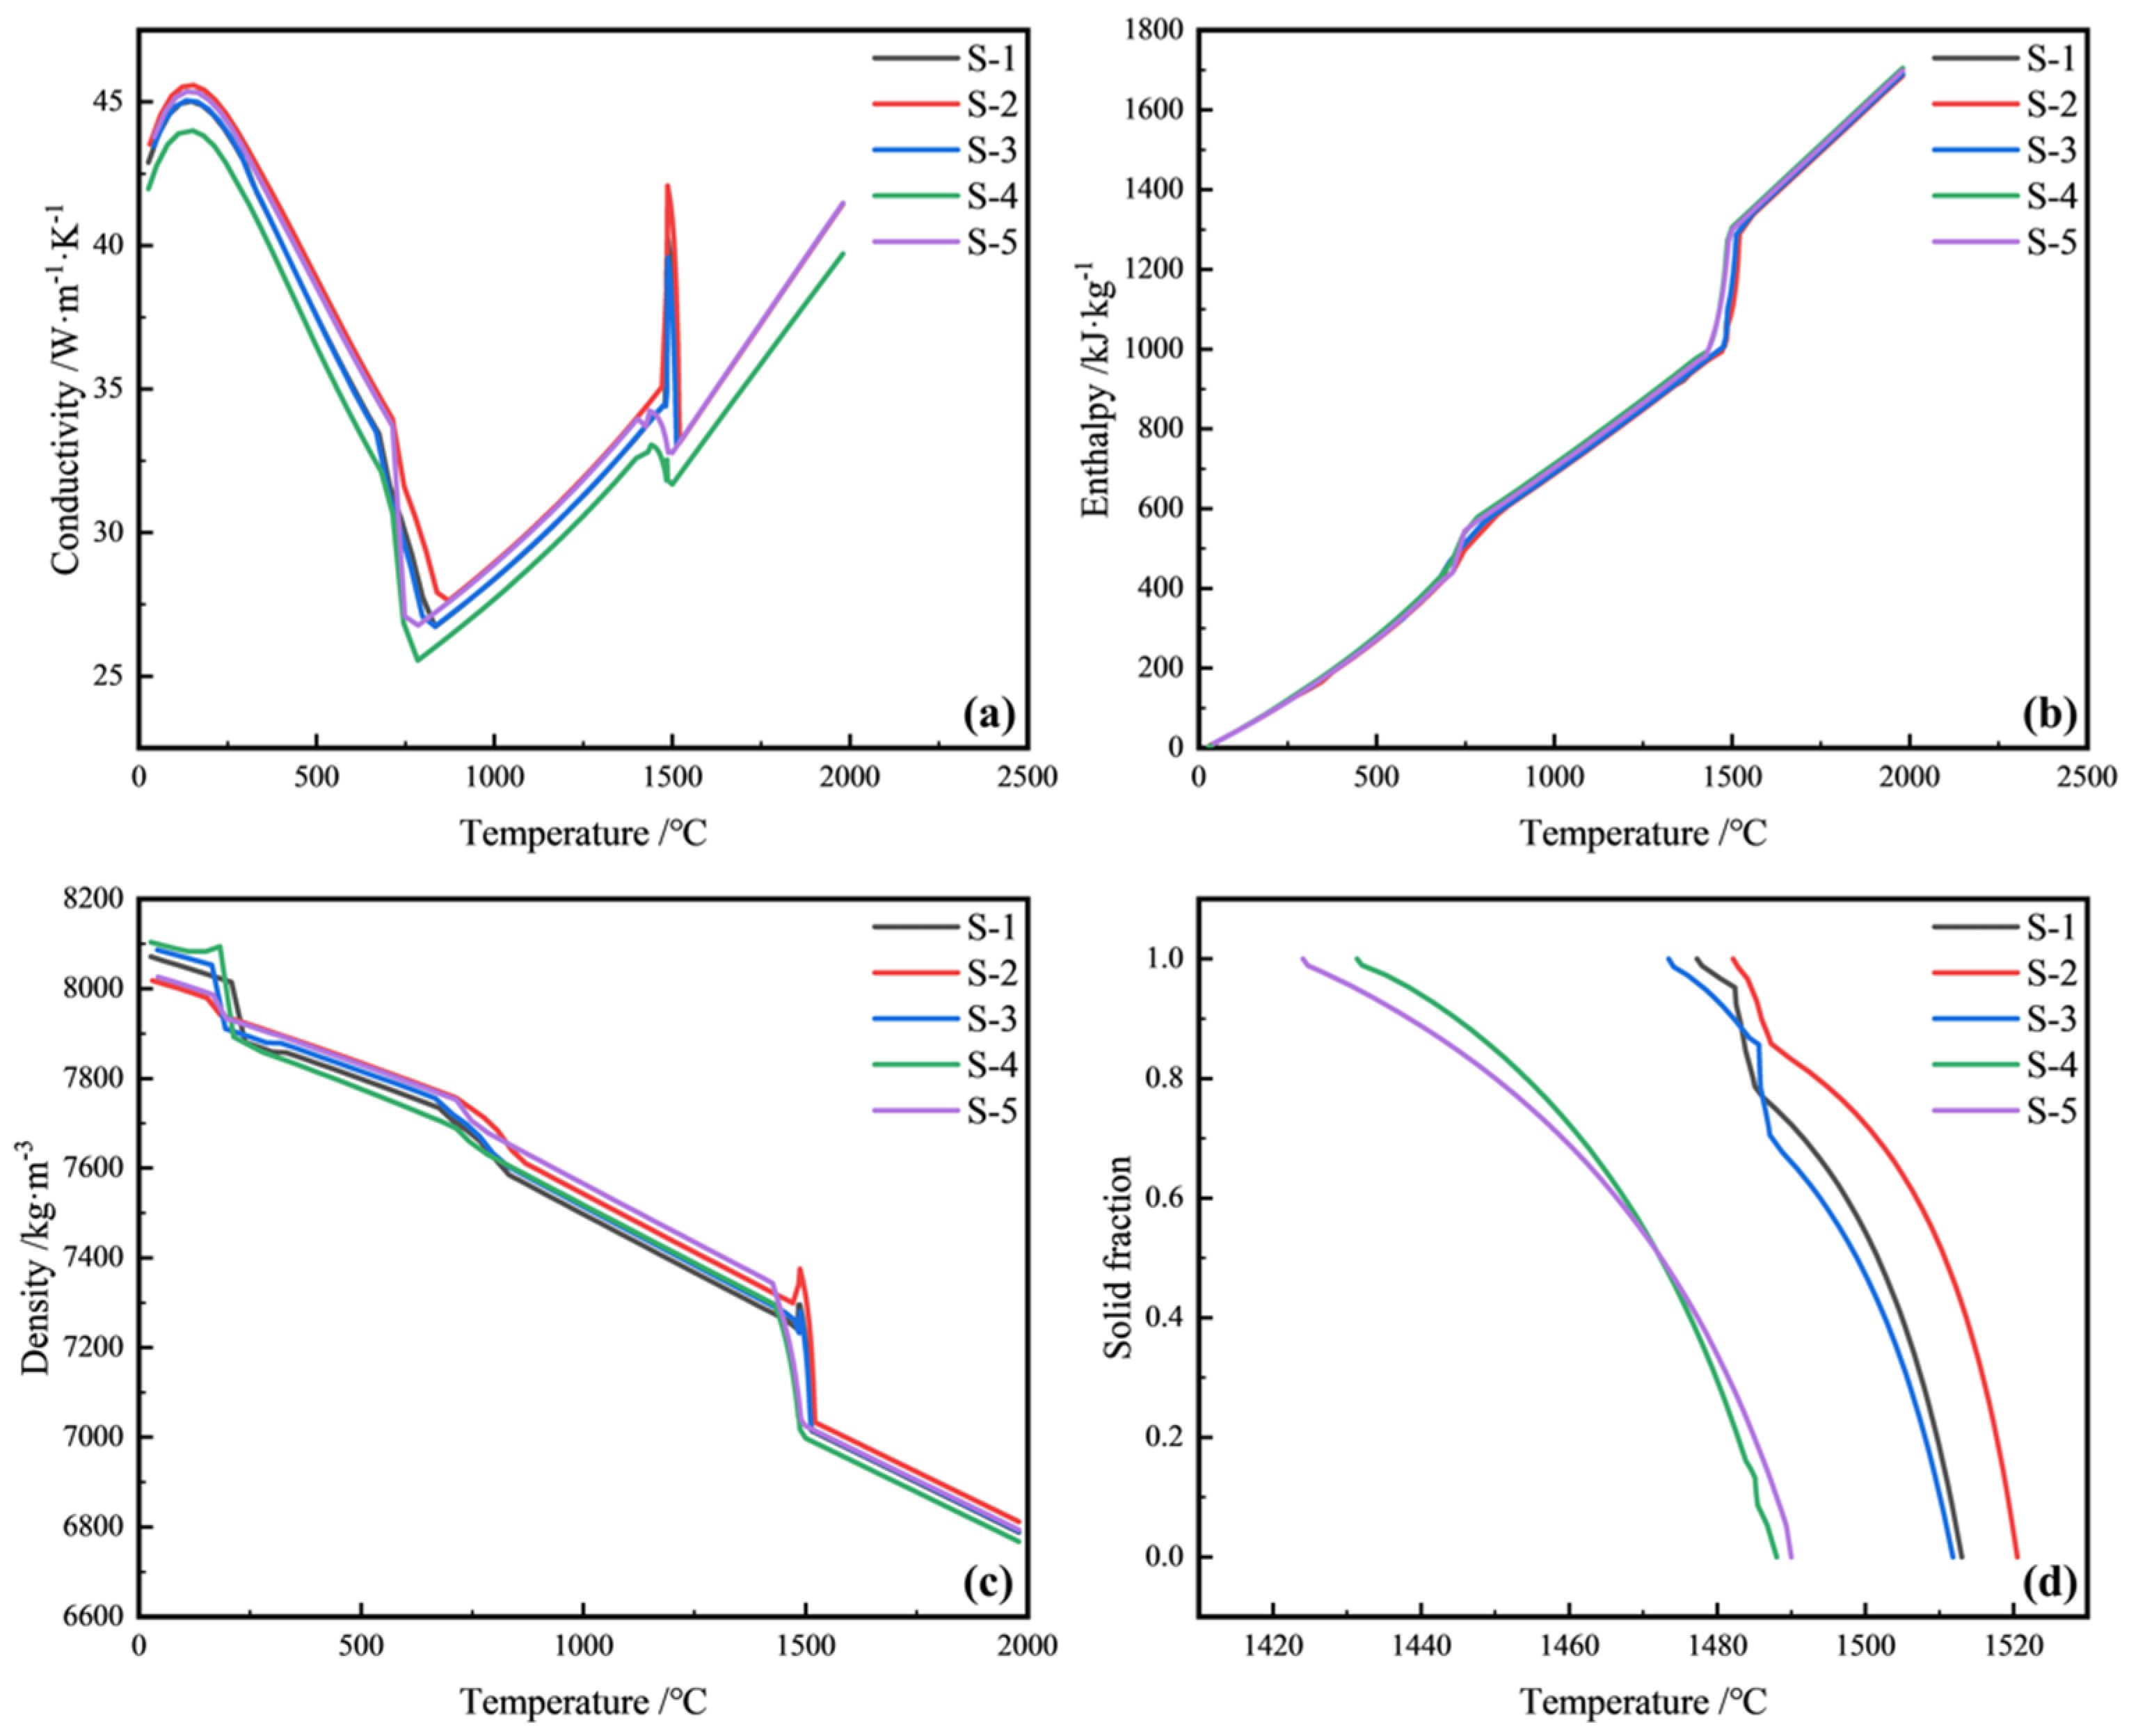
3.2.1. Thermal properties of the Material

The thermal conductivity, density, enthalpy, and solid fraction can be obtained from the ProCAST software database according to the steel compositions. The thermal properties of different steels are shown in the Figure 2.

3.2.2. Initial Condition and Calculation method for Boundary Conditions

The initial condition is given by Equation (10):
T 0 = T C  
where T0 is the initial temperature, K; and TC is the casting temperature, K.
In the mold, the heat flux was calculated using Equations (11) and (12) [25]:
q m = ( 2.688 β t )   ×   10 6  
β = 1.5 × ( 2.688 × 10 6 q c ) l m / v  
where qm is the heat flux of the crystallizer, W·m−2; β is a coefficient depending on the mold cooling conditions, W·m−2·s−1/2; qc is the average heat flux in the mold, W·m−2; lm is the effective length of the mold, m; t is the time in the mold, s; and v is the casting speed, m·s−1. The lengths, the boundary conditions, and the relevant formulas of the foot roller section, secondary cooling zone, and air-cooling zone are shown in Table 4. In addition, when the superheat is 20 °C and the specific water ratio is 0.32 L/kg, the water amounts at different sections are shown in Table 3. hf and hk are the heat transfer coefficients of the foot roller section and the secondary cooling zone, W/(m2·K); W is the water flow rate, L/(m2·s); Tw is the temperature of the environment, K; α and β are the correction factors; ε is the radiation coefficient; and σ is Stefan–Boltzmann constant, 5.67 × 10⁻⁸ W/(m2·K4).

3.3. Model Validation

3.3.1. Validation of Heat Transfer

In this paper, the accuracy of the solidification heat transfer model is verified by the nail shooting experiment. The installation position of the nail shooting device is at the end of segments 8, 9, and 10 of the caster (the distances from the meniscus are 24.63 m, 27.22 m, and 29.77 m, respectively), which are located above one quarter of the broad surface of the slab, and the length of the nail is 200 mm. The nail shooting position is shown in the Figure 3.
During the experiment, nails with sulfur (S) are hit into the solidifying slab, the nail tip is melted in the molten steel, and then the S is rapidly distributed into the molten steel. The thickness of the solidified shell can be judged by the diffusion of sulfur in the slab. As can be seen from the acid pickling results in Figure 4a, the liquid zone thickness at the end of segment eight is 30 mm, the actual shell thickness is 132.8 mm, and the simulated shell thickness is 132.5 mm, with an error of 0.23%. The measured value agrees well with the calculated value. The nails at the end of the ninth and tenth segments do not melt in the slab, and sulfur diffusion does not occur, so it is concluded that the slab has completely solidified when it enters the ninth segment. To further confirm the accuracy of the simulation results, the surface temperature measured at one quarter of the broad surface of the slab is compared with the simulation results, as shown in Figure 5. It can be seen that the error between simulated temperature and the measured temperature is within 4%. The absolute error is not more than 40 K, which indicates that the processing of the model boundary conditions is close to the actual continuous casting process. The simulation accurately reflects the solidification characteristics of the slab continuous casting process.

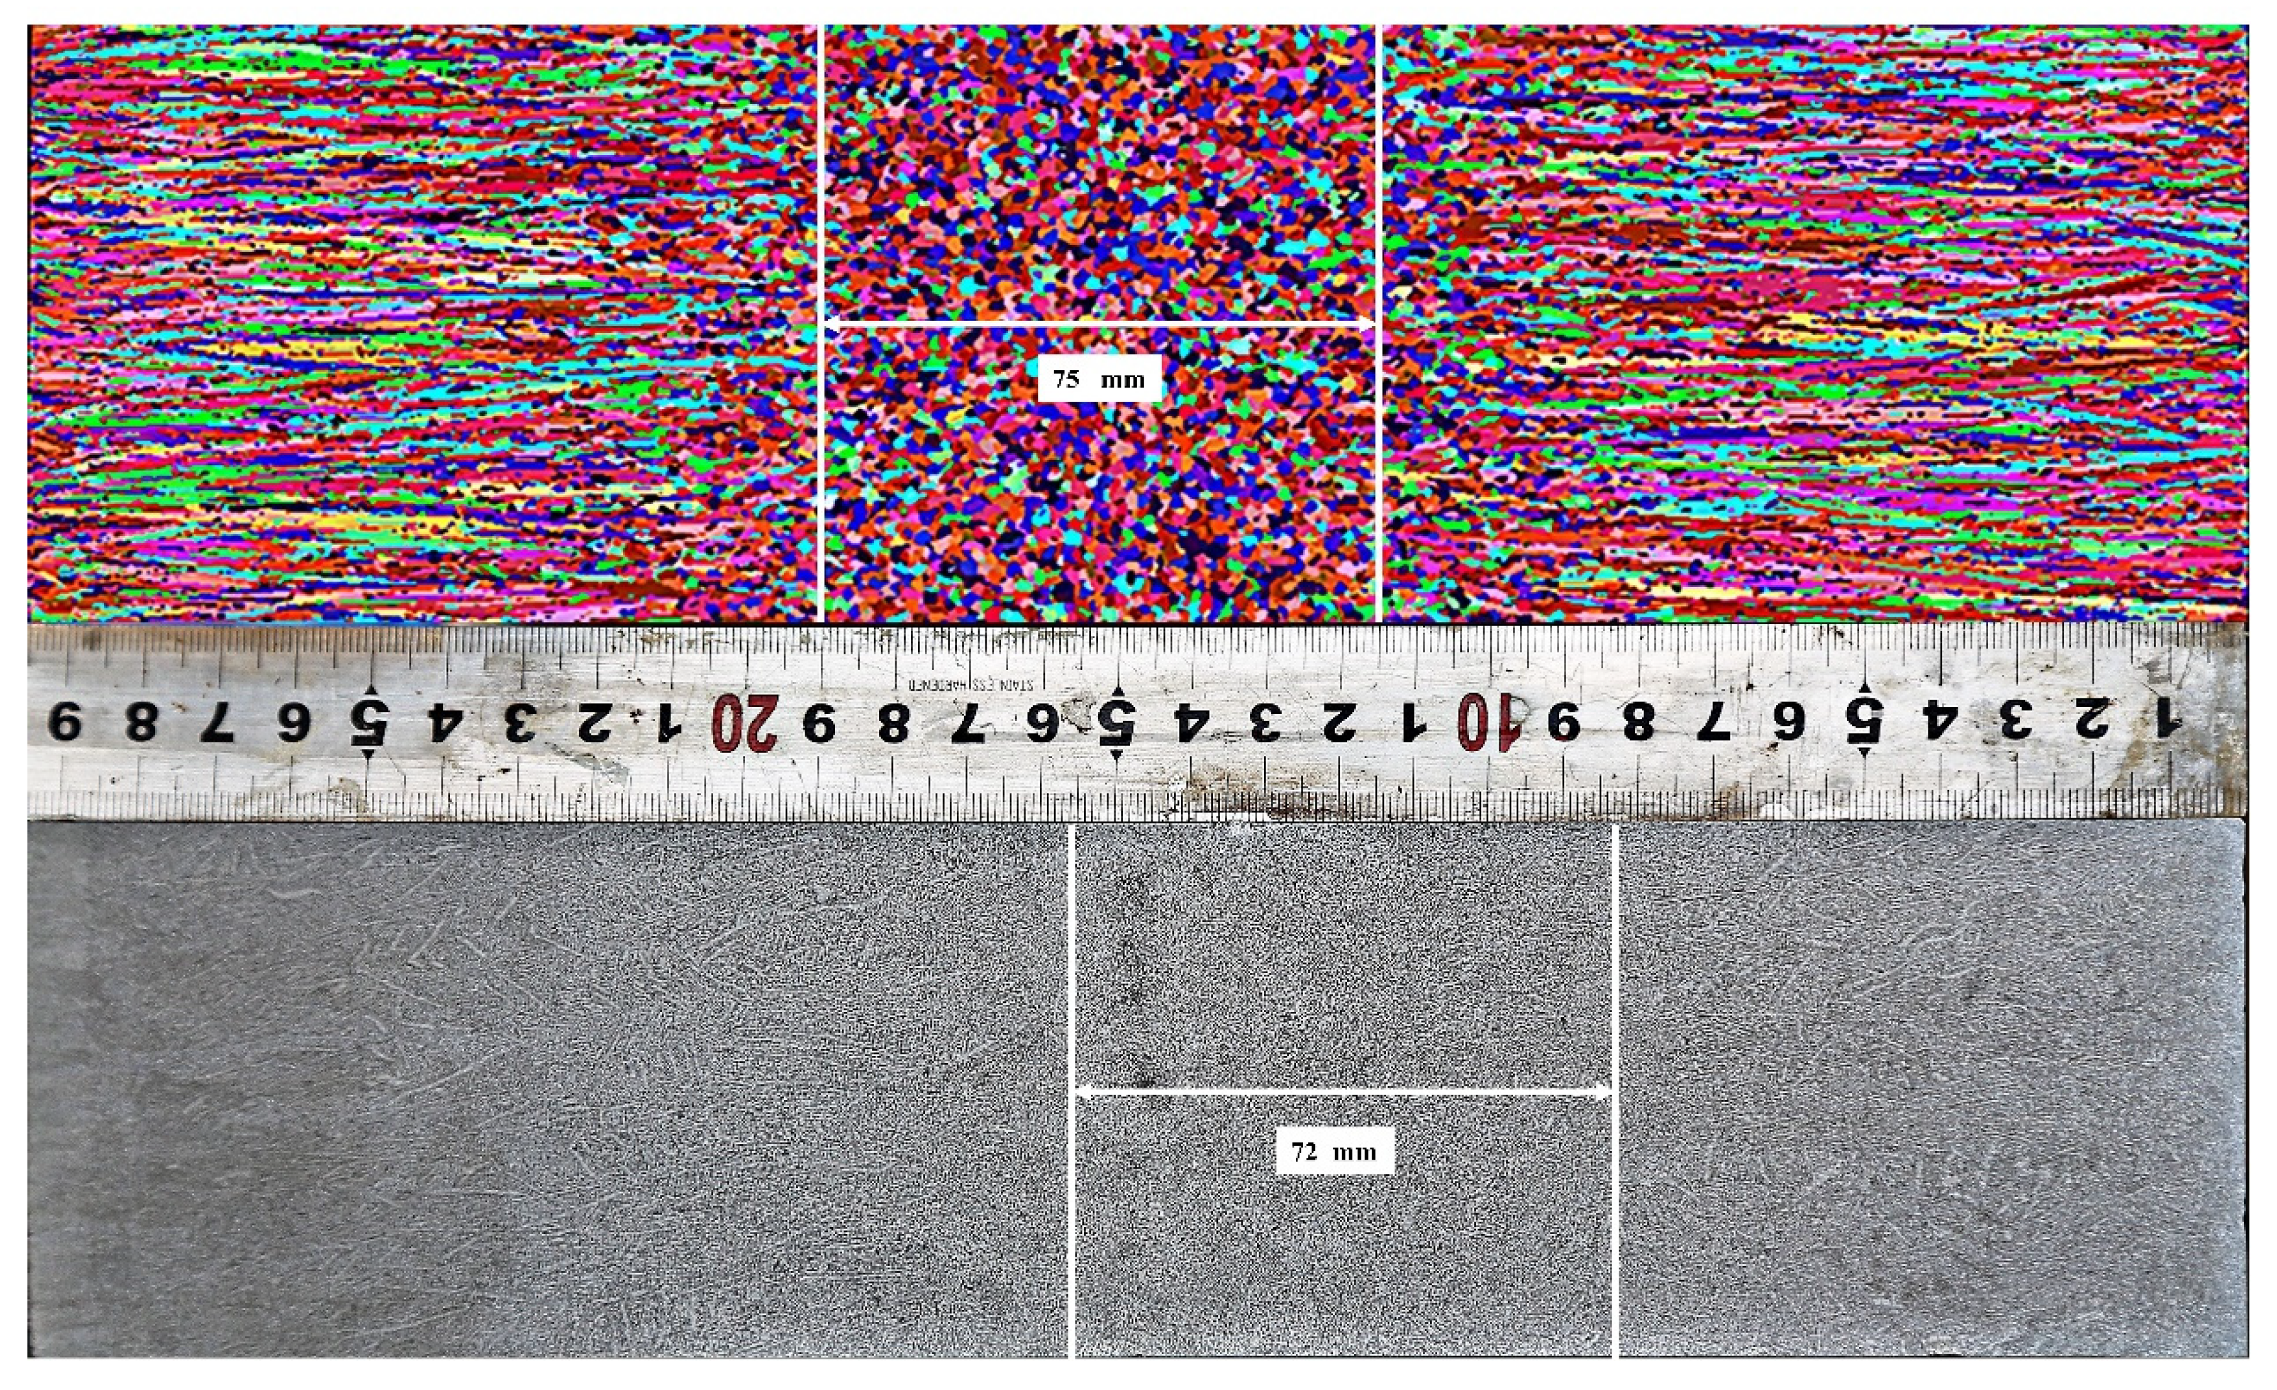
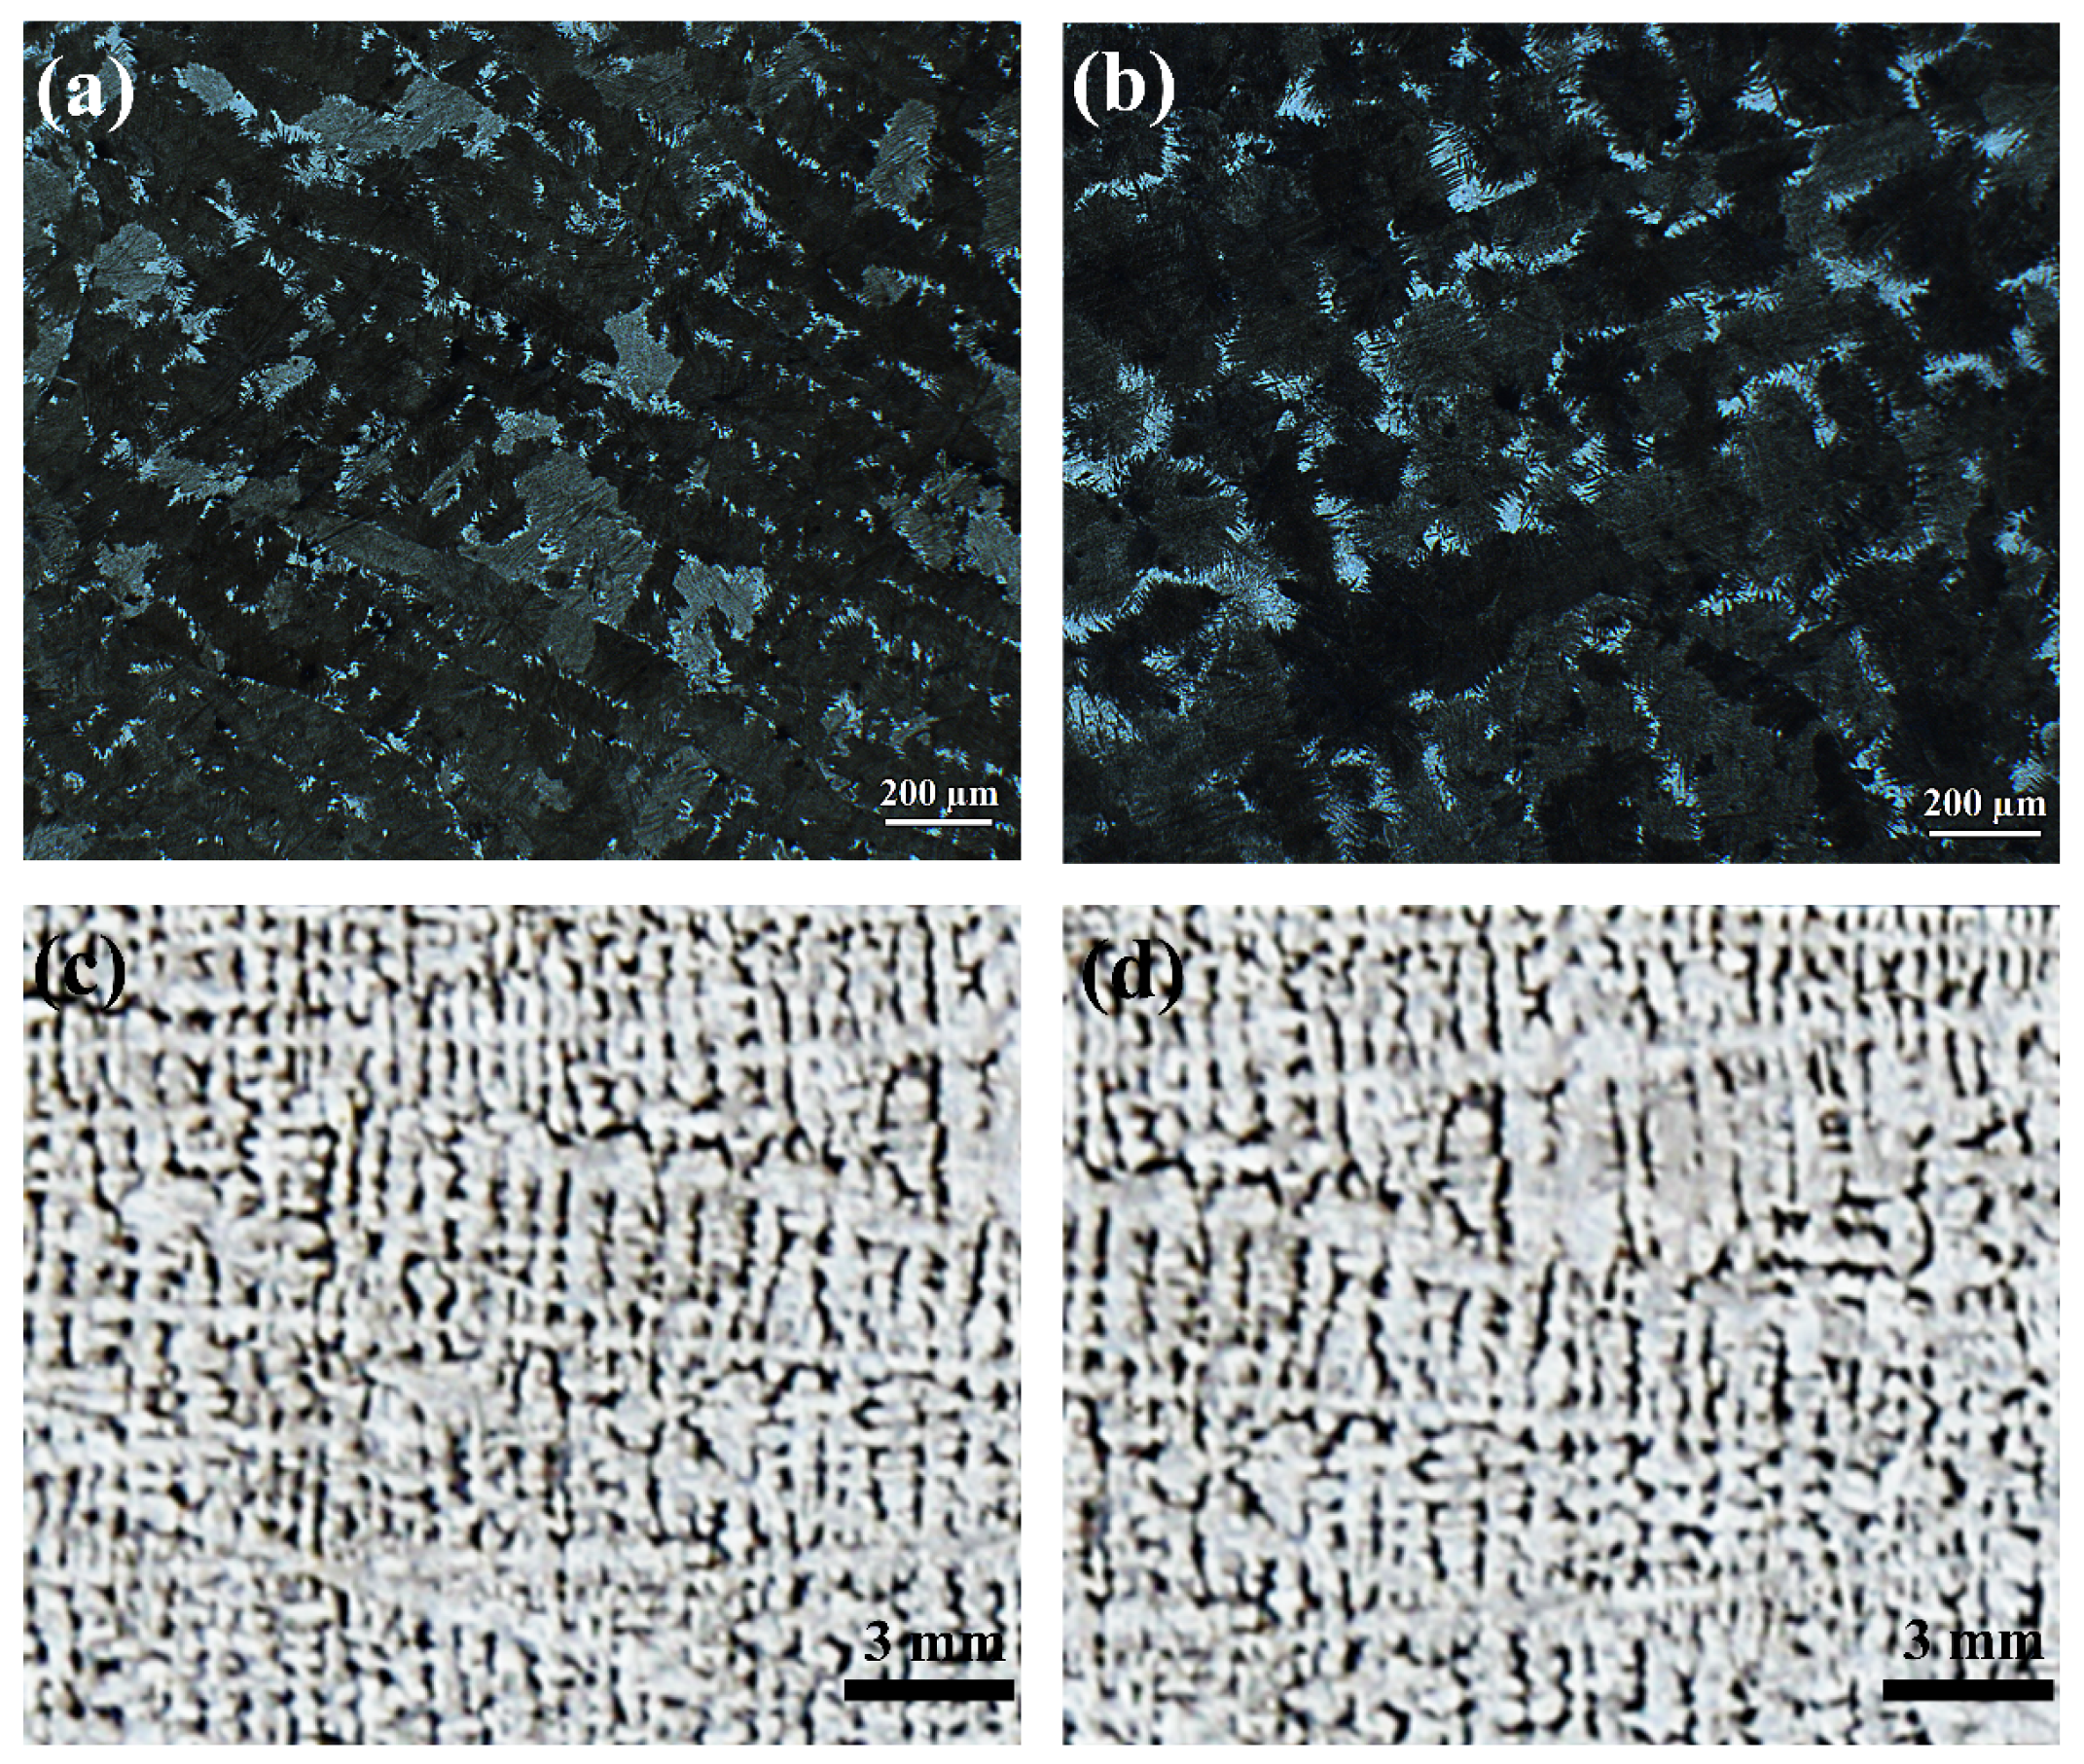
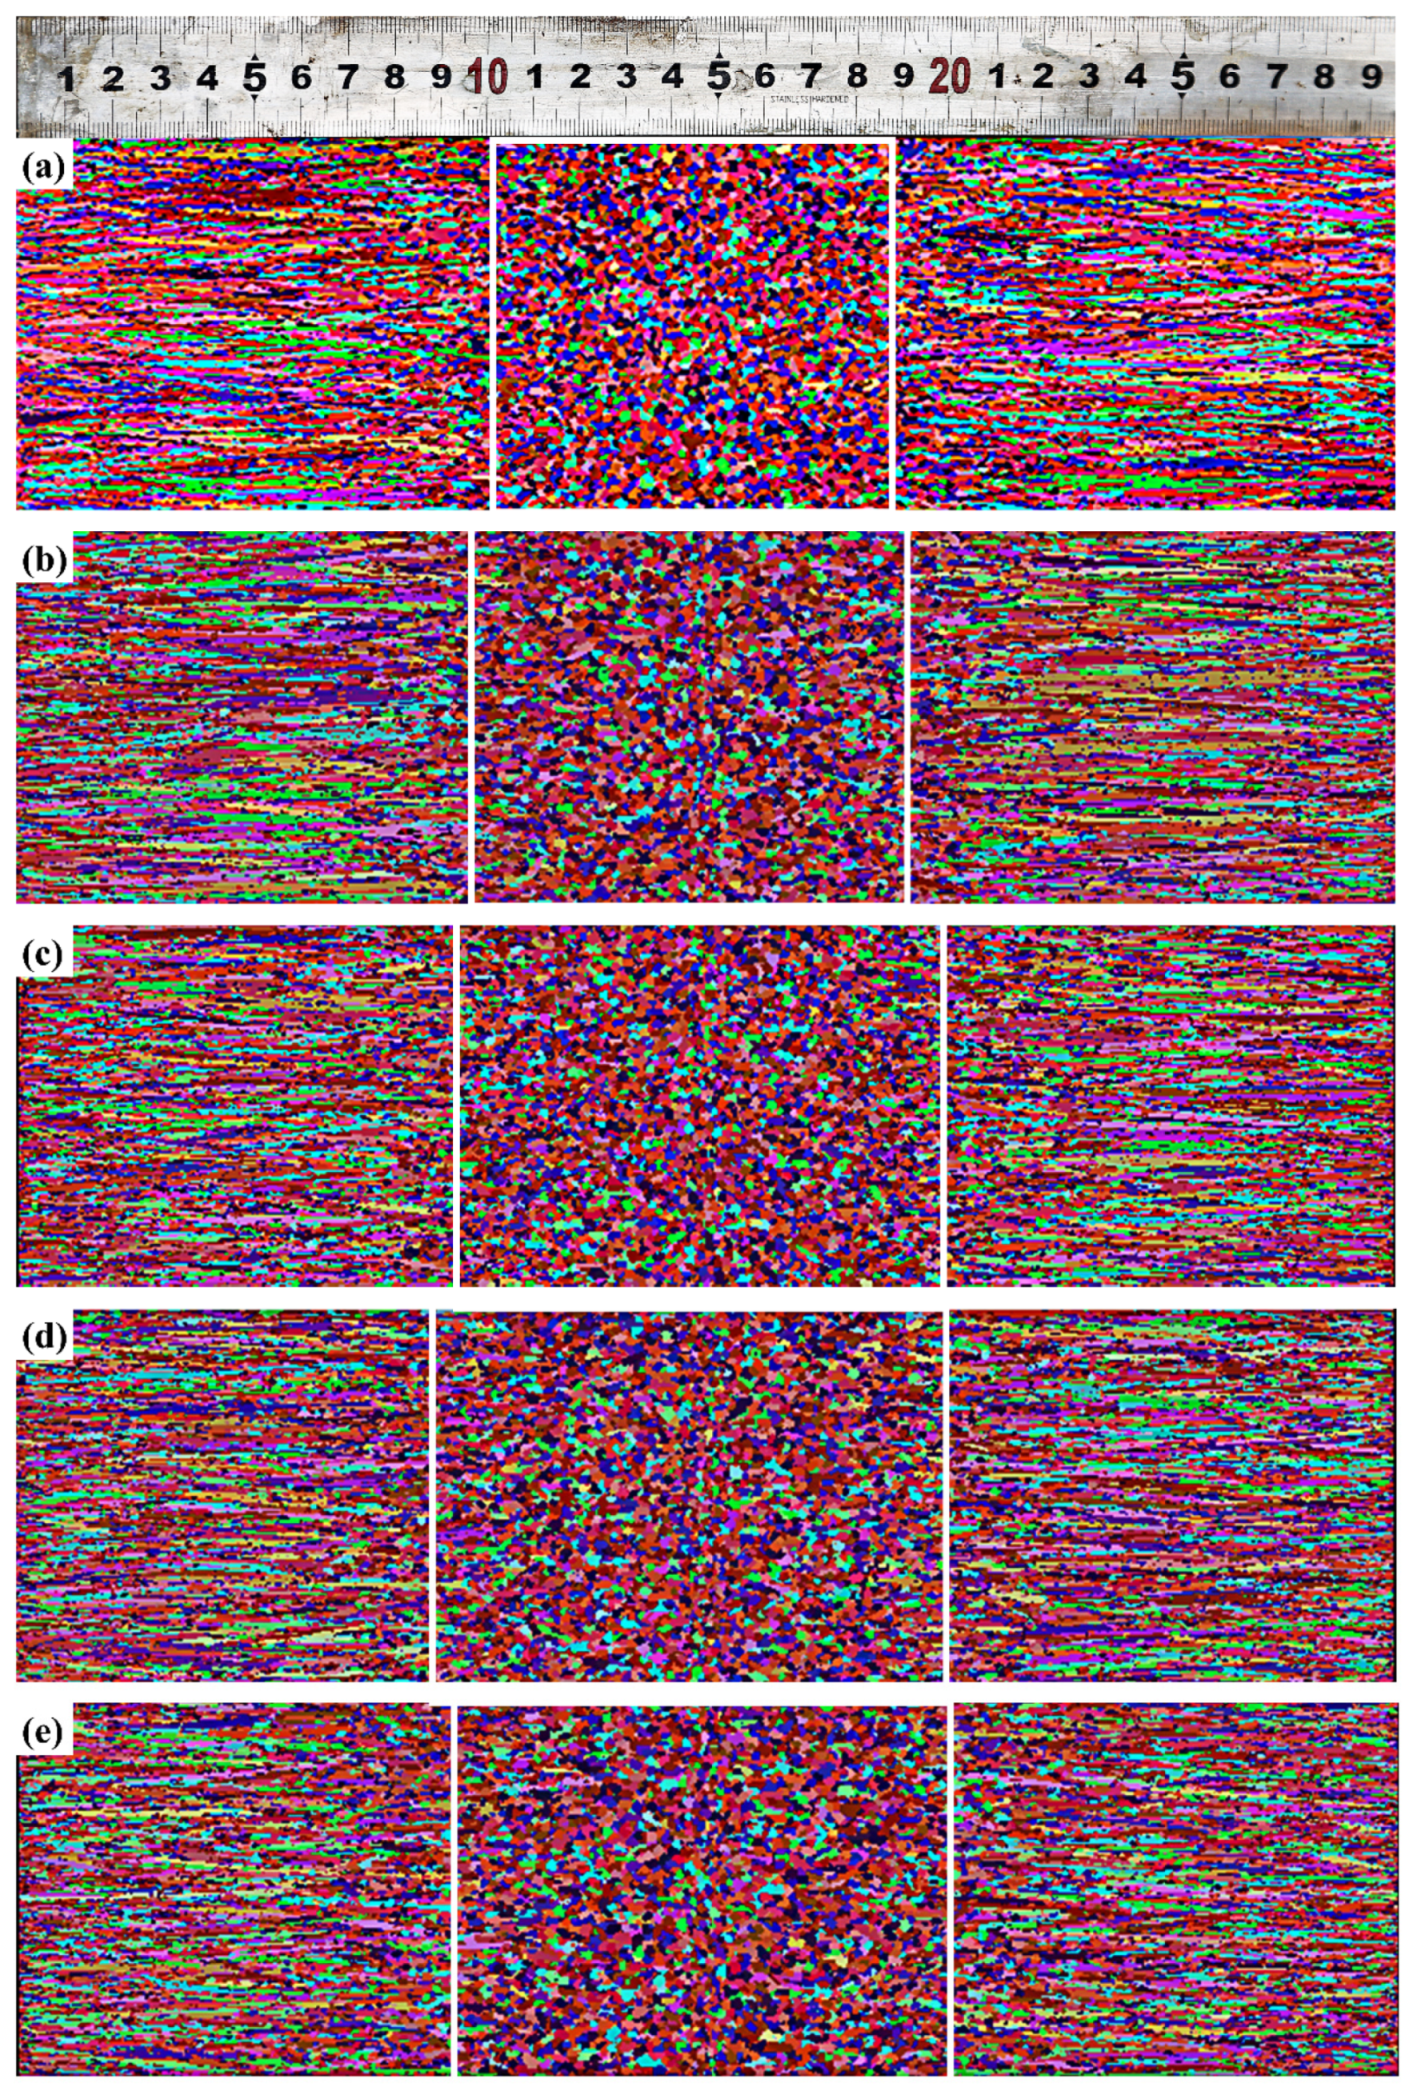
3.3.2. Validation of Solidification Structure

Figure 6 shows the comparison of the numerical and experimental solidification structures of S-1 steel. Different colors in Figure 6 represent grain orientation. The ECR of the slab is about 24.41%, while the calculated ECR is also 25.42%. The experimental and simulated equiaxed crystal ratios are almost identical, which indicates the model used in this study can better simulate the evolution of the solidification structure of the slab, and that the model used is reasonable.
To further prove the accuracy of the model, the solidification structure of S-5 steel is simulated under the same continuous casting industrial parameters as S-1 steel. The solidified structures after pickling and simulation are shown in Figure 7. It can be seen from the figure that there are basically no equiaxed crystals in Figure 7a,b, indicating that the model and the actual situation have reached a good correspondence.

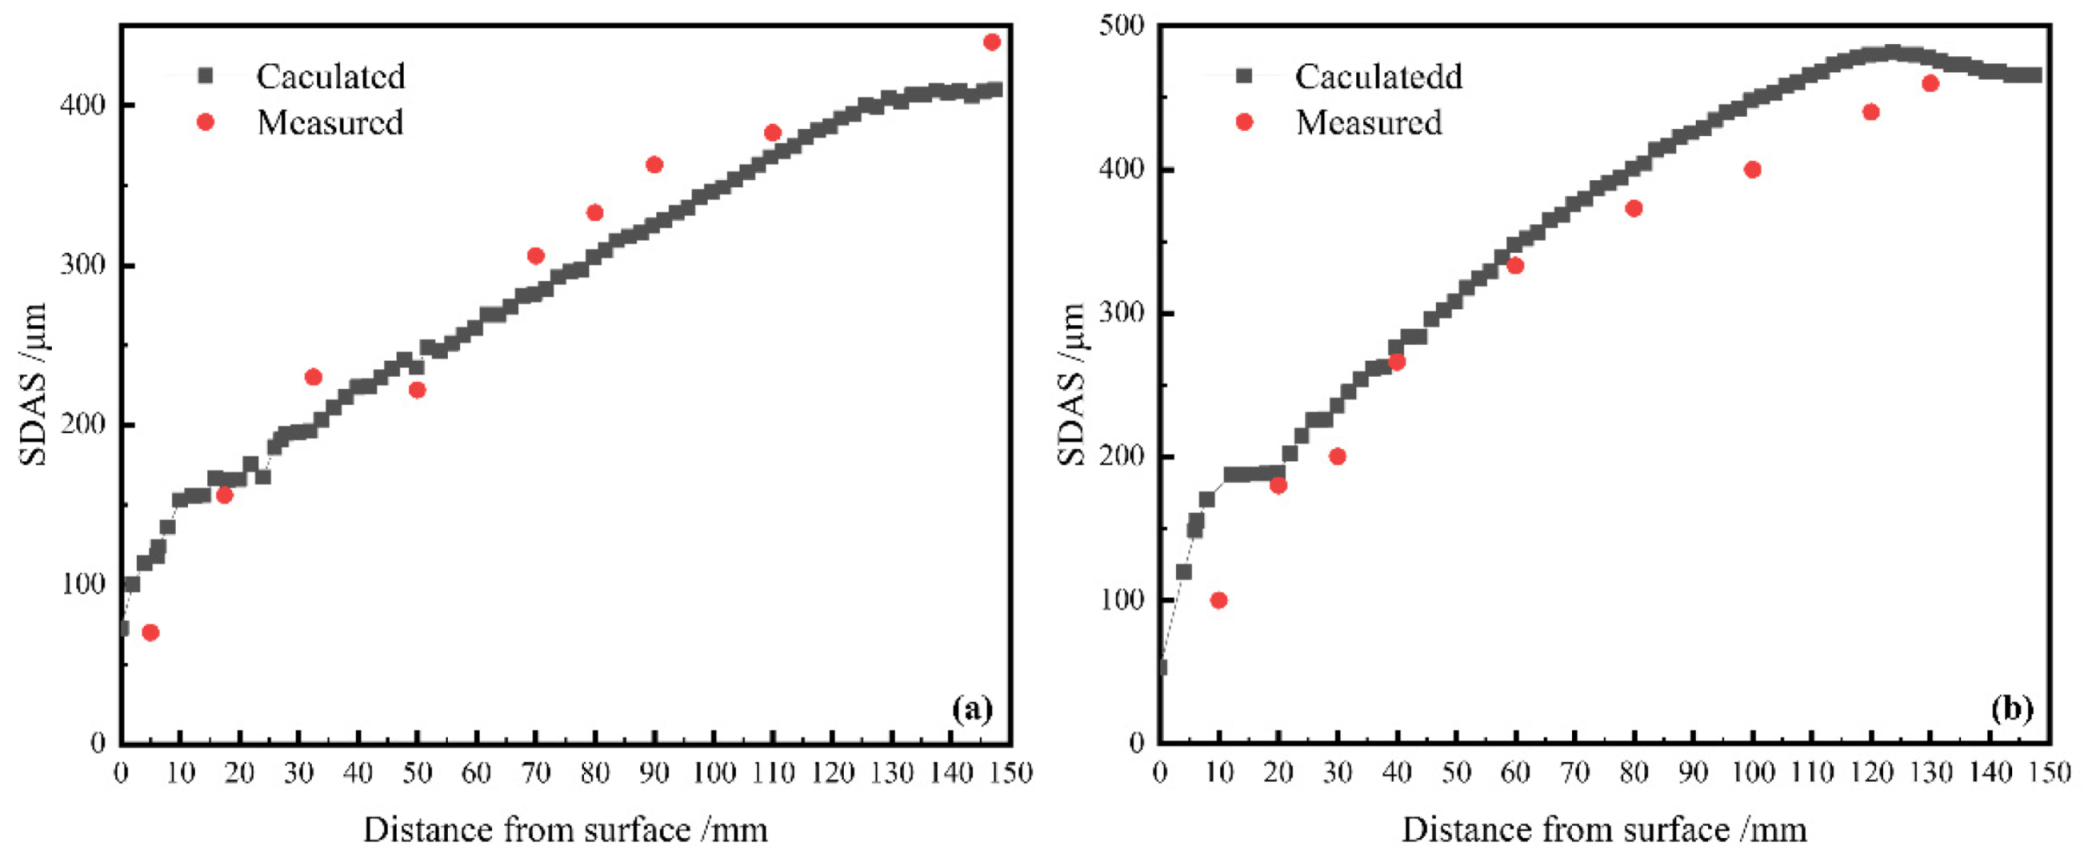
3.3.3. Validation of SDAS Model

Nine samples are taken from the surface to the center of the slab, as shown in Figure 8. The etching solution, V(HNO3):V(C2H6O) = 5:95, is used to etch the dendrite and observed under a metallographic microscope. The average SDAS of each sample is measured at 50 times magnification. Micrographs of the samples are shown in Figure 9.
Marrero and Galindo [8] studied four kinds of steel with different compositions and fitted an empirical formula suitable for low alloy steel and high alloy steel through the ordinary least squares, which can be expressed as Equation (13):
λ 2 = t 1 / 3 f [ 70 ( % C ) + 50 ( % S i ) 0.178 ( % M n ) 430 ( % A l ) + 0.755 ( % N i ) 3.42 ( % C r ) ]  
According to Equations (9) and (13), the M(t) of different steel grades in this study were calculated by a simple model, such as Equation (14):
M ( t ) 1 / 3 = [ 70 ( % C ) + 50 ( % S i ) 0.178 ( % M n ) 430 ( % A l ) + 0.755 ( % N i ) 3.42 ( % C r ) ]
The comparison between the SDAS values calculated by the model and the measured ones is shown in Figure 10. It can be seen that there is little difference between the calculated results and the measured results. In the continuous casting process, with the increase in the cooling rate, the SDAS decreases. On the surface area of the slab, the SDAS is small because the cooling intensity in the mold and the foot roll zone is large, and the cooling rate is high. In the interior, the SDAS is larger due to the slower cooling rate. When the distance from the surface of the slab increases to 115–147.5 mm, the SDAS becomes stable and reaches the maximum value near 125 mm, then decreases slowly.

4. Results and Discussion

4.1. Effect of Alloying Elements on the Solidification Structure of the Slab

The influence of carbon content on the ECR of the billets is shown in Figure 11 [27]. When the carbon content in steel is 0.09%, the peritectic reaction occurs. At this time, the mushy zone is short and the temperature gradient increases sharply, which is conducive to the growth of columnar crystals. When the carbon content in the steel is between 0.1% and 0.53%, δ-Fe is formed by solidification, and the rest of the molten steel is transformed into γ-Fe by the peritectic reaction. Consequently, the Fe-C equilibrium phase diagram can be used to derive ferrite/austenite fractions during solidification by simply applying the lever rule. The ECR reaches the maximum value when the carbon is 0.3%.
The solidification microstructures of general steel are significantly influenced by the carbon content. To further verify the effect of C content on the ECR, the steels with C contents of 0.20 wt%, 0.25 wt%, 0.30 wt%, and 0.35 wt% were numerically simulated. The composition of the simulated steels is shown in Table 5. The nucleation parameters and growth parameters are shown in Table 6. The simulated solidification structures of different steels are shown in Figure 12. The comparison of the simulation results and calculation curves showing the effect of C content on the ECR of the slab are shown in Figure 13. It can be seen that when the carbon content is 0.1657 wt%, 0.2 wt%, 0.25 wt%, 0.3 wt%, 0.35 wt%, and 0.3994 wt%, the ECR is 28.14%, 32.20%, 35.60%, 37.63%, 36.27%, and 26.44%, respectively. This indicates that with the increase in carbon content, the ECR increases at first, then decreases. For alloys with a carbon content of 0.09 wt% to 0.17 wt%, due to the large amount of ferrite, a part of the ferrite remains after the peritectic reaction. At the same time, the amount of austenite is relatively small, so the ECR rapidly increases. With the further increase in carbon content, the ferrite content decreases continuously, and the growth rate of the equiaxed crystal ratio decreases. When the carbon content is about 0.3 wt%, the ECR reaches the maximum value. The austenite content formed by the peritectic reaction increases continuously as the carbon content increases from 0.3 wt% to 0.53 wt%, and the heat flow increases continuously, which promotes the growth of columnar crystals. When the carbon content is about 0.53 wt%, the ECR reaches the lowest value.
Marrero and Galindo [8] used the operation data of the billet caster, such as casting speed, steel temperature, and cooling conditions of the spray zone, to predict the dendrite structure of the solidified steel. For this purpose, semi-empirical equations to calculate primary and secondary arm spacing were derived from uni-directional solidification experiments of steel samples with various compositions, as shown in Equation (15):
λ 1 = R 1 / 4 G 1 / 2 [ 1990 ( % C ) + 380 ( % S i ) 0.221 ( % M n ) 9840 ( % A l ) + 20 ( % N i ) 40 ( % C r )
where λ1 is the PDAS, μm; R is the solidification rate, cm·s−1; and G is the thermal gradient, K·cm−1.
For equiaxed crystals, the PDAS is usually the grain diameter [28]. Therefore, the PDAS is used to describe the grain size of the equiaxed crystal zone of the slab. The corresponding values of the average grain size of the equiaxed crystal zone for each slab are displayed in Figure 14. According to the Equation (15), it is obvious that the addition of C, Si, and Ni increases the PDAS, while the addition of Mn, Al, and Cr decreases the PDAS. C promotes the largest increases in PDAS, whereas Al produces the strongest diminution. As for the role of Si and Mn, it is obvious that the coefficient affecting Si is one order of magnitude larger than that of Mn, indicating that Si has a greater influence on the PDAS than Mn. The average grain size of the S-2 steel is smaller than that of S-1 steel. This is mainly due to the Si content of S-2 steel being less than that of S-1 steel; specifically, it is one-third of that of S-1 steel. The simulation and experimental results show that with the decrease in Si content, the ECR in the slab increases, the number of grains increases, and the average grain radius decreases. Increasing Cr content can increase the ECR, reduce the average grain size, and increase the number of grains. The increase in Mn content serves to increase the ECR. Another important fact worth mentioning is that Mn element has little influence on the average radius of the grains, which is in agreement with some results published by other researchers [15,16].

4.2. Effect of Alloying Elements on Macrosegregation

The comparison of the transverse and longitudinal morphologies of typical defects of experimental steels is shown in Figure 15. The existence of V-segregation can be seen from the cross section of the slabs after pickling. The V-segregation line will occur if (1) equiaxed dendrite crystals grow large even while the molten steel pool remains large, (2) columnar crystals grow to the vicinity of the central axis, and (3) the bridges are not ruptured, thereby functioning as an effective filter against equiaxed dendrite crystals [1]. In this actual production, under the cooling conditions described in this paper, the secondary cooling intensity is large. The casting speed is very stable and the roll spacing is small, which makes the bulging amount small and have little effect on the central segregation. Therefore, the effect of bulging on central segregation is excluded. In a low-carbon steel slab, small V-lines occur in large numbers, probably because the size of the equiaxed dendrite is small, as shown in Figure 16. This is mainly because the solidification temperature range of low-carbon steel is narrower than that of the medium-carbon steel, as shown in Figure 2d. The equiaxed crystals have a short growth period, so that they cannot fully grow.
According to the solidification structure of the slabs, the slab can be divided into three types. In Figure 15 (S-1) (S-3) (S-4), the columnar crystal is tiny and the equiaxed crystal area is wide (about 25%). The columnar crystals occupy about 75% of the area, and there are tiny pipes around the central axis. In Figure 15 (S-2), the average grain size is the smallest, and the equiaxed crystal area is the widest (about 28%); no obvious V-segregation line was observed, and the center porosity is characterized by the absence of pipes around the central axis where a wide porous area is observed. In Figure 15 (S-5), the columnar crystals are seen elongated and merging into branched columnar crystals which extend to the vicinity of the central axis. In addition, cracks along columnar crystals are found on the inner and outer arc sides.
The solid–liquid zone at the solidification front of the slab is called the mushy zone of the slab. The mushy zone is composed of dendrites, which block the liquid flow in the mushy zone. The solutes discharged from the solid phase at the solidification front are macroscopically distributed in the mushy zone, forming the central segregation of the slab. Dendrite arm spacing is the main micro-parameter affecting permeability [29]. The calculation formula for permeability is usually the Kozeny Carman formula [30]:
K P = λ 2 2 × ( 1 f s ) 3 180 × f s 2
where KP represents the permeability of the solid–liquid zone, μm2. For the slab, the solidification front is based on the position of zero strength temperature, which is generally between 20–30 K above the solidus, and the corresponding solid fraction is 0.8 [31]. When the solid fraction is 0.8, the permeability is proportional to the square of the SDAS, as shown in Equation (16). With the increase in the SDAS, the permeability of the mushy zone increases sharply. When the permeability is high, the solute is continuously enriched, which increases macrosegregation.
In general, the dendrite spacing is the vertical distance between dendrites. The dendrite growth morphology and SDAS determine the density and the morphology (columnar crystal and equiaxed crystal) of the solidification structure. The size of the dendrite spacing is closely related to macrosegregation, microcracks, and porosity in the solidification structure. The SDAS curves of different slabs from the slab surface to the center are shown in Figure 16. According to Equation (11), C and Si promote a larger increase in the SDAS, and conversely Al produces the strongest decrease. As for the role of Mn, Ni, and Cr, it is apparent that they have little effect on the SDAS. Although the C content of S-3 steel is higher than that of S-1 steel, the SDASs of S-1 and S-3 steel are basically equal due to the relatively high Si content of S-1 steel. Since the ECR of S-1, S-2, S-3, and S-4 steel are not much different, the main factor affecting the macrosegregation of the slab is the SDAS. The internal quality of the S-2 slab is significantly higher than that of the S-3 slab, which is mainly because smaller SDAS can reduce the frequency of central segregation. When the SDAS is 100-220 μm, the dendrite belongs to a fine dendrite structure with a small dendrite gap and a small volume fraction of enriched solute, which reduce the macrosegregation [32]. The internal quality of the S-1 slab is not much different from that of the S-3 slab, mainly because the SDAS is not much different. Although the ECR of S-3 steel is higher than that of S-1, the grain size of S-1 steel is smaller than that of S-3. For S-4 and S-5 steel, due to the large SDAS, the slab has more serious central segregation, and for S-5 steel, due to its ECR close to 0% and large grain size, the central segregation is most serious.
To quantitatively describe the macrosegregation, the carbon segregation index of the slabs was quantitatively measured by chemical analysis of the drillings, as shown in Figure 17. A carbon–sulfur analyzer was used to obtain the carbon content at different locations in the slabs. The calculation formula for the C segregation index is as follows:
C i = C C 0  
Where C represents the carbon content of the drillings, and C0 is the carbon content of the liquid steel in the tundish.
The comparison of the carbon segregation index between S-1, S-2, and S-3 billets is shown in Figure 18. As shown in Figure 18, the carbon segregation degree ranges from 0.971 to 1.085 and the standard mean deviation is 0.035 for the S-2 slab, and the carbon segregation degree decreases to 0.890–1.077 and the standard mean deviation is 0.042 for the S-3 slab. It can be seen that the carbon segregation at the center of the S-2 slab is 0.972, and the carbon segregation of the S-3 slab is 1.077. In addition, the standard average deviation of the carbon segregation of the S-2 slab is 0.038. This is basically consistent with the results of our previous analysis. The quality rate of the S-1 slab is better than that of the S-3 slab, mainly because the grain size of the S-3 slab is larger. The final results show that decreasing the SDAS and average grain size can improve the central segregation of the slab.

5. Conclusions

The effect of element content on solidification structure, SDAS, average grain size and macrosegregation in continuously cast 295 mm × 2270 mm experimental steels was investigated by physical experiments, numerical simulations, and industrial trials. Based on numerical simulations and experiments, the effect of element content on the solidification process, macrostructure, and SDAS were investigated, and the following conclusions can be obtained.
(1)
The heat transfer model is established and verified by surface temperature measurements and the nail shooting test. Based on the temperature field, the solidification structure of different slabs is simulated, which is in good agreement with the results of macro-etch experiments. The SDAS model for experimental slabs was obtained, and the calculated value of the model is in good agreement with the value obtained through metallographic observation.
(2)
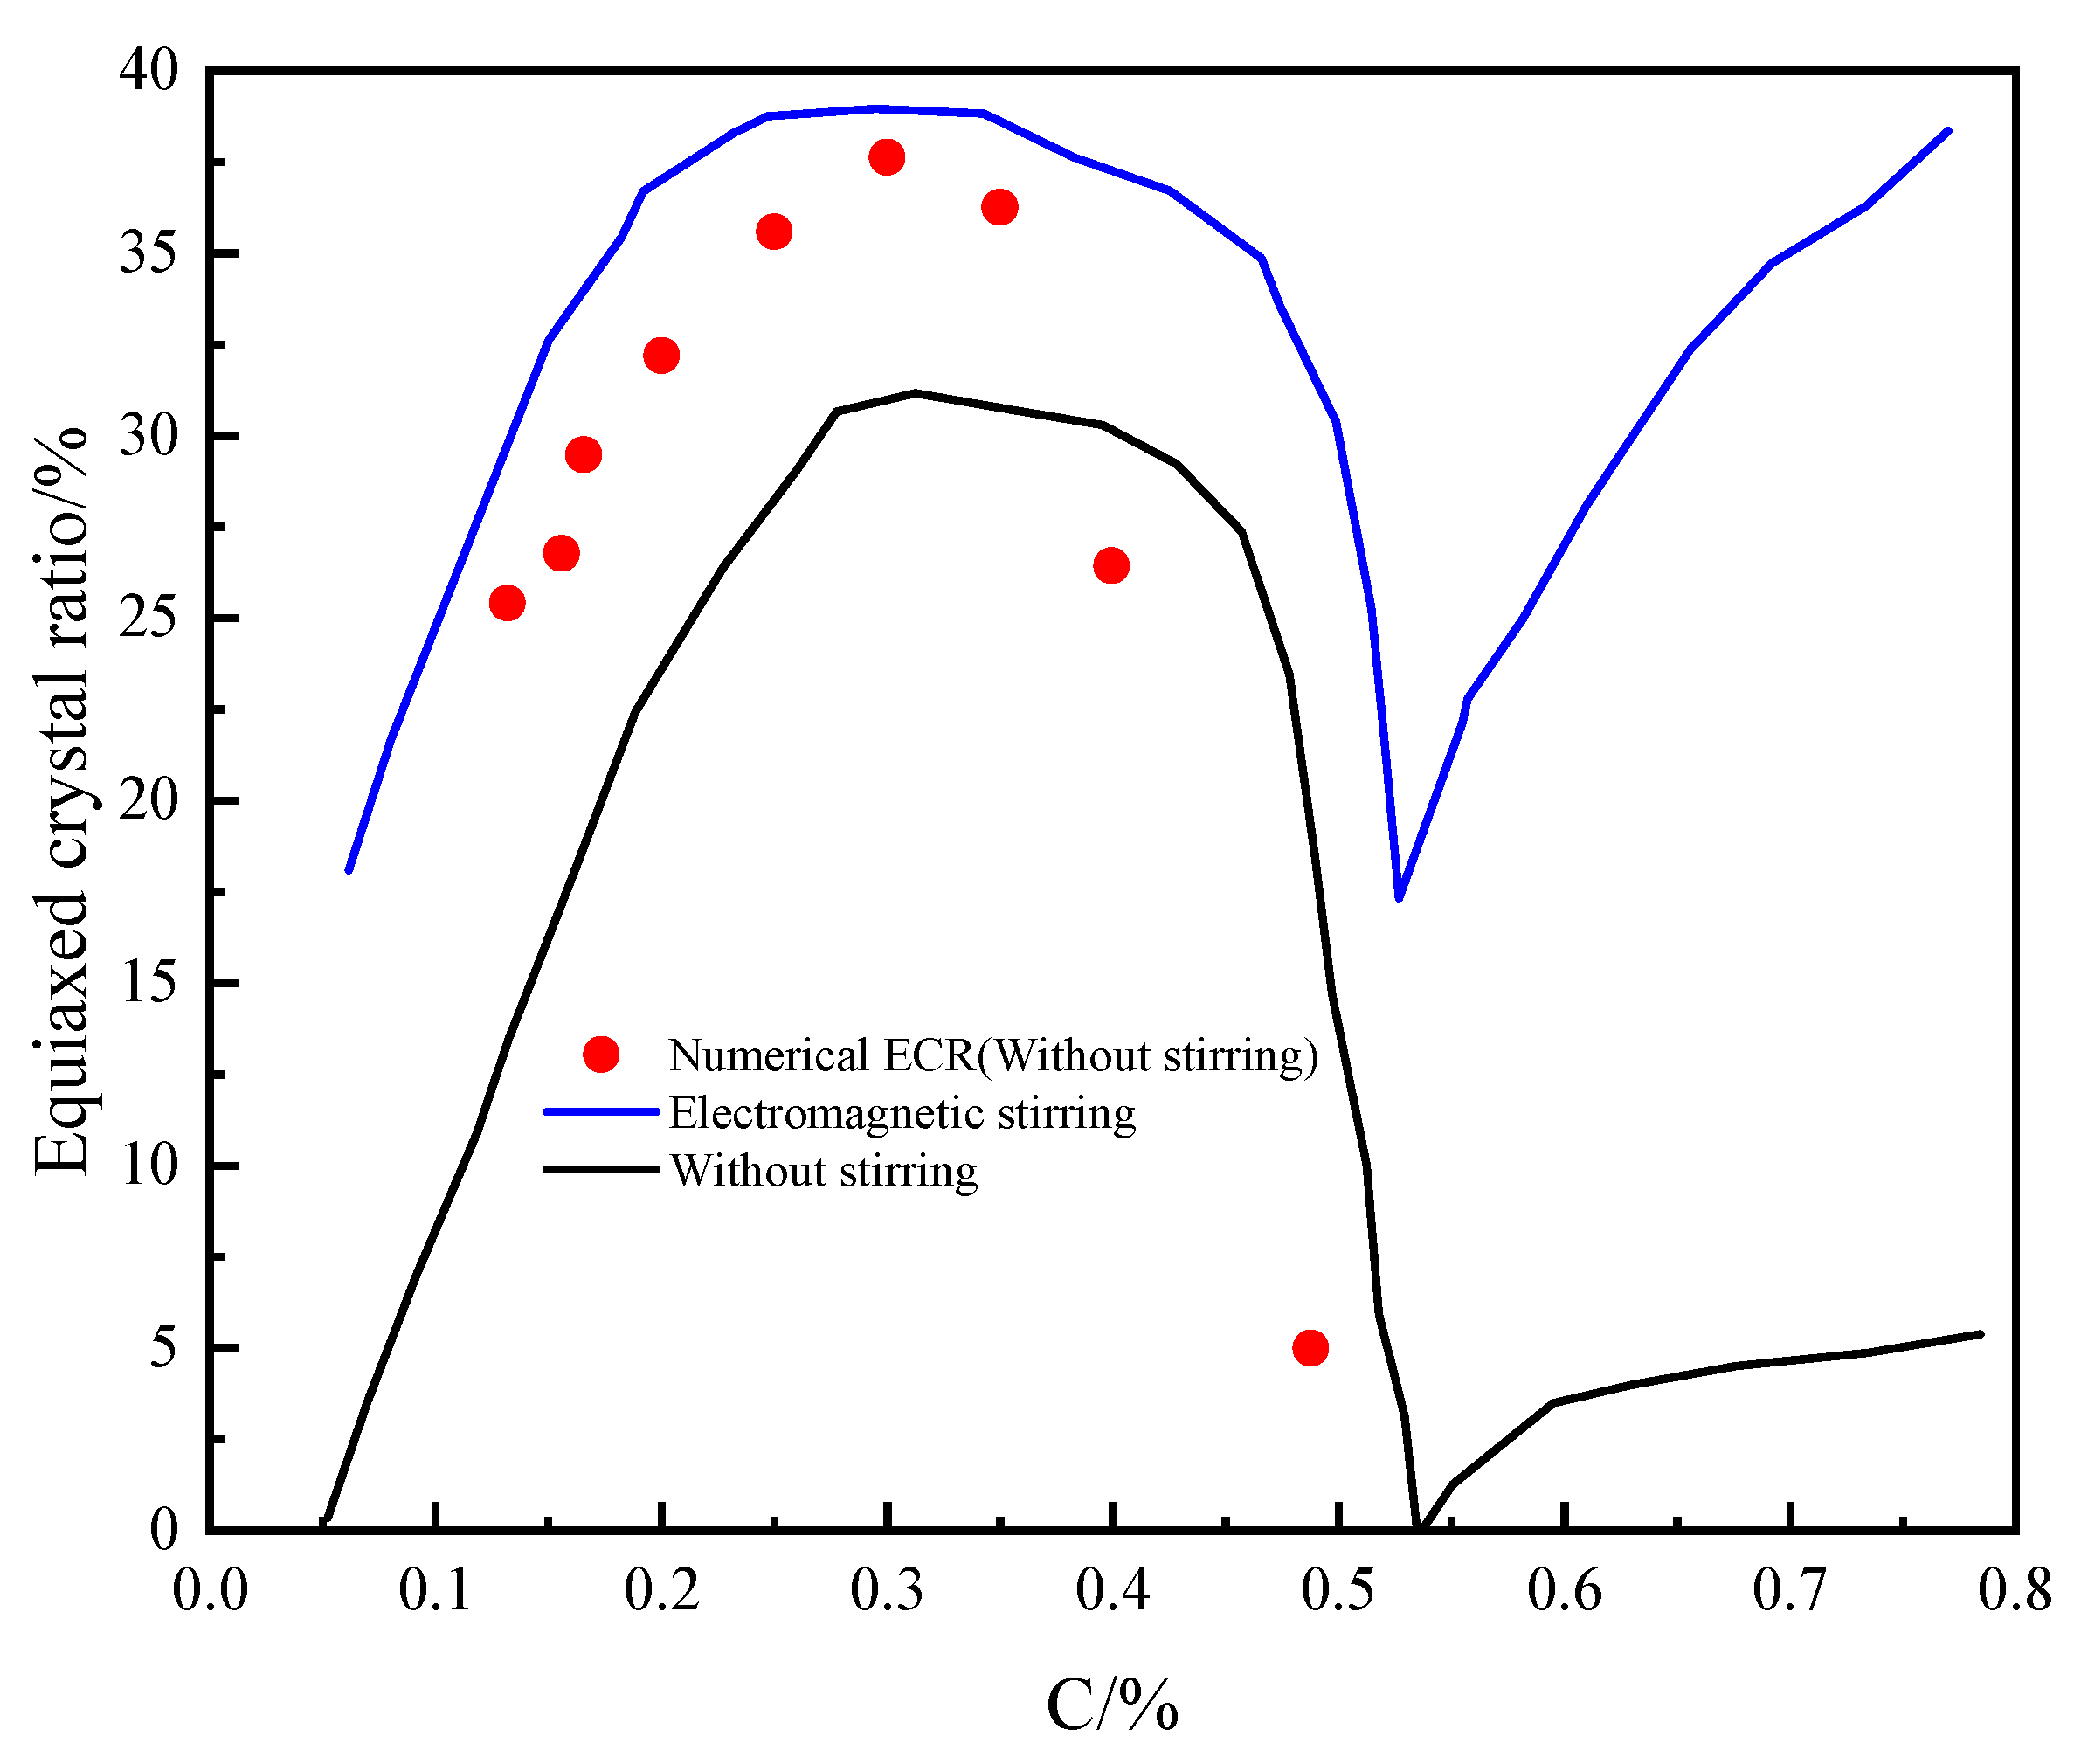
With the increase in carbon content, the ECR increases at first, and then decreases. The ECR reaches the maximum value when the carbon content is 0.3%. When the carbon content is about 0.53 wt%, the equiaxed crystal rate reaches the lowest value. Therefore, in the actual production, within the acceptable range of carbon content, the content of C can be controlled by this rule to improve the ECR.
(3)
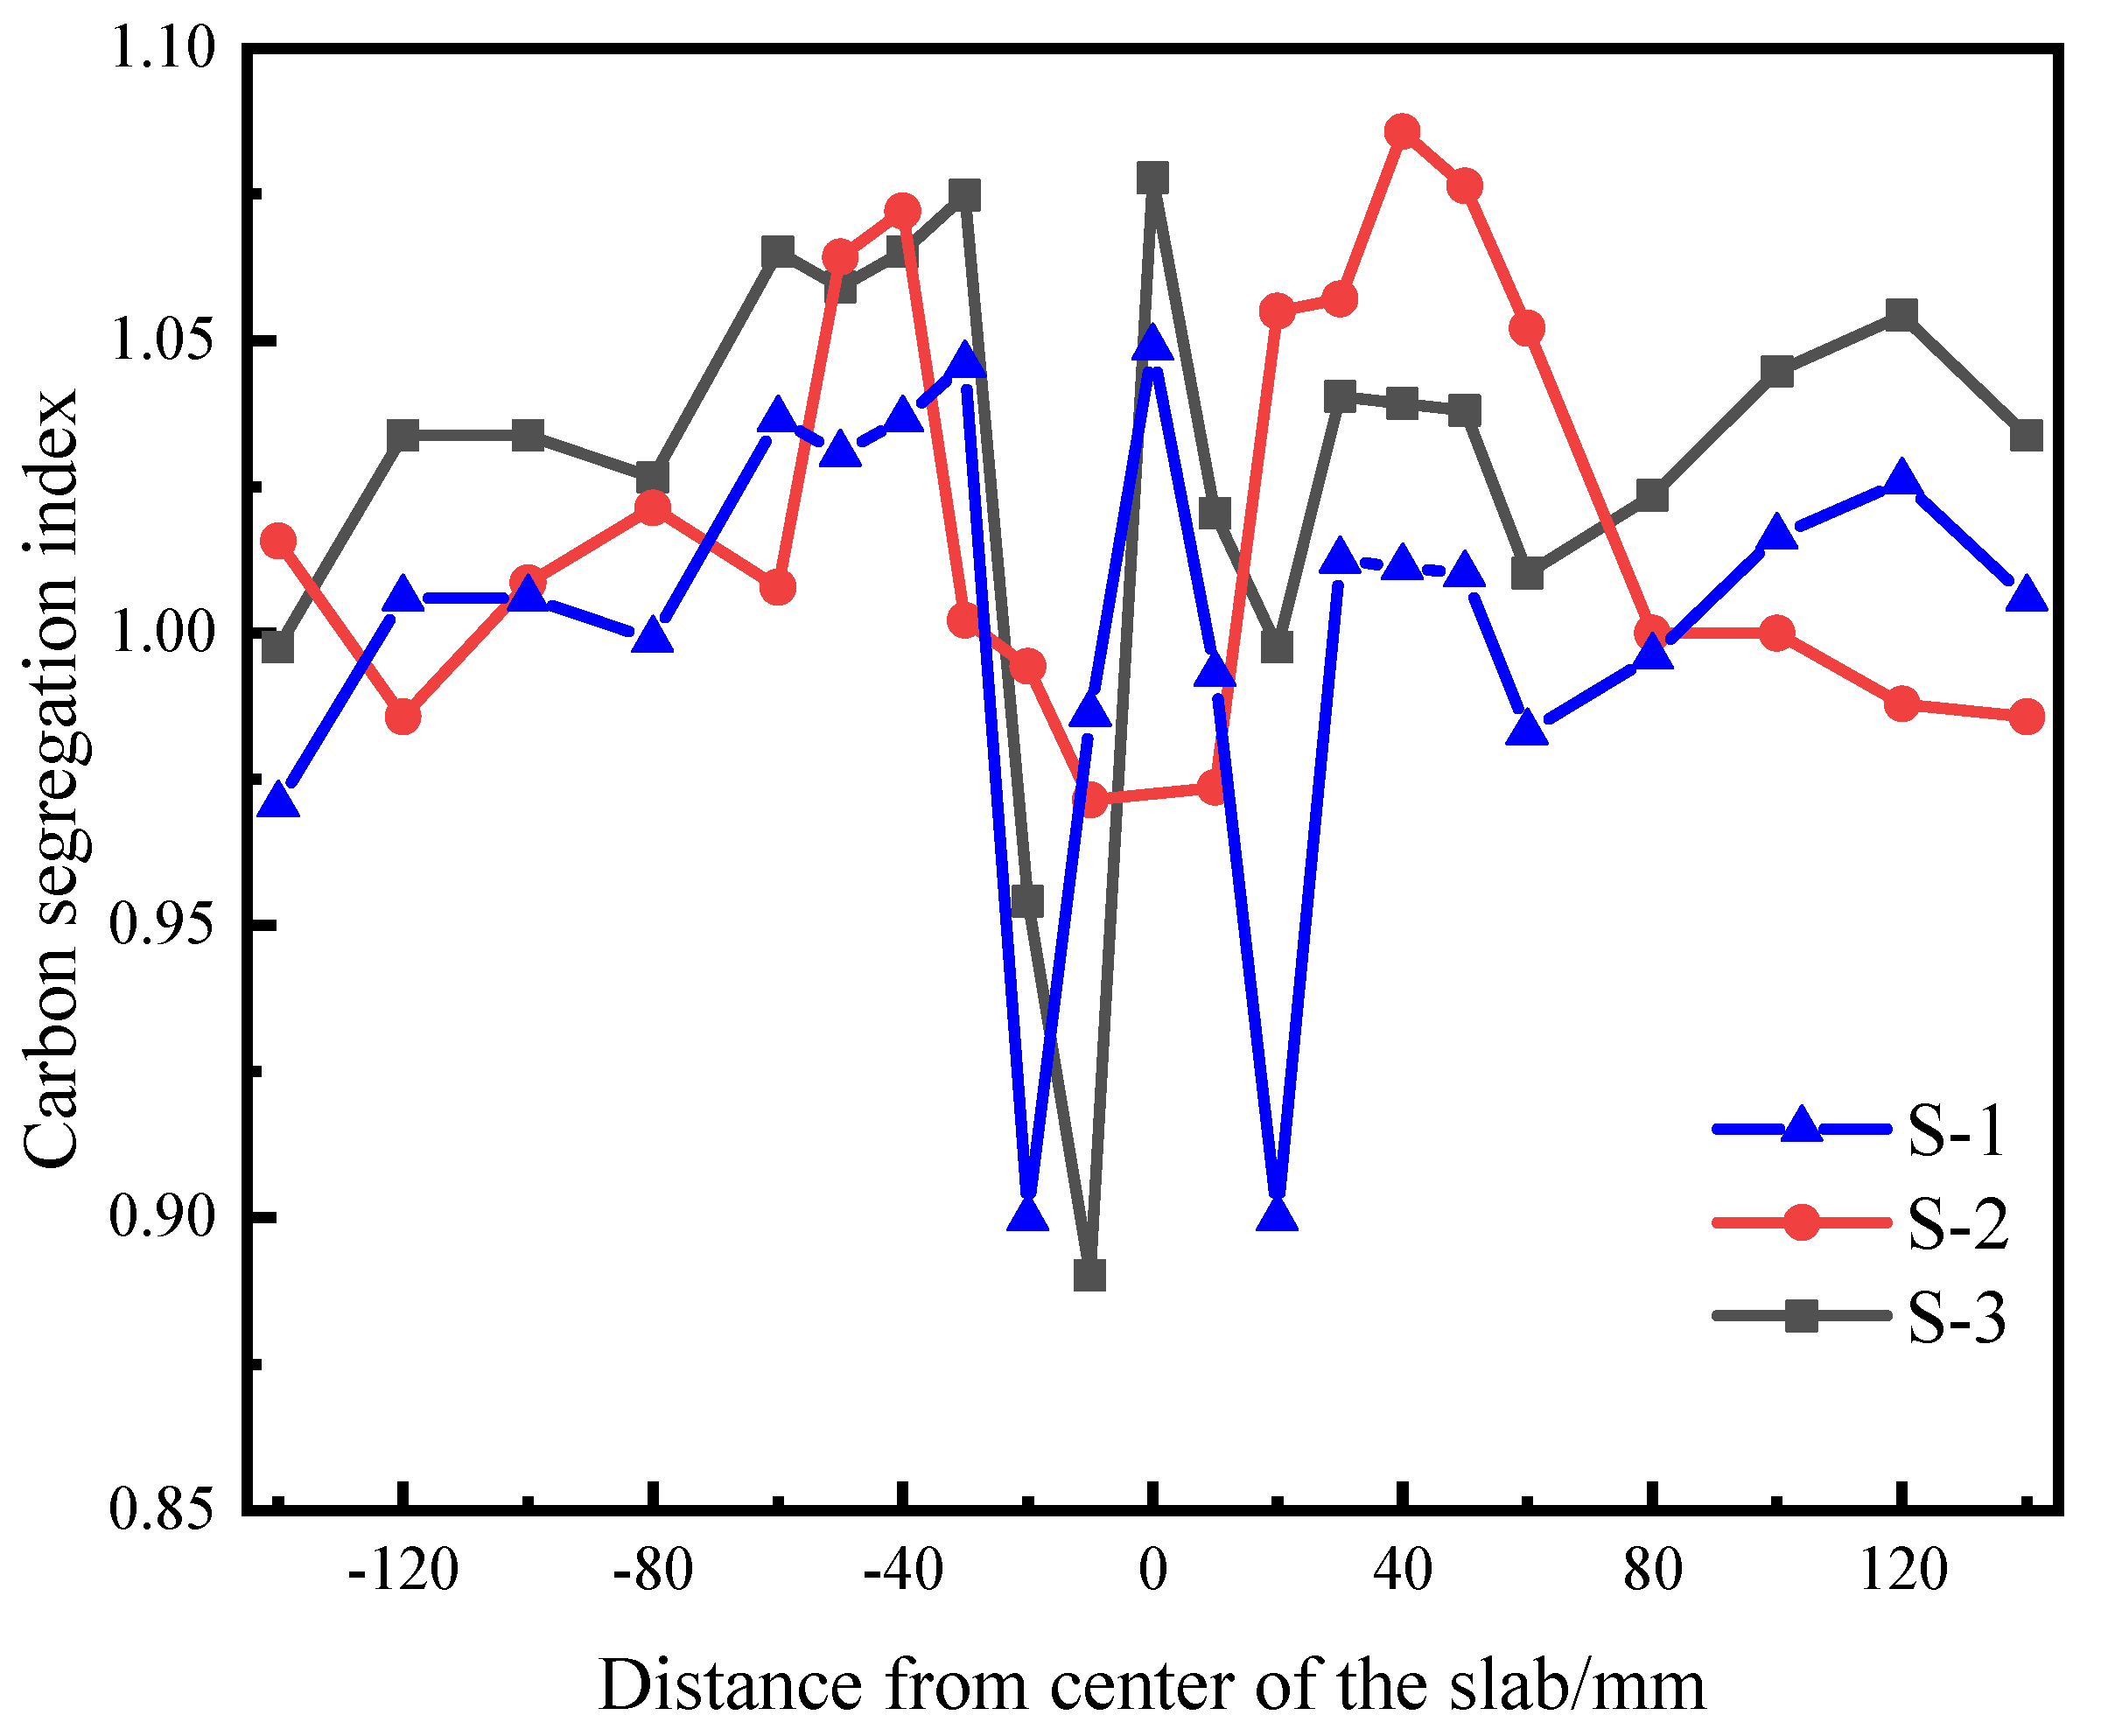
The SDAS increases with the increase in C and Si content. Compared with S-2 steel, the degree of central segregation in S-1 steel is lower. The effect of Si content on SDAS is second only to that of C content. Properly reducing Si content can reduce SDAS and effectively reduce central segregation.
(4)
The average grain size of the equiaxed crystal zone can be expressed by the primary dendrite spacing, which is closely related to the element content. Additions of C, Si, and Ni increase the arm spacing, while additions of Mn, Al, and Cr diminish them. C promotes the largest increases in PDAS, and conversely Al produces the strongest diminution. The grain size of the equiaxed zone can be controlled by controlling the alloying content to reduce the macrosegregation.
(5)
The macrosegregation is closely related to the SDAS, ECR and average grain size. Smaller SDAS can make the solidification structure more compact, and a high ECR and small grain size can reduce macrosegregation.

Author Contributions

Original draft preparation, validation, P.Z.; writing—review and editing, M.W. and L.X.; Conceptualization, M.W.; formal analysis, P.S.; methodology, L.X. All authors have read and agreed to the published version of the manuscript.

Funding

This research received no external funding.

Data Availability Statement

Not applicable.

Conflicts of Interest

The authors declare no conflict of interest.

References

  1. Hisashi, M.; Nobuyoshi, T.; Norio, S.; Masazumi, H. Macrostructure of and Segregation in Continuously Cast Carbon Steel Billets. Trans. Iron Steel Inst. Jpn. 1972, 12, 102–111. [Google Scholar]
  2. Cicutti, C.; Boeri, R. On the relationship between primary and secondary dendrite arm spacing in continuous casting products. Scr. Mater. 2001, 45, 1455–1460. [Google Scholar] [CrossRef]
  3. Ludlow, V.; Normanton, A.; Anderson, A. Strategy to minimize central segregation in high carbon steel grades during billet casting. Ironmak. Steelmak. 2005, 32, 68–74. [Google Scholar] [CrossRef]
  4. Ayata, K.; Mori, T.; Fujimoto, T.; Ohnishi, T.; Wakasugi, I. Improvement of macrosegregation in continuously cast bloom and billet by electromagnetic stirring. Trans. Iron Steel Inst. Jpn. 1984, 24, 931–939. [Google Scholar] [CrossRef]
  5. Imagumbai, M. Relationship between Primary- and Secondary-dendrite Arm Spacing of C-Mn Steel Uni-directionally Solidified in Steady State. ISIJ Int. 1994, 34, 986. [Google Scholar] [CrossRef]
  6. Ayata, K.; Mor, T.; Taniguchi, K.; Matsuda, H. Low superheat teeming with electromagnetic stirring. ISIJ Int. 1995, 35, 680–685. [Google Scholar] [CrossRef]
  7. An, H.; Bao, Y.; Wang, M.; Yang, Q.; Dang, Y. Numerical and experimental investigation of solidification structure evolution and reduction of centre segregation in continuously cast GCr15 bloom. Ironmak. Steelmak. 2020, 47, 1063–1077. [Google Scholar] [CrossRef]
  8. Cabrera-Marrewo, J.M.; Carreno-Galindo, V.; Morales, R.D.; Chávez-Alcalá, F. Macro-micro modeling of the dendritic microstructure of steel billets processed by continuous casting. ISIJ Int. 1998, 38, 812–821. [Google Scholar] [CrossRef]
  9. Weisgerber, B.; Hecht, M.; Harste, K. Investigations of the solidification structure of continuously cast slabs. Steel Res. 1999, 70, 403–411. [Google Scholar] [CrossRef]
  10. Gao, X.; Yang, S.; Li, J. Effects of micro-alloying elements and continuous casting parameters on reducing segregation in continuously cast slab. Mater. Des. 2016, 110, 284–295. [Google Scholar] [CrossRef]
  11. Wang, W.; Ji, C.; Luo, S.; Zhu, M. Modeling of dendritic evolution of continuously cast steel billet with cellular automaton. Metall. Mater. Trans. B 2017, 49, 200–212. [Google Scholar] [CrossRef]
  12. Jing, C.L.; Wang, X.H.; Jiang, M. Study on solidification structure of wheel steel round billet using FE-CA coupling model. Steel Res. Int. 2011, 82, 1173–1178. [Google Scholar] [CrossRef]
  13. Wang, Q.; Yan, H.; Wang, F.; Li, B. Impact of electromagnetic stirring on grain structure of electroslag remelting ingot. JOM 2015, 67, 1821–1829. [Google Scholar] [CrossRef]
  14. Pierer, R.; Bernhard, C. On the influence of carbon on secondary dendrite arm spacing in steel. J. Mater. Sci. 2008, 43, 6938–6943. [Google Scholar] [CrossRef]
  15. Bai, L.; Liu, H.; Zhang, Y.; Miao, X.; Ruan, X. Numerical simulation of the microstructure of 22CrMoH billets and the effects of alloying elements. Chinese J. Eng. 2011, 33, 1091–1098. [Google Scholar] [CrossRef]
  16. Han, L.; Feng, Y.; Wu, H.; Chen, Z. Numerical simulation of effects of alloying elements on solidification structure of 20CrMnTi billets. Iron Steel 2016, 51, 36–42. [Google Scholar]
  17. Lally, B.; Biegler, L.; Henein, H. Finite difference heat transfer modeling for continuous casting. Metall. Mater. Trans. B 1990, 21, 761–770. [Google Scholar] [CrossRef]
  18. Rappaz, M.; Gandin, C.A. Probabilistic modelling of microstructure formation in solidification processes. Acta Metall. Mater. 1993, 41, 345–360. [Google Scholar] [CrossRef]
  19. Kurz, W.; Giovanola, B.; Trivedi, R. Theory of microstructural development during rapid solidification. Acta Metallurgica. 1986, 34, 823–830. [Google Scholar] [CrossRef]
  20. Kurz, W.; Fisher, D.J. Fundaments of Solidification, 4th revised ed.; Trans Tech Publishers: Aedermannsdorf, Switzerland, 1998; p. 77. [Google Scholar]
  21. Bai, L.; Wang, B.; Zhong, H.; Ni, J.; Zhai, Q.; Zhang, J. Experimental and numerical simulations of the solidification process in continuous casting of slab. Metals 2016, 6, 53. [Google Scholar] [CrossRef] [Green Version]
  22. Li, W.C. Metallurgy and Physical Chemistry of Materials; Metallurgical Industry Press: Beijing, China, 2001; pp. 531–533. (In Chinese) [Google Scholar]
  23. Fang, Q.; Ni, H.W.; Zhang, H.; Wang, B.; Lv, Z.A. The effects of a submerged entry nozzle on flow and initial solidification in a continuous casting bloom mold with electromagnetic stirring. Metals 2017, 7, 146. [Google Scholar] [CrossRef] [Green Version]
  24. Pequet, C.; Rappaz, M.; Gremaud, M. Modeling of microporosity, macroporosity, and pipe-shrinkage formation during the solidification of alloys using a mushy-zone refinement method: Applications to aluminum alloys. Metall. Mater. Trans. A 2002, 33, 2095–2106. [Google Scholar] [CrossRef]
  25. Savage, J.; Pritchard, W.H. The problem of rupture of the billet in the continuous casting of steel. J. Iron Steel Inst. 1954, 178, 269–277. [Google Scholar]
  26. Hardin, R.A.; Liu, K.; Beckermann, C.; Kapoor, A. A transient simulation and dynamic spray cooling control model for continuous steel casting. Metall. Mater. Trans. B 2003, 34, 297–306. [Google Scholar] [CrossRef]
  27. Cai, K. Quality Control of Continuous Casting Billet; Metallurgical Industry Press: Beijing, China, 2010; pp. 279–282. (In Chinese) [Google Scholar]
  28. Hu, H.Q. Metal Solidification Principle; Machine Press: Beijing, China, 2000; pp. 131–133. (In Chinese) [Google Scholar]
  29. Yoo, H.; Viskanta, R. Effect of anisotropic permeability on the transport process during solidification of binary a mixture. Int. J. Heat Mass Transf. 1992, 35, 2335. [Google Scholar] [CrossRef]
  30. Piorier, D.R. Permeability for flow of dendritic liquid in columnar dendrite alloys. Metall. Trans. B 1987, 18, 245. [Google Scholar] [CrossRef]
  31. Cornelissen, M.C.M. Mathematical model for solidification of multicomponent alloys. Ironmak. Steelmak. 1986, 13, 204–212. [Google Scholar]
  32. Shen, H.F.; Beckermann, C. Experimental study on the mush deformation and solute redistribution. Acta Metall. Sin. 2002, 38, 352–358. [Google Scholar]
Figure 1. Information about geometric model.
Metals 12 01826 g001
Figure 2. Variations in the thermo−physical parameters of steels with temperature: (a) thermal conductivity; (b) enthalpy; (c) density; (d) solid fraction.
Metals 12 01826 g002
Figure 3. Nail shooting position.
Metals 12 01826 g003
Figure 4. Photographs of sulfur printing samples for nail shooting experiments on S-4 steel: (a) The end of segment 8; (b) the end of segment 9; (c) the end of segment 10.
Metals 12 01826 g004
Figure 5. Comparison of the calculated temperature of the slab narrow side center and of the shell thickness with measured values.
Metals 12 01826 g005
Figure 6. Comparison of numerical and experimental structures of S-1 steel.
Metals 12 01826 g006
Figure 7. Comparison of the numerical and experimental structures of S-5 steel: (a) simulated solidification structure (b) experimental solidification structure
Metals 12 01826 g007
Figure 8. Schematic diagram: Samples for SDAS.
Metals 12 01826 g008
Figure 9. Dendritic microstructure from surface to center in bloom cross-section for S-4 and S-5, (a) S-4, 10 mm, (b) S-4, 40 mm, (c) S-5, 100 mm, (d) S-5, 120 mm.
Metals 12 01826 g009
Figure 10. Comparison between calculated and measured SDAS: (a) S-4; (b) S-5.
Metals 12 01826 g010
Figure 11. Effect of carbon content on the equiaxed grain ratio of billets [27].
Metals 12 01826 g011
Figure 12. The simulated solidification structures of different slabs: (a) S-3; (b) C-0.20; (c) C-0.25; (d) C-0.30; (e) C-0.35.
Metals 12 01826 g012
Figure 13. Comparison of simulation results and calculation curves showing the effect of C content on the slab ECR.
Metals 12 01826 g013
Figure 14. Average grain size of the equiaxed zone of different steels.
Metals 12 01826 g014
Figure 15. Central segregation rating of 295 × 2270 mm steel slabs: (a) S-1; (b) S-2; (c) S-3; (d) S-4; (e) S-5.
Metals 12 01826 g015
Figure 16. SDAS at different positions from the slab surface of different slabs.
Metals 12 01826 g016
Figure 17. Carbon segregation sampling schematic.
Metals 12 01826 g017
Figure 18. Comparison of carbon segregation index between the S−1, S−2, and S−3 slab.
Metals 12 01826 g018
Table 1. Chemical compositions (mass%) of the slab under investigation.
SteelCSiMnPSCrAl
S-10.13190.36391.47670.01820.0021\\
S-20.15570.13260.55480.01680.0039\\
S-30.16570.28021.45030.01840.0026\\
S-40.39940.30711.46040.01980.00271.90.0153
S-50.48780.20560.53080.01450.00260.02150.0189
Table 2. Nucleation parameters of CAFE model.
ParametersΔTS (K)ΔTS,σ (K)nSΔTV (K)ΔTV,σ (K)nVα2α3Liquidus (°C)Solidus (°C)
S-110.11 × 1082.513.0 × 1092.022 × 10−69.413 × 10−615131477
S-210.11 × 1081.913.0 × 1095.227 × 10−61.630 × 10−515191483
S-310.11 × 1082.613.0 × 1092.645 × 10−68.105 × 10−615111473
S-410.11 × 1084.013.0 × 1091.551 × 10−61.412 × 10−614881431
S-510.11 × 1085.013.0 × 1091.639 × 10−61.189 × 10−614891424
Table 3. Liquidus slope, solute partition coefficient, diffusion coefficient, and Gibbs–Thompson coefficient of binary Fe-X steels.
Steel ElementCSiMnPSCrAl
Parameters
S-1k0.160.580.720.330.045//
m/K·(wt.%)−1−84.78−17.37−5.1−29.09−44.16//
S-2k−79.80.16−5.2−27.2−38.0/4.0
m/K·(wt.%)−10.170.600.720.290.03/1.13
S-3k−80.7−16.7−5.2−28.4−38.4//
m/K·(wt.%)−10.160.560.710.260.03//
S-4k−87.2−16.7−5.3−32.3−44.9−1.75.0
m/K·(wt.%)−10.160.610.710.250.060.891.22
S-5k−88.1−17.2−5.2−30.8−48.4/3.9
m/K·(wt.%)−10.170.600.700.300.05/1.19
AllD × 10−9/ m2·s−1113.52.41.93.93.03.0
Γ/m·K3 × 10−7
Table 4. Parameters and relevant computational formulas at different sections of the secondary cooling zone.
Secondary Cooling ZoneLength, mWater Flow Rate, L·min−1Computational Formula
Foot roller section (W)0.2972.6hf = α·[581W0.541(1 − 0.0075TW)
Foot roller section (N)0.89182.7
L23.45174.2hk = γ·(130 + 350W)
L31.87123.5
L42.1466
L52.1331
L69.266.2
L72.3628.5
L822.6868.75
Air cooling zone /qa = εσ(T4Ta4)ε = 0.85/(1 + exp(42.68 − 0.02682Ts)0.0115) [26]
Table 5. Chemical compositions (mass%) of simulated steel.
SteelCSiMnPS
C-0.200.20.28021.45030.01840.0026
C-0.250.250.28021.45030.01840.0026
C-0.300.30.28021.45030.01840.0026
C-0.350.350.28021.45030.01840.0026
Table 6. Nucleation parameters of CAFE model.
ParametersΔTS (K)ΔTS,σ (K)nSΔTV (K)ΔTV,σ (K)nVα2α3
C-0.210.11 × 1082.813.0 × 1092.652 × 10−66.300 × 10⁻⁶
C-0.2510.11 × 1083.013.0 × 1092.572 × 10−64.535 × 10⁻⁵
C-0.3010.11 × 1083.213.0 × 1092.412 × 10−63.402 × 10⁻⁶
C-0.3510.11 × 1083.413.0 × 1092.230 × 10−62.634 × 10⁻⁶
Publisher’s Note: MDPI stays neutral with regard to jurisdictional claims in published maps and institutional affiliations.

