Article

Assessment of Transfer Learning Capabilities for Fatigue Damage Classification and Detection in Aluminum Specimens with Different Notch Geometries

by
Susheel Dharmadhikari
1,†,
Riddhiman Raut
1,†,
Chandrachur Bhattacharya
1,
Asok Ray
2 and
Amrita Basak
1,*
1
Department of Mechanical Engineering, The Pennsylvania State University, University Park, PA 16802, USA
2
Department of Mechanical Engineering and Mathematics, The Pennsylvania State University, University Park, PA 16802, USA
*
Author to whom correspondence should be addressed.
These authors contributed equally to this work.
Metals 2022, 12(11), 1849; https://doi.org/10.3390/met12111849
Submission received: 3 September 2022 / Revised: 17 October 2022 / Accepted: 21 October 2022 / Published: 29 October 2022
(This article belongs to the Special Issue Fatigue Behavior and Crack Mechanism of Metals and Alloys)

Abstract

:
Fatigue damage detection and its classification in metallic materials are persistently challenging the structural health monitoring community. The mechanics of fatigue damage is difficult to analyze and is further complicated because of the presence of notches of different geometries. These notches act as possible crack-nucleation sites resulting in failure mechanisms that are drastically different from one another. Often, sensor-based tools are used to monitor and detect fatigue damage in critical metallic materials such as aluminum alloys. Through deep neural networks (DNNs), such a sensor-based approach can be ubiquitously extended for a variety of geometries as appropriate for different applications. To that end, this paper presents a DNN-based transfer learning framework that can be used to classify and detect fatigue damage across candidate notch geometries. The DNNs are built upon ultrasonic time-series data obtained during fatigue testing of Al7075-T6 specimens with two types of notch geometries, namely, a U-notch and a V-notch. The baseline U-notch DNN is shown to achieve an accuracy of 96.1% while the baseline V-notch DNN has an accuracy of 95.8%. Both baseline DNNs are, thereafter, subjected to a transfer learning process by keeping a certain number of layers frozen and retraining only the remaining layers with a small volume of data obtained from the other notch geometry. When a layer of the baseline U-notch DNN is retrained with just 10% of the total V-notch data, an accuracy above 90% is observed for fatigue damage detection of V-notch specimens. Similar results are also obtained when the baseline V-notch DNN is retrained and interrogated to detect damage for U-notch specimens. These results, in summary, demonstrate the data-thrifty quality of combining the concepts of transfer learning and DNN for fatigue damage detection in different geometries of specimens made of high-performance aluminum alloys.

1. Introduction

Ultrasonic sensors are often employed for structural health monitoring (SHM) for metallic components [1]. Single-transducer ultrasonic sensors emit sound waves at very high frequencies. The sound waves are reflected back from the boundaries of the objects or internal flaws. By comparing the original emitted wave with the reflected wave, appropriate analysis can be performed to understand the flaw characteristics. A dual-configuration ultrasonic sensor has a transmitter and a receiver. The transmitter emits sound waves while the receiver captures them. Compared to other non-destructive SHM sensors such as strain gauges [2], acoustic transducers [3], eddy current [4], etc., ultrasonic sensors [5] have been observed to detect flaws with greater precision and accuracy. The accuracy and precision of detection are, however, a strong function of the ultrasonic frequency [1]. A higher frequency would improve the detection capability with respect to the flaw size, however, the span of detection would be compromised.
During fatigue testing, ultrasonic transducers typically provide data in the form a time-series that possess the information of internal flaws or defects or crack [5]. In order to calibrate this data, a secondary sensor, e.g., an optical microscope is required. The visual information obtained from the microscope appropriately segregates the time-series data into ‘healthy’ and ‘cracked’ regimes. Such a segregated data, thereafter, can be processed using sophisticated time-series data analysis methods such as finite state automata, neural networks, etc. to develop damage detection models. Gupta et al. [6] performed fatigue testing using high-frequency ultrasonics, calibrated the time series data using an optical microscope, and used probabilistic finite state automata (PFSA) to develop a damage detection model. Ghalyan et al. [7] used Symbolic Time Series Analysis built upon a property of measure-preserving transformation sequence to detect fatigue damages in Al7075-T6. Bhattacharya et al. [8] modified the PFSA method and showed that the modified PFSA was able to detect the emergence of cracks with 95% accuracy. More recently, Dharmadhikari et al. [5] used deep neural network (DNN) to process the ultrasonic time-series data and obtained a damage detection accuracy of 98.94%. However, all these experiments have so far been conducted on Al7075-T6 specimens with a fixed notch geometry. For a new specimen geometry, the framework would again require new data as shown in Figure 1a.
DNNs are usually trained with a large amount of data. A relatively recent technique, called Transfer Learning, is hypothesized to circumvent this problem of enormous data requirement. Transfer learning [9] has received significant attention with applications to fatigue damage and broadly to structural health monitoring. With several pre-trained networks available in the public domain, these applications have often seen a bias toward convolutional neural network (CNN)-based architectures. Munawar et al. [10] reviewed the recent trends in image-based crack detection and commented on the focus of transfer learning in CNN-based approaches. Through AlexNet, VGGNet13, and ResNet18, Yang et al. [11], successfully demonstrated the efficacy of crack detection for different structures. Similarly, Dung et al. [12] successfully showed the application of VGGNet13 in detecting cracks on welded joints of steel bridges. Che et al. [13] studied the applications of transfer learning for different loading conditions to detect damage in roller bearings. Li et al. [14] applied transfer learning to train models to detect gear pitting for varied working conditions. A number of transfer learning studies with CNNs, autoencoders, and several other methods for fault diagnosis have been reported on the bearing dataset from the Case Western Reserve University [9,14,15,16,17].
The goal of this research article is to develop a transfer learning framework to enable fatigue damage detection of Al7075-T6 specimens having two different notch geometries, namely, a U-notch and a V-notch (Figure 1b). The central hypothesis is that the ultrasonic transducers are agnostic to the notch type—as soon as a crack reaches the size of detection, the ultrasonic signals would show an attenuation behavior. Hence, a damage detection framework, such as a DNN, developed using Al7075-T6 U-notch data is expected to carry similar signatures like Al7075-T6 V-notch and vice versa. To test this hypothesis, in this article, American Society for Testing and Materials (ASTM) standard Al7075-T6 U- and V-notch specimens are tested on a custom fatigue testing apparatus. The apparatus is integrated with a confocal microscope and the specimens are instrumented with a pair of ultrasonic transducers. The time-series data from the ultrasonic transducers are continuously recorded during fatigue testing using a data acquisition system. Using the information obtained from the confocal microscope, the set of time-series data is segmented into ‘healthy’ and ‘cracked’ regimes. Fifteen Al7075 U-notch specimens and fifteen Al7075-T6 V-notch specimens are tested. On an average, the U-notch specimens exhibit a fatigue life of 41,681 ± 11,737 while the V-notch specimens show a fatigue life of 56,057 ± 14,822 making them ideal candidates for a transfer learning study.
Using the Al7075 segmented data, baseline DNNs are trained for each specimen geometry. Retraining is performed by using a fraction of the data from one geometry to develop a DNN for the other. To understand the effects of retraining, a parametric analysis is conducted by varying the percentage of data used for retraining and the number of retrained layers. The observations from the analysis reveal that the baseline DNNs can reach accuracies above 95% for both specimen geometries. By increasing the amount of data, the accuracy in retraining increases gradually, eventually achieving the baseline DNN performance. By looking at the extreme cases, it is observed that, when DNN layers of the baseline U-notch DNN is retrained with just 10% of the total V-notch data, an accuracy above 90% is observed for fatigue damage detection of V-notch specimens. Similar results are also obtained when the baseline V-notch DNN is retrained and interrogated to make detection for U-notch specimens.
The paper is organized into five sections including the present one. Section 2 succinctly describes the test apparatus and the experimental protocol, followed by a comprehensive description of the data set. Section 3 briefly describes the design of DNNs for this study, and explains the architecture of the transfer learning framework. Section 4 presents and discusses the pertinent results. The paper is summarized and concluded in Section 5 along with recommendations for future research.

2. Experimental Method

2.1. Fatigue Testing

Figure 2a,b depicts the design of the two sets of (ASTM Standard E466) test specimens that are used in this study. These two types of specimens have different notch geometries, namely, a U-notch and a V-notch. All specimens are made of high-strength aluminum alloy Al7075-T6 acquired from McMaster-Carr. Al7075-T6 has an ultimate tensile strength of 572 MPa, tensile yield strength of 503 MPa, fatigue strength of 159 MPa, and fracture toughness of 29 MPa-m1/2. For each type of notch geometry, a total of 15 specimens have been tested by following an experimental protocol that is very briefly summarized in this paper for completeness. The details can be found in previous publications by Dharmadhikari et al. [18,19]. Figure 2c depicts the fatigue testing apparatus. The apparatus is built upon a computer-controlled and computer-instrumented 25 kN fatigue-testing machine (Manufacturer: MTS®, Berlin, NJ, USA), which is equipped with ultrasonic sensors (Manufacturer: OLYMPUS®, Shinjuku, Tokyo, Japan) for the generation of ultrasonic time-series data and a confocal microscope (Manufacturer: Alicona Imaging GmbH, Dr.-Auner-Strasse 21a, 8074 Raaba/Graz, Austria) mounted on a moving stage (Manufacturer: Aerodyne Research, LLC 1725 Lexington Avenue, Deland, FL, USA) for capturing the surface images of the specimens while being tested.
The specimens are mounted on the fatigue testing machine using custom grips and are subjected to a periodic tensile-tensile fatigue loading with a mean load of 3 kN and a stress ratio (i.e., minimum stress divided by maximum stress) of 0.5 at a frequency of 20 Hz. The maximum stress (nominal) induced in the specimens is 109.2 MPa. Since the cross sectional area for all the specimens is the same across the two geometries, the maximum nominal stress induced is the same. However, due to the stress concentrations, both sets of specimens show different instances of crack initiation and fatigue lives. On average, the V-notch specimens, exhibit a longer fatigue life of 56,057 cycles as compared to 41,681 cycles by the U-notch. The crack detection by the confocal microscope is achieved on an average at the 25,500th cycle (45% of the fatigue life) for the V-notch, and at 15,500th cycle (37% of the fatigue life) for the U-notch. Owing to this distribution of the fatigue life, the experiments can be termed as operating in the medium to high cycle fatigue domain. Experimental data are collected during the testing phase from the confocal microscope and ultrasonic sensors. The tests are conducted through an MTS controller using an automated routine from the Multi-Purpose TestWare® software suite. The ultrasonic transmitter and receiver have been placed at fixed locations for all experiments on the specimens. The ultrasonic sensors have a base frequency of 10 MHz and are sampled at 100 MHz.

2.2. Binary Classification of the Ultrasonic Time-Series Data Using Confocal Microscope

During the experiments, ultrasonic signals are continuously recorded until specimen failure. For both types of specimen, roughly 30,000 signals are collected per specimen. When these signals are concatenated together sequentially, a visible attenuation is observed as shown in Figure 3a,b for both types of specimen. However, the exact instance of crack appearance cannot be determined solely with the ultrasonic signals. Additional information is, therefore, needed to corroborate the failure.
The confocal microscope is focused on the notch root [18]. The microscope can reliably detect a crack that has a resolution of 3 μm in the form of a crack opening displacement. During the experiment, through continuous monitoring, the microscope can identify the exact instance of emergence of a short crack in the fatigue damage process as shown in Figure 3c–e. By mapping this information of crack emergence to the ultrasonic signals, a clear bifurcation between a ‘healthy’ and ‘cracked’ state can be established. Accordingly, the two representative ultrasonic signals from Figure 3a,b are now shown with ‘healthy’ and ‘cracked’ labels in Figure 3f,g. In Figure 3g, the sudden drop (or break) in the signal at the point of bifurcation is a random occurrence. Similar breaks are also seen before the bifurcation and cannot be correlated to the occurrence of the crack (or the detection therein). A total of 458,655 signals are accrued through the testing of 15 U-notch specimens. For labeled data, the distribution of the signals between the two classes is well balanced, with 45% healthy and 55% cracked signals. Similarly, a total of 448,939 signals are accrued through the testing of 15 V-notch specimens. For labeled data, the distribution of the signals between the two classes is well balanced, with 45% healthy and 55% cracked signals.

3. Design of Deep Neural Networks (DNNs) and Transfer Learning Methodology

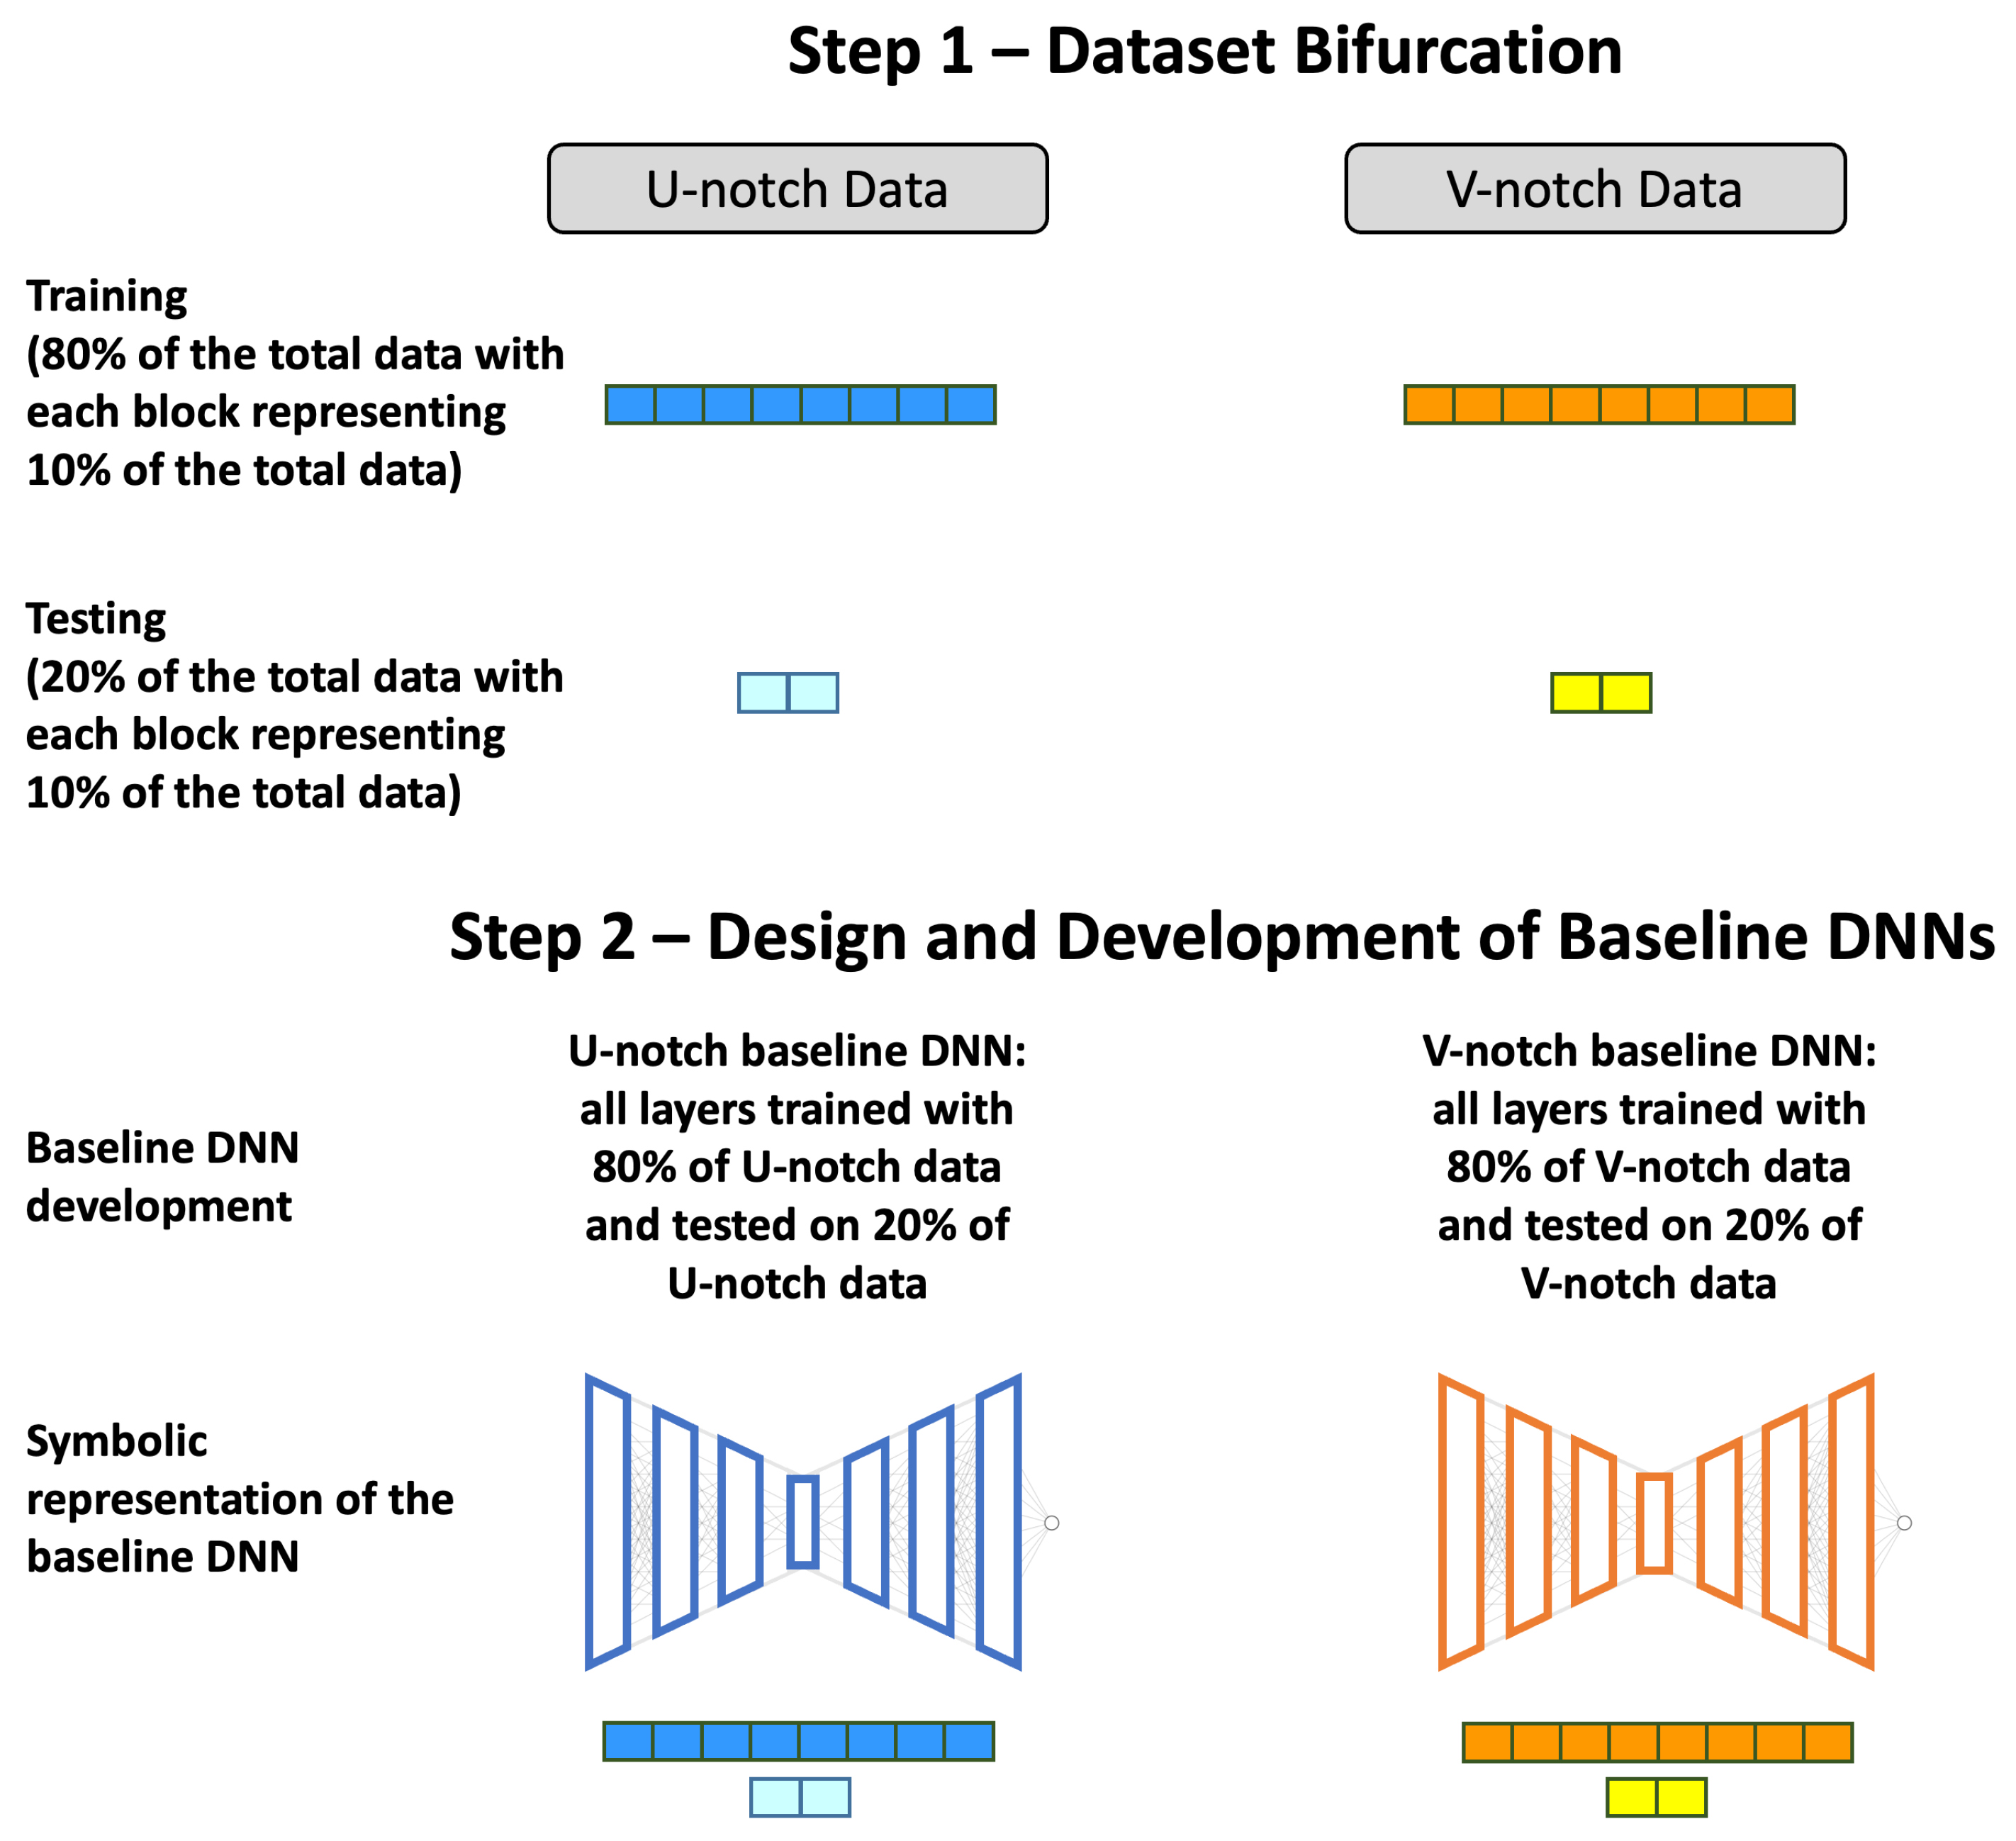
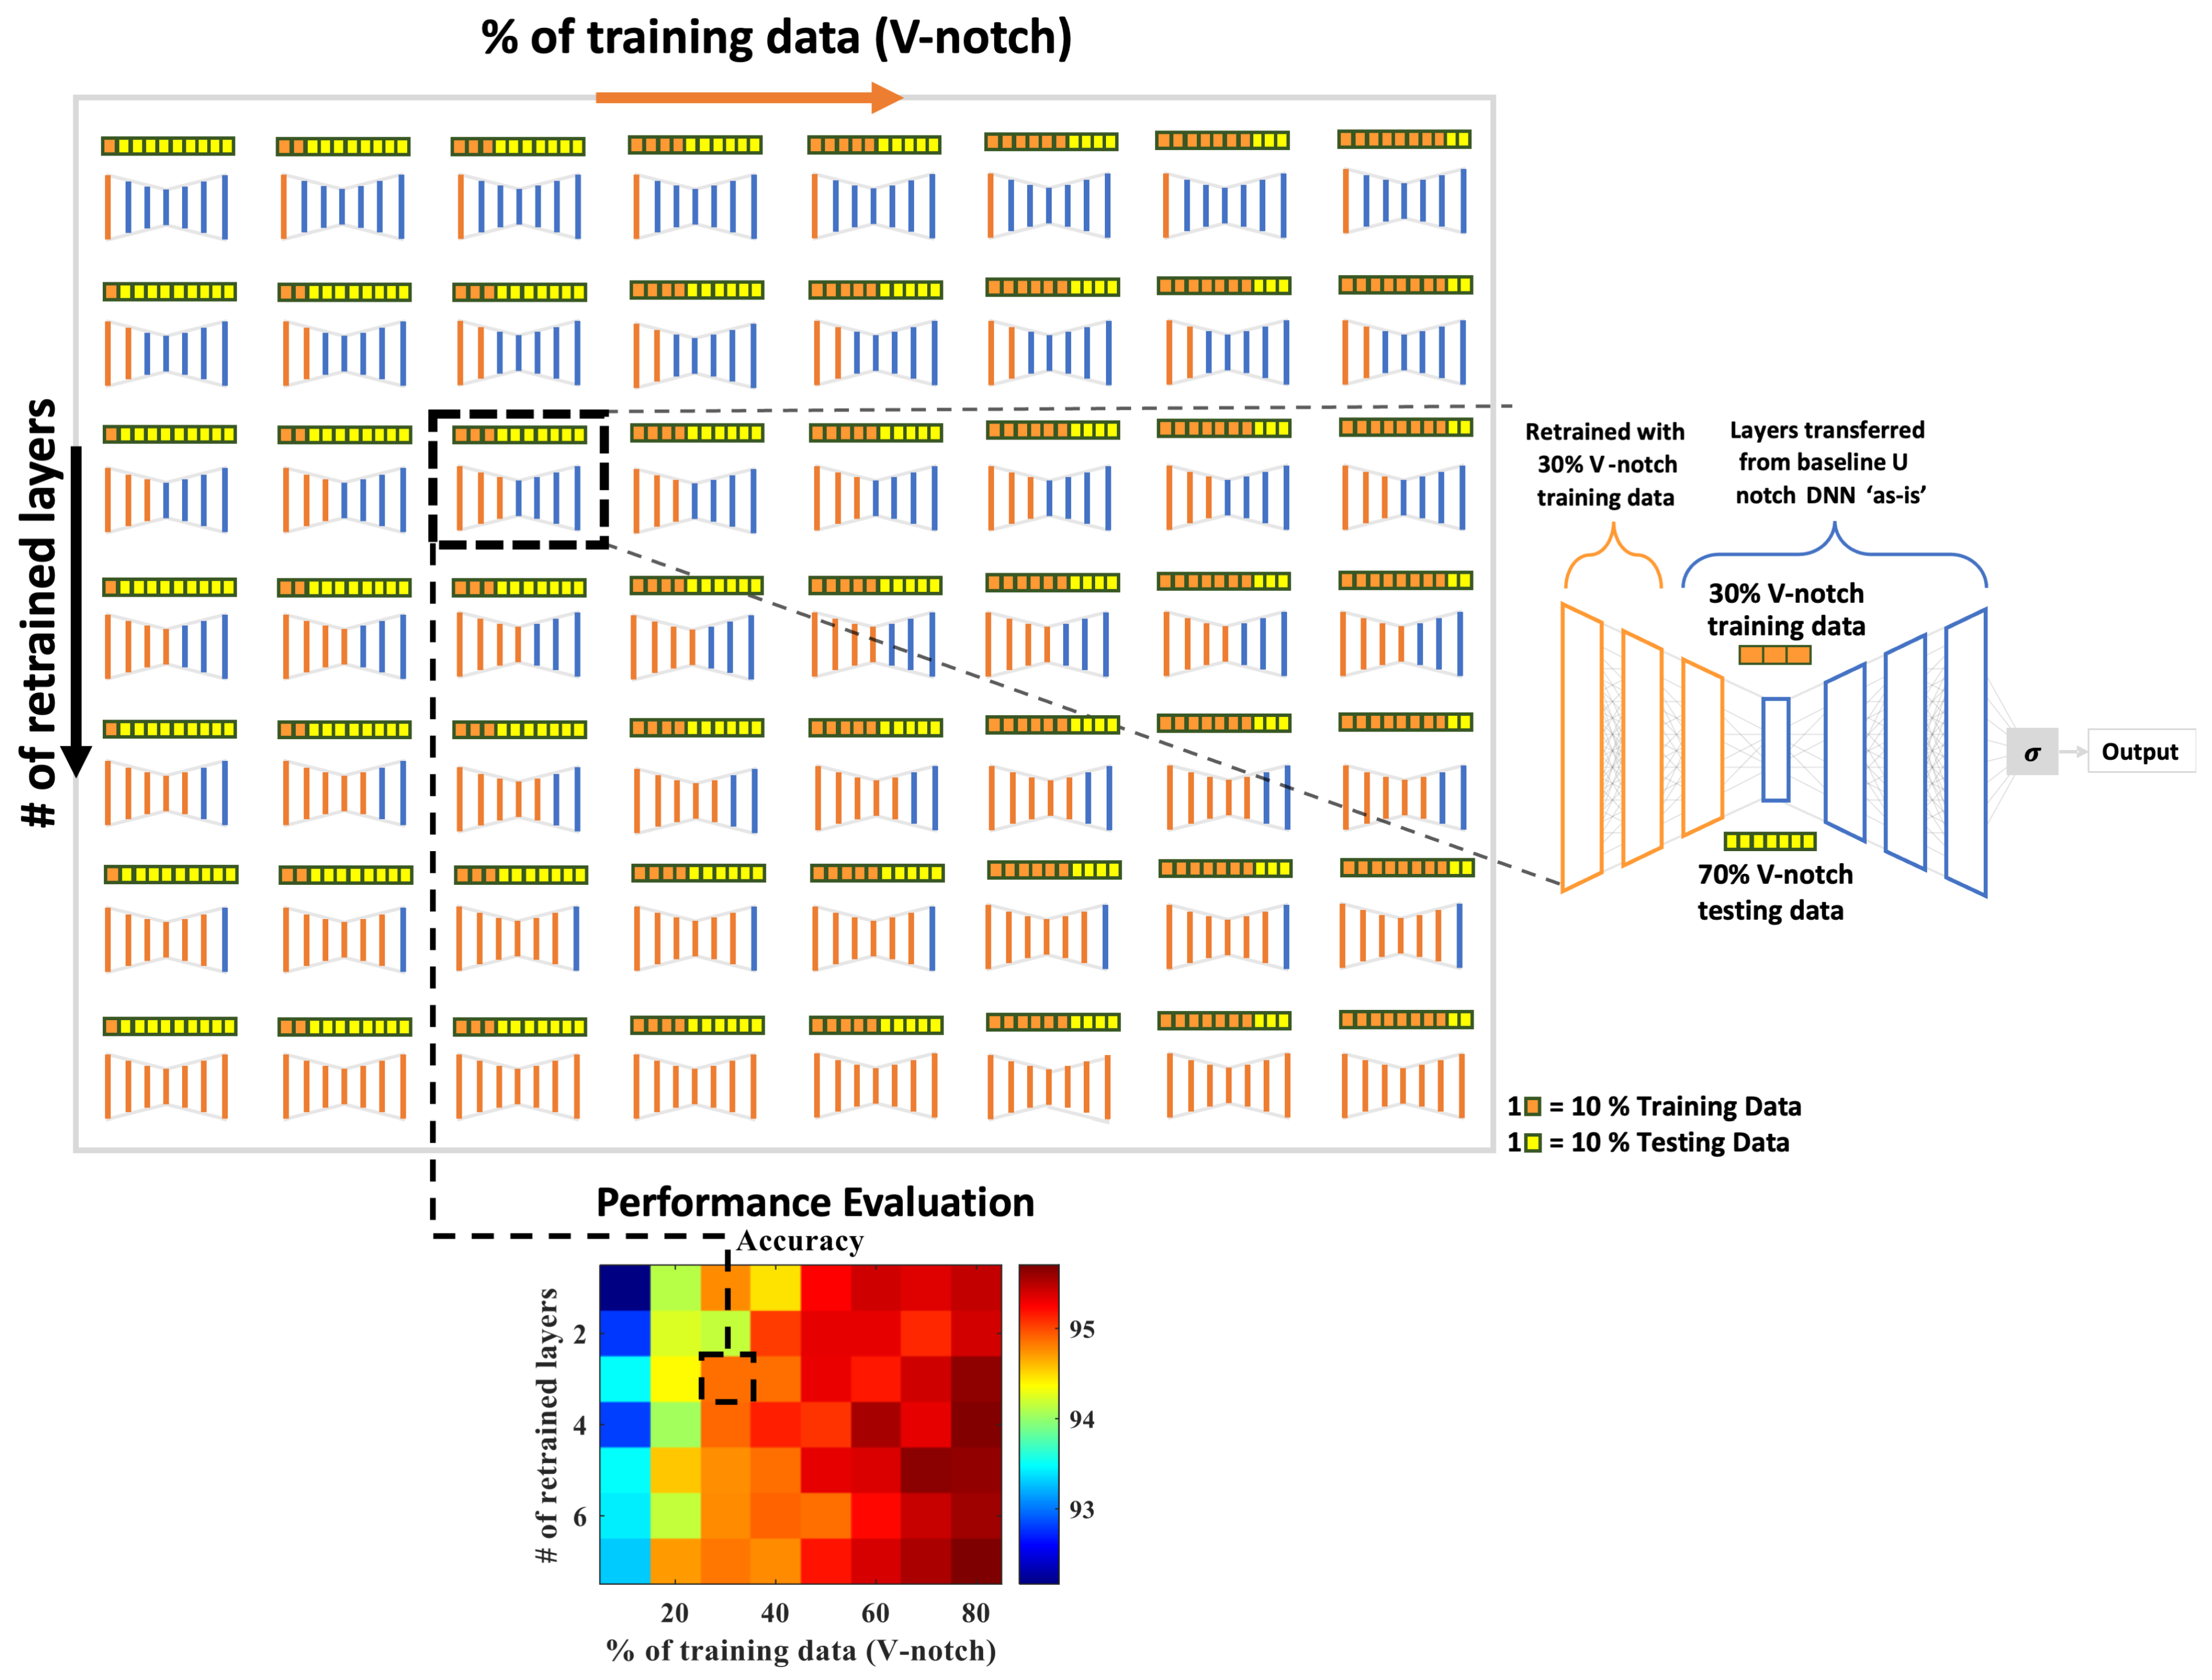
To begin with, a training and testing split of 80–20% of the available data from both types of specimen is created as shown in Step 1 of Figure 4. Following this step, a baseline DNN is trained for each type of specimen as shown in Step 2 of Figure 4. After training these baseline DNNs for individual specimen geometries, the next step is to study whether they can be retrained for other specimen geometry. In general, the retraining can be performed with a combination of some new retraining data and some layers of the existing baseline DNN. Since no prior understanding this retraining procedure is available in literature for such problems, a parametric formulation is setup by varying the amount of data needed for retraining and the number of retrained layers of the baseline DNN. A schematic of this parametric procedure is shown in Figure 5 for retraining the baseline U-notch DNN with V-notch data. The percentage of training data is varied from 10% to 80% of all data, and the testing data is conversely varied from 90% to 20%. The number of retrained layers is varied from 1 to 7 (all layers). Similar retraining analysis is also performed for baseline V-notch DNN with U-notch data. Therefore, the study sets up 56 cases for each specimen leading to 128 different DNNs across both specimen geometries.
Since the goal of all classifiers discussed in this paper is binary classification, their performance is best represented using a confusion matrix that focuses on three metrics: accuracy, sensitivity (true positive rate), and specificity (true negative rate). The accuracy, as reported in this article, is an average of the sensitivity and specificity. In contrast to the typical positive-negative terminology used in machine learning literature, a positive occurrence in this situation is equivalent to the cracked state, and vice versa. As a result, sensitivity is the ratio of correctly diagnosing genuinely ‘cracked’ data, whereas specificity is the percentage of correctly recognizing the ‘healthy’ data.

4. Results and Discussion

All analyses are performed in TensorFlow using Python. The computations are conducted on an Intel® Xeon® Gold 5217 CPU @ 3.00 GHz with a NVIDIA Quadro RTX 6000 GPU.

4.1. Performance of the Baseline DNNs

The fully connected DNN network (Step 2 in Figure 4) which consists of seven dense hidden layers and one dense output layer with a single neuron, receives raw, unprocessed signal data as input. The hidden layers use the Rectified Linear Unit (ReLU) activation function, while the output layer uses a sigmoid activation function. The model is inspired by the encoder-decoder architecture [20] where inputs are compressed to a 2-D latent space, and then expanded again to reconstruct the original input. Logistic regression is carried out on the reconstructed output. Since the task is a mutually-exclusive binary classification problem, binary cross entropy is used as the loss functions. A single sigmoid neuron in the output layer is used because it additionally evaluates the probability of the output being 1 (‘cracked’). While training the DNN architecture for each specimen geometries, the corresponding data is used. The hyperparameters for the model, i.e., the number of neurons for each hidden layer, and the learning rate are selected through a grid-search algorithm using KerasTuner [21] to ensure optimality in terms of accuracy and speed of convergence.
The proposed DNN architecture consists of seven layers with 428, 132, 96, 2, 96, 132, and 428 neurons and has a a learning rate of 0.0004 for the Adam optimizer. The vast volume of data ensures that the computation rarely encounters over-fitting and, hence, techniques like L2 regularization and dropouts have not been used in the DNNs. The U-notch DNN exhibits an accuracy of around 96.1%, with a sensitivity of 96.8% and a specificity of 95.6%. Similarly, the V-notch DNN network achieves an overall accuracy of 95.8%, a sensitivity of 95.05%, and a specificity of 95.93%. These performances are observed to be consistent for both specimen geometries. This performance is a significant improvement (∼10%) as compared to symbolic analysis-based approach on similar data [19]. The confusion matrices for the baseline DNN networks are shown in Figure 6. These accuracies now serve as the reference against which the transfer-learnt DNNs are to be evaluated as discussed in Section 4.3.

4.2. Transductive Results

After the baseline DNN results are obtained, a transductive analysis is performed. The baseline DNN trained with the U-notch training data is tested with the V-notch testing data without any retraining. Similarly, the baseline DNN trained with the V-notch data is tested with the U-notch testing data. The transductive DNNs are schematically shown in Figure 7a,b. The analysis shows a significant loss in performance for both notches. When the baseline U-notch DNN is tested on the V-notch testing data, the accuracy is 60.9%. Similarly, when the baseline V-notch DNN is tested on the U-notch testing data, the accuracy is 56.99%. The poor performance in Figure 7c,d is balanced across both notch geometries with low magnitudes of sensitivity and specificity as well. These results from the transductive analysis indicate the need to develop better learning methods to enable a unified damage detection framework that would work across any notch geometries.

4.3. Effect of Transfer Learning

4.3.1. Impact of the Percentage of Training Data

After developing the baseline DNNs, the impact of training data volume on the performance metrics is investigated. An illustration of the baseline U-notch DNN is shown in Figure 8a. Figure 8b shows the schematic of a transfer-learnt DNN whose first two layers are retrained with 30% V-notch training data. Hence, the DNN in Figure 8b is originally developed for U-notch geometry and is being retrained for the V-notch geometry using a fraction of the V-notch data.
Figure 9 shows the variation observed across both U- and V-notch geometries for training data ranging from 10% to 80%. It is to be noted that the performance in Figure 9a–c are for retraining the baseline U-notch DNN with V-notch data to make fatigue damage detection of the V-notch specimens. Figure 9d–f are for retraining the baseline V-notch DNN with U-notch data to make fatigue damage detection of the U-notch specimens. The accuracy plots (Figure 9a,d) demonstrate a gradual increase in performance with an increase in the percentage of training data. The variance of the distribution also reduces while moving towards more data. A similar, albeit less prominent improvement with more variance in performance is observed for sensitivity and specificity. The highest reported values for accuracy, sensitivity and specificity for V-notch data are 95%, 93.42%, and 95.98%, respectively. This is quite close to the performance of the baseline DNN for V-notch data. Interestingly, even with as low as 20% training data, accuracy, sensitivity and specificity values are found to be above 91%—just about 2% less than the performance metrics of the baseline DNN.

4.3.2. Impact of the Number of Retrained Layers

Figure 10 shows the performance variation observed with an increase in the number of retrained layers. Incredibly, as opposed to the percentage of training data, increasing the number of retrained layers does not seem to provide any improvement in performance across all the three metrics. However, accuracy seems to have the most consistent distribution across the number of retrained layers.
By combining the findings from Section 4.3.1 and Section 4.3.2, a composite outlook is now presented to provide better insight into their inter-dependence. Figure 11a–c are obtained by retraining the baseline U-notch DNN using V-notch data to enable fatigue damage detection of the V-notch geometries. Figure 11d–f are obtained by retraining the baseline V-notch DNN using U-notch data to enable fatigue damage detection of the U-notch geometries. As expected, accuracies are the highest (95% for V-notch and 96% for U-notch) at the bottom right corner i.e., for 7 retrained layers and 80% training data. While good performances (>90%) are reported across the board for all three metrics, high-performance combinations are observed to require a very low number of retrained layers, and a moderate amount of training data. Retraining less layers drastically reduces the number of trainable parameters in the deep learning model, thus requiring a lot less computing power and training time. Moreover, the model’s ability to work efficiently without requiring a lot of data, emphasizes its usability in critical cases where it may not be possible to obtain extensive data. These findings are quite encouraging, showing that the above methodology can be readily deployed online across the industry, with minimum compromise in performance.

5. Conclusions and Future Work

This paper developed a framework to detect fatigue crack initiation in the short crack regime using DNNs for Al7075-T6 specimens with different notch geometries. An ensemble of time series sensor data, collected from a computer-instrumented and computer-controlled fatigue-test apparatus, has been analyzed by using DNNs for a U-notch and a V-notch. This data-driven method has been further extended by combining the concepts of transfer learning and DNN for fatigue damage detection which yields an accuracy of 95.06% and 93.84% for U-notch and V-notch, respectively. The transfer learning methodology is further probed with a parametric analysis by varying the number of retrained layers and the amount of training data. Therefore, pending further experimental and theoretical investigation, this paper suggests the potential data-thrifty quality of combining the concepts of transfer learning and DNN for fatigue damage detection. While there are many areas of research to enhance the work reported here, the following topics are suggested to be conducted in the near future:
  • Verification of the proposed method with additional experimental data, where knowledge of micro-crack emergence is available through different measurement methods.
  • Usefulness of the proposed method in reducing the testing requirement of specimens made of expensive materials [22] or fabricated through emerging manufacturing processes [23].
  • Integration of the current framework with physics-informed neural networks to enable mechanistic interpretation of the fatigue failure.

Author Contributions

Conceptualization, A.B.; methodology, S.D., R.R. and C.B.; validation, R.R. and S.D.; formal analysis, S.D. and R.R.; resources, A.B. and A.R.; data curation, S.D.; writing—original draft preparation, A.B., S.D. and R.R.; writing—review and editing, A.B. and A.R.; visualization, R.R. and S.D.; supervision, A.B.; project administration, A.B. and A.R.; funding acquisition, A.B. and A.R. All authors have read and agreed to the published version of the manuscript.

Funding

The work reported in this paper is supported in part by the Department of Mechanical Engineering at the Pennsylvania State University, University Park, PA 16802 and in part by the U.S. Air Force Office of Scientific Research (AFOSR) under Grant No. FA9550-15-1-0400. The APC was funded by the Metals Editorial Office. Any opinions, findings, and conclusions in this paper are those of the authors and do not necessarily reflect the views of the supporting institution.

Institutional Review Board Statement

Not applicable.

Informed Consent Statement

Not applicable.

Data Availability Statement

The data is available from the communicating author on reasonable request.

Conflicts of Interest

The authors declare no conflict of interest.

References

  1. Krautkrämer, J.; Krautkrämer, H. Ultrasonic Testing of Materials; Springer Science & Business Media: Berlin/Heidelberg, Germany, 2013. [Google Scholar]
  2. Atzori, B.; Meneghetti, G. Fatigue strength of fillet welded structural steels: Finite elements, strain gauges and reality. Int. J. Fatigue 2001, 23, 713–721. [Google Scholar] [CrossRef]
  3. Roberts, T.; Talebzadeh, M. Acoustic emission monitoring of fatigue crack propagation. J. Constr. Steel Res. 2003, 59, 695–712. [Google Scholar] [CrossRef]
  4. Zilberstein, V.; Schlicker, D.; Walrath, K.; Weiss, V.; Goldfine, N. MWM eddy current sensors for monitoring of crack initiation and growth during fatigue tests and in service. Int. J. Fatigue 2001, 23, 477–485. [Google Scholar] [CrossRef]
  5. Dharmadhikari, S.; Basak, A. Fatigue damage detection of aerospace-grade aluminum alloys using feature-based and feature-less deep neural networks. Mach. Learn. Appl. 2022, 7, 100247. [Google Scholar] [CrossRef]
  6. Gupta, S.; Ray, A.; Keller, E. Symbolic time series analysis of ultrasonic data for early detection of fatigue damage. Mech. Syst. Signal Process. 2007, 21, 866–884. [Google Scholar] [CrossRef]
  7. Ghalyan, N.F.; Ray, A. Symbolic time series analysis for anomaly detection in measure-invariant ergodic systems. J. Dyn. Syst. Meas. Control 2020, 142, 061003. [Google Scholar] [CrossRef]
  8. Bhattacharya, C.; Dharmadhikari, S.; Basak, A.; Ray, A. Early detection of fatigue crack damage in ductile materials: A projection-based probabilistic finite state automata approach. ASME Lett. Dyn. Syst. Control 2021, 1, 041003. [Google Scholar] [CrossRef]
  9. Zhang, R.; Tao, H.; Wu, L.; Guan, Y. Transfer learning with neural networks for bearing fault diagnosis in changing working conditions. IEEE Access 2017, 5, 14347–14357. [Google Scholar] [CrossRef]
  10. Munawar, H.S.; Hammad, A.W.; Haddad, A.; Soares, C.A.P.; Waller, S.T. Image-Based Crack Detection Methods: A Review. Infrastructures 2021, 6, 115. [Google Scholar] [CrossRef]
  11. Yang, C.; Chen, J.; Li, Z.; Huang, Y. Structural Crack Detection and Recognition Based on Deep Learning. Appl. Sci. 2021, 11, 2868. [Google Scholar] [CrossRef]
  12. Dung, C.V.; Sekiya, H.; Hirano, S.; Okatani, T.; Miki, C. A vision-based method for crack detection in gusset plate welded joints of steel bridges using deep convolutional neural networks. Autom. Constr. 2019, 102, 217–229. [Google Scholar] [CrossRef]
  13. Che, C.; Wang, H.; Fu, Q.; Ni, X. Deep transfer learning for rolling bearing fault diagnosis under variable operating conditions. Adv. Mech. Eng. 2019, 11, 1687814019897212. [Google Scholar] [CrossRef] [Green Version]
  14. Li, J.; Li, X.; He, D.; Qu, Y. A domain adaptation model for early gear pitting fault diagnosis based on deep transfer learning network. Proc. Inst. Mech. Eng. Part O J. Risk Reliab. 2020, 234, 168–182. [Google Scholar] [CrossRef]
  15. Guo, L.; Lei, Y.; Xing, S.; Yan, T.; Li, N. Deep convolutional transfer learning network: A new method for intelligent fault diagnosis of machines with unlabeled data. IEEE Trans. Ind. Electron. 2018, 66, 7316–7325. [Google Scholar] [CrossRef]
  16. Wen, L.; Gao, L.; Li, X. A new deep transfer learning based on sparse auto-encoder for fault diagnosis. IEEE Trans. Syst. Man Cybern. Syst. 2017, 49, 136–144. [Google Scholar] [CrossRef]
  17. Wang, Q.; Michau, G.; Fink, O. Domain adaptive transfer learning for fault diagnosis. In Proceedings of the 2019 Prognostics and System Health Management Conference (PHM-Paris), Paris, France, 2–5 May 2019; pp. 279–285. [Google Scholar]
  18. Dharmadhikari, S.; Keller, E.; Ray, A.; Basak, A. A dual-imaging framework for multi-scale measurements of fatigue crack evolution in metallic materials. Int. J. Fatigue 2021, 142, 105922. [Google Scholar] [CrossRef]
  19. Dharmadhikari, S.; Bhattacharya, C.; Ray, A.; Basak, A. A Data-Driven Framework for Early-Stage Fatigue Damage Detection in Aluminum Alloys Using Ultrasonic Sensors. Machines 2021, 9, 211. [Google Scholar] [CrossRef]
  20. Goodfellow, I.; Bengio, Y.; Courville, A.; Bengio, Y. Deep Learning; MIT Press: Cambridge, UK, 2016; Volume 1. [Google Scholar]
  21. Li, L.; Jamieson, K.; DeSalvo, G.; Rostamizadeh, A.; Talwalkar, A. Hyperband: A novel bandit-based approach to hyperparameter optimization. J. Mach. Learn. Res. 2017, 18, 6765–6816. [Google Scholar]
  22. Angel, N.M.; Basak, A. On the fabrication of metallic single crystal turbine blades with a commentary on repair via additive manufacturing. J. Manuf. Mater. Process. 2020, 4, 101. [Google Scholar] [CrossRef]
  23. Dharmadhikari, S.; Basak, A. Evaluation of Early Fatigue Damage Detection in Additively Manufactured AlSi10Mg. In Proceedings of the 2021 International Solid Freeform Fabrication Symposium, Virtual, 2–4 August 2021. [Google Scholar]
Figure 1. Schematic of (a) a conventional machine learning and (b) a transfer learning framework.
Metals 12 01849 g001
Figure 2. Schematic of (a) a U-notch and (b) a V-notch specimen. All dimensions are in mm. (c) The experimental setup for fatigue testing.
Metals 12 01849 g002
Figure 3. Concatenated signals during the entire duration of fatigue testing for a representative (a) U-notch specimen and (b) V-notch specimen. Representative initiation of fatigue cracks inside the notch root for (c) U-notch specimen and (d) V-notch specimen, and (e) an actual image from the V-notch. The red arrows in (ce) represents the locations of short cracks. Binary classification into healthy and cracked labels of the ultrasonic signals for (f) U-notch specimen and (g) V-notch specimen.
Metals 12 01849 g003
Figure 4. Overview of the data analysis methodology split into two steps: (i) Step 1: dataset bifurcation and (ii) Step 2: design and development of baseline DNNs.
Metals 12 01849 g004
Figure 5. Overview of the parametric retraining to enable transfer learning. These DNNs have the original baseline U-notch DNN as the starting structure. Then, a fraction of the V-notch data is used to selectively train a pre-determined number of layers. Finally, the DNNs are tested on V-notch testing data to investigate the efficacy of transfer learning to enable fatigue damage detection of V-notch specimens.
Metals 12 01849 g005
Figure 6. Confusion matrix for the baseline (a) U-notch DNN and (b) V-notch DNN.
Metals 12 01849 g006
Figure 7. Overview of the transductive analysis framework: (a) the baseline U-notch DNN is tested on the V-notch test data and (b) the baseline V-notch DNN is tested on the U-notch test data. (c) Confusion matrix for (a). (d) Confusion matrix for (b).
Metals 12 01849 g007
Figure 8. (a) Structure of the baseline U-notch DNN developed using U-notch training data. (b) The baseline U-notch DNN with the first two layers retrained with 30% of the V-notch training data.
Metals 12 01849 g008
Figure 9. Effect of the training data volume when the baseline U-notch DNN is retrained with V-notch data to enable a prediction for V-notch: (a) accuracy, (b) specificity, and (c) sensitivity. Effect of the training data volume when the baseline V-notch DNN is retrained with U-notch data to enable a prediction for U-notch: (d) accuracy, (e) specificity, and (f) sensitivity. All the distributions indicate the variation for the corresponding training data across different retrained layers. For example: The box plot for 10% training data in (a) is a distribution of seven different accuracies corresponding to different number of re-trained layers.
Metals 12 01849 g009
Figure 10. Effect of the number of retrained layers when the baseline U-notch DNN is re-trained with V-notch data to enable a prediction for V-notch: (a) accuracy, (b) specificity, and (c) sensitivity. Effect of the number of the retrained layers when the baseline V-notch DNN is retrained with U-notch data to enable a prediction for U-notch: (d) accuracy, (e) specificity, and (f) sensitivity. All the distributions indicate the variation for the corresponding retrained layers across different percentage of training data. The box plot for 1 retrained layer in (a) is a distribution of eight different accuracies corresponding to different percentage of training data.
Metals 12 01849 g010
Figure 11. A composite effect of the number of retrained layers and percentage of training data when the baseline U-notch DNN is re-trained with V-notch data to enable a prediction for V-notch: (a) accuracy, (b) specificity, and (c) sensitivity. A composite effect of the number of retrained layers and percentage of training data when the baseline V-notch DNN is retrained with U-notch data to enable a prediction for U-notch: (d) accuracy, (e) specificity, and (f) sensitivity.
Metals 12 01849 g011
Publisher’s Note: MDPI stays neutral with regard to jurisdictional claims in published maps and institutional affiliations.