Article

Spall Fracture of Solid and Molten Copper: Molecular Dynamics, Mechanical Model and Strain Rate Dependence

by
Polina N. Mayer
,
Victor V. Pogorelko
,
Dmitry S. Voronin
and
Alexander E. Mayer
*
Department of General and Theoretical Physics, Chelyabinsk State University, 454001 Chelyabinsk, Russia
*
Author to whom correspondence should be addressed.
Metals 2022, 12(11), 1878; https://doi.org/10.3390/met12111878
Submission received: 30 September 2022 / Revised: 31 October 2022 / Accepted: 1 November 2022 / Published: 3 November 2022

Abstract

:
In this study, we formulate a mechanical model of spall fracture of copper, which describes both solid and molten states. The model is verified, and its parameters are found based on the data of molecular dynamics simulations of this process under ultrahigh strain rate of tension, leading to the formation of multiple pores within the considered volume element. A machine-learning-type Bayesian algorithm is used to identify the optimal parameters of the model. We also analyze the influence of the initial size distribution of pores or non-wettable inclusions in copper on the strain rate dependence of its spall strength and show that these initial heterogeneities explain the existing experimental data for moderate strain rates. This investigation promotes the development of atomistically-based machine learning approaches to description of the strength properties of metals and deepens the understanding of the spall fracture process.

1. Introduction

Plastic deformation and fracture of metals substantially influence their performance as structural materials, including various dynamic-oriented applications [1,2,3]. Understanding of the physical mechanisms of dynamic fracture, allowing its mechanical description, is one of keystones in the formulation of the constitutive equations of metals. Application of molecular dynamics (MD) simulations allows one to consider atomistic details of the initiation and development of various defects [3,4,5,6,7] and to gain a large amount of information complementary to the experimental data. MD simulations are directly applicable to very small spatial and temporal scales, which are on the verge of the modern experimental techniques with ultra-short laser-driven shocks [8,9,10,11] and far beyond the typical conditions of metal exploitation. Conversely, using of MD-generated data and machine learning methods for verification and parameterization of mechanical models [12,13,14] is a prospective route to extrapolate MD data to the scales of interest. In the present study we develop this approach regarding the spall fracture of copper. Although MD-informed models are the most promising for new and complex materials, the approach itself requires examination for the case of a well-studied metal with known experimental data, such as copper, for which a plenty of dynamic experiments were previously performed [15,16,17,18,19,20,21].
The spall fracture [22,23,24,25] of solid metals occurs at reflection of a shock wave from a free surface or an interface with a material with lower mechanical impedance. A zone of dynamic tension is formed at a certain distance from this free surface/interface, which leads to the formation, growth, and coalescence of voids or cracks, and the spallation of a layer of material by this reflected shock wave. A similar phenomenon occurs in the case of metal melts [26,27,28,29], although it leads to ejection of multiple drops (micro-spall [30]) rather than spallation of a solid layer. Direct MD simulation of the whole spallation process is often used [4,30,31,32], but here we intend to develop a fracture model and, therefore, we consider the stage of uniform tension of a representative volume element (RVE). It allows us to consider orders-of-magnitude lower strain rates and large spatial scales in comparison with the simulation of the spatial non-uniform process of the shock wave reflection in the direct MD approach. Our MD data for the representative volume element are generalized in the form of fracture model, which can be incorporated in the corresponding continuum mechanics code (hydrocode) intended to model the shock wave process.

2. Materials and Methods

2.1. Problem Statement for MD Simulations

Classical molecular dynamics simulations with LAMMPS [33] software package (Sandia National Laboratories, Albuquerque, NM, USA), version 12 Dec 18, and extensively tasted and widely used interatomic potential [34] of EAM type (embedded atom method) are adopted to study the dynamic tensile fracture of copper. Additional verification of this interatomic potential is performed in the present work by comparison with the experimental data on the spall strength of copper at ultrahigh strain rates [15,16,17].
We consider single crystals at room temperature (300 K) and elevated temperature (1000 K), in addition to copper melt at 2000 K. To study the growth of existing voids, small MD systems of 70 × 70 × 70 lattice parameters (about 25 nm3) with single spherical pores in the center are simulated; the following initial radii of pores are considered: 5 lattice parameters (about 1.9 nm) with the porosity 0.0017, 10 lattice parameters (about 3.7 nm) with the porosity of 0.013, and 20 lattice parameters (about 7.3 nm) with the porosity of 0.1. The number of atoms in these small systems varies from 1.37 to 1.23 million depending on the porosity. In all cases, a spherical repulsive force field is placed inside the pore by the command “indent” of LAMMPS, like in [35]. This force field mimics a non-wettable inclusion and prevents the pore collapse in the case of melt. In the case of solid state, the crystal remains perfect outside the pore.
To study the void nucleation, we consider uniform perfect single crystals and uniform melt without preset pores or inclusions. The moderate MD system of 150 × 150 × 150 lattice parameters (about 55 nm3, 13.5 million atoms) and large MD system of 200 × 200 × 200 lattice parameters (about 73 nm3, 32 million atoms) are simulated to provide a statistically sound number of nucleated voids, like in [35,36].
Prior to tension, the MD system is held at the test temperature and zero stresses during 50 ps in the case of solid copper. The temperature and stresses are controlled by the Nose–Hoover thermostat and barostat [37], respectively. In the case of melt, to provide the complete melting, the system is initially heated to 3000 K during 10 ps, and then relaxed at 2000 K during 40 ps. After this preparation, a uniform hydrostatic tension is applied with the volumetric strain rate of 1 ns−1 by rescaling the atomic coordinates using the “deform” command of LAMMPS. The temperature is kept constant during the tension by means of the Nose–Hoover thermostat [37]. The constant temperature in MD simulations simplifies the analysis of the obtained results and calibration of the fracture model, while the inherent change of temperature at loading can be considered during the following application of the fracture model.
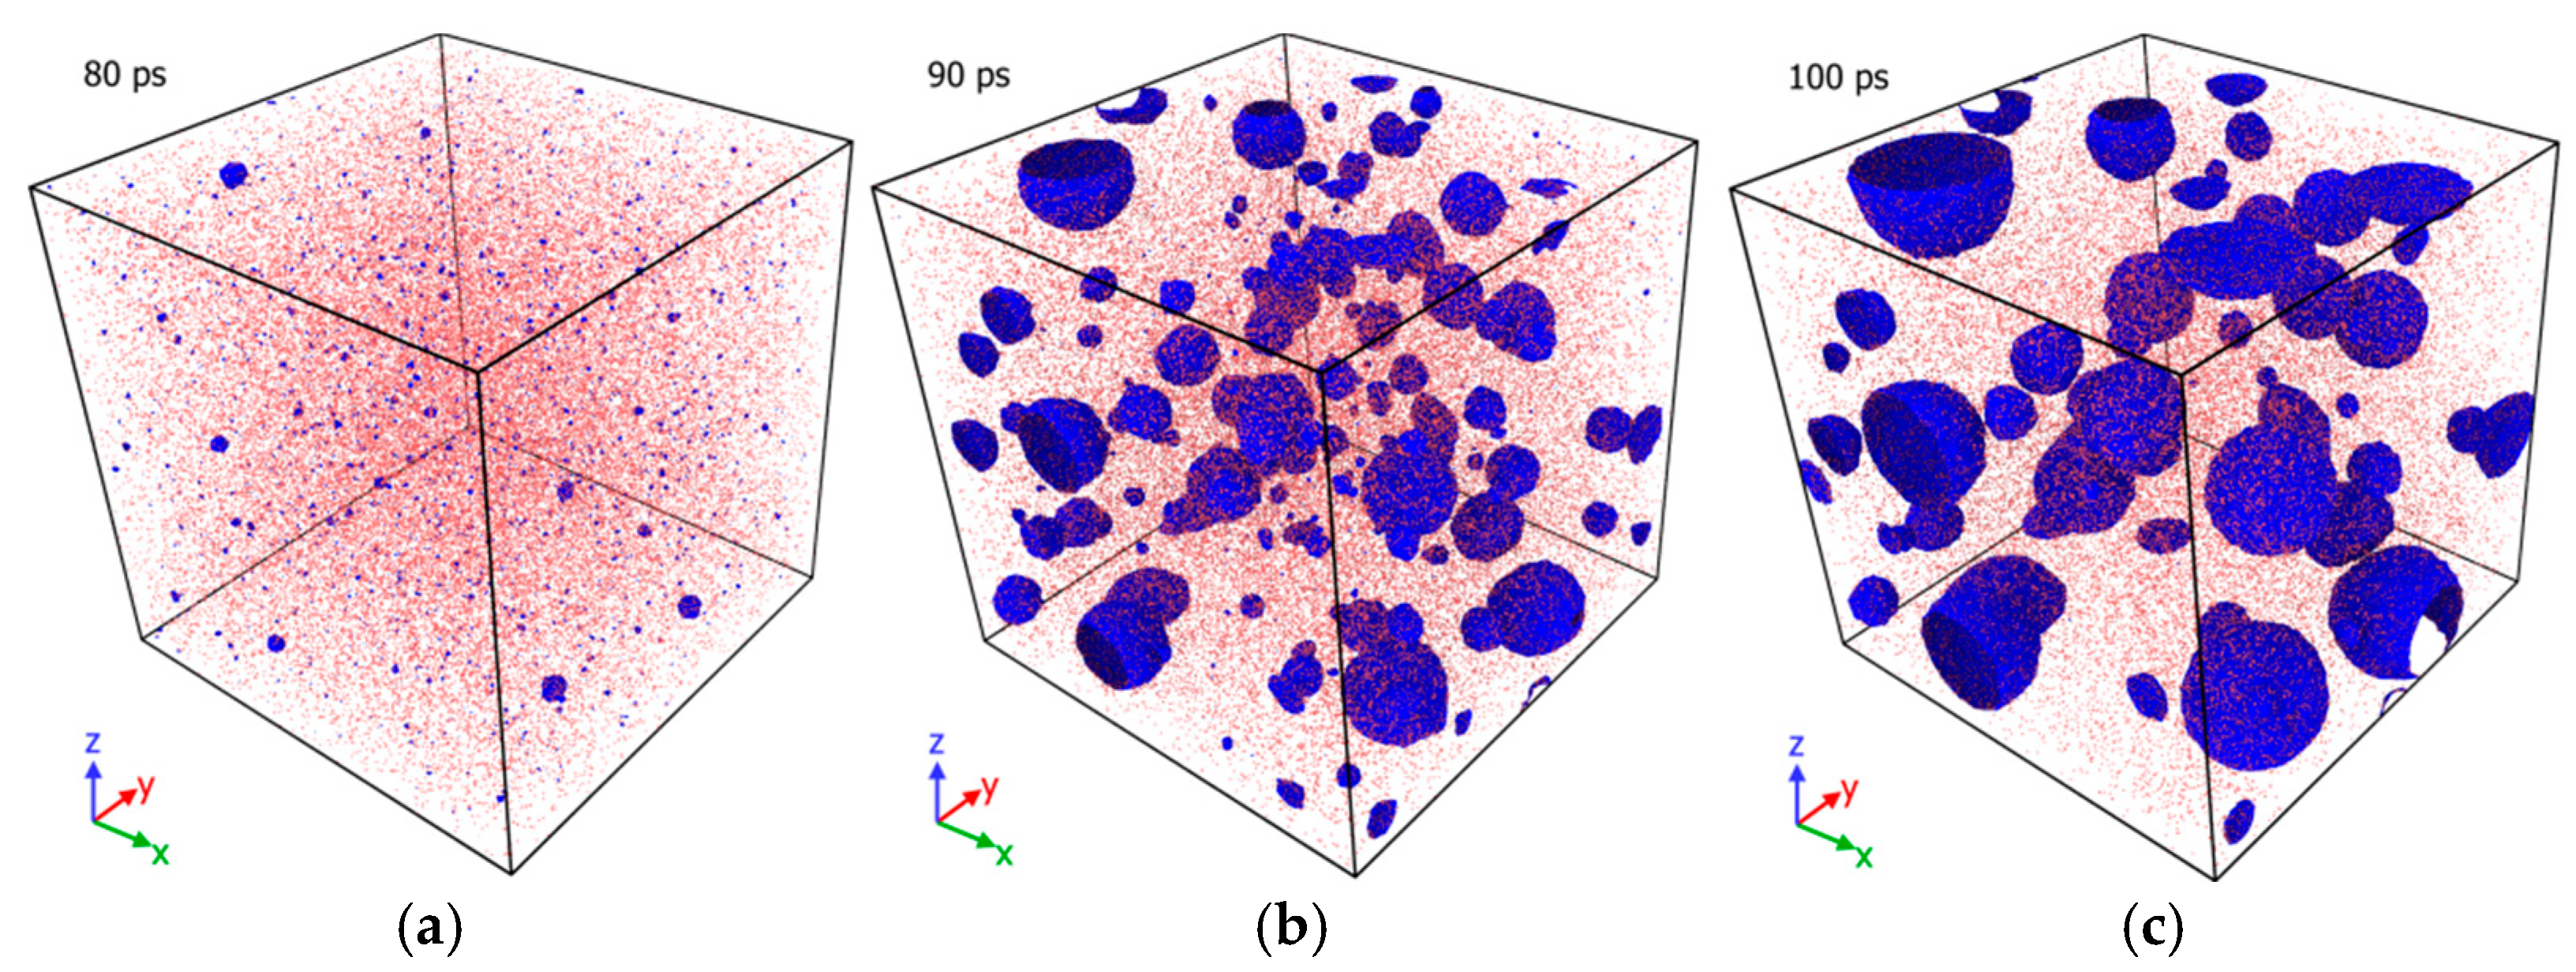
The obtained atomic configurations are analyzed by means of the pore searching algorithm [7,38], which allows one to trace in time both the total volume fraction of voids (porosity) and the number and sizes of individual voids in the system. The pressure averaged over the system volume is calculated by means of the virial theorem [39]. For visualization of the atomic configurations, we use OVITO program [40] with the embedded “Construct surface mesh” algorithm [41] and “Dislocation extraction algorithm” (DXA) [42]. The examples of the visualized evolution of the uniform solid copper and copper melt during tension are shown in Figure 1 and Figure 2, respectively. The tensile fracture of a uniform material starts from the nucleation of voids due to small-scale (thermal) fluctuations. In the case of a solid, as in Figure 1, these voids are coated by dislocations, which motion provides the plastic growth of voids. Most of the pores grow under negative pressure, while the smallest ones collapse after the pressure relaxation, which is the most pronounced in the case of a melt, Figure 2c, and was discussed earlier [7,38,43].
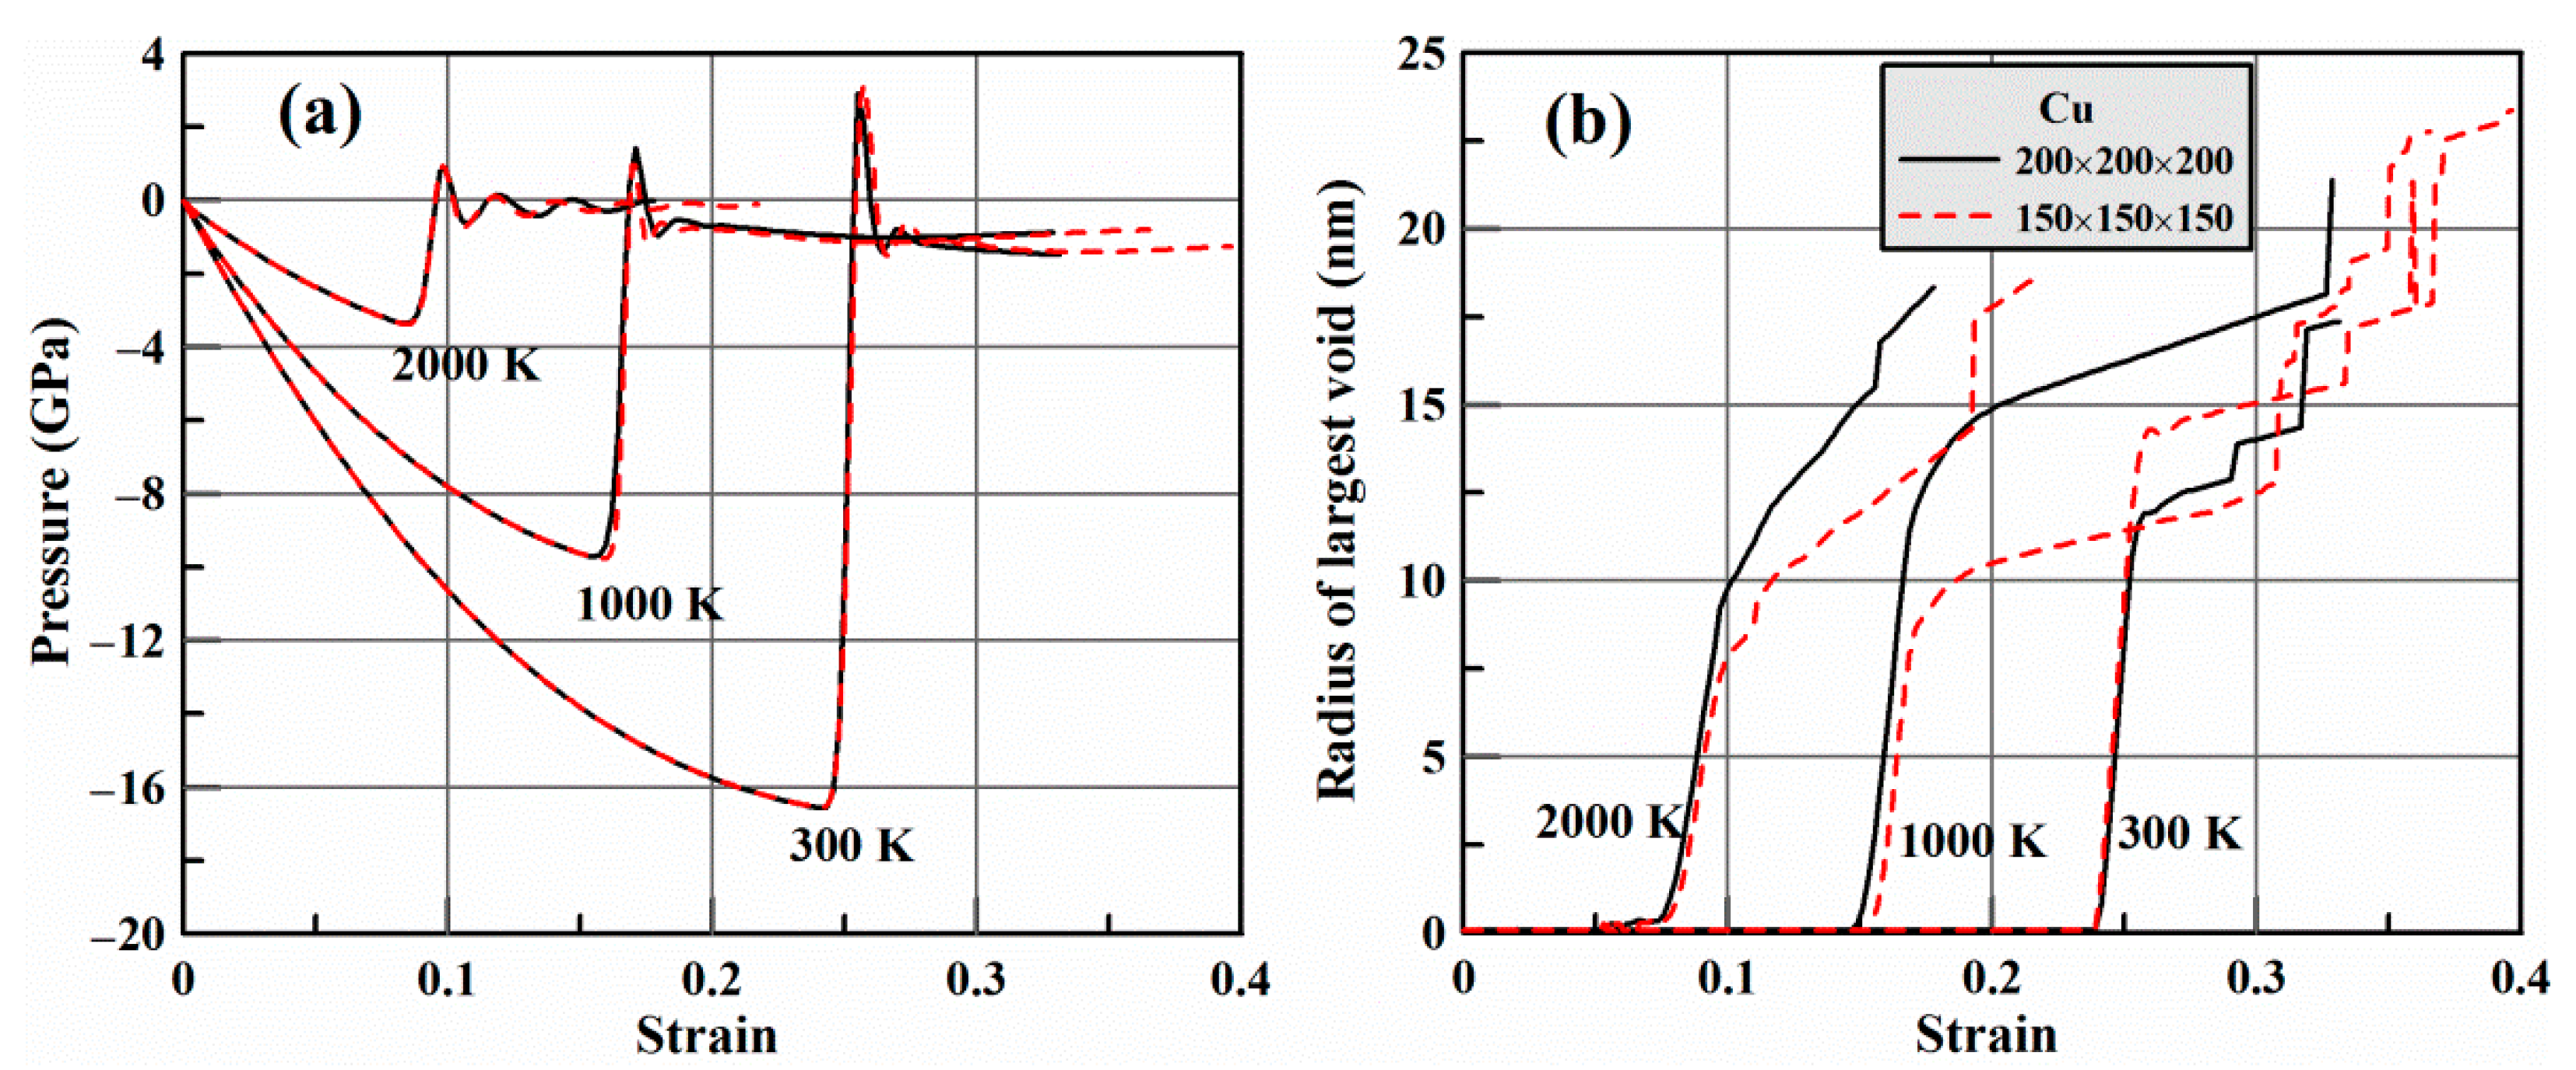
The evolution of pressure in a uniform metal under tension is compared for the cases of moderate and large MD systems in Figure 3a, while Figure 3b compares the radii of the largest voids for all test temperatures. The monotonous decrease in pressure, Figure 3a, is interrupted by the nucleation and fast growth of voids, Figure 3b, which leads to the pressure relaxation and the following oscillations about some negative level much less than the tensile strength. The tensile strength is the maximal absolute value of the negative pressure. Figure 3a demonstrates that the mechanical response of both MD systems is almost the same, which means that the system size is large enough for the considered strain rate to reproduce the statistics of fracture process, and the statistical scatter is negligible for the system. At the same time, Figure 3b demonstrates that the behaviors of individual voids differ, because it is inherently random. In particular, a sharp increase in radius of a void indicates the random process of coalescence with smaller voids. This brief analysis substantiates the choice of the size of MD systems.

2.2. Fracture Model

The general framework of the fracture model is taken from the previous publications [35,36], but here we use, in the case of solid, a simpler model for the plastic strain rate. This simplification is partially compensated by a more efficient procedure of parameter identification described in Section 2.3. Let us consider the used system of equations.
Like in the MD, we consider the RVE as a part of periodically repeated material. The total volume V of the RVE increases with the constant rate:
V = V 0 ( 1 + ε t ˙ )
where ε ˙ is the engineering (volumetric) strain rate, which is equal to 1 ns−1 in the case of comparison with the MD and varies in the case of investigation of the strain rate dependence. We approximate all pores as spheres with radii R i , and the total volume of pores in the RVE can be calculated as follows:
V p = i = 1 N 4 π 3 R i 3 ,
where N is the number of pores in the RVE; the porosity is equal to φ = V p / V . The current volume of the condensed phase V s = V V p and its initial value V s 0 allows us to calculate the pressure inside the condensed phase. Analysis of MD data shows that the dependence P ( V s ) at a constant temperature T can be approximated by the following third-order polynomial:
P = K 1 ( V s V s 0 1 ) + K 2 ( V s V s 0 1 ) 2 K 3 ( V s V s 0 1 ) 3 ,
where the constants K 1 , K 2 and K 3 are determined by fitting to the elastic part of the pressure-strain curves, as in Figure 3a, before the pressure relaxation at the fracture beginning. The pressure-volume relationship P ( V s ) determines the isothermal bulk modulus
K = V s ( P V s ) T = [ K 1 2 K 2 ( V s V s 0 1 ) + 3 K 3 ( V s V s 0 1 ) 2 ] ( V s V s 0 ) .  
Equations (3) and (4) allow us to calculate the shear modulus
G = 3 2 · 1 2 μ 1 + μ K ,  
where μ is the Poisson’s coefficient, and the volume-averaged pressure
P = V s V P ,  
which should be compared with the volume-averaged pressure from the MD. The elastic constants determined from the MD for the investigated temperatures are collected in Table 1. For instance, zero Poisson’s coefficient μ = 0 gives us the case of molten metal.
The fracture model predicts the evolution of the number and size of voids. The following equation describing the variation of the current void radius is derived in [35] and valid for both viscous fluid and elastic-plastic medium:
R i R ¨ i + 3 2 R ˙ i 2 + 4 η ρ ( R i ˙ R i + P ˙ 3 K ) + R i 2 [ P ¨ 3 K 5 2 ( P ˙ 3 K ) 2 ] = 1 ρ [ P ( 1 + 4 G 3 K ) 4 G ( R i R p , i ) R i 2 γ R i ] ,  
where R p , i is the plastically stabilized radius for i-th void, ρ is the mass density, γ is the surface tension coefficient, and η is the coefficient of viscosity. In the case of viscous fluid (melt) one must use G = 0 , which excludes the elastic counteraction to the expansion of void; specifically, for incompressible fluid K 0 , Equation (7) transforms into the Rayleigh–Plesset equation [44,45]. In the elastic-plastic case (solid metal), one can neglect the viscosity η = 0 , but must calculate the plastically stabilized radius R p , i , which the pore will have in the absence of applied pressure and surface tension. The difference between the current radius R i and the plastically stabilized one R p , i determines the elastic part of deformation and the corresponding shear stress in the pore vicinity [35]:
σ i = P G K 3 G R i R p , i R i .
This shear stress provides plastic flow and variation of R p , i . Previously, we used explicit dislocation kinetics-based models of the plastic flow [35,36]. Here we employ the following equation taken from [46] for the plastic strain rate in the vicinity of i-th pore:
w ˙ i = 1 2 G τ [ σ i Y 2 · sign ( σ i ) ] · H ( | σ i | Y 2 ) ,
where H ( σ ) is the Heaviside step function. Equation (9) expresses the modified Maxwell relaxation model with accounting of the yield strength Y like in [35,46]. In contrast to [35,46], both the yield strength Y and the relaxation time τ are treated as constants and directly optimized to reach the correspondence with the MD, as described in Section 2.3. This simplification can be eliminated in the future works, but here we try to use the simplest possible model of plasticity and to concentrate on the optimal parameter fitting. Estimating the linear scale, on which the plastic flow develops around a void, as the minimum from the pore radius R i and the average distance V / N 3 between the pore centers, we can calculate the rate of the plastic growth as follows:
R p , i = min { R i ,   V / N 3 } · w ˙ i .
The remaining part of the model includes the description of the homogeneous nucleation of pores and activation of pores on the pre-existing heterogeneities. At negative pressure P < 0 , the critical radius of void, which can mechanically grow, is equal to R c = 2 γ / P . The work required for the homogeneous nucleation of voids can be expressed as follows:
W c = 16 π 3 γ 3 P 2 + W p ,  
where the first term in the right-hand part is the work of surface tension partially compensated by the work of the negative pressure favoring the nucleation, while the second part, W p , is the plastic work of void nucleation in solids. We neglected this plastic work in the previous works [35,36], but here we estimate its value as discussed in Section 2.3. According to [36], the moments t N + 1 of nucleation of the next new void can be determined from the following integral criterion:
t N t N + 1 V s ( c s a 4 ) · exp ( W c k B T )   d t = 1 ,  
where k B is the Boltzmann constant, c s = K / ρ is the bulk sound velocity, and a is the mean interatomic distance.
Activation of a pore on a pre-existing heterogeneity occurs when the critical radius R c becomes smaller than the size of heterogeneity. According to [35], the moments of void activation t N + 1 * can be also determined from the integral criterion:
t N * t N + 1 * V s ( d n d R ) | R = R c | R ˙ c | · H ( R ˙ c )   d t = 1 ,  
where the function ( d n / d R ) is the size distribution of heterogeneities, it means distribution of spherical heterogeneities over radius R . The following size distributions are considered here: The monodisperse ensemble of pores or inclusions with the radius of R 0 and total concentration of n 0
( d n d R ) = n 0 δ ( R R 0 ) ,  
where δ ( R ) is the Dirac delta function, the exponential distribution
( d n d R ) = n 0 R 0 exp ( R R 0 ) ,  
which also has two parameters, R 0 and n 0 , and the power-law distribution
( d n d R ) = n 0 R 0 A 1   ( A 1 ) R A  
with an additional parameter A .
The presented equations constitute the complete model of the spall fracture and related pressure relaxation, which allows one to trace evolution of individual voids in addition to the average parameters. The time-differential equations are integrated by means of the explicit Euler scheme with small enough time step, which depends on the considered strain rate, and it is as small as 1 fs for the strain rate of 1 ns−1 considered in the MD.

2.3. Bayesian Identification of Parameters

A machine-learning-type Bayesian algorithm is used to identify the optimal parameters of the model. We have MD results as the training data set, which includes two runs for uniform material with different system size and three runs for heterogeneous material with non-wettable inclusions for each considered temperature. The trial sets of model parameters are randomly seeded inside a reasonable range. Probability of each set of parameters is calculated as a degree of correspondence of the model to the training data:
p = k = 1 k 0 exp ( 0.1 [ ( P P MD Δ P MD ) 2 + ( φ φ MD Δ φ MD ) 2 + ( N N MD Δ N MD ) 2 + ( R 1 R 1 MD Δ R 1 MD ) 2 ] k )   ,
where Δ P MD , Δ φ MD , Δ N MD , and Δ R 1 MD are the ranges of the corresponding values from the MD, and k 0 is the number of training points from the MD. The comparison is performed with a step of 10−3 of engineering strain consequently for all MD runs (two MD systems for homogeneous copper and three MD systems with different size of non-wettable inclusions) at the same temperature. Thus, the total number k 0 of comparison points reaches about 1500. This procedure allows one to calculate the probability distribution in the space of model parameters; an example of such distribution for 1000 K is presented in Figure 4, while Figures S1 and S2 in Supplementary Materials represent similar distributions for 300 K and 2000 K, respectively. The areas of large probability indicate the most suitable parameters, and an arbitrary set of parameters from these areas can be used, because a little variation of them does not significantly influence the model correspondence to the MD. The absolute value of probability is not indicated in Figure 4,Figures S1 and S2, since it does not make sense due to the lack of normalization in Equation (17). The chosen parameters for all test temperatures are collected in Table 2. Relatively narrow areas of high probability in Figure 4 mean that the used composition of the training data from the MD is enough for unambiguous determination of the model parameters, which holds for the surface tension and relaxation time. Concurrently, stripes along the yield strength and the plastic work of nucleation means that the model results are less sensitive to these parameters.

3. Results

3.1. Compilance of the Model and the MD

Here we consider the case of solid copper at the increased temperature of 1000 K. The fit for the case of room temperature and for the case of melt is on the same level or better; Figures S3 and S4 for 300 K, as well as Figures S5 and S6 for 2000 K are collected in the Supplementary Materials.
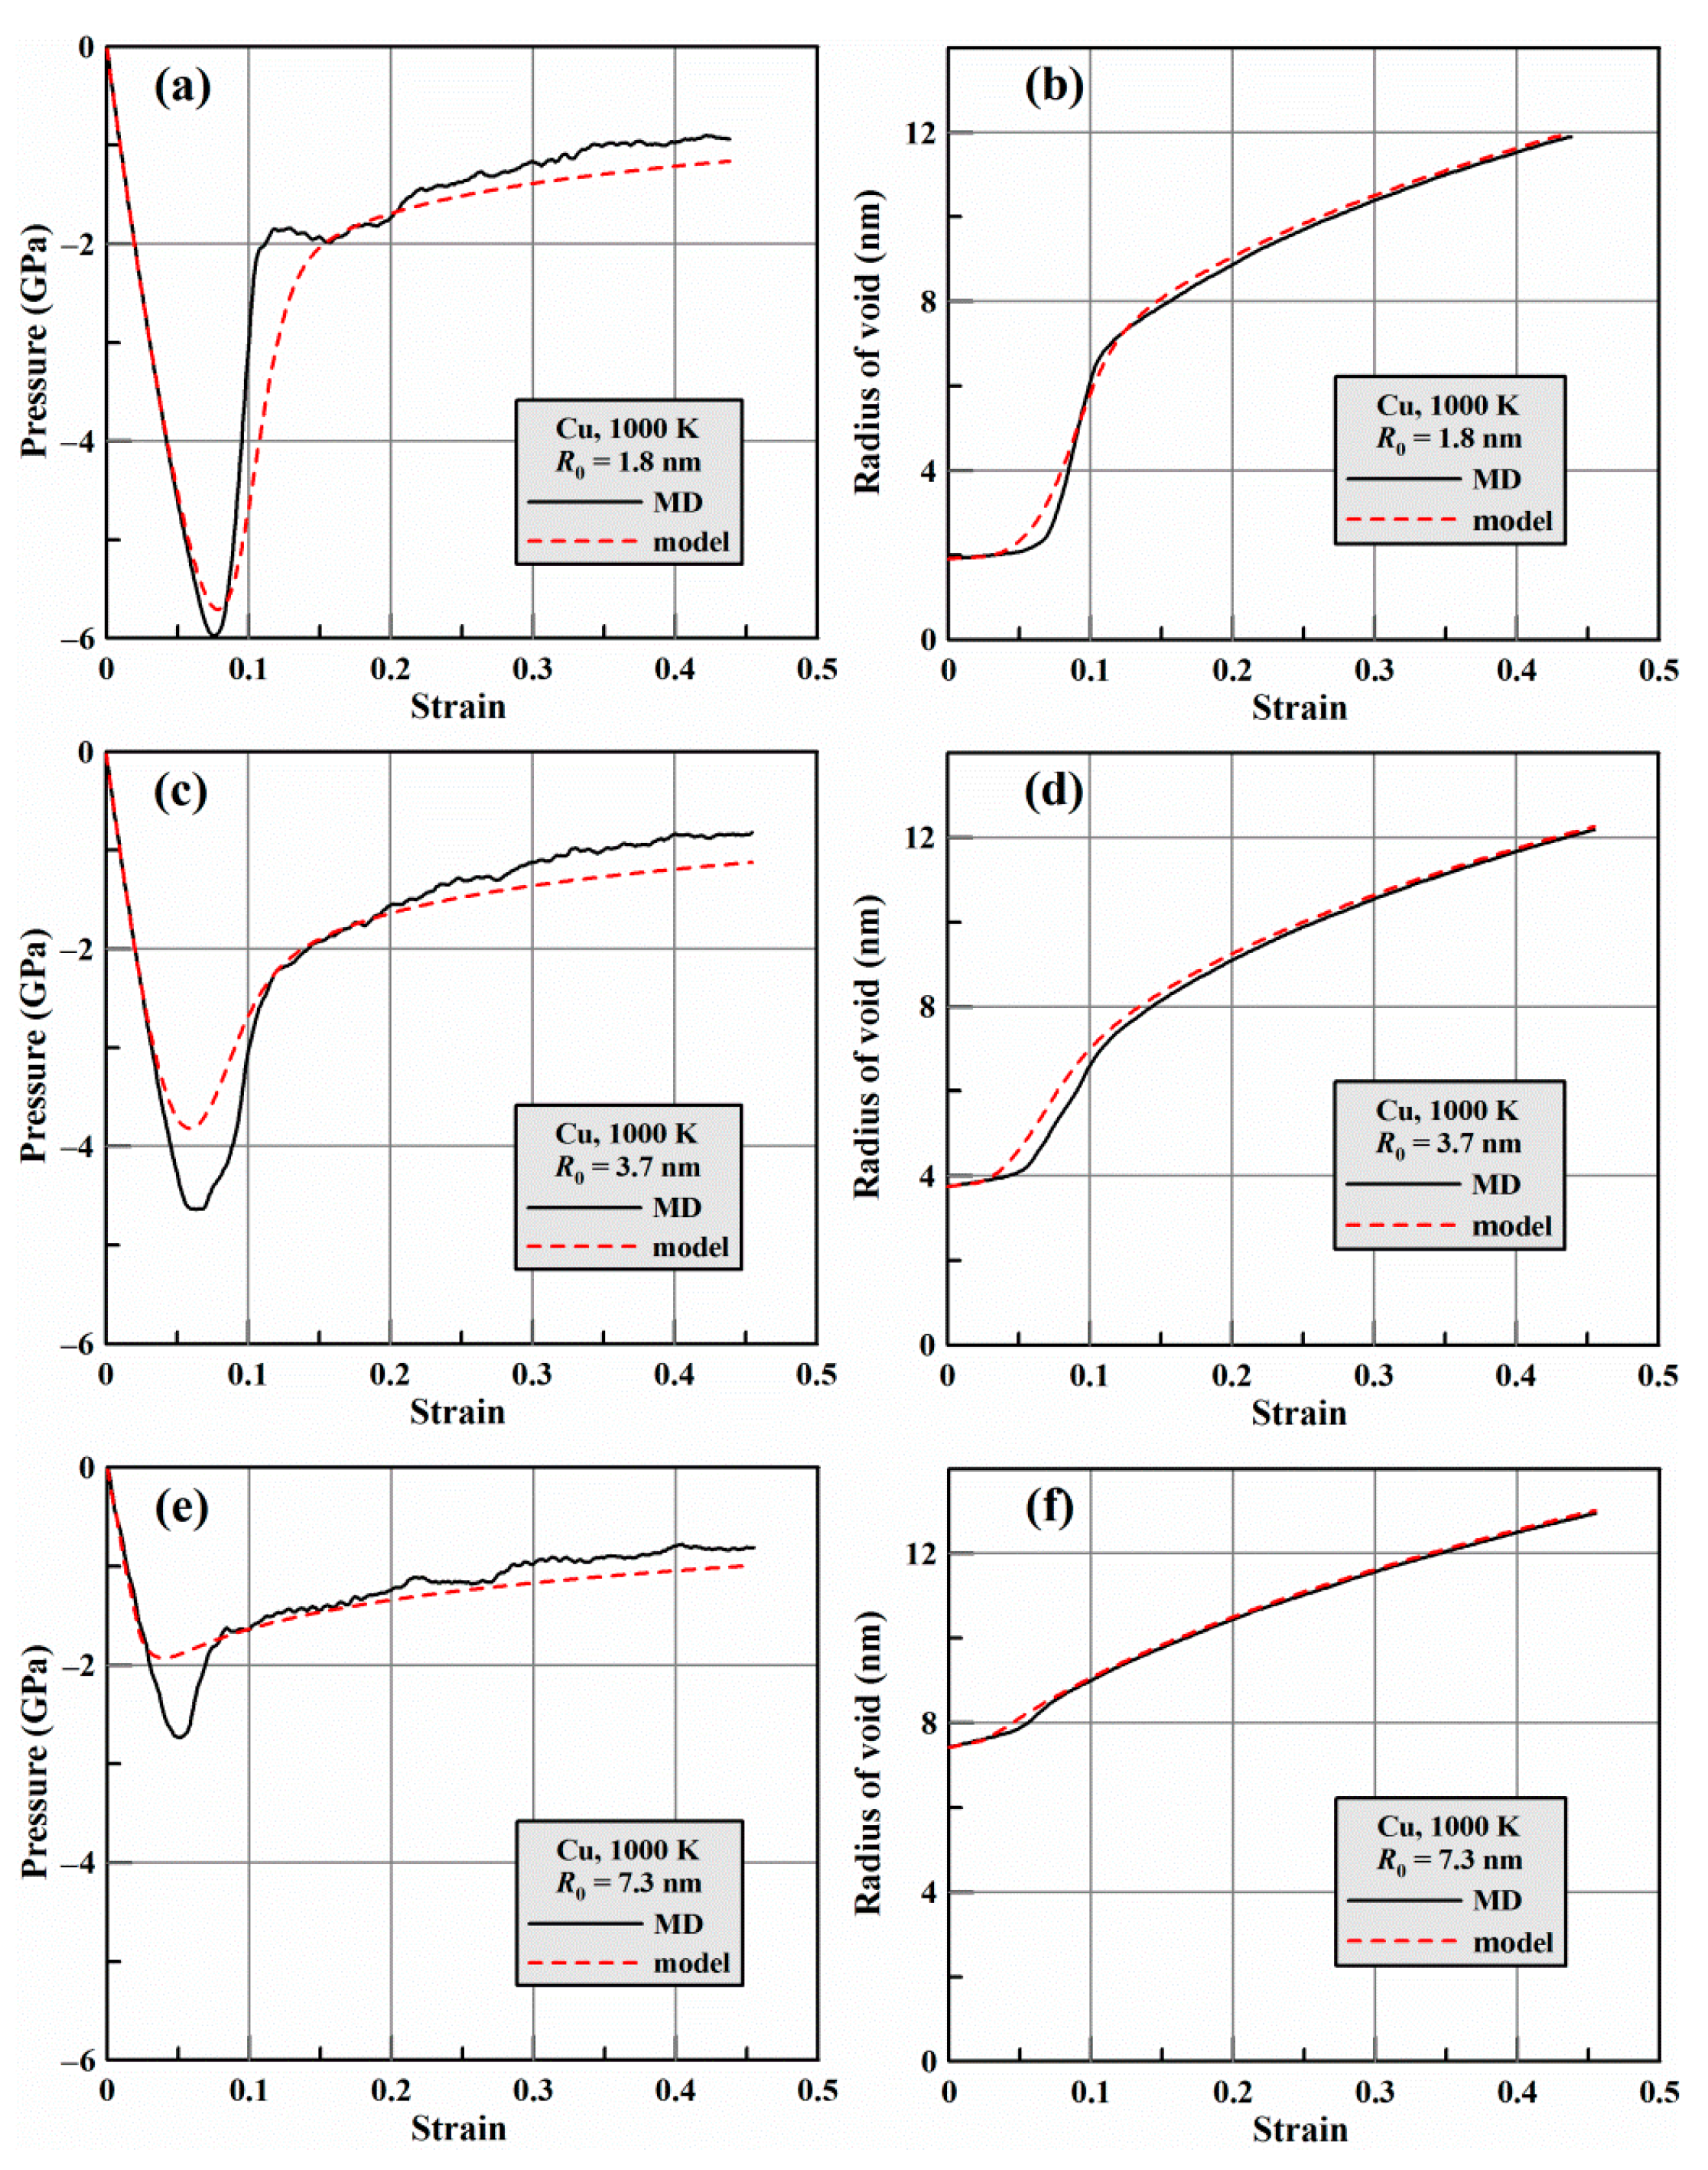
Figure 5 displays the comparison for copper with non-wettable inclusions of three different sizes. In this case, the fracture process is reduced to the activation and growth of voids on the inclusions, and there is no homogeneous nucleation of voids. Voids start to grow at a certain level of negative pressure, which decreases in absolute value with an increase in the radius of inclusion equal to the initial radius of void, as in Figure 5b,d,f. The initial fast growth of voids leads to a rapid relaxation of pressure, Figure 5a,c,e, while the following slower growth mostly compensates the expansion of the RVE. The model adequately reproduces all main stages of the fracture development, while it somewhat overestimates the rate of void growth after its activation and, consequently, underestimates the achieved level of negative pressure. Note that a small difference in the void radius, Figure 5b,d,f, leads to a significant difference in pressure, Figure 5a,c,e.
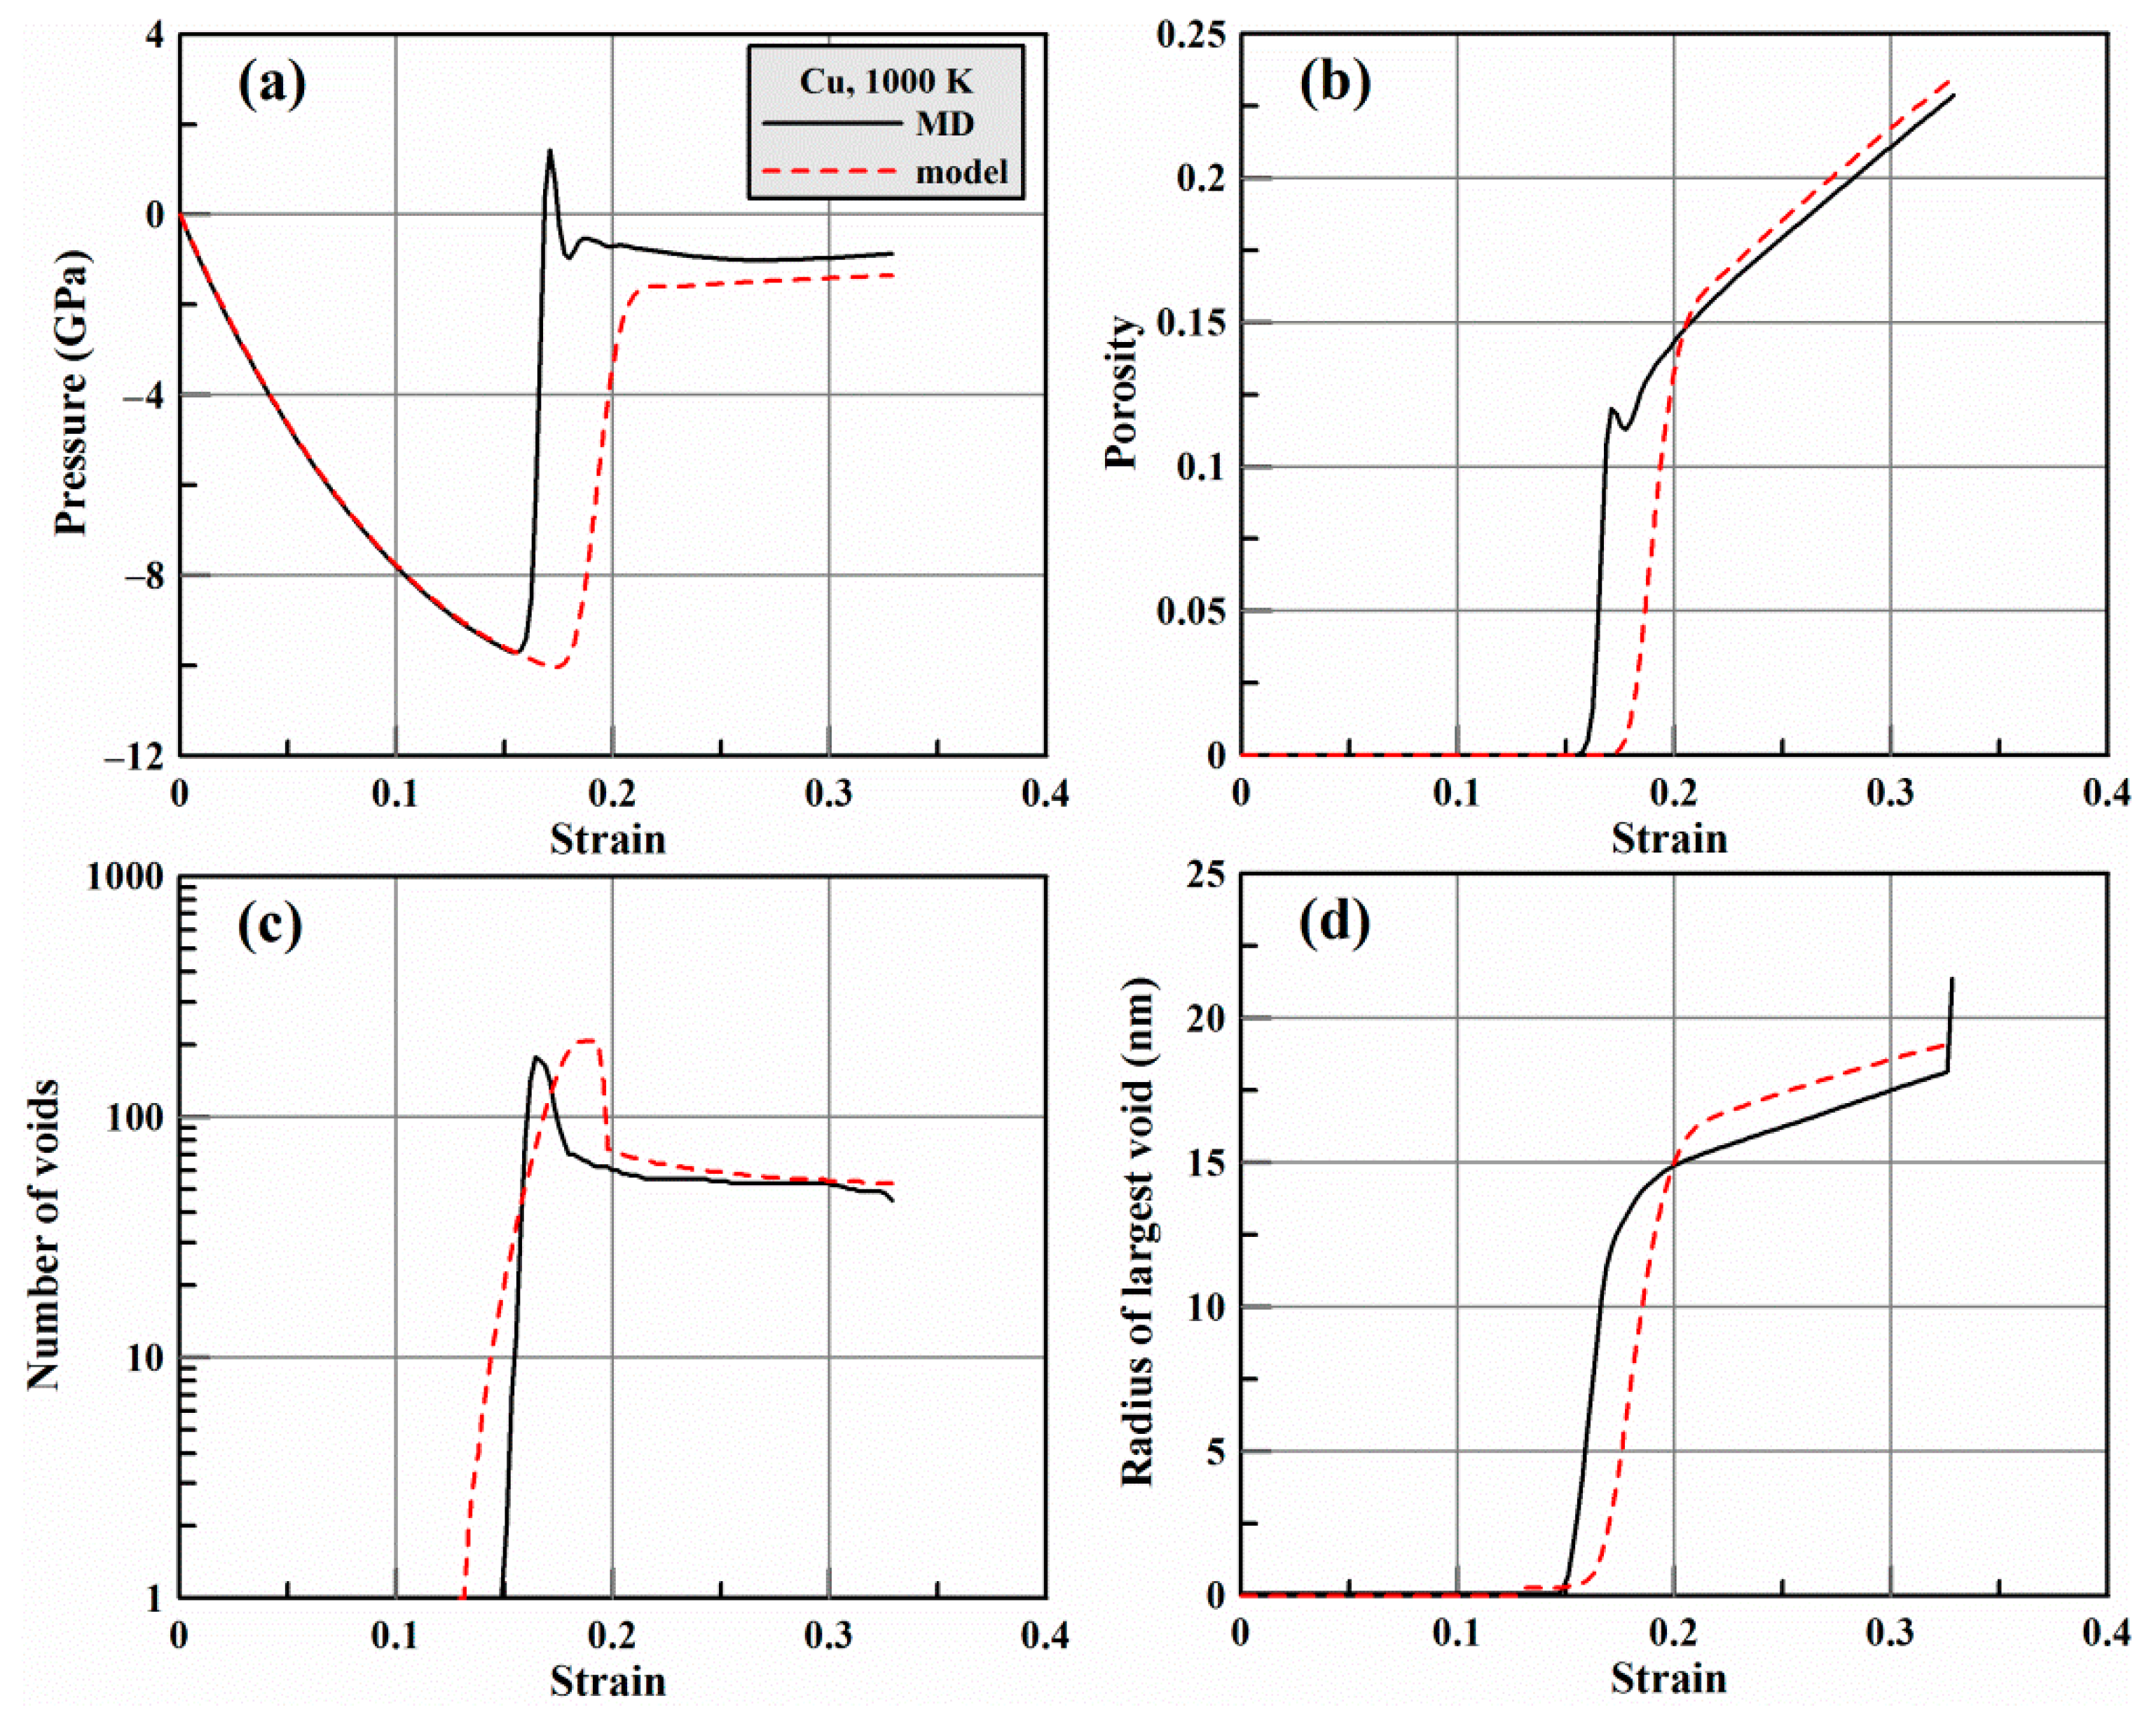
Figure 6 presents the comparison for the case of tension of the initially uniform and defect-free copper, MD system size is 200 × 200 × 200 lattice parameters. The results for the medium MD system are similar. In the case of uniform single crystal, the fracture starts from the homogeneous nucleation of voids, Figure 6c. The number of voids rapidly grows, while the porosity remains small, see Figure 6b, and the negative pressure continues to increase in absolute value, Figure 6a. Thereafter, an accelerated growth of voids begins with sharp increase in porosity and a rapid relaxation of pressure. After the pressure relaxation, the smallest voids become subcritical and collapse in both the MD and the model. In the case of uniform material, the model also correctly predicts the main stages of the fracture development and gives close numerical results. Concurrently, the delay between the pore nucleation and growth is longer in the model than in the MD. Therefore, the mechanical response (Figure 6a) is delayed in comparison with the void nucleation (Figure 6c). Comparing this discrepancy with the opposite one in the case of non-wettable inclusions, one can conclude that the present model underestimates the growth rate of small voids (comparable with the interatomic distance), but overestimates the growth rate of larger ones; this shortcoming should be addressed in future works.

3.2. Strain Rate Dependence of Solid Copper: Influence of Initial Heterogenieties

After the “training” of the fracture model by means of the Bayesian optimization of parameters, the model is used to explore the strain rate dependence of the spall strength of copper at room temperature in a wide range of strain rates, from 10 ms−1 to 1 ns−1. Each point of the strain rate dependence is obtained by means of a separate run of the fracture model with constant strain rate, and the outcome is a single value of the spall strength as the maximum of the absolute value of negative pressure achieved during this run. The behavior of uniform perfect single crystal and the influence of initial heterogeneities with different size distributions are analyzed. These heterogeneities are interpreted as some inclusions, maybe non-wettable, which prevent collapse of surrounding pores until the tension activates growth of the pores (see Section 2.2).
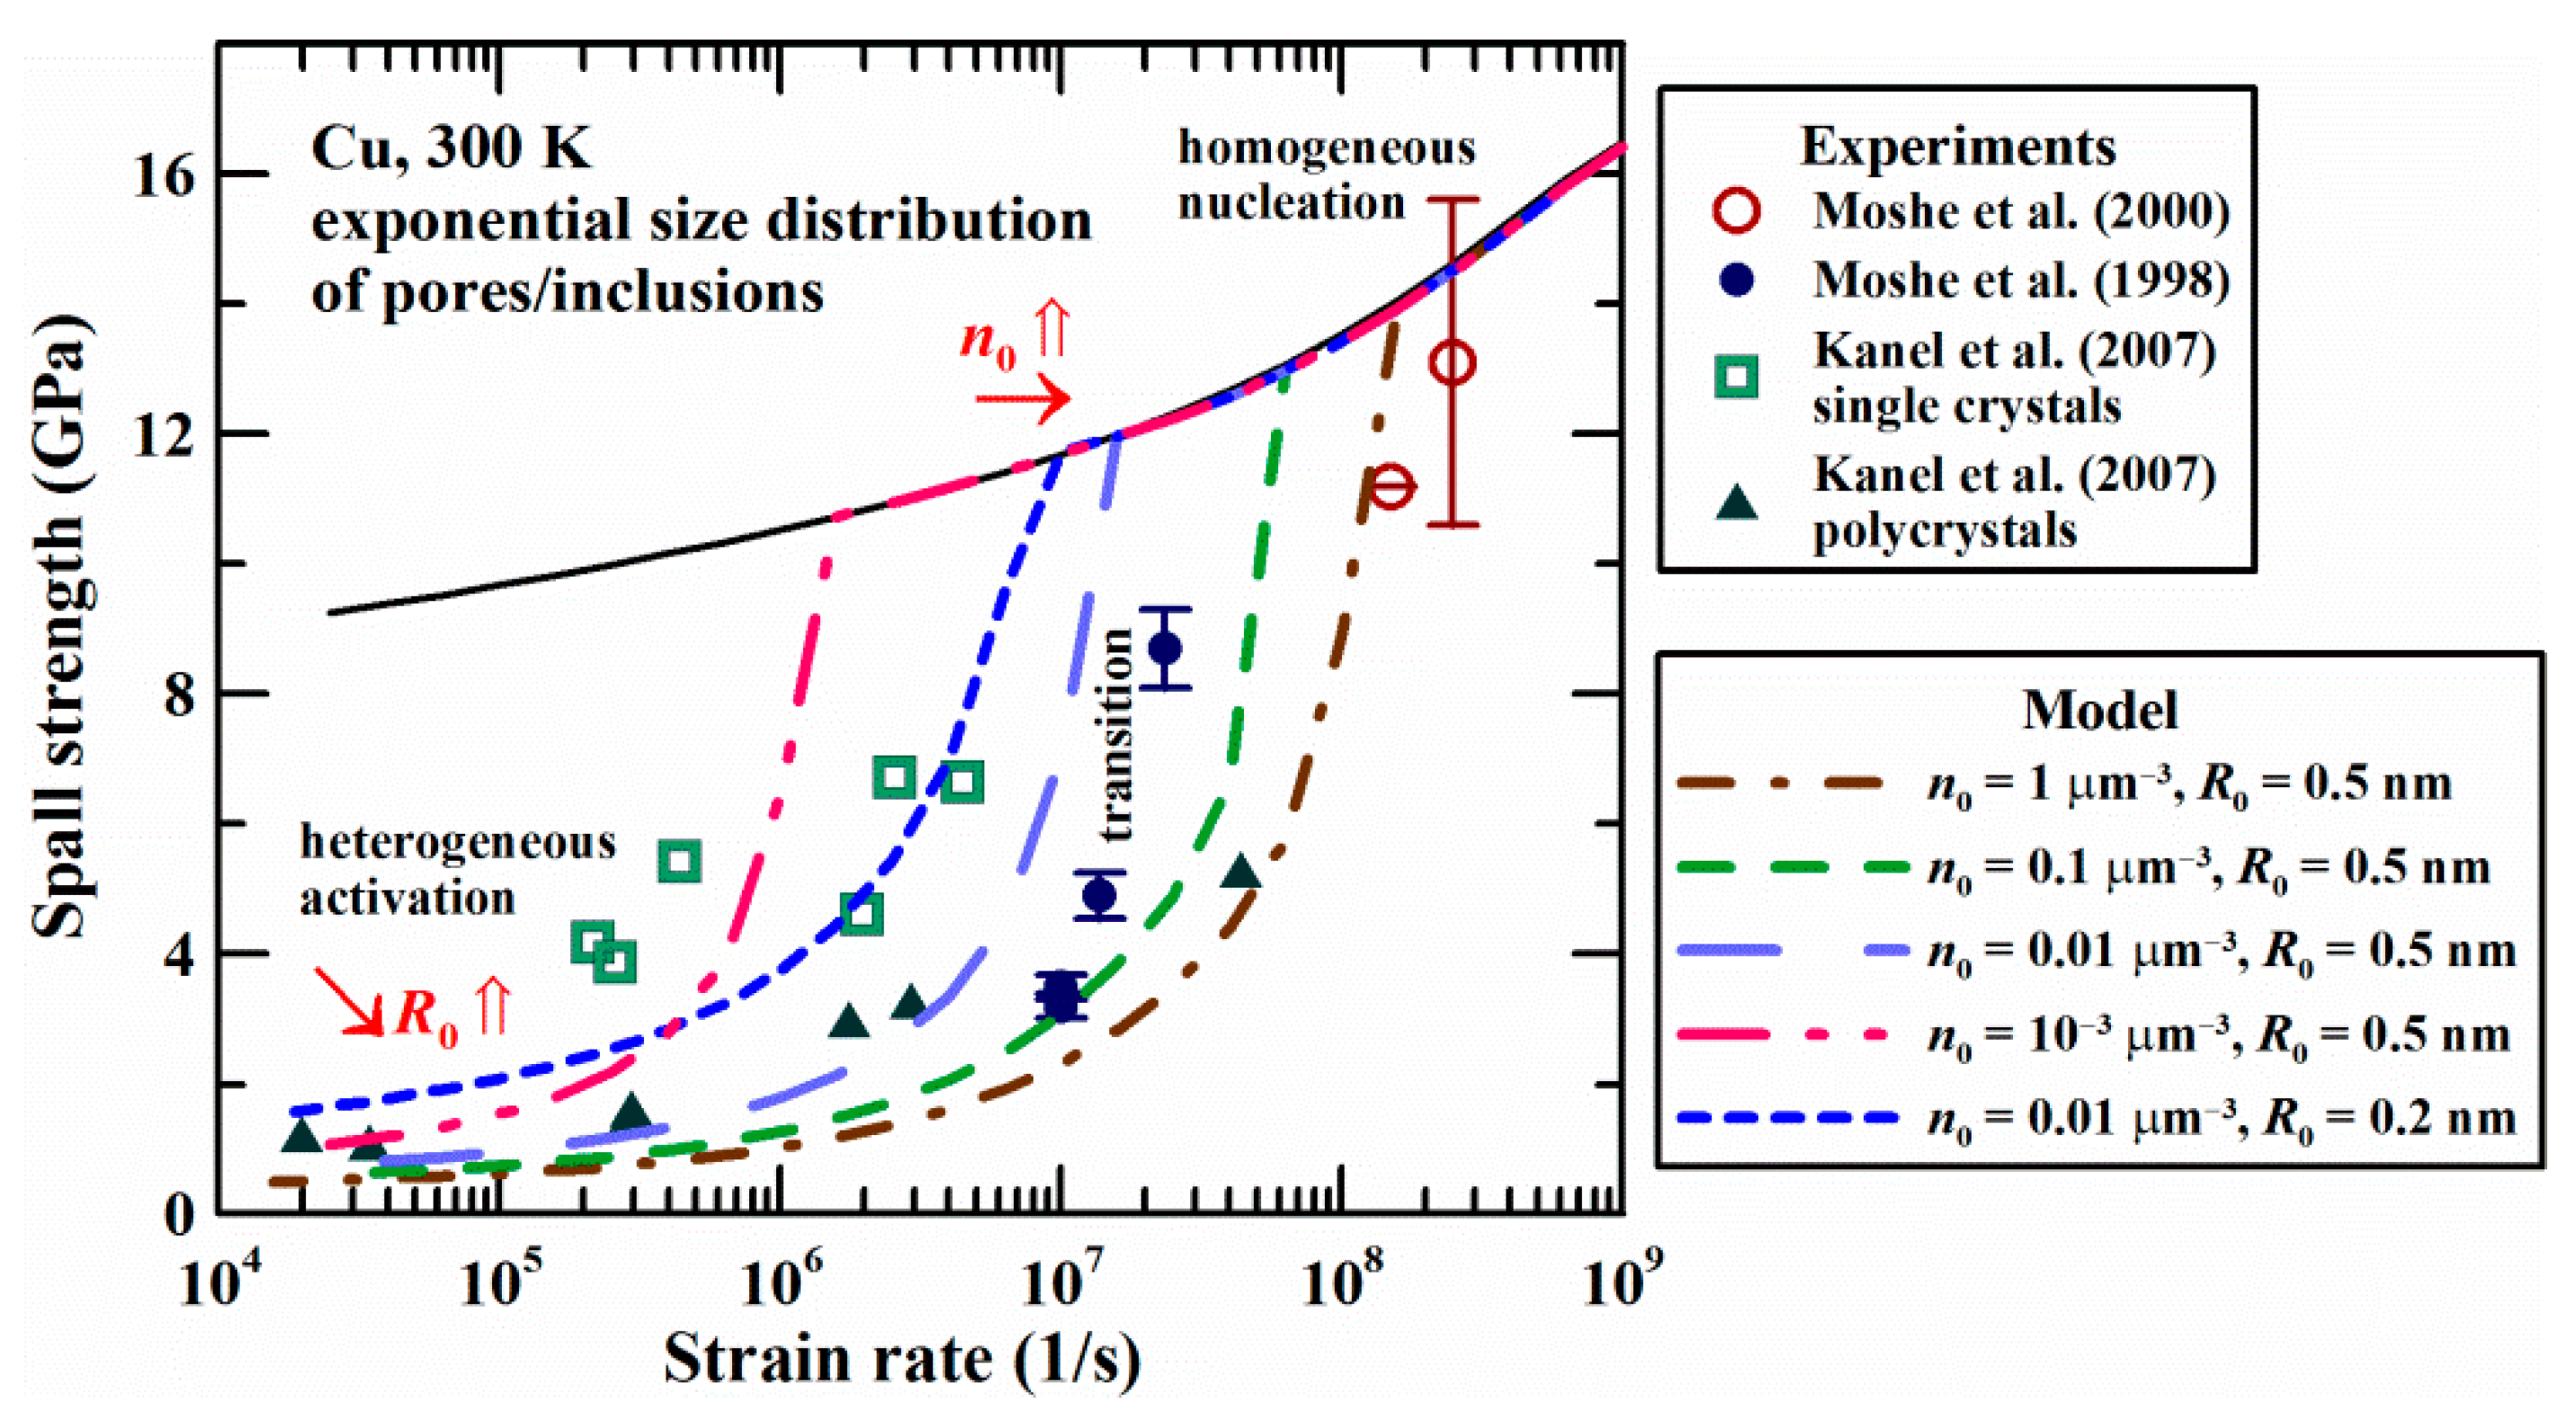
Figure 7 shows the results for monodisperse ensemble of inclusions, Equation (14), as the simplest case of its size distribution. At the moderate strain rates (less than about 106−107 s−1), the fracture develops by the mechanism of heterogeneous activation of voids on inclusions, and the spall strength is completely determined by the size of inclusions; the larger the inclusions, the lower the spall strength. At ultra-high strain rates (above 108 s−1) the inclusions lose their influence, and all curves coincide with that for the uniform perfect single crystal controlled by the homogeneous nucleation of voids. This is because ultra-fast tension requires a high number of voids to compensate this tension, and the existing concentration of pores on inclusions is not enough to accommodate the material tension. In the intermediate range of strain rates (from 106 to 108 s−1), there is a transition from the heterogeneous activation to the homogeneous nucleation of voids, and the spall strength depends on both the radius and concentration of inclusions: The higher the concentration, the higher the strain rate of the transition to homogeneous nucleation.
Figure 7 also compares the model results with the existing experimental data from the literature [15,16,18]. The spall strength in the mode of homogeneous nucleation corresponds to that is observed in [16] for the laser-driven shock waves in thin foils. The transition from the heterogeneous activation to the homogeneous nucleation explains the fast growth of the spall strength at the strain rates above 107 s−1 reported in [15], based on experiments with the laser-driven shock waves. Difference in the size of imperfections can explain the difference in the spall strength of single crystals and polycrystals reported in [18] based on the analysis of the plate impact experiments.
Figure 8 shows the case of exponential size distribution of inclusions, as in Equation (15). The general regularities are close to that for the monodisperse ensemble, but the strain rate dependencies and the transition to the homogeneous nucleation are smoother.
Figure 9 and Figure 10 present the results for the case of power-law size distribution of inclusions. This distribution has an additional parameter A , see Equation (16), and Figure 9 studies the influence of this parameter on the strain rate dependence of the spall strength of copper. Figure 9a shows that an increase in the degree A of the power-law distribution leads to smoothing of the strain rate dependence, while low degree A = 2 leads to a sharp transition to the mode of homogeneous nucleation. According to Figure 9b, the homogeneous nucleation leads to a weak rate dependence of the spall strength σ spall , close the power-law dependence σ spall = ε ˙ δ with the degree δ 0.053 . Rate dependencies of spall strength in the case of inclusions with the power-law size distributions also contain regions close to the power-law dependence on the strain rate, and the degree of this dependence δ decreases with the increase in the degree A of the size dependence.
Figure 10 shows that an increase in the total concentration of inclusions simultaneously decreases the spall strength at moderate strain rates in the mode of heterogeneous activation of voids and increases the threshold strain rates of the transition to the mode of homogeneous nucleation of voids.

4. Discussion

The model of dynamic spall fracture developed in the previous works is verified by the results of MD simulation for solid and molten copper. To identify the parameters of the model, an approach in the form of machine learning based on the Bayesian algorithm is developed; for a large number of random sets of parameters, the probability is estimated as a measure of the compliance of the model with the MD results. The use of this approach allows us to automate the process of choosing parameters and justify the choice itself. The machine learning makes it possible to quickly and formally determine the parameters for the required conditions basing on MD data. Additionally, it is possible to make a conclusion, is the used data set sufficient for an unambiguous choice of parameters and is the model suitable for describing the phenomenon under consideration.
The parameters of the fracture model for solid copper and copper melt are determined. For solid metals, in addition to the full dislocation model of plastic growth of cavities used in the previous papers [35,36], a simplified version has been developed with four parameters: yield strength, shear stress relaxation time, surface tension, and plastic work of nucleation. In this case, the plastic flow is described based on the Maxwell relaxation model with an additionally introduced threshold for the onset of relaxation, which is the yield strength. The full dislocation model contains a larger set of parameters, including the coefficients of dislocation friction and dislocation multiplication, in addition to the strain hardening coefficient. The full dislocation model creates a more physically based and detailed description, considering the local density of linear defects for each pore and their influence on the yield strength and relaxation rate. Nevertheless, the use of a simplified model seems to be justified, since in the most cases it gives a comparable quality of description of MD modeling curves. The model for melts contains two parameters: surface tension and melt viscosity.
In an ideal homogeneous material, as the strain rate decreases, the spall strength decreases much more slowly than in the experiment. The presence of cavities or inhomogeneities weakly linked to the matrix (non-wettable inclusions, gas bubbles) leads at moderate strain rates to destruction by a heterogeneous mechanism through the activation of voids. The limited concentration of volumetric defects causes the transition to homogeneous nucleation at ultrahigh strain rates. A monodisperse ensemble of pores or inclusions corresponds to a sharp transition from a heterogeneous plateau to a homogeneous branch in a narrow range of strain rates. The exponential distribution creates a parabolic increase in strength on the heterogeneous branch. The power-law distribution creates, at certain intervals, an increase in strength close to a power-law one. In particular, when the distribution density ( d n / d R ) is inversely proportional to the radius R to the power A = 8 , the spall strength in the range up to 10 μs−1 is proportional to the strain rate to the power δ = 0.2 ; this power is indicated in a number of works as a generalization of experimental data [23,47], while slightly different powers ranging from about 0.16 to 0.24 are reported in [20]. Conversely, the degree A = 8 leads to δ 1 / 3 expected for brittle solids [48,49,50]. Concurrently, a sharp increase in the spall strength in a limited range of strain rates recorded in several experiments [15,16,17] correlates well with the monodisperse distribution of inhomogeneities near the corresponding spatial scale. Real materials can have a complex combination of different distributions at different scale levels, which lead to a complex rate dependence of the spall strength. For example, a set of volumetric defects of a certain scale associated with the structure of grain boundaries can be superimposed on a power-law distribution of volumetric defects inside the grains, etc. The strong relationship between the strain rate dependence of the spall strength and the size distribution of volumetric defects indicates that the rate dependence is not only a characteristic of the material itself, but also depends on the technology of its manufacturing, processing, and preloading (compression prior to tension).

5. Conclusions

We develop a multiscale approach to numerical investigation of the spall fracture of molten and solid metals and apply it to the case of copper. MD data are used to verify the fracture model of continuum level and to find its parameters by means of machine-learning-type Bayesian identification. Initial volumetric defects, such as pores or non-wettable inclusions, can explain the experimental strain rate dependence of the spall strength. On the basis of the developed model, we investigate the influence of different size distributions of volumetric defects on the character of this strain rate dependence.

Supplementary Materials

The following supporting information can be downloaded at: https://www.mdpi.com/article/10.3390/met12111878/s1, Figure S1: Bayesian identification of parameters for solid copper at the room temperature of 300 K; Figure S2: Bayesian identification of parameters for copper melt at 2000 K; Figure S3: Comparison of the model and the MD for the case of solid copper at 300 K with non-wettable inclusions; Figure S4: Comparison of the model and the MD for the case of uniform solid copper at 300 K; Figure S5: Comparison of the model and the MD for the case of copper melt at 2000 K with non-wettable inclusions; Figure S6: Comparison of the model and the MD for the case of uniform copper melt at 2000 K.

Author Contributions

Conceptualization, P.N.M. and A.E.M.; methodology, P.N.M., V.V.P., D.S.V., and A.E.M.; software, A.E.M. and P.N.M.; validation, V.V.P., D.S.V., and A.E.M.; formal analysis, V.V.P., D.S.V., and A.E.M.; investigation, P.N.M. and A.E.M.; resources, P.N.M.; data curation, A.E.M.; writing—original draft preparation, P.N.M. and A.E.M.; writing—review and editing, A.E.M.; visualization, P.N.M. and A.E.M.; supervision, A.E.M.; project administration, P.N.M.; funding acquisition, P.N.M. All authors have read and agreed to the published version of the manuscript.

Funding

This research and the APC were funded by the Russian Science Foundation, grant number 20-79-10229.

Institutional Review Board Statement

Not applicable.

Informed Consent Statement

Not applicable.

Data Availability Statement

The most essential data of MD simulations are presented in graphical form in the Article and Supplementary Materials, the fracture model and its coefficients are presented in the Article. Other data are available upon request.

Acknowledgments

Computational resources of the Tornado SUSU supercomputer (South Ural State University, Chelyabinsk, Russia) are used for the large-scale MD simulations.

Conflicts of Interest

The authors declare no conflict of interest.

References

  1. Liang, J.W.; Shen, Y.F.; Li, Y.Z.; Feng, X.W.; Wang, G.D. Nanosized precipitates activating ultrahigh strength of an ultrafine-grained ferritic steel during dynamic deformation. Mater. Sci. Eng. A 2022, 841, 143040. [Google Scholar] [CrossRef]
  2. Zhong, X.; Zhang, Q.; Ma, M.; Xie, J.; Wu, M.; Ren, S.; Yan, Y. Dynamic compressive properties and microstructural evolution of Al1.19Co2CrFeNi1.81 eutectic high entropy alloy at room and cryogenic temperatures. Mater. Des. 2022, 219, 110724. [Google Scholar] [CrossRef]
  3. Zhou, T.; Zhao, F.; Zhou, H.; Zhang, F.; Wang, P. Atomistic simulation and continuum modeling of the dynamic tensile fracture and damage evolution of solid single crystalline Al with He bubble. Int. J. Mech. Sci. 2022, 234, 107681. [Google Scholar] [CrossRef]
  4. Jiang, D.-D.; Shao, J.-L.; Wu, B.; Wang, P.; He, A.-M. Sudden change of spall strength induced by shock defects based on atomistic simulation of single crystal aluminum. Scripta Mater. 2022, 210, 114474. [Google Scholar] [CrossRef]
  5. Jiang, D.-D.; Zhou, T.-T.; Wang, P.; He, A.-M. Dynamic tensile fracture of liquid copper containing helium bubbles. Int. J. Mech. Sci. 2022, 232, 107585. [Google Scholar] [CrossRef]
  6. Bryukhanov, I.A. Atomistic simulation of the shock wave in copper single crystals with pre-existing dislocation network. Int. J. Plast. 2022, 151, 103171. [Google Scholar] [CrossRef]
  7. Mayer, P.N.; Mayer, A.E. Size distribution of pores in metal melts at non-equilibrium cavitation and further stretching, and similarity with the spall fracture of solids. Int. J. Heat Mass Transf. 2018, 127, 643–657. [Google Scholar] [CrossRef]
  8. Ashitkov, S.I.; Komarov, P.S.; Struleva, E.V.; Agranat, M.B.; Kanel, G.I. Mechanical and optical properties of vanadium under shock picosecond loads. JETP Lett. 2015, 101, 276–281. [Google Scholar] [CrossRef]
  9. Zuanetti, B.; McGrane, S.D.; Bolme, C.A.; Prakash, V. Measurement of elastic precursor decay in pre-heated aluminum films under ultra-fast laser generated shocks. J. Appl. Phys. 2018, 123, 195104. [Google Scholar] [CrossRef] [Green Version]
  10. Merkel, S.; Hok, S.; Bolme, C.; Rittman, D.; Ramos, K.J.; Morrow, B.; Lee, H.J.; Nagler, B.; Galtier, E.; Granados, E.; et al. Femtosecond Visualization of hcp-iron strength and plasticity under shock compression. Phys. Rev. Let. 2021, 127, 205501. [Google Scholar] [CrossRef]
  11. Murzov, S.A.; Ashitkov, S.I.; Struleva, E.V.; Komarov, P.S.; Khokhlov, V.A.; Zhakhovskii, V.V.; Inogamov, N.A. Elastoplastic and polymorphic transformations in iron films loaded by ultrashort laser shock waves. J. Exp. Theor. Phys. 2022, 134, 263–276. [Google Scholar] [CrossRef]
  12. Mayer, A.E. Micromechanical model of nanoparticle compaction and shock waves in metal powders. Int. J. Plast. 2021, 147, 103102. [Google Scholar] [CrossRef]
  13. Mayer, A.E.; Lekanov, M.V.; Grachyova, N.A.; Fomin, E.V. Machine-Learning-Based Model of Elastic-Plastic Deformation of Copper for Application to Shock Wave Problem. Metals 2022, 12, 402. [Google Scholar] [CrossRef]
  14. Latypov, F.T.; Fomin, E.V.; Krasnikov, V.S.; Mayer, A.E. Dynamic compaction of aluminum with nanopores of varied shape: MD simulations and machine-learning-based approximation of deformation behavior. Int. J. Plast. 2022, 156, 103363. [Google Scholar] [CrossRef]
  15. Moshe, E.; Eliezer, S.; Dekel, E.; Ludmirsky, A.; Henis, Z.; Werdiger, M.; Goldberg, I.B.; Eliaz, N.; Eliezer, D. An increase of the spall strength in aluminum, copper, and Metglas at strain rates larger than 107 s−1. J. Appl. Phys. 1998, 83, 4004–4011. [Google Scholar] [CrossRef] [Green Version]
  16. Moshe, E.; Eliezer, S.; Henis, Z.; Werdiger, M.; Dekel, E.; Horovitz, Y.; Maman, S.; Goldberg, I.B.; Eliezer, D. Experimental measurements of the strength of metals approaching the theoretical limit predicted by the equation of state. Appl. Phys. Let. 2000, 76, 1555. [Google Scholar] [CrossRef]
  17. Werdiger, M.; Eliezer, S.; Moshe, E.; Henis, Z.; Dekel, E.; Horovitz, Y.; Arad, B. Al and Cu dynamic strength at a strain rate of 5*108 s–1. AIP Conf. Proc. 2002, 620, 583. [Google Scholar] [CrossRef]
  18. Kanel, G.I.; Fortov, V.E.; Razorenov, S.V. Shock waves in condensed-state physics. Phys.-Usp. 2007, 50, 771–791. [Google Scholar] [CrossRef]
  19. Dudarev, E.F.; Markov, A.B.; Mayer, A.E.; Bakach, G.P.; Tabachenko, A.N.; Kashin, O.A.; Pochivalova, G.P.; Skosyrskii, A.B.; Kitsanov, S.A.; Zhorovkov, M.F.; et al. Spall fracture patterns for the heterophase Cu–Al–Ni alloy in ultrafine- and coarse-grained states exposed to a nanosecond relativistic high-current electron beam. Rus. Phys. J. 2013, 55, 1451–1457. [Google Scholar] [CrossRef]
  20. Abrosimov, S.A.; Bazhulin, A.P.; Voronov, V.V.; Geras’kin, A.A.; Krasyuk, I.K.; Pashinin, P.P.; Semenov, A.Y.; Stuchebryukhov, I.A.; Khishchenko, K.V.; Fortov, V.E. Specific features of the behaviour of targets under negative pressures created by a picosecond laser pulse. Quantum Electron. 2013, 43, 246–251. [Google Scholar] [CrossRef]
  21. Kanel, G.I.; Savinykh, A.S.; Garkushin, G.V.; Razorenov, S.V. Effects of temperature and strain on the resistance to high-rate deformation of copper in shock waves. J. Appl. Phys. 2020, 128, 115901. [Google Scholar] [CrossRef]
  22. Antoun, T.; Seaman, L.; Curran, D.R.; Kanel, G.I.; Razorenov, S.V.; Utkin, A.V. Spall Fracture; Springer: New York, NY, USA, 2003. [Google Scholar] [CrossRef] [Green Version]
  23. Kanel, G.I. Spall fracture: Methodological aspects, mechanisms and governing factors. Int. J. Fract. 2010, 163, 173–191. [Google Scholar] [CrossRef]
  24. Gnyusov, S.F.; Rotshtein, V.P.; Mayer, A.E.; Rostov, V.V.; Gunin, A.V.; Khishchenko, K.V.; Levashov, P.R. Simulation and experimental investigation of the spall fracture of 304L stainless steel irradiated by a nanosecond relativistic high-current electron beam. Int. J. Fract. 2016, 199, 59–70. [Google Scholar] [CrossRef]
  25. Saveleva, N.V.; Bayandin, Y.V.; Savinykh, A.S.; Garkushin, G.V.; Razorenov, S.V.; Naimark, O.B. The formation of elastoplastic fronts and spall fracture in amg6 alloy under shock-wave loading. Tech. Phys. Let. 2018, 44, 823–826. [Google Scholar] [CrossRef]
  26. de Resseguier, T.; Signor, L.; Dragon, A.; Boustie, M.; Roy, G.; Llorca, F. Experimental investigation of liquid spall in laser shock-loaded tin. J. Appl. Phys. 2007, 101, 013506. [Google Scholar] [CrossRef]
  27. Agranat, M.B.; Anisimov, S.I.; Ashitkov, S.I.; Zhakhovskii, V.V.; Inogamov, N.A.; Komarov, P.S.; Ovchinnikov, A.V.; Fortov, V.E.; Khokhlov, V.A.; Shepelev, V.V. Strength properties of an aluminum melt at extremely high tension rates under the action of femtosecond laser pulse. JETP Lett. 2010, 91, 471–477. [Google Scholar] [CrossRef]
  28. Kuksin, A.Y.; Norman, G.E.; Pisarev, V.V.; Stegailov, V.V.; Yanilkin, A.V. Theory and molecular dynamics modeling of spall fracture in liquids. Phys. Rev. B 2010, 82, 174101. [Google Scholar] [CrossRef] [Green Version]
  29. Mayer, A.E.; Mayer, P.N. Continuum model of tensile fracture of metal melts and its application to a problem of high-current electron irradiation of metals. J. Appl. Phys. 2015, 118, 035903. [Google Scholar] [CrossRef]
  30. Wang, X.-X.; Zhou, T.-T.; Sun, Z.-Y.; Shi, X.-F.; Sun, H.-Q.; Zhang, F.-G.; Yin, J.-W.; He, A.-M.; Wang, P. Micro-spall damage and subsequent re-compaction of release melted lead under shock loading. Comput. Mat. Sci. 2022, 203, 111178. [Google Scholar] [CrossRef]
  31. Liao, Y.; Hong, S.; Ge, L.; Chen, J.; Xiang, M. Shock wave characteristics and spalling behavior of non-coherent Cu/Nb multilayers. Mech. Mater. 2022, 173, 104439. [Google Scholar] [CrossRef]
  32. Ma, K.; Dongare, A.M. Role of α→ε→α phase transformation on the spall behavior of iron at atomic scales. J. Mater. Sci. 2022, 57, 12556–12571. [Google Scholar] [CrossRef]
  33. Plimpton, S.J. Fast parallel algorithms for short-range molecular dynamics. J. Comp. Phys. 1995, 117, 1–19. [Google Scholar] [CrossRef] [Green Version]
  34. Mishin, Y.; Mehl, M.J.; Papaconstantopoulos, D.A.; Voter, A.F.; Kress, J.D. Structural stability and lattice defects in copper: Ab initio, tight-binding, and embedded-atom calculations. Phys. Rev. B 2001, 63, 224106. [Google Scholar] [CrossRef] [Green Version]
  35. Mayer, A.E.; Mayer, P.N. Strain rate dependence of spall strength for solid and molten lead and tin. Int. J. Fract. 2020, 222, 171–195. [Google Scholar] [CrossRef]
  36. Mayer, A.E.; Mayer, P.N. Evolution of pore ensemble in solid and molten aluminum under dynamic tensile fracture: Molecular dynamics simulations and mechanical models. Int. J. Mech. Sci. 2019, 157–158, 816–832. [Google Scholar] [CrossRef]
  37. Hoover, W.G. Canonical dynamics: Equilibrium phase-space distributions. Phys. Rev. A 1985, 31, 1695–1697. [Google Scholar] [CrossRef] [Green Version]
  38. Mayer, P.N.; Mayer, A.E. Evolution of foamed aluminum melt at high rate tension: A mechanical model based on atomistic simulations. J. Appl. Phys. 2018, 124, 035901. [Google Scholar] [CrossRef]
  39. Thompson, A.P.; Plimpton, S.J.; Mattson, W. General formulation of pressure and stress tensor for arbitrary many-body interaction potentials under periodic boundary conditions. J. Chem. Phys. 2009, 131, 154107. [Google Scholar] [CrossRef] [Green Version]
  40. Stukowski, A. Visualization and analysis of atomistic simulation data with OVITO—The Open Visualization Tool. Model. Simul. Mater. Sci. Eng. 2010, 18, 015012. [Google Scholar] [CrossRef]
  41. Stukowski, A. Computational analysis methods in atomistic modeling of crystals. JOM 2014, 66, 399–407. [Google Scholar] [CrossRef]
  42. Stukowski, A.; Bulatov, V.V.; Arsenlis, A. Automated identification and indexing of dislocations in crystal interfaces. Model. Simul. Mater. Sci. Eng. 2012, 20, 085007. [Google Scholar] [CrossRef]
  43. Mayer, P.N.; Mayer, A.E. Late stages of high rate tension of aluminum melt: Molecular dynamic simulation. J. Appl. Phys. 2016, 120, 075901. [Google Scholar] [CrossRef]
  44. Rayleigh, L. On the pressure developed in a liquid during the collapse of a spherical cavity. Phil. Mag. 1917, 34, 94–98. [Google Scholar] [CrossRef]
  45. Plesset, M.S. The dynamics of cavitation bubbles. ASME J. Appl. Mech. 1949, 16, 228–231. [Google Scholar] [CrossRef]
  46. Popova, T.V.; Mayer, A.E.; Khishchenko, K.V. Evolution of shock compression pulses in polymethylmethacrylate and aluminum. J. Appl. Phys. 2018, 123, 235902. [Google Scholar] [CrossRef]
  47. Kanel, G.I.; Zaretsky, E.B.; Razorenov, S.V.; Ashitkov, S.I.; Fortov, V.E. Unusual plasticity and strength of metals at ultra-short load durations. Phys.-Usp. 2017, 60, 490–508. [Google Scholar] [CrossRef] [Green Version]
  48. Grady, D.E. The spall strength of condensed matter. J. Mech. Phys. Solids 1988, 36, 353–384. [Google Scholar] [CrossRef]
  49. Kanel, G.I.; Garkushin, G.V.; Savinykh, A.S.; Razorenov, S.V.; Paramonova, I.V.; Zaretsky, E.B. Effect of small pre-strain on the resistance of molybdenum 100 single crystal to high strain rate deformation and fracture. J. Appl. Phys. 2022, 131, 095903. [Google Scholar] [CrossRef]
  50. Kanel, G.I.; Razorenov, S.V.; Utkin, A.V.; Fortov, V.E.; Baumung, K.; Karow, H.U.; Rusch, D.; Licht, V. Spall strength of molybdenum single crystals. J. Appl. Phys. 1993, 74, 7162–7165. [Google Scholar] [CrossRef]
Figure 1. MD simulations of the dynamic tensile fracture of copper at room temperature (300 K): (a) Homogeneous nucleation of voids coated by dislocations; (b) Abrupt plastic growth of voids with the dislocation coats indicating zones of plastic flow around the voids; (c) Intersection of the plastic flow zones. The void surfaces and dislocation lines are shown; MD system with 13.5 million atoms.
Metals 12 01878 g001
Figure 2. MD simulations of the dynamic tensile fracture of copper melt at 2000 K: (a) Homogeneous nucleation of multiple voids; (b) Abrupt viscous growth of voids; (c) Collapse of small voids and growth of large ones after the relaxation of pressure. The void surfaces and copper atoms with increased energy are shown; MD system with 13.5 million atoms.
Metals 12 01878 g002
Figure 3. Data of MD simulations with the moderate MD system (13.5 million atoms) and the large MD system (32 million atoms) at three considered test temperatures: (a) Evolution of pressure with strain and (b) evolution of the radius of the largest void in the system.
Metals 12 01878 g003
Figure 4. Bayesian identification of parameters: Probability distributions in the space of model parameters for solid copper at the increased temperature of 1000 K; 80,000 parameter points. Subfigures show distributions along the following pairs of parameters: (a) the yield strength and the relaxation time; (b) the surface tension and the plastic work of nucleation.
Metals 12 01878 g004
Figure 5. Comparison of the model and MD data for the case of copper at 1000 K with non-wettable inclusions of three different initial radii: Evolution of (a,c,e) pressure and (b,d,f) void radius.
Metals 12 01878 g005
Figure 6. Comparison of the model and MD data for the case of uniform copper at 1000 K: Evolution of (a) pressure, (b) porosity, (c) number of voids, and (d) radius of the largest void.
Metals 12 01878 g006
Figure 7. Influence of a monodisperse ensemble of pores or non-wettable inclusions on the strain rate dependence of the spall strength of copper at room temperature: Model results in comparison with the experimental data of Moshe et al. (1998) [15], Moshe et al. (2000) [16], and Kanel et al. (2007) [18]. Solid black curve shows the case of uniform perfect single crystal, in which the homogeneous nucleation of voids triggers the fracture.
Metals 12 01878 g007
Figure 8. Influence of initial pores or non-wettable inclusions with an exponential size distribution on the strain rate dependence of the spall strength of copper at room temperature; model results in comparison with the experimental data of Moshe et al. (1998) [15], Moshe et al. (2000) [16], and Kanel et al. (2007) [18].
Metals 12 01878 g008
Figure 9. Influence of initial pores or non-wettable inclusions with a power-law size distribution with different degree A on the strain rate dependence of the spall strength of copper at room temperature; (a) Model results in comparison with the experimental data of Moshe et al. (1998) [15], Moshe et al. (2000) [16], and Kanel et al. (2007) [18]; (b) approximation of the strain rate dependence of spall strength by a power function; R 0 = 0.5   nm and n 0 = 1   μ m 3 .
Metals 12 01878 g009
Figure 10. Influence of initial pores or non-wettable inclusions with a power-law size distribution with different total concentration on the strain rate dependence of the spall strength of copper at room temperature; model results in comparison with the experimental data of Moshe et al. (1998) [15], Moshe et al. (2000) [16], and Kanel et al. (2007) [18]; R 0 = 0.5   nm .
Metals 12 01878 g010
Table 1. Elastic constants: K 1 , K 2 , and K 3 are the coefficients of the pressure-volume relation determined with the used interatomic potential proposed in [34]; μ is the Poisson’s coefficient.
Temperature K 1 (GPa) K 2 (GPa) K 3 (GPa) μ
300 K1383331920.337
1000 K1103563230.337
2000 K582565170
Table 2. Identified parameters of the fracture model (copper): γ is the surface tension coefficient; W p is the plastic work of void nucleation in solids; Y is the yield strength;   τ is the relaxation time; η is the viscosity coefficient.
Temperature γ (J/m2) W p (eV) Y (GPa) τ (ps) η (Pa × s)
300 K1.00.081.86
1000 K1.10.081.82.7
2000 K0.653⋅10−3
Publisher’s Note: MDPI stays neutral with regard to jurisdictional claims in published maps and institutional affiliations.