Article

Correlation between Precipitation and Recrystallisation during Stress Relaxation in Titanium Microalloyed Steel

1
School of Material Science and Engineering, Jiangsu University, Zhenjiang 212013, China
2
Guangdong Key Laboratory for Advanced Metallic Materials Processing, South China University of Technology, Guangzhou 510640, China
*
Author to whom correspondence should be addressed.
Metals 2022, 12(11), 1920; https://doi.org/10.3390/met12111920
Submission received: 11 October 2022 / Revised: 31 October 2022 / Accepted: 3 November 2022 / Published: 9 November 2022

Abstract

:
This study investigated the correlation between strain-induced precipitation (SIP) and static recrystallisation (SRX) in Ti microalloyed steel during stress relaxation after controlled compression. The final compression temperature strongly influenced the order of SIP and SRX and thus the evolution of the austenite structure. Precipitation-time-temperature (PTT) curve obtained for the experimental steel exhibited an inverted “S” shape. A recrystallisation kinetics model revealed that SRX, which occurs preferentially above 940 °C, resulted in delayed subsequent SIP, thus causing deviation in the PTT curve from the typical ‘C’ shape. Below 940 °C, the fastest nose temperature for precipitation was located at 900 °C, and the precipitate was constituted by TiC particles with a NaCl-type FCC structure. The dynamic competition between SIP and SRX processes were evaluated by comparing the relative magnitude of the recrystallisation driving force and precipitation pinning force during stress relaxation, combined with the evolution of precipitate and austenitic structure. The results indicated that the plateau period occurred because of the precipitation pinning effect inhibited recrystallisation-induced austenite softening. However, the non-uniform distribution of SIP restricted the mobility of the boundaries to a portion of the austenite grains, resulting in abnormal grain growth during the plateau period.

1. Introduction

Highly cost-effective steel products and production processes are developed to address global warming caused by carbon emissions [1,2]. High-strength low-alloy (HSLA) steel, prepared through thermo-mechanical control process (TMCP), is an optimal product with advantages such as low cost, high productivity, and excellent mechanical properties. TCMP can be employed to control grain growth and the distribution of microalloy precipitation by using reasonable process parameters at low carbon and trace alloying elements, without requiring complex heat treatments [3,4]. Moreover, advanced surface modifications such as laser heat treatment, plasma spraying and shot peening, further provide HSLA steel with excellent surface hardness, corrosion resistance and wear resistance [5].
Ti is a commonly used microalloying element with the advantage of low-cost production, especially owing to its abundant deposits. However, the Ti-containing precipitate types are complex, thereby making the control of properties challenging [6]. Using advanced technologies such as clean steel smelting, continuous casting, and TMCP, nanoscale precipitated particles in Ti microalloyed steels have been controlled to develop Ti microalloyed steels with yield strengths higher than 700 MPa [7,8,9,10]. Studies have revealed that the increase in yield strength is attributable to grain refinement and precipitation strengthening [11,12]. Precipitation strengthening is the predominant strengthening mechanism resulting in the diffuse distribution of nanoscale carbides and thus an increase of approximately 158 MPa in yield strength [8].
Because of the prevailing precipitation strengthening effect, most previous studies on Ti microalloyed steels have attempted to maximise precipitation strengthening, especially by controlling the balance between stain-induced precipitation (SIP) during rolling and the diffuse precipitation during coiling [12,13,14,15]. SIP has been analysed using high temperature flow curves [16], two-stage interrupted compression [7,17], stress relaxation [18,19,20] and thermal resistivity measurement methods [21]; among these, the stress relaxation method is extensively used as it provides a more efficient and sensitive detection of SIP occurrence [22]. The SIP process during stress relaxation inhibits the decrease in stress due to recovery and static recrystallisation (SRX). Thus, the information on recrystallisation and austenite structure evolution after the onset of SIP is lacking It is well known that recrystallization controlled rolling influences the final grain size to a large extent [2]. In contrast, with non-recrystallisation controlled rolling, lower rolling temperatures will lead to incomplete SRX, while inducing SIP of microalloyed carbide [3]. The occurrence of SRX increases the inhomogeneity of the austenite grain and thus affects fine grain strengthening [23]. SIP results in delayed SRX, but depletes the microalloyed elements dissolved in the matrix, which severely affects subsequent precipitation strengthening [24]. Therefore, the correlation between SIP and SRX during stress relaxation should be investigated to control the grain size of austenite and the degree of precipitation.
This work aimed to investigate the correlation between SIP and SRX in Ti microalloyed steel after controlled compression. The SIP kinetics and precipitation phase after compression were investigated using the stress relaxation method and transmission electron microscopy (TEM). Furthermore, SRX during stress relaxation and its effects on grain refinement were investigated by calculating recrystallisation kinetics. In addition to the effects of temperature, the correlation between SIP and SRX during stress relaxation was systematically analysed and validated through calculations using a model of precipitation pinning force versus recrystallisation driving force.

2. Materials and Methods

The composition of the experimental steel was based on the strengthening mechanism of the 700 MPa grade Ti microalloyed high-strength steel developed by Zhujiang Steel: the incremental precipitation strengthening of Ti microalloyed steel is positively correlated with the Ti content within a certain range, and this enhancement is not significant above 0.095 wt.% [25]. Accordingly, the experimental steel was designed by adding 0.11 wt.% Ti to the composition of ordinary low carbon steel. The raw material was melted through vacuum induction melting and cast as ingots, which were then forged into 17 mm round bars and wire-cut into φ10 × 15 mm specimens. The chemical composition and initial austenite grain size measured in the laboratory are displayed in Table 1.
Thermal simulation experiments were conducted using a Gleeble 3800 (manufactured by DSI, NY, USA) thermal simulator to investigate the SIP and SRX during stress relaxation after two-stage controlled compression. The two-stage controlled compression simulated the actual industrial recrystallisation and non-recrystallisation controlled rolling process. The experimental schematic is displayed in Figure 1, wherein the samples were first heated to 1200 °C for 5 min to achieve austenitisation and then cooled to the deformation temperature. The first pass of compression occurred at 1050 °C in the simulation of the recrystallisation controlled rolling process. The second pass of compression occurred at 860–960 °C simulating the non-recrystallisation controlled rolling process. Both passes were compressed at a strain rate of 1/s and 20% reduction, with reference to the compression parameters of single-pass rolling in industrial production. After the second compression stage, the samples were held isothermally at different temperatures from 0 to 1000 s, and then quenched by water to room temperature. Furthermore, the precipitation-time-temperature (PTT) curve of SIP was plotted according to the stress relaxation experiment after two-stage controlled compression.
According to the stress relaxation curves, the evolution of austenite structure during stress relaxation at 960 and 900 °C was analysed. The quenched samples were mechanically polished after cutting along the cylindrical axial centre line and etched using a saturated picric acid solution supplemented with sodium dodecyl sulphate. Then, the austenite dimensional changes in the experimental steel during stress relaxation were comparatively analysed. The etched specimens were analysed for original austenite grain using a LEICA DM 2500M metallographic microscope, and the average austenite grain size was measured using the linear intercept method.
TEM analysis of the precipitates in 900 °C isothermal 150 and 500 s was conducted according to the stress relaxation curves. The quenched samples were wire-cut and mechanically thinned to 50 μm foil and then electropolished in a twin-jet polisher to prepare TEM thin film samples. The type, morphology, and distribution of the nanoscale precipitates in the samples were analysed at 200 KV using an FEI Talos F200X high-resolution scanning transmission electron microscope (HR-STEM) equipped with an energy dispersive spectrometer (EDS).

3. Results

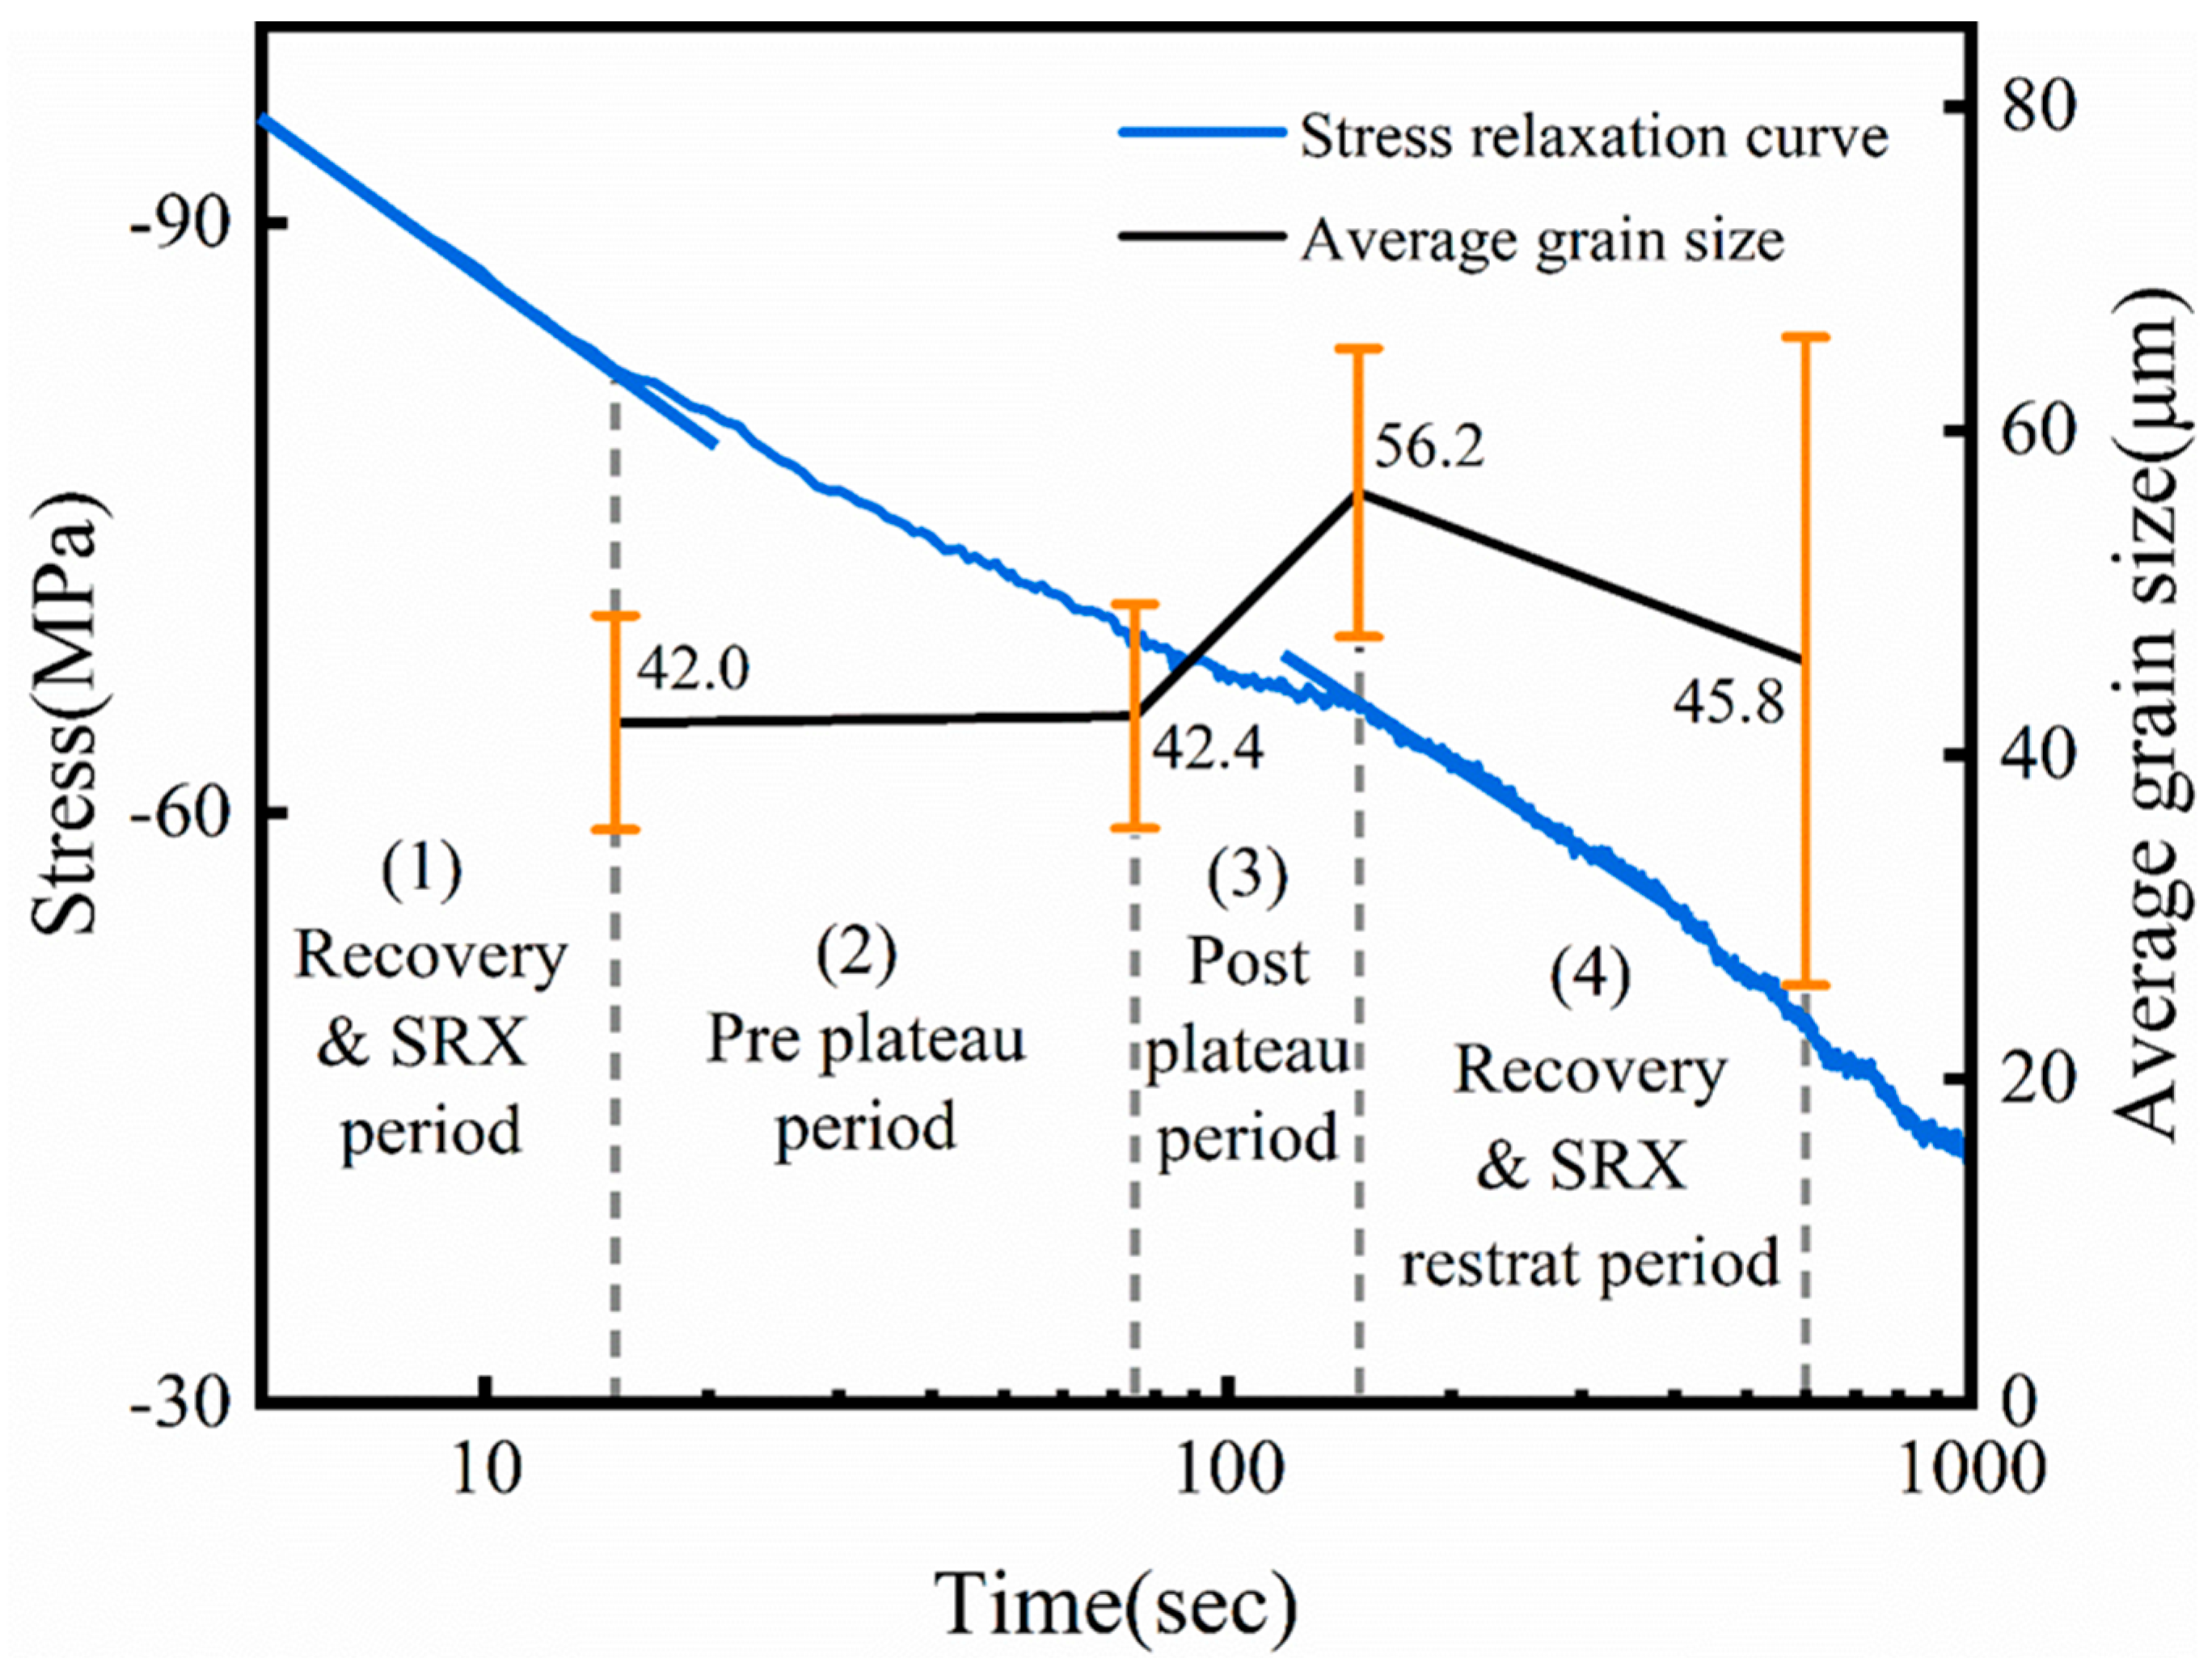
3.1. Stress Relaxation Curves
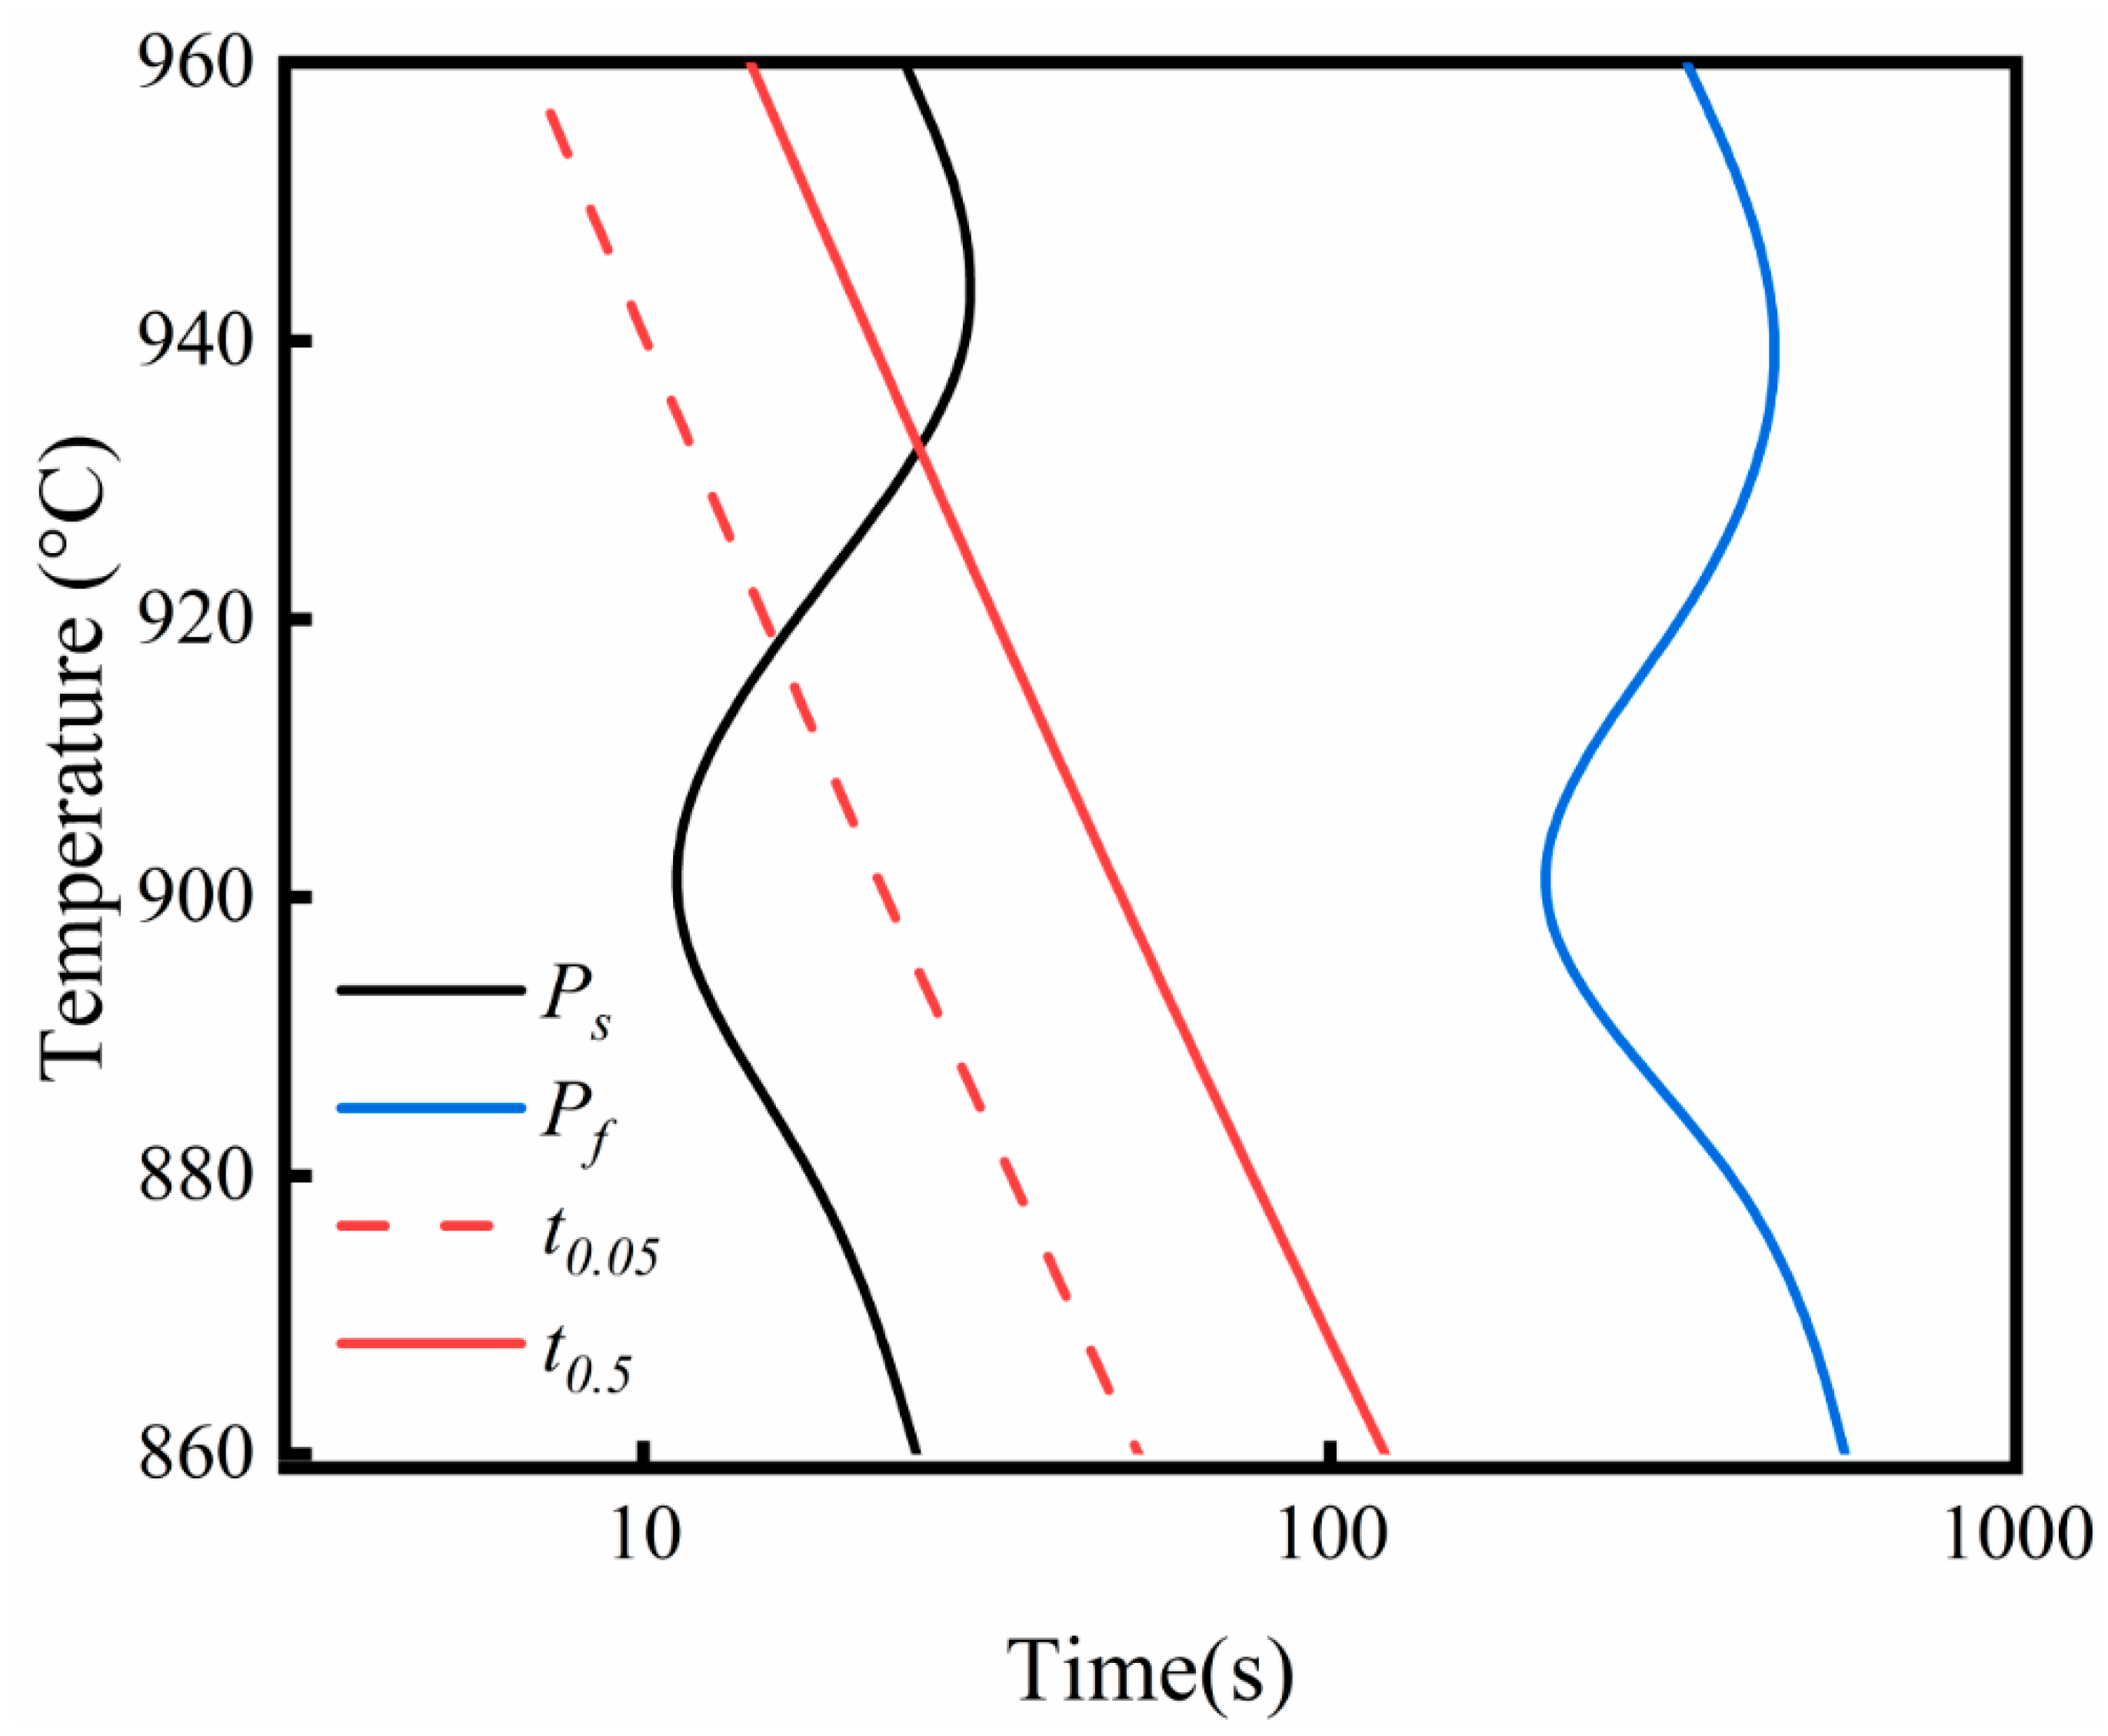
Experimentally measured stress relaxation curves for Ti microalloyed steel reflected the variation of stress vs. log (time) at different temperatures, as shown in Figure 2. The curves reflected the dynamic interaction among recovery, SRX, and SIP after two stages of compression of austenite [3].The curves at different temperatures resembled a relaxation plateau, indicating SIP [18]. Based on the plateau, a typical stress relaxation curve was broadly divided into three periods. The first period involved a decrease in stress dominated by recovery and SRX, as indicated by the black leading lines at the start of each curve. The recovery caused a linear decrease in the stress curve by rearranging and eliminating dislocations [14]. At higher compression temperatures, SRX occurred along with recovery, thereby causing the growth in the velocity of the stress decrease, as indicated by the dotted guide lines [19,20]. In the second period, a relaxation plateau dominated by SIP was observed; the pinning effect of precipitated particles caused a delay in the austenite softening due to recovery and SRX. The two arrows around the plateau indicated the precipitation start time point (Ps) and end time point (Pf) [18]. In the third period, the continued stress decreased remarkably when SIP was not sufficient to delay austenite softening, as indicated by the black guide line at the end of each curve. Since the stress decrease at each temperature was significantly faster than that dominated by recovery in the first period, it was evident that SRX has played a dominant role during the third period [14].

3.2. PTT Curve

The PTT curve for carbide precipitation in Ti microalloyed steel represented the variations in the plateau period of the stress relaxation curve at different isothermal temperatures, as illustrated in Figure 3. Unlike the typical ‘C’ PTT curves for HSLA steels, the curve obtained in this study displayed an inverted ‘S’ shape. Hysteresis of the Ps and Pf points occurred at 940 and 960 °C, with the highest magnitude at 940 °C, and the plateau period shortened at 960 °C. This phenomenon can be attributable to the preferential SRX during stress relaxation over the same temperature range [14,17,19,20]. However, no studies have investigated the regularity in the occurrence of SRX and its interactions with SIP. Below 940 °C, the shape of the PTT curve changed to the typical ‘C’ shape. The fastest precipitation nose temperature was 900 °C, with the precipitation plateau period within the range 15–150 s. Furthermore, the sample held at 900 °C for 150 and 500 s were selected for analysing the precipitates using the TEM method.

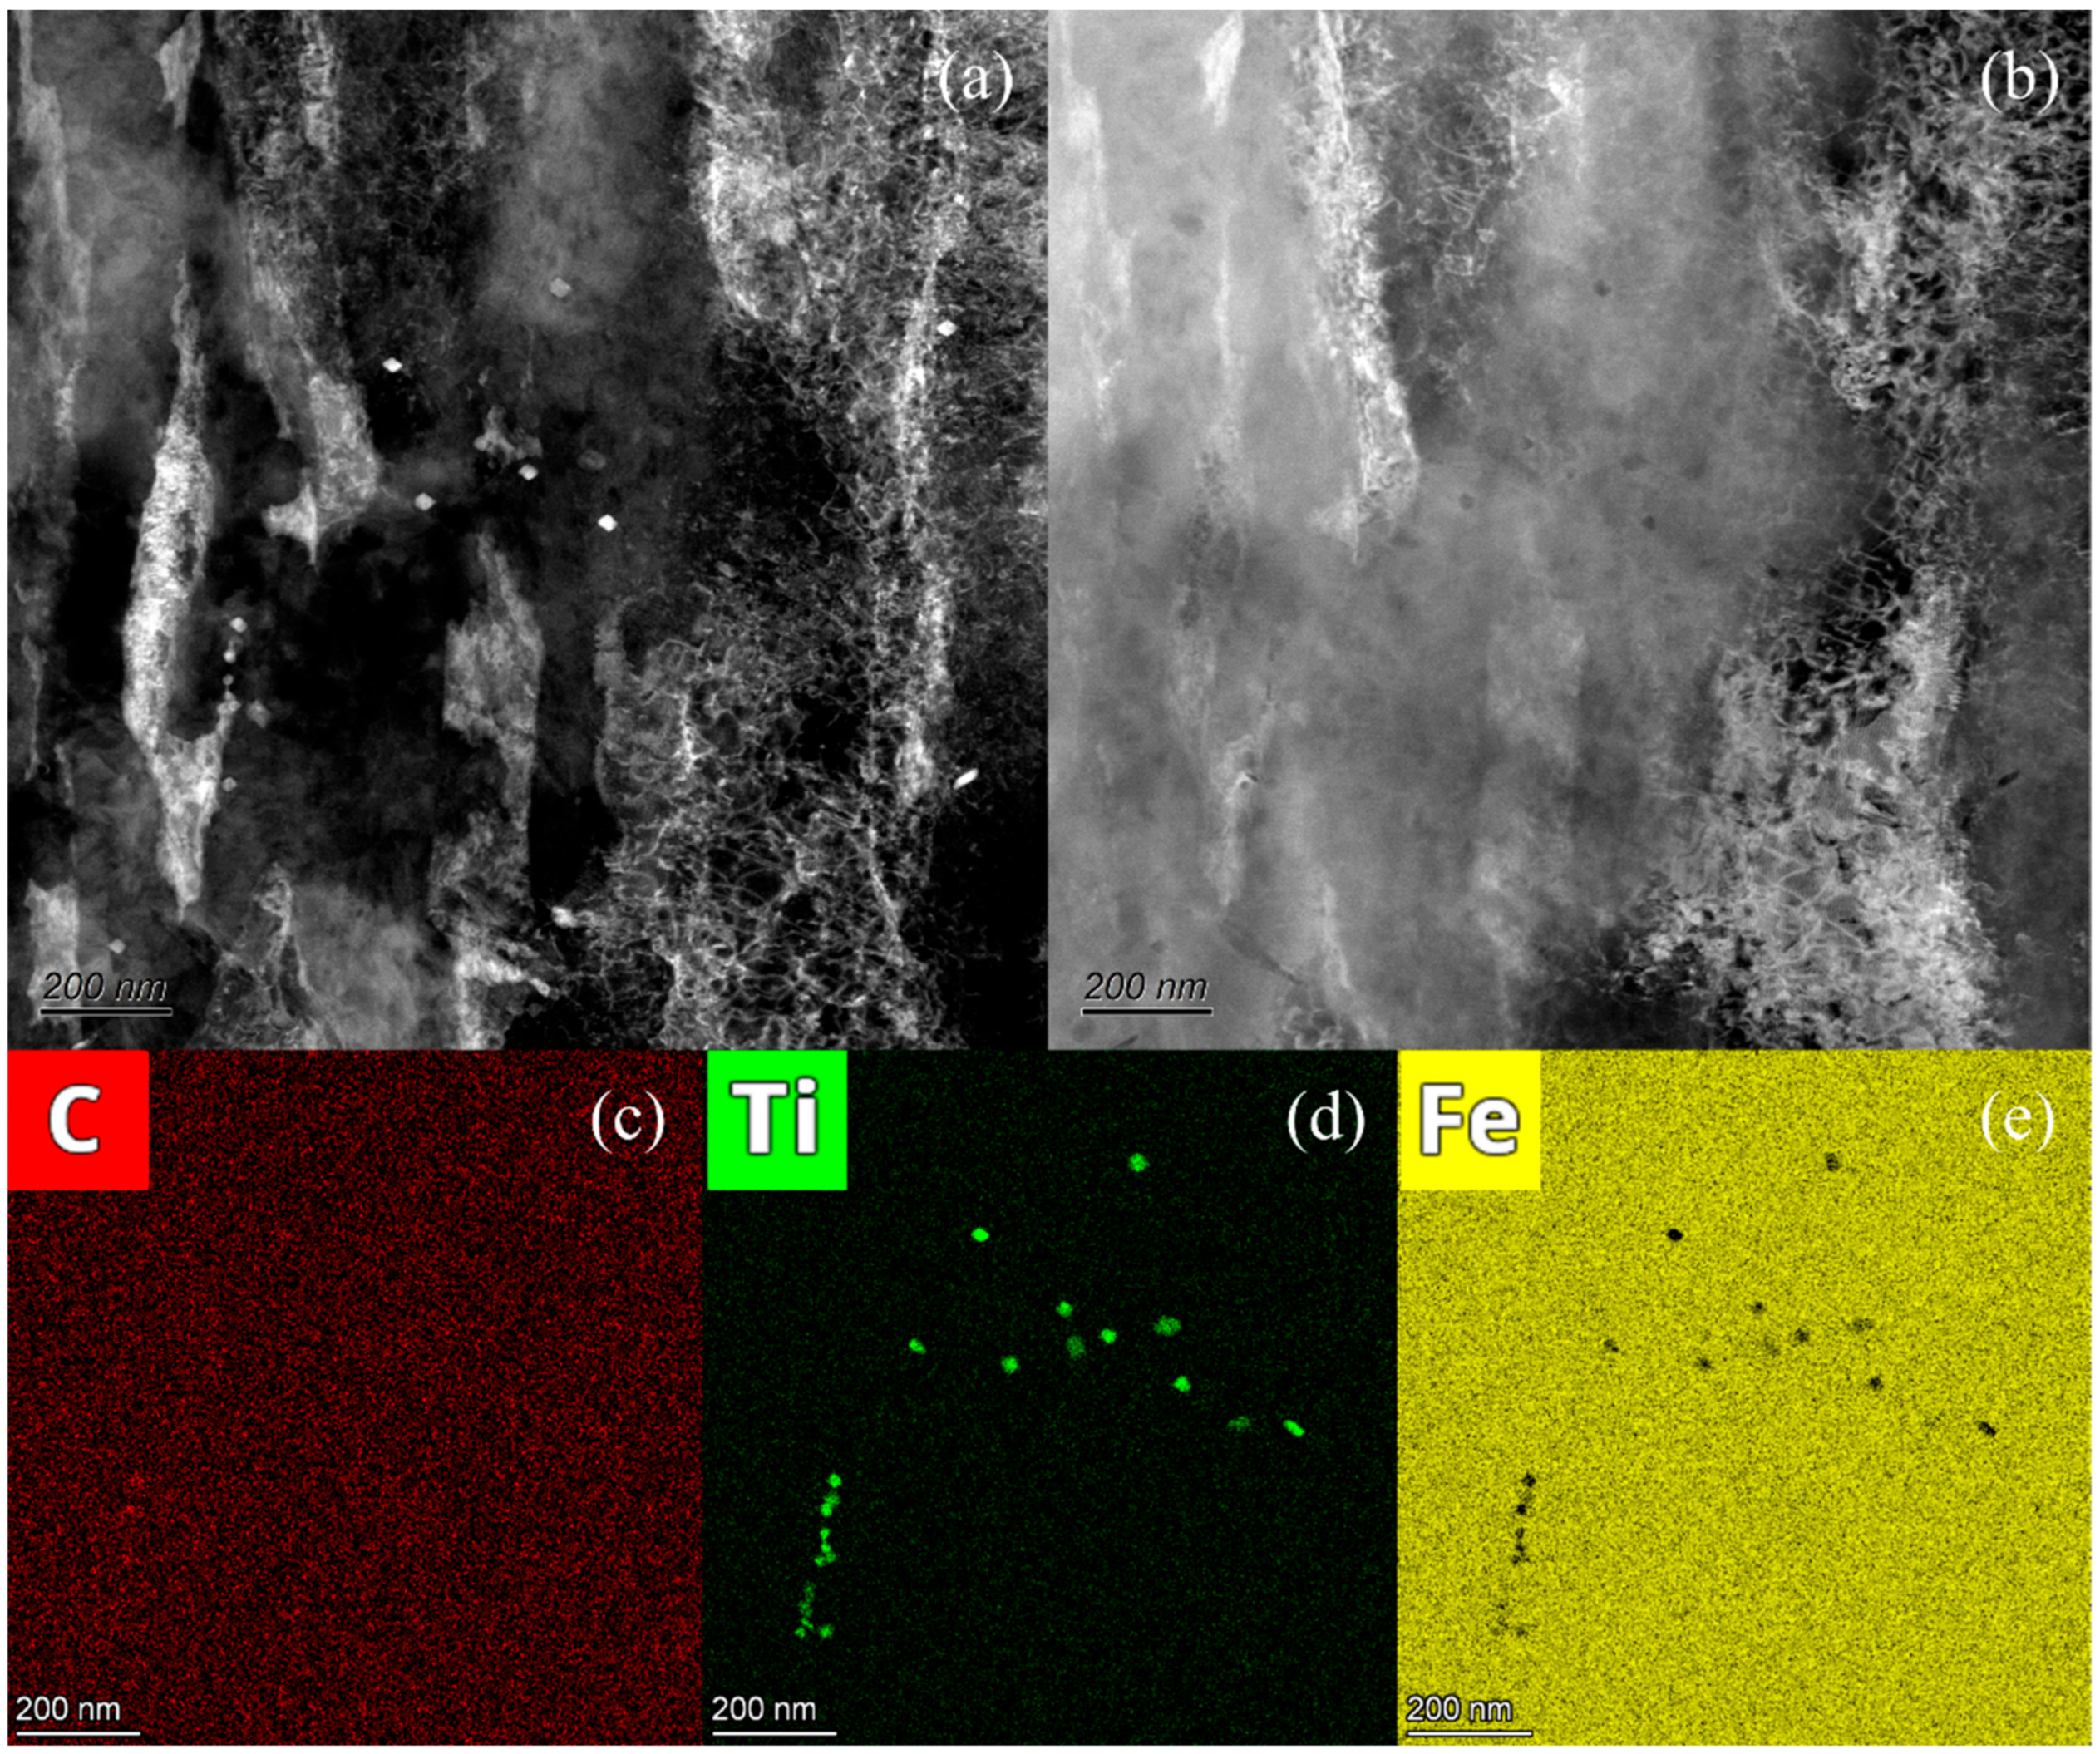
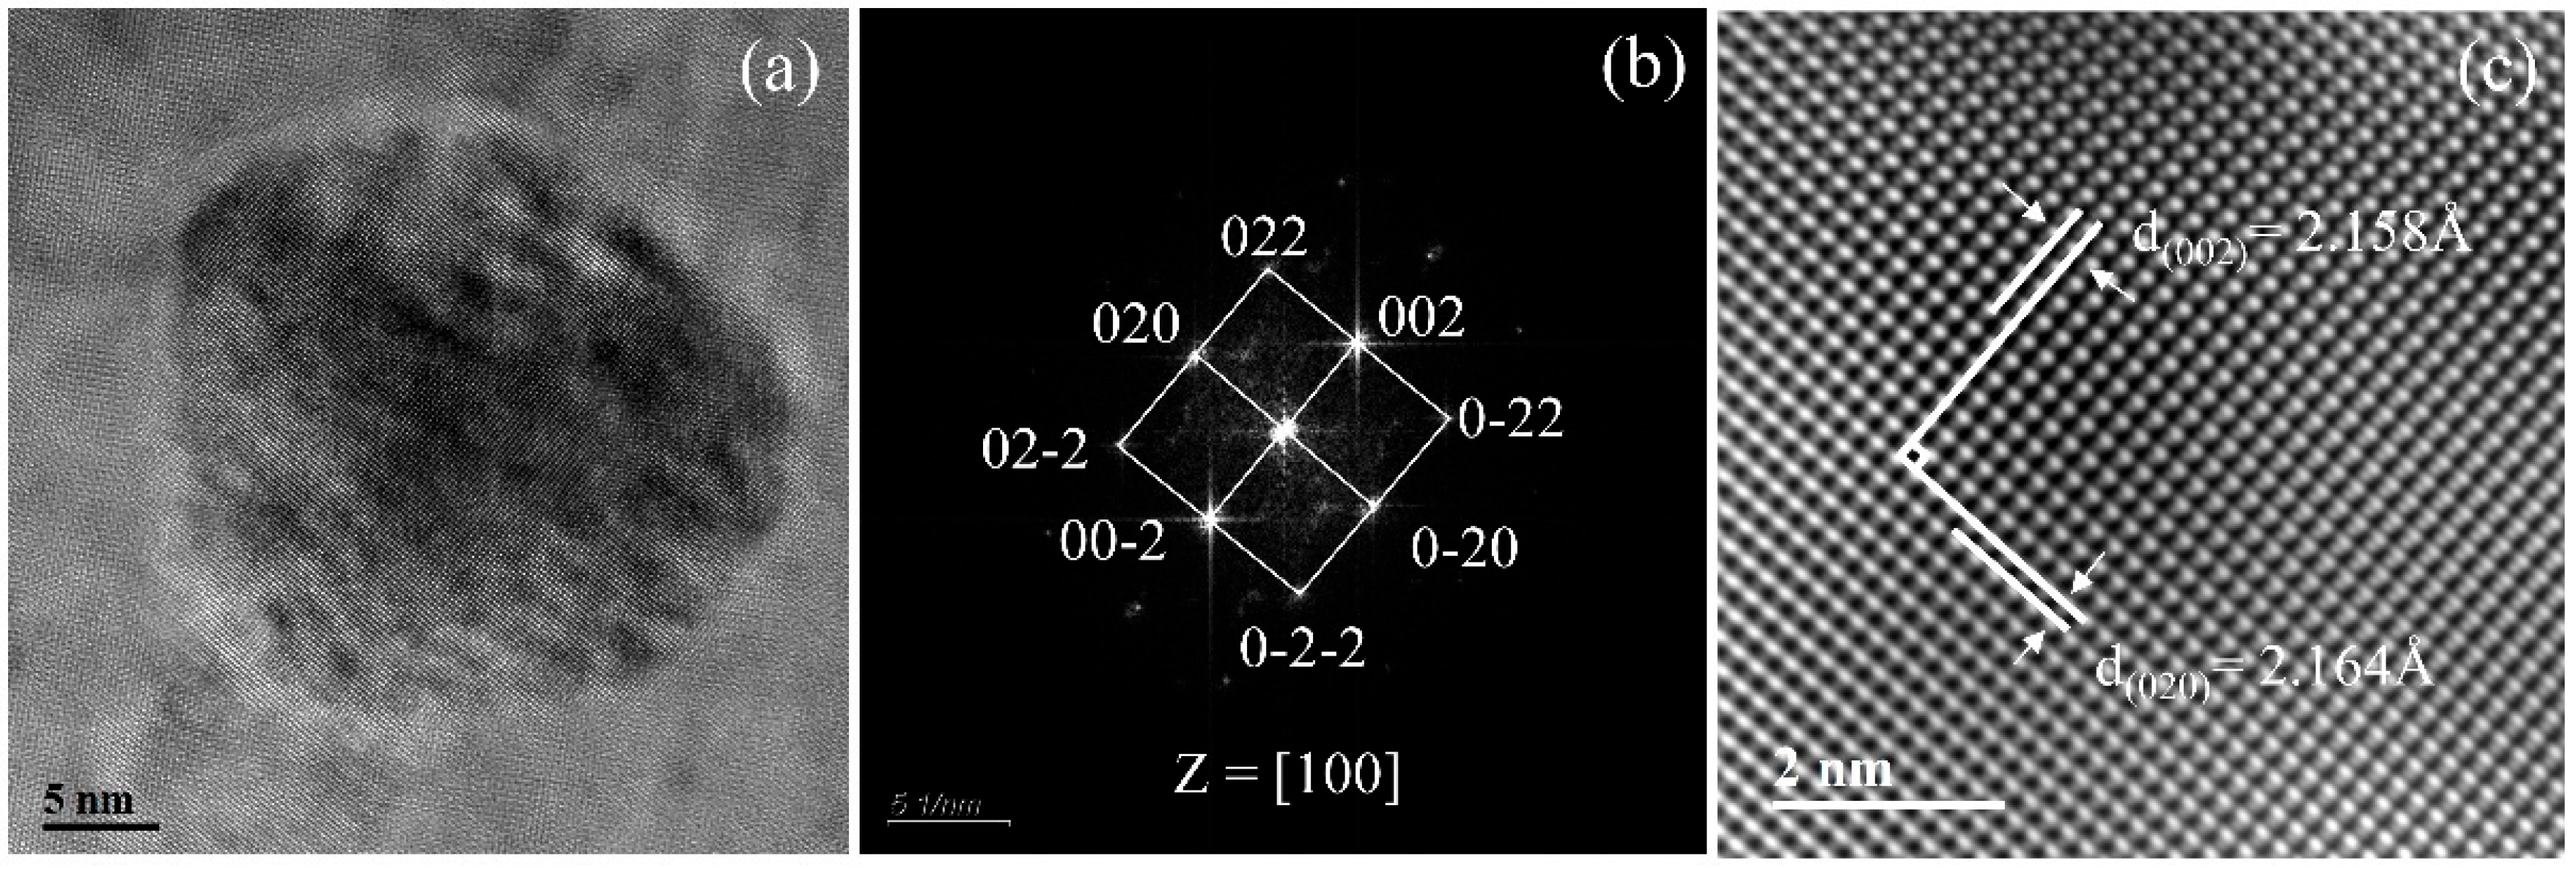
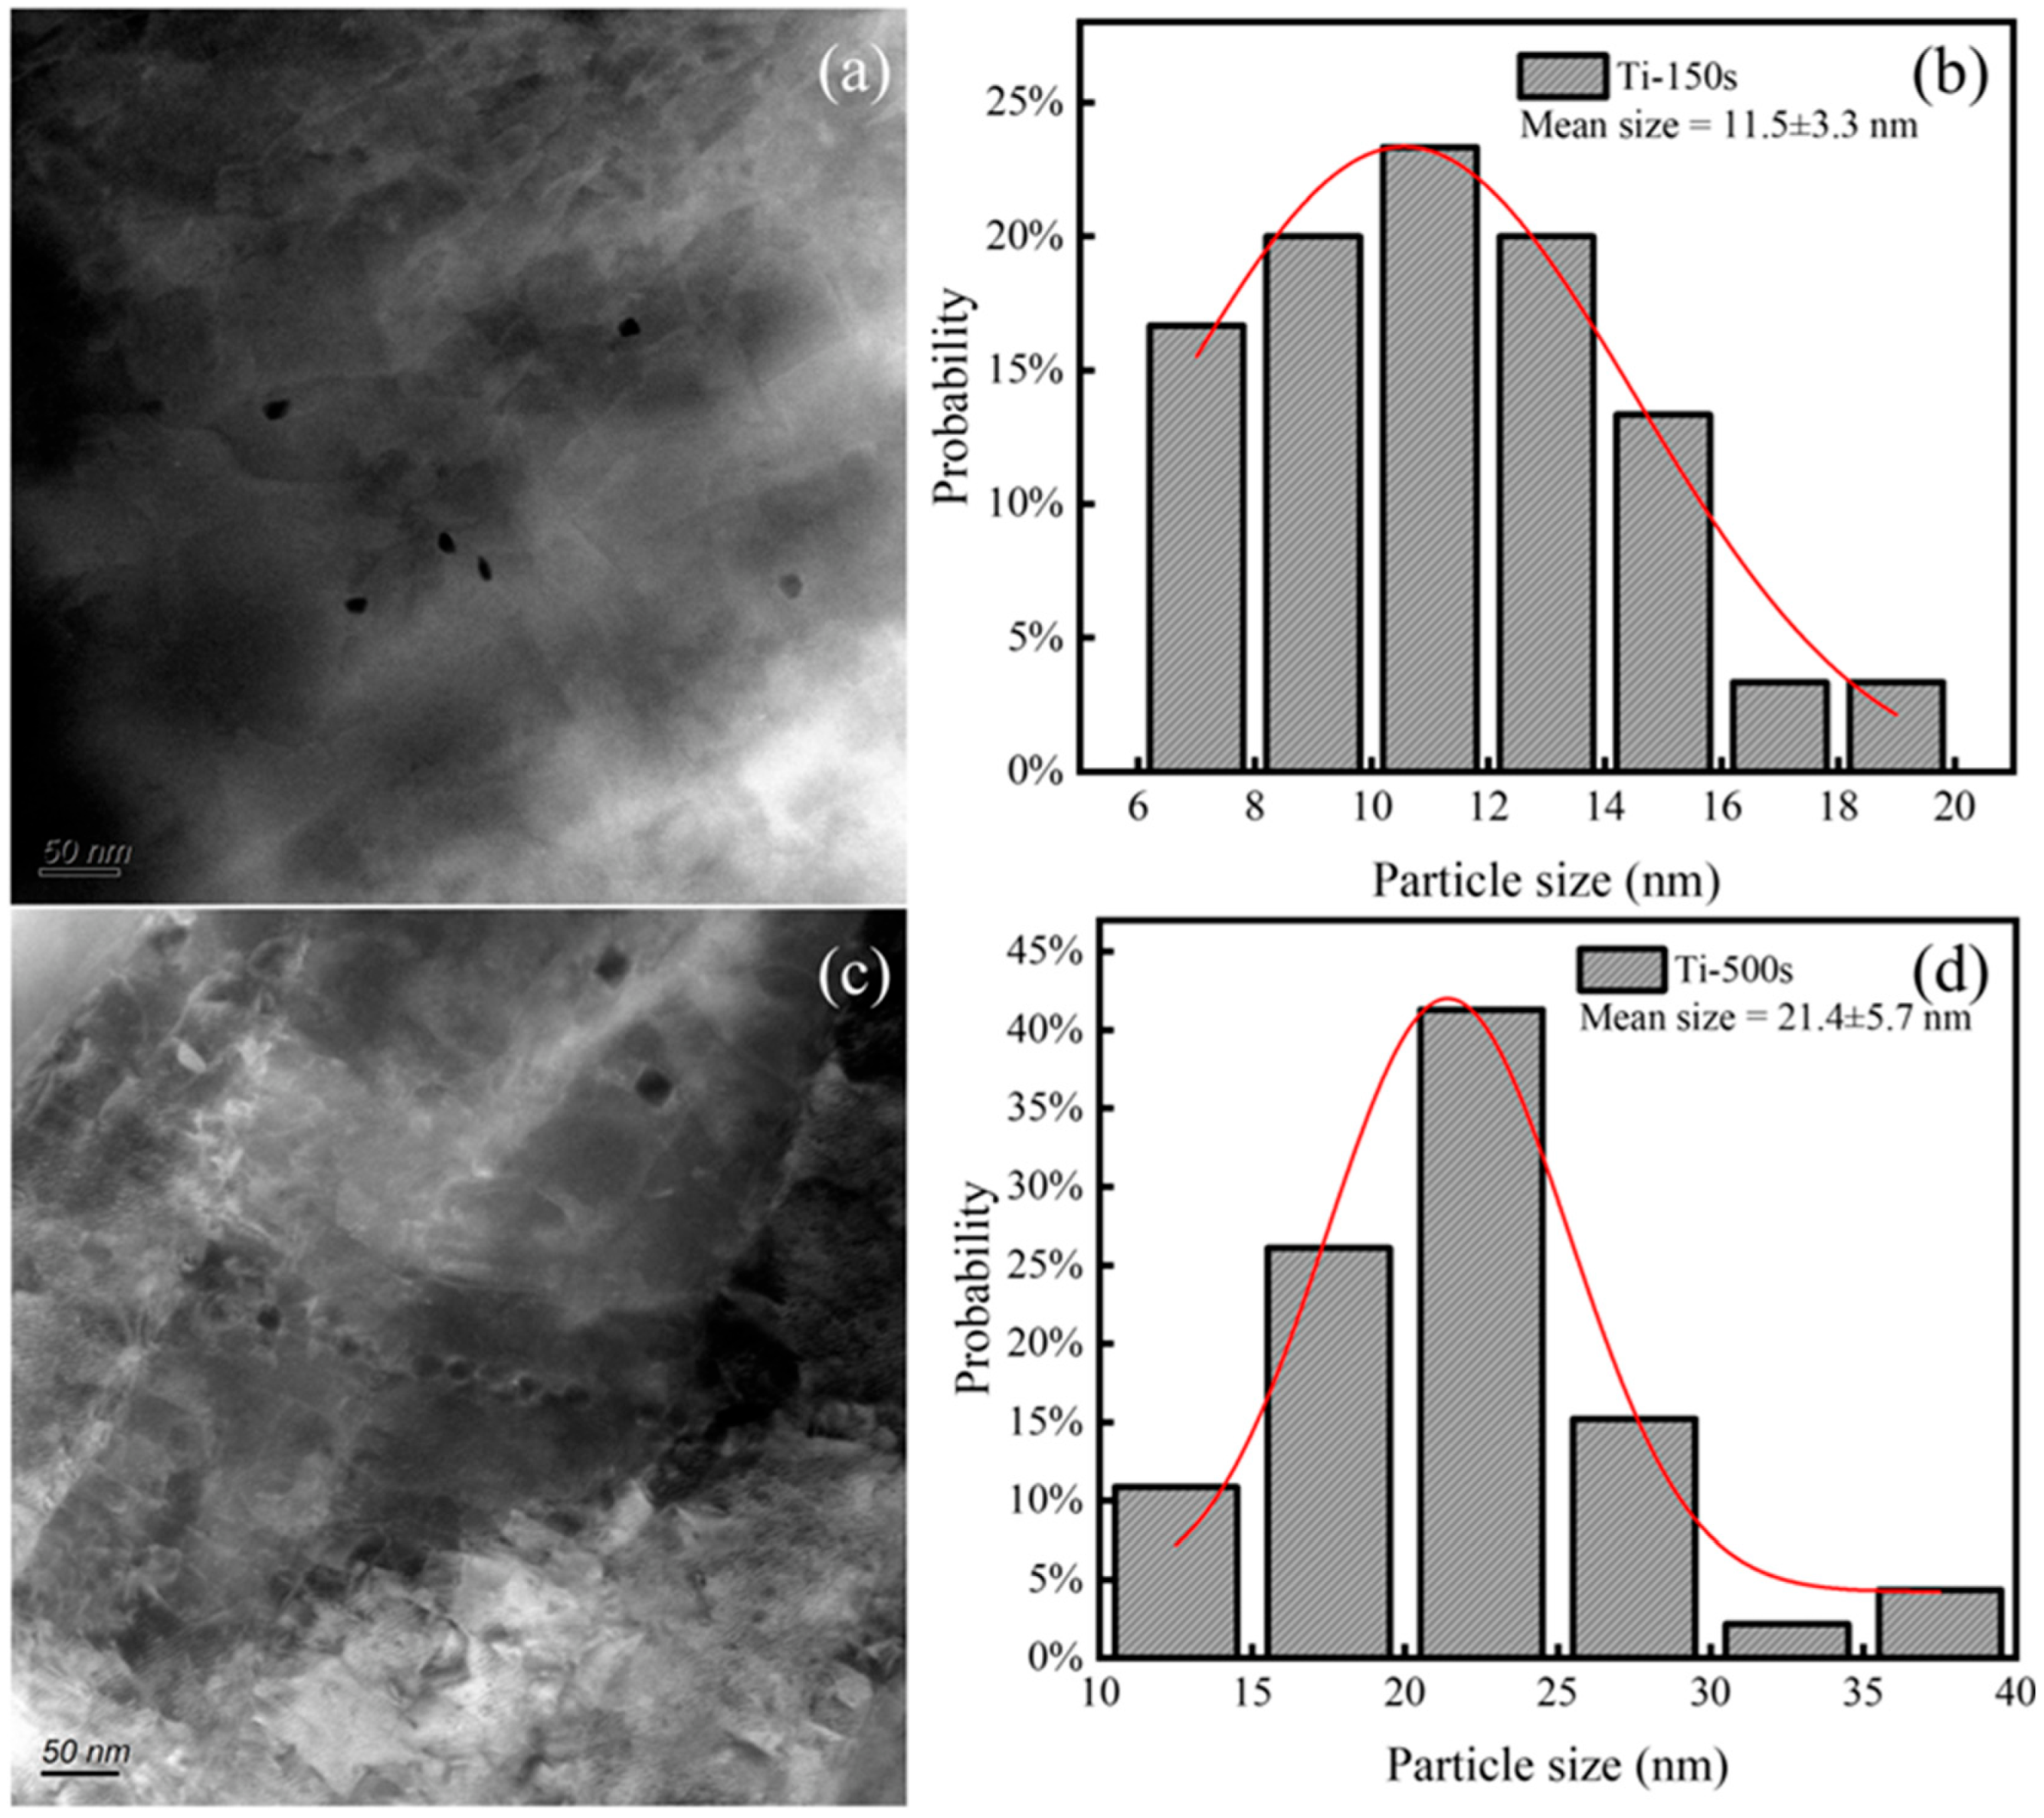
3.3. TEM Analysis of Precipitated Particles

Figure 4 displayed the precipitated particles in Ti microalloyed steel after isothermal compression at 900 °C for 500 s. The nanoscale particles were identified by dark-field and high-angle annular dark-field (HAADF) imaging in Figure 4a,b. These particles were either inhomogeneously distributed accompanied by larger individual sizes of 20–25 nm or precipitated in bunches accompanied by smaller individual sizes of 8–15 nm. Through EDS mapping in Figure 4c–e, the clear Ti and C enrichment accompanied by the absence of Fe were observed in the regions corresponding to the precipitated particles, evidencing that the precipitated particles were Ti-rich carbides.
To further analyze the type of Ti-rich carbides, HRTEM imaging was used for characterizing the morphology and crystal structure of the carbides, as displayed in Figure 5. An oval particle with a diameter of 25 nm was selected and subjected to fast Fourier transform (FFT) and inverse fast Fourier transform (IFFT) to determine the crystal structure information. The results indicated that the precipitate was TiC in NaCl-type FCC structure with a lattice constant of 0.432 nm.
In addition, Figure 6 illustrated the evolution of the TiC particles and their particle size distribution during stress relaxation at 900 °C. Figure 6a–d were separately taken from samples deformed at 900 °C and held for 150 and 500 s. Results revealed the distribution of TiC particle sizes for both isothermal holding times, the mean particle size increasing with increasing holding time. At a holding time of 150 s, the particles were mostly sphere-like with an average size of 11.5 ± 3.3 nm. As the holding time increased to 500 s, the average size of the precipitated particles increased to 21.4 ± 5.7 nm. In Figure 6c, sphere-like particles smaller than 15 nm distributed in bunches and polygonal particles with a non-uniform distribution of 20–30 nm are observed, where the polygons are more inclined to the equilibrium shape of TiC precipitation in interfacial energy calculations [26]. This non-uniform growth rate and distribution can be attributed to the characteristics of SIP that preferentially nucleate and grow at defects, such as dislocations and subgrain boundaries formed as a result of austenite deformation [17,19].

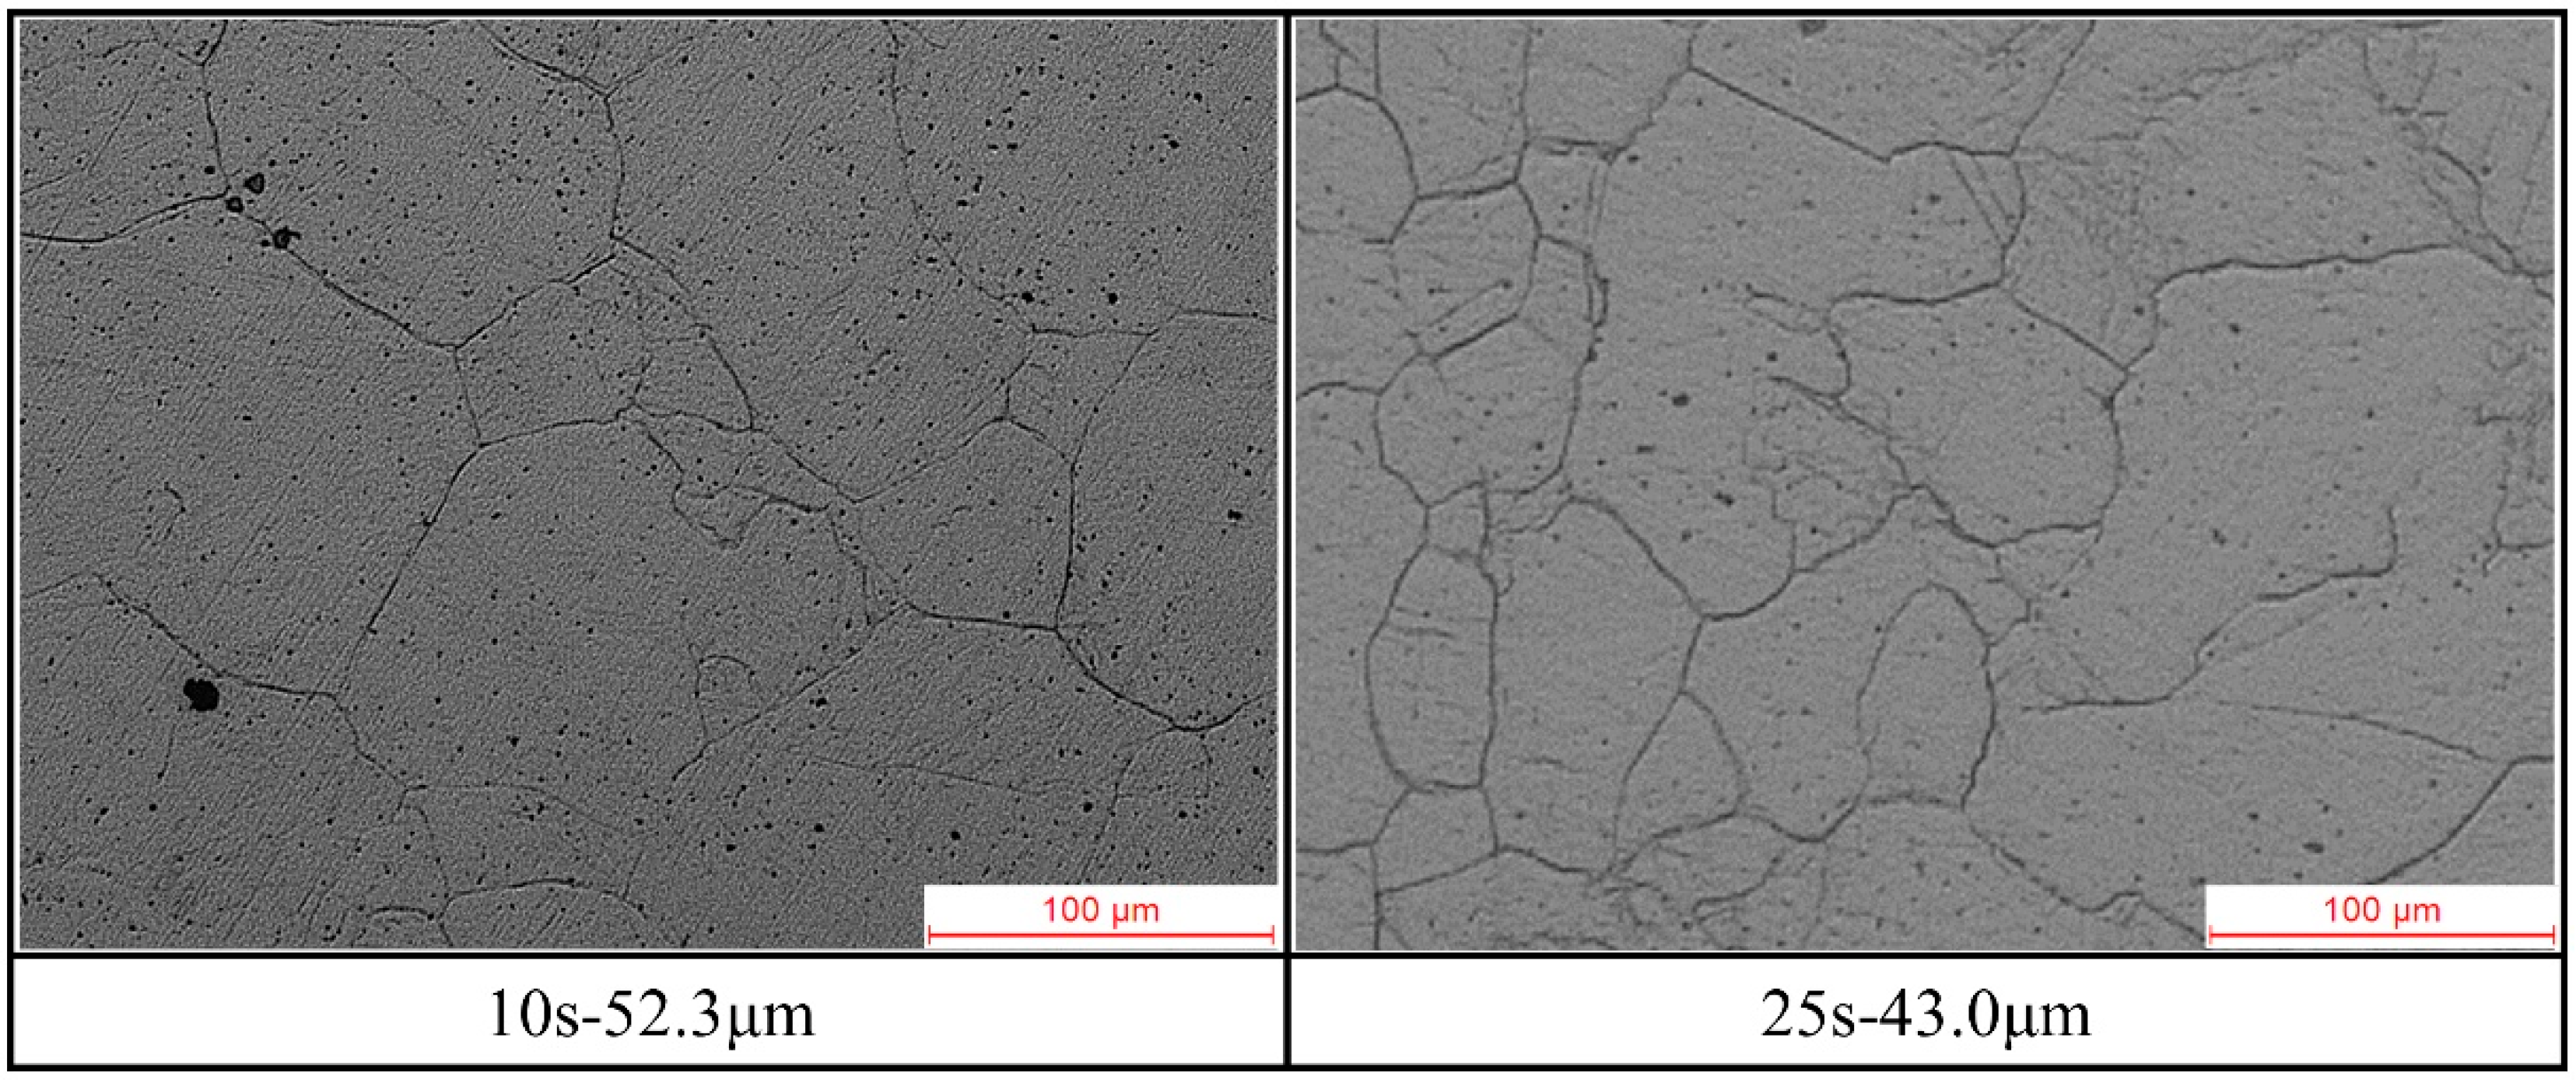
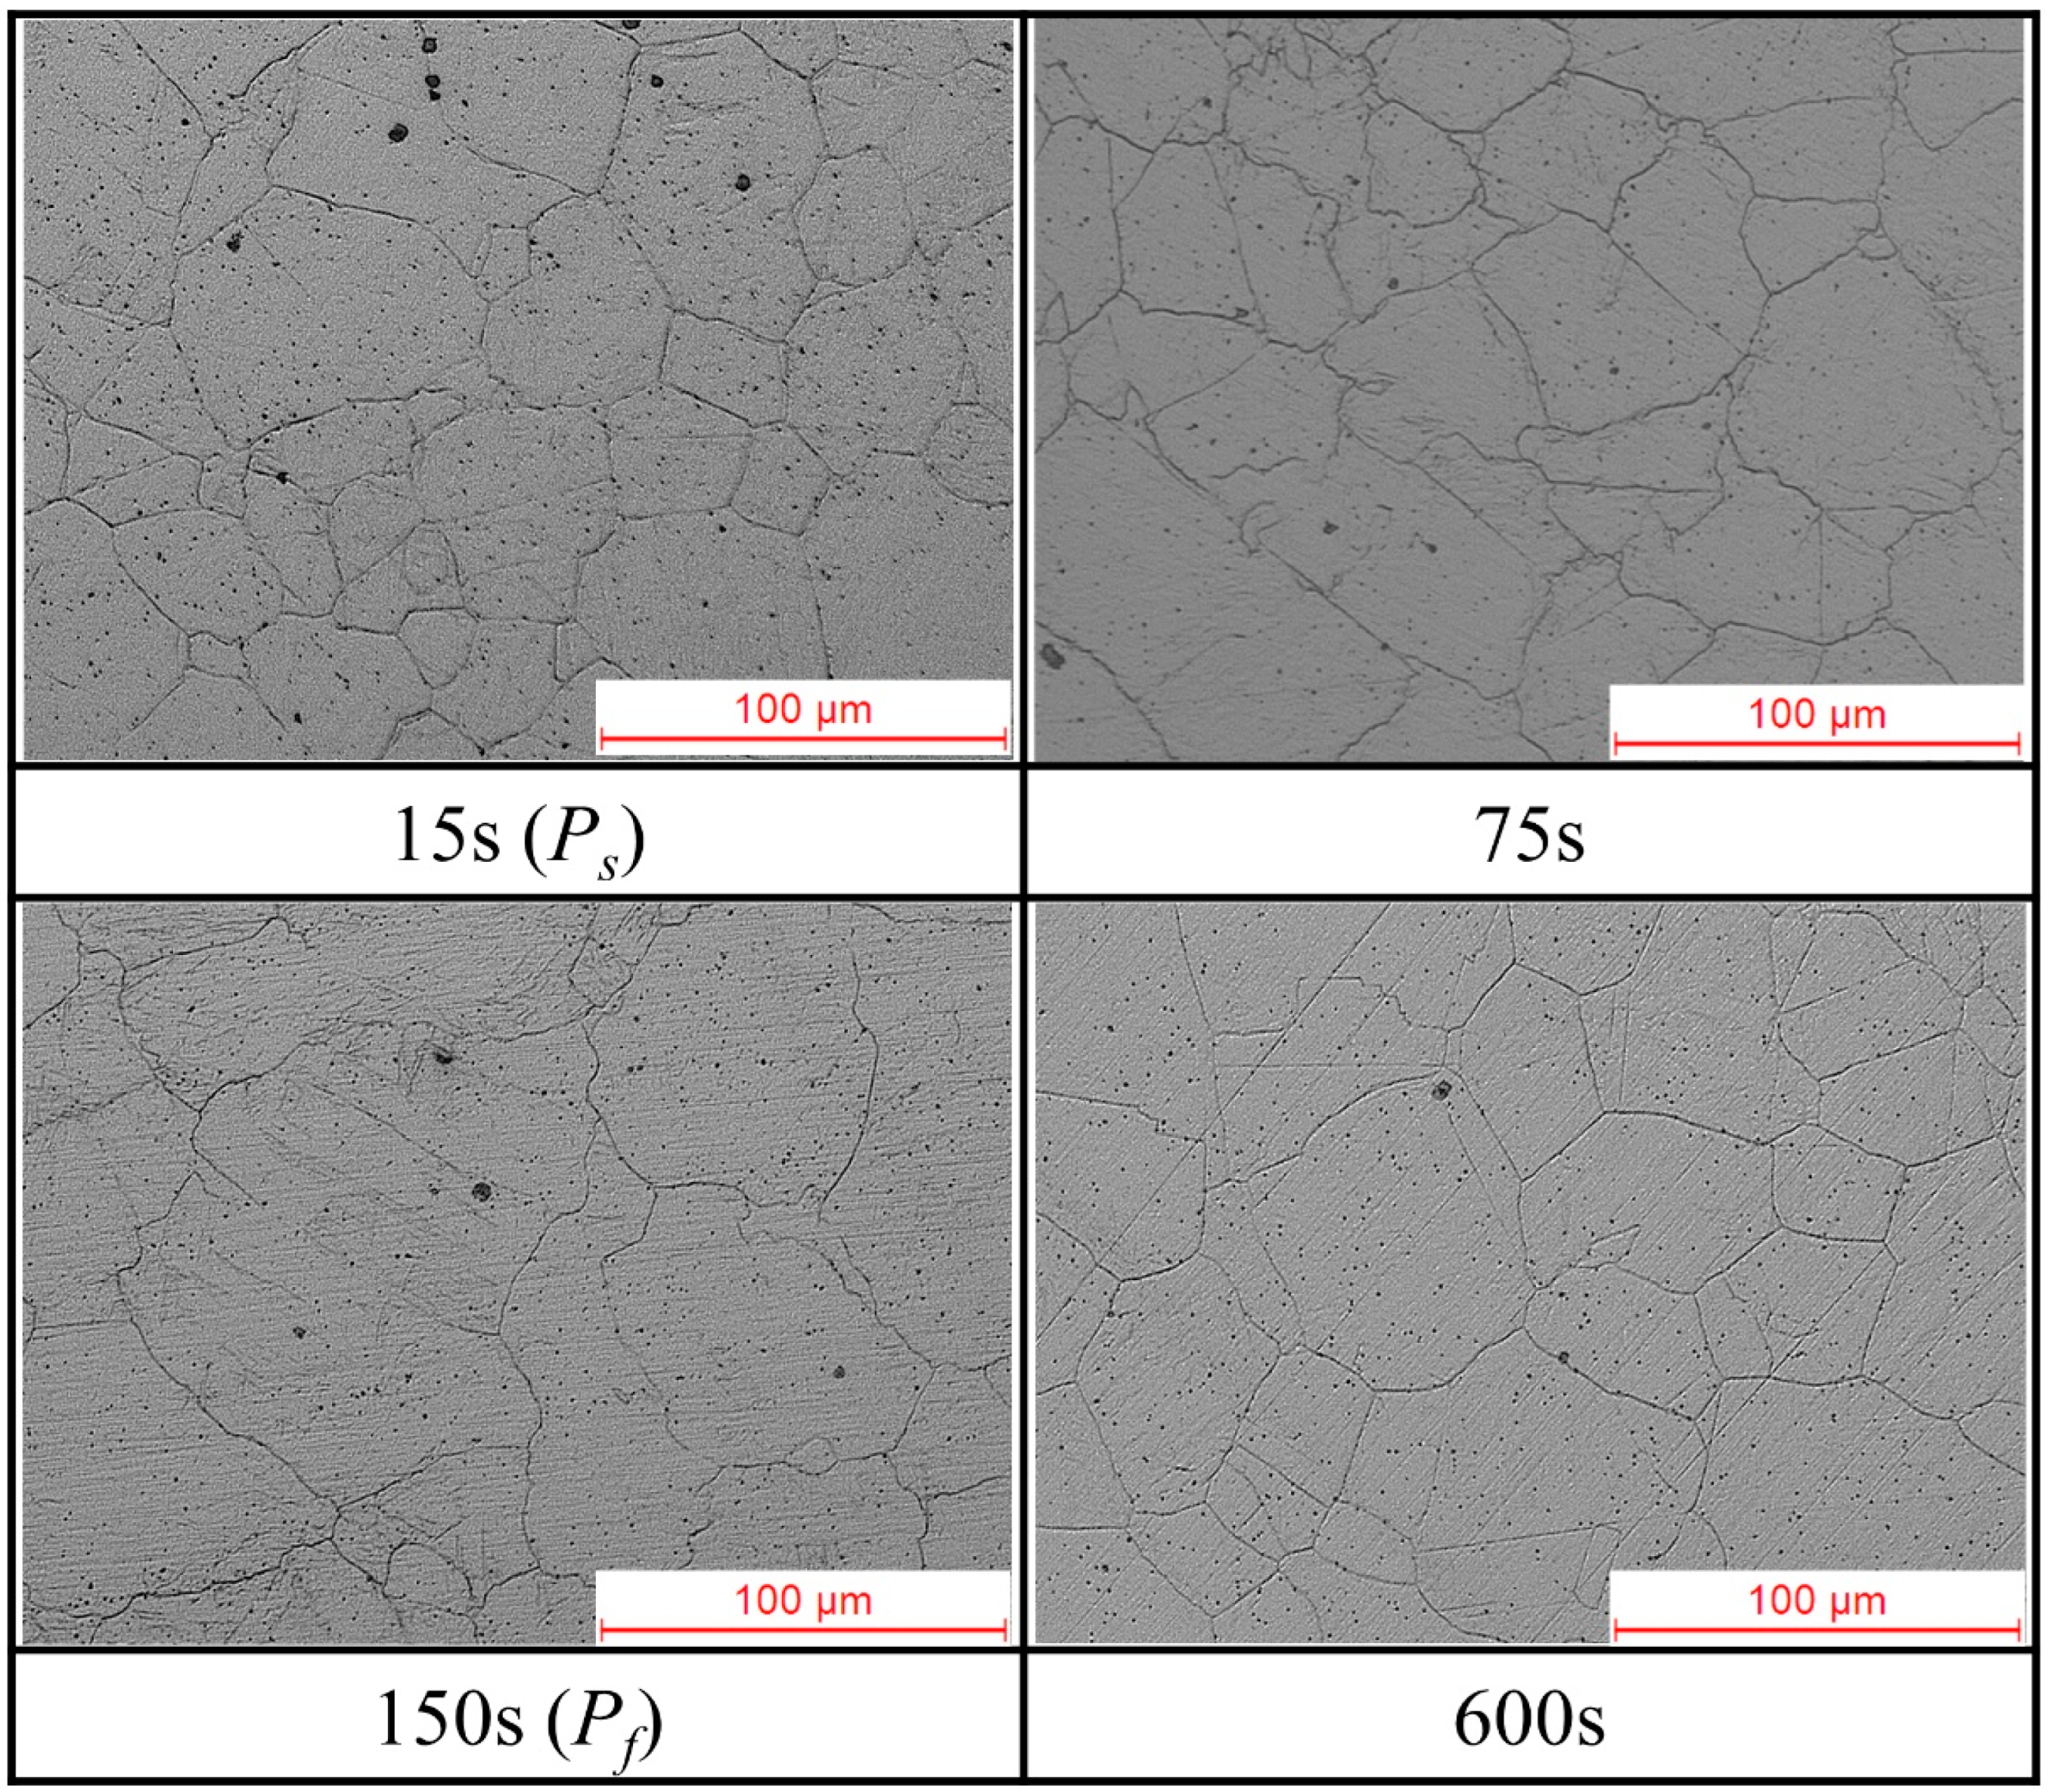
3.4. Evolution of Austenitic Microstructure

Figure 7 illustrates the evolution of the austenite microstructure during SRX in the stress relaxation process of Ti microalloyed steel at 960 °C. As shown in Figure 2, the SRX-induced stress decrease starts and ends at 5 and 20 s respectively, while the quenching of the samples undergoes a delay of 5 s. The results indicated a significant refinement (52.3 → 43.0 μm) of the original austenite grains during the SRX-induced stress decreas period, accompanied by a more uniform grain distribution, thus indicating the occurrence of SRX.
Figure 8 illustrates the original austenite grains of Ti microalloyed steel quenched after being held for different times at 900 °C. The holding time nodes were selected with reference to the precipitation plateau period and determined as 15 s (Ps), 75 s (mid-point between Ps and Pf), 150 s (Pf), and 600 s. The evolution of grain size was expressed as mean grain size ± standard deviation, where the standard deviation reflected the degree of inhomogeneity of grain size.
The results indicated that the initial austenite grain size after compression at 900 °C for 15 s was 42.0 ± 6.6 µm. During the first half of the subsequent precipitation plateau period (15–75 s), the austenite structure changed minimally, with the grain size equal to 42.4 ± 6.9 µm. During the second half of the plateau period (75–150 s), the austenite grains slightly coarsened, accompanied by a small increase in the standard deviation (56.2 ± 8.9 µm), indicating a non-uniform degree of austenite coarsening at this period and abnormal grain growth (AGG) of some grains. Previous studies reported that SIP did not completely inhibit the AGG of austenite [27] because the pinning effect of the fine precipitated particles restricted the growth of most grains, while restricted the mobility of the grain boundaries to a few grains, thereby resulting in AGG and an undesirable mixed-crystal structure [28]. This conclusion is supported by the inhomogeneous distribution of SIP particles observed in this work, as shown in Figure 6. After the plateau period (150–600 s), considerable refinement of the austenite grains occurred, accompanied by a noticeable increase in the standard deviation (45.8 ± 20.0 µm); this indicated that SRX occurred to intensify the degree of miscibility in austenite. The austenite structure evolution analysed in this study involved SRX and AGG during stress relaxation. Most studies have focused on precipitation kinetics [19,20,21,29], neglecting the effects of SRX on SIP and subsequent austenitic softening.

4. Discussion

4.1. Recrystallization-Precipitation-Time-Temperature Curve

The SRX of austenite after rolling affected the final structure and properties of steel. Recrystallisation altered the original austenite microstructure and resulted in the fine grain strengthening effect; however, recrystallisation reduced the deformation energy stored in the dislocations, thereby affecting the subsequent precipitation and phase transformation [29]. To study SRX kinetics during stress relaxation, the present study used an SRX kinetics model for HSLA steels proposed by Medina [30]:
X r = 1 e x p [ l n 2 ( t t 0.5 ) n ]
n = 2.93 e x p ( 12500 R T )
t 0.5 = 3.754 × 10 4 e x p ( 7.869 Q × 10 5 ) ε 4.3 D 0.169 ε · 0.53 D 1.09 e x p ( Q R T )
Q = 124714 + 28385.68 ( M n ) + 64716.68 ( S i ) + 76830.32 ( T i ) 0.123
Equation (1) depicts that the recrystallization fraction Xr obeys the Avrami’s kinetics equation, where n is a material-determined constant derived from Equation (2), with the absolute temperature T; t0.5 is the time at which 50% recrystallization occurs in deformed austenite, as expressed by Equation (3); t is the specific time corresponding to Xr. D is the initial grain size before austenite compression (58 μm shown in Table 1), R is the Avogadro constant (8.314 J·mol−1·K−1), ε is the strain (20%), ε ˙ is the strain rate (1/s), and Q is the apparent activation energy for recrystallization, which can be deduced using Equation (4) representing the elemental composition in HSLA steel.
Data obtained from stress relaxation experiments and metallography were incorporated into this model to calculate the recrystallisation fraction Xr as a function of time at each isothermal temperature displayed in Table 2. The lowering of temperature inhibited the onset of SRX; this is the theoretical basis for non-recrystallization controlled rolling [3]. Notably, because of the exponential increase in the recrystallization fraction in Equation (1), SRX began in the steel and rapidly reached 50% completion immediately after deformation in a relatively short period of time, following which the increase slowed down significantly. Medina [31] indicated the temperature-influencing nature of SRX: partial recrystallization occurs within the range 25–50 °C below the complete recrystallization temperature. Further, the results obtained using this model indicated that the final rolling temperature significantly influenced the rate of SRX.
The parameters displayed in Table 2 were incorporated into the PTT curve to transform it into the recrystallisation-precipitation-temperature-time (RPTT) curve for Ti microalloyed steel, as displayed in Figure 9. First, the curve represented SRX and SIP during stress relaxation after compression at 960–860 °C, which is strongly influenced by the temperature. Second, the RPTT curve displayed a preferential onset of SRX in the stress relaxation curve above 940 °C, which is indicated by the non-linear decrease in the stress relaxation curve in Figure 2 and the refinement of the austenite grains in Figure 8. The preferential onset of SRX delayed the subsequent SIP, resulting in an overall delay in the precipitation plateau period, as illustrated by the PTT curve in Figure 3. Previous studies on Ti microalloyed steel subjected to two-stage interrupted compression resulting in a similar conclusion: SRX was 45% completed before SIP occurred at 100 s for the steel compressed by 20% at 950 °C [7]. Studies have revealed that SRX decreases the density of dislocations, thereby reducing the available precipitation nucleation sites, which is responsible for the delay in the SIP plateau period [23]. Moreover, the delaying effects of SRX on SIP do not simply increase in intensity with increasing isothermal temperature. The plateau period is delayed more significantly at 940 °C; however, Ps occurring at 960 °C is earlier with the overall plateau duration unchanged, as illustrated in Figure 2. The earlier Ps point can be attributed to the fact that SRX proceeds more rapidly at higher temperature, thus reducing the inhibition effect of SIP more quickly. Nevertheless, the more rapid SRX accelerates the depletion of dislocation-stored deformation energy [3]. Moreover, the higher temperature implies a reduction in the equilibrium volume fraction of the precipitates [9]. Both indicate a diminished effect of SIP, which could explain the unchanged plateau period at 960°C.
It is worth noting that the SRX kinetics model used in this work did not take into account the effects of SIP. Besides, the complex correlation between SRX and SIP when SIP occurs preferentially below 940 °C, accompanied by the onset of the plateau period, has not been reported in previous studies. To explore this correlation, the dynamic competition between SIP and SRX was determined by calculating the driving forces for precipitation and recrystallisation.

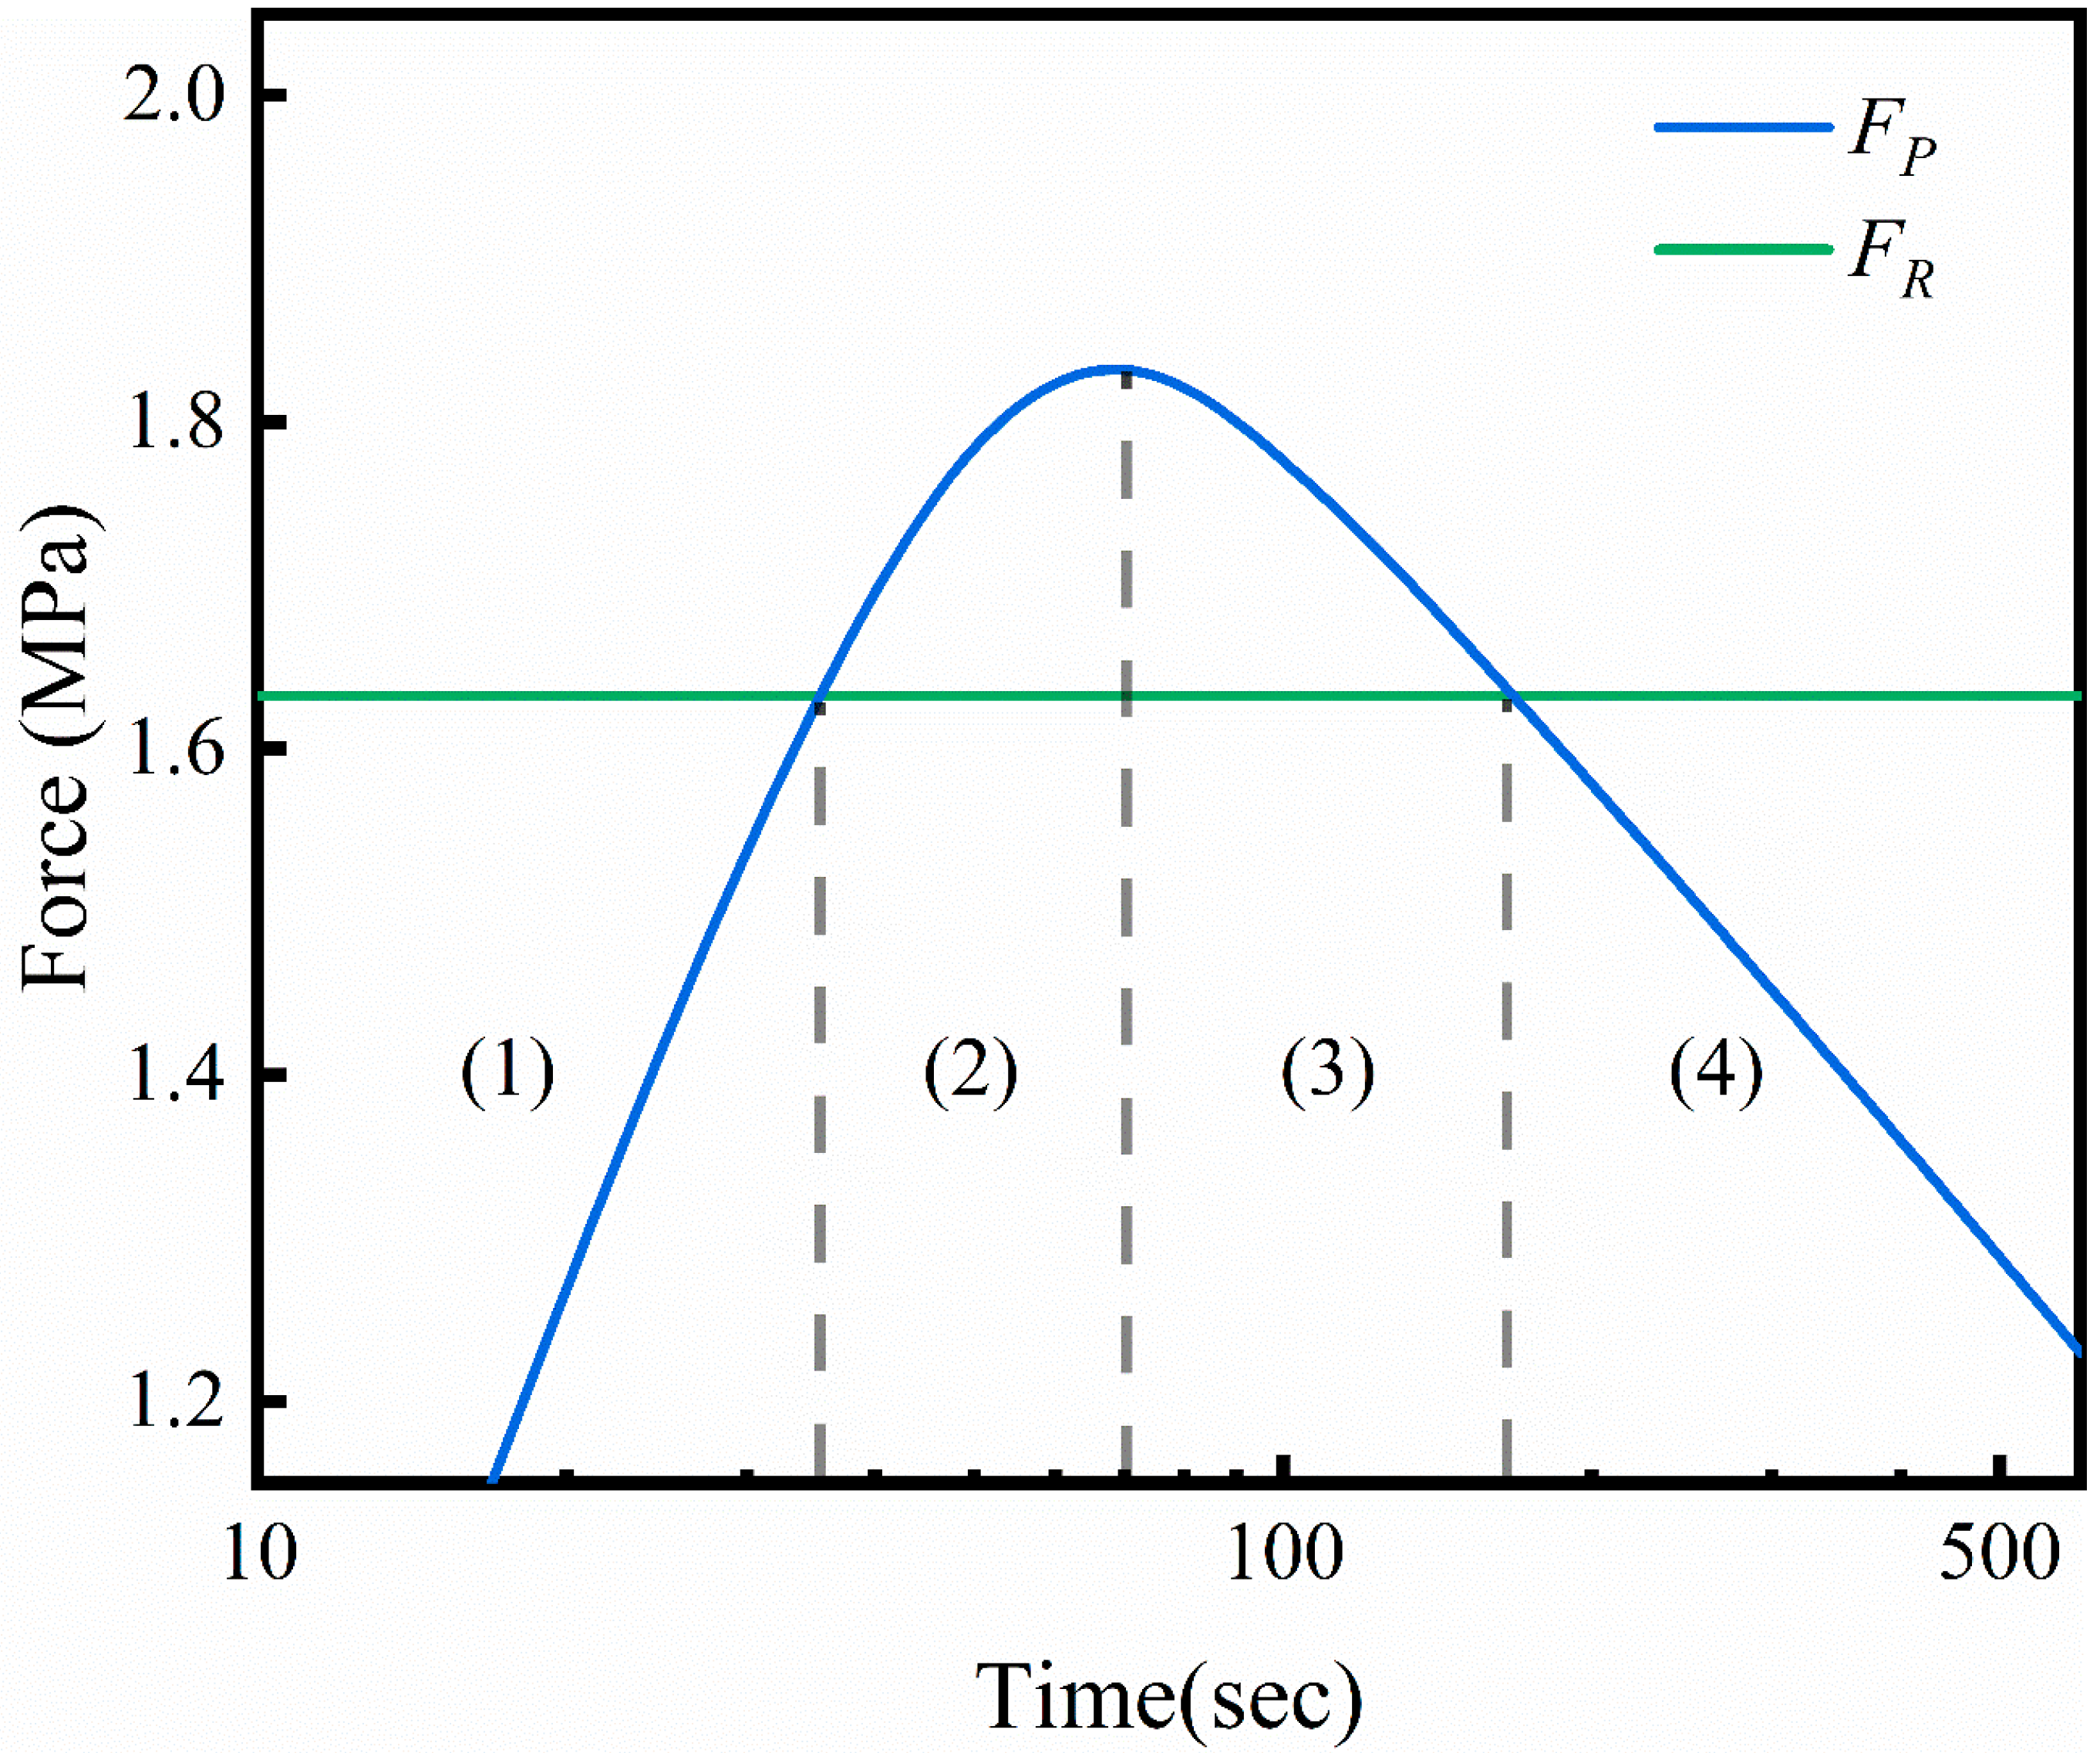
4.2. Recrystallization driving Force FR and Precipitation Pinning Force FP

Below 940 °C, the preferential occurrence of SIP is accompanied by a plateau period on the stress relaxation curve for the Ti microalloyed steel, as displayed in Figure 2. The RPTT curve in Figure 9 predicted that SRX will occur in the plateau period of SIP below 940 °C; however, it did not predict the correlation between them. According to the strain-induced grain boundary migration model proposed by Beck, this correlation can be expressed as a competition between the driving force of grain front migration (FR) and the delayed force of precipitated particle pinning grain boundary (FP) [32]. To analyse the competitive process, the nose temperature of 900 °C was selected to achieve the fastest SIP of Ti microalloyed steel, and the corresponding FR and FP can be expressed as [33]:
F R = μ b 2 2 ( 5 Δ σ μ b ) 2
F P = 3 γ f 2 / 3 π r
where μ is the shear modulus (4 × 10⁴ MPa), b is the Burgers vector (2 × 10⁻¹⁰ m), Δσ is the increment between flow stress and yield stress at the deformation temperature (73 MPa), γ is the interfacial energy per unit boundary area (0.8 J/m2), f is the volume fraction of precipitated particles and r is the average radius of the precipitated particles. According to the particle coarsening data on the SIP of Ti microalloyed steel during stress relaxation at 900 °C in Figure 6; r increased from 5.1 to 10.7 nm over isothermal times of 150–500 s [19]. Furthermore, the particle growth process was modelled according to Zener’s theory of diffusion-controlled growth [34]:
r = 1 2 α E t
where α is the particle growth coefficient and E is the diffusion coefficient of Ti in austenite. Both parameters are primarily influenced by temperature and can be approximated as a constant at 900 °C to determine the variation in r during stress relaxation. Subsequently, according to the precipitation kinetic data obtained from the PTT curve displayed in Figure 3, the change in f during precipitation was derived as follows [9,17]:
( T i ) [ T i ] ( C ) [ C ] = 48 12
f e = ( ( C ) [ C ] ) 60 12 7.75 4.93
f = f e X p
X p = 1 e x p c t q
C = l n ( 1 X s ) P s
q = l n l n ( 1 X s ) / l n ( 1 X f ) l n ( P s / P f )
Equations (8)–(10) represented the volume fraction fe of TiC precipitated in equilibrium at 900 °C, where (i) and [i] represent the equilibrium and dissolved concentration of each element in steel, respectively. Equations (11)–(13) indicated that the variations in f were consistent with the Avrami’s kinetics equation, with c and q as constant parameters [34]. Xs and Xf were the precipitation fractions at Ps and Pf points during the precipitation plateau period according to the PTT curve of Figure 3, which were set to 0.05 and 0.95.This is because the stress relaxation method reflects the inhibiting effect of precipitation on austenite softening, the plateau period of which is curtailed compared to the complete precipitation period [17]. The relevant parameters obtained using Equations (8)–(13) are displayed in Table 3.
Summarising the calculated results of Equations (5)–(13), the relative dominance of FP versus FR during the stress relaxation process at 900 °C for Ti microalloyed steel is illustrated asa force vs. log(time) curve in Figure 10. The decrease in dislocation density because of recovery and recrystallisation was not accounted for in the proposed model; therefore, FR is held constant at 1.63 MPa. The approximation in this study is justified, considering that precipitation during the plateau period inhibited most of the recrystallisation. By contrast, the period of FP dominance coincided with the plateau in the stress relaxation curve in Figure 2, indicating that the pinning effect of SIP inhibits SRX-induced austenitic softening.
Compared with the evolution in relative dominance between FP and FR, the correlation between SRX and SIP can be classified into four periods in Figure 10. The accuracy of this classification is further verified by the stress relaxation curve at 900 °C in Figure 2, with changes in the corresponding precipitated TiC particles in Figure 6 and average grain size of austenite in Figure 8. After validation, the correlation between SRX and SIP during stress relaxation can be classified as follows (displayed Figure 11):
Recovery and SRX period. At the beginning of the stress relaxation curve, the onset of recovery and SRX induces a decrease in stress in deformed austenite by depleting the internally stored deformation energy associated with dislocations [3]. The linear decrease in stress corresponds to the onset of single recovery, not accompanied by SRX [17], likely because of the longer gestation time of SRX at 900 °C.
Pre-plateau period. The dislocation accumulation in deformed austenite provided a preferential location for the nucleation and growth of nanoscale TiC particles [23], thereby resulting in the rapid peaking of FP at 1.83 MPa from 0 to 70 s. When FP increases to greater than FR, the overall pinning effect inhibited the migration of grain boundaries with SRX, reflected by the plateau period of the stress relaxation curve. However, SIP did not completely inhibit the progression of recovery, as reflected by the slow decrease in stress occurred during the plateau period. Therefore, the austenite grain size remained constant during this period, corresponding to the approximately unchanged austenite structure within 15–75 s.
Post-plateau period. With increasing isothermal time, FP decreased because of the growth of individual SIP particles. However, the inhomogeneous growth of TiC along dislocations and subgrain boundaries caused a reduction in solid-dissolved Ti and the increase in solute inhomogeneity. This phenomenon facilitated the migration of local grain boundaries, thereby leading to AGG with the onset of undesired mixed-crystal structure, as illustrated by the austenitic structure of 150 s [27,28].
Recovery and SRX restart period. When the microalloy element Ti reached dissolution equilibrium, the precipitated TiC particles would no longer increase in volume fraction and would instead merge with each other through the Ostwald ripening mechanism, thereby causing a continuous decrease in FP [35]. Until FP was less than FR, the pinning effect was insufficient to inhibit SRX, leading to a continued sharp decrease in the stress relaxation curve. The partial fine grains produced by recrystallisation consumed a large amount of deformation energy, while further exacerbating the mixed-crystal structure, for 600 s of metallography.
Using experimental data combined with theoretical model calculations, the correlation between SIP and SRX during stress relaxation in Ti microalloyed steel was revealed as a process of competing dominance and inhibiting each other. Compression temperature and isothermal holding time have been found to significantly influence this correlation. In terms of compression temperature, the nose temperature at which SIP occurred the fastest was 900 °C, whereas SRX occurred more rapidly with increasing holding temperature. In terms of isothermal time, the preferential onset of SRX or SIP substantially inhibited and delayed each other, and this inhibitory effect gradually decreased with increasing isothermal time until the effect was negligible. For industrial production, the main objective of non-recrystallisation controlled rolling is to retain dislocation accumulation in austenite while inhibiting recrystallisation and grain growth through SIP. In combination with the influence of compression temperature and isothermal time, it is recommended for Ti microallyed steel to finalise the rolling at 900 °C and hold it until the middle of the precipitation plateau period (75 s) before cooling. By optimising the final rolling temperature and the isothermal time after rolling, SIP and SRX can be controlled more effectively to achieve a well-balanced combination between strength and toughness.

5. Conclusions

The PTT curve obtained from the stress relaxation curves exhibited an inverted ‘S’ shape. The austenite microstructure evolution confirmed that the preferential onset of SRX above 940 °C, which resulted in a delay of the subsequent SIP. Below 940 °C, the PTT curve revert to the typical ‘C’ shape with the fastest precipitation nose temperature located at 900 °C.
The precipitated particles were identified as TiC in NaCl-type FCC structure with a lattice constant of 0.432 nm. The average particle size of TiC at 900 °C increased from 11.5 ± 3.3 nm to 21.5 ± 5.4 nm over the stress relaxation time of 150–500 s. However, the nature of SIP preferentially nucleating and growing at defects resulted in the non-uniform distribution and growth of the TiC particles.
To investigate the effect of temperature on the sequential correlation between SRX and SIP, the RPTT curve was plotted based on a SRX kinetic model and the PTT curve. SRX occurred more rapidly with increasing isothermal temperature. The preferential SRX above 940 °C inhibited SIP because rapid recrystallisation neutralised the dislocations and severely depleted the deformation energy. This inhibition effect reduced with increasing isothermal temperature, which can be attributed to the faster depletion of deformation energy and the reduction in the equilibrium volume fraction of the TiC particles.
To investigate the effect of isothermal time on the correlation between SRX and SIP, the dynamic competition between SIP and SRX below 940 °C was determined by comparing the recrystallisation driving force FR and the precipitation pinning force FP, in conjunction with the evolution of precipitates and austenitic structure. The precipitation plateau period occurred because of the relative dominance of FP versus FR, such that the pinning effect inhibited recrystallisation-induced austenite softening. In the post plateau period, the non-uniform distribution of the TiC particles led to an inhomogeneous pinning effect, which restricted the mobility of the boundaries to a portion of the austenite grains, resulting in abnormal grain growth and mixed-crystal structure.

Author Contributions

Conceptualization, Q.Z., X.H. and L.L.; Data curation, Q.Z.; Funding acquisition, X.H. and L.L.; Investigation, Q.Z. and C.L.; Methodology, Q.Z., S.C. and C.L.; Project administration, X.H. and L.L.; Supervision, X.H. and L.L.; Validation, Q.Z. and S.C.; Writing—original draft, Q.Z.; Writing—review & editing, Q.Z., X.H. and L.L. All authors have read and agreed to the published version of the manuscript.

Funding

This research was funded by Guangzhou Science and Technology Project, grant number 202007020007.

Data Availability Statement

Not applicable.

Acknowledgments

The authors would like to acknowledge the experimental platform and technical support provided by Shaoguan Steel Co., Ltd., China.

Conflicts of Interest

The authors declare no conflict of interest.

References

  1. Villalobos, J.C.; Del-Pozo, A.; Campillo, B.; Mayen, J.; Serna, S. Microalloyed Steels through History until 2018: Review of Chemical Composition, Processing and Hydrogen Service. Metals 2018, 8, 351. [Google Scholar] [CrossRef] [Green Version]
  2. Nasiri, Z.; Ghaemifar, S.; Naghizadeh, M.; Mirzadeh, H. Thermal Mechanisms of Grain Refinement in Steels: A Review. Met. Mater. Int. 2021, 27, 2078–2094. [Google Scholar] [CrossRef]
  3. Vervynckt, S.; Verbeken, K.; Lopez, B.; Jonas, J.J. Modern HSLA steels and role of non-recrystallisation temperature. Int. Mater. Rev. 2012, 57, 187–207. [Google Scholar] [CrossRef]
  4. Zhao, J.; Jiang, Z. Thermomechanical processing of advanced high strength steels. Prog. Mater. Sci. 2018, 94, 174–242. [Google Scholar]
  5. Kyzioł, K.; Kluska, S.; Januś, M.; Środa, M.; Jastrzębski, W.; Kaczmarek, L. Chemical composition and selected mechanical properties of Al–Zn alloy modified in plasma conditions by RF CVD. Appl. Surf. Sci. 2014, 311, 33–39. [Google Scholar] [CrossRef]
  6. Huo, X.; Xia, J.; Li, L.; Peng, Z.; Chen, S.; Peng, C. A review of research and development on titanium microalloyed high strength steels. Mater. Res. Express 2018, 5, 062002. [Google Scholar] [CrossRef]
  7. Xia, J.; Huo, X.; Li, L.; Peng, Z.; Chen, S. Development of Ti microalloyed high strength steel plate by controlling thermo-mechanical control process schedule. Mater. Res. Express 2017, 4, 126504. [Google Scholar] [CrossRef]
  8. Mao, X.; Huo, X.; Sun, X. Strengthening mechanisms of a new 700 MPa hot rolled Ti-microalloyed steel produced by compact strip production. J. Mater. Process. Technol. 2010, 210, 1660–1666. [Google Scholar] [CrossRef]
  9. Zhang, K.; Li, Z.; Sun, X.; Yong, Q.; Yang, J.; Li, Y.; Zhao, P. Development of Ti–V–Mo Complex Microalloyed Hot-Rolled 900-MPa-Grade High-Strength Steel. Acta Metall. Sin. 2015, 28, 641–648. [Google Scholar] [CrossRef] [Green Version]
  10. Larzabal, G.; Isasti, N.; Rodriguez-Ibabe, J.M.; Uranga, P. Evaluating Strengthening and Impact Toughness Mechanisms for Ferritic and Bainitic Microstructures in Nb, Nb-Mo and Ti-Mo Microalloyed Steels. Metals 2017, 7, 65. [Google Scholar] [CrossRef] [Green Version]
  11. Huo, X.; Li, L.; Peng, Z.; Chen, S. Effects of TMCP Schedule on Precipitation, Microstructure and Properties of Ti-microalloyed High Strength Steel. J. Iron. Steel Res. Int. 2016, 23, 593–601. [Google Scholar] [CrossRef]
  12. Zaitsev, A.; Arutyunyan, N. Low-Carbon Ti-Mo Microalloyed Hot Rolled Steels: Special Features of the Formation of the Structural State and Mechanical Properties. Metals 2021, 11, 1584. [Google Scholar] [CrossRef]
  13. Wang, Z.; Chen, H.; Yang, Z.; Jiang, F. Decelerated Coarsening of (Ti, Mo)C Particles with a Core–Shell Structure in Austenite of a Ti-Mo-Bearing Steel. Metall. Mater. Trans. A 2018, 49, 1455–1459. [Google Scholar] [CrossRef]
  14. Wang, Z.; Sun, X.; Yang, Z.; Yong, Q.; Zhang, C.; Li, Z.; Weng, Y. Carbide precipitation in austenite of a Ti–Mo-containing low-carbon steel during stress relaxation. Mater. Sci. Eng. A 2013, 573, 84–91. [Google Scholar] [CrossRef]
  15. Funakawa, Y.; Shiozaki, T.; Tomita, K.; Yamamoto, T.; Maeda, E. Development of High Strength Hot-rolled Sheet Steel Consisting of Ferrite and Nanometer-sized Carbides. ISIJ Int. 2004, 44, 1945–1951. [Google Scholar] [CrossRef]
  16. Andrade, H.L.; Akben, M.G.; Jonas, J.J. Effect of molybdenum, niobium, and vanadium on static recovery and recrystallization and on solute strengthening in microalloyed steels. Metall. Trans. A 1983, 14, 1967–1977. [Google Scholar] [CrossRef]
  17. Wang, Z.; Mao, X.; Yang, Z.; Sun, X.; Yong, Q.; Li, Z.; Weng, Y. Strain-induced precipitation in a Ti micro-alloyed HSLA steel. Mater. Sci. Eng. A 2011, 529, 459–467. [Google Scholar] [CrossRef]
  18. Liu, W.J.; Jonas, J.J. A stress relaxation method for following carbonitride precipitation in austenite at hot working temperatures. Metall. Trans. A 1988, 19, 1403–1413. [Google Scholar] [CrossRef]
  19. Chen, S.; Li, L.; Peng, Z.; Huo, X.; Gao, J. Strain-induced precipitation in Ti microalloyed steel by two-stage controlled rolling process. J. Mater. Res. Technol. 2020, 9, 15759–15770. [Google Scholar] [CrossRef]
  20. Huo, X.; Lv, Z.; Ao, C.; Li, L.; Xia, J.; Chen, S. Effect of strain-induced precipitation on microstructure and properties of titanium micro-alloyed steels. J. Iron Steel Res. Int. 2022, 29, 983–993. [Google Scholar] [CrossRef]
  21. Jung, J.-G.; Park, J.-S.; Kim, J.; Lee, Y.-K. Carbide precipitation kinetics in austenite of a Nb–Ti–V microalloyed steel. Mater. Sci. Eng. A 2011, 528, 5529–5535. [Google Scholar] [CrossRef]
  22. Liu, W.J. A Review of the Stress-Relaxation Method for Following the Kinetics of Precipitation, Recovery and Recrystallization. Mater. Sci. Forum 2012, 706–709, 2758–2763. Available online: www.scientific.net/MSF.706-709.2758 (accessed on 1 November 2022).
  23. Kwon, O.; DeArdo, A.J. Interactions between recrystallization and precipitation in hot-deformed microalloyed steels. Acta Metall. Mater. 1991, 39, 529–538. [Google Scholar] [CrossRef]
  24. Medina, S.F.; Quispe, A. Static Recrystallisation-Precipitation Interaction in Microalloyed Steels. Mater. Sci. Forum 2003, 426–432, 1139–1144. Available online: www.scientific.net/MSF.426-432.1139 (accessed on 1 November 2022).
  25. Jian, Z.; Kang, Y.; Mao, X.; Lin, Z.; Li, L. Effect of Ti on the mechanical properties of high strength weathering steel. J. Univ. Sci. Technol. B 2006, 28, 926–930. [Google Scholar]
  26. Yang, Z.; Enomoto, M. Calculation of the interfacial energy of B1-type carbides and nitrides with austenite. Metall. Mater. Trans. A 2001, 32, 267–274. [Google Scholar] [CrossRef]
  27. Fujiyama, N.; Nishibata, T.; Seki, A.; Hirata, H.; Kojima, K.; Ogawa, K. Austenite grain growth simulation considering the solute-drag effect and pinning effect. Sci. Technol. Adv. Mater. 2017, 18, 88–95. [Google Scholar] [CrossRef]
  28. Goins, P.E.; Frazier, W.E. A model of grain boundary complexion transitions and grain growth in Yttria-doped alumina. Acta Mater. 2020, 188, 79–91. [Google Scholar] [CrossRef]
  29. Gong, P.; Palmiere, E.J.; Rainforth, W.M. Characterisation of strain-induced precipitation behaviour in microalloyed steels during thermomechanical controlled processing. Mater. Charact. 2017, 124, 83–89. [Google Scholar] [CrossRef]
  30. Medina, S.; Quispe, A. Improved Model for Static Recrystallization Kinetics of Hot Deformed Austenite in Low Alloy and Nb/V Microalloyed Steels. ISIJ Int. 2001, 41, 774–781. [Google Scholar] [CrossRef]
  31. Gómez, M.; Rancel, L.; Fernández, B.J.; Medina, S.F. Evolution of austenite static recrystallization and grain size during hot rolling of a V-microalloyed steel. Mater. Sci. Eng. A 2009, 501, 188–196. [Google Scholar] [CrossRef] [Green Version]
  32. Beck, P.A.; Sperry, P.R.; Hu, H. The Orientation Dependence of the Rate of Grain Boundary Migration. J. Appl. Phys. 1950, 21, 420–425. [Google Scholar] [CrossRef]
  33. Gómez, M.; Medina, S.F.; Chaves, J.I. Static Recrystallization of Austenite in a Medium-Carbon Vanadium Microalloyed Steel and Inhibition by Strain-Induced Precipitates. Mater. Sci. Forum 2007, 550, 417–422. Available online: www.scientific.net/MSF.550.417 (accessed on 1 November 2022).
  34. Zener, C. Theory of Growth of Spherical Precipitates from Solid Solution. J. Appl. Phys. 1949, 20, 950–953. [Google Scholar] [CrossRef]
  35. Vervynckt, S.; Verbeken, K.; Thibaux, P.; Houbaert, Y. Recrystallization–precipitation interaction during austenite hot deformation of a Nb microalloyed steel. Mater. Sci. Eng. A 2011, 528, 5519–5528. [Google Scholar] [CrossRef]
Figure 1. Schematic of stress relaxation treatment of samples through two-stage controlled rolling.
Metals 12 01920 g001
Figure 2. Stress relaxation curves for Ti microalloyed steel in a two-stage controlled compression process at different isothermal temperatures. The two arrows in each curve indicated the Ps and Pf points.
Metals 12 01920 g002
Figure 3. PTT curve for the Ti microalloyed steel.
Metals 12 01920 g003
Figure 4. TEM image of Ti microalloyed steel deformed at 900 °C and held for 500s showing (a) dark field image; (b) HAADF image; and (ce) corresponding EDS mapping.
Metals 12 01920 g004
Figure 5. HRTEM images of Ti microalloyed steel deformed at 900 °C and held for 500 s: (a) a carbide particle; (b) its FFT diffractogram; and (c) its IFFT lattice image, with a measured lattice spacing between the two arrows.
Metals 12 01920 g005
Figure 6. Carbide evolution and particle size distribution in Ti microalloyed steel deformed at 900 °C and held for (a,b) 150 s; (c,d) 500 s.
Metals 12 01920 g006
Figure 7. Evolution of the austenite grain with mean grain sizes in Ti microalloyed steel deformed at 960 °C and held for different times.
Metals 12 01920 g007
Figure 8. Evolution of the austenite grain of Ti microalloyed steel deformed at 900 °C and held for different times.
Metals 12 01920 g008
Figure 9. RPTT curve for Ti microalloyed steel.
Metals 12 01920 g009
Figure 10. Evolution of recrystallization driving force FR and precipitation pinning force FP during stress relaxation at 900 °C for Ti microalloyed steel.
Metals 12 01920 g010
Figure 11. Evolution of the correlation between SIP and SRX during stress relaxation at 900 °C.
Metals 12 01920 g011
Table 1. Test steel chemical composition (wt.%) and grain size after austenitisation dγ (μm).
SteelCSiMnSPNTidγ
Ti0.0610.281.610.0470.00300.00290.1158
Table 2. Time required for different levels of SRX at different isothermal temperatures for Ti microalloyed steel (s).
Xr860 °C880 °C900 °C920 °C940 °C960 °C
5%66.843.328.519.012.88.8
50%152.697.162.741.127.418.4
75%372.3232.1147.194.761.941.1
Table 3. Parameters related to the precipitation fraction during stress relaxation at 900 °C.
ParameterfeCq
Value0.00130.00701.3395
Publisher’s Note: MDPI stays neutral with regard to jurisdictional claims in published maps and institutional affiliations.

