Article

Effect of the Surface Oxide Layer on Shape Memory Effect and Superelasticity of [011]-Oriented Ti-50.1Ni Single Crystals

by
Yuriy I. Chumlyakov
,
Irina V. Kireeva
*,
Anastasia A. Saraeva
,
Zinaida V. Pobedennaya
and
Anna V. Vyrodova
Laboratory of Physics of High-Strength Crystals, National Research Tomsk State University, Lenin Ave. 36, 634050 Tomsk, Russia
*
Author to whom correspondence should be addressed.
Metals 2022, 12(11), 1932; https://doi.org/10.3390/met12111932
Submission received: 15 September 2022 / Revised: 28 October 2022 / Accepted: 9 November 2022 / Published: 11 November 2022
(This article belongs to the Special Issue Microstructure and Mechanical Behaviour of Shape Memory Alloys)

Abstract

:
Effect of the surface oxide layer on the shape memory effect (SME) and superelasticity (SE) after marforming (deformation in the martensitic state, followed by annealing at 713 K for 0.5 h in an inert helium gas and in dry air) was investigated on Ti-50.1Ni (at.%) single crystals, oriented along [011]-direction, under compression. Quenched [011]-oriented crystals of the Ti-50.1Ni alloy experience a one-stage B2-B19′ martensitic transformation (MT) without SE under compression. Marforming leads to a two-stage B2-R-B19′ MT and creates conditions for SE. A thin TiO2 oxide layer of 170 nm thick was formed on the sample surface upon annealing at 713 K for 0.5 h in dry air. In [011]-oriented crystals without and with an oxide layer, maximum of the SE value reached 4%, and the SME was 2.4 and 2.6%, respectively. Appearance of an oxide layer upon annealing in dry air: (i) reduces the stresses of B2-phase by 50 MPa from Md to 473 K; (ii) decreases Θ = dσ/dε from 6.5 GPa in crystals without an oxide layer to 2.0 GPa with an oxide layer and (iii) does not affect the SME and SE values.

1. Introduction

TiNi alloys are well known due to their unique properties, namely shape memory effect (SME) and superelasticity (SE), associated with the thermoelastic phase transformations from the high-temperature ordered B2-phase to the monoclinic B19′-martensite during a one-stage B2-B19′ martensitic transformation (MT) or a two-stage B2-R-B19′ MT [1,2,3,4,5,6,7,8,9,10,11,12]. Here R is a rhombohedral phase. In single-phase equiatomic and near-equiatomic TiNi alloys, the B2-R transition is initiated by preliminary deformation in the high-temperature B2-phase (ausforming) or in martensite (marforming) followed by low-temperature annealing, which retains the defect structure after deformation [7,8,9]. In this case, ausforming and marforming lead to the appearance of SE, which is not observed in quenched crystals of equiatomic and near- equiatomic composition TiNi alloys [7,8,9].
In many applications in medicine and engineering, TiNi alloys are deformed to obtain wires, plates, or complex-shaped products obtained by additive technologies [1,4,11,13]. Plate rolling and wire production are carried out in the temperature range from 673 K to 1023 K in air. In this case, TiNi alloys interact with oxygen, forming oxide layers [14,15,16,17,18,19,20]. Oxide films of various thicknesses and structures are formed depending on the temperature and exposure time. Three layers are formed during oxidation at a temperature of 1023 K and above: the outer layer consists of TiO2, the intermediate layer is a mixture of TiO2 and nickel and the inner layer has the Ni3Ti composition [17,18,19,20]. The thickness of the surface oxide layer increases from 1 µm to 40–50 µm with a growth in the oxidation temperature from 923 to 1273 K [16,17,18,19]. Lowering the oxidation temperature to 673–773 K for 0.5–1 h promotes the formation of a thin oxide layer of 80–100 nm thick, which leads to good biocompatibility of the TiNi implants [20].
The influence of the thickness of the oxide layer on the MT temperatures, SME and SE was studied on polycrystals of the TiNi alloy [19]. However, there are no studies on the effect of the oxide layer on the functional (SME and SE) and mechanical properties of TiNi single crystals. Therefore, the aim of the present paper is investigation of the oxide layer effect on the SME and SE of [011]-oriented crystals of the Ti-50.1Ni (at.%) alloy. In addition, there are currently no papers on the effect of marforming on the SE in [011]-oriented crystals. This paper is intended to fill this gap. It should be noted that annealing after deformation in the martensitic state can be carried out in an inert He (Helium) gas, when the oxide layer is not formed, and in dry air, when the oxide layer is formed. Carrying out such studies on TiNi single crystals makes it possible, firstly, to exclude the effect of grain boundaries and their different orientations relative to the applied stress during marforming on the SME and SE. Secondly, to obtain new objects after marforming, which are pseudo-single crystals and contain defects in the microstructure such as dislocations, twins and stabilized martensite. Thirdly, for the first time, to study the SME and SE in crystals after marforming with an oxide layer and compare them with crystals after marforming without an oxide layer.

2. Materials and Methods

Ti-50.1Ni (at.%) alloys were smelted from pure components in an ARC-200 furnace (Arcast Inc., Oxford, MS, USA) with arc remelting in a cold copper crucible. For a uniform distribution of elements over the ingots, the ingots were remelted three times. Single crystals were grown by the Bridgman method in graphite crucibles and helium atmosphere, on a Russian-made Redmet installation (Firm “Kristallooptika”, Tomsk, Russia). To determine the [011] orientation of the crystals, the diffractometric method was used by means of a DRON-3M X-ray diffractometer (Bourevestnik, St.-Petersburg, Russia) with monochromatic Fe Kα radiation. Compression specimens 4 × 4 × 8 mm3 in size were cut by wire electrical discharge machining ARTA-5.9 (DELTA-TEST, Fryazino, Moscow region, Russia). The differential scanning calorimetry (DSC) method (NETZSCH DSC 404F1 machine (NETZSCH Geratebau GmbH, Selb, Germany with a cooling/heating rate of 10 K/min) was used to study the MT temperatures (RMs, Ms are temperatures, respectively, for start of the forward B2-R and R-B19′ MTs at cooling, and Af, RAf are temperatures, respectively, for finish of the reverse B19′-R and R-B2 MTs at heating). To study the temperature dependence of critical stresses and SE, an Instron 5969 testing machine (Instron, Norwood, MA, USA) was used. Mechanical tests were carried out at strain rate of 4 × 10⁻⁴ s−1. SME at a constant tensile stress in the cycle, was studied using a Russian-made dilatometer (Firm “Kristallooptika”, Tomsk, Russia) during cooling and heating within a temperature range of 77 to 400 K, with a heating/cooling rate of 10 K/min.
The sample preparation procedure and thermomechanical processing (marforming) were described in detail in [7]. Marforming included deformation up to 7.7% in the martensitic state at 203 K and subsequent annealing at 713 K for 0.5 h in an inert He gas and in dry air. To eliminate the influence of the natural oxide film on the functional and mechanical properties, all samples after quenching, before marforming, and after annealing in He gas at a temperature of 713 K for 0.5 h, before testing, were subjected to mechanical grounding and electrolytic polishing in an electrolyte containing 490 mL of CH3COOH + 10 mL of HClO4, at 263 K, with 20 V applied voltage. The choice of oxidation conditions (temperature 713 K and time 0.5 h) was carried out on the basis of previous experiments [19,20], which showed that short oxidation times of 0.5–1 h and low oxidation temperatures of 713–773 K led to the formation of a thin oxide layer on TiNi polycrystals of similar composition, with a thickness up to 100 nm. This layer is not destroyed during the study of SE and, therefore, protects the alloy from contact with the human body when it is used as an implant. After oxidation in air, the surface layer had an orange-pink color with a slight blue tint at the edges and had a layer thickness of 170 nm on average along the length of the sample. The thickness of the oxide layer was determined in two methods. Firstly, using scanning electron microscope (SEM) TESCAN VEGA3 (TESCAN, Brno, Czech) with an energy dispersive spectroscopy (EDS) detector in the study of the cross section of the sample after annealing. The chemical composition of the oxide layer, determined by the EDS method, showed that the surface layer had a high concentration of oxygen atoms, and the oxide layer had the following chemical composition: O—25.4%, Ti—37.4%, Ni—37.2%. Secondly, the oxide layer established by the first method was removed using mechanical grinding, and then the chemical composition of the samples was determined by EDS. After removing the layer thickness of 170 nm, the chemical composition of the samples turned out to be the same as in the initial crystals before annealing in dry air: Ti—49.9%, Ni—50.1%.
The microstructure was investigated by a JEOL-2010 transmission electron microscope (TEM) (JEOL, Tokyo, Japan) at an accelerating voltage of 200 kV. The thin foils were prepared using double-jet electropolishing (TenuPol-5, “Struers”, Ballerup, Denmark), with an electrolyte containing 20% sulfuric acid in methyl alcohol at room temperature, with 12.5 V applied voltage. In crystals without an oxide layer, thin foils were cut out from the sample body to study the structure after residual strain. In crystals with an oxide layer, thin foils were cut out directly at the edge of the samples containing an oxide film. The samples were thinned from the side of the cut so as to preserve the oxide film for studying the microstructure.
The SME and SE were studied in the initial samples (after quenching), which were named as Crystals I, after low-temperature deformation and annealing in He gas (Crystals II), after low-temperature deformation and annealing in dry air (Crystals III). In SME experiments, the transformation strain εtr, reversible strain εrev and irreversible strain εirr were determined from the εtr(T) curve. The εtr is the strain that is observed in the εtr(T) curve under stress at cooling, and εrev is the strain that is observed in the εtr(T) curve under stress when heated. The amount of εrev is equal to the SME under stress. Irreversible strain εirr is defined as the difference between εtr and εrev.

3. Results

3.1. Microstructure and Martensitic Transformation Temperatures after Marforming

TEM studies of the residual strain at 296 K in Crystals II and Crystals III are shown in Figure 1. In Crystals II, the residual strain contains three phases: B2-phase, retained B19′-martensite and R-phase (Figure 1a,b). In Crystals III, the microstructure of the oxide layer after residual strain is characterized by a complex composition. Analysis of the microdiffraction pattern shows that, simultaneously with the B2-phase, retained B19′-martensite and R-phase, reflections of two more phases, namely, TiO2 and Ni3Ti particles are detected (Figure 1c,d). The Ni3Ti particles have a quasi-equiaxed shape 15–20 nm in size. An analysis of the literature data shows that the TiO2 phase forms the basis of the first surface oxide layer, which is formed upon annealing in dry air at a temperature of 723–873 K for 0.5–1 h [20]. The Ni3Ti particles are formed upon annealing in dry air at higher temperatures of 923–1023 K for 0.5–1 h and, as a rule, are located in the second near-surface layer [19]. In our case, these two phases (TiO2 and Ni3Ti) are found in the surface layer of single crystals after low-temperature deformation and annealing in air at 713 K for 0.5 h. Consequently, the introduced defect structure during low-temperature deformation in martensite activates the precipitation of Ni3Ti particles that is confirmed by the orange-pink color of the surface layer after oxidation and its thickness of 170 nm. Usually, in defect-free samples, the pink color of the surface layer of 154 nm thick is observed after annealing in air at 823 K for 1 h [20].
The results of studying the MT temperatures in [011]-oriented crystals of the Ti-50.1Ni (at.%) alloy after quenching (Crystals I) and marforming (Crystals II and Crystals III) are shown in Figure 2. In Crystals I, upon cooling and heating, the DSC curves revealed one peak of exothermic and endothermic heat, which is usually observed in poly- and single crystals of single-phase TiNi alloys and is associated with B2-B19′ and B19′-B2 MT, respectively. The B2-B19′ MT temperatures turned out to be close to those obtained earlier for [001]-oriented crystals and for polycrystals of the TiNi alloys of a similar composition [1,2,5,6,7,8]. In [011]-oriented crystals, temperature hysteresis ΔTh = AfMs = 34 K and temperature Ms = 224 K, and in [001]-oriented crystals, ΔTh = 25 K and Ms = 252 K [7].
In Crystals II and III, after strain at temperature of 203 K, which is close to the temperature Mf = 197 K, and subsequent annealing in an inert gas and dry air, during cooling and heating, two peaks of exothermic and endothermic heat are observed (Figure 2b,c). In Crystals II, the MTs during cooling is characterized by the wide temperature range ΔT = 182–307 K, while reverse MTs occur in a narrow one from 279 to 315 K. In Crystals III, as in crystals II, forward MTs occur in a wide temperature range from 312 to 177 K, while reverse MTs occur in a narrow one from 281 to 319 K. It can be seen that in Crystals III there is an increase in the start temperature of the first peak RMs by 5 K and a decrease in the start temperature of the second peak Ms by 6 K compared to Crystals II. A comparison of the DSC and TEM study obtained for Crystals II and III, as well as with the literature DSC curves for TiNi polycrystals of similar composition alloy after oxidation [19], shows that the first peak of forward MT is the B2-R transition with a small temperature hysteresis ΔTh, which is equal to 7 and 8 K, respectively, for Crystal III and II. The second peak with large temperature hysteresis (ΔTh = 83 K in Crystal II and ΔTh = 88 K in Crystal III) is the R-B19′ transition. During heating, two peaks are associated with B19′-R and R-B2 transitions, respectively. It can be seen that oxidation increases the Af temperature by 3 K for the B19′-R transition and RAf by 4 K for the R-B2 transition. Thus, marforming regardless of annealing in helium gas or dry air, leads to a change in the MT from a one-stage B2-B19′ MT in quenched Crystals I to a two-stage B2-R-B19′ MT in Crystals II and III of the Ti-50.1Ni alloy, as in other single- and polycrystals of equiatomic and near-equiatomic TiNi alloys [2,7,8,9]. An oxide layer in 170 nm thick upon annealing in dry air does not significantly affect the MT temperatures relative to crystals without an oxide layer.

3.2. Shape Memory Effect

The study of the SME at different levels of constant external stresses σex of [011]-oriented crystals of the Ti-50.1Ni alloy is presented in Figure 3. It can be seen that in Crystals I–III, the MT temperatures (Ms and RMs) under σex increase with increasing σex. This dependence is linear, which is characteristic of alloys with MT under stress and is described by the Clausius-Clapeyron relation [1,2]:
d σ cr T d T = Δ S ε 0 = Δ H ε 0 T 0
Here ΔS, ΔH are the change in entropy and enthalpy during MT; T0 is the equilibrium temperature of the phases; ε0 is the lattice deformation during MT.
In Crystals I, firstly, a transformation strain εtr increases from 0.3% at σex = 50 MPa to 3.7% at σex = 400 MPa. Secondly, the irreversible strain εirr at σex ≤ 100 MPa is equal to zero, and at σex ≥ 150 MPa it increases to 0.6% at σex = 400 MPa. As a result, at σex = 400 MPa at the maximum value of εtr = 3.7% and εirr = 0.6%, the reversible strain εrev and, accordingly, SME under stress is 3.1%. In terms of magnitude, the maximum values of εtr and εSME turned out to be lower than the theoretical value ε0 for B2-B19′ MT in [011]-oriented crystals under compression [1,2,21,22]. Thirdly, the temperature hysteresis ΔTh = AfMs depends on σex and increases from 45 K at σex = 50 MPa to 60 K at σex = 400 MPa.
The magnitudes of overcooling ΔM = MfMs and overheating ΔA = AfAs growth with increasing σex and AsMs, as was previously observed in [001]-oriented crystals on compression of a TiNi alloy of similar composition [7]. The ΔM and ΔA values are close (at σex = 100 MPa ΔM = 35 K and ΔA = 32 K; at σex = 300 MPa ΔM = 83 K and ΔA = 68 K) and the temperature hysteresis is symmetrical. High magnitudes of ΔM and ΔA and AsMs, in accordance with the findings of analysis of the thermoselastic stress-induced MT, evidence a high level of elastic energy ΔGel, which significantly exceeds the dissipated energy, ΔGel ≥ 2ΔGdis [1,2,7,23,24]. Such MTs belong to the second type of thermoelastic MTs according to the Tong-Wayman classification [23,24]. This is a general pattern for single crystals of the quenched TiNi alloys of equiatomic and near-equiatomic composition [7,9].
In Crystals II and III after marforming, a qualitatively similar behavior of the εtr(T) curves is observed, but different from the behavior of the εtr(T) curves in Crystals I.
Firstly, the stress-induced transformation with εtr = 0.7–0.8% occurs at much lower σex = 12.5 MPa than in Crystals I. Then εtr increases to 2.6 and 2.7% at σex of 350 and 400 MPa for Crystals II and III, respectively, (Figure 3b,c). At σex ≤ 100 MPa, εirr = 0%, and at σex ≥ 150 MPa, it appears, but does not exceed 0.2% at σex = 350 and 400 MPa. As a result, at σex = 350–400 MPa, the SME under stress was 2.4 and 2.6%, for Crystals II and III, respectively. These values turned out to be less than the SME in Crystals I and the theoretical value of ε0 = 5.15% for B2-B19′ MT in [011]-oriented crystals under compression [1,2,21,22]. Secondly, overcooling ΔM = MsMf notable exceeds overheating ΔA = AfAs. In this case, the hysteresis under stress during cooling ΔT1 = AfMs is significantly less than the hysteresis ΔT2 = AsMf during heating, and the εtr(T) loop has an asymmetric form. Thirdly, in both crystals, the forward stress-induced transformation has a complex staging of εtr(T) curve, characterized by three stages with different values of dεtr(T)/dT. The first stage with a small temperature hysteresis ΔTh = 3–5 K and a large value of dεtr(T)/dT, according to DSC and TEM data, is associated with the B2-R MT. The second and third stages, according to previous studies on [001]-oriented single crystals of the TiNi alloy of similar composition, are associated with the stress-induced R-B19′ MT near inhomogeneities of the microstructure (dislocations and stabilized B19′-martensite) and in defect-free regions [7]. It can be seen that with an increase in σex ≥ 350 MPa, the first and second stages associated with the stress-induced B2-R MT and R-B19′ MT near inhomogeneities of the defect structure disappear. As a result, εtr is determined by the R-B19′ MT in defect-free regions and ΔTh acquires a shape close to symmetrical (Figure 3b,c). In [001] orientation, the stress-induced B2-R MT was not appear on the εtr(T) and σ(ε) curves due to the zero contribution for the B2-R transition in this orientation [7]. However, this B2-R transformation with εtr ≈ 1% and α = dσcr/dT = 10 MPa/K was observed earlier on the σ(ε)-curve in [111]-oriented crystals under tension [1,2,25]. In [011]-oriented crystals under compression, the stress-induced B2-R transition has the values εtr ≈ 0.2–0.25% and α = dσcr/dT = 17 MPa/K. In Crystals II and III, as in Crystals I, stress-induced MTs are MTs of the second type according to the Tong-Wayman classification, since AsMs [23,24].
A comparison of the SME data in Crystals II and III shows that the oxide layer of 170 nm thick does not affect the staging of the stress-induced MT, SME value, and temperature hysteresis ΔTh.
The cyclic stability of the SME in Crystals I–III was studied at σex = 100 MPa up to 100 repeated cycles of “cooling-heating” (Figure 4). At σex = 100 MPa, when studying the SME under stress, the irreversible strain εirr in these crystals was equal to zero (Figure 3). It turned out that with an increase in repeated cycles of “cooling-heating” to n = 100 in Crystals I-III, the εirr also did not appear. However, there were insignificant changes in the SME value, temperature hysteresis ΔTh and Ms temperature. So, in Crystals I with an increase in repeated cycles of “cooling-heating” to n = 100 at σex = 100 MPa, the SME decreased by 0.2%; the Ms temperature increased by 2 K, while ΔTh remained constant. In Crystals II, the SME remained unchanged, ΔTh, and Ms are increased by 3 K and 5 K, consequently. As for the Crystals III, the SME and ΔTh remained unchanged, while the Ms increased by 2 K. Thus, at σex = 100 MPa, Crystals I-III demonstrate good cyclic stability up to n = 100.

3.3. Superelasticity

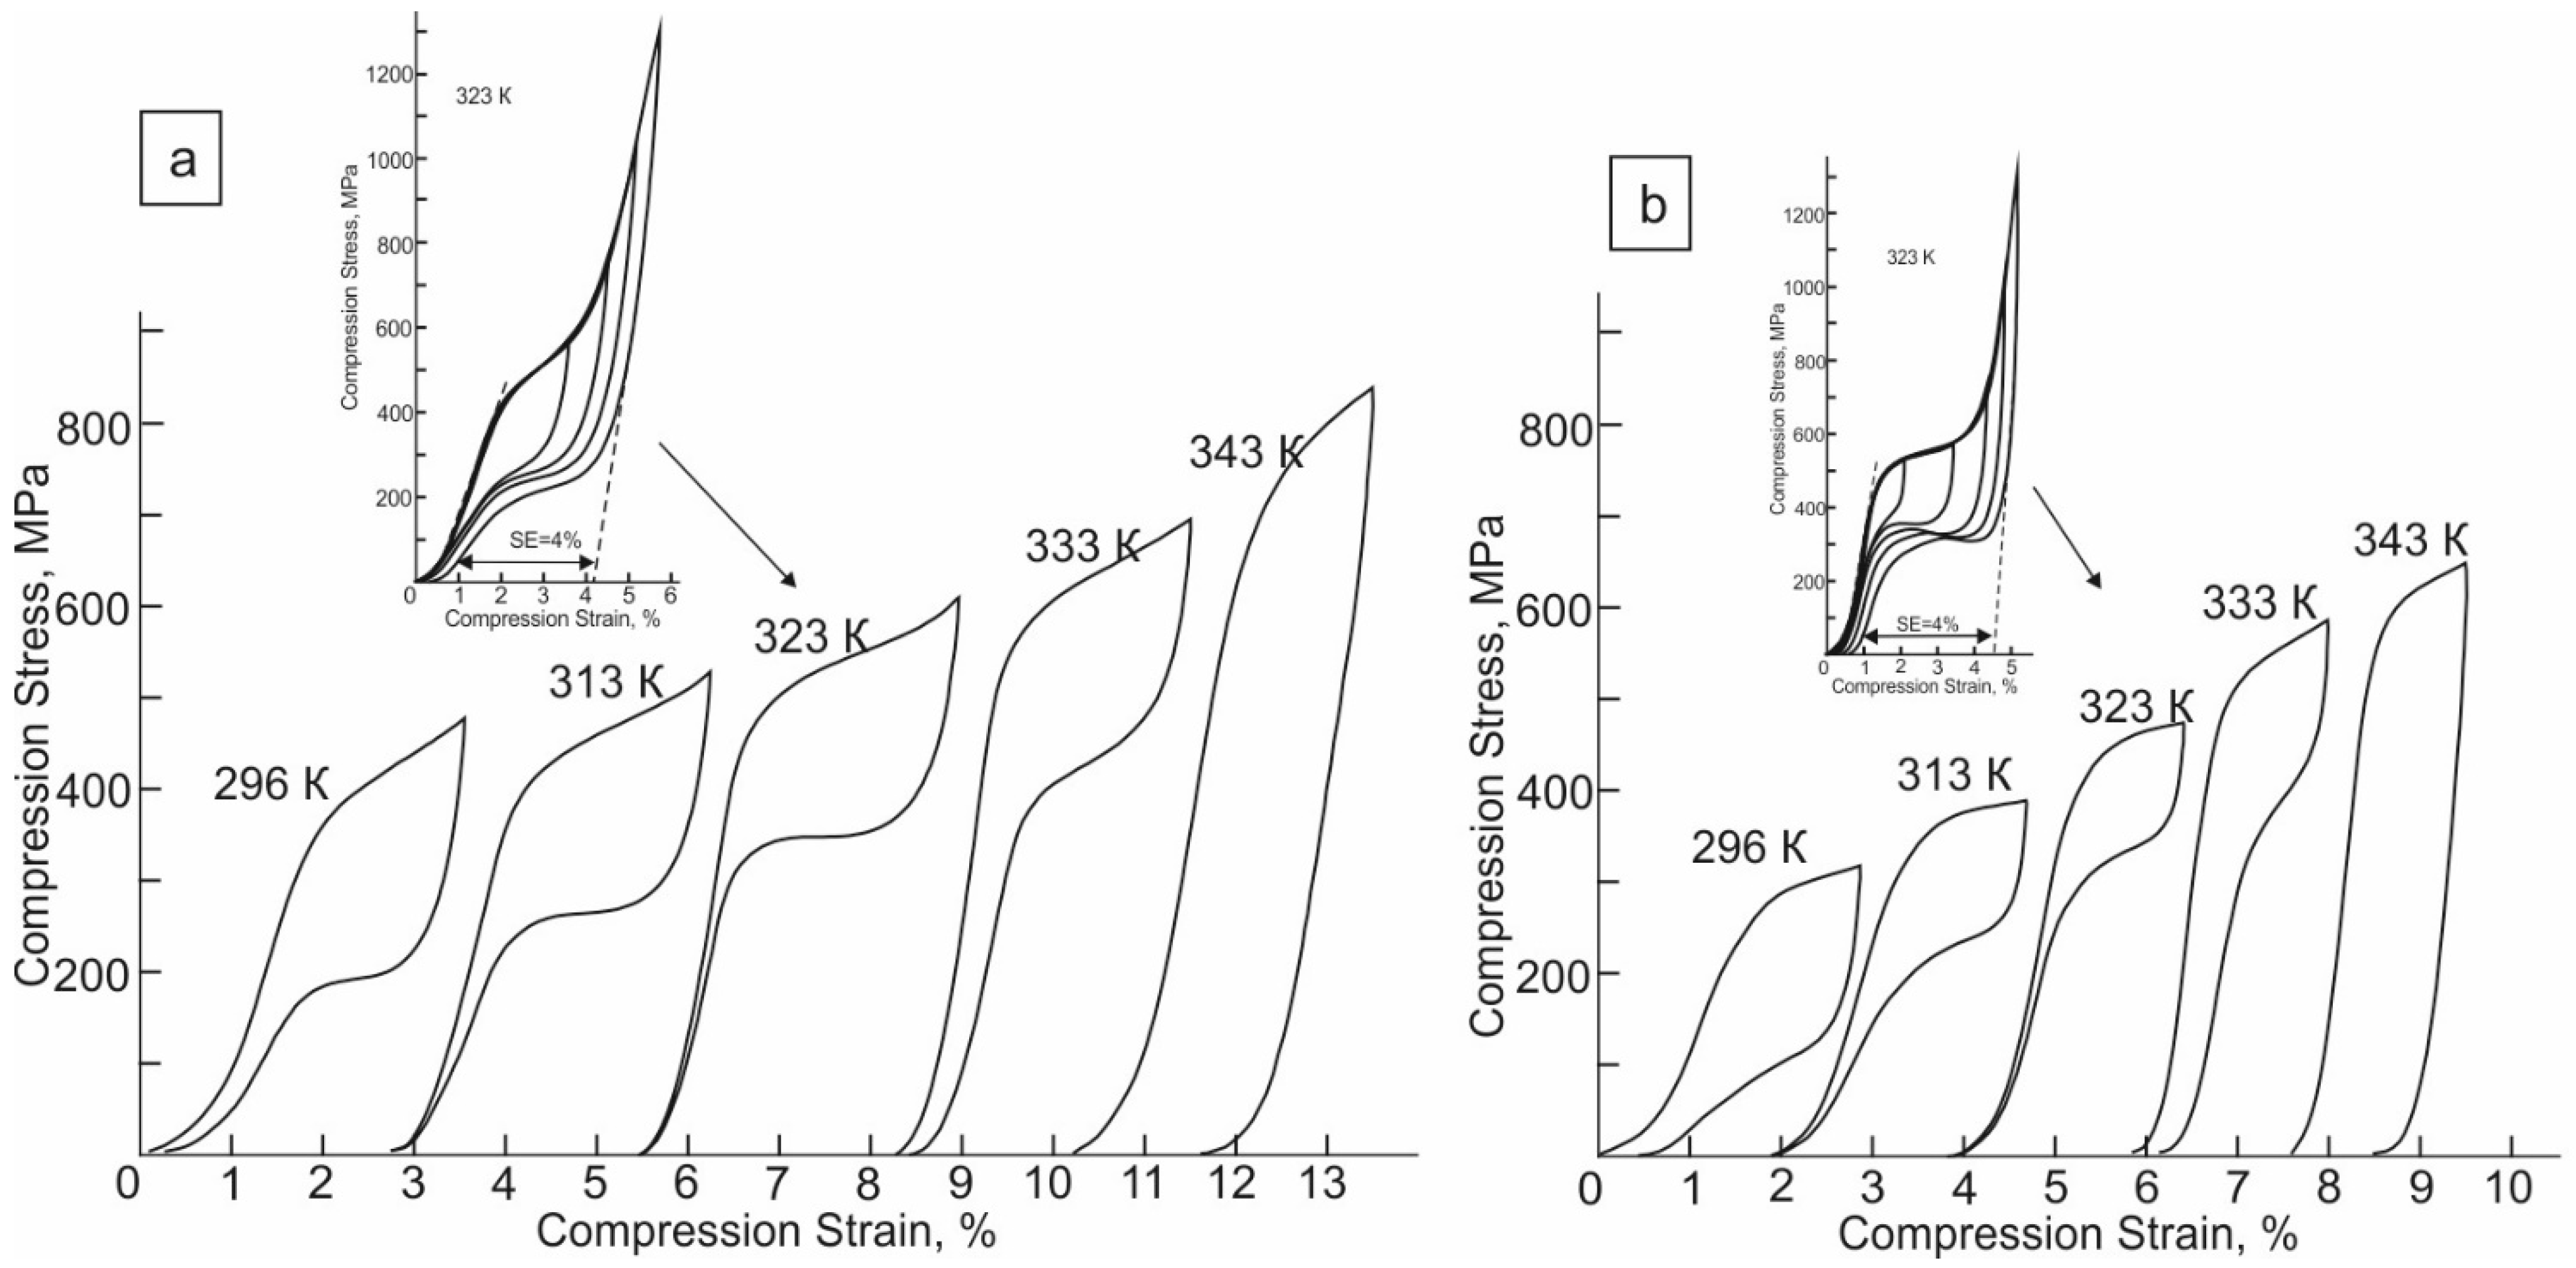
SE is absent in Crystals I, but it is observed in Crystals II and Crystals III after marforming (Figure 5). In Crystals II, the SE temperature range is ΔTSE = 37 K (Figure 5a). The first perfect SE loop takes place at T = 296 K, which coincided with the temperature Af = 294 K for the second R-B19′ peak (Figure 2b). In the temperature range of 296–333 K, perfect SE is observed when transformation strain εtr up to 2%. The maximum value of SE εSE is 4%. The εSE is larger than the SME value, but less than the theoretical value of the lattice deformation ε0 for the B2-B19′ MT in the [011] orientation under compression [1,2,21,22]. It can be seen that the mechanical hysteresis Δσ = 200 MPa at εtr = 2% weakly depends on the test temperature, but increases during cycling with an increase in εtr during “load-unloading” cycle. At T = 296 K, the transformation hardening coefficient Θ = dσ/dε = 6.5 GPa and decreases to 5.0 GPa at T = 323 K.
In Crystals III, the SE temperature range of ΔTSE = 37 K (Figure 5b). However, at 296 and 333 K at εtr = 1.5%, a low irreversible strain εirr = 0.3% is observed. In Crystals III, as in Crystals II, SE starts at T = 296 K, which coincides with the temperature Af = 297 K for the second R-B19′ peak (Figure 2c). The maximum SE value εSE, determined by “load-unloading” cyclic with an increase in strain by 1% in each subsequent cycle, is 4% and this is less than the theoretical value ε0 for B2-B19′ MT in [011] orientation under compression [1,2,21,22]. At εtr = 1.5% and 296 K, the mechanical hysteresis Δσ = 200 MPa. The Δσ decreases with increasing temperature to Δσ = 150 MPa at 323 K and increases during cycling with an increase in εtr in the “load-unloading” cycle (Figure 5b). The transformation hardening coefficient Θ = dσ/dε = 2.0 GPa weakly depends on the test temperature.
A comparison of the SE data in Crystals II and III shows that the oxide layer of 170 nm thick affects the development of the stress-induced MT. The oxide layer leads to a decrease in the transformation hardening coefficient Θ = dσ/dε and a decrease in mechanical hysteresis Δσ with increasing test temperature. In addition, in Crystals III at 323 K, an interesting feature of the behavior of hysteresis loops during cyclic deformation with an increase in strain level is observed (Figure 5b, Inset). The SE loop has a shape close to a symmetrical loop under loading and unloading in the first two cycles up to 2%. With an increase in strain during unloading, nonmonotonicity is observed, associated with the appearance of a stage at which an increase in stresses is observed with a decrease in strain. The value of mechanical hysteresis Δσ increases from 140 to 260 MPa, respectively, at a strain of 0.8% and 3.5%. In Crystals II, the cyclic deformation shows a typical dependence of the shape of the SE curves on the strain level, and no features are observed at the unloading stage. The mechanical hysteresis Δσ increases with strain.
It should be noted that, in Crystals II and III, the stage associated with the stress-induced B2-R transition did not appear in experiments on the study of SE on the σ(ε) curves, in contrast to the SME experiments under stress (Figure 3, Figure 4 and Figure 5).
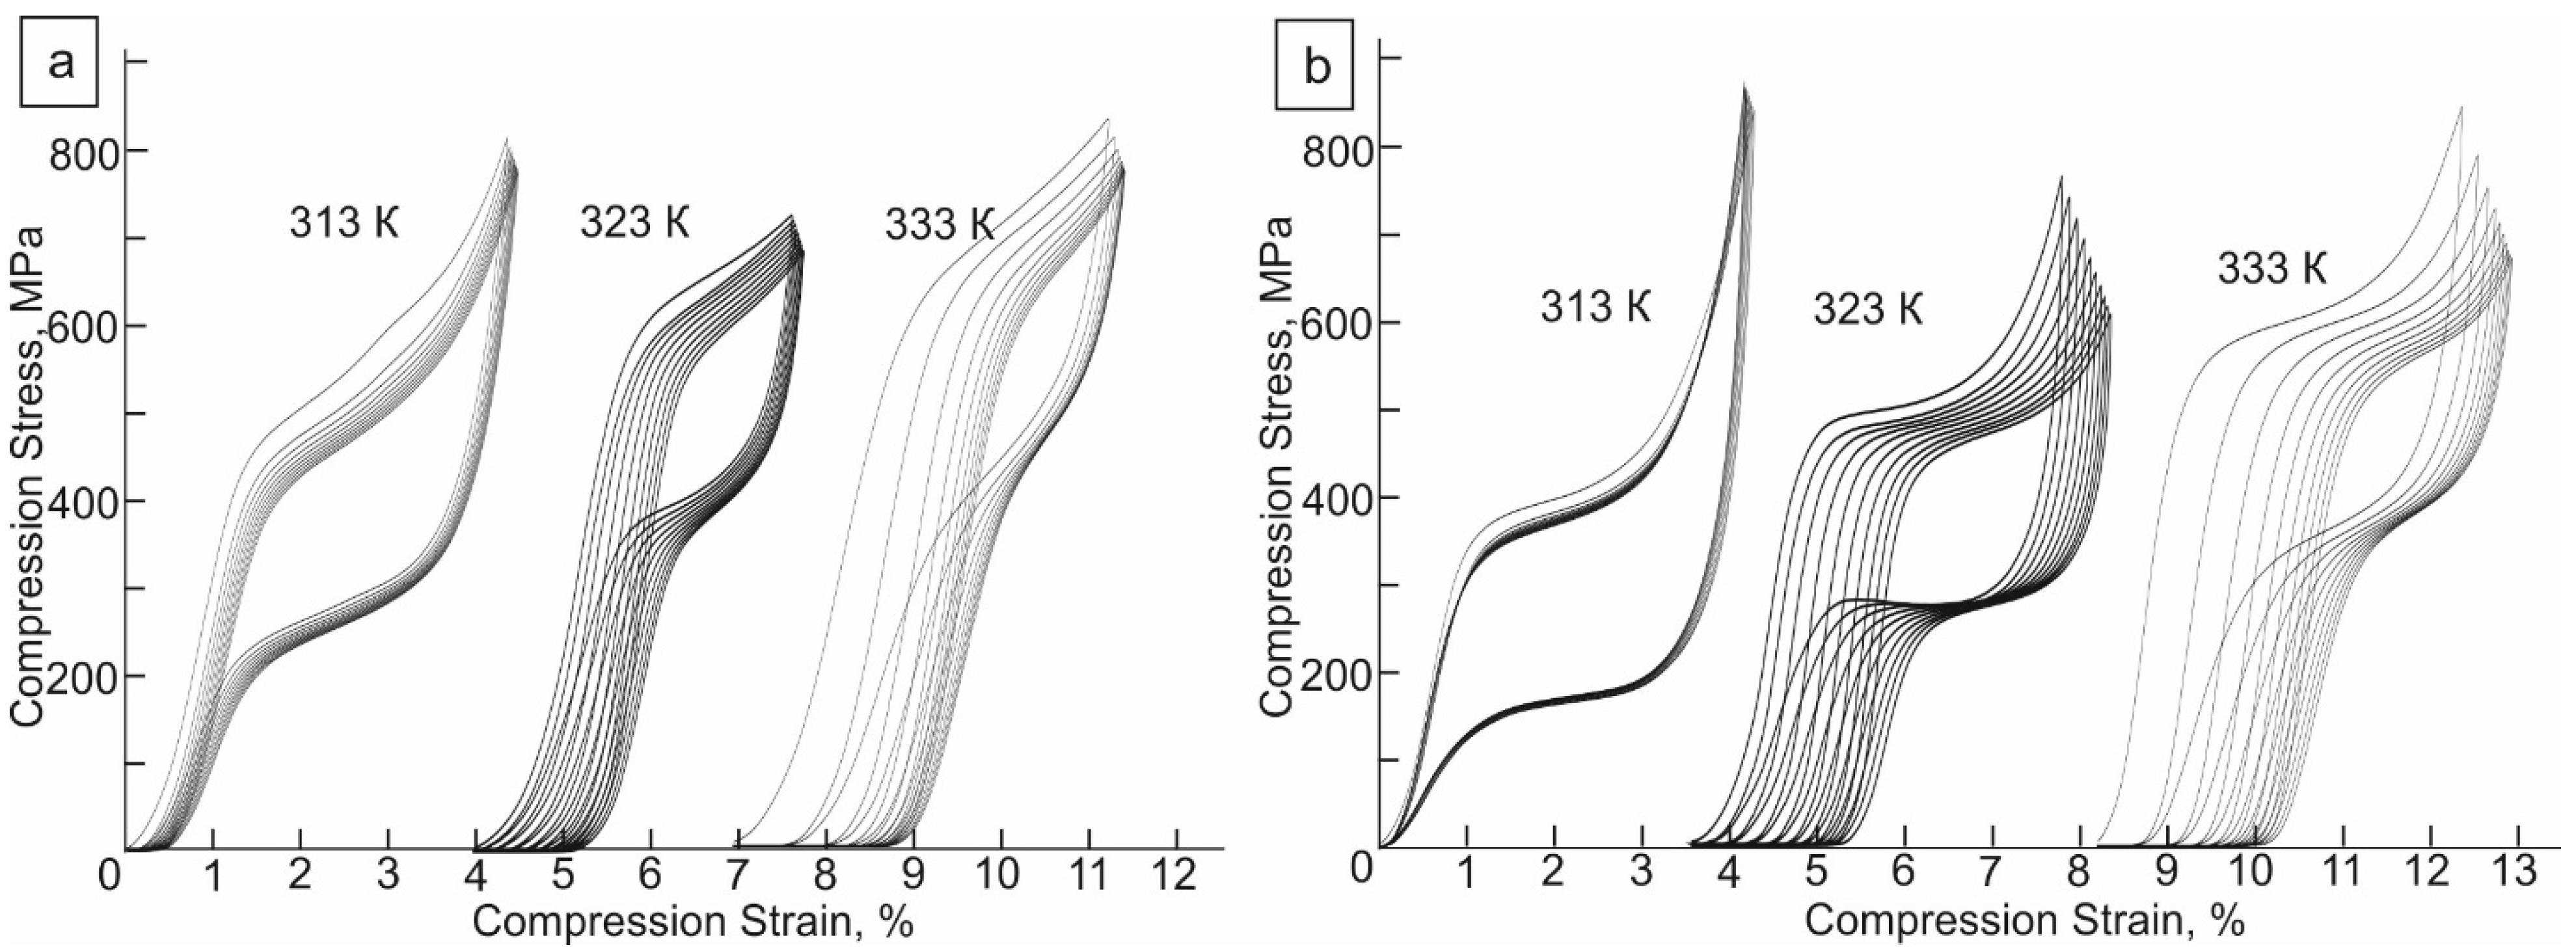
A study of the cyclic stability of superelastic behavior in the temperature range from 313 to 333 K shows that Crystals III demonstrate good stability in repeated load-unloading cycles from n = 1 to n = 10 at 313 K, compared to Crystals II (Figure 6). It can be seen that in Crystals III, the critical stress σcr for the start of B2-B19′ MT decreases by 20 MPa only after the first cycle, and does not change in subsequent cycles. Irreversible strain εirr does not appear with an increase in the number of repeated load-unloading cycles, and mechanical hysteresis Δσ remains constant. With increasing test temperature in Crystals III, as well as in Crystals II in the temperature range from 313 to 333 K, the degradation of the superelastic behavior occurs after the first cycle (Figure 6). At a transformation strain in a cycle of 2–2.5%, up to 10 repeated load-unloading cycles, an irreversible strain is appeared εirr = 0.2%. The εirr is increased to 0.5 and 1% with an increase in the number of cycles and test temperature. In this case, a drop of the stress for the start of the B2-B19′ MT in the next cycle and a decrease in the mechanical hysteresis Δσ are observed.

4. Discussion

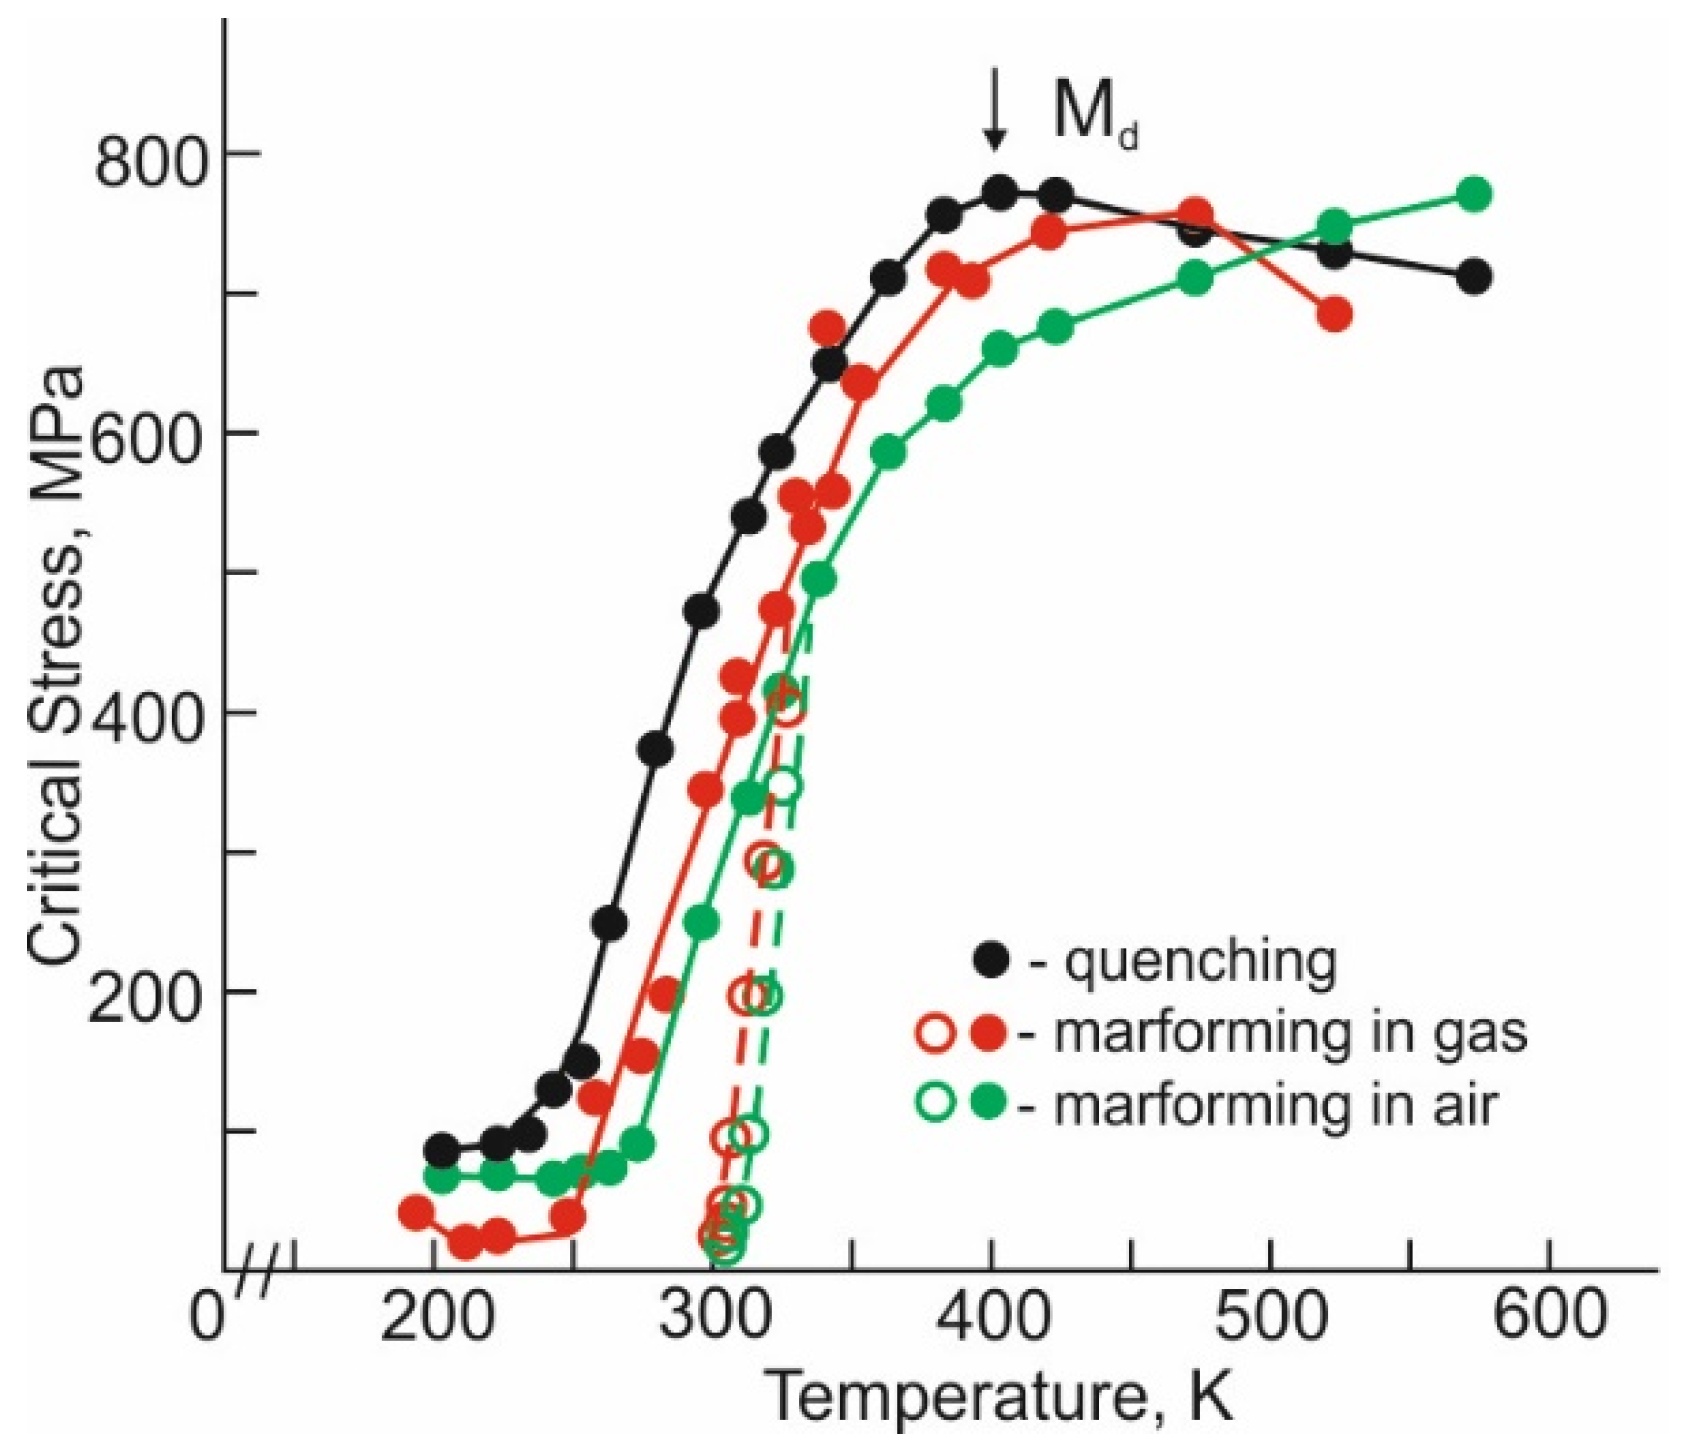
In the [011]-oriented Ti-50.1%Ni crystals, the conditions for SE under compression are achieved in Crystals II and Crystals III, but not in Crystals I. As a rule, SE takes place under condition that the critical stress level of B2-phase σcr(B2) are sufficiently high compare to the critical stresses required for the martensite formation at the Ms temperature σcr(Ms) [1,2,7]. To find of the σcr(B2), we studied the temperature dependence of σcr(T) from 200 to 473 K for Crystals I-III, which is shown in Figure 7. The σcr for the B2-R transition, obtained in SME experiments under stress, are also shown in Figure 7 open circles.
It can be seen that for the studied Crystals I-III, an anomalous temperature dependence σcr(T) is observed, which is characteristic of alloys undergoing the stress-induced MT [1,2] and has three stages. The first stage takes place at low test temperatures from 200 K to the temperature of the minimum stress on the σcr(T) dependence. The minimum stresses on the σcr(T) dependence are observed at the Ms temperature, which coincides with the Ms temperature for the B-B19′ and R-B19′ MTs, determined by the DSC curves, respectively, for Crystals I and Crystals II–III (Figure 1). In this temperature range, the σcr(T) dependence is determined by the temperature dependence of the motion of interphase boundaries and twins in martensite.
The maximum in the σcr(T) dependence corresponds to the Md temperature, at which the stresses required for the stress-induced MT, σcr(SIM), are equal to stresses for the onset of plastic flow of the B2-phase, σcr(B2). The second stage of the σcr(T) dependence from Ms to Md temperature is associated with the formation of stress-induced B19′-martensite, and dσcr(T)/dT in this stage are described by the Clausius-Clapeyron relation (1) [1,2]. In temperature range from Ms to Md in Crystals I-III, the values of α = dσcr(T)/dT ≈ 5.1 MPa/K are practically independent of heat treatment (Figure 7), which is explained by the close values of εtr in these crystals after quenching and marforming and follows from relation (1).
The third stage of the σcr(T) dependence at T > Md is determined by the temperature dependence of the high-temperature B2-phase. It is important to note that the oxide layer in Crystals III leads to the softening effect of the high-temperature B2-phase relative to Crystals II at temperatures above Md (by 100 MPa at T = 425 K and by 45 MPa at T = 475 K) and to a decrease in stresses σcr(SIM) at one test temperature in the temperature range from Ms to Md. The influence of the oxide layer on the MT temperatures and the transformation strain was studied on NiTi polycrystals [19], where it was shown that a change in the temperature and time of annealing in air leads to an increase in the oxide layer from 0.1 to 50 μm. The Ms temperature was increased and the SME was decreased with an rise in the thickness of the oxide layer. An increase in the Ms temperature was associated with the appearance of compressive stresses induced by the oxide layer due to an increase in the molar volume during oxidation. The decrease in the SME value was associated with a growth in the thickness of the oxide layer and with a reduction in the volume fraction fTiNi of TiNi undergoing of the MT [19].
In the present paper, we used the oxidation regime [19,20], which led to the formation of a thin layer of d = 170 nm in thickness. This agrees with the known results given in [20] on the oxidation of TiNi polycrystals. Studies of the SME under stress and SE were shown that the oxide layer of 170 nm thick does not significantly affect the εtr value, which manifests itself in the absence of the dependence of the α = dσcr(T)/dT value in the range from Ms to Md and does not affect the maximum SE value compared with crystals without an oxide layer.
However, at T > Md, the strength properties of the B2-phase turned out to be dependent on the presence of an oxide layer. Thus, in Crystals II in the temperature range from 410 to 475 K, σcr(B2) were higher by 50 MPa on average than in Crystals III at the same deformation in martensite, temperature and annealing time (Figure 7). According to TEM data, the oxidation produces an oxide layer of TiO2 (Rutile), which has a larger molar volume than TiNi (Figure 1) [19,20]. The formation of an oxide layer of TiO2 (Rutile) on the crystal surface leads to the appearance of compressive internal stresses <σ>, which, upon compression, reduce the stresses σcr(B2) for the onset of plastic deformation of the B2-phase in Crystals III relative to Crystals II in temperature range of Md < T < 500 K. Therefore, internal stresses <σ> can be defined as the stress difference between σcr(B2) in Crystals II without an oxide layer and σcrOx(B2) in Crystals III with an oxide layer according to the relation:
<σ> = σcr(B2) − σcrOx(B2)
According to relation (2), the formation of an oxide layer of TiO2 with a thickness of 170 nm leads to the appearance of internal stresses <σ> = 50 MPa on average.
An analysis of the σcr(T) dependences and SE curves of the Crystals II and III shows that at one test temperature, the stresses of the onset of the stress-induced B2-B19′ MT in Crystals III are lower than those in Crystals II. The difference Δσcr= σcrMT (II) − σcrMT (III) is equal to 50 MPa on average and is close in value to <σ>. Therefore, there should be an increase in Ms temperature in Crystals III relative to Crystals II. Using the Clausius-Clapeyron relation (1), it is possible to estimate the change ΔMs:
Δ M s = Δ σ cr α  
Estimation of ΔMs by relation (3) showed that at Δσcr = 50 MPa and α = 5.1 MPa/K the ΔMs = 10 K. This correlates with a shift of the σcr(T) dependence of Crystals III relative to Crystals II to the region of high temperatures on 10–12 K in the temperature range of stress-induced B2-B19′ MT. However, increase in RMs temperature for the B2-R MT in Crystals III relative Crystals II is not observed in SME experiments under stress (Figure 3b,c). Estimation of ΔRMs by relation (3) shows that at Δσcr = 50 MPa and α = dσcr/dT = 17 MPa/K the ΔRMs = 2.9 K, which is observed experimentally (Figure 3b,c and Figure 7, open circles).
Finally, from the analysis of the σcr(T) dependence, εtr(T) and σ(ε) curves, it can be seen that in the SME experiments under stress the B2-R MT is observed at σcr < 350 MPa. SE in Crystals II and III begins at 296 K at σcr ≥ 350 MPa, when there is no B2-R-B19′ MT, and immediately goes B2-B19′ MT. Therefore, in [011]-oriented crystals on compression, the σ(ε) curves do not contain a stage associated with the B2-R transition. In addition, at temperature above 313 K, the σcr for the onset of the stress-induced B2-B19′ MT become close to stresses at which there is a deviation from the linear dependence of σcr(T) (Figure 7). As a result, the B2-B19′ MT under stress develops simultaneously with local plastic deformation in B2-phase. This leads to degradation of the superelastic behavior during cyclic tests. If σcr for stress-induced B2-B19′ MT are low, then there is no local plastic deformation of the B2-phase, and degradation of functional properties does not occur. This was found when studying the cyclic stability of the SME at σex = 100 MPa in Crystals II and III and when studying the cyclic stability of SE at 313K in Crystals III.

5. Conclusions

On the [011]-oriented Ti-50.1Ni (at.%) crystals, the influence of the surface oxide layer on the SME and SE after marforming (deformation in the martensitic state, followed by annealing at 713 K for 0.5 h in an inert helium gas and in dry air) was studied under compression. Based on the results of studies of the SME and SE in the [011]-oriented Ti-50.1Ni (at.%) crystals without and with an oxide layer and their analysis, the following conclusions can be formulated as the main findings:
  • In single-phase [011]-oriented single crystals of the Ti-50.1%Ni alloy during cooling/heating in the free state and under stress, a one-stage B2-B19′ MT is observed with a low temperature hysteresis of 34 K. SME is equal to 3.1%. SE is not observed.
  • Deformation up to 7.7% in the martensitic state at 203 K, followed by annealing at 713 K for 0.5 h in an inert helium gas and in dry air, leads to the development of a two-stage B2-R-B19′ MT and to the appearance of SE in the temperature range from 296 to 333 K. The maximum SE is 4%, and the SME is 2.4 and 2.6% in samples without and with an oxide layer, respectively.
  • Annealing in dry air determines the formation of a thin oxide layer with a thickness of 170 nm, which leads to a decrease in the strength properties of the high-temperature B2-phase and the stresses in temperature range of the stress-induced MT compared to crystals without an oxide layer. These differences are associated with the formation of compressive stresses from the oxide layer.
  • In experiments on the study of SE, an oxide layer of 170 nm thick reduces the transformation hardening coefficient Θ = dσ/dε from 6.5 GPa in crystals without an oxide layer to 2.0 GPa with an oxide layer; does not affect the SE value and SE temperature range ΔTSE = 37 K, but reduces the value of mechanical hysteresis Δσ. In experiments on studying the SME under stress, the oxide layer does not affect the SME value and the temperature ΔTh hysteresis.

Author Contributions

Conceptualization, Y.I.C. and I.V.K.; methodology, Y.I.C. and I.V.K.; validation, I.V.K. and Z.V.P.; formal analysis, Y.I.C. and I.V.K.; investigation, I.V.K., A.A.S., Z.V.P. and A.V.V.; writing—original draft preparation, Y.I.C. and I.V.K.; writing—review and editing, Y.I.C. and I.V.K.; supervision, Y.I.C. and I.V.K.; project administration, I.V.K. All authors have read and agreed to the published version of the manuscript.

Funding

The research was carried out with the support of a grant under the Decree of the Government of the Russian Federation No. 220 of 9 April 2010 (Agreement No. 075-15-2021-612 of 4 June 2021) and by the Tomsk State University Development Programme (Priority-2030). Work was conducted with the application of equipment of the Tomsk Regional Core Shared Research Facilities Centre of National Research Tomsk State University.

Institutional Review Board Statement

Not applicable.

Informed Consent Statement

Not applicable.

Data Availability Statement

Data are available from the corresponding author on reasonable request.

Conflicts of Interest

The authors declare no conflict of interest.

References

  1. Otsuka, K.; Wayman, C.M. Shape Memory Materials; Cambridge University Press: Cambridge, UK, 1998; p. 284. [Google Scholar]
  2. Otsuka, K.; Ren, X. Physical metallurgy of Ti–Ni-based shape memory alloys. Prog. Mater. Sci. 2005, 50, 135–678. [Google Scholar] [CrossRef]
  3. Elahinia, M.; Moghaddam, N.S.; Andani, M.T.; Amerinatanzi, A.; Bimber, B.A.; Hamilton, R.F. Fabrication of NiTi through additive manufacturing. Prog. Mater. Sci. 2016, 83, 630–663. [Google Scholar] [CrossRef] [Green Version]
  4. Moghaddam, N.S.; Saedi, S.; Amerinatanzi, A.; Hinojos, A.; Ramazani, A.; Kundin, J.; Mills, M.J.; Karaca, H.; Elahinia, M. Achieving superelasticity in additively manufactured NiTi in compression without post-process heat treatment. Sci. Rep. 2019, 9, 41. [Google Scholar] [CrossRef] [PubMed] [Green Version]
  5. Gall, K.; Sehitoglu, H.; Chumlyakov, Y.I.; Kireeva, I.V. Tension–compression asymmetry of the stress–strain response in aged single crystal and polycrystalline TiNi. Acta Mater. 1999, 47, 1203–1217. [Google Scholar] [CrossRef]
  6. Choi, W.S.; Pang, E.L.; Ko, W.-S.; Jun, H.; Bong, H.J.; Kirchlechner, C.; Raabe, D.; Choi, P.-P. Orientation-dependent plastic deformation mechanisms and competition with stress-induced phase transformation in microscale NiTi. Acta Mater. 2021, 208, 116731. [Google Scholar] [CrossRef]
  7. Chumlyakov, Y.I.; Kireeva, I.V.; Vyrodova, A.V.; Saraeva, A.A.; Pobedennaya, Z.V. Effect of marforming on superelasticity and shape memory effect of [001]-oriented Ni50.3Ti49.7 alloy single crystals under compression. J. Alloy. Compd. 2021, 896, 162841. [Google Scholar] [CrossRef]
  8. Hornbogen, E.; Mertinger, V.; Wurzel, D. Microstructure and tensile properties of two binary NiTi-alloys. Scr. Mater. 2001, 44, 171–178. [Google Scholar] [CrossRef]
  9. Kireeva, I.V.; Chumlyakov, Y.I.; Vyrodova, A.V.; Pobedennaya, Z.; Marchenko, E.S. Investigation of the orientation dependence of marforming on superelasticity and shape memory effect in equiatomic TiNi single crystals under compression. Mater. Lett. 2022, 324, 132817. [Google Scholar] [CrossRef]
  10. Liang, Q.; Zhao, S.; Liang, C.; Zhao, T.; Wang, D.; Ding, X.; Li, S.; Wang, Y.; Zheng, Y.; Ren, X.; et al. Strain states and unique properties in cold-rolled TiNi shape memory alloys. Acta Mater. 2022, 231, 117890. [Google Scholar] [CrossRef]
  11. Lu, B.; Gui, X.; Liu, E.; Feng, X.; Dong, M.; Li, Y.; Wang, H.; Jin, G. Influence of microstructure on phase transformation behavior and mechanical properties of plasma arc deposited shape memory alloy. Mater. Sci. Eng. A 2018, 736, 130–136. [Google Scholar] [CrossRef]
  12. Dubinskiy, S.; Prokoshkin, S.; Sheremetyev, V.; Konopatsky, A.; Korotitskiy, A.; Tabachkova, N.; Blinova, E.; Glezer, A.; Brailovski, V. The mechanisms of stress-induced transformation in ultimately fine-grained titanium nickelide, and critical grain size for this transformation. J. Alloy. Compd. 2021, 858, 157733. [Google Scholar] [CrossRef]
  13. Jenko, M.; Godec, M.; Kocijan, A.; Rudolf, R.; Dolinar, D.; Ovsenik, M.; Gorenšek, M.; Zaplotnik, R.; Mozetic, M. A new route to biocompatible Nitinol based on a rapid treatment with H2/O2 gaseous plasma. Appl. Surf. Sci. 2019, 473, 976–984. [Google Scholar] [CrossRef]
  14. Shabalovskaya, S.; Anderegg, J.; Humbeeck, J.V. Critical overview of Nitinol surfaces and their modifications for medical applications. Acta Biomater. 2008, 4, 447–467. [Google Scholar] [CrossRef] [PubMed]
  15. Barison, S.; Cattarin, S.; Daolio, S.; Musiani, M.; Tuissi, A. Characterisation of surface oxidation of nickel–titanium alloy by ion-beam and electrochemical techniques. Electrochim. Acta 2004, 50, 11–18. [Google Scholar] [CrossRef]
  16. Firstov, G.S.; Vitchev, R.G.; Kumar, H.; Blanpain, B.; Van Humbeeck, J. Surface oxidation of NiTi shape memory alloy. Biomaterials 2002, 23, 4863–4871. [Google Scholar] [CrossRef]
  17. Chu, C.L.; Wu, S.K.; Yen, Y.C. Oxidation behavior of equiatomic TiNi alloy in high temperature air environment. Mater. Sci. Eng. A 1996, 216, 193–200. [Google Scholar] [CrossRef]
  18. Neelakantan, L.; Swaminathan, S.; Spiegel, M.; Eggeler, G.; Hassel, A.W. Selective surface oxidation and nitridation of NiTi shape memory alloys by reduction annealing. Corros. Sci. 2009, 51, 635–641. [Google Scholar] [CrossRef]
  19. Nam, T.-H.; Chung, D.-W.; Lee, H.-W.; Kim, J.-H.; Choi, M.-S. Effect of the surface oxide layer on transformation behavior and shape memory characteristics of Ti-Ni and Ti-Ni-Mo alloys. J. Mater. Sci. 2003, 38, 1333–1338. [Google Scholar] [CrossRef]
  20. Ng, C.W.; Mahmud, A.S.; Ahmad, M.N.; Razali, M.F.; Liu, Y. Estimation of titanium oxide layer thickness on thermally oxidized NiTi alloy based on color variations. Mater. Werkst. 2022, 53, 47–55. [Google Scholar] [CrossRef]
  21. Buchheit, T.E.; Wert, J.A. Modeling the effects of stress state and crystal orientation on the stress-induced transformation of NiTi single crystals. Met. Mater. Trans. A 1994, 25, 2383–2389. [Google Scholar] [CrossRef]
  22. Kaya, I.; Karaca, H.; Souri, M.; Chumlyakov, Y.; Kurkcu, H. Effects of orientation on the shape memory behavior of Ni 51 Ti 49 single crystals. Mater. Sci. Eng. A 2017, 686, 73–81. [Google Scholar] [CrossRef]
  23. Wayman, C.M.; Tong, H. On the equilibrium temperature in thermoelastic martensitic transformations. Scr. Met. 1977, 11, 3341–3343. [Google Scholar] [CrossRef]
  24. Tong, H.; Wayman, C.M. Thermodynamics of thermoelastic martensitiC transformations. Acta Met. 1975, 23, 209–215. [Google Scholar] [CrossRef]
  25. Funakubo, H. Shape Memory Alloys; Gordon and Breach Science Publishers: New York, NY, USA, 1987; 276p, [translated from the Japanese by J.B. Kennedy]. [Google Scholar]
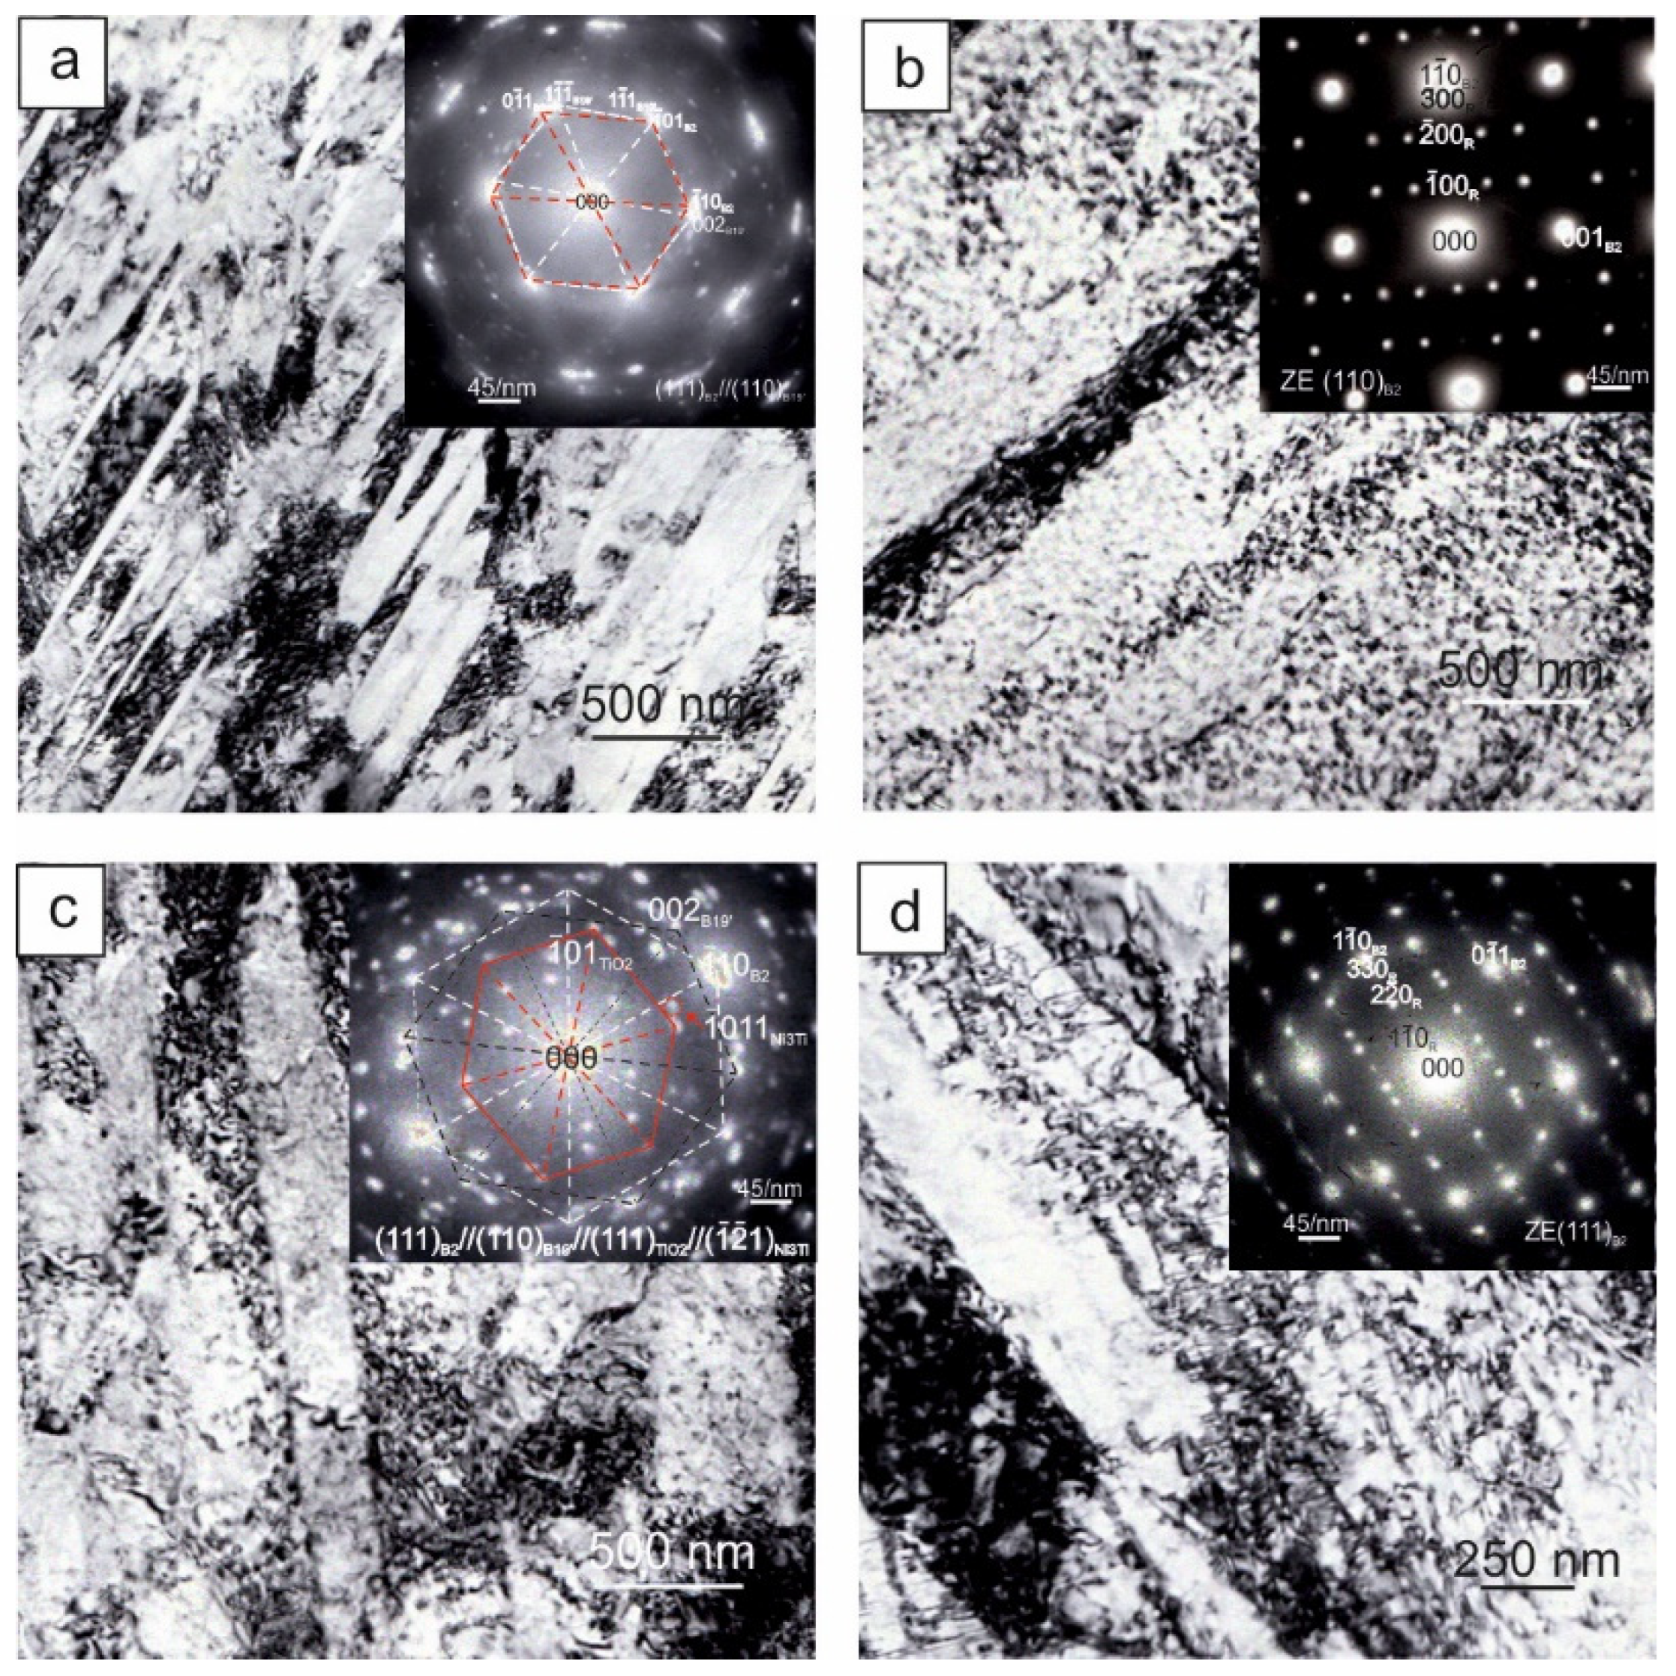
Figure 1. TEM images of microstructure of residual strain in the [011]-oriented Ti-50.1Ni single crystals after marforming at room temperature: (a,b) after annealing at 713 K for 0.5 h in helium gas; (c,d) after annealing at 713 K for 0.5 h in dry air.
Metals 12 01932 g001
Figure 2. DSC curves of the [011]-oriented Ti-50.1Ni single crystals: (a) after quenching; (b) after annealing at 713 K for 0.5 h in helium gas; (c) after annealing at 713 K for 0.5 h in dry air.
Metals 12 01932 g002
Figure 3. Change in the magnitude of the shape memory effect with increasing compressive stresses of the [011]-oriented Ti-50.1Ni single crystals: (a)—quenching; (b)—annealing at 713 K for 0.5 h in helium gas; (c)—annealing at 713 K for 0.5 h in dry air.
Metals 12 01932 g003
Figure 4. Cyclic stability of SME under compressive stress 100 MPa at the number of repeating cycles from 1 to 100 of the [011]-oriented Ti-50.1Ni single crystals: (a)—quenching; (b)—annealing at 713 K for 0.5 h in helium gas; (c)—annealing at 713 K for 0.5 h in dry air.
Metals 12 01932 g004
Figure 5. Temperature range of superelastisity in the compressive-tested [011]-oriented Ti-50.1Ni single crystals: (a)—after annealing at 713 K for 0.5 h in helium gas; (b)—after annealing at 713 K for 0.5 h in dry air.
Metals 12 01932 g005
Figure 6. Superelastic cycles (n = 10) of [011]-oriented Ti-50.1Ni single crystals: (a)—annealing at 713 K for 0.5 h in helium gas; (b)—annealing at 713 K for 0.5 h in dry air.
Metals 12 01932 g006
Figure 7. Temperature dependence of critical stresses of the [011]-oriented Ti-50.1Ni single crystals under compression. The open circles represent data from the SME studies.
Metals 12 01932 g007
Publisher’s Note: MDPI stays neutral with regard to jurisdictional claims in published maps and institutional affiliations.