

Effect of Al Content on the Microstructural and Grain Growth Kinetics of Magnesium Alloys
Abstract
:1. Introduction
2. Experiment
3. Results and Discussion
3.1. Influence of Al Content on Grain Growth
3.1.1. The Hot-Extruded State
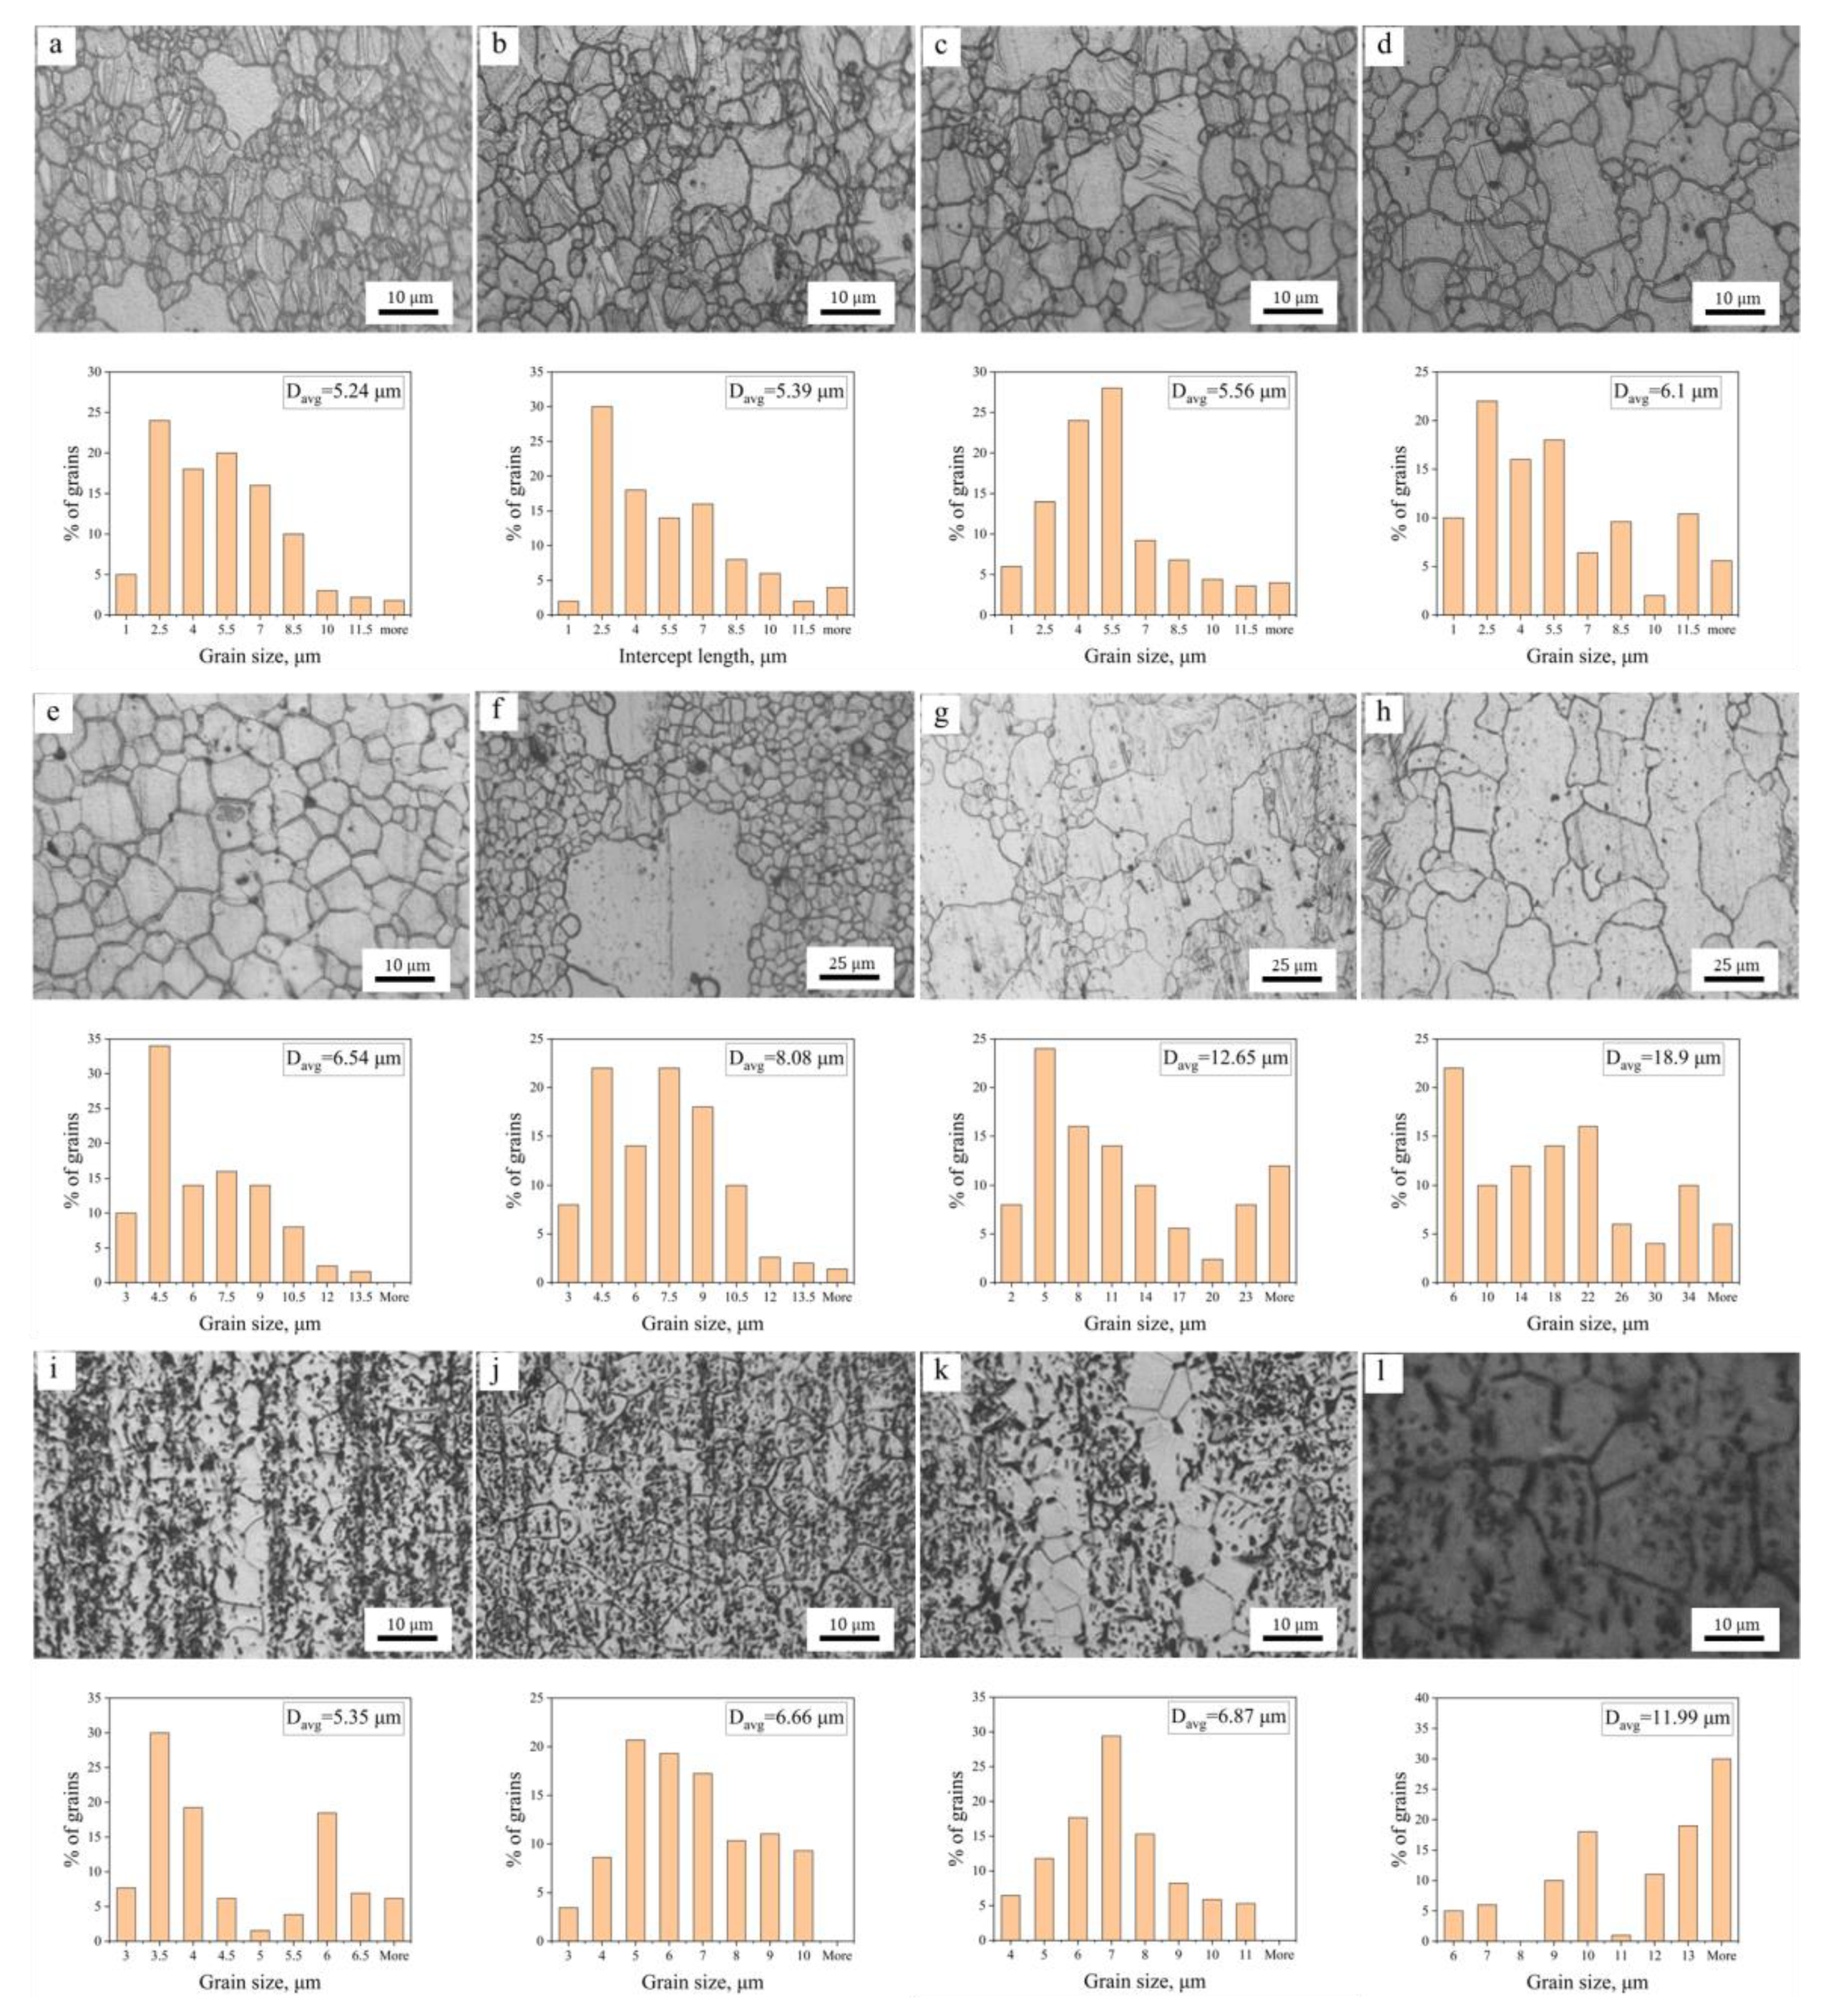
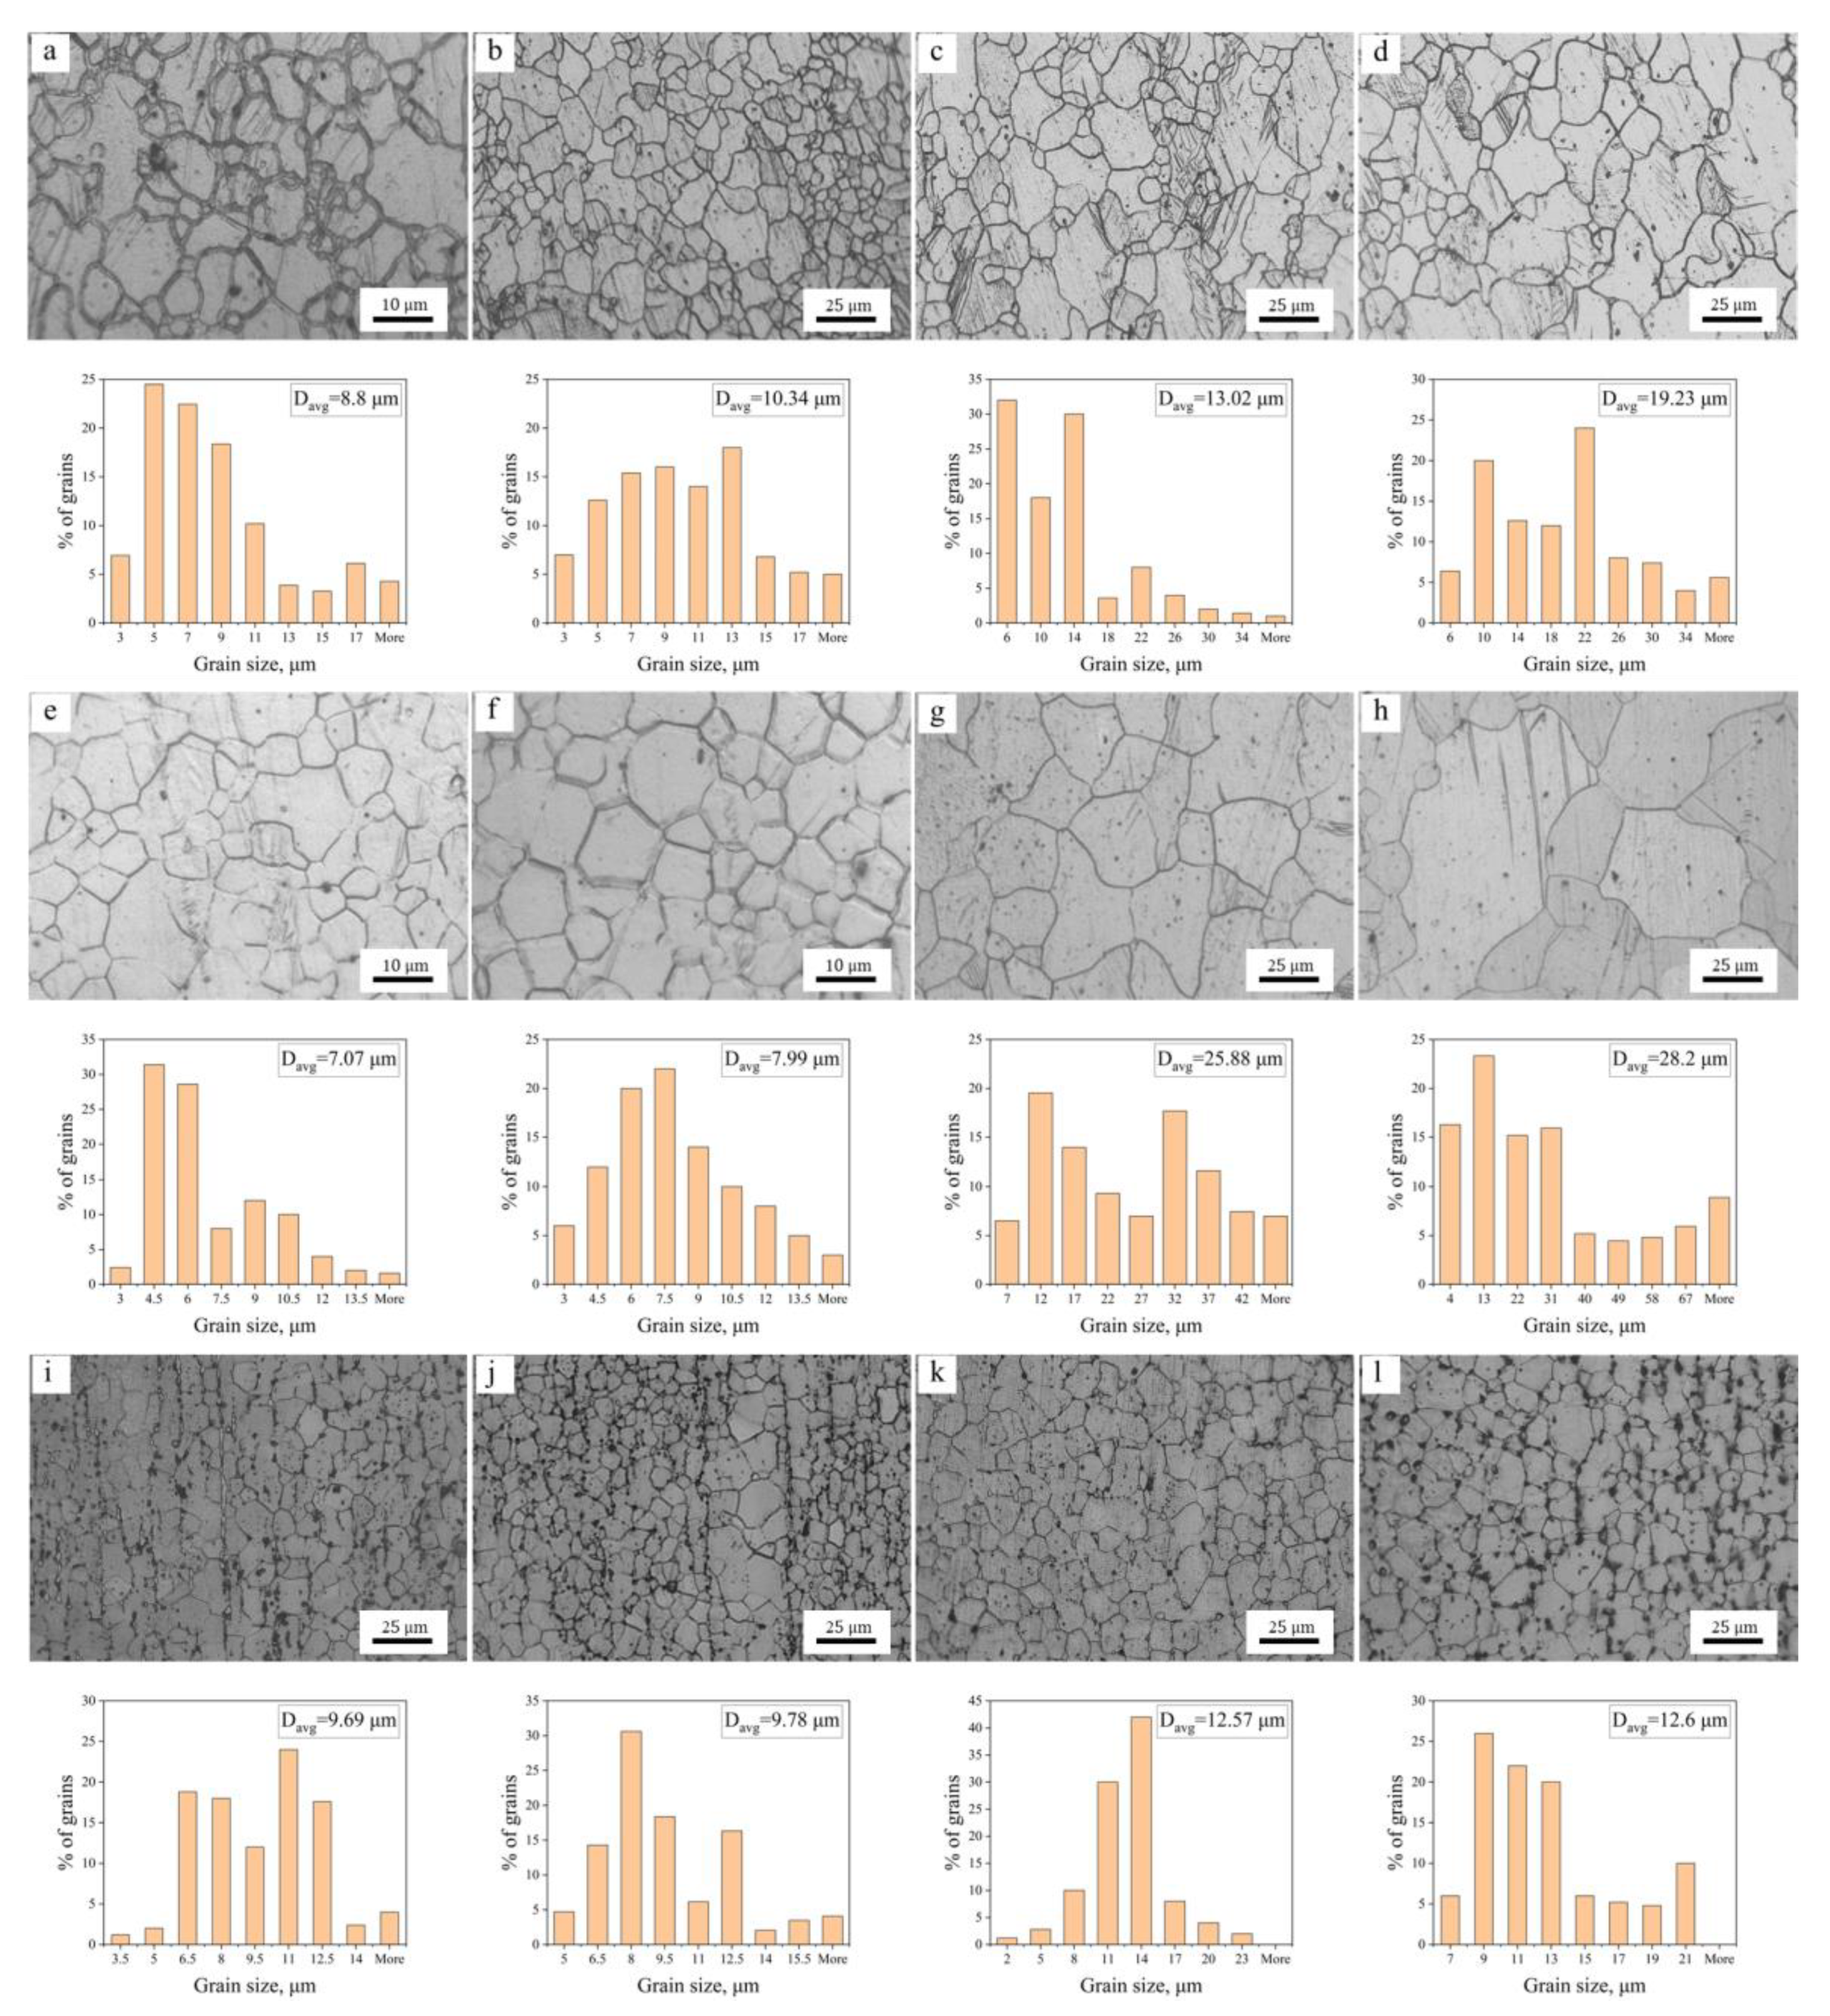
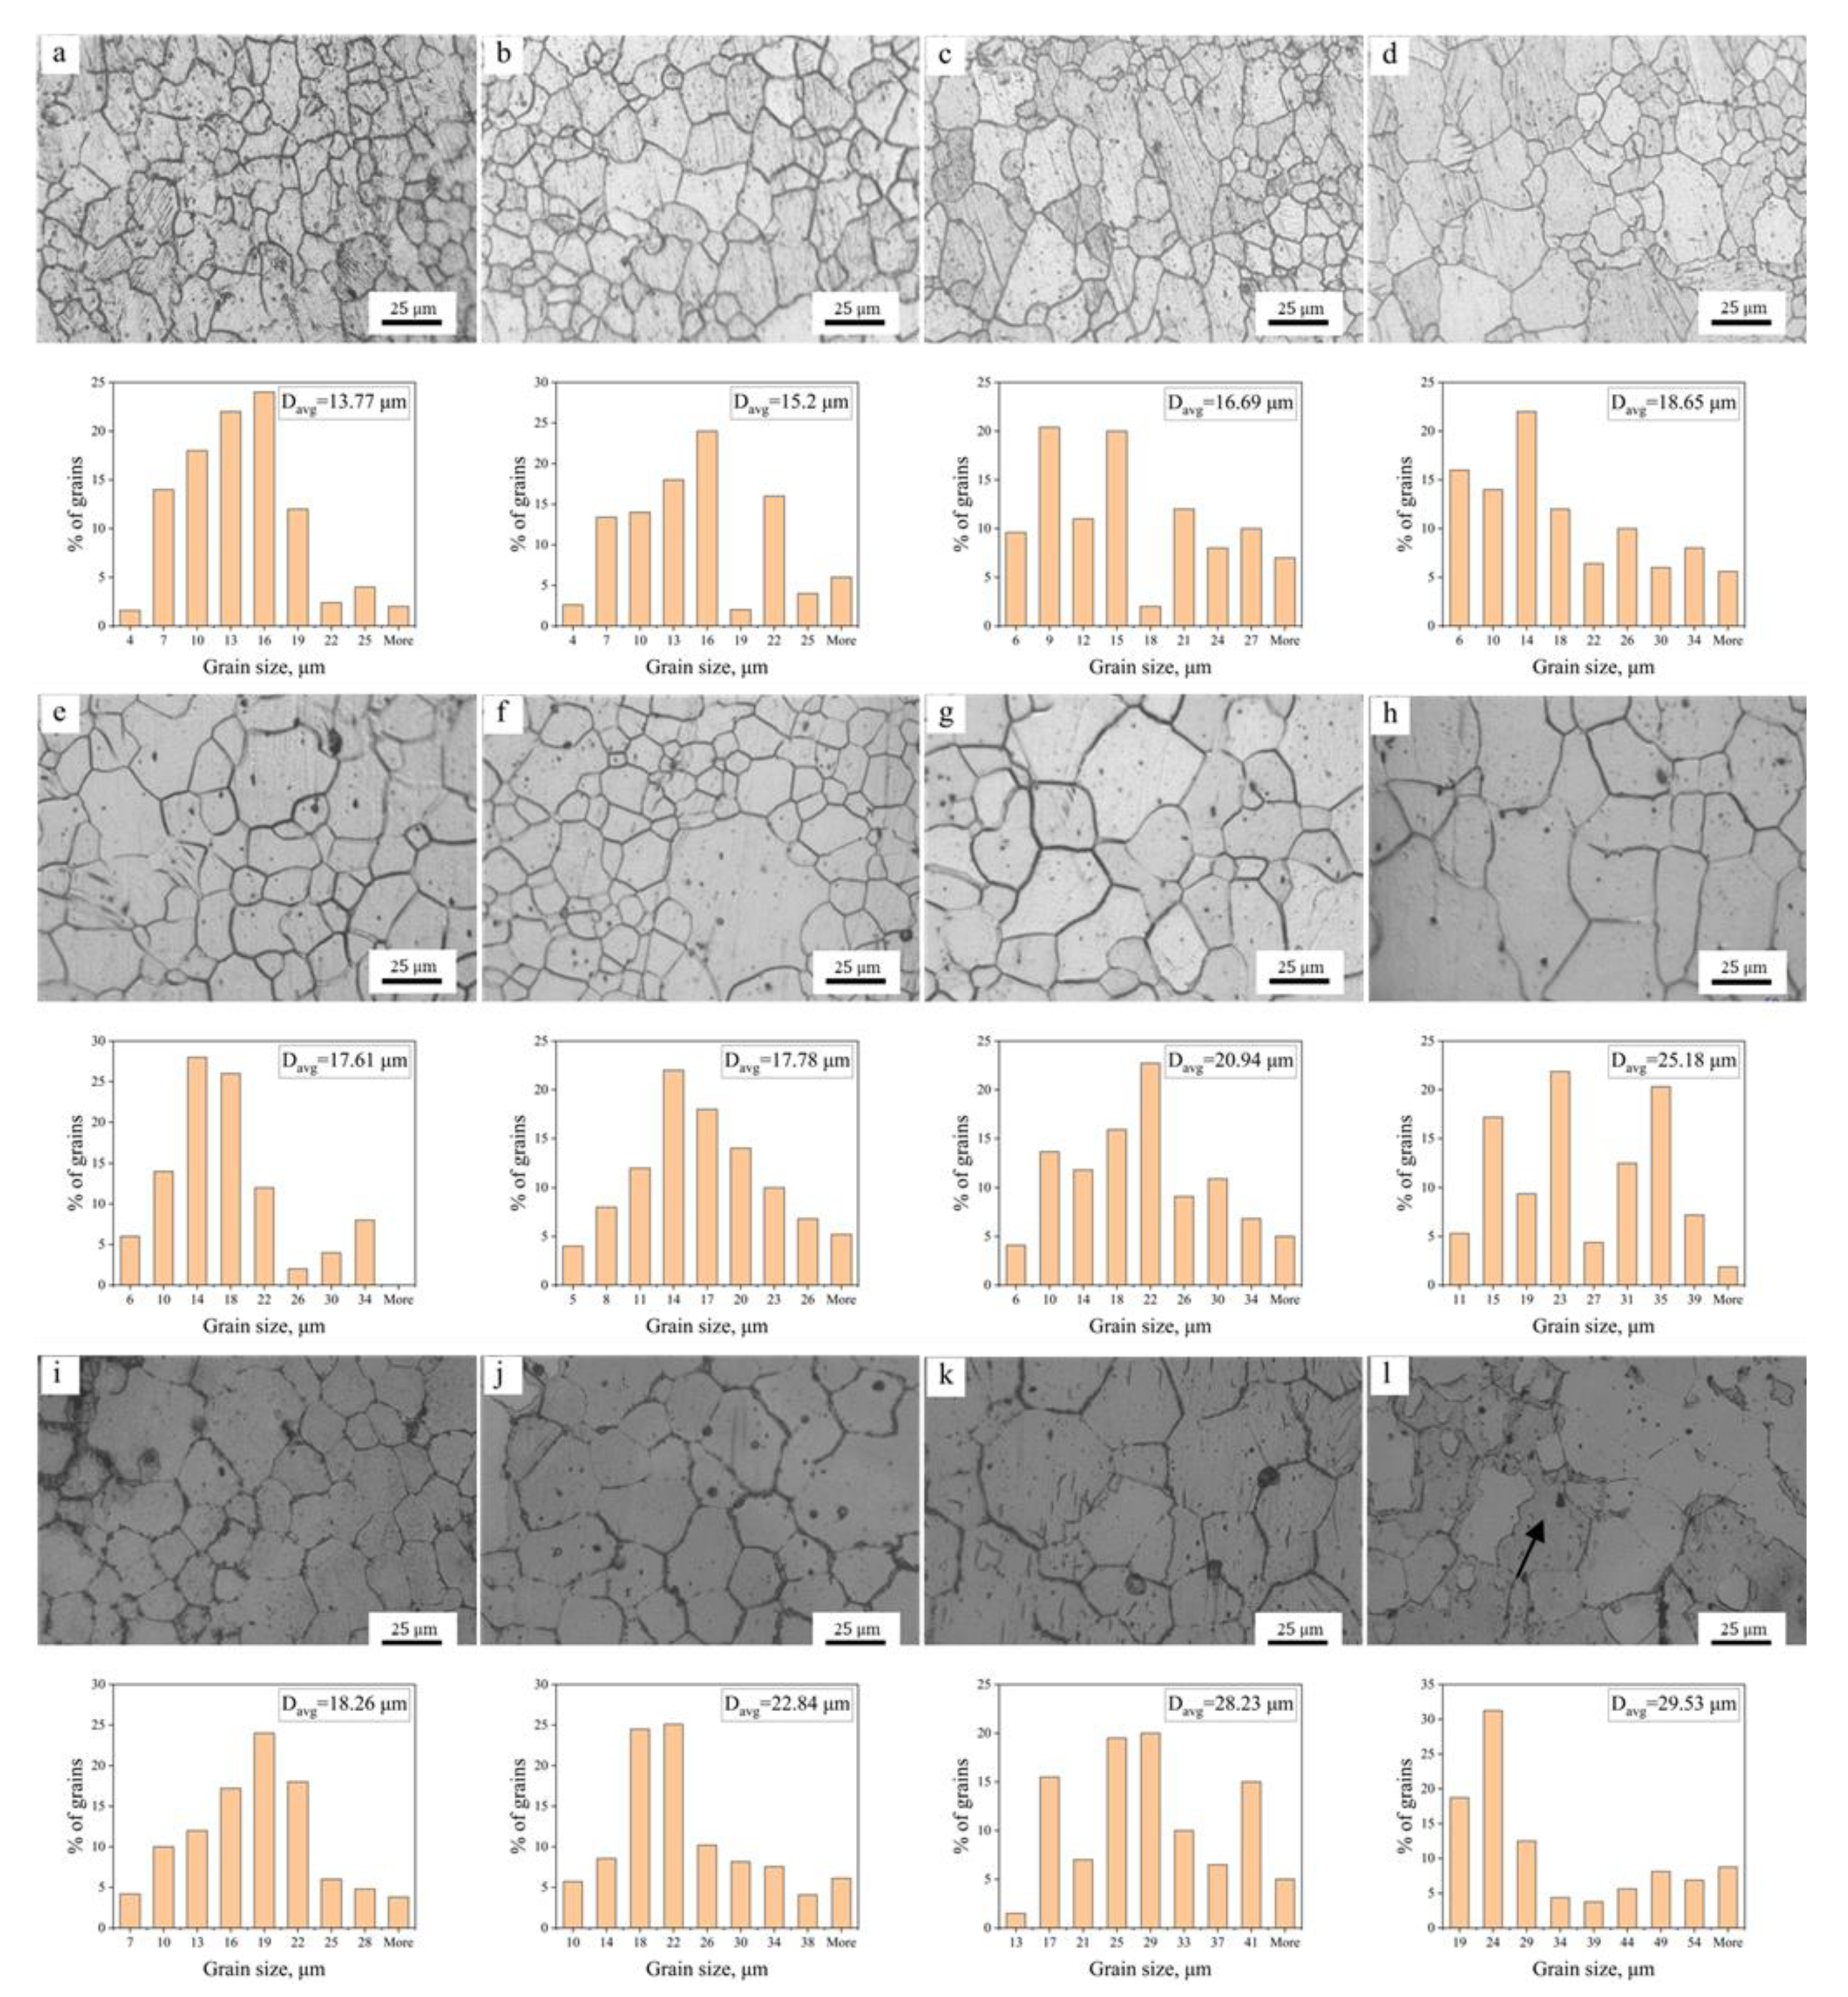
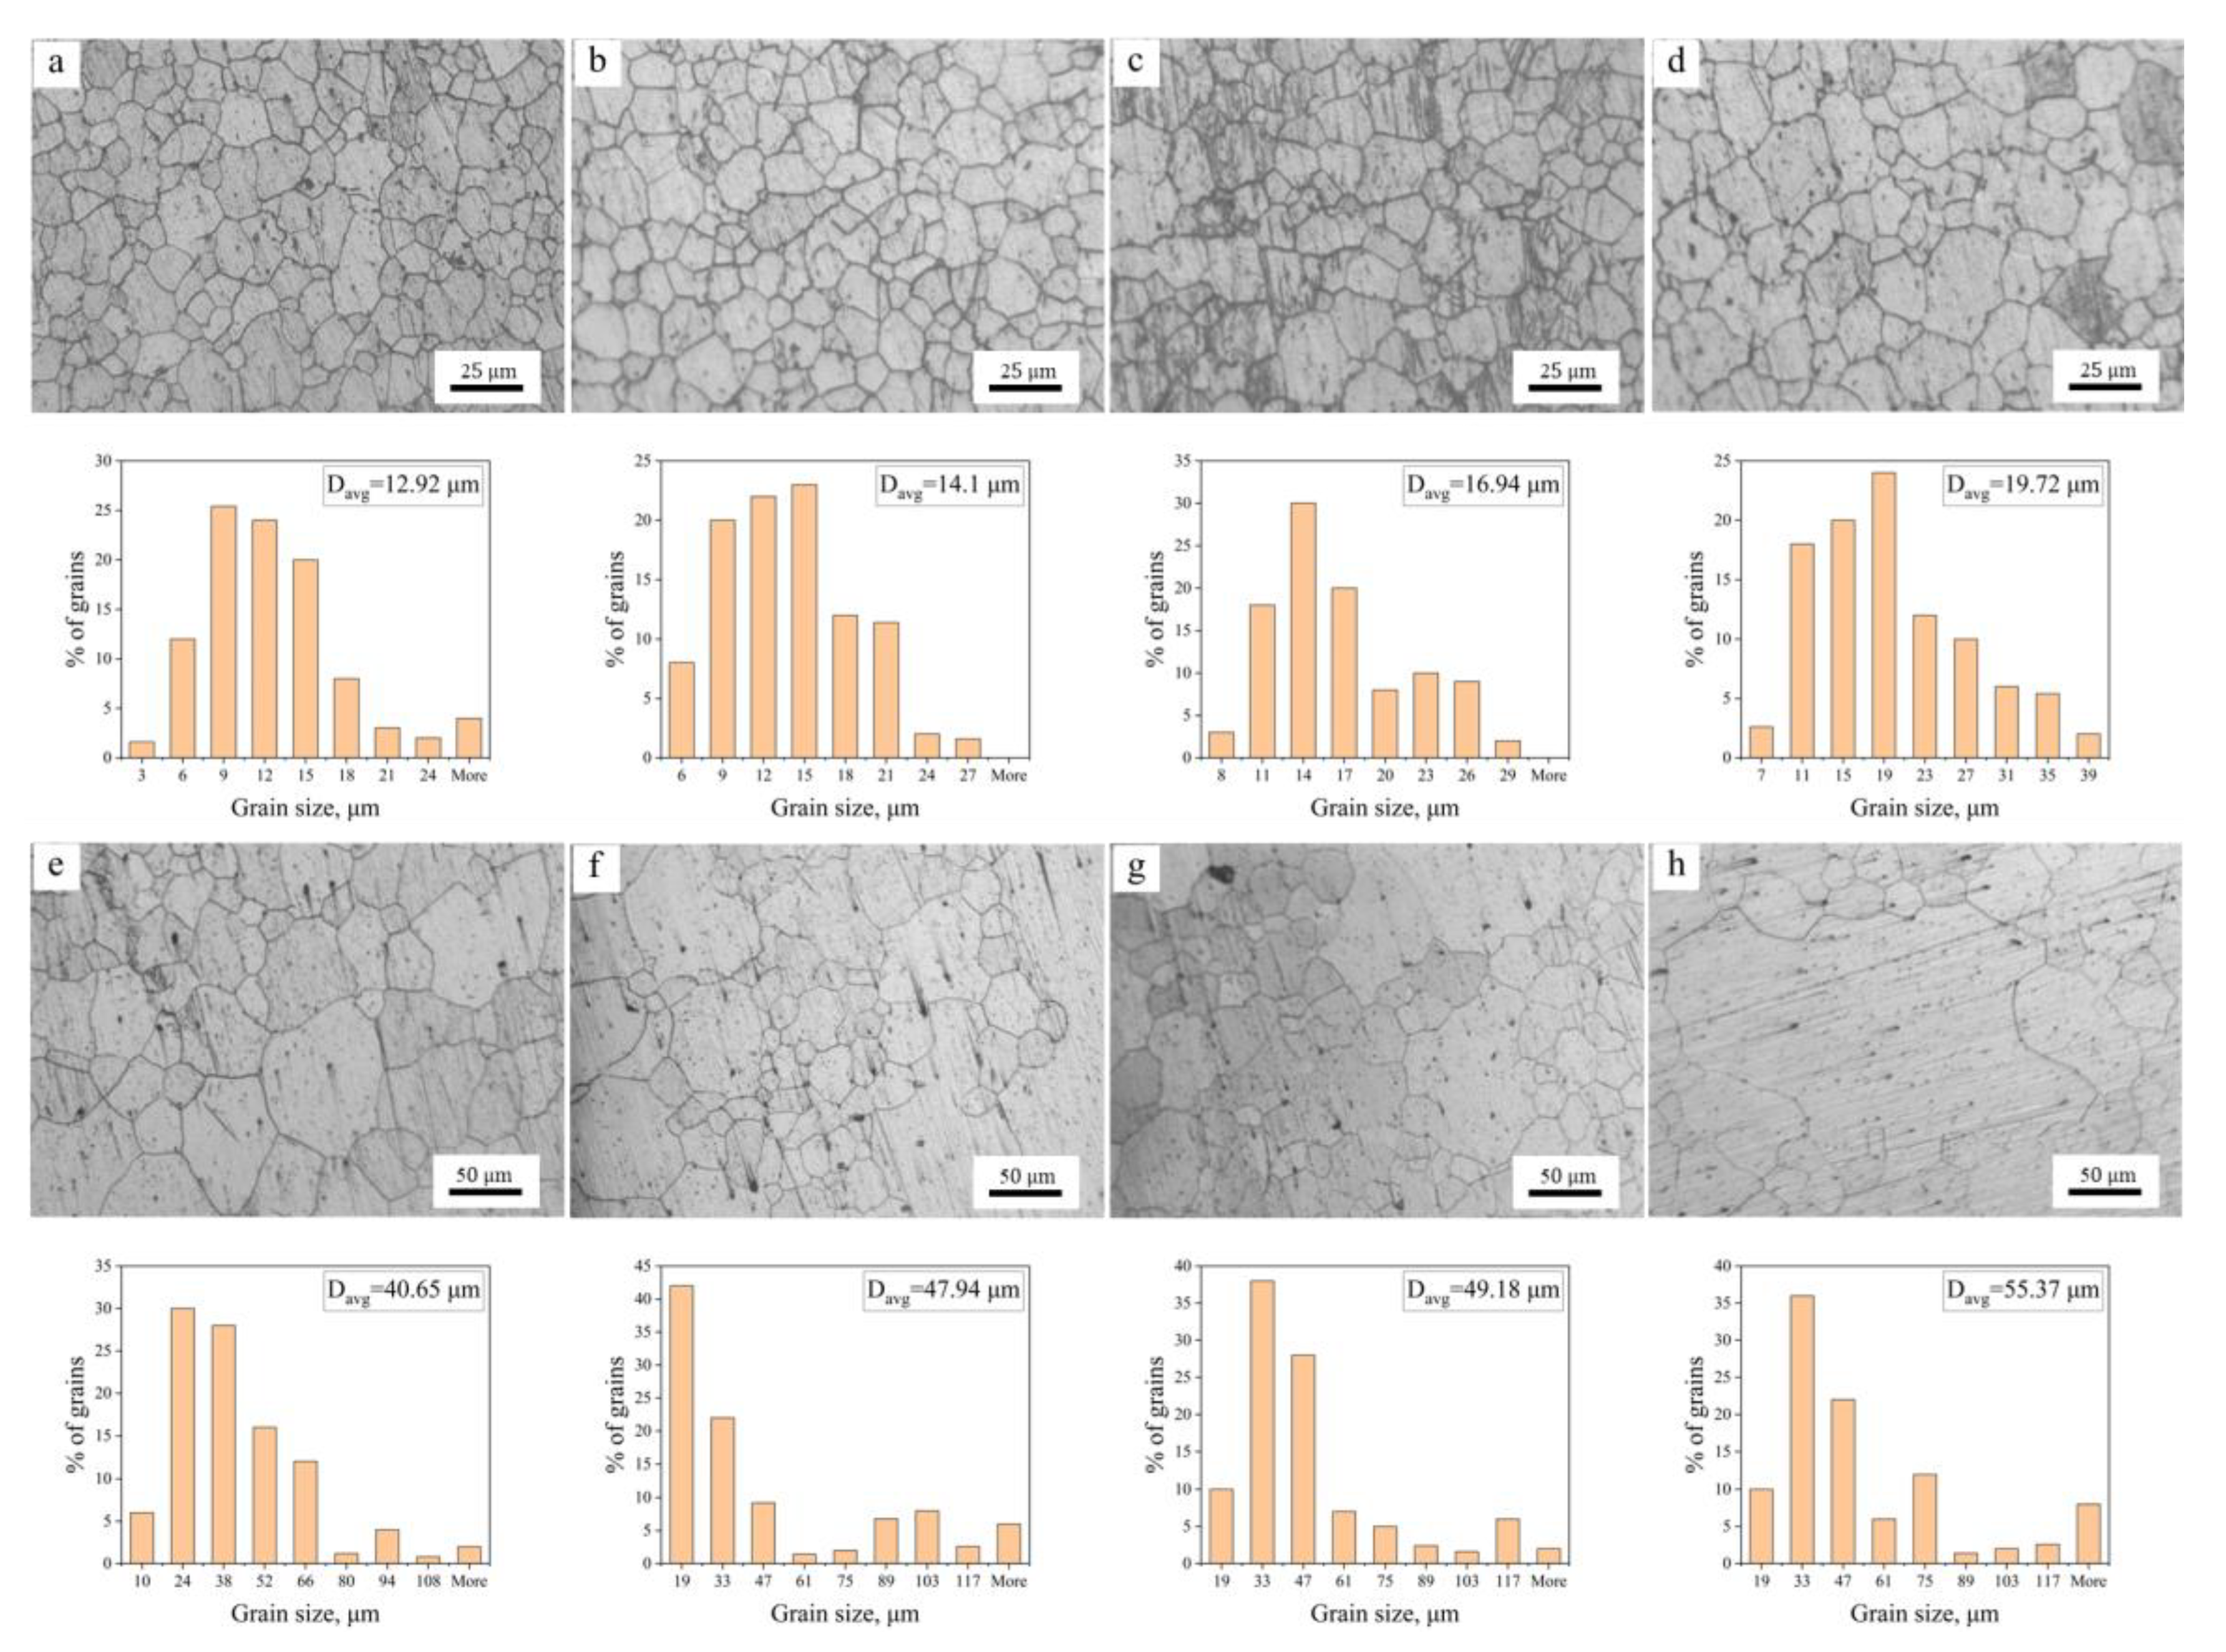
3.1.2. Microstructure Evolution during Annealing
3.2. Grain Growth Kinetics
3.3. Deviation of Grain Growth Exponent n
3.4. Second Phase and Solute Effects Influences Grain Growth
3.4.1. Effects of the Al-Rich Second Phase
3.4.2. Effects of Solute Al
3.5. Texture Selection and Oriented Preferential Growth
3.6. Mechanical Properties
4. Conclusions
- (1)
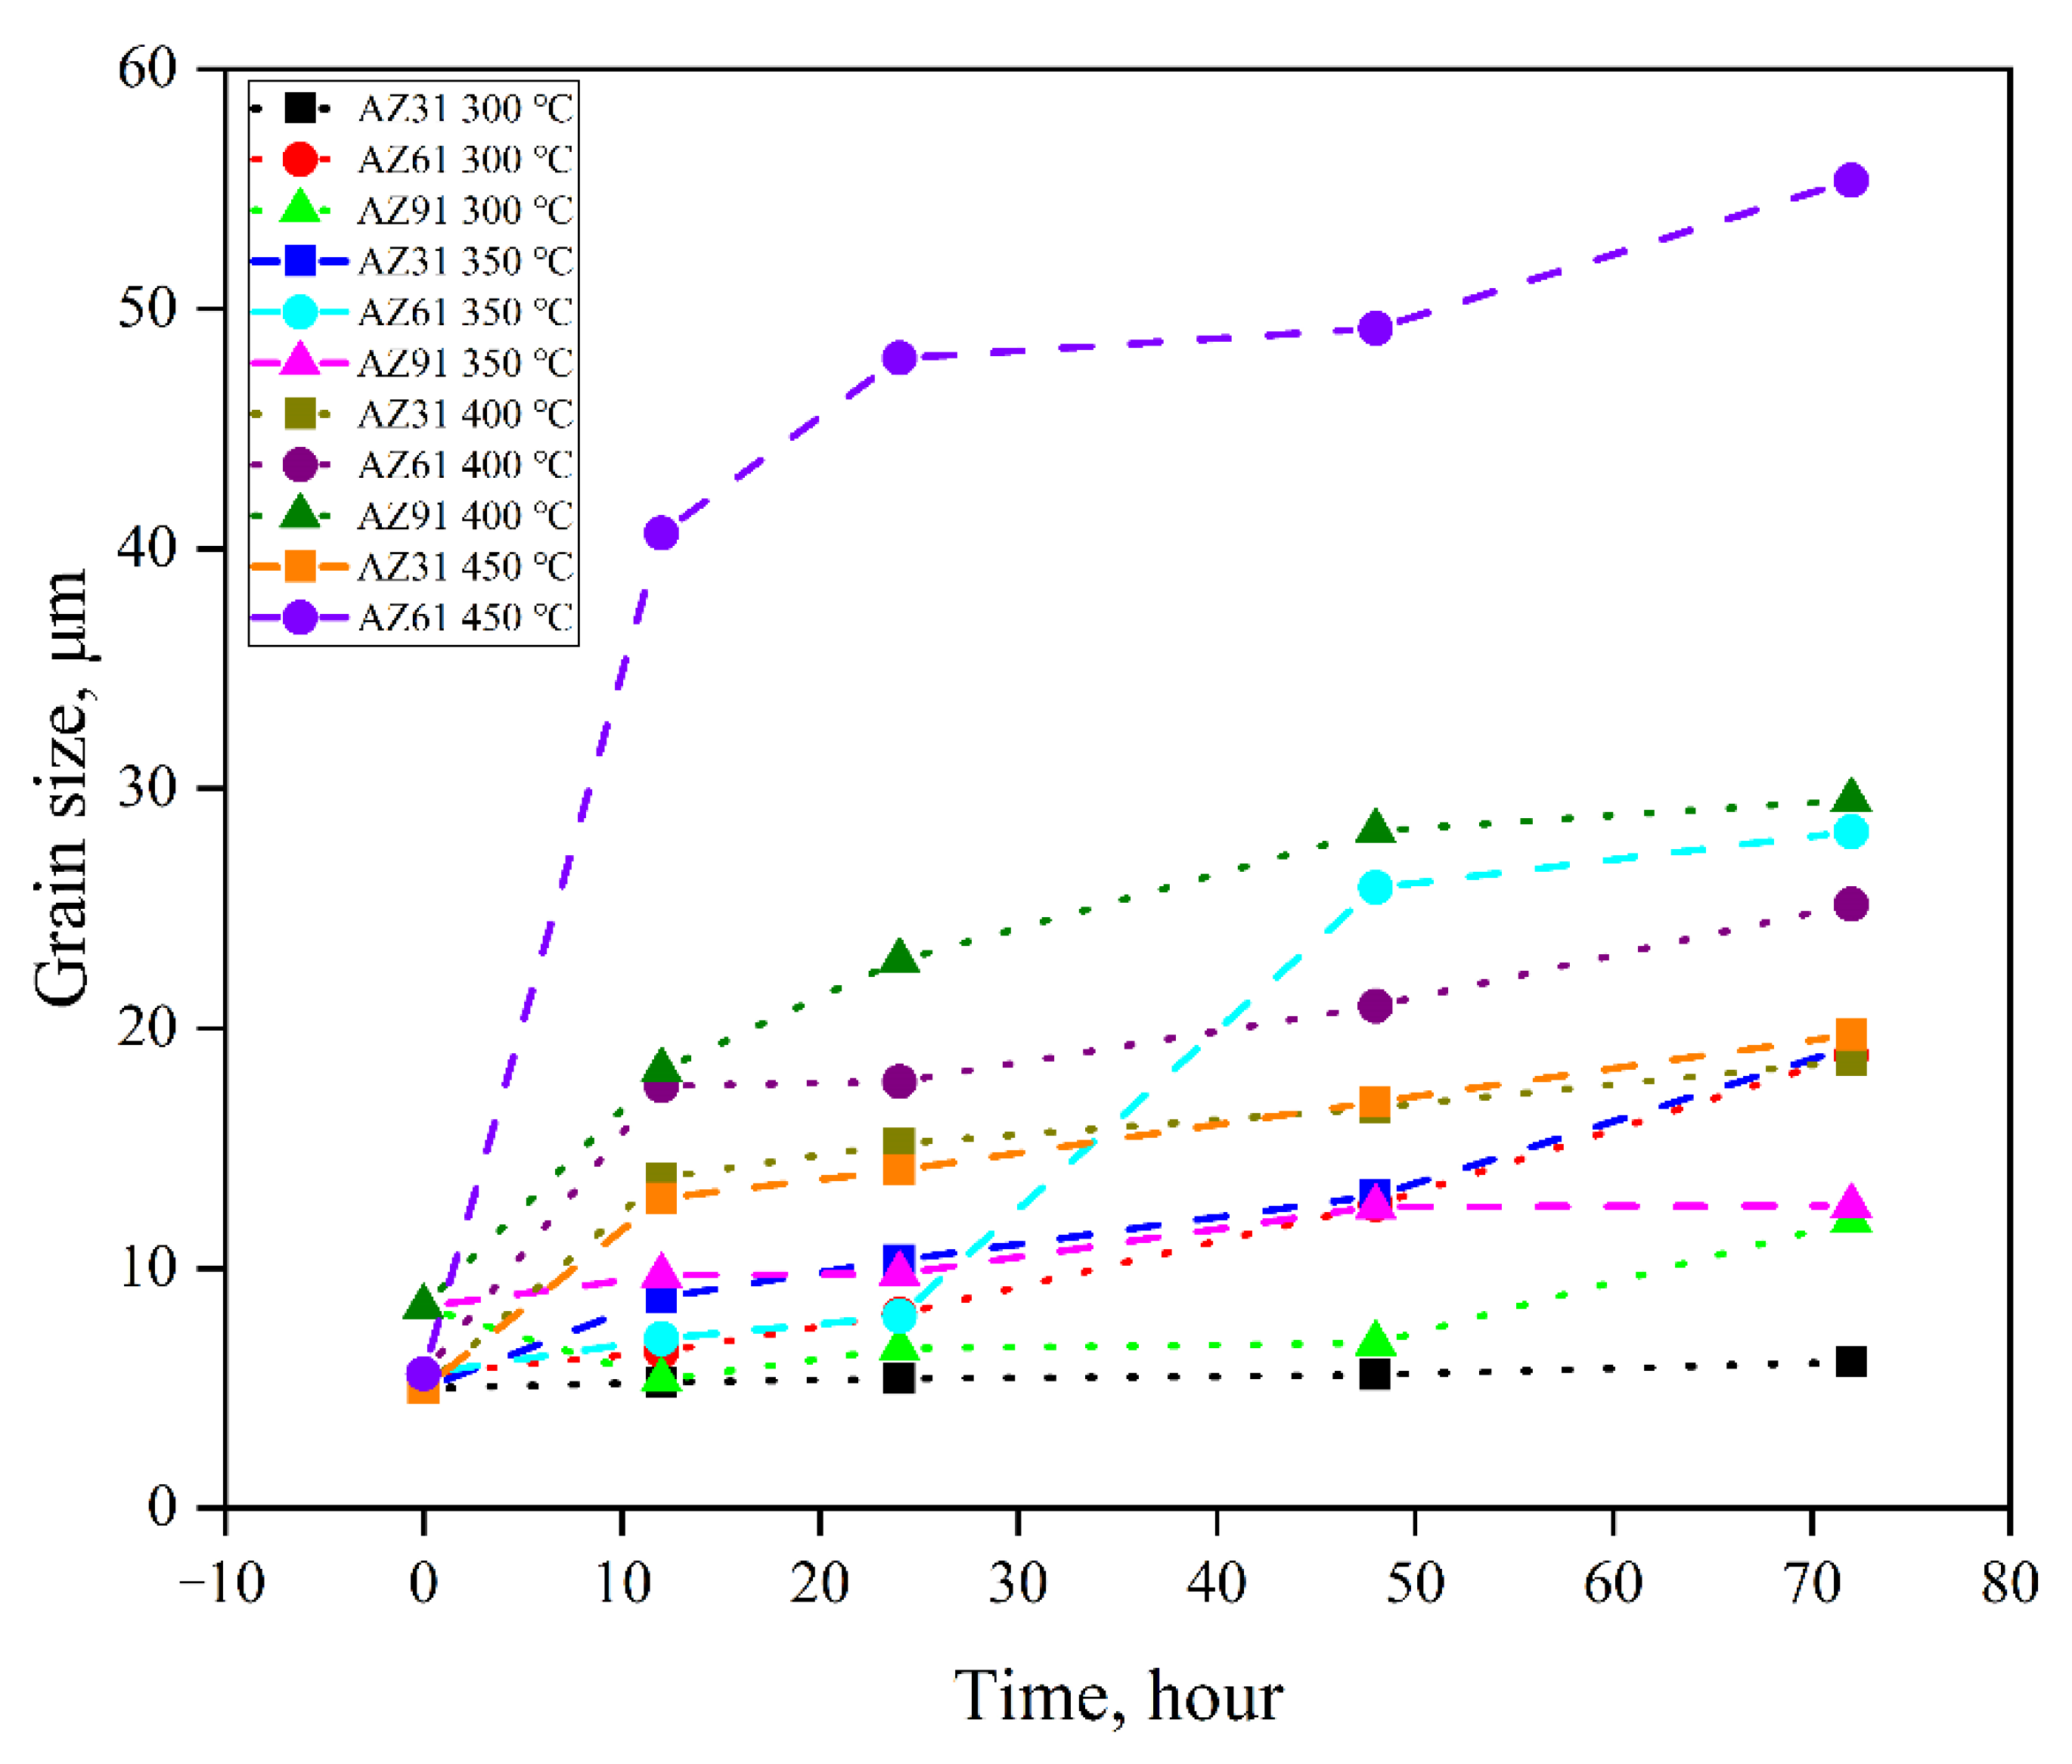
- The average grain size of hot extruded Mg–xAl–1Zn (x = 3, 6, 9) alloys increases with an increasing annealing temperature and holding time under isothermal annealing treatment. The growth rate of AZ61 is greater than that of AZ31 and AZ91, which is attributed to the fact that AZ31 has a large number of recrystallized grains at all annealing conditions, which significantly reduces the growth rate of grains. The AZ91 obtains the lowest growth rate by the pinning of the second phase and dragging of the solute.
- (2)
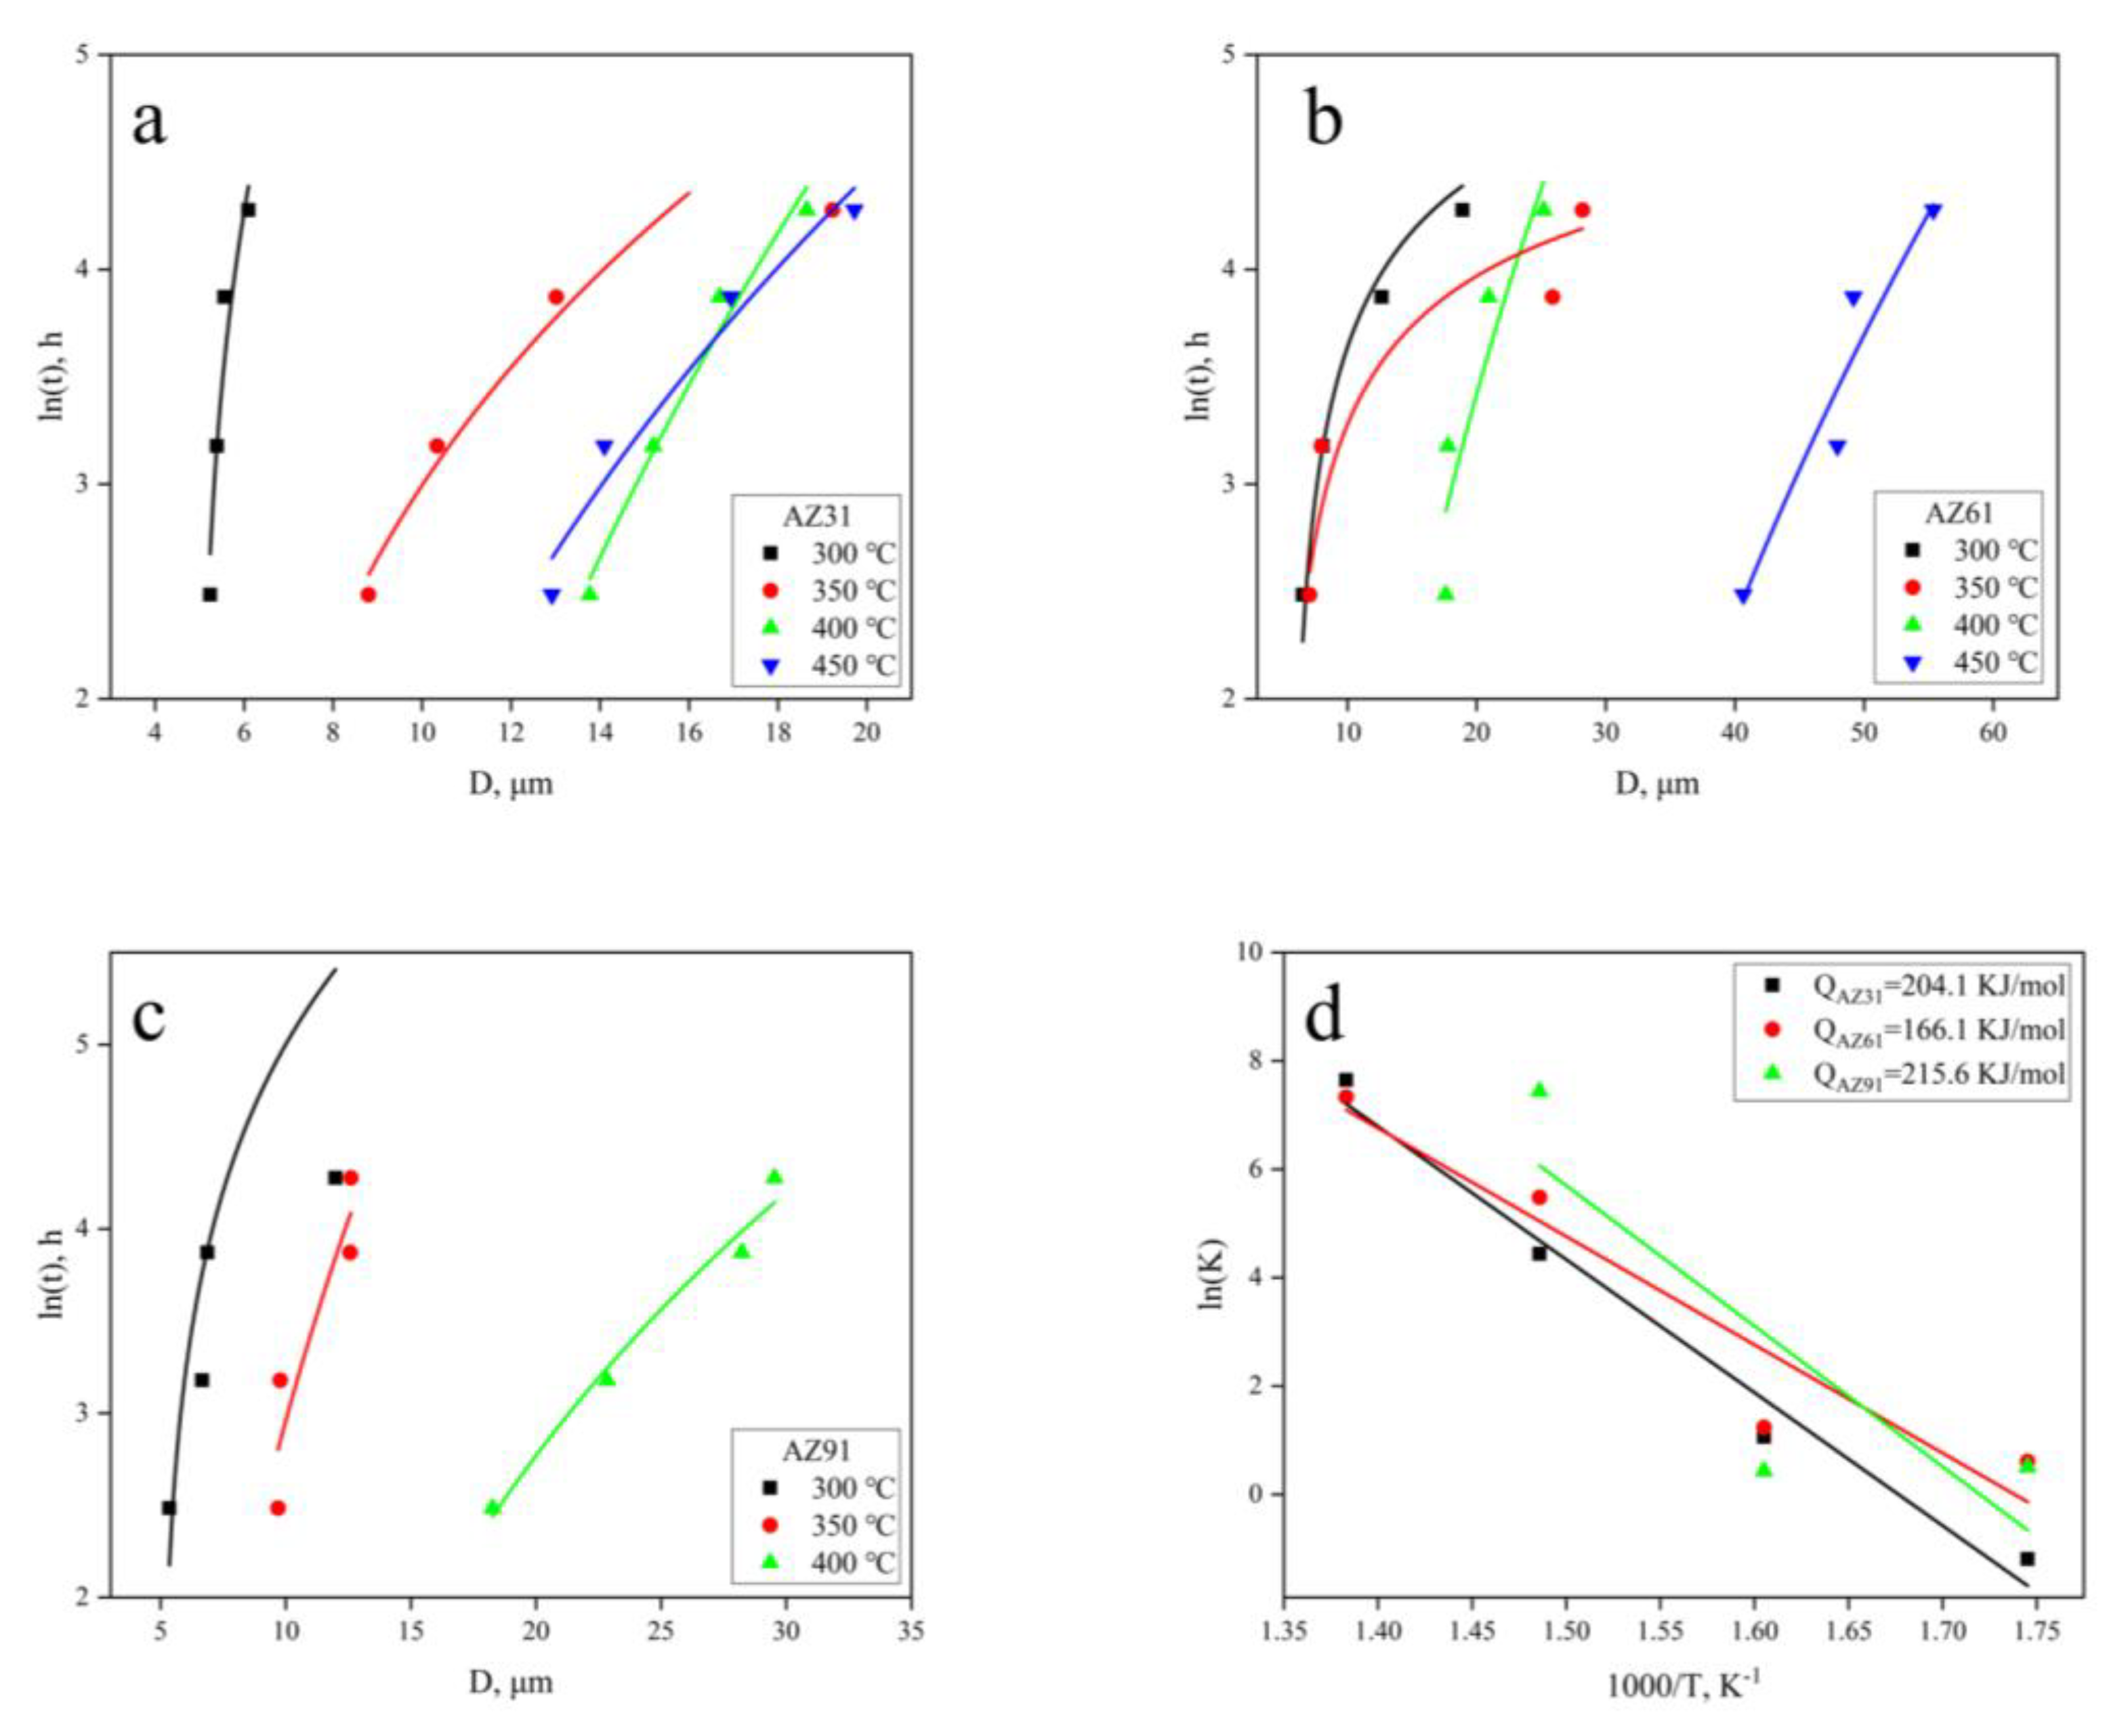
- The average grain growth exponent n of hot extruded Mg–xAl–1Zn (x = 3, 6, 9) alloys increases with increasing Al content. The n values are 2.26, 2.33, and 2.53, respectively, which are greater than the theoretical value of 2. This deviation is related to the presence of Al-rich second phase particles and solute Al. The activation energy Q values are 204.4 KJ/mol, 166.1 KJ/mol, and 215.6 KJ/mol. The Q values of AZ61 are lower than those of AZ31 and AZ91. This is due to the AGG, which reduces the grain growth activation energy of the system.
- (3)
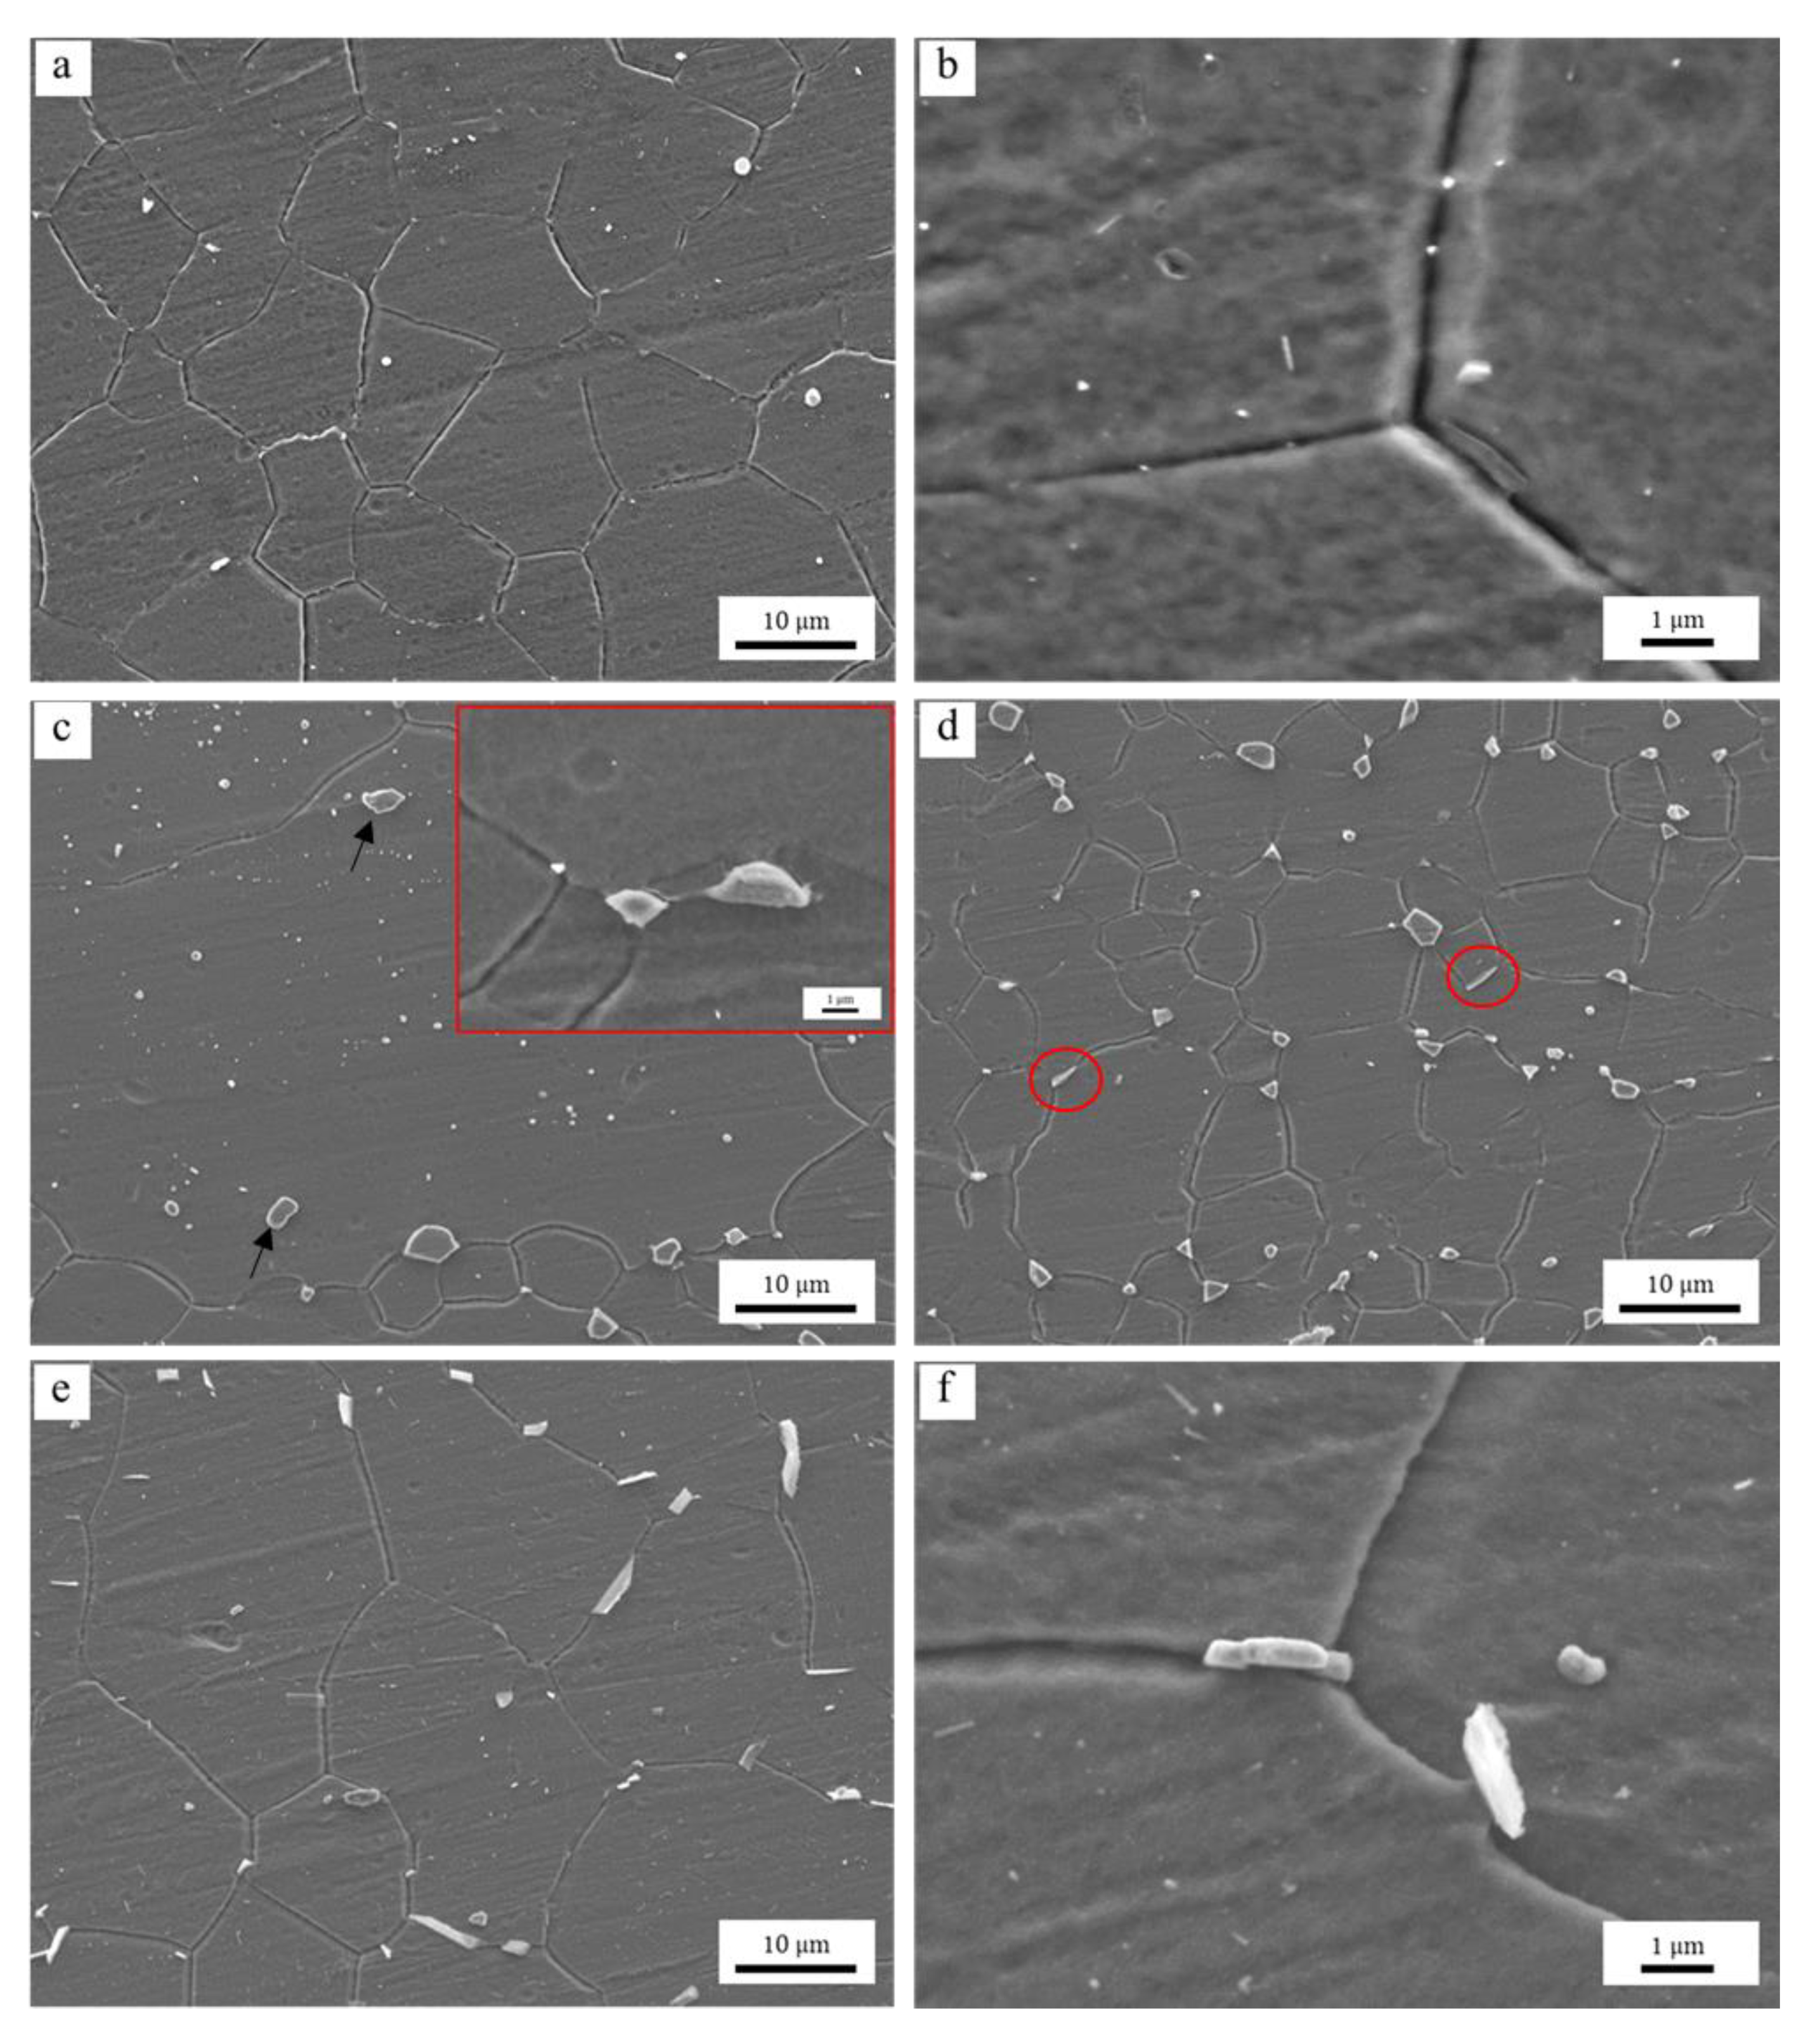
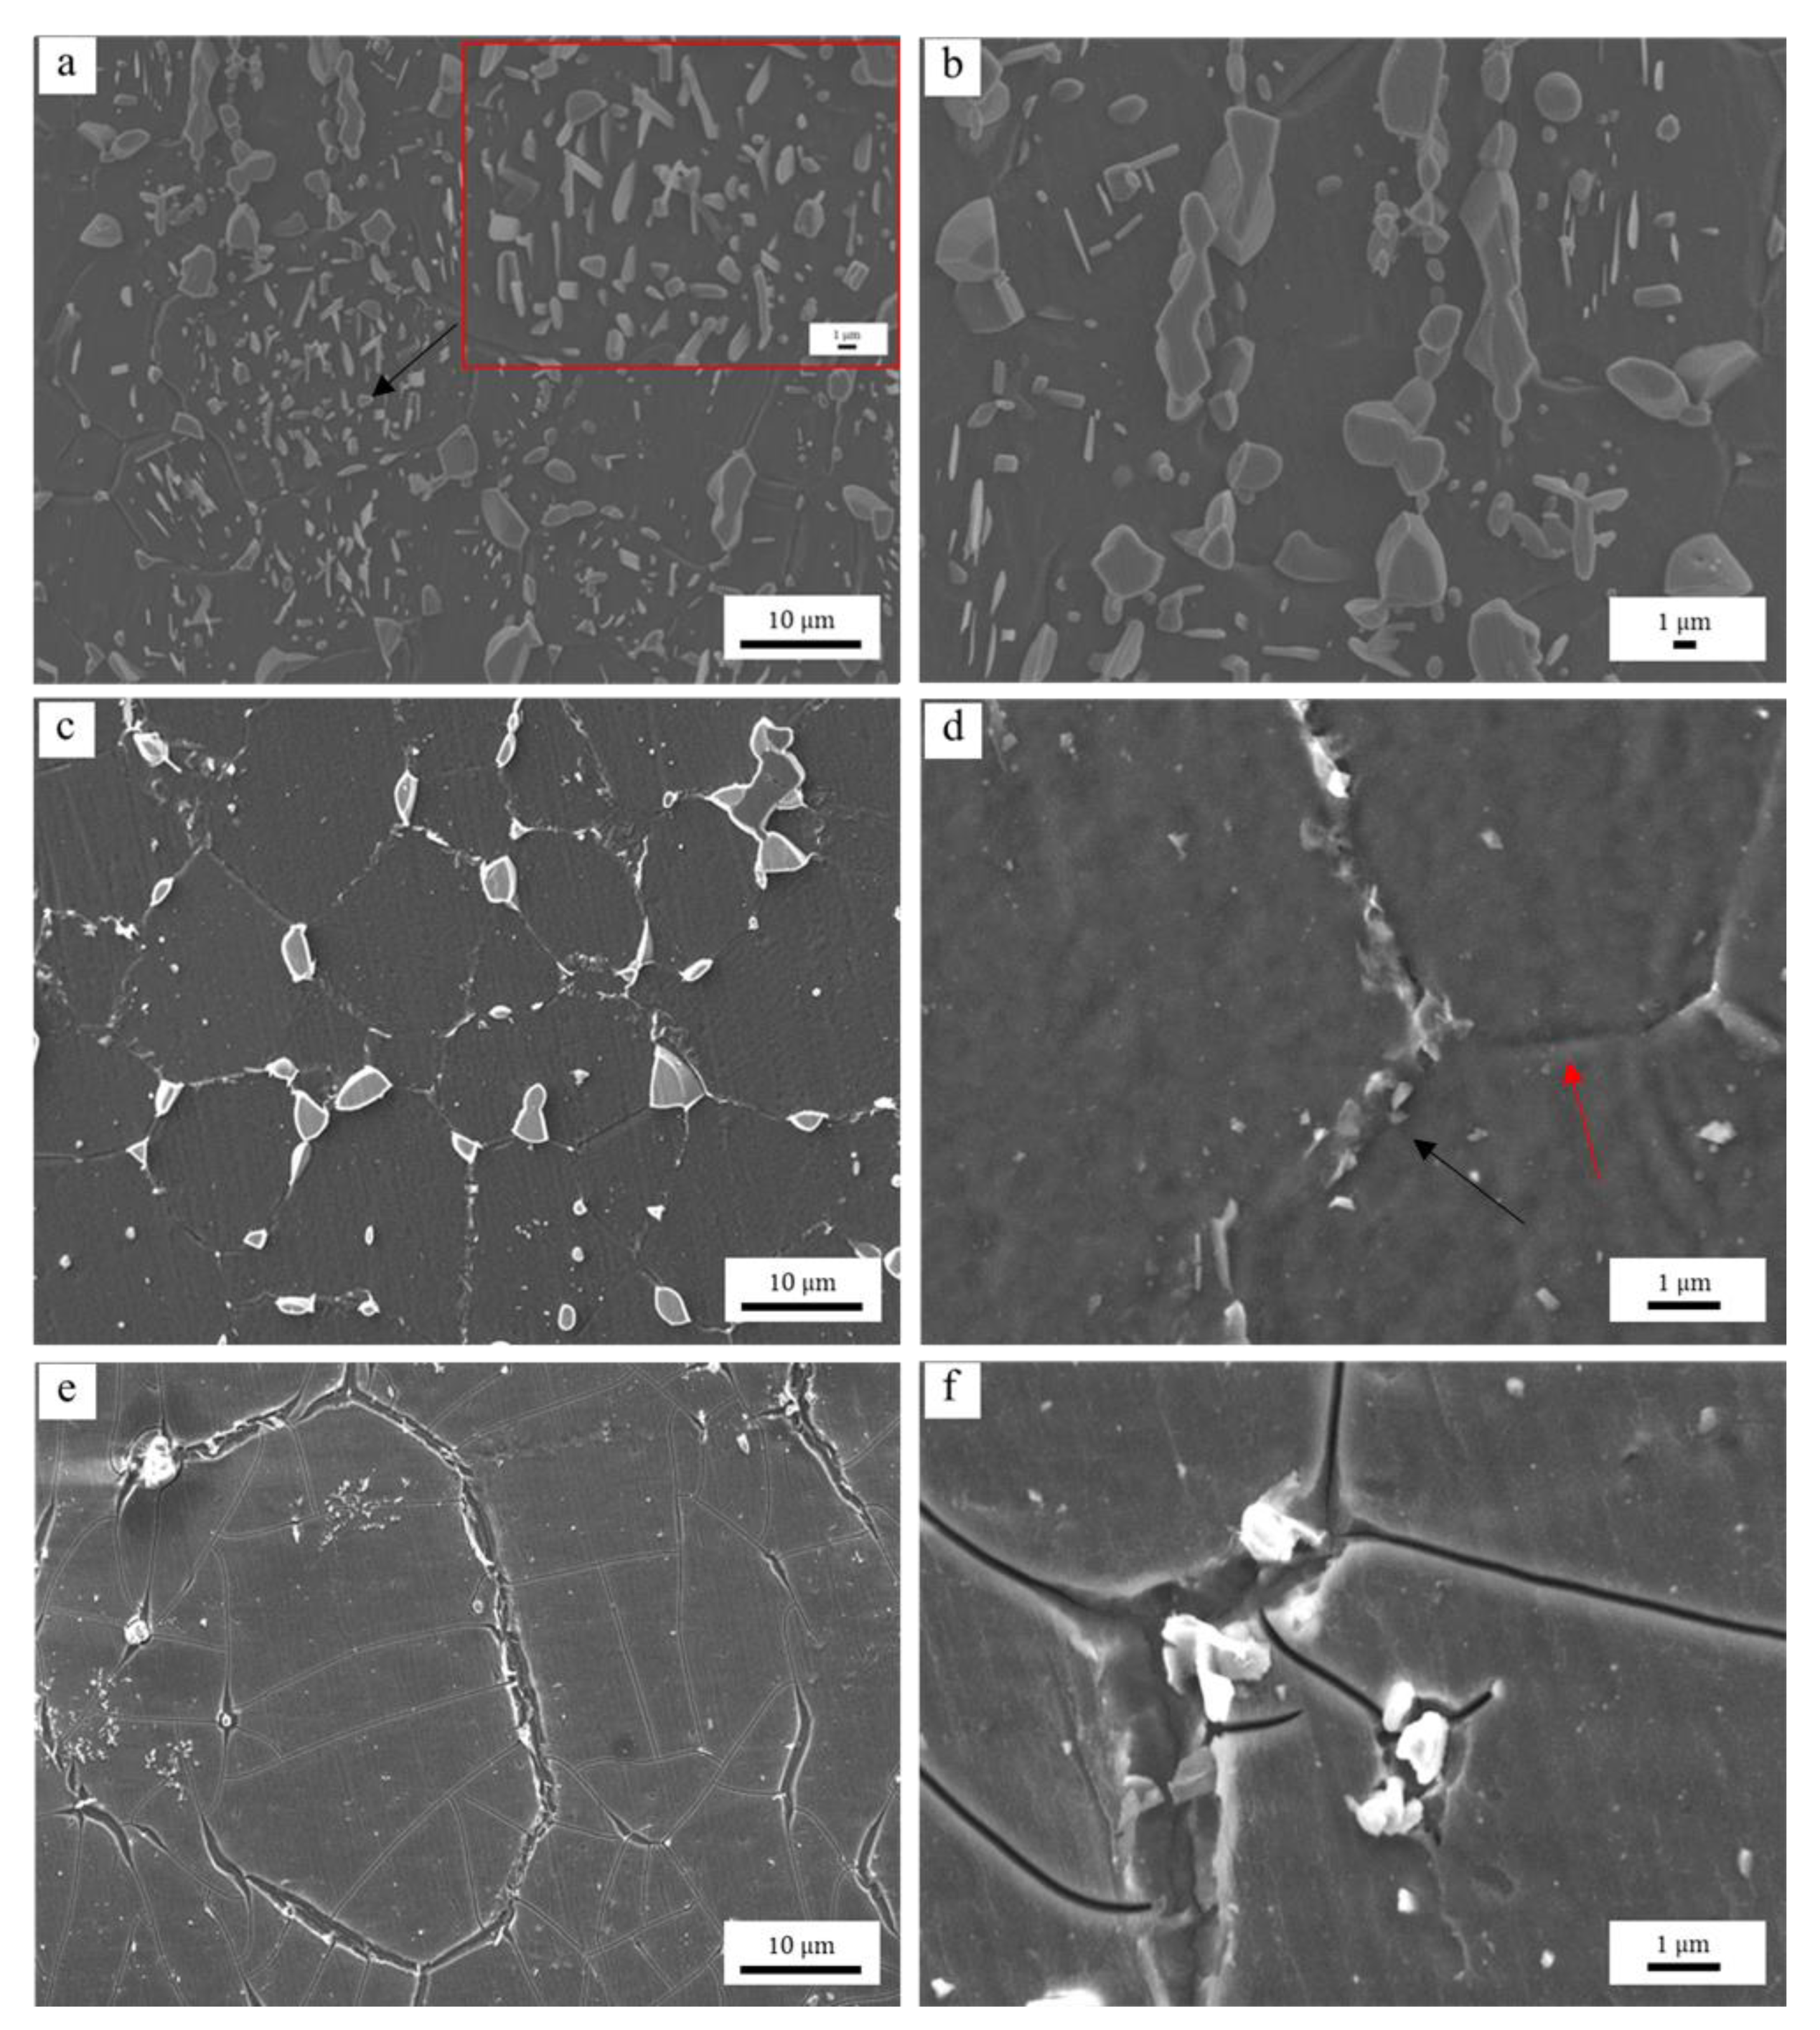
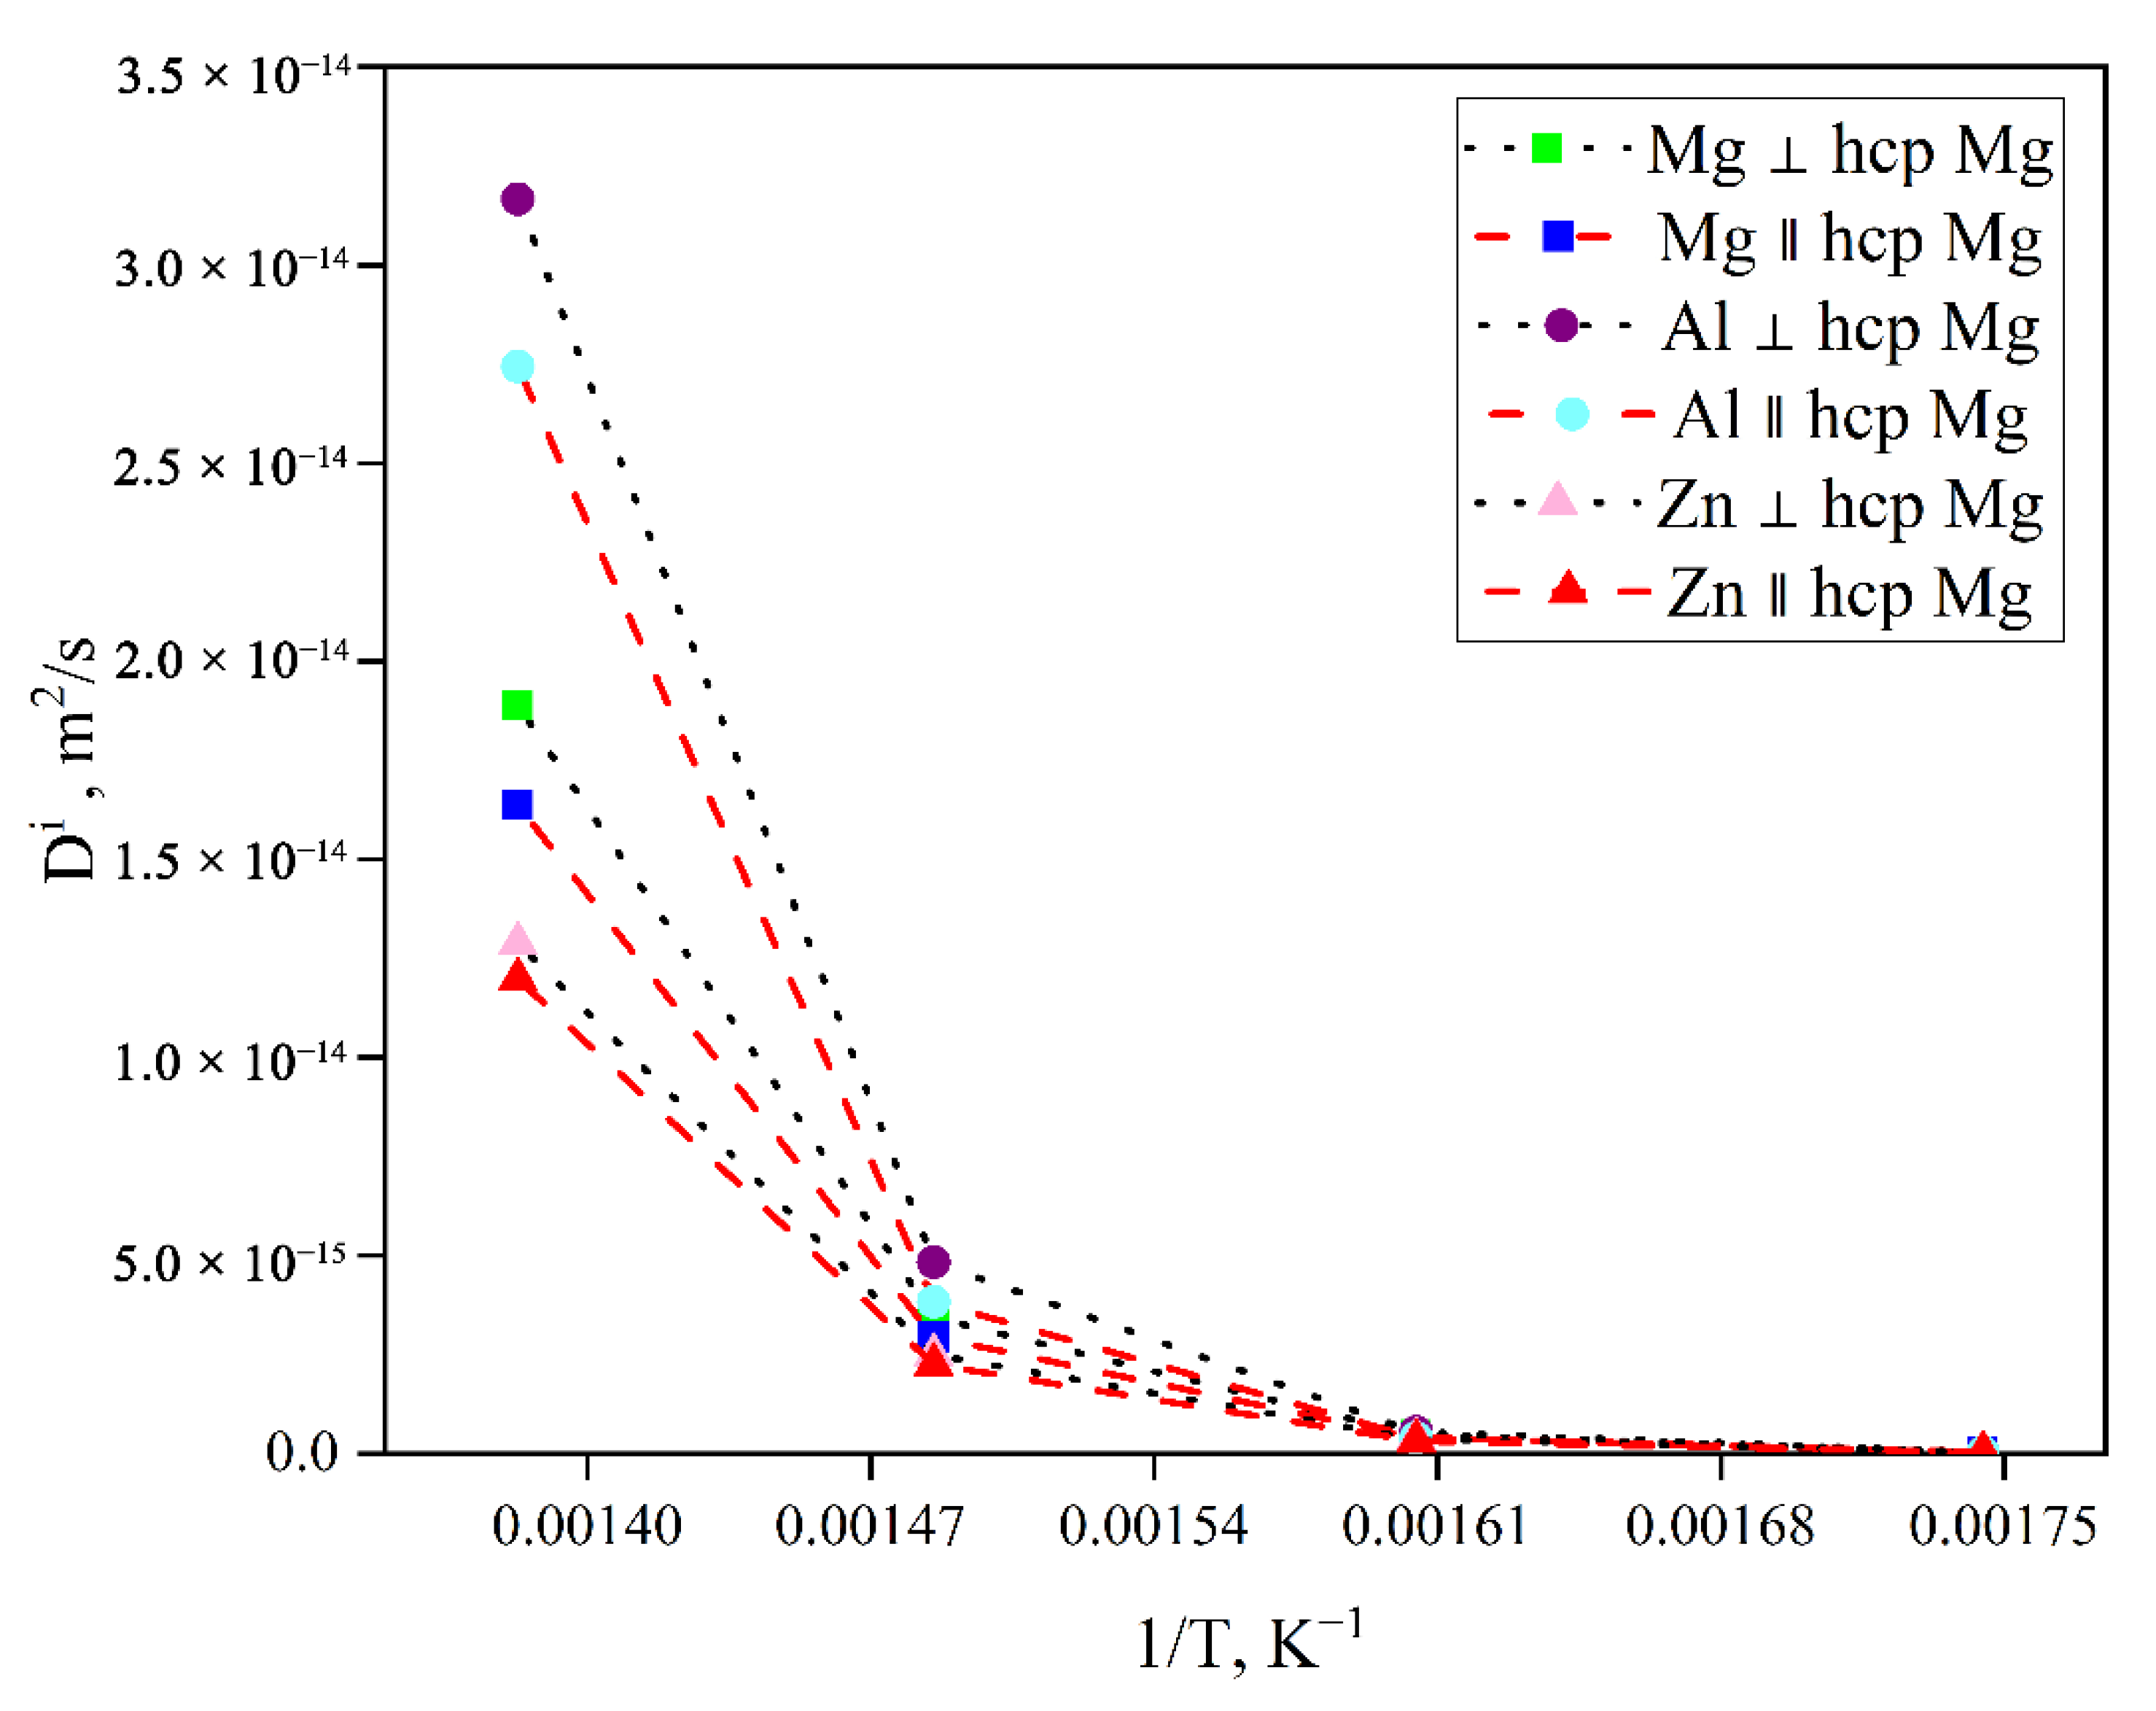
- The pinning of lamellar and networked second phase particles at grain boundaries in hot extruded Mg–xAl–1Zn (x = 3, 6, 9) alloys is greater than that in spherical and granular forms. The distribution of solute Al in the alloy is homogeneous. Moreover, the pinning of Al-rich second phase particles is more effective than the dragging of solute Al during grain refinement.
- (4)
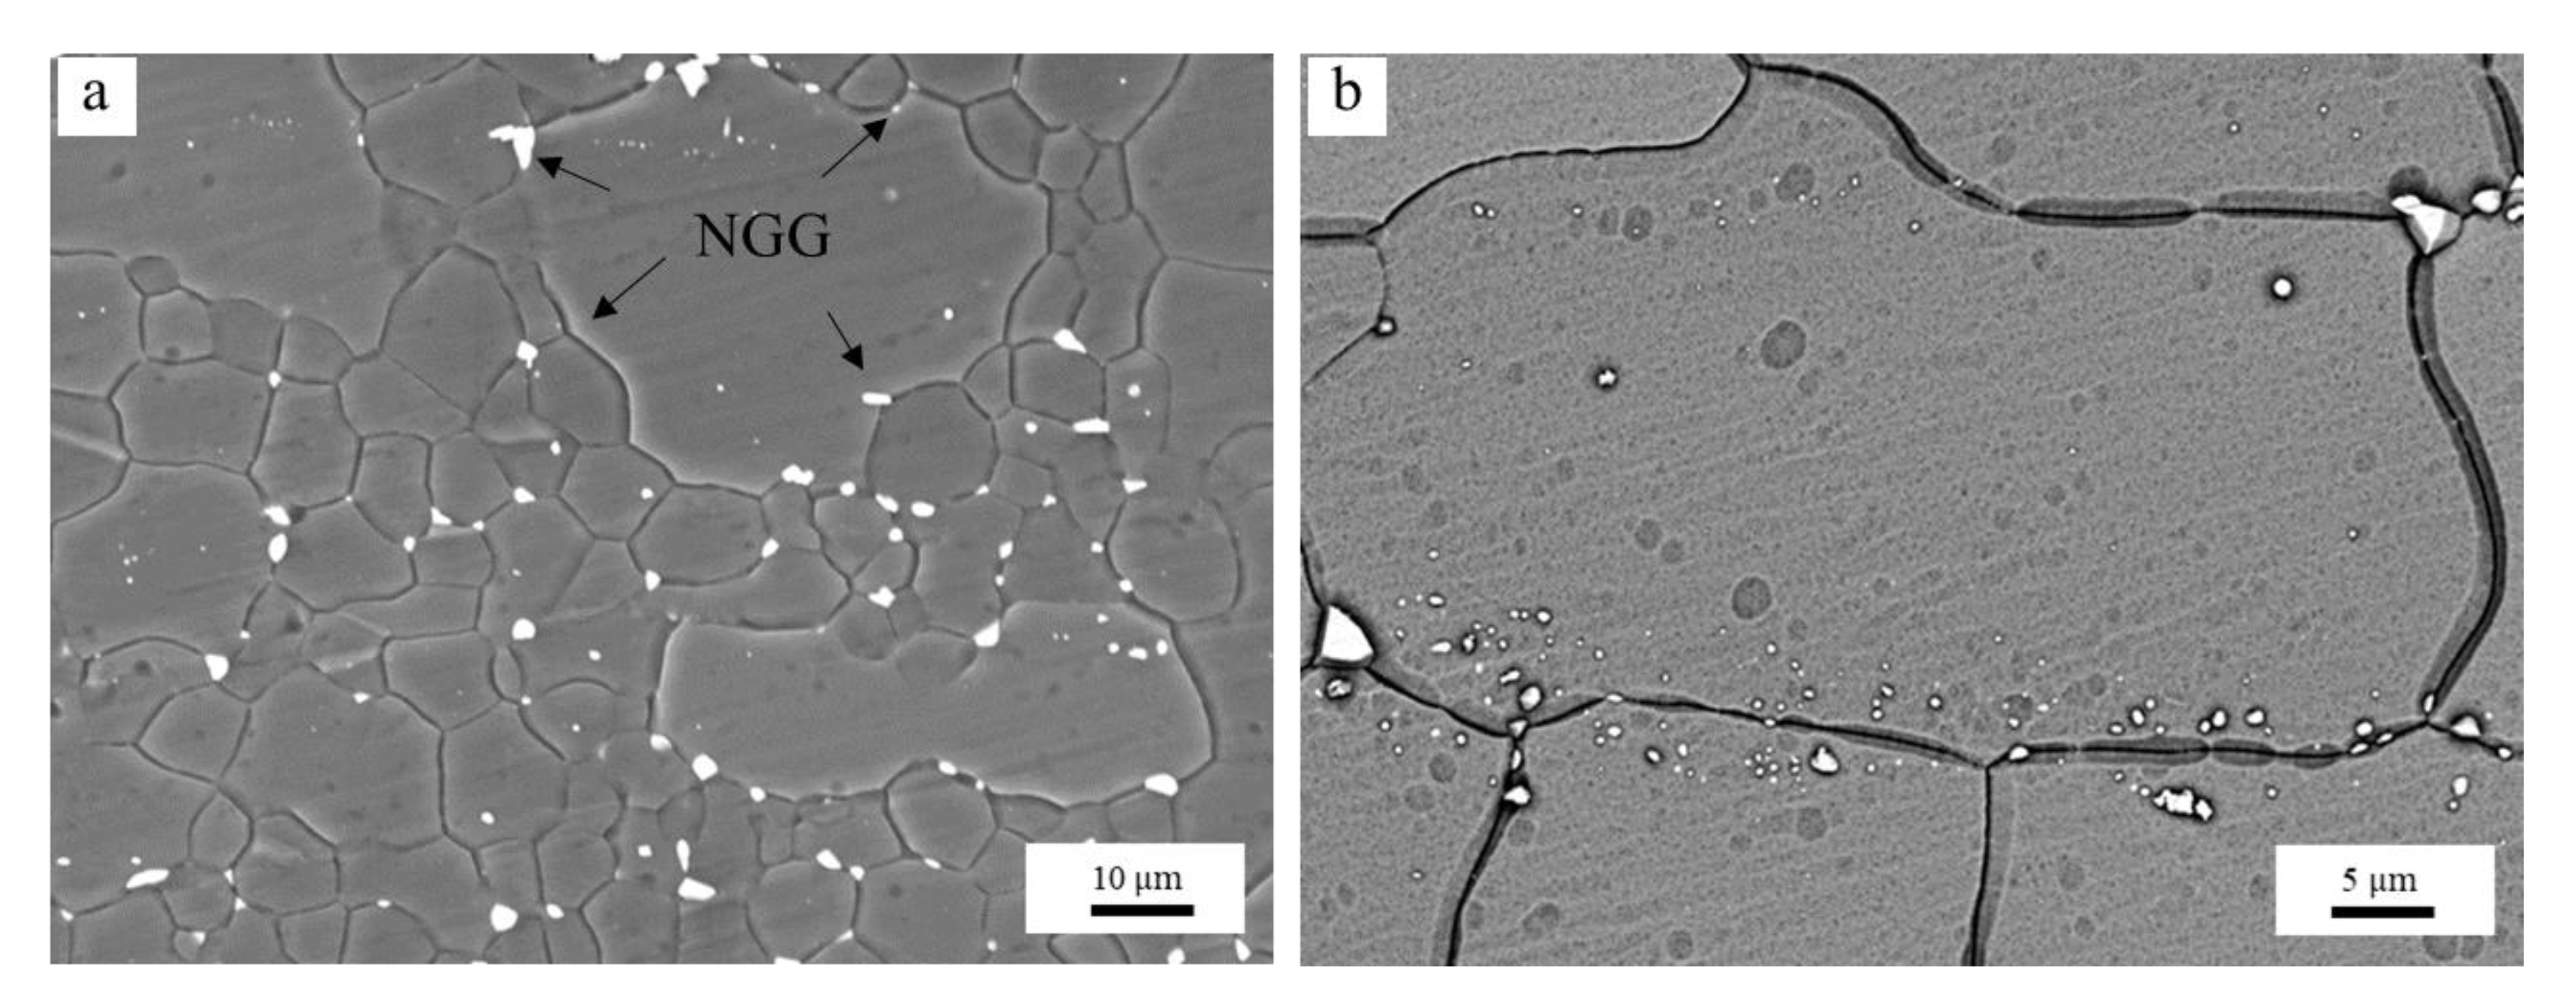
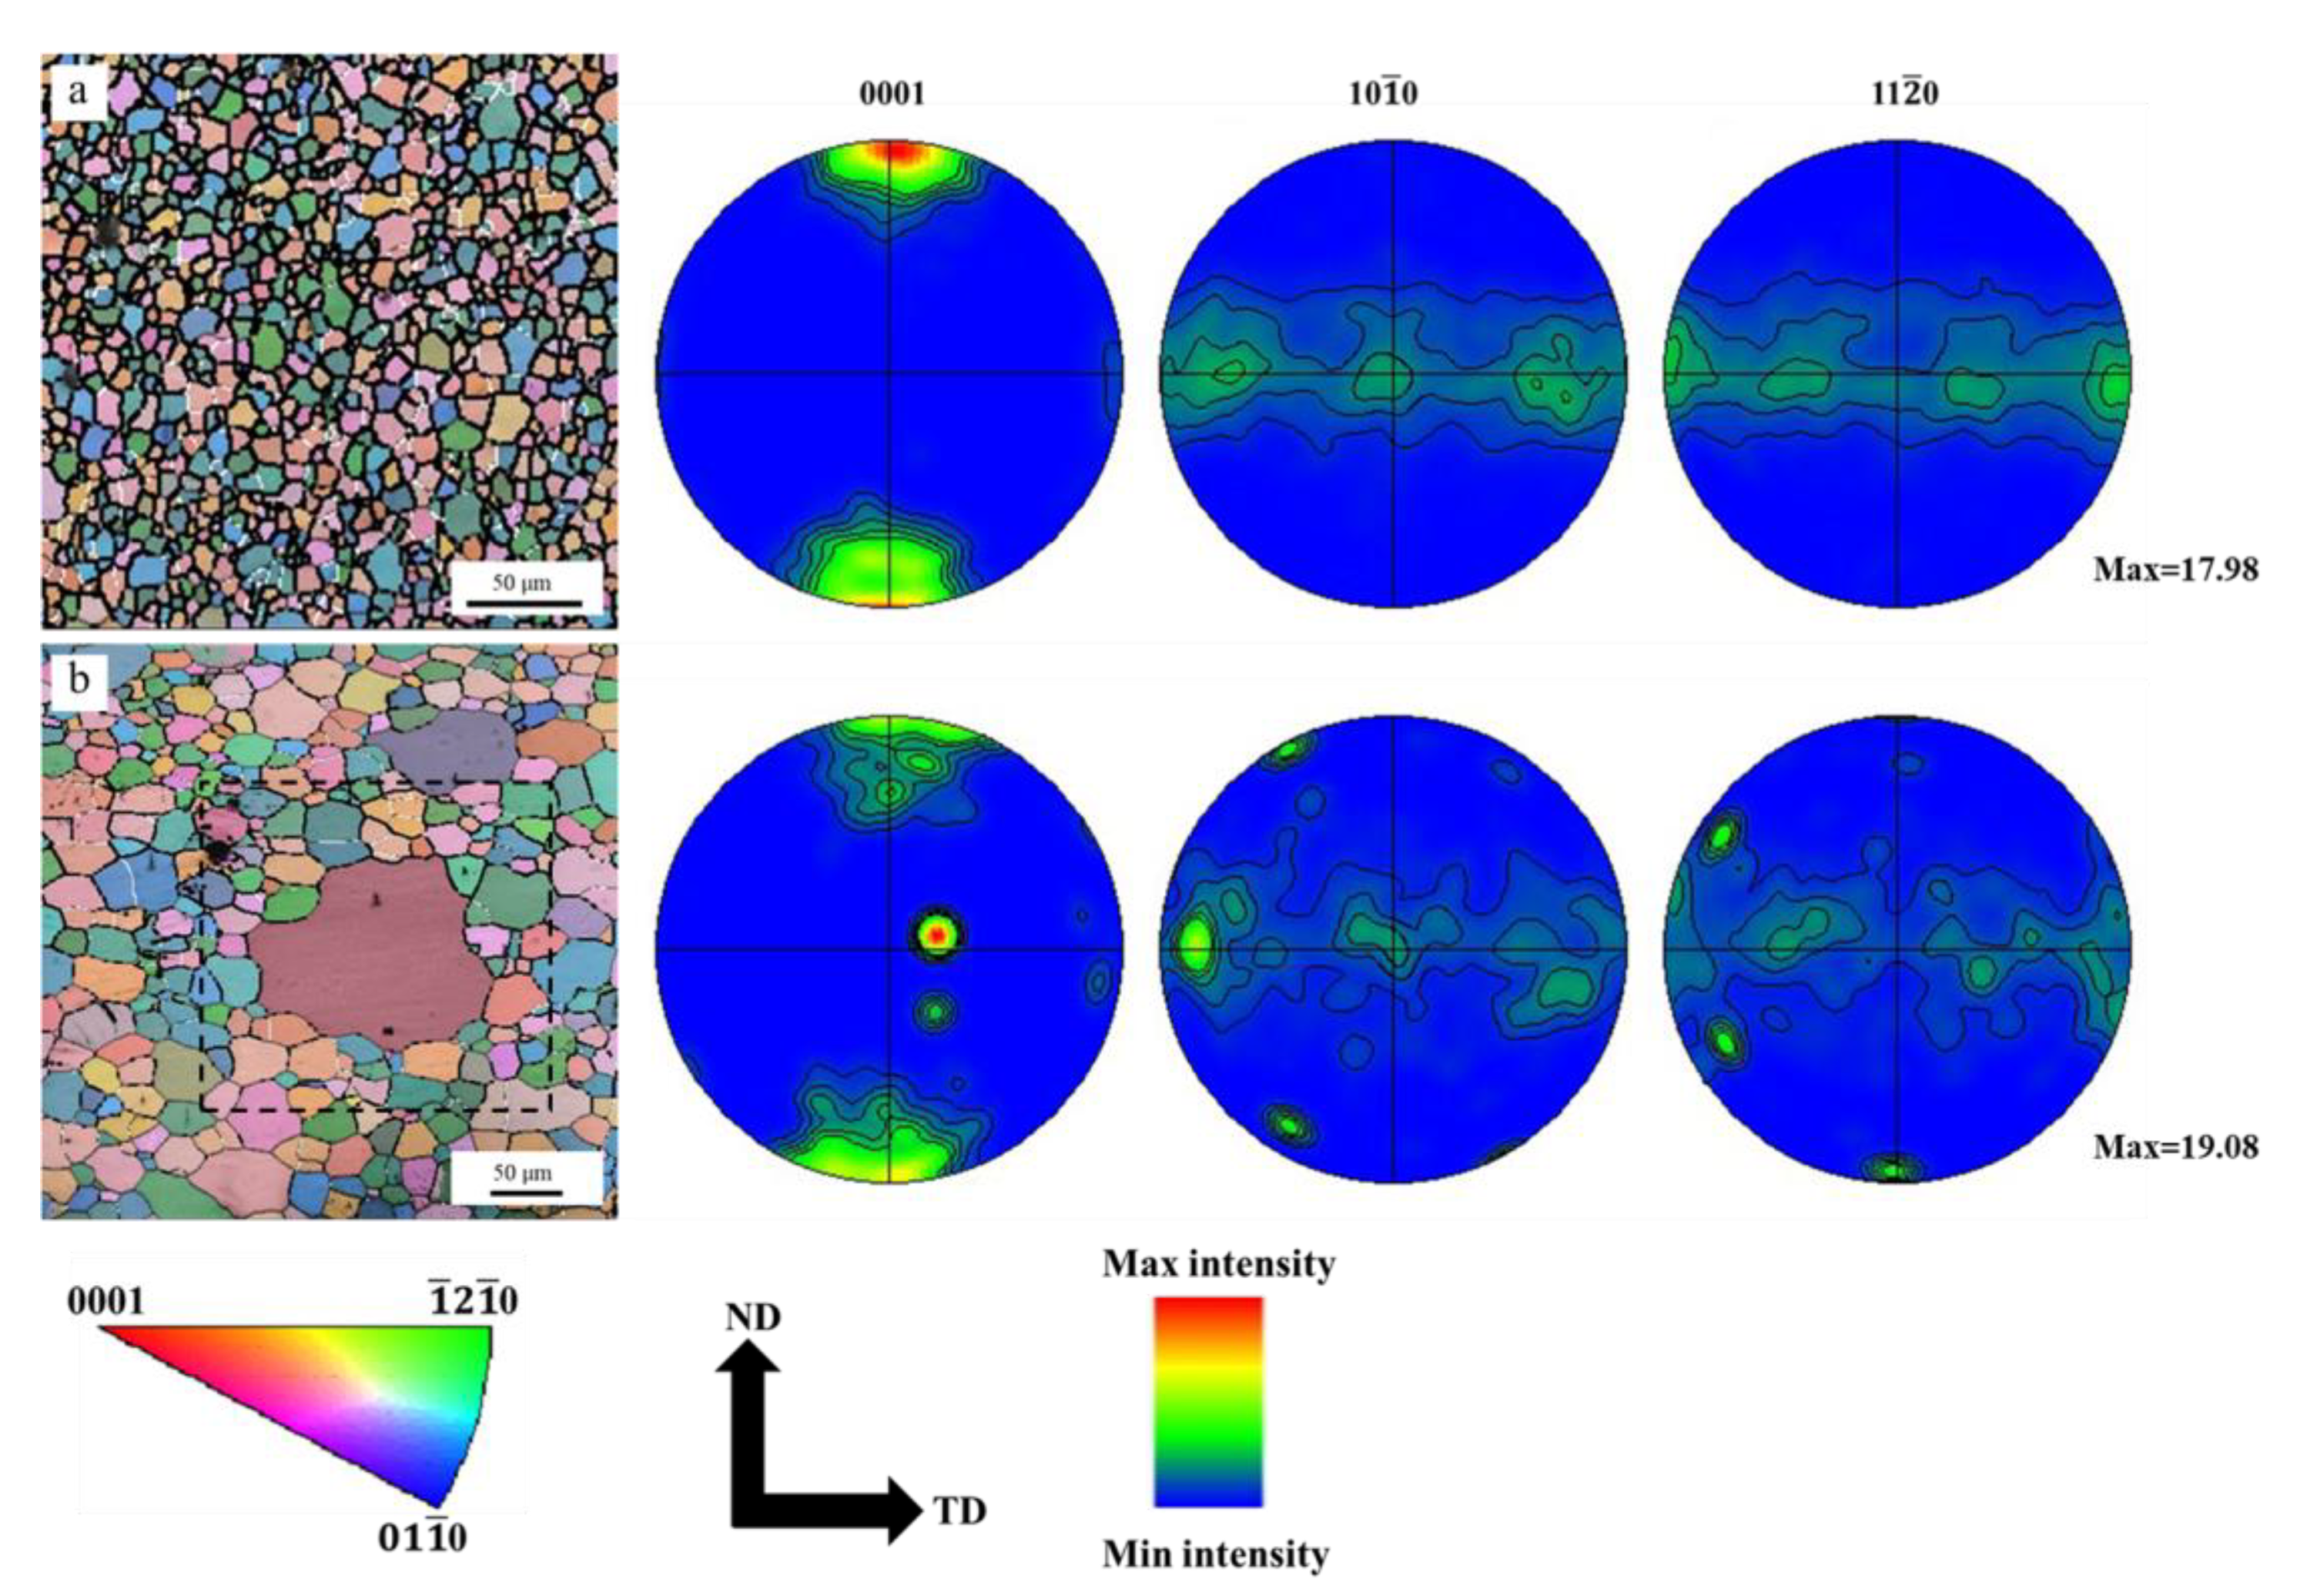
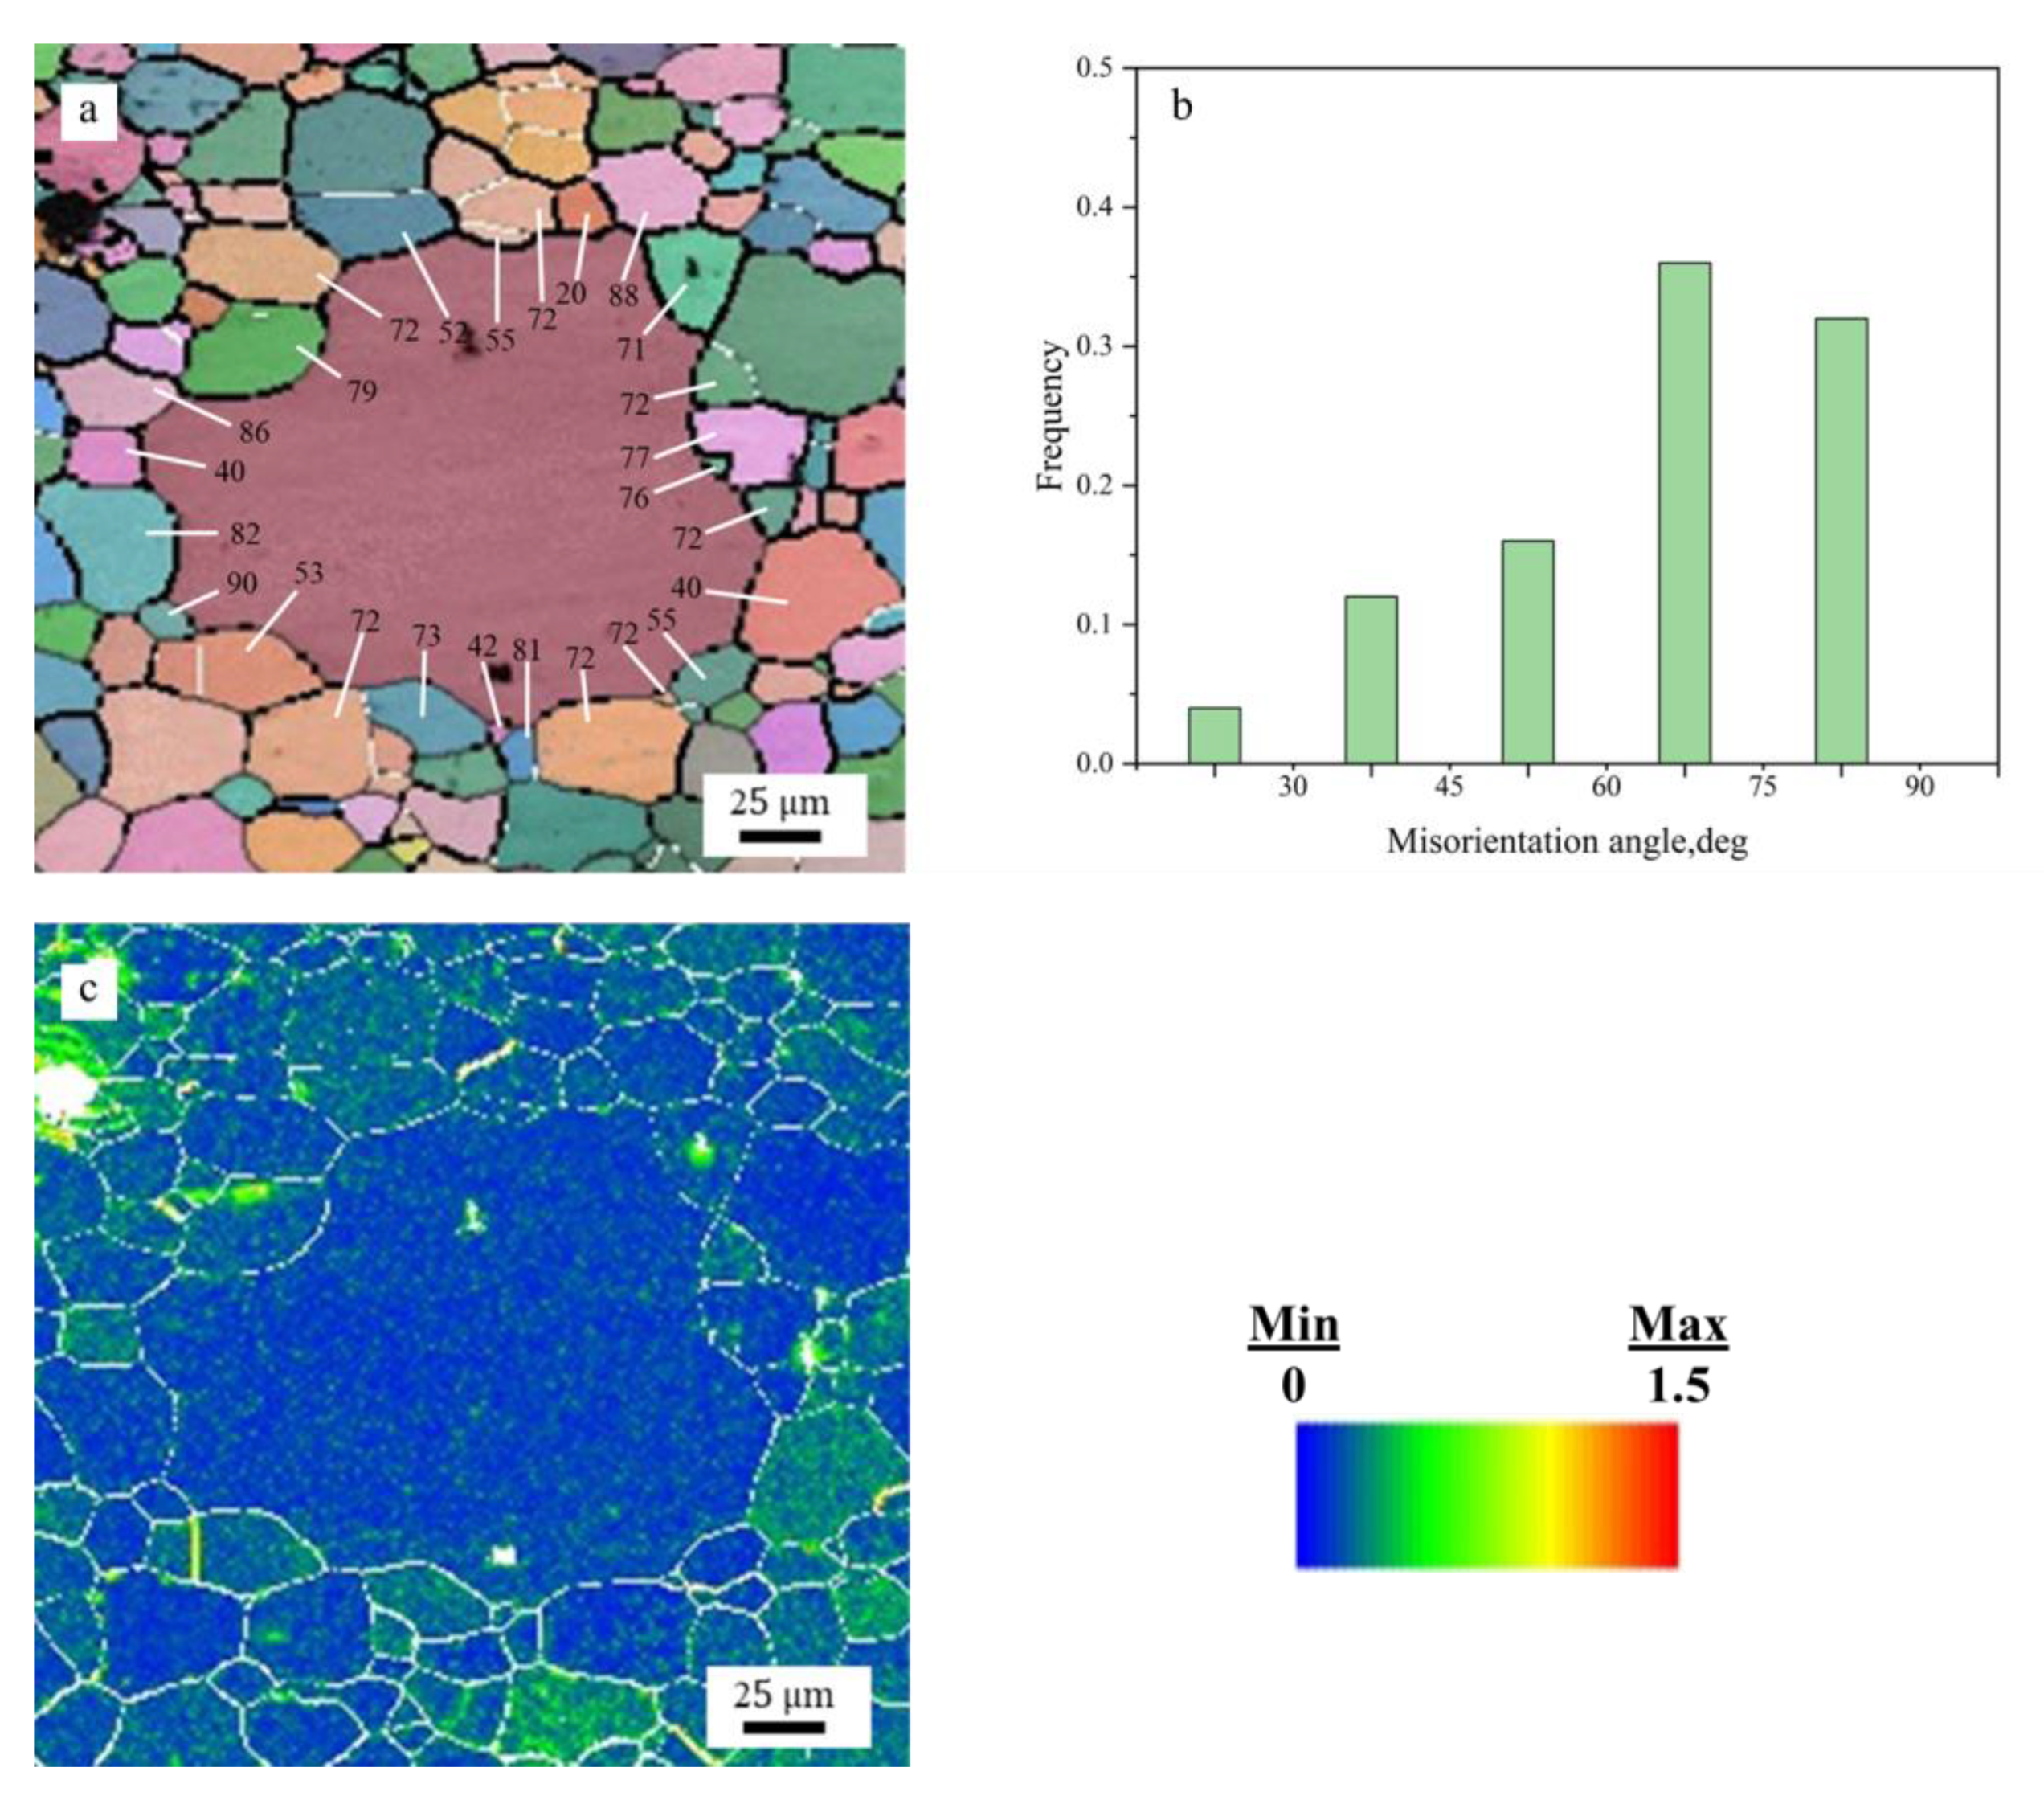
- The AGG in hot extruded Mg–xAl–1Zn (x = 3, 6, 9) alloys is not caused by the inhomogeneous distribution of the second phase particles, but by the high energy difference between the preferentially oriented abnormal grains and the surrounding grains, which drives the grain boundaries to overcome the same pinning forces and continue to migrate.
Author Contributions
Funding
Data Availability Statement
Conflicts of Interest
References
- Kim, S.-J.; Lee, C.; Koo, J.; Lee, J.; Lee, Y.-S.; Kim, D. Improving the room-temperature formability of a magnesium alloy sheet by texture control. Mater. Sci. Eng. A 2018, 724, 156–163. [Google Scholar] [CrossRef]
- Kim, Y.J.; Lee, J.U.; Kim, S.-H.; Kim, Y.M.; Park, S.H. Grain size effect on twinning and annealing behaviors of rolled magnesium alloy with bimodal structure. Mater. Sci. Eng. A 2019, 754, 38–45. [Google Scholar] [CrossRef]
- Wei, K.; Hu, R.; Yin, D.; Xiao, L.; Pang, S.; Cao, Y.; Zhou, H.; Zhao, Y.; Zhu, Y. Grain size effect on tensile properties and slip systems of pure magnesium. Acta Mater. 2021, 206, 116604. [Google Scholar] [CrossRef]
- Yuan, W.; Panigrahi, S.K.; Su, J.Q.; Mishra, R.S. Influence of grain size and texture on Hall–Petch relationship for a magnesium alloy. Scr. Mater. 2011, 65, 994–997. [Google Scholar] [CrossRef]
- Chen, Q.; Chen, R.; Su, J.; He, Q.; Tan, B.; Xu, C.; Huang, X.; Dai, Q.; Lu, J. The mechanisms of grain growth of Mg alloys: A review. J. Magnes. Alloys 2022, 10, 2384–2397. [Google Scholar] [CrossRef]
- Miao, Q.; Hu, L.; Wang, X.; Wang, E. Grain growth kinetics of a fine-grained AZ31 magnesium alloy produced by hot rolling. J. Alloys Compd. 2010, 493, 87–90. [Google Scholar] [CrossRef]
- Wang, X.; Hu, L.; Liu, K.; Zhang, Y. Grain growth kinetics of bulk AZ31 magnesium alloy by hot pressing. J. Alloys Compd. 2012, 527, 193–196. [Google Scholar] [CrossRef]
- Mohseni, M.; Eivani, A.R.; Vafaeenezhad, H.; Jafarian, H.R.; Salehi, M.T.; Zhou, J. An experimental and theoretical investigation of the effect of second-phase particles on grain growth during the annealing of hot-rolled AZ61 magnesium alloy. J. Mater. Res. Technol. 2021, 15, 3585–3597. [Google Scholar] [CrossRef]
- Chang, K.; Feng, W.; Chen, L.-Q. Effect of second-phase particle morphology on grain growth kinetics. Acta Mater. 2009, 57, 5229–5236. [Google Scholar] [CrossRef]
- Wu, Y. Effect of Second Phase Particles on Grain Growth for Nanocrystalline AZ31 Mg Alloy by Phase Field Methods. In International Conference on Energy, Materials and Manufacturing Engineering (EMME 2015), MATEC Web of Conferences; EDP Sciences: Ulyss, France, 2015; p. 6. [Google Scholar] [CrossRef]
- Jin, Z.; Yu, D.; Wu, X.; Yin, K.; Yan, K. Drag Effects of Solute and Second Phase Distributions on the Grain Growth Kinetics of Pre-Extruded Mg-6Zn Alloy. J. Mater. Sci. Technol. 2016, 32, 1260–1266. [Google Scholar] [CrossRef]
- Kim, S.G.; Park, Y.B. Grain boundary segregation, solute drag and abnormal grain growth. Acta Mater. 2008, 56, 3739–3753. [Google Scholar] [CrossRef]
- Hu, G.W.; Zeng, L.C.; Du, H.; Wang, Q.; Fan, Z.T.; Liu, X.W. Combined effects of solute drag and Zener pinning on grain growth of a NiCoCr medium-entropy alloy. Intermetallics 2021, 136, 107271. [Google Scholar] [CrossRef]
- Chuan, W.U.; Yang, H.; Li, H.W. Static coarsening of titanium alloys in single field by cellular automaton model considering solute drag and anisotropic mobility of grain boundaries. Chin. Sci. Bull. 2012, 57, 1473–1482. [Google Scholar] [CrossRef] [Green Version]
- Ganeshan, S.; Hector, L.G., Jr.; Liu, Z.K. First-principles study of self-diffusion in hcp Mg and Zn. Comput. Mater. Sci. 2010, 50, 301–307. [Google Scholar] [CrossRef]
- Shewmon, P.G. Self-diffusion in magnesium single crystals. JOM 1956, 8, 918–922. [Google Scholar] [CrossRef]
- Moreau, G.; Cornet, J.A.; Calais, D. Acceleration de la diffusion chimique sous irradiation dans le systeme aluminium-magnesium. J. Nucl. Mater. 1971, 38, 197–202. [Google Scholar] [CrossRef]
- Das, S.K.; Jung, I.H. Effect of the basal plane orientation on Al and Zn diffusion in hcp Mg. Mater. Charact. 2014, 94, 86–92. [Google Scholar] [CrossRef]
- Das, S.K.; Kim, Y.-M.; Ha, T.K.; Jung, I.-H. Investigation of anisotropic diffusion behavior of Zn in hcp Mg and interdiffusion coefficients of intermediate phases in the Mg–Zn system. Calphad 2013, 42, 51–58. [Google Scholar] [CrossRef]
- Shirdel, M.; Mirzadeh, H.; Parsa, M.H. Abnormal grain growth in AISI 304L stainless steel. Mater. Charact. 2014, 97, 11–17. [Google Scholar] [CrossRef]
- Alili, B.; Azzeddine, H.; Abib, K.; Bradai, D. Texture evolution in AZ91 alloy after hot rolling and annealing. Trans. Nonferrous Met. Soc. China 2013, 23, 2215–2221. [Google Scholar] [CrossRef]
- Bhattacharyya, J.J.; Agnew, S.R.; Muralidharan, G. Texture enhancement during grain growth of magnesium alloy AZ31B. Acta Mater. 2015, 86, 80–94. [Google Scholar] [CrossRef] [Green Version]
- Humphreys, F.J.; Hatherly, M. Recrystallization and Related Annealing Phenomena, 2nd ed.; Elsevier: Oxford, UK, 2004; pp. 361–373. [Google Scholar]
- Basu, I.; Pradeep, K.G.; Mießen, C.; Barrales-Mora, L.A.; Al-Samman, T. The role of atomic scale segregation in designing highly ductile magnesium alloys. Acta Mater. 2016, 116, 77–94. [Google Scholar] [CrossRef]
- Roostaei, M.; Shirdel, M.; Parsa, M.H.; Mahmudi, R.; Mirzadeh, H. Microstructural evolution and grain growth kinetics of GZ31 magnesium alloy. Mater. Charact. 2016, 118, 584–592. [Google Scholar] [CrossRef]
- Doiphode, R.L.; Murty, S.V.S.N.; Prabhu, N.; Kashyap, B.P. Grain growth in calibre rolled Mg–3Al–1Zn alloy and its effect on hardness. J. Magnes. Alloys 2015, 3, 322–329. [Google Scholar] [CrossRef] [Green Version]
- Wang, Y.; Choo, H. Influence of texture on Hall–Petch relationships in an Mg alloy. Acta Mater. 2014, 81, 83–97. [Google Scholar] [CrossRef] [Green Version]
- Ma, J.; Yang, X.; Huo, Q.; Sun, H.; Qin, J.; Wang, J. Mechanical properties and grain growth kinetics in magnesium alloy after accumulative compression bonding. Mater. Des. 2013, 47, 505–509. [Google Scholar] [CrossRef]
- Burke, J.E.; Turnbull, D. Recrystallization and grain growth. Prog. Met. Phys. 1952, 3, 220–292. [Google Scholar] [CrossRef]
- Jin, Z.-Z.; Cheng, X.-M.; Zha, M.; Rong, J.; Zhang, H.; Wang, J.-G.; Wang, C.; Li, Z.-G.; Wang, H.-Y. Effects of Mg17Al12 second phase particles on twinning-induced recrystallization behavior in Mg-Al-Zn alloys during gradient hot rolling. J. Mater. Sci. Technol. 2019, 35, 2017–2026. [Google Scholar] [CrossRef]
- Ubeda, C.; Garces, G.; Adeva, P.; Llorente, I.; Frankel, G.S.; Fajardo, S. The role of the beta-Mg17Al12 phase on the anomalous hydrogen evolution and anodic dissolution of AZ magnesium alloys. Corros. Sci. 2020, 165, 108384. [Google Scholar] [CrossRef]
- Palai, P.; Prabhu, N.; Hodgson, P.D.; Kashyap, B.P. Grain growth and β-Mg17Al12 intermetallic phase dissolution during heat treatment and its impact on deformation behavior of AZ80 Mg-Alloy. J. Mater. Eng. Perform. 2014, 23, 77–82. [Google Scholar] [CrossRef]
- Du, L.; Yang, S.; Zhang, P.; Du, H. Pinning effect of different shape second-phase particles on grain growth in polycrystalline: Numerical and analytical investigations. Compos. Interfaces 2018, 25, 357–368. [Google Scholar] [CrossRef]
- Chai, S.; Zhong, S.; Yang, Q.; Yu, D.; Dai, Q.; Zhang, H.; Yin, L.; Wang, G.; Yao, Z. Transformation of Laves phases and its effect on the mechanical properties of TIG welded Mg-Al-Ca-Mn alloys. J. Mater. Sci. Technol. 2022, 120, 108–117. [Google Scholar] [CrossRef]
- Hoseini-Athar, M.M.; Mahmudi, R.; Babu, R.P.; Hedström, P. Effect of Zn content on the microstructural stability and grain growth kinetics of fine-grained extruded Mg–Gd–Zn alloys. J. Alloys Compd. 2020, 831, 154766. [Google Scholar] [CrossRef]
- Ganeshan, S.; Hector, L.G.; Liu, Z.K. First-principles calculations of impurity diffusion coefficients in dilute Mg alloys using the 8-frequency model. Acta Mater. 2011, 59, 3214–3228. [Google Scholar] [CrossRef]
- Das, S.K.; Kim, Y.M.; Ha, T.K. Erratum to: Anisotropic Diffusion Behavior of Al in Mg: Diffusion Couple Study Using Mg Single Crystal. Metall. Mater. Trans. A 2013, 44, 2539–2547. [Google Scholar] [CrossRef]
- Okamoto, H.; Schlesinger, M.E.; Mueller, E.M. Binary alloy phase diagrams. In Alloy Phase Diagrams; ASM International: Materials Park, OH, USA, 2016; p. 12. [Google Scholar] [CrossRef]
- Imandoust, A.; Barrett, C.D.; Al-Samman, T.; Inal, K.A.; El Kadiri, H. A review on the effect of rare-earth elements on texture evolution during processing of Mg alloys. J. Mater. Sci. 2017, 52, 1–29. [Google Scholar] [CrossRef]
- Griffiths, D. Explaining texture weakening and improved formability in magnesium rare earth alloys. Mater. Sci. Technol. 2015, 31, 10–24. [Google Scholar] [CrossRef]
- Robson, J.D. Effect of rare-earth additions on the texture of wrought Mg alloys: The role of grain boundary segregation. Metall. Mater. Trans. A 2014, 45, 3205–3212. [Google Scholar] [CrossRef]
- Tang, J.; Chen, L.; Zhao, G.; Zhang, C.; Chu, X. Formation mechanism of abnormal coarse grains on weld seam of extruded ZK60 alloy and the effects on mechanical properties. Mater. Sci. Eng. A 2020, 773, 138718. [Google Scholar] [CrossRef]
- Pérez-Prado, M.T.; Ruano, O.A. Texture evolution during grain growth in annealed MG AZ61 alloy. Scr. Mater. 2003, 48, 59–64. [Google Scholar] [CrossRef]
- Pérez-Prado, M.T.; Ruano, O.A. Texture evolution during annealing of magnesium AZ31 alloy. Scr. Mater. 2002, 46, 149–155. [Google Scholar] [CrossRef]
- Shirdel, M.; Mirzadeh, H.; Parsa, M.H. Enhanced Mechanical Properties of Microalloyed Austenitic Stainless Steel Produced by Martensite Treatment. Adv. Eng. Mater. 2015, 17, 1226–1233. [Google Scholar] [CrossRef]


| Material | Chemical Composition (wt.%) | ||||
|---|---|---|---|---|---|
| Al | Zn | Mn | Si | Mg | |
| AZ31 | 2.90 | 0.80 | 0.27 | 0.07 | Bal. |
| AZ61 | 6.53 | 0.47 | 0.27 | 0.02 | Bal. |
| AZ91 | 8.70 | 0.82 | 0.27 | 0.02 | Bal. |
| Annealing Temperature/°C | nAZ31 | KAZ31 | nAZ61 | KAZ61 | nAZ91 | KAZ91 |
|---|---|---|---|---|---|---|
| 300 | 2.1 | 0.3 | 2.0 | 0.6 | 2.2 | 1.7 |
| 350 | 2.0 | 2.9 | 2.0 | 1.2 | 2.0 | 1.5 |
| 400 | 2.7 | 84.6 | 3.0 | 2.4 × 10² | 3.4 | 1.7 × 10³ |
| 450 | 4.0 | 2.1 × 10³ | 2.8 | 1.5 × 10³ | - | - |
| Annealing Temperature/°C | D, (μm) | fv | 2r, (μm) | ||||||
|---|---|---|---|---|---|---|---|---|---|
| AZ31 | AZ61 | AZ91 | AZ31 | AZ61 | AZ91 | AZ31 | AZ61 | AZ91 | |
| Initial | 4.98 | 5.66 | 8.42 | 1.30% | 1.50% | 4.00% | 0.7 | 1.32 | 0.87 |
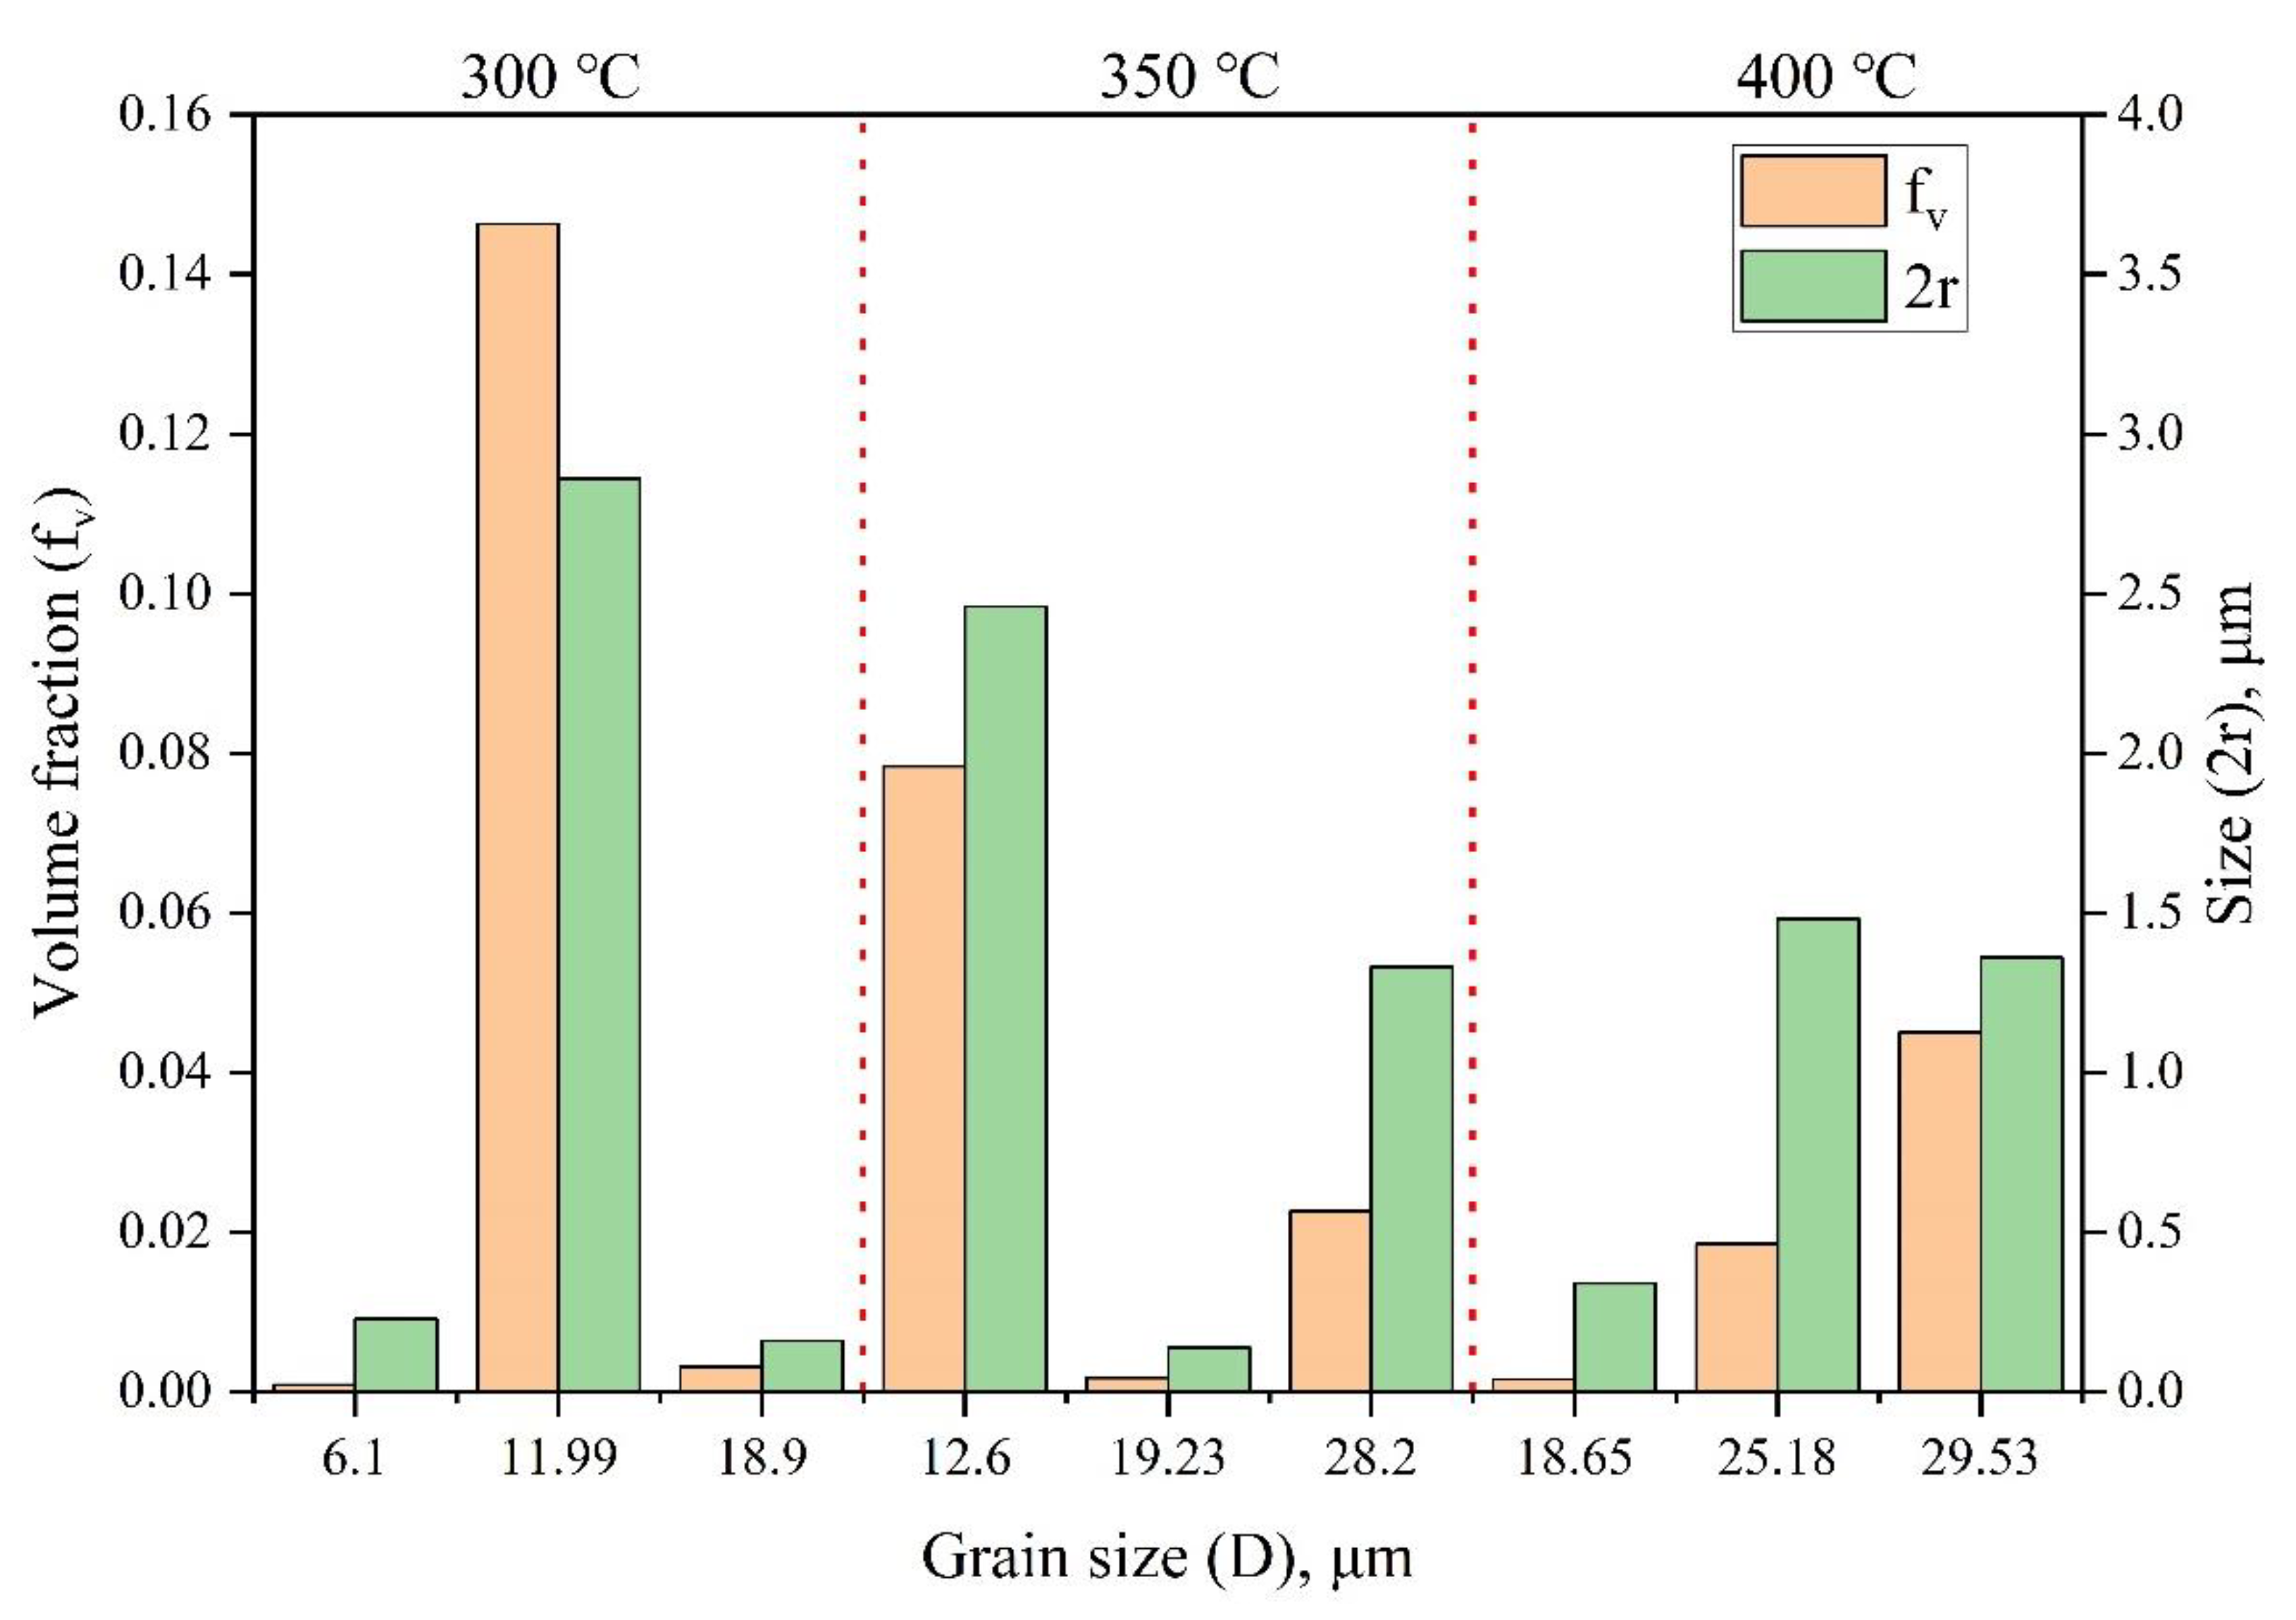
| 300 | 6.1 | 18.9 | 11.99 | 0.09% | 0.31% | 14.63% | 0.23 | 0.16 | 2.86 |
| 350 | 19.23 | 28.2 | 12.6 | 0.18% | 2.26% | 7.84% | 0.14 | 1.33 | 2.46 |
| 400 | 18.65 | 25.18 | 29.53 | 0.16% | 1.85% | 4.51% | 0.34 | 1.48 | 1.36 |
Publisher’s Note: MDPI stays neutral with regard to jurisdictional claims in published maps and institutional affiliations. |
© 2022 by the authors. Licensee MDPI, Basel, Switzerland. This article is an open access article distributed under the terms and conditions of the Creative Commons Attribution (CC BY) license (https://creativecommons.org/licenses/by/4.0/).
Share and Cite
Chen, R.; Chen, Q.; Huang, X.; He, Q.; Su, J.; Tan, B.; Xu, C.; Deng, H.; Dai, Q. Effect of Al Content on the Microstructural and Grain Growth Kinetics of Magnesium Alloys. Metals 2022, 12, 1955. https://doi.org/10.3390/met12111955
Chen R, Chen Q, Huang X, He Q, Su J, Tan B, Xu C, Deng H, Dai Q. Effect of Al Content on the Microstructural and Grain Growth Kinetics of Magnesium Alloys. Metals. 2022; 12(11):1955. https://doi.org/10.3390/met12111955
Chicago/Turabian StyleChen, Ruinan, Qinghua Chen, Xu Huang, Qingsong He, Jian Su, Bin Tan, Chao Xu, Huahong Deng, and Qingwei Dai. 2022. "Effect of Al Content on the Microstructural and Grain Growth Kinetics of Magnesium Alloys" Metals 12, no. 11: 1955. https://doi.org/10.3390/met12111955
APA StyleChen, R., Chen, Q., Huang, X., He, Q., Su, J., Tan, B., Xu, C., Deng, H., & Dai, Q. (2022). Effect of Al Content on the Microstructural and Grain Growth Kinetics of Magnesium Alloys. Metals, 12(11), 1955. https://doi.org/10.3390/met12111955