Article

Effects of Build Orientations on Microstructure Evolution, Porosity Formation, and Mechanical Performance of Selective Laser Melted 17-4 PH Stainless Steel

by
Mohammad Azlan Aripin
1,2,
Zainuddin Sajuri
1,*,
Nashrah Hani Jamadon
1,
Amir Hossein Baghdadi
1,
Junaidi Syarif
3,
Intan Fadhlina Mohamed
1 and
Ahmad Muhammad Aziz
1
1
Department of Mechanical and Manufacturing Engineering, Faculty of Engineering and Built Environment, Universiti Kebangsaan Malaysia, Bangi 43600, Selangor, Malaysia
2
Department of Mechanical Engineering, Faculty of Engineering, City University, Petaling Jaya 46100, Selangor, Malaysia
3
Department of Mechanical and Nuclear Engineering, College of Engineering, University of Sharjah, Sharjah 27272, United Arab Emirates
*
Author to whom correspondence should be addressed.
Metals 2022, 12(11), 1968; https://doi.org/10.3390/met12111968
Submission received: 17 October 2022 / Revised: 9 November 2022 / Accepted: 13 November 2022 / Published: 17 November 2022

Abstract

:
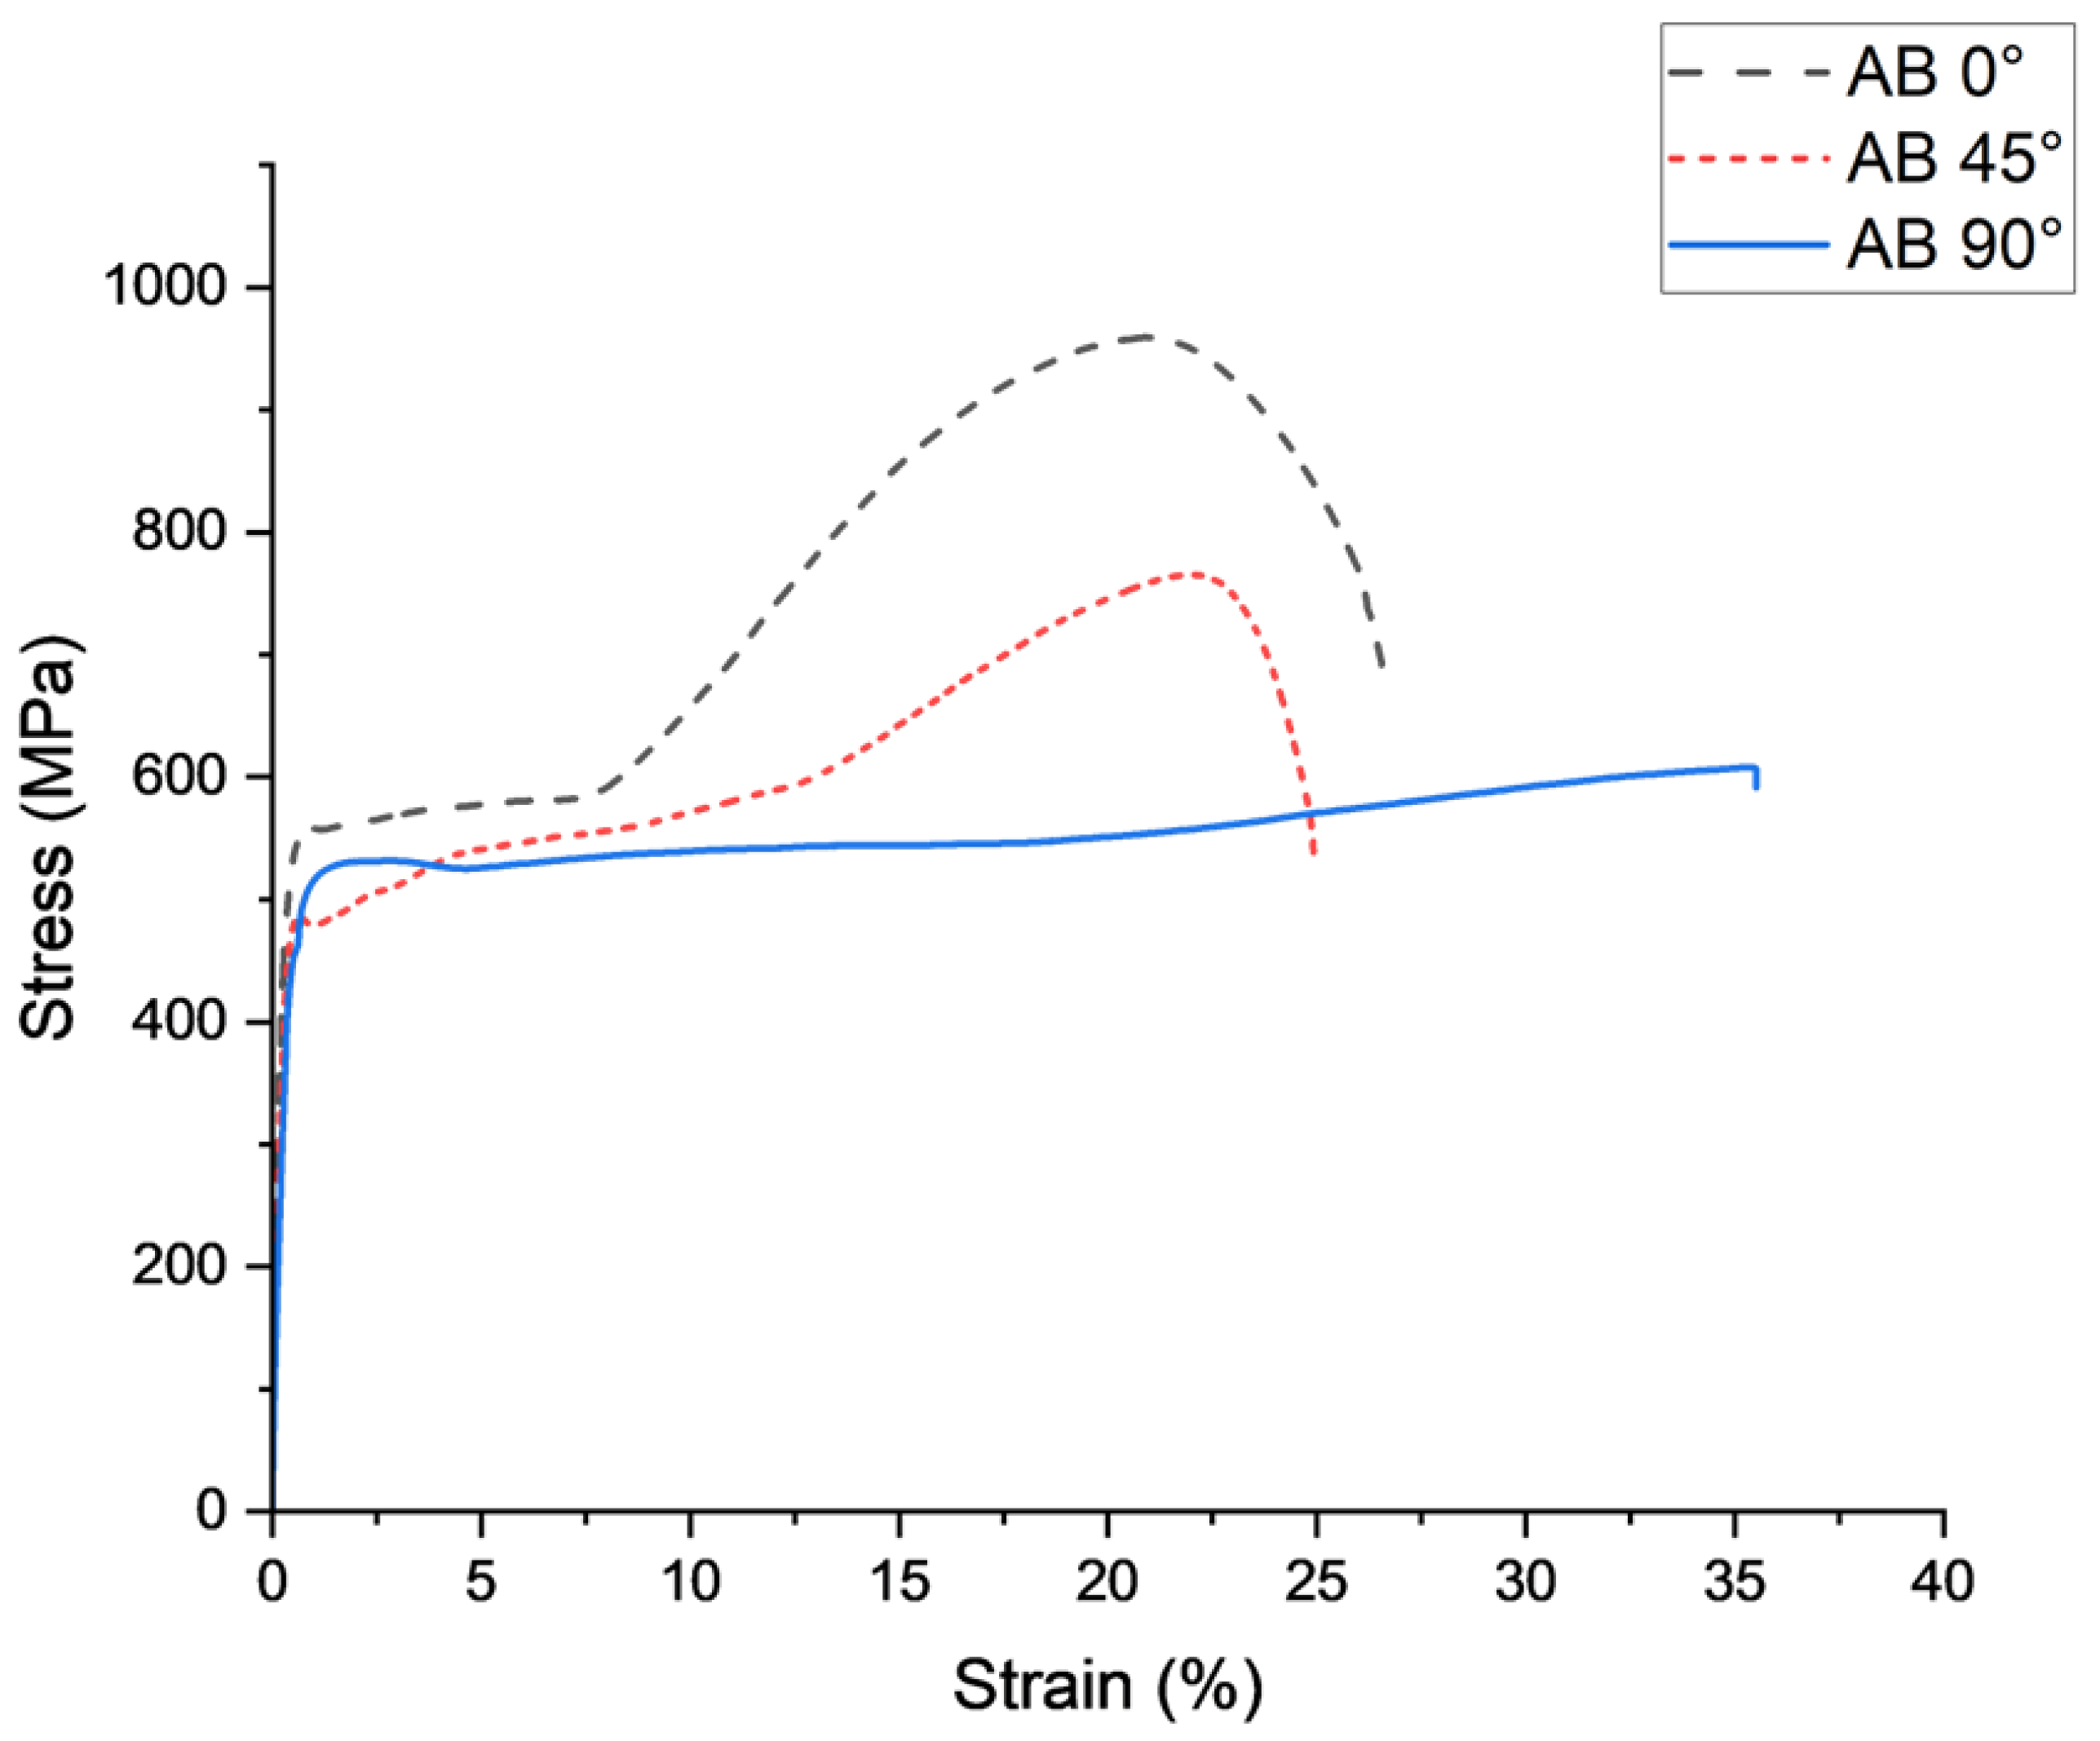
In this study, the effect of phase, microstructure, and porosity in Selective Laser Melting (SLM) on hardness, tensile, and fracture behavior of 17-4 PH was investigated. The increasing interest in SLM in producing complex parts has encouraged the industry to produce performance parts, such as martensitic 17-4 PH stainless steel. However, the microstructure and mechanical behavior of SLM 17-4PH is not fully understood by researchers. Understanding the microstructure profile is complex because it is driven by thermal history and porosity. Both elements vary, based on the build directions, further hindering researchers from fully understanding the mechanical properties. To fabricate specimens in three different building orientations (0°, 45°, and 90°), 17-4 powder was used. Two phases, namely, austenite and martensite, with 90° build direction, retained more austenite, due to the reheating process on a smaller base area. The optical microstructure revealed several elements that were distinct for SLM processing, including circular, columnar lath, wave melt pool, and porosity. Columnar lath was found to grow continuously across different melt pools. Hardness was found to be higher for 0° than for 90°, due to higher martensite content. Tensile strength was highest for 0°, at 958 MPa, higher than at 45° and 90° at 743 and 614 MPa, respectively. Porosity analysis validated that 90° had all three types of porosities and, specifically, the crescent type, which held un-melted powders. All types of porosities were found in fractography analysis.

1. Introduction

Modern manufacturing has evolved numerous times, each evolution improving on previous limitations, but also introducing its own significant limitations. Fabrication technology initially began with a subtractive strategy that required eliminating material from bulk metal until the desired final product was achieved. The requirement of special cutting tools increased duration and cost due to the waste metal produced [1,2]. The subsequent duration of fabrication dramatically decreased with the introduction of formative strategies, such as metal direction injection molding, which allowed commercial products to be produced at a higher rate and reduced the cost of waste material. However, this method hindered the ability to produce unique parts because making new molds was often expensive. Thus, additive manufacturing (AM), offering flexibility in changing design, and the ability to produce complex shapes, was introduced as the latest fabrication strategy [3]. Many researchers attempted to optimize the additive manufacturing process, especially regarding the strength of produced components, and reduced build time.
AM is a manufacturing method wherein layers of materials are built to create a solid object. Currently, it has seven types, and the two most common methods of metal AM are direct energy deposition and powder bed fusion [4,5]. The direct energy deposition process is where solid metal objects are built into a 3D shape through a succession of welded metal tapes. However, to create a complex object, the powder bed fusion method is more suitable because a smaller volume of powder metals can be melted on a powder bed and result in better mechanical properties [6]. The two standard powder bed technologies are Selective Laser Melting (SLM) and Selective Laser Sintering (SLS).
Grade 17-4 PH stainless steel is a type of precipitation-hardening stainless steel widely used for applications that require high strength, toughness, and ductility at high temperatures, specifically in nuclear reactors, aerospace structural components, and gas turbines [7]. Combining anti-corrosion properties and a ductile martensitic matrix with a strengthening effect through nano-particles has made 17-4 PH stainless steel one of the most attractive materials for modern engineering structures [8]. In the case of producing mono-material 17-4 PH, the SLM method is most suitable. The SLM method selectively melts successive layers of powder by interacting with a high-energy-density laser beam [9]. Grade 17-4 PH was one of the materials that underwent extensive studies to obtain the optimum SLM processing parameters without sacrificing its mechanical properties. Despite the attractive capabilities of SLM, such as the ability to produce highly complex shaped components and customized parts without the need for part-specific tooling [10], its mechanical property behavior is yet to be specifically determined using the unique microstructure produced.
On the basis of the 17-4 PH composition, a preliminary calculation can be performed to estimate the phases that exist in the 17-4 PH. The equivalent nickel of 7.64 and equivalent chromium of 16.22 are determined using the general chemical composition of 17-4 PH in the formula in Figure 1. The location of the predicted phases is shown by a red dot in the figure, which is a mixture of three phases, namely, austenite (A), martensite (M), and ferrite (F). Even though the phases within 17-4 PH can be deducted from the Schaeffler diagram, they are no longer accurate for SLM parts, due to different welding conditions, and the diagram does not consider copper elements. Generally, research findings have observed mainly two types of phases in 17-4 PH, namely, austenite and martensite with different volume ratios. During cooling, some microstructures that transform from austenite into martensite depend on the elements and martensite transformation temperature [11,12,13,14].
The phase that exists in the microstructure is mainly contributed to by the chemical composition, and processes during heat treatment may remain regardless of the orientation built. However, the growth of each phase may be different due to the introduction of a unique heat flow for each orientation. The SLM process, which involves layer-by-layer construction, results in a microstructure with distinct differences compared with the conventional method. Lack of comprehension of the SLM microstructure is largely due to the complexity of physical transformation that drives rapid melting, solidification, and re-melting of processed material [17,18], which is projected differently by various build directions [9]. This scenario hinders the researcher from fully understanding the mechanical properties of SLM 17-4 PH.
The SLM method experiences localized melting and solidifying of metal powders that generate a unique microstructure because the conventional method involves bulk solidification. The mechanical property yield from SLM parts is offset from that of conventional 17-4 PH due to the difference in the microstructure. The strength of SLM-produced components is affected by the volume of porosities generated within the microstructure. Eliminating porosity is difficult even if the processing parameters are controlled precisely [19,20,21]. The energy density during melt-pool generation and heat flow during melt-pool solidification guide the location and types of porosities [22,23].
The thermal history of heat flow is varied for different build orientations based on the number of layers and the base area of laser heating [24]. This condition induces anisotropy behavior in SLM parts [25]. Several researchers have investigated the effects of building orientation on the tensile strength of components using commercial metals, including AlSi10Mg [26], Ti6Al4V [9], stainless steel 316 [27,28], and 17-4 PH [17]. Most findings consistently indicate that 0° build orientation has higher tensile strength than 90° build orientation. However, the underlying cause is unclear, considering the distribution of porosities, the direction of melt pool layers, and the cooling rate of each orientation. This study intended to investigate the microstructure profile of SLM 17-4 in three different build directions and to verify its hardness and tensile properties toward the phase fraction and porosity distribution, respectively.

2. Methodology

This study utilized 17-4 PH stainless steel, which is suitable for high-temperature applications. The 17-4 PH powders were supplied directly from EOSINT as the provider of the SLM machine which was used to produce the additive manufactured samples in three different build orientations in this research. The EOSINT 17-4 PH powder was produced according to ISO 9001:2015. The morphology and the chemical composition of the powder particles were observed and analyzed using a Hitachi VP-SEM SU1510 scanning electron microscope (Hitachi High Technologies America, Inc., Schaumburg, IL, USA) with an energy-dispersive X-Ray analysis (EDX).
The SLM process was carried out in a nitrogen atmosphere. The SLM machine was EOSINT M 280 (EOS GmbH. Electro Optical Systems, München, Germany) set to suitable process parameters. The laser scanning temperature during the process could reach up to 1125 °C. Even though the melting temperature for bulk 17-4 PH is approximately 1450 °C, for the SLM process, the 17-4 PH exists as micro-scale powder leading to a reduction in melting temperature to 1125 °C. The machine was set to high productivity with a scanner speed of 800 mm/s and layer thickness of 30 µm in 200 W laser power. The hatching distance was set to 100 ± 10 μm. The details of the process parameters are shown in Table 1.
Currently, processing parameters are manipulated to optimize the shape of the final microstructure [23] and porosity generated in solidified components is also directly related to energy density received by powders. An optimized energy density helps the manufacturer achieve a printed component porosity of less than 1% [29]. The energy density can be calculated by considering major contributing parameters, based on Equation (1) [30]. The energy density optimum value is often translated into a desirable characteristic of the melt pool profile. This finding is necessarily true because the energy density is directly related to the temperature flow in the component during the laser scanning process. Adeyemi et al. found that lower laser power, with higher scanning speed, caused incomplete powder melting and higher porosity [31]. Based on Table 1, the calculated energy density for this research was 75.76 J/mm3.
E = P V τ h
where E, energy input per volume, energy density (J/mm2), P, laser power (W), V, scanning speed (mm/s), τ, layer thickness (mm), h, hatch spacing (mm).
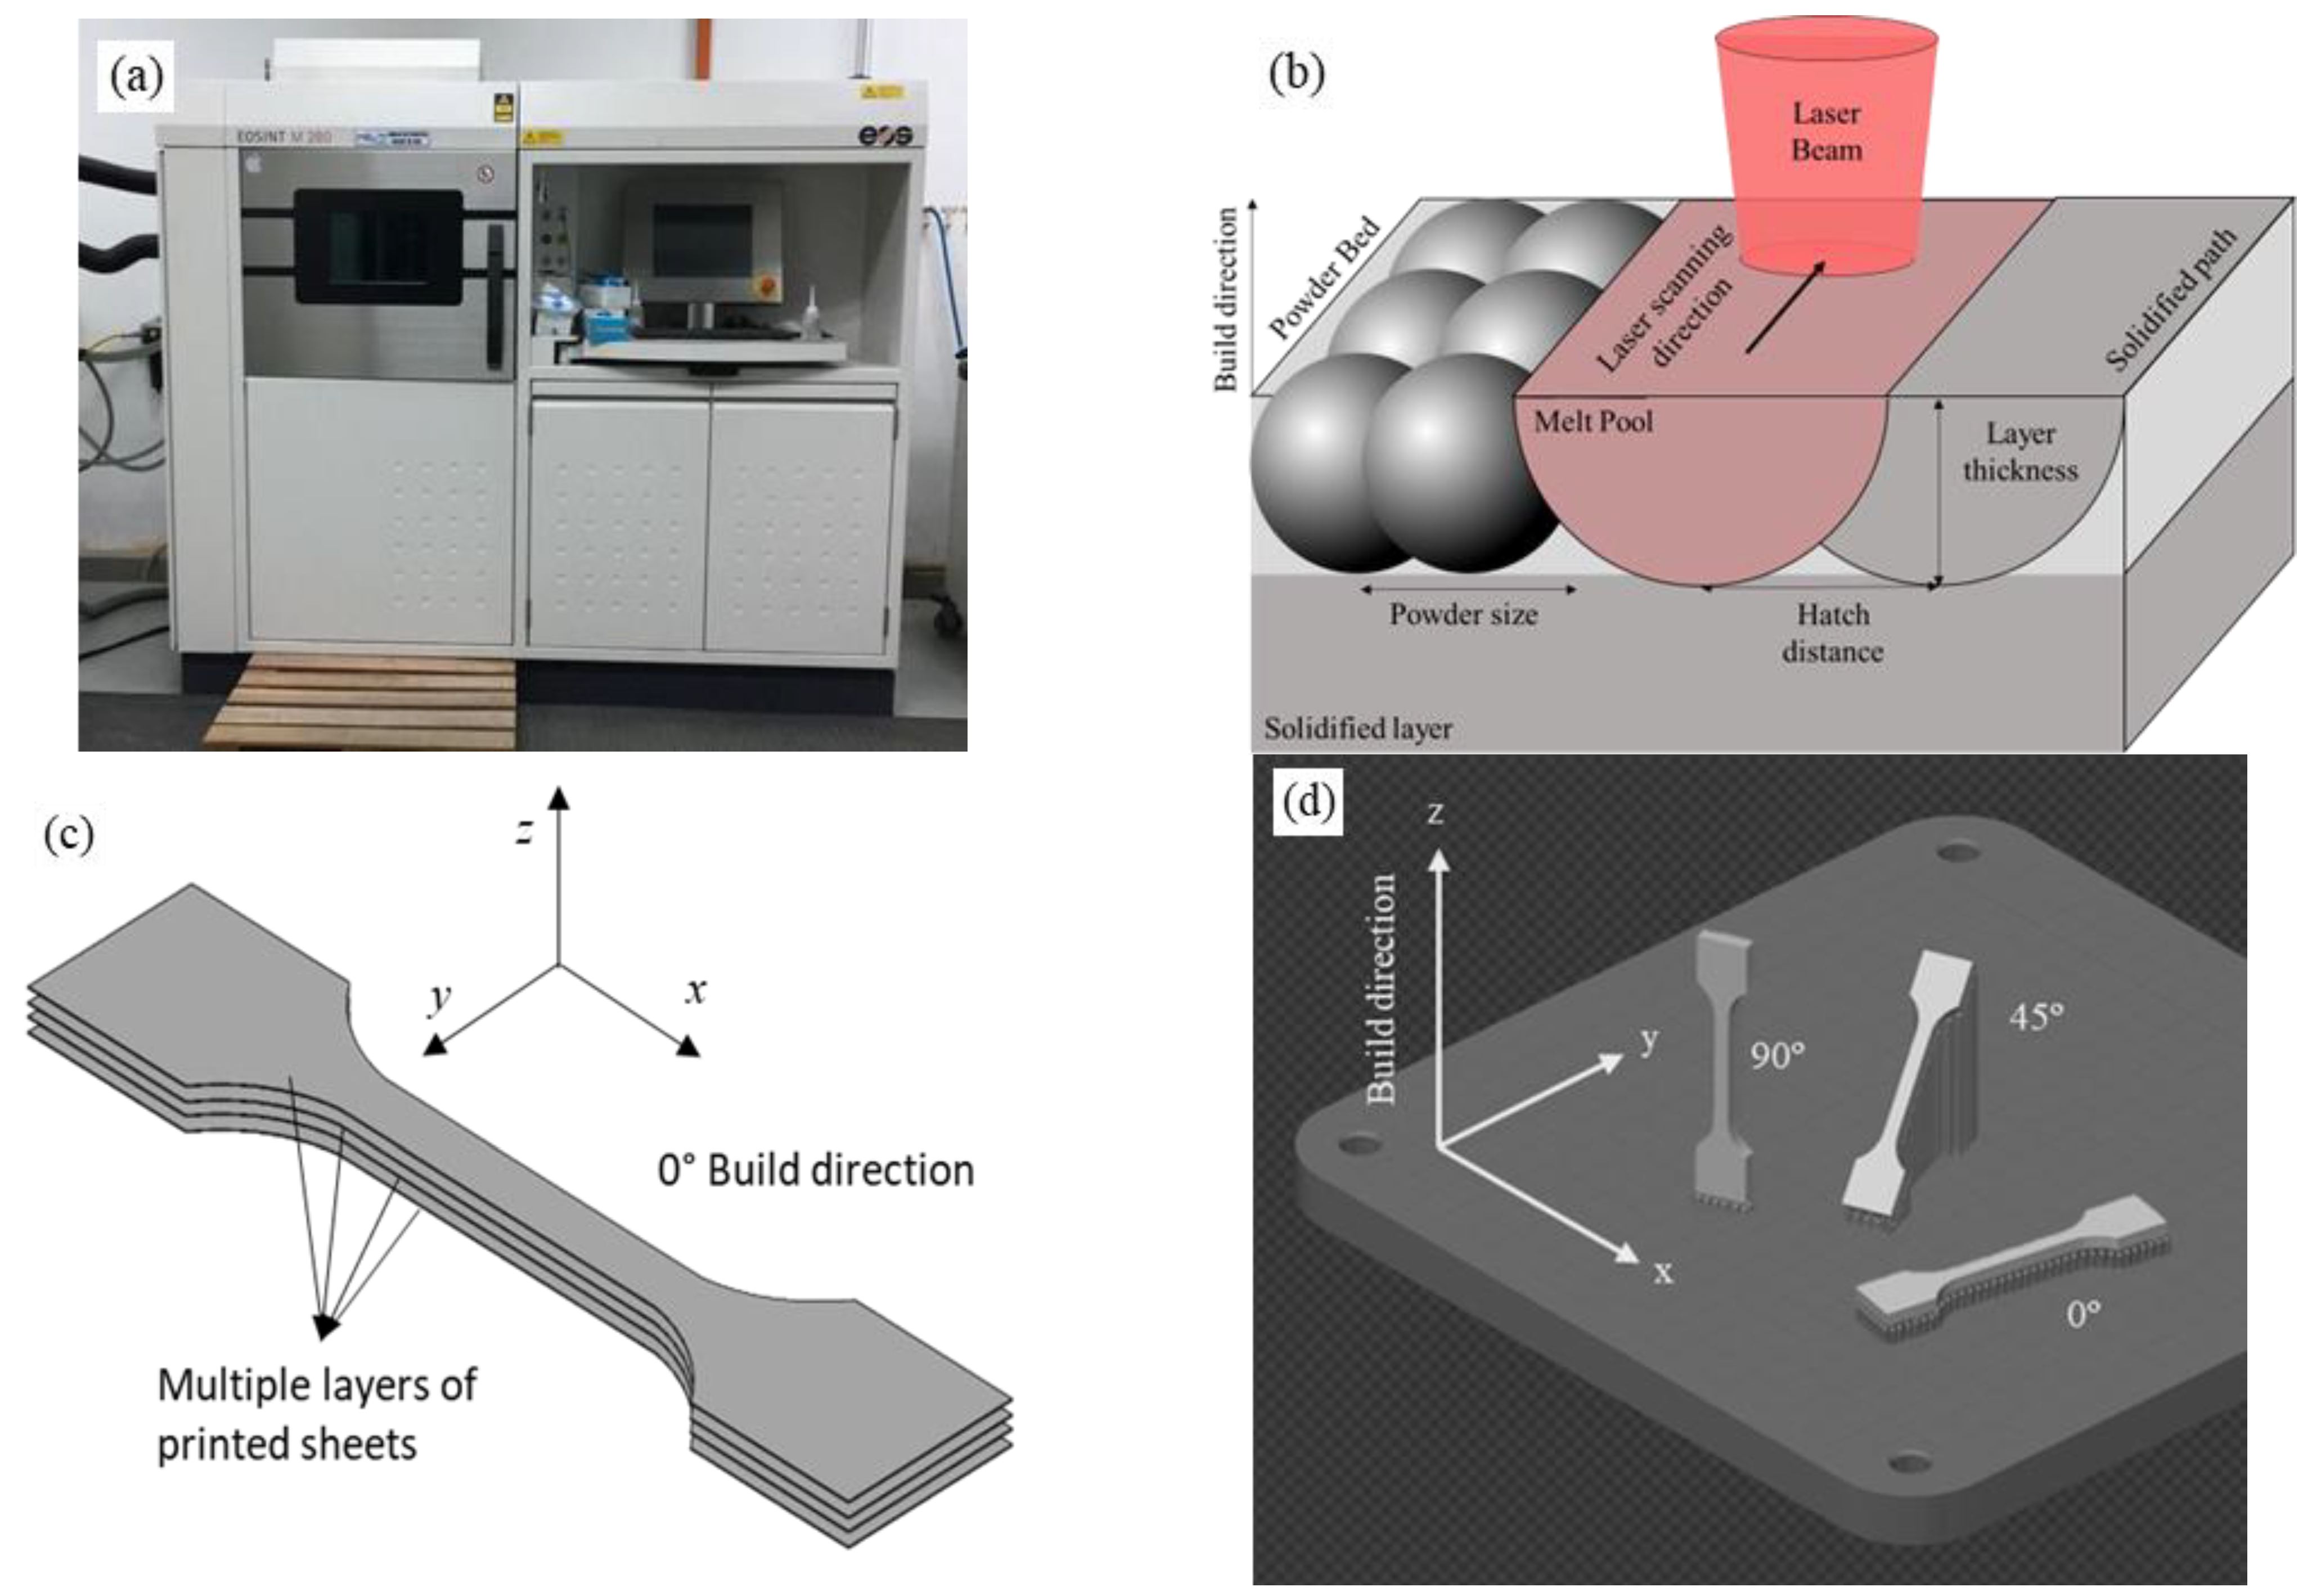
Based on the processing parameter input and the coordinate supplied by slicing software, the SLM process was initiated using the EOSINT machine shown in Figure 2a. Laser scanning was performed in layers in a continuous linear path beside the previous path. Once a layer was completed, the bed was lowered; then, a new layer of powders was spread evenly on the bed. The laser beam was repeatedly applied to powders, as shown in Figure 2b,c. The different build orientations were set to 0°, 45°, and 90°, with respect to the x-axis, as shown in Figure 2d.
X-ray diffraction (XRD) analysis was performed using a Bruker D8 Diffractometer (Bruker AXS, Inc., Billerica, MA, USA) to determine whether or not phases were present, by examining the respective diffraction patterns. The phase was identified according to ASTM E975 [32], where the manufactured 17-4 PH sample was placed in an XRD machine for phase identification of face-centered cubic (FCC) Fe–Ni alloy and body-centered cubic (BCC) Fe–Cr. Continuous scan mode, with a step size of 0.025 degree/0.1 s was used to scan the peaks. The peaks obtained were identified using JCPDS-ICDD-Card No. 33-397 for gamma and 34-396 for alpha [33]. The peaks of the graphs showed that the volume fraction was generated by the software according to Equation (2), obtained from the SAE manual [34].
V M = 1 ɳ M 0 ɳ ( I M h k l R M h k l ) 1 ɳ A 0 ɳ ( I A h k l R A h k l ) + 1 ɳ M 0 ɳ ( I M h k l R M h k l ) + V C
Microstructure and porosity were observed by optical microscopy LEICA DMI 5000 M (Leica Microsystems, Wetzlar, Germany) and scanning electron microscopy. Cube samples were mounted in Bakelite before grinding with different grits of abrasive papers, including 400, 600, 800, and 1200 grit, followed by polishing using a 1-micron diamond polishing suspension. The surface microstructure of the 17-4 PH was revealed using Adler’s etchant, consisting of ferric chloride, copper ammonium chloride, hydrochloric acid, and distilled water, for five seconds [35,36].
The Micro Vickers Hardness test was conducted using a ZHVμ model (Zwick GmbH & Co. KG, Ulm, Germany), according to ISO 6507/ASTM E384. The samples were polished, and three-by-three point- loads were measured on the surface, yielding nine hardness points. The load was 0.5 kg with a dwell time of 15 s. After the surface was indented, the hardness value was measured using the Vickers Equation (3):
H V = ( d 1 + d 2 2 ) 2
Tensile tests were performed to investigate the mechanical properties. The 17-4 PH was printed in a dog bone shape, as per ASTM E8. The specimen was tested using the Zwick-Roell Universal testing machine, Z100, with a maximum capacity of 100 kN. The thickness and width were 3.5 and 4 mm, respectively. A preload was applied at 10 N, with a crosshead speed input of 1.5 mm/min, based on the length of gauge and strain rate, as per standard. The stress–strain curve was generated for further analysis. The experiment for all samples was repeated three times and the average value was presented. Fractography analysis was performed using SEM for the fractured surface.

3. Results and Discussion

3.1. Powder and Phase Profiling

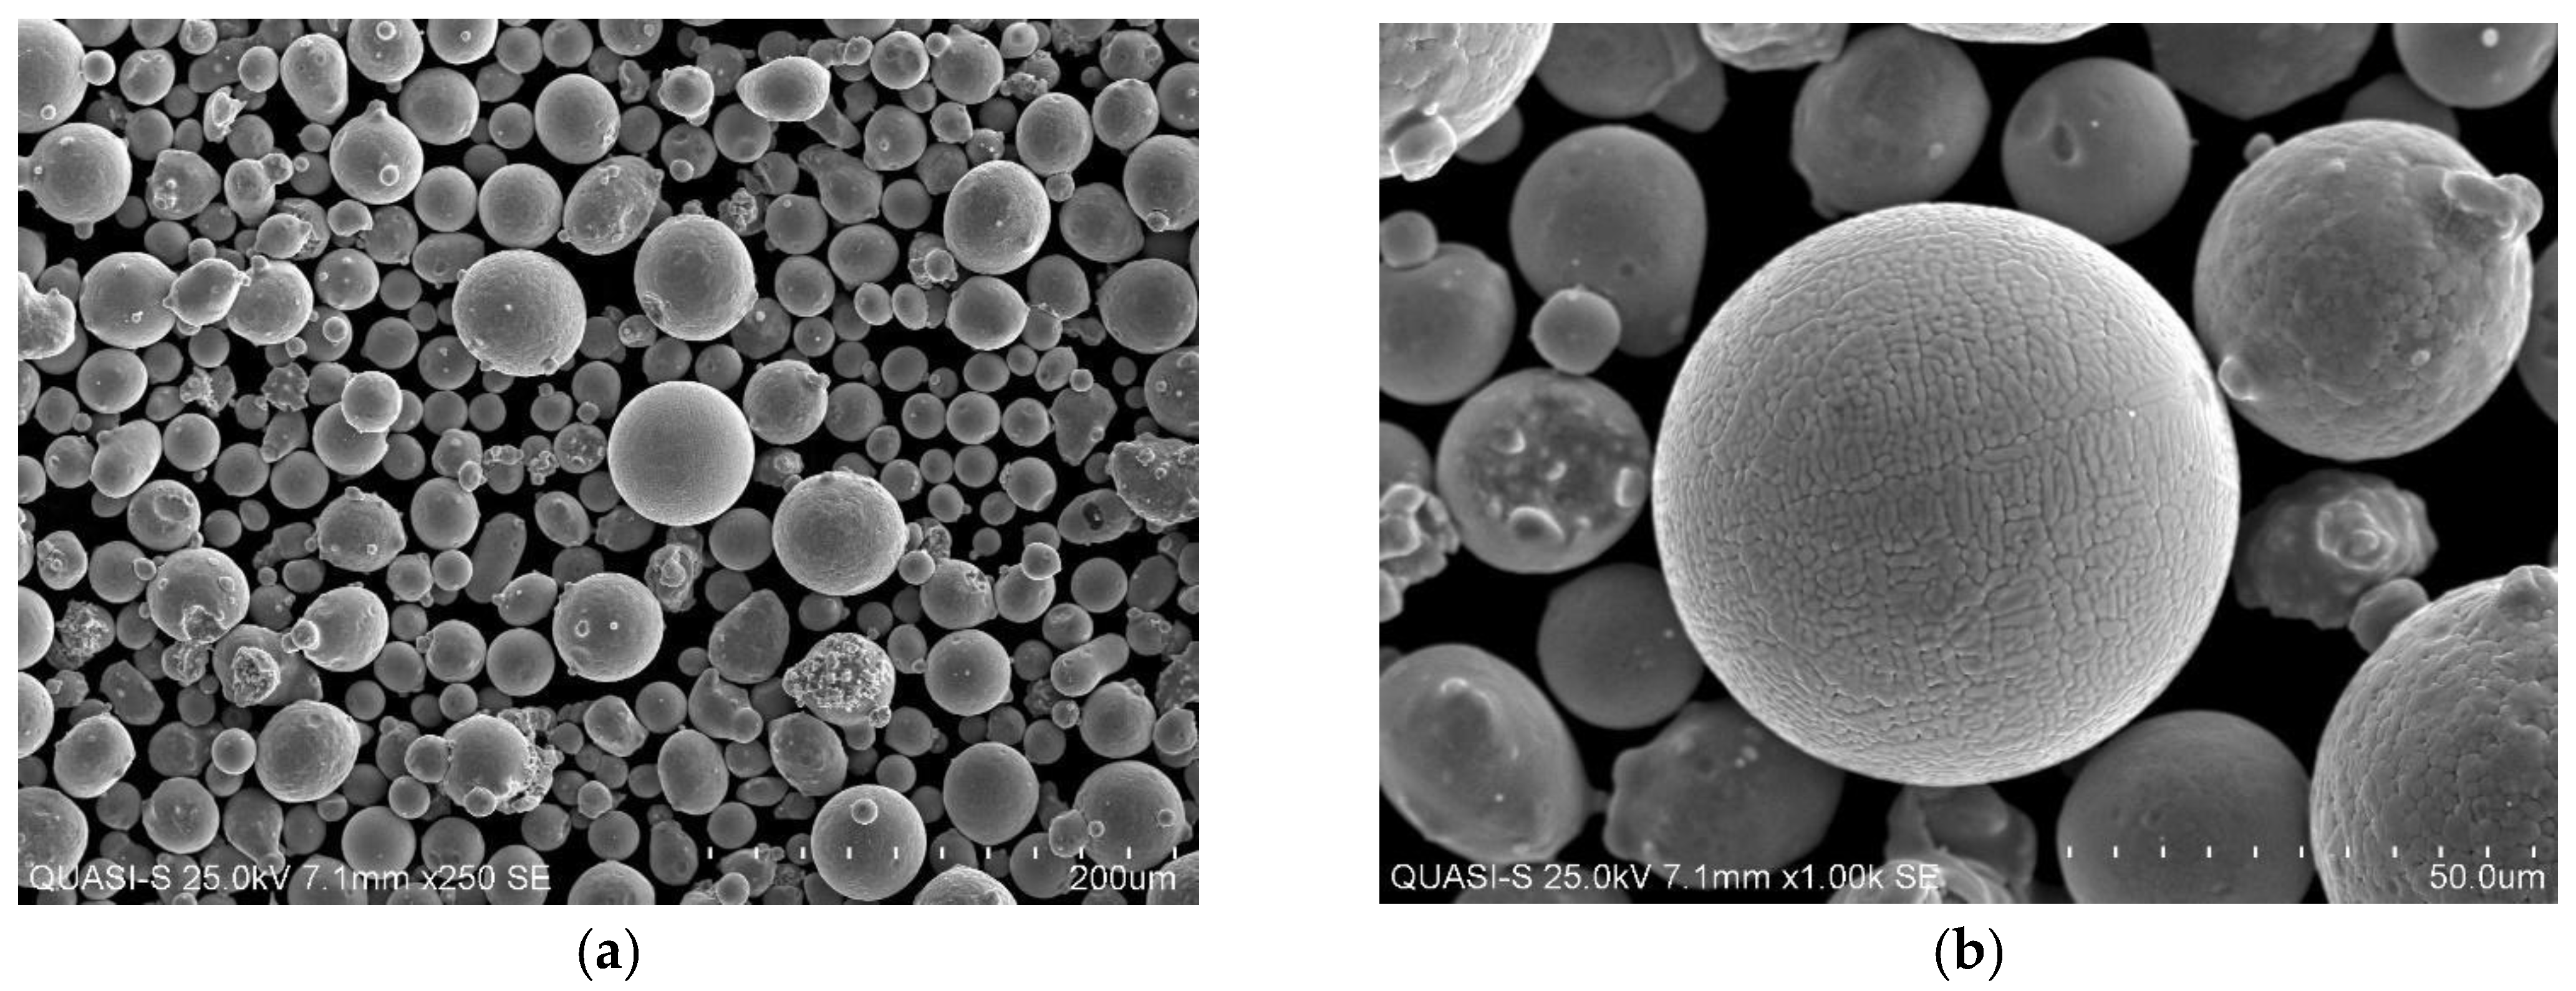
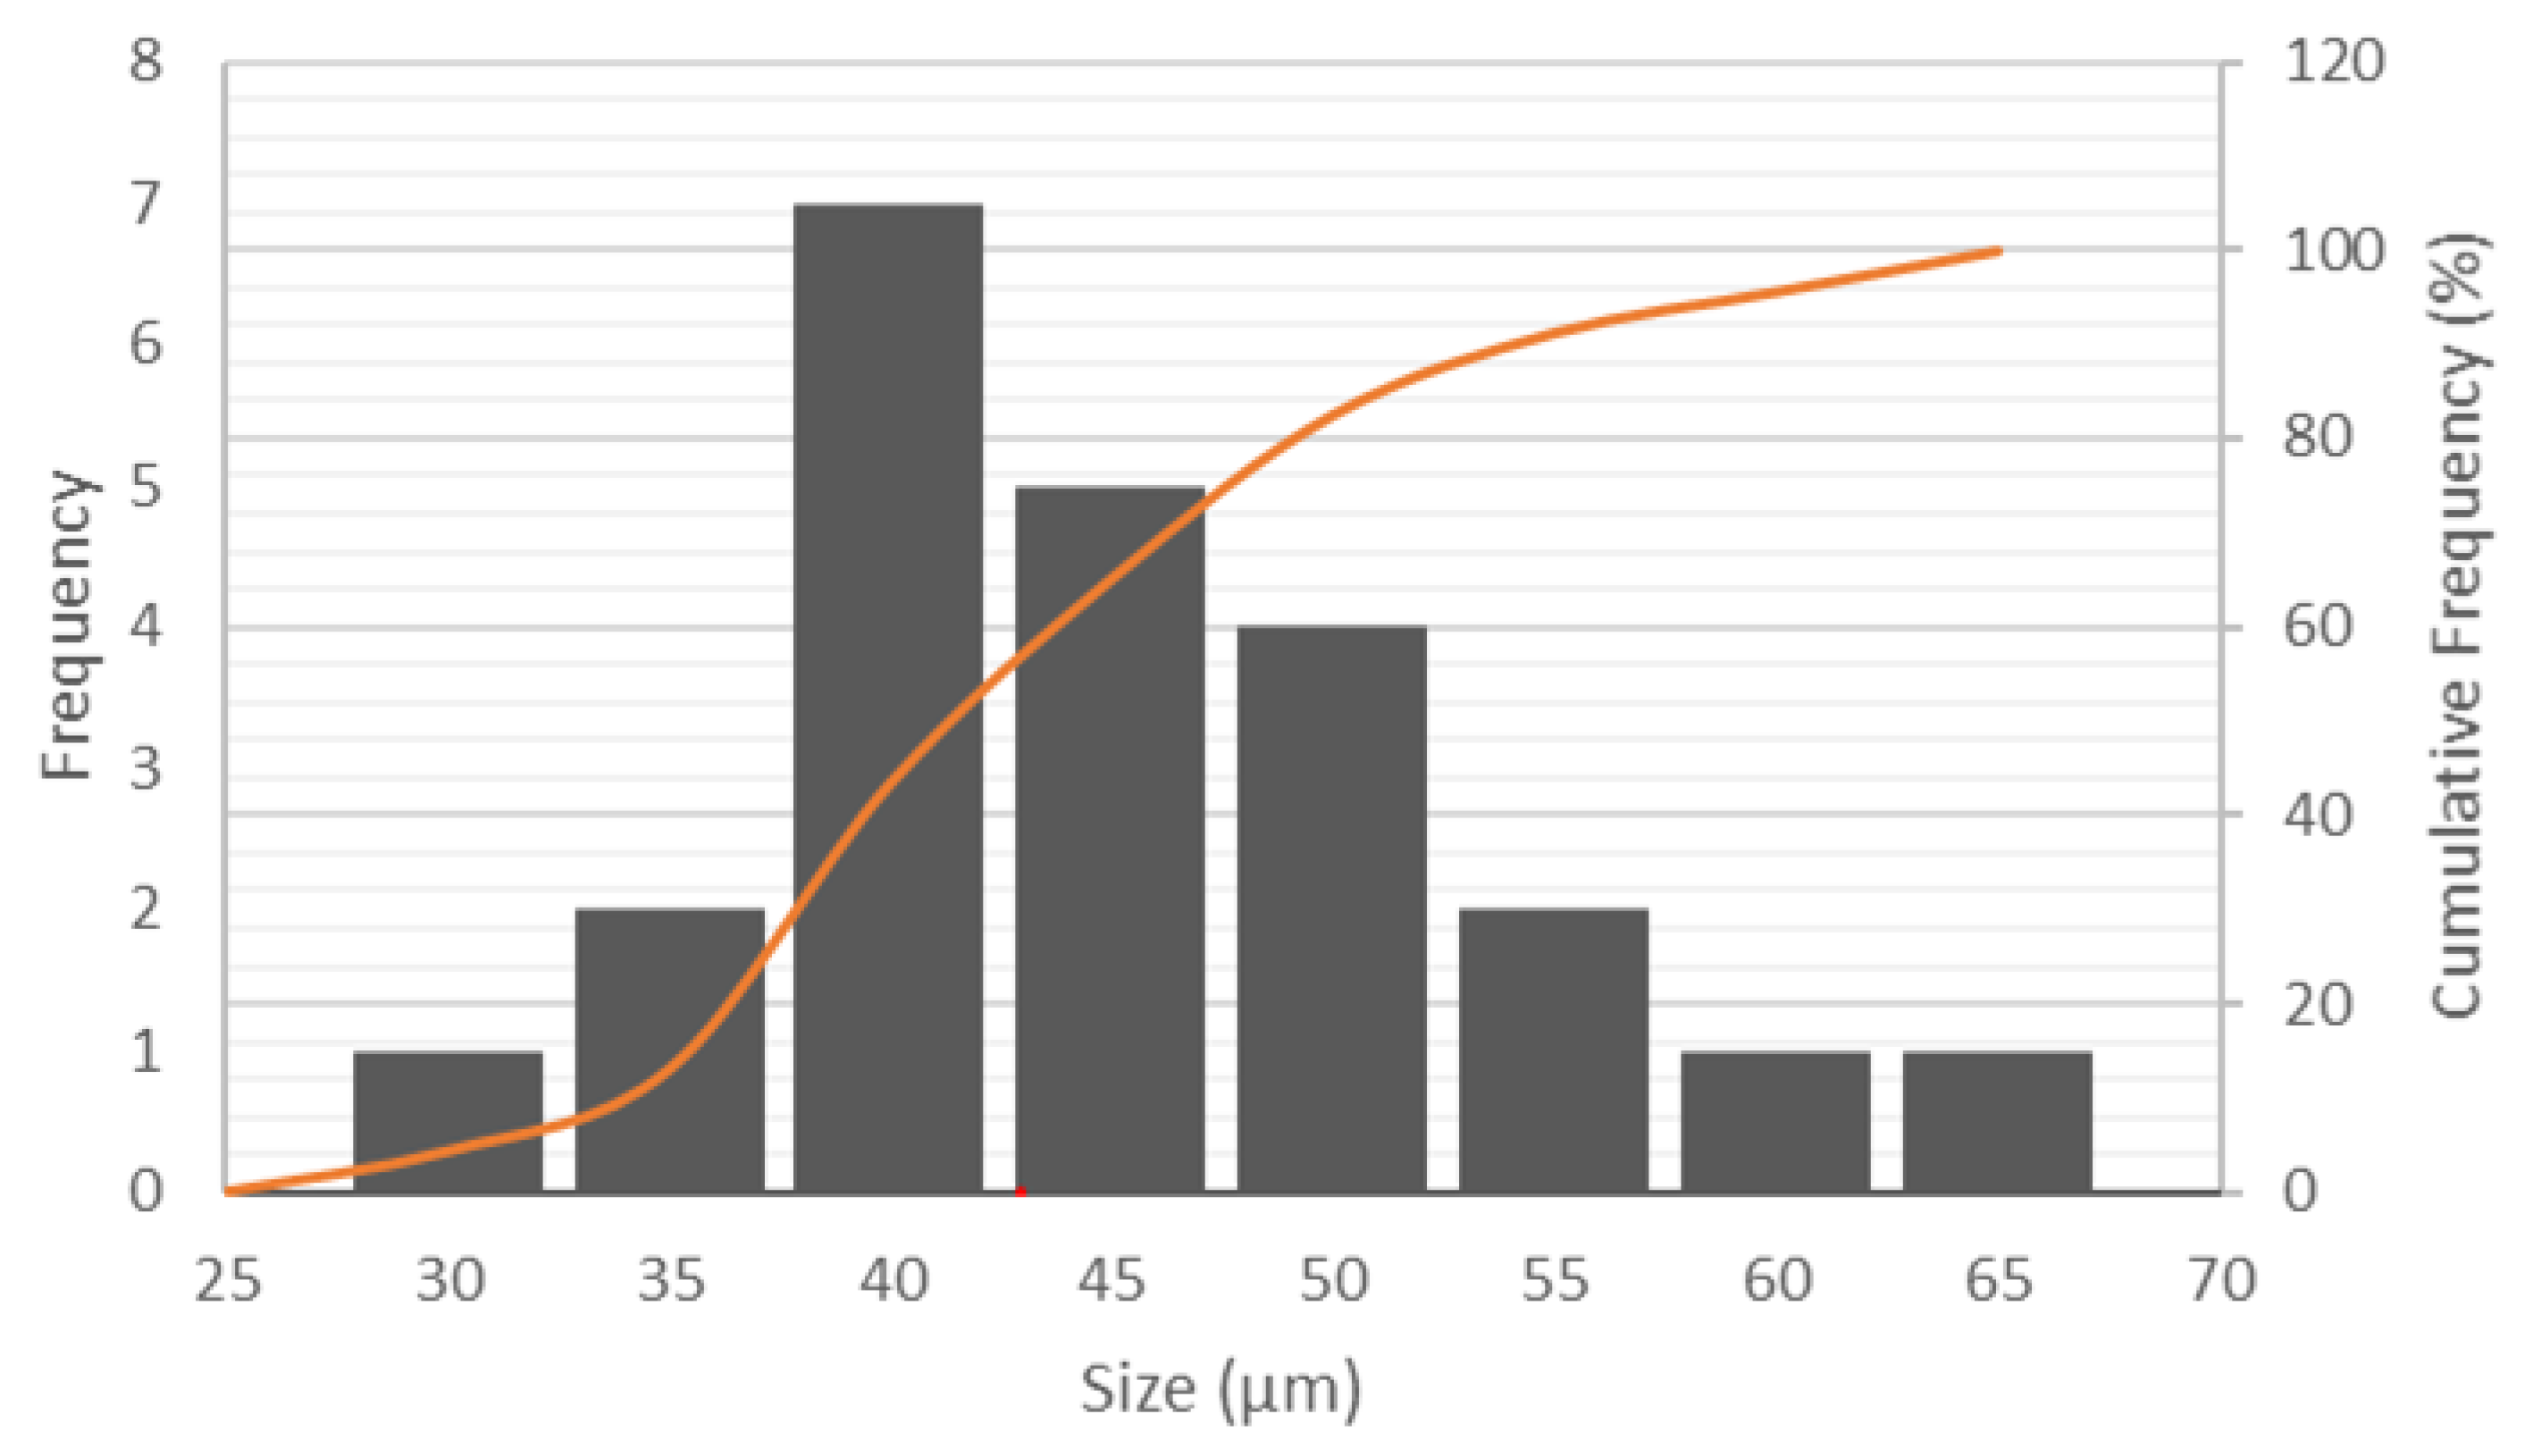
The chemical composition of SS 17-4 extracted from EDX is listed in Table 2. The analyzed composition fell in the range specified by the ASTM A240M [37]. Figure 3 shows the powder morphology with spherical shapes in various sizes. Size distribution was concluded from particle analysis with a strong agreement with research by Irrinki et al., as shown in Figure 4, where the mean size of particle D50 = 43 μm [38].
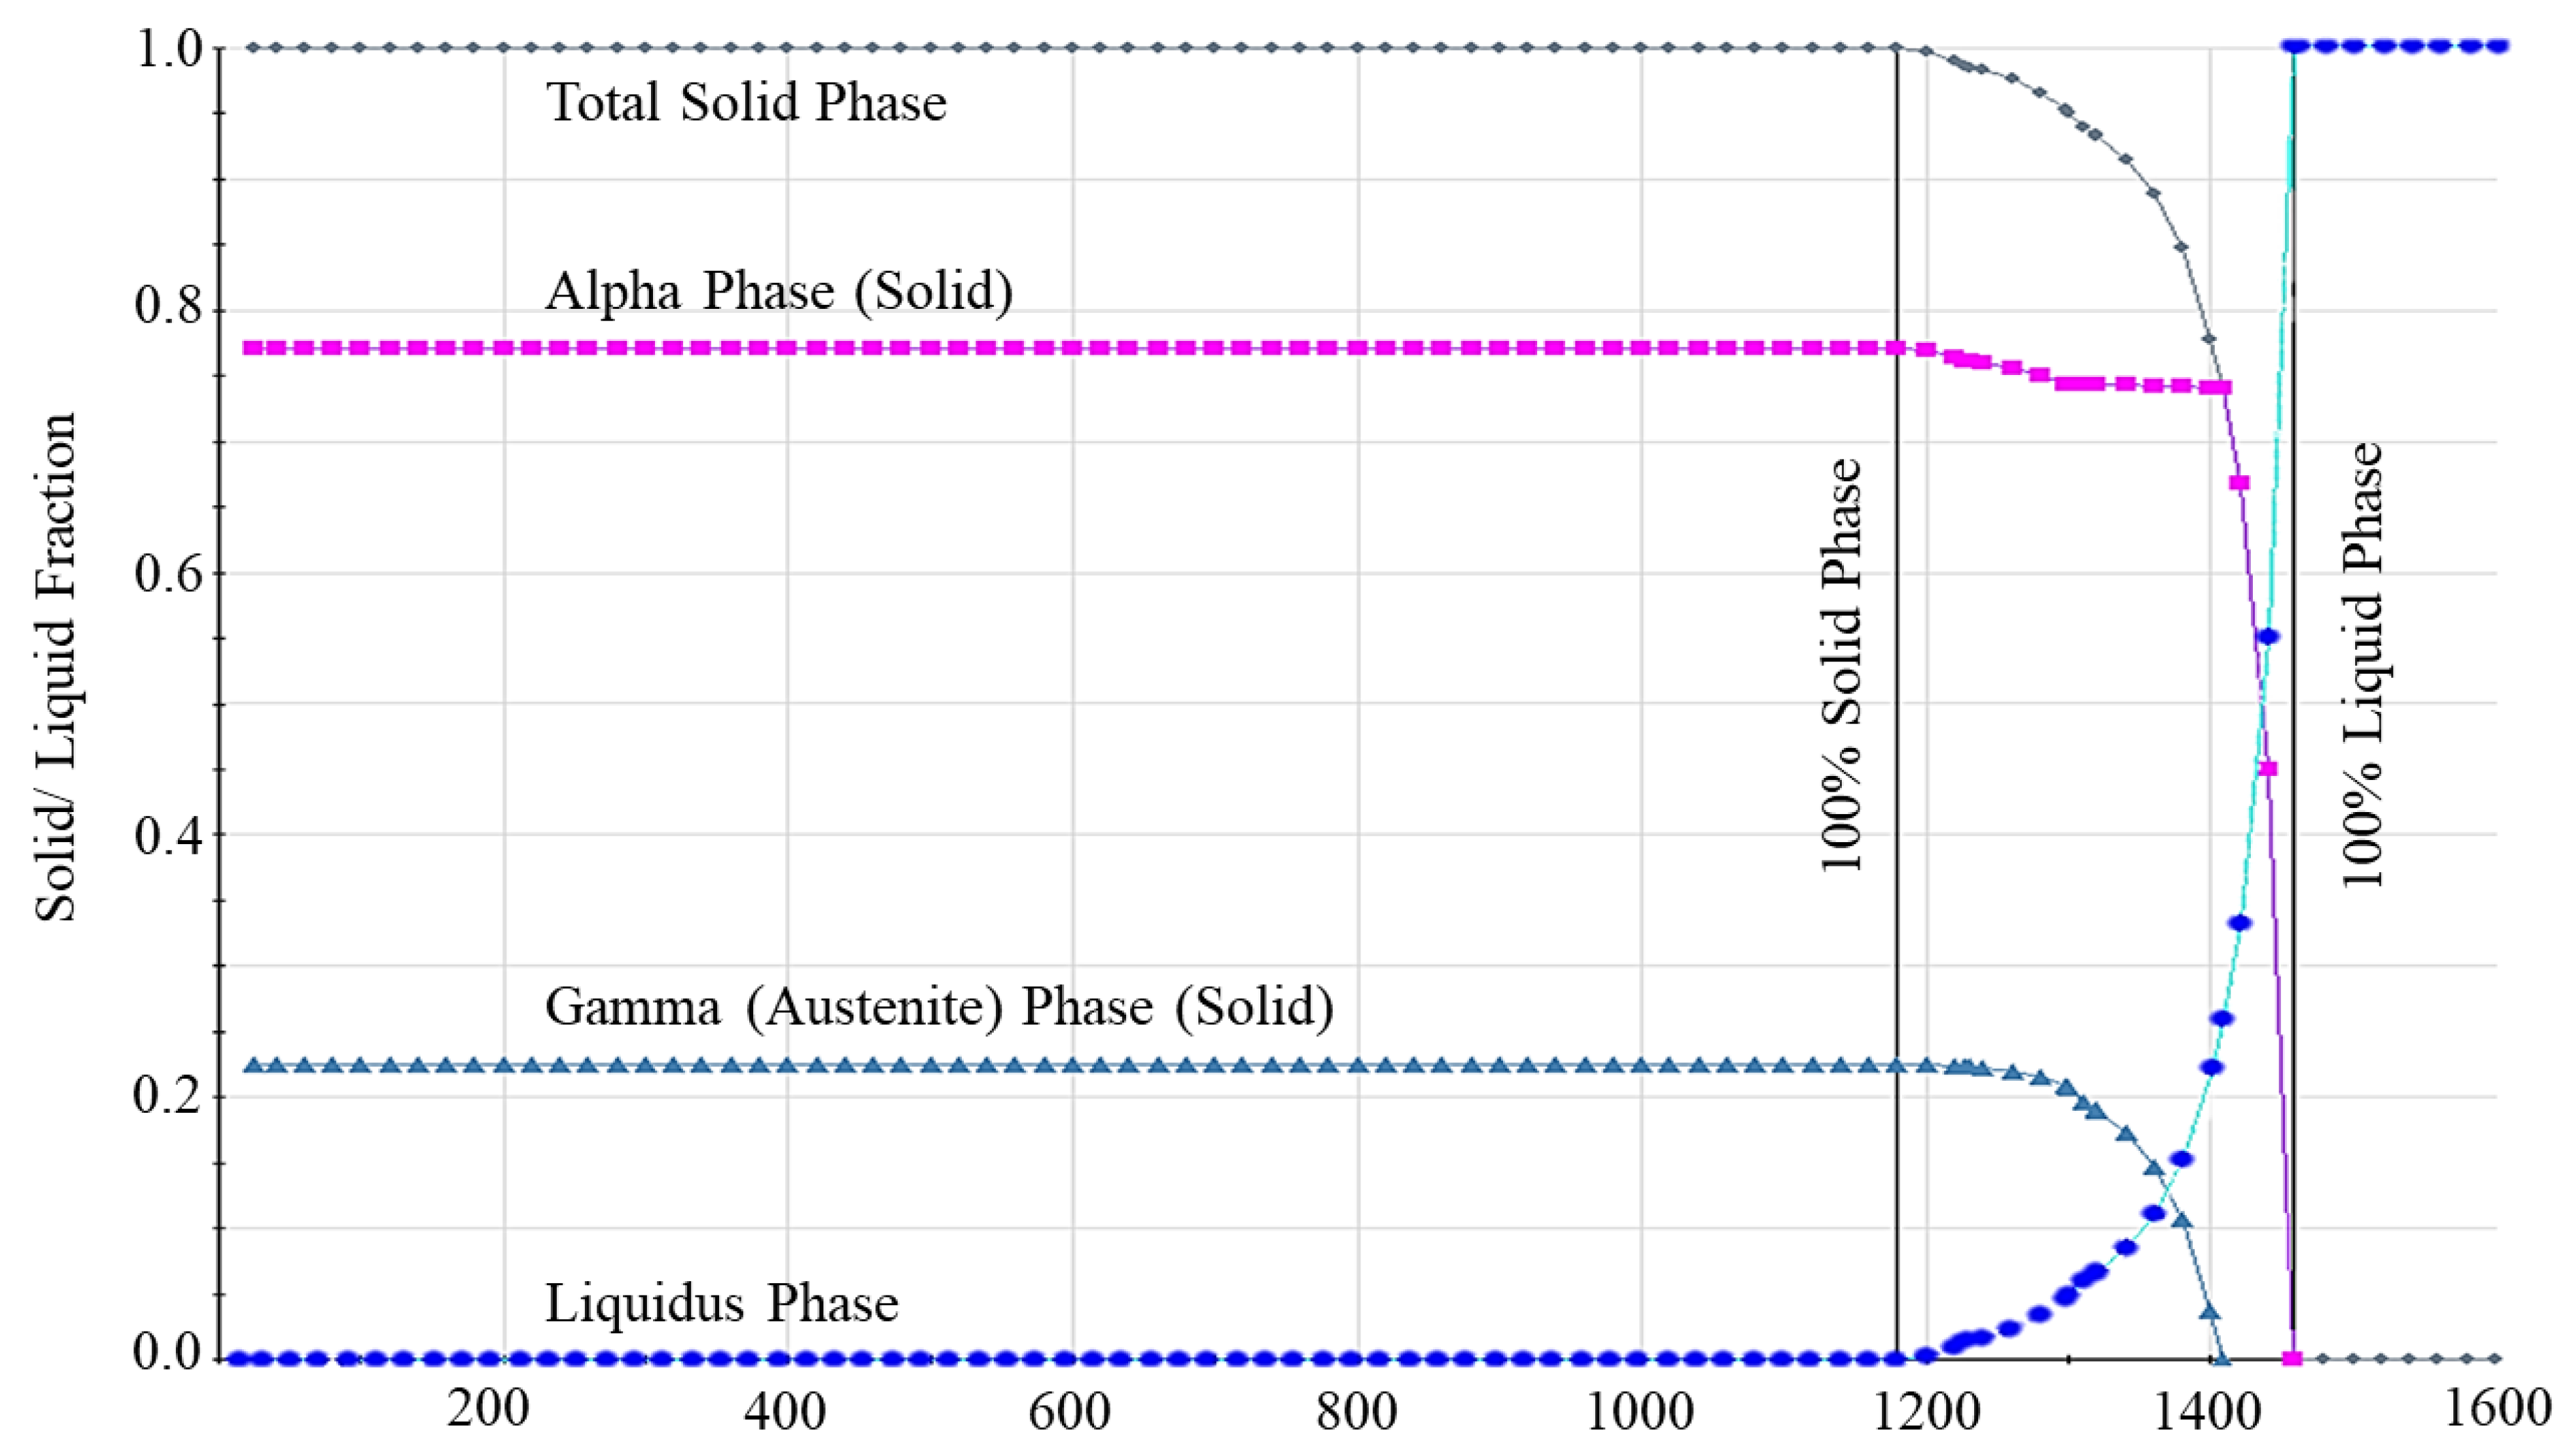
The solidification of 17-4 PH eventually generated mainly two types of phases, the FCC phase, known as austenite, and the BCC phase, which could be either ferrite or martensite, given the thermal history of the material. Conventionally, solid-state transformation for 17-4 PH begins with ferrite, followed by austenite, and, finally, martensite formation. During the SLM process, the non-equilibrium microstructure is generated due to large cooling rates of up to 105–106 K/s in a single melt pool, resulting in the formation of a non-equilibrium and metastable phase. A portion of austenite is transformed to martensite, due to rapid cooling [39]. Even though the cooling rate of SLM is sufficiently high to form complete martensite, the reheating generated from the neighboring region slows down cooling and retains more austenite content. The volume of austenite transformed to martensite, compared with that of retained austenite, varies, based on the thermal profile of each process [40]. The evolution of the phases in the material can be tentatively yielded from JMatPro with the input of chemical composition. Therefore, ferrite indicated in JMatPro cannot specifically identify the difference between ferrite and martensite because they have the same structural center cubic body. Subsequent analysis from optical microscopy confirmed that the martensite phase existed. Figure 5 shows the fraction of liquid phase for 17-4 PH. The graph indicates that, during solidification, the liquidus line ended at T = 1200 °C. Prior to this condition, a small percentage of solidus existed at 1450 °C, resulting from alpha phase nucleation, suspected to be ferrite. The ferrite began nucleation, followed by austenite, at a temperature of 1400 °C. With rapid cooling effects, austenite transformed into martensite. From this point onwards, both phases emerged in fully solidified condition at 1200 °C. The final volume fraction showed that 17-4 PH had 22% austenite gamma, and 78% alpha, phases.
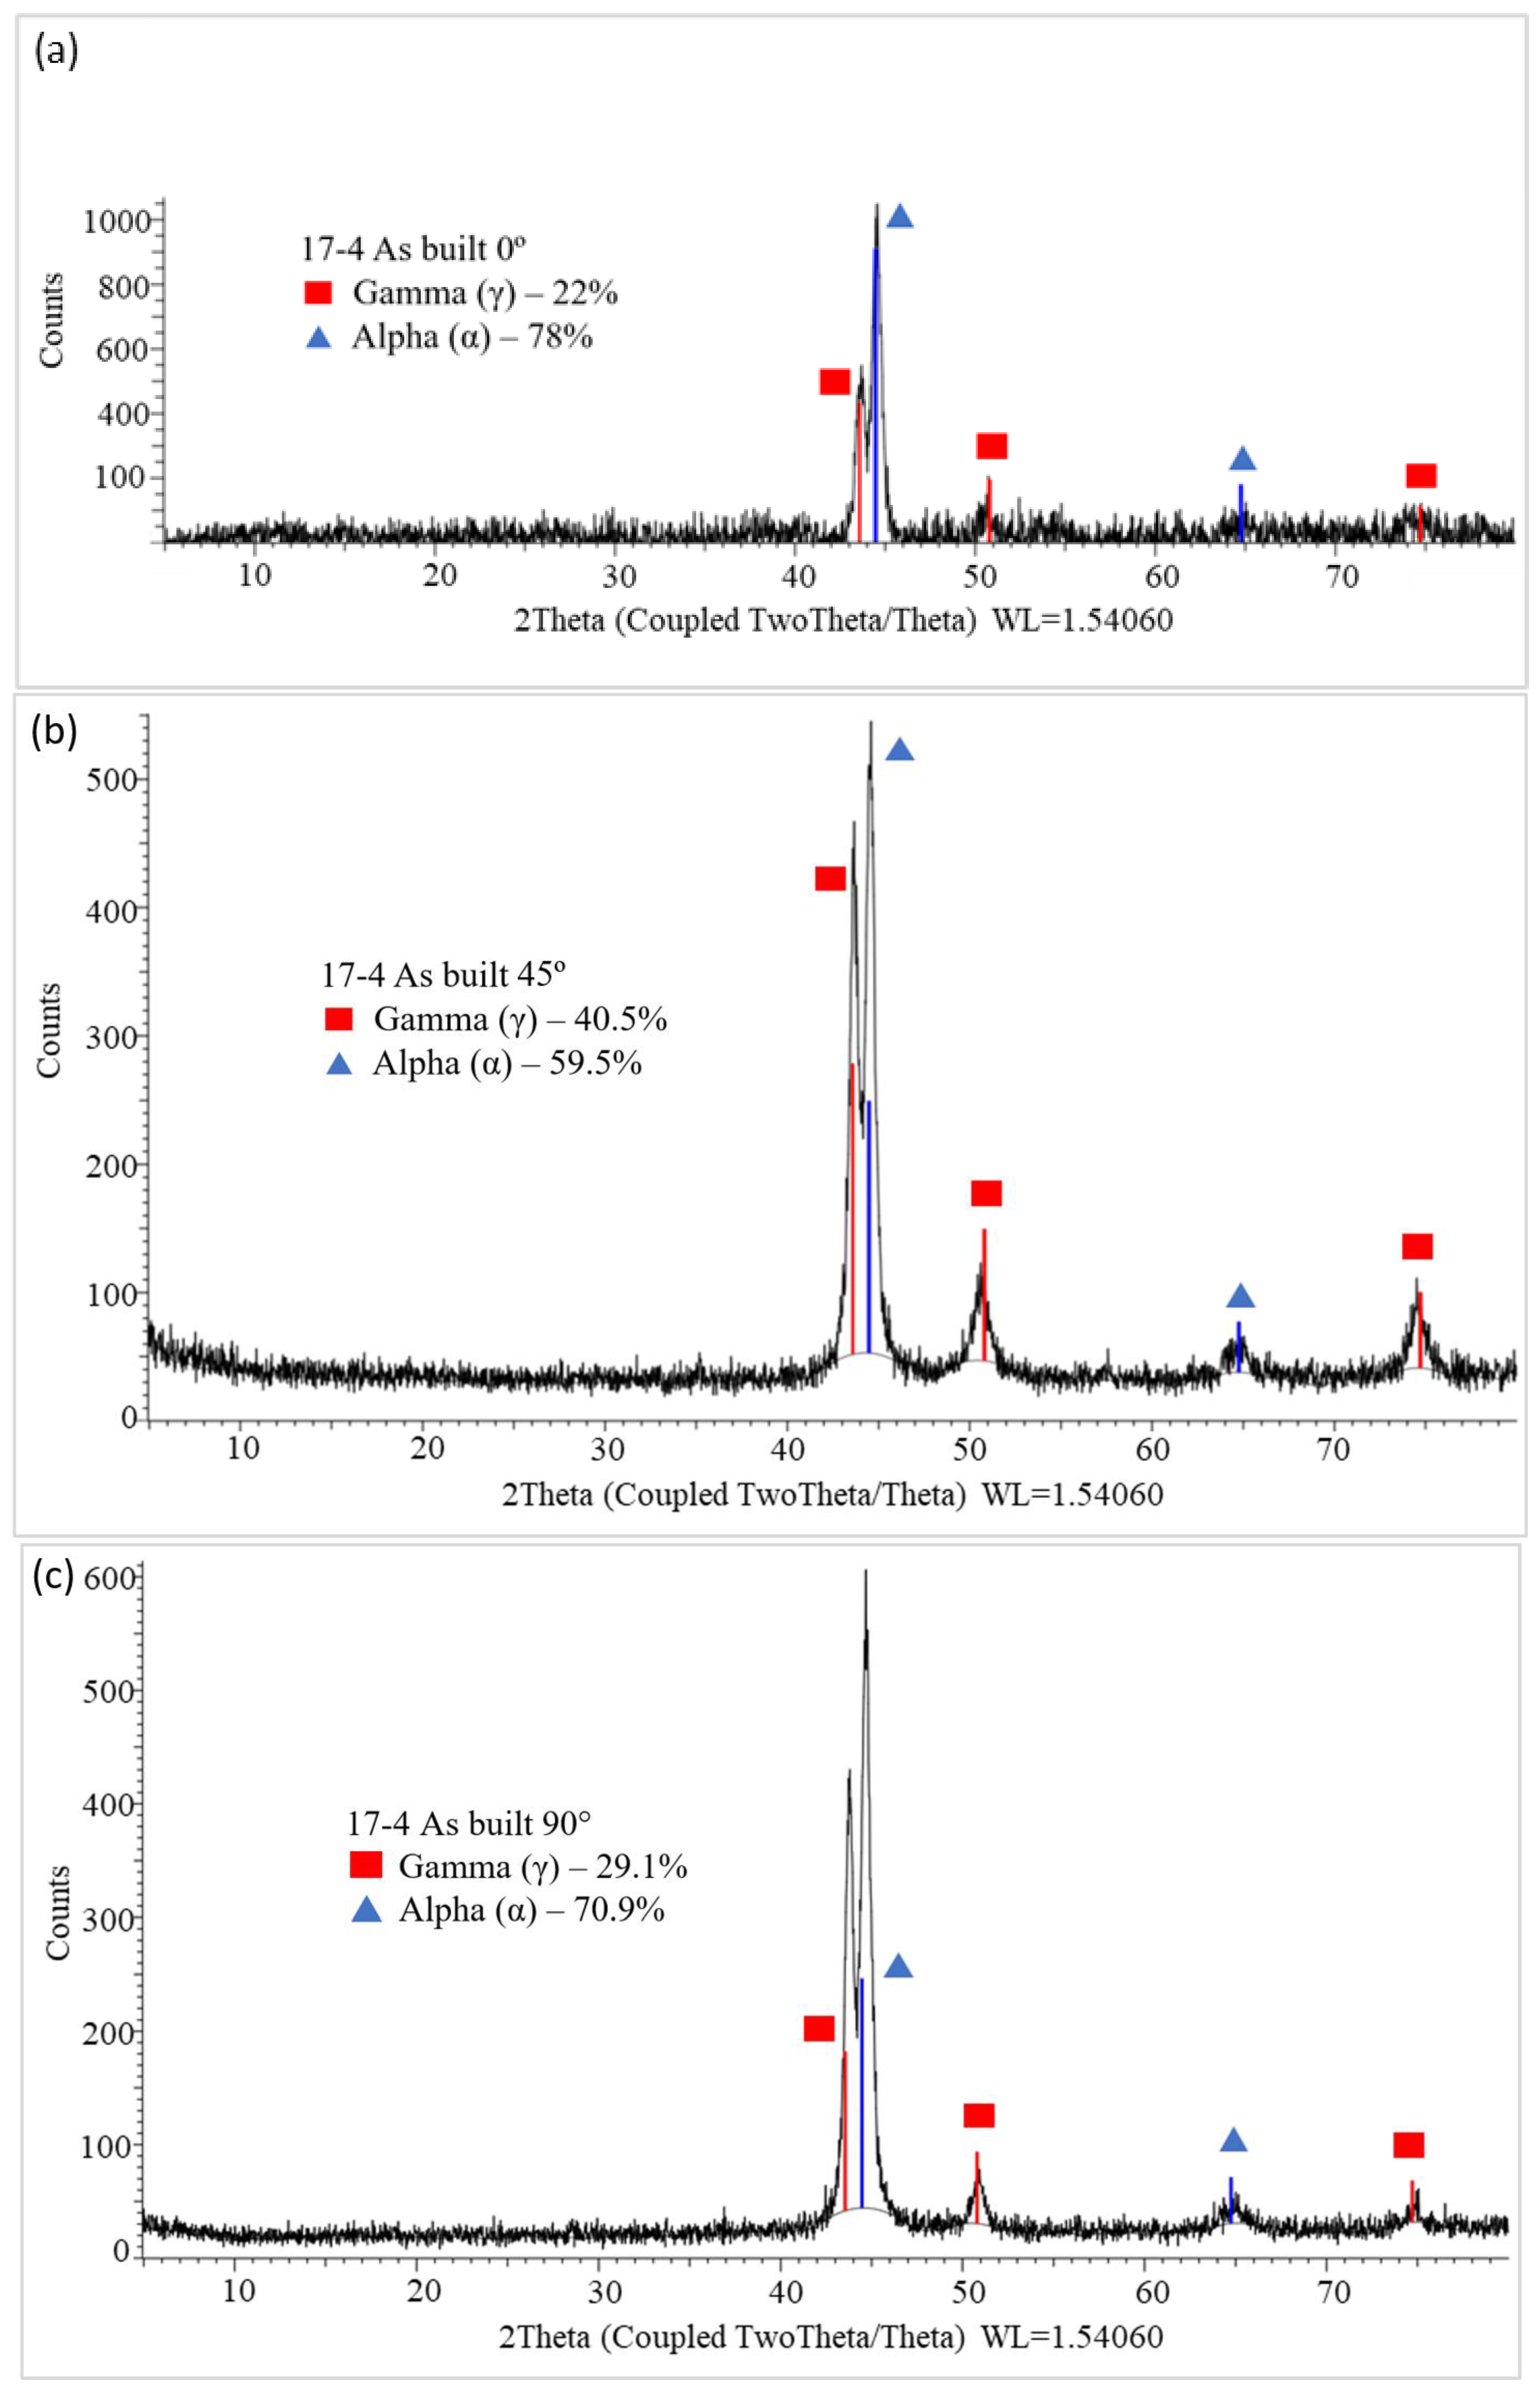
The contents of both phases were analyzed using XRD analysis for two build directions of 0° and 90°. The peaks were analyzed using the Rietveld method to calculate each phase’s volume fraction. The volume for both directions was different with 22.0% austenite, compared with 78.0% alpha phase, for 0° build, and 29.1% austenite, compared with 70.9% alpha phase, for 90°, as shown in Figure 6. The result for 0° aligned with thermophysical properties generated by JMatPro at 90° was slightly offset with more retained austenite content. The higher percentage of austenite at 90° could be attributed to the sample base area. The martensite start temperature (Ms) and martensite stop temperature (Mf) for stainless steel shifted to much lower values than for standard metal. For 17-4 steel, martensite formation started from Ms = 132 °C and completed at Mf = 32 °C [13,40]. Based on the chemical composition, the martensite start temperature Ms could be calculated using the classic Equation (4) by Andrew [41], as follows:
M s ( ° C ) = 539 423 ( % C ) 30.4 ( % M n ) 17.7   ( % N i ) 12.1 ( % C r ) 7.5   ( % M o ) 11.0 ( % Si )
During the process of melting and cooling of the first layer, the amount of martensite and retained austenite is the same because the rate of conversion from austenite to martensite depends only on the chemical composition of the powder. However, during the melting and cooling of the second layer, the amount of retained austenite begins to deviate for both orientations, given that some retained austenite content is converted to martensite upon reheating of new layers above and subsequent cooling. The higher cooling rate further reduces the retained austenite and produces martensite. In this case, 90° had more retained austenite, indicating a lower cooling rate. The surface area of layers for 90° was smaller than for 0°, leading to a similar point on the x–y plane exposed to a laser beam of the upper layers. The frequency of the upper layer melting retarded the cooling rate of the 90° specimen and retained the austenitic phase. At 0° there was more martensite, indicating a higher cooling rate than at 90°.
The parts were fabricated by layers with a maximum of 30 μm for each layer, with atmospheric temperature maintained at 40 °C, which was slightly higher than Mf, to reduce the thermal stress effect. Hence, the delay in cooling to room temperature resulted in retained formation of austenite at room temperature, as identified by the XRD test.

3.2. Microstructure Profiling and Hardness Test

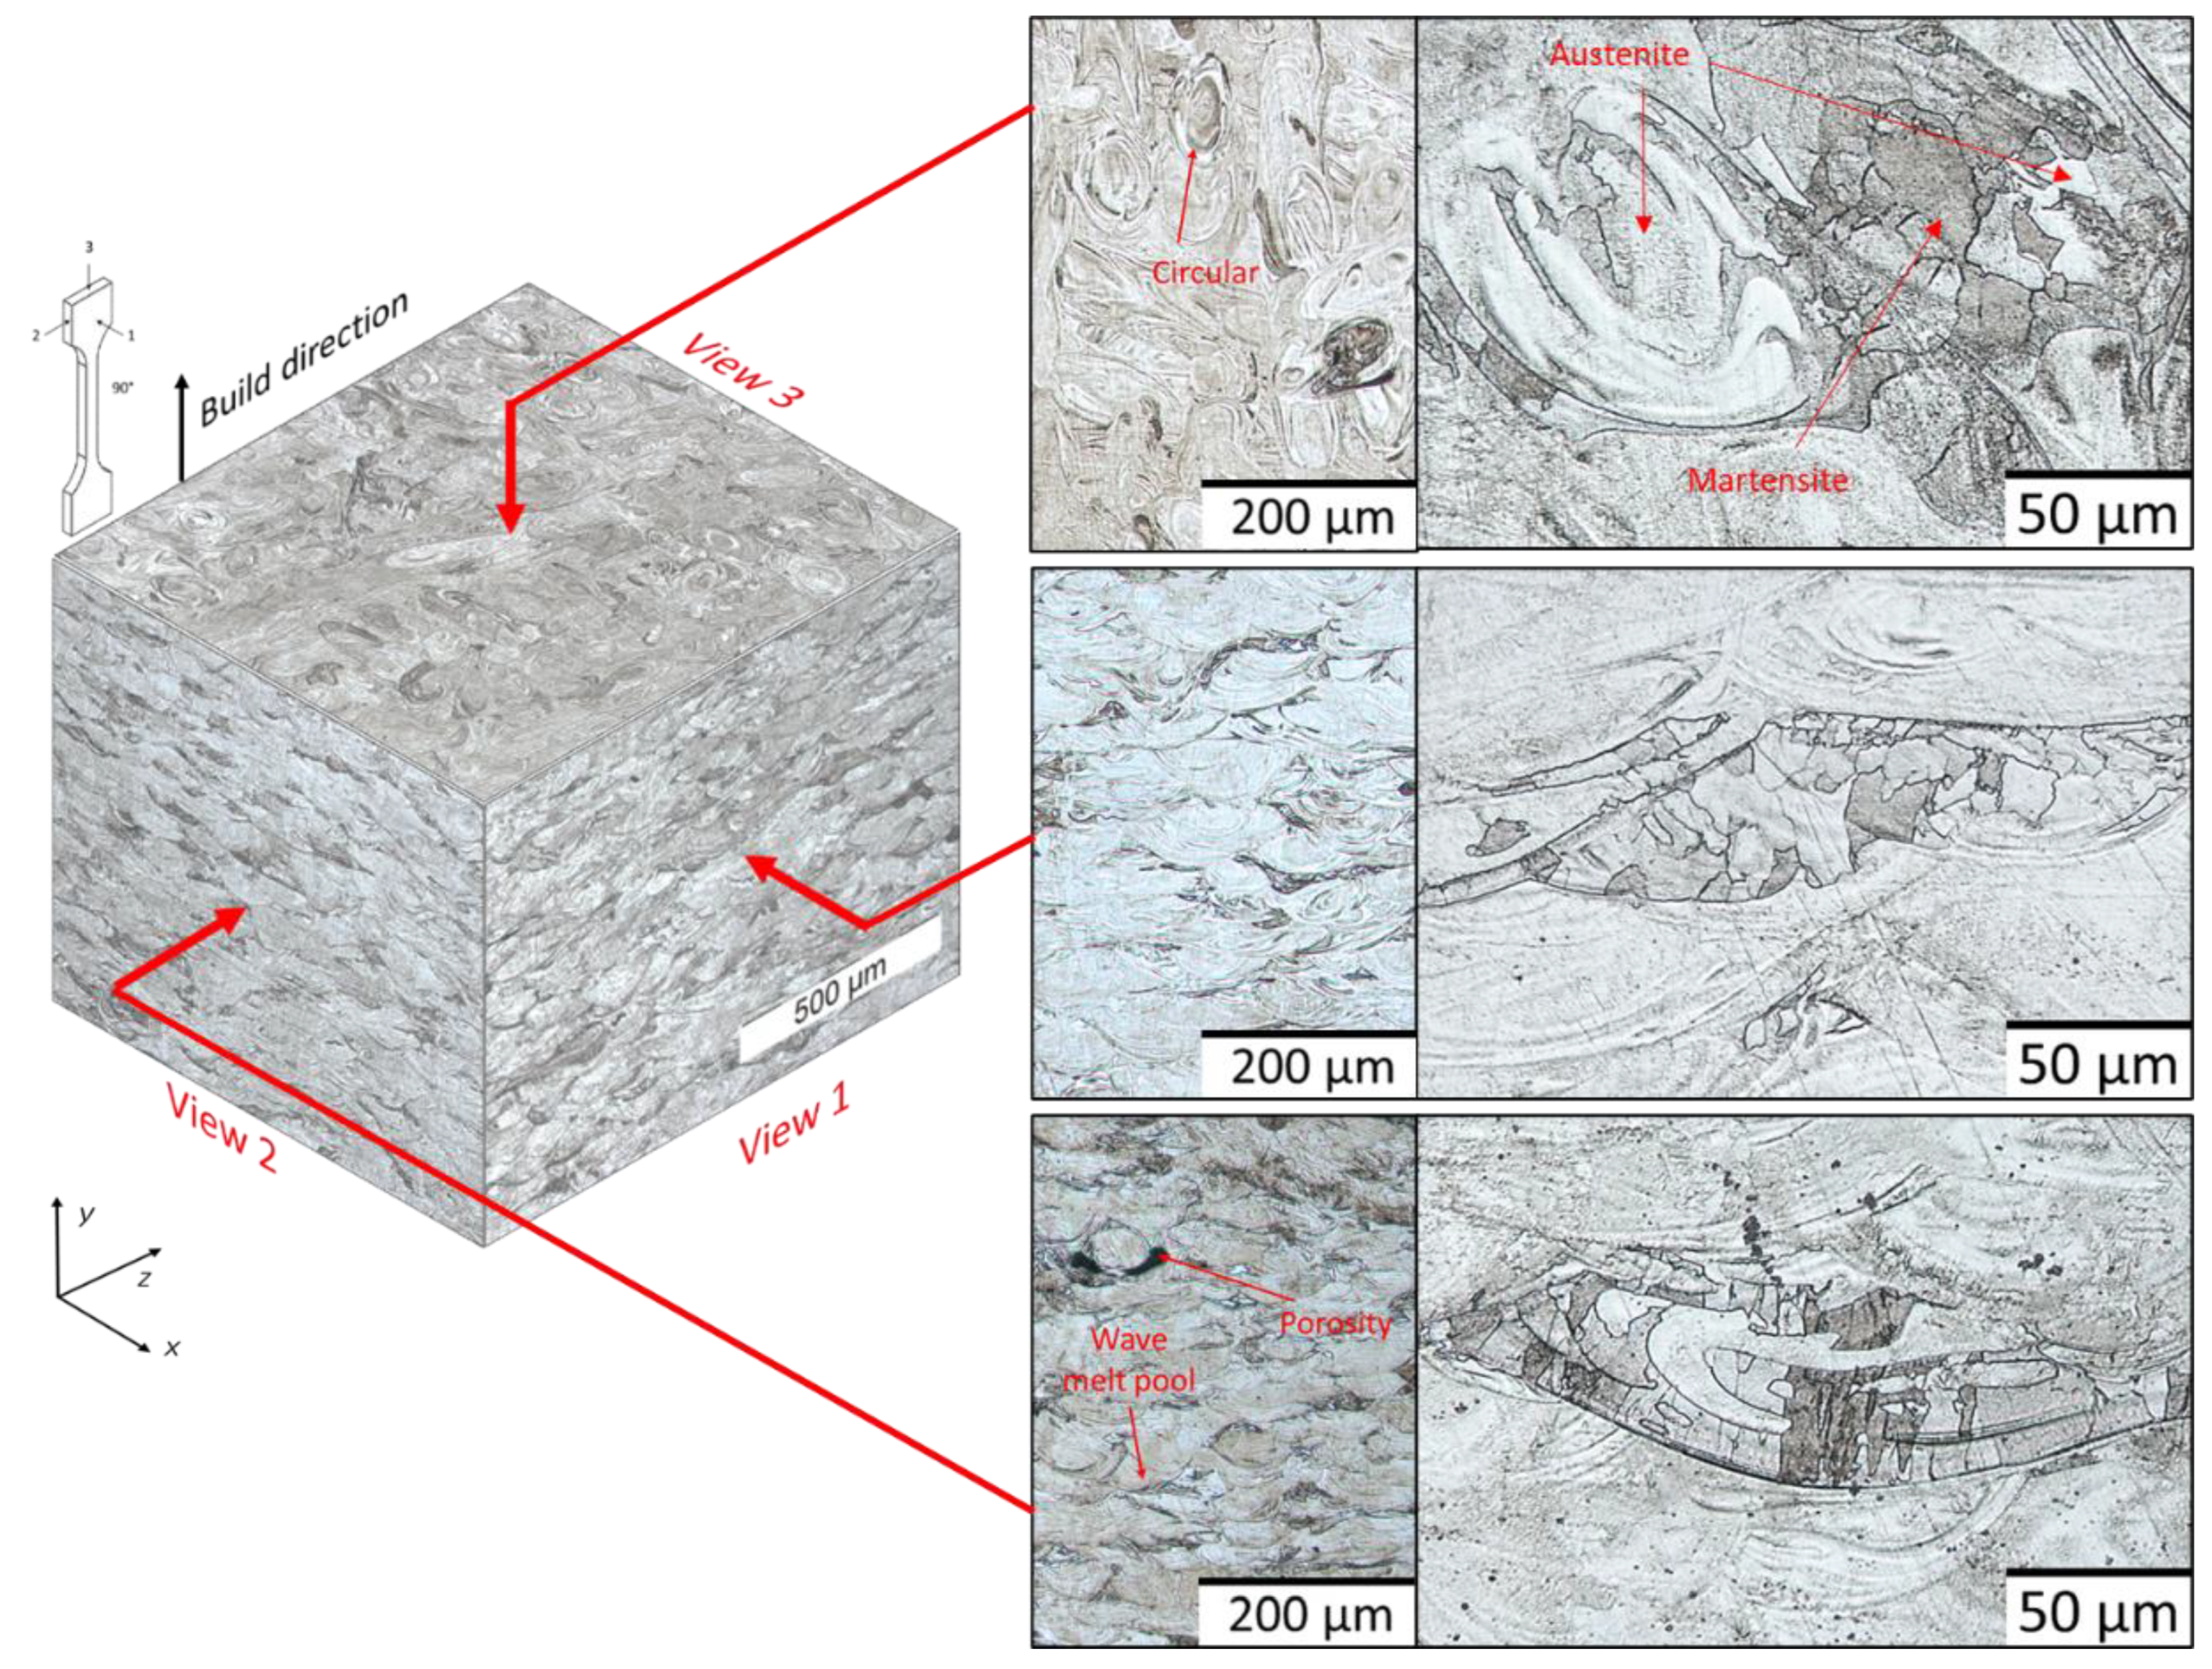
In this section, the microstructures were observed to differentiate between the effect of build directions 0°, 45°, and 90°. The profiles were viewed from three directions of the sample. The view from the y-direction is known as the build direction, and from the transverse direction the view is either from the x or z-direction. At 0°, by observing view 1, the build direction in Figure 7 had a distinct circular pattern. This finding was due to the hemispherical shape of the melt pool; when viewed from the top, only the round shape was revealed. Observation by higher magnification for view 1 revealed that the circular pattern consisted of a few shades of dark to bright. Within the circular pattern, the regions of the same grain orientation had the same shade of darkness, and a solid back region defined the porosity on the surface, as shown in the top right corner.
For the transverse direction (view 2 and view 3), the two consistent observations included columnar lath and waves of melt pools. The columnar lath resulted from the continuous growth of grain with similar orientation; this concept is further discussed in the next section. The wave curve was a result of the side view of the hemispherical shape for the melt pool. No evident grain boundary was observed, given that components were not solidified from a bulk liquid metal, which opposed the typical nucleation and growth process. However, the etching material attacked the melt pool boundary more, as shown in the microstructure. Each melt pool possessed a unique microstructure but exhibited the same characteristic, wherein the grain grew vertically, from downward and upward toward the center of the melt pool. This observation was also recorded by Murr et al. [42] and Donik et al. [43], who specifically remarked on the melt pool visualization for low energy density. A unique combination of brighter and darker grains, which were austenite and martensite, lay within each melt pool. Martensite could be observed as a spiking darker region without defined boundaries, as recorded by Ponnusamy et al. [44].
Microstructure profiling of the 90° build orientation, seen in Figure 8, shows similarity to that at 0°, where the circular view dominated build direction (view 3) and wave melt pool structure the transverse direction (view 1 and view 2). Phases were randomly distributed and could still be distinguished by the brightness through high magnification observation on the circular area. The average melt pool was 100–200 μm sideways with an average thickness of 40 μm. Brighter regions represented austenite, and the darker regions represented martensite. The black regions indicated porosity, which was very prominent in the 90° side view.
The build direction, 45°, in Figure 9, reveals a different microstructure from the two other build orientations. The build direction offered no view because the angle was distorted, but the transverse direction (view 2) revealed consistent elements, including the wave-like structure and columnar lath. A circular structure was unidentified because the view direction did not correspond to the print direction.
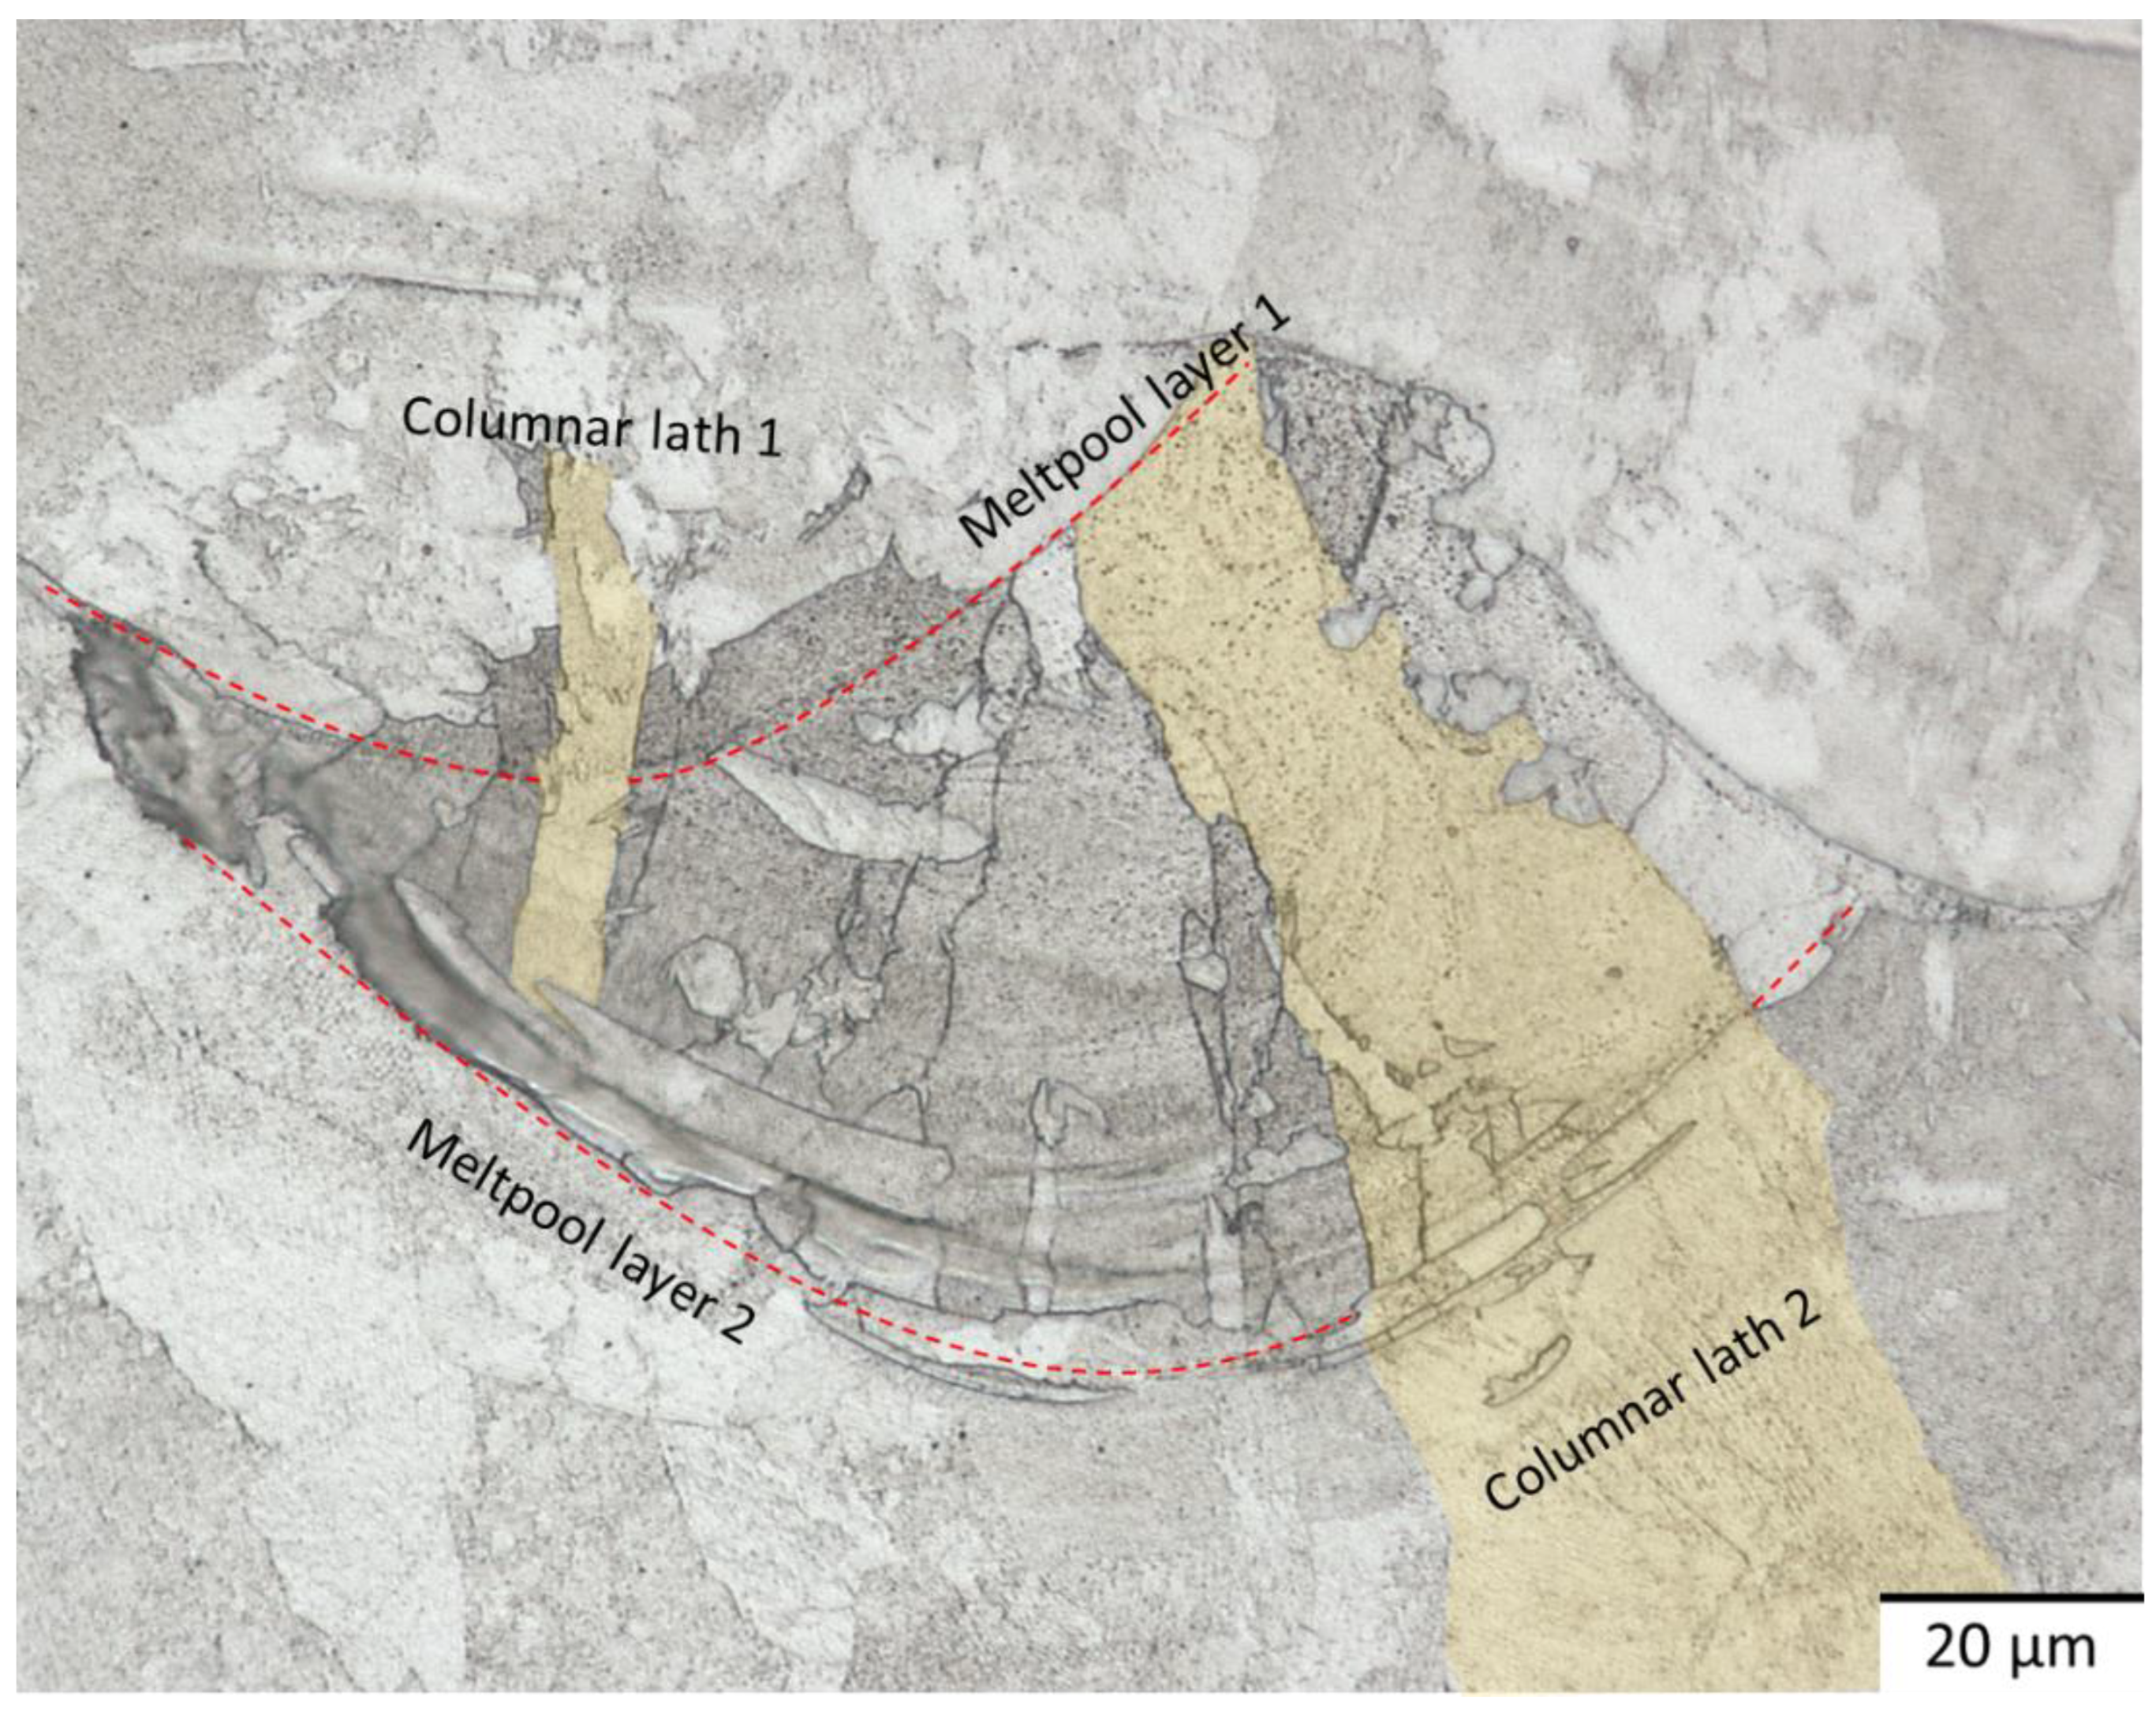
The observation from the transverse direction of all build directions indicatef the existence of bright columnar lath growing from the bottom upward. Similar growth was recorded by Pilehrood et al. [45], where solidification nucleated in a one-way direction from the bottom of the melt pool. This grain indicated continuous grain growth in inter melt pool layers, as shown in Figure 10. Columnar laths 1 and 2 showed continuous growth extending over their respective meltpool layer. Although each layer solidified consecutively, they appeared during the solidification of a single melt pool. The lowest temperature occurred at the bottom, where nucleation of the liquefied layer adopted the orientation of the adjacent grain of the previously solidified layer. This nucleation drove further similar grain orientation solidification in an upward manner to generate a pillar-like structure. The growth direction driven by heat flow was mentioned by previous reseachers [12,24]. Although the columnar lath did not resemble austenite, which has a bright and shiny region, many researchers consider this columnar lath to be an austenitic phase [46,47], and some deemed it ferrite [48].
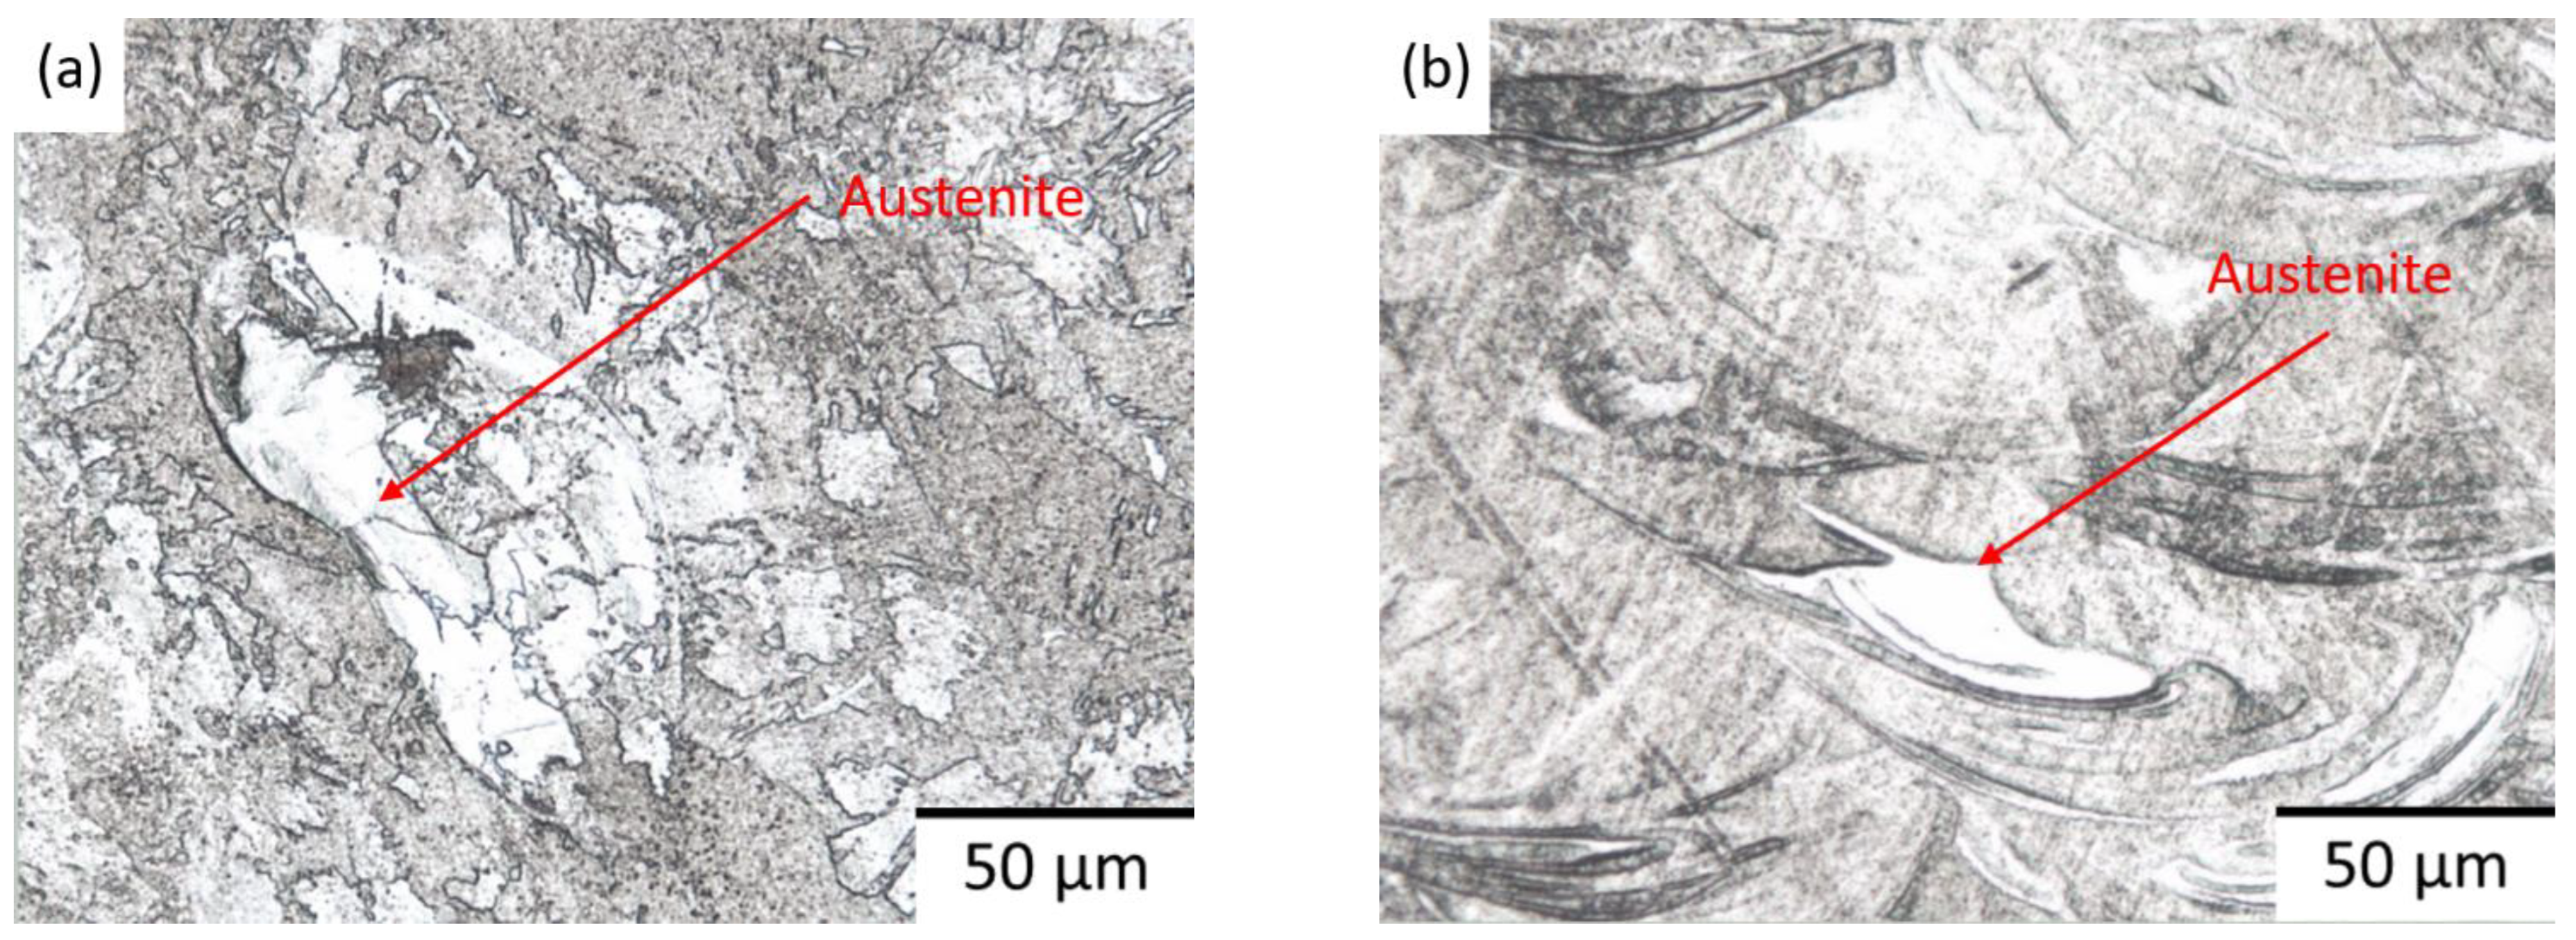
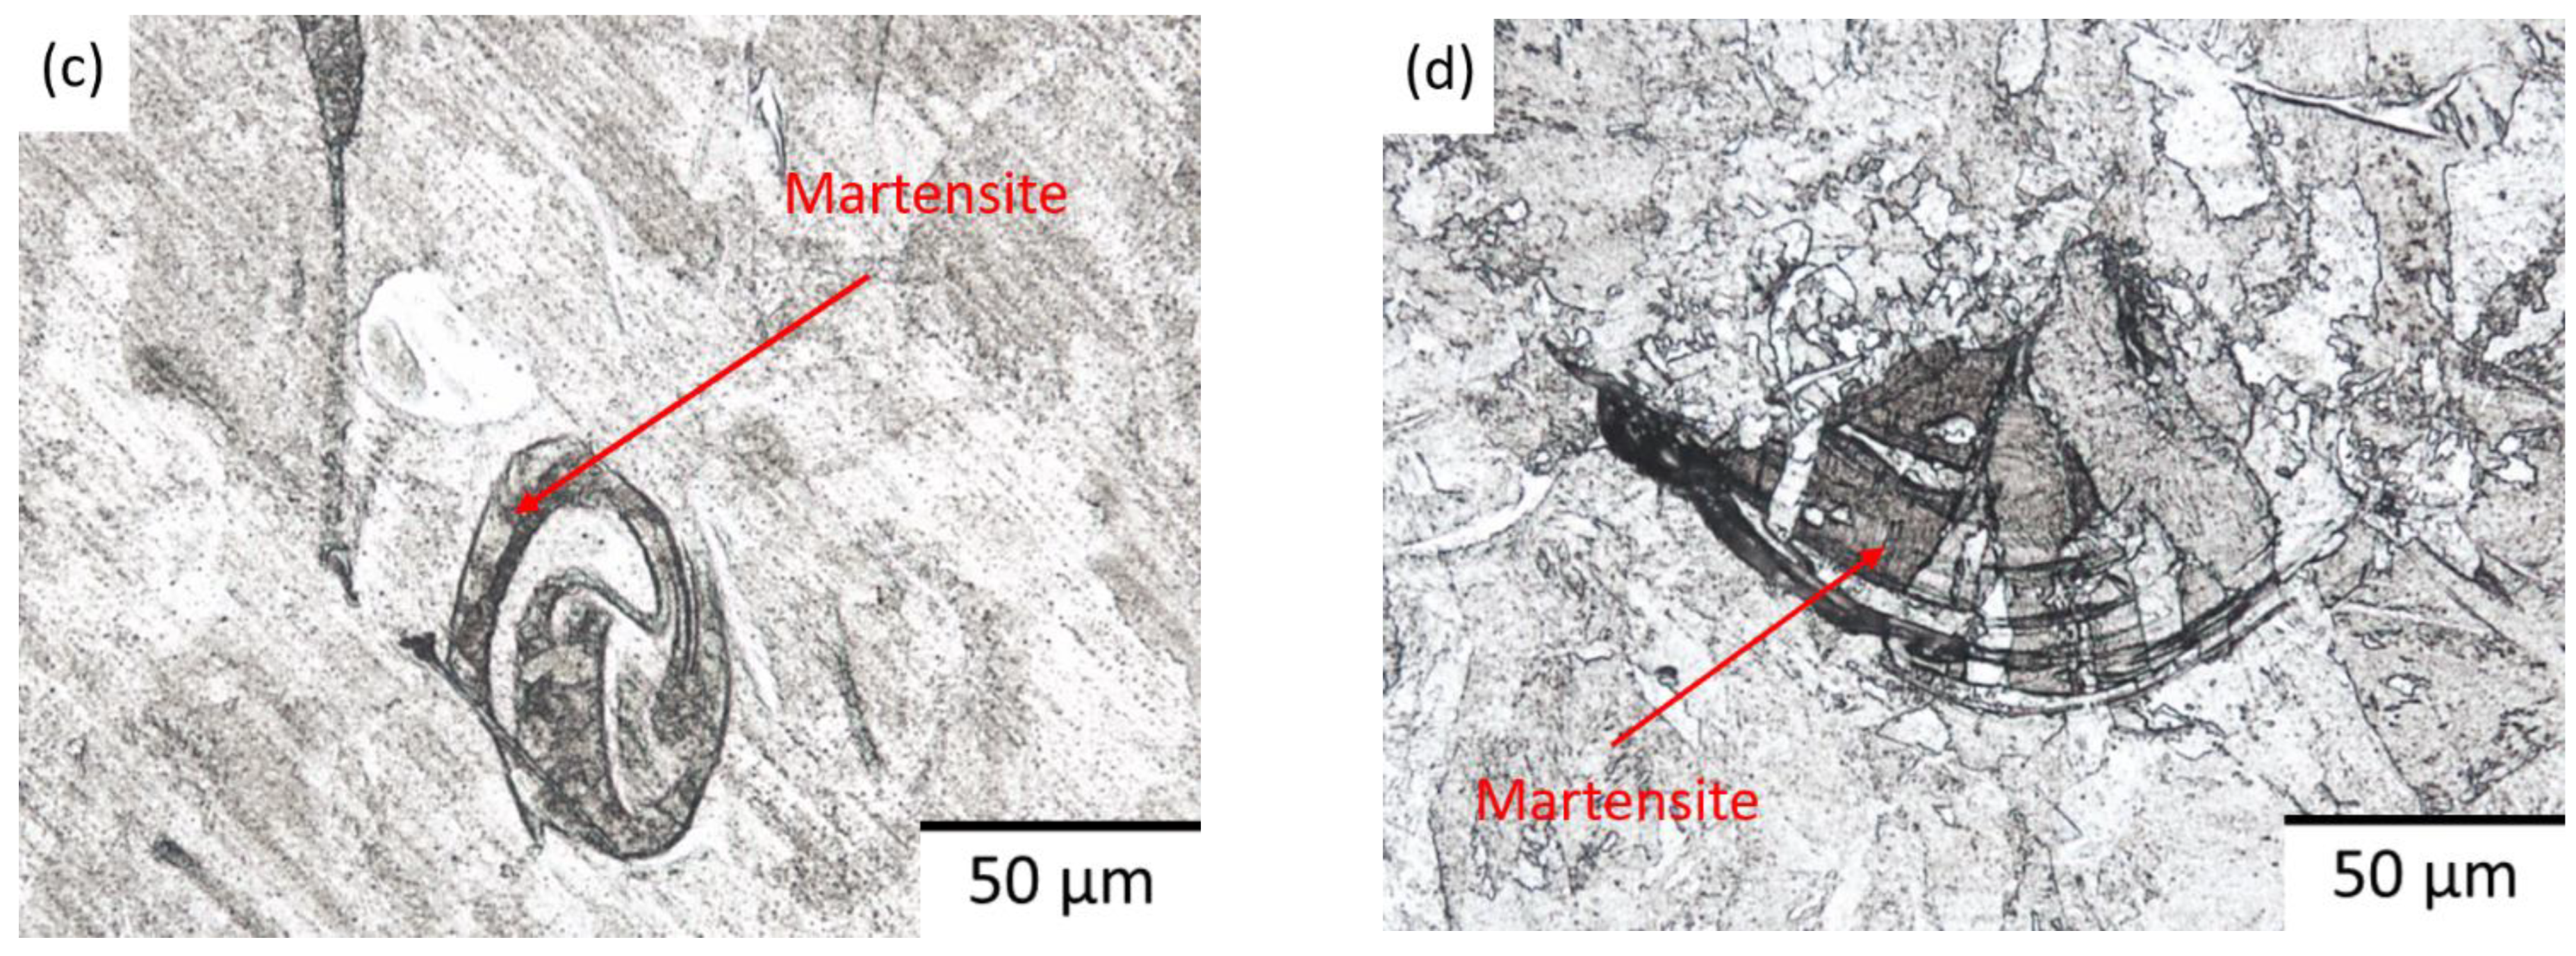
Apart from geometrical analysis, identifying the phases indicated in XRD analysis from optical microscopy was important. Based on XRD results, the microstructure on 17-4 PH was dominantly martensite, with 29.1% of the austenite phase. Some austenite content was still retained because most of the austenite transformed into martensite, owing to decreased Ms and Mf temperatures when alloying elements were added. Similarly, the columnar austenite was mentioned by Lass et. al. [47]. Figure 11a,b show the appearance of austenite as a shiny bright region from build and transverse directions. On the contrary, martensite was indicated by a dark region, as shown in Figure 11c,d. From the transverse direction, martensite had a columnar form, indicating grain growth from the bottom toward the top.
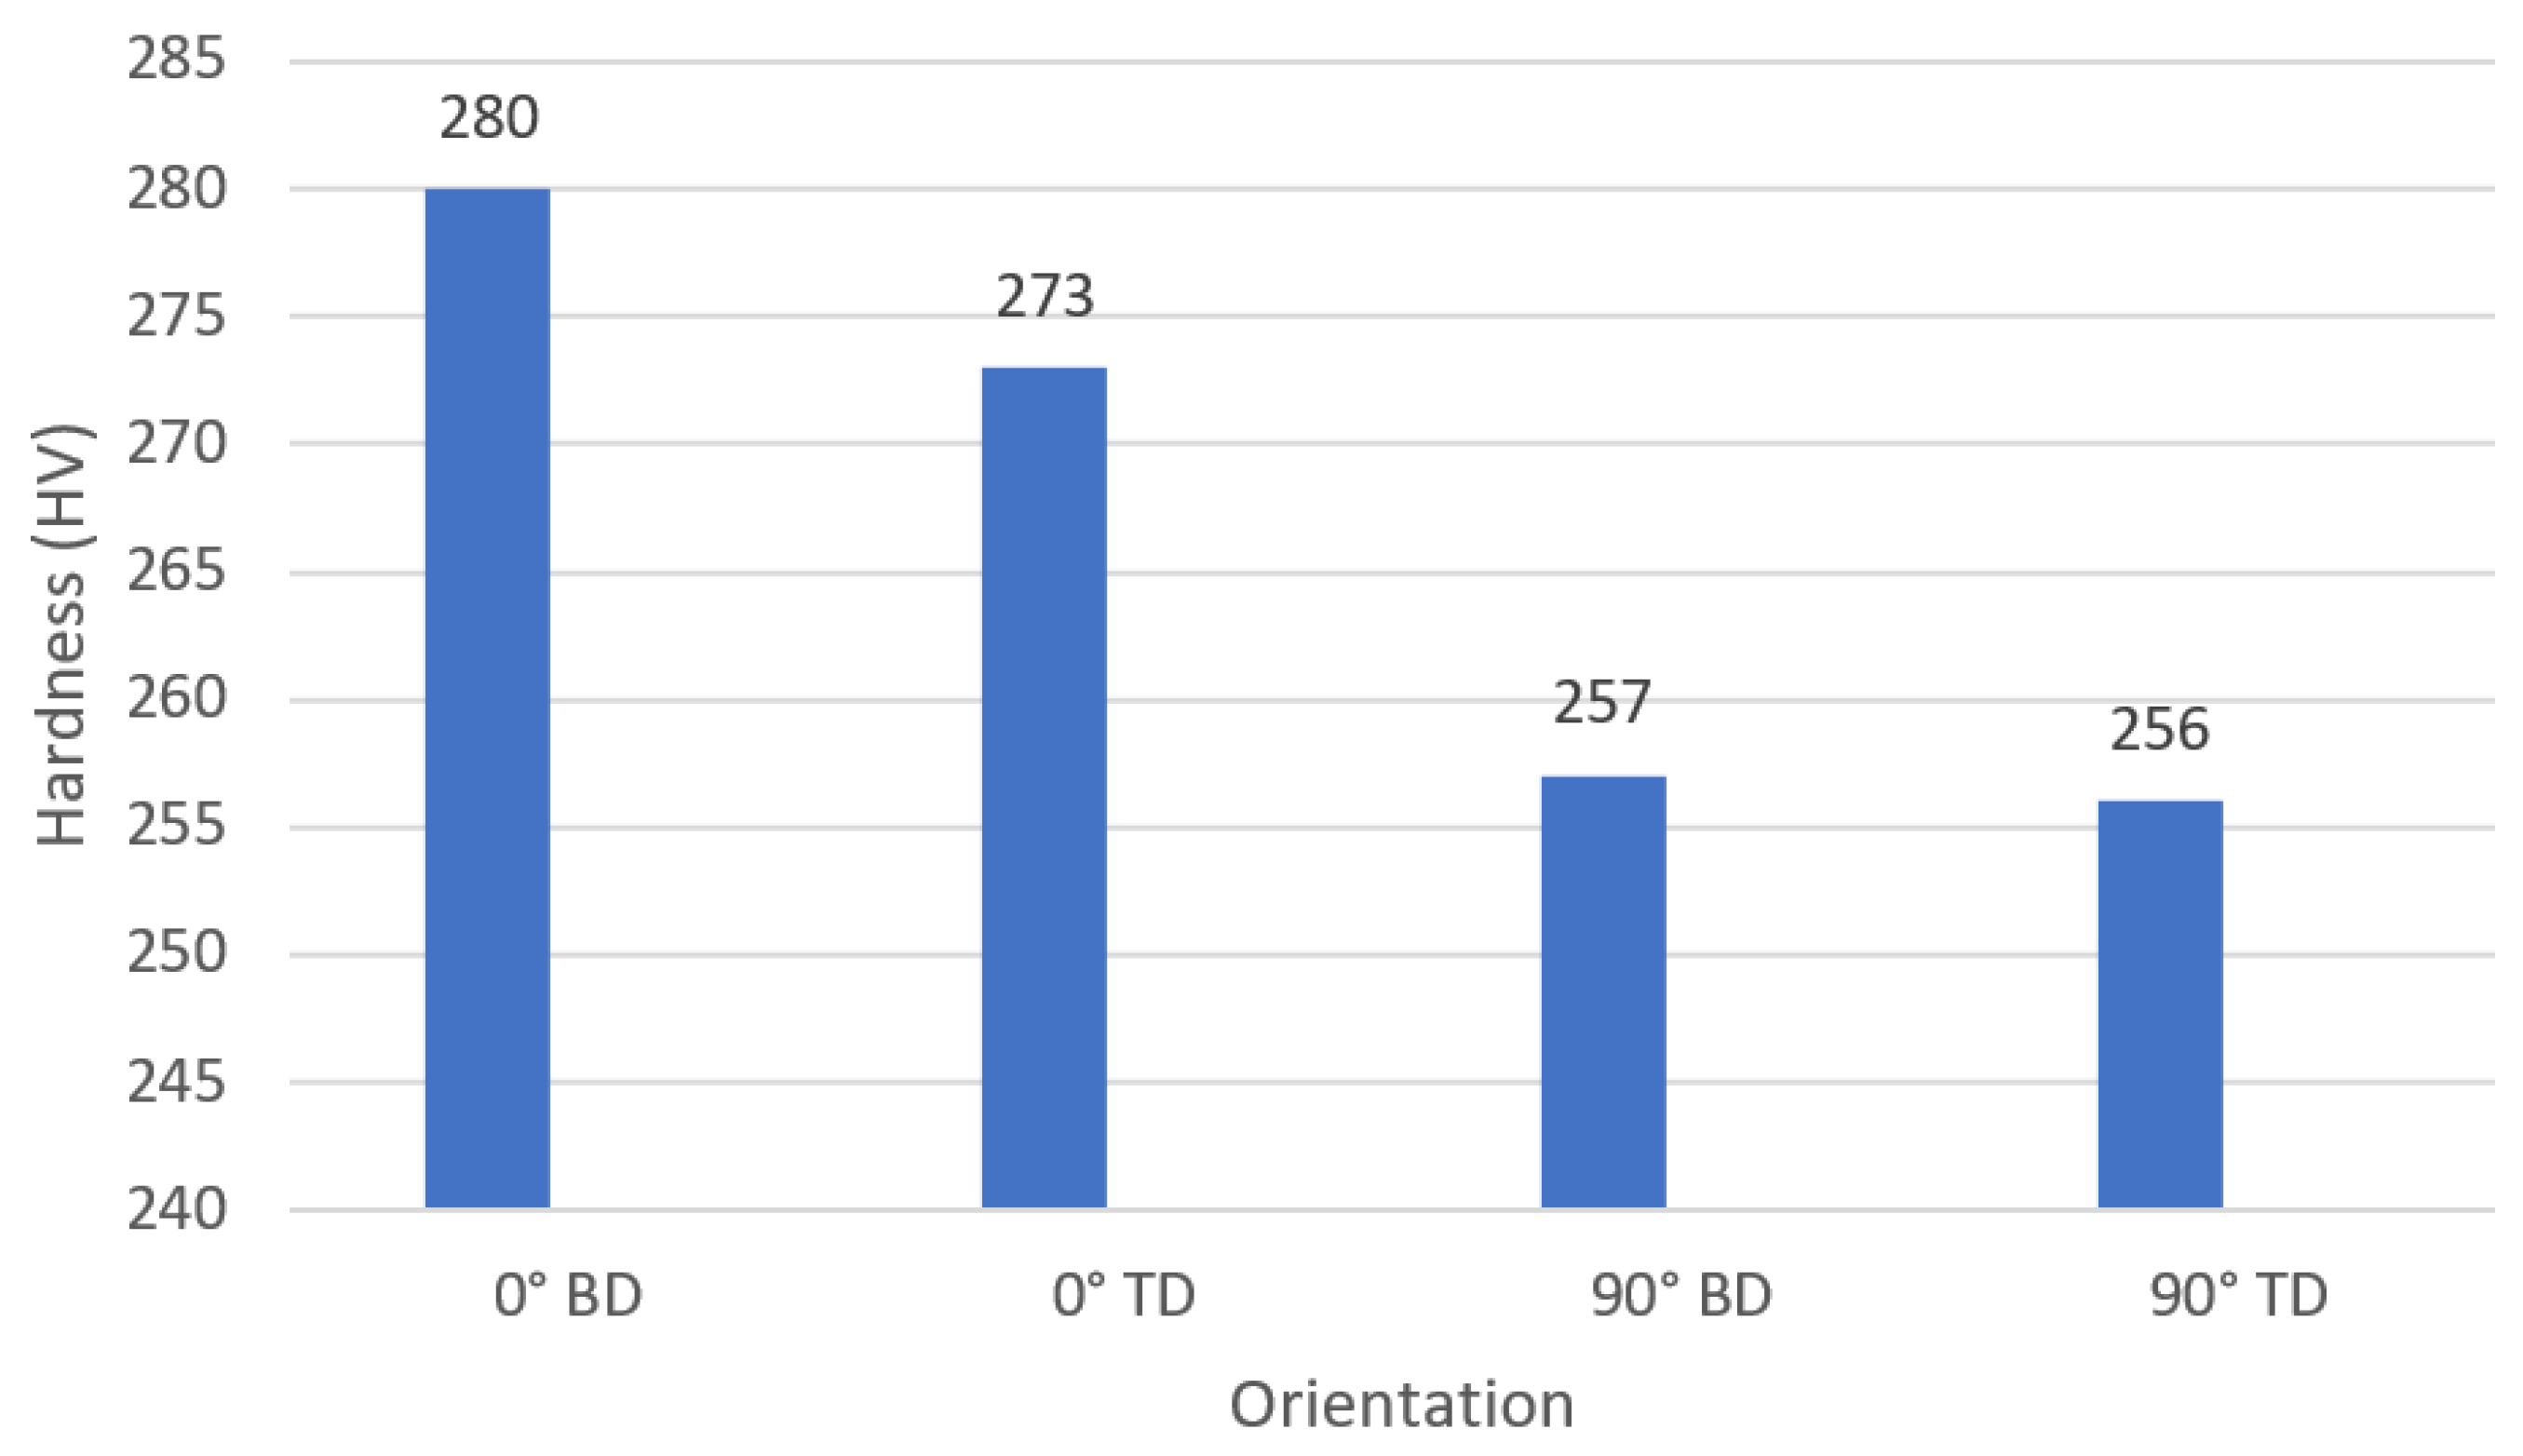
The hardness test was conducted from two different sides of each sample, including the build direction and the transverse direction, to validate the homogeneity of hardness. Leo et al. measured SLM 17-4 PH components at 307 HV to 315 HV without substantial variation in average values at different portions of components [49]. However, this study specified the variations based on build directions. The value range for 0° was from 253 HV to 320 HV, and from 242 HV to 266 HV for 90°. The average HV value is shown in Figure 12, indicating that 90° had lower hardness than 0°. Hardness decreased owing to the increased amount of retained austenite at 90°, due to lower cooling rate. The increment of austenite contributed to higher elongation, as observed by Yadollahi et al. [50]. The hardness of transverse (TD) and build directions (BD) was almost similar, with build direction hardness recording a slightly higher reading than the transverse reading. According to Hu et al. [51], these variations could be rationalized by microstructural heterogeneities generated by the AM process. Deviation values of BD and TD, as reported by Yusuf et al. [25], could be the effect of such heterogeneities (dendritic segregation, grain morphology, and differences in cell grain size).

3.3. Porosity Distribution and Tensile Test

Under optical microscope observation, the microstructure of SLM 17-4 revealed numerous types of porosities. Porosity in SLM could be divided into process-induced and gas-induced porosity. The observation of porosity was more common to a side view than a top view. This finding was heavily due to most porosity being generated at the melt pool area.
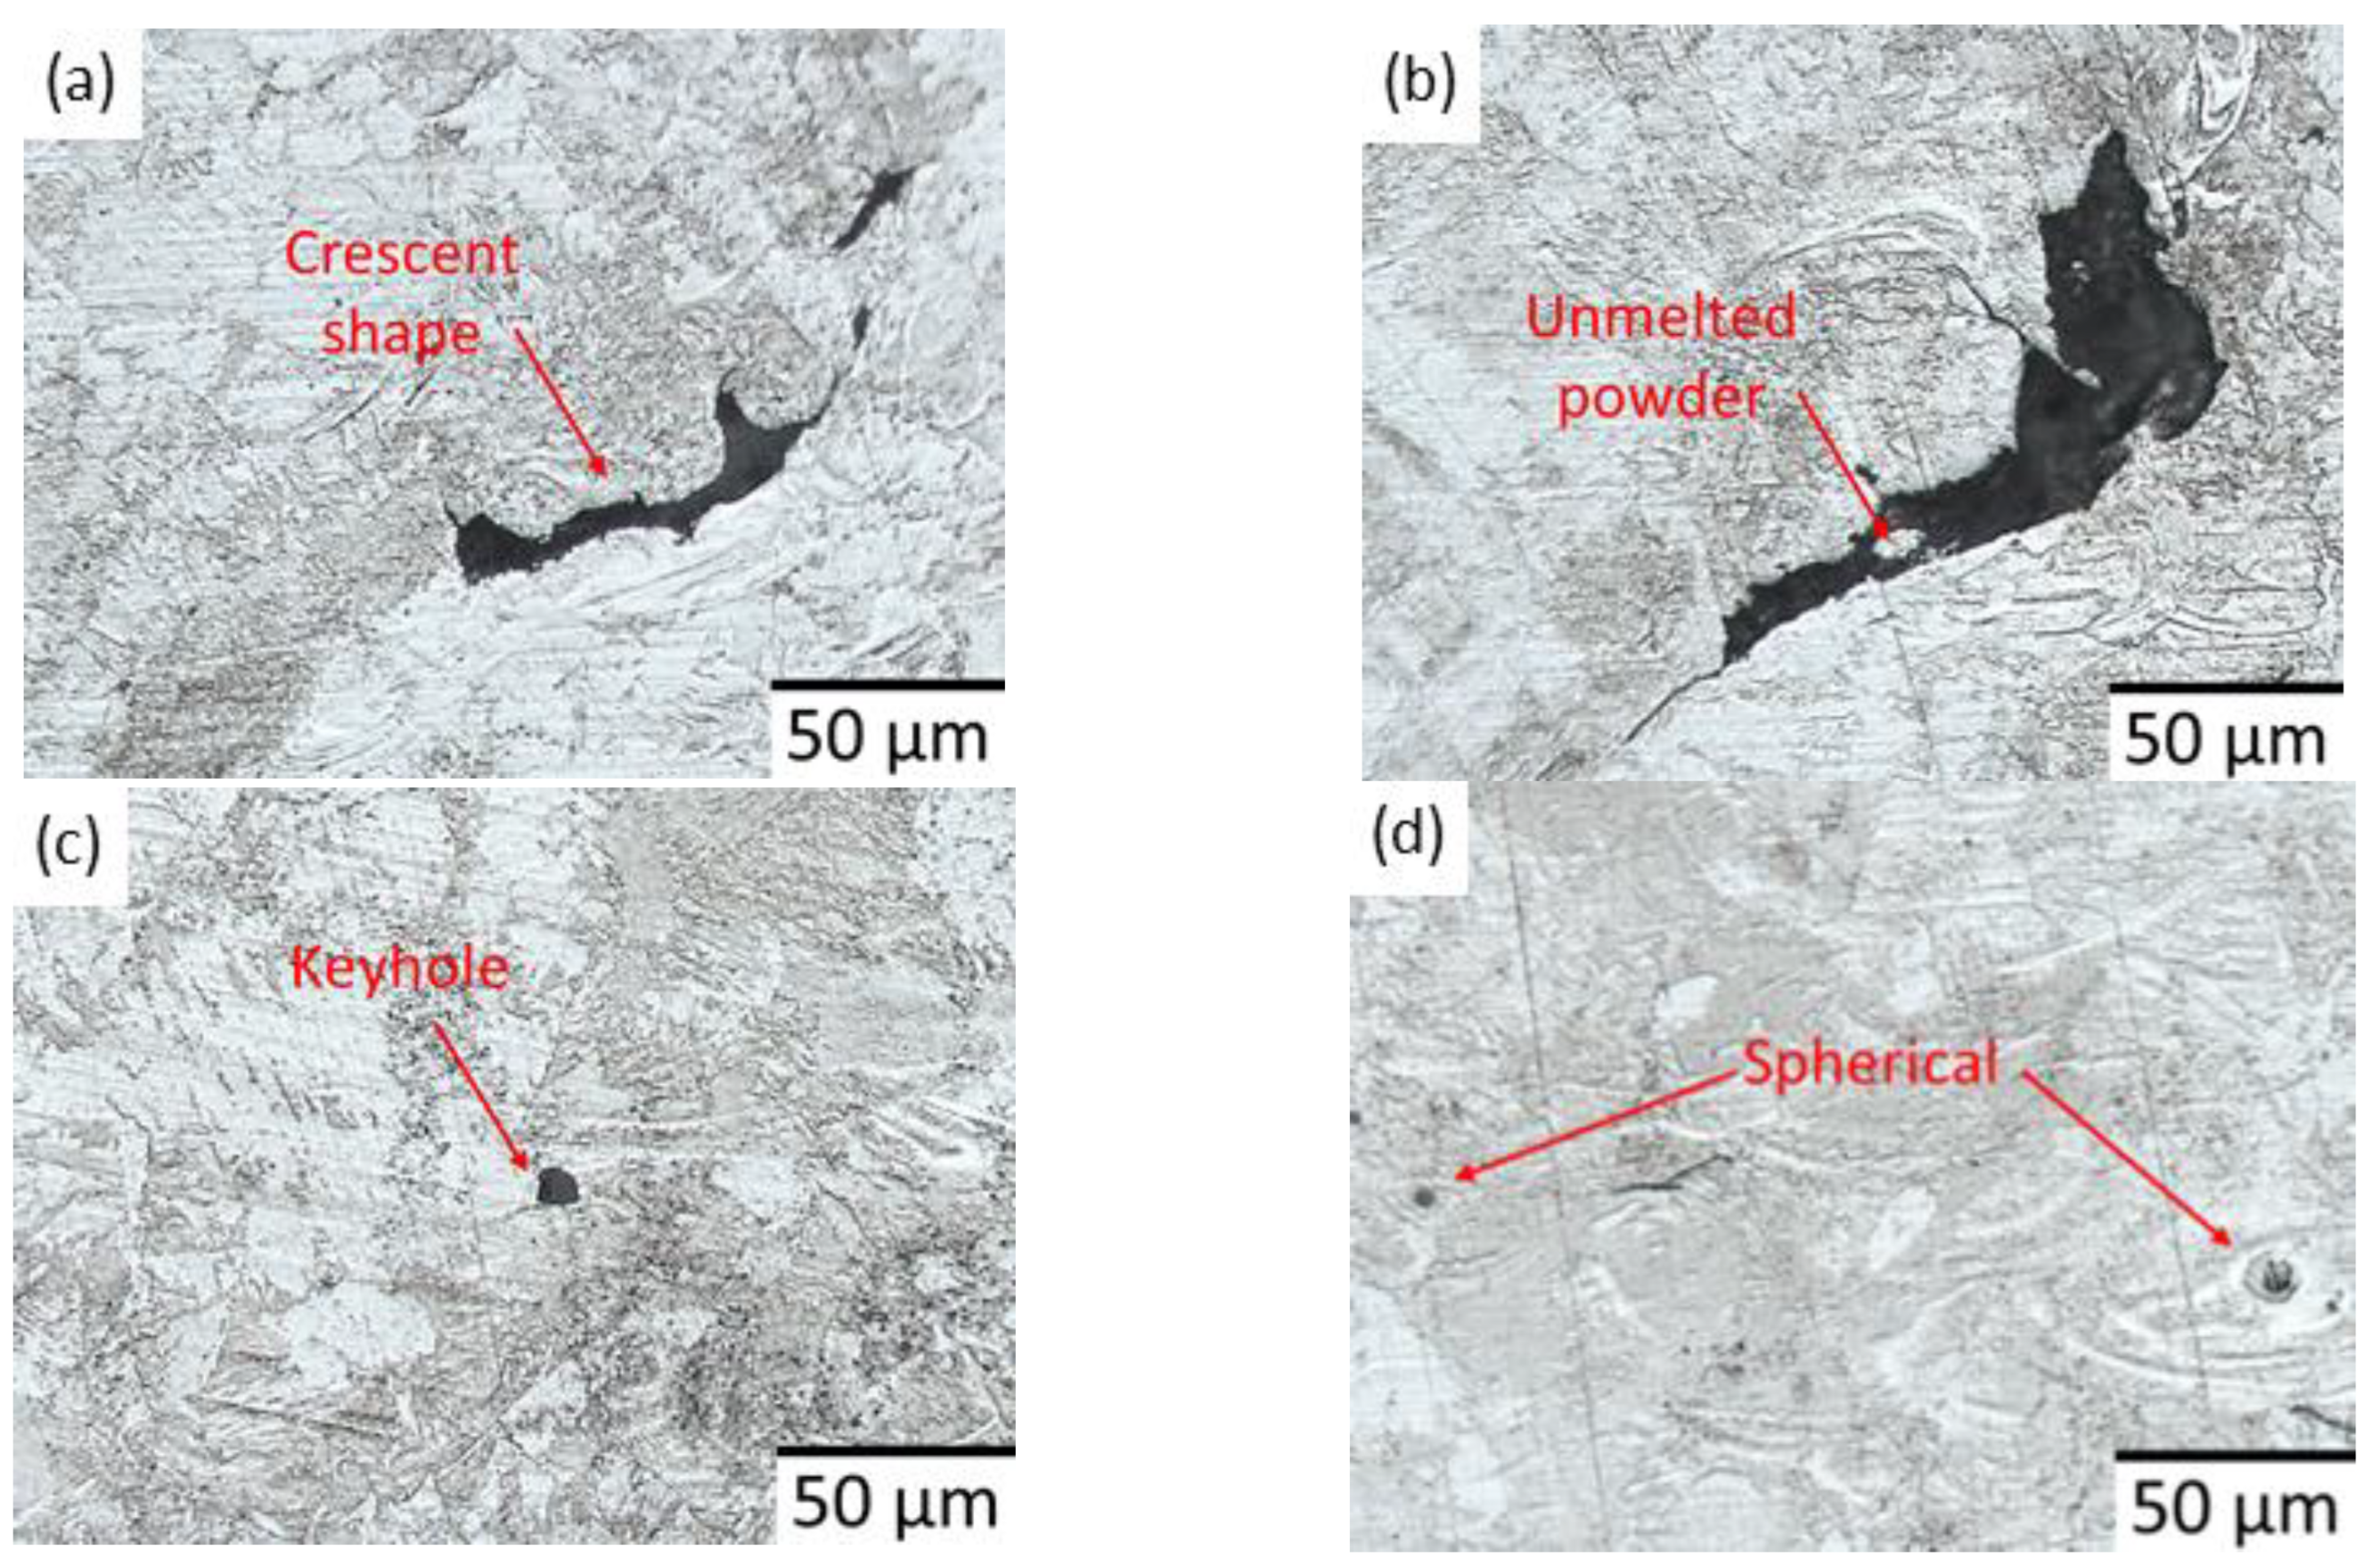
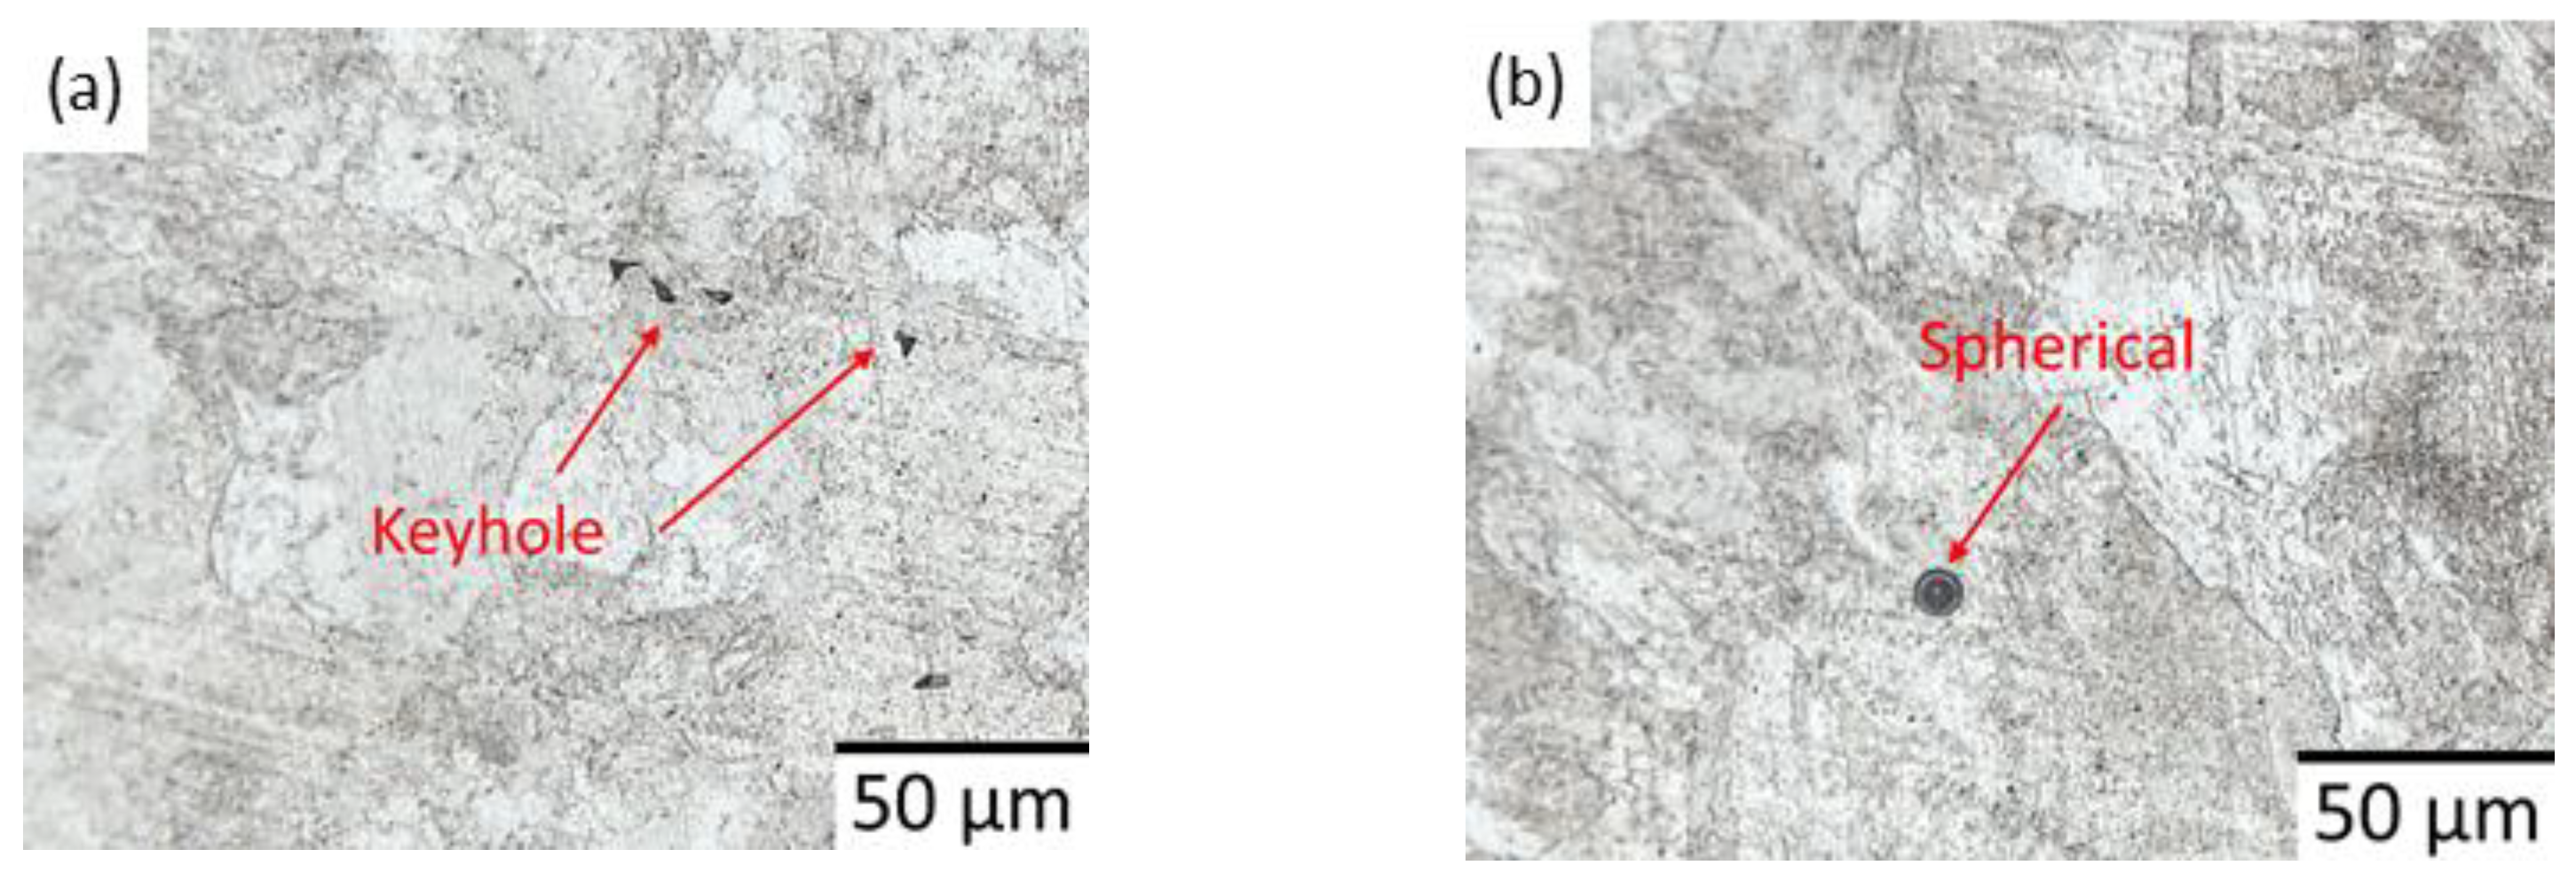
The total power transferred to powders during printing may vary, due to inevitable errors. The power transferred by the laser beam was assumed to be insufficient. In this case, the two consequences were as follows: heat did not penetrate until the bottom layer, the un-melted powder, remained, and the powders were fully melted. Nevertheless, they did not fuse with adjacent melt pools, resulting in voids occurring in the interlayer. The common geometry of these porosities included slit-shapes and crescent-shapes. The porosities exhibited the most extensive geometry, with a length of up to 200 μm from end to end and a thickness of 40 μm appearing dominantly at 90° and 45° side views, as shown in Figure 13a and Figure 14a. If the energy received was very low, then the powder would not even melt, as shown in Figure 13b and Figure 14b, recorded by Kamariah et al. [52]. These porosities that might affect the mechanical properties were mainly observed at 90° and 45°, in Figure 13 and Figure 14, respectively. However, they were not observed at 0°, as seen in Figure 15, consistent with previous findings [17,31].
Contrary to insufficient energy, the powder was vulnerable to excessive laser beam energy, resulting in the spatter ejection process, known as keyhole formation. Previous researchers observed that this porosity left a trail of voids [29]. The spattering effect displaced a portion of melted volume to a nearby region, followed by solidification of the top surface of the melt pool. The displaced volume consequently generated porosity, due to the incomplete flow of molten metal into the desired region. The geometry of porosity was not as significant as the unmelt porosity. It could be any irregular shape, commonly triangular, as shown in Figure 13c, Figure 14c, and Figure 15a. Therefore, this type of porosity is more commonly found in all build directions equivalently.
The third type of porosity is gas-induced porosity. Gas bubbles may form in the melt pool due to the vaporization of low melting point constituents within the metal [53]. Entrapped gas appears because the melting process occurs rapidly. The spherical pores are the by-products of gas-induced porosity, due to entrapped gas, as shown in previous findings [40,44]. For this study, these findings are shown in Figure 13d, Figure 14d, and Figure 15b. The size was commonly found to be less than 20 μm, with one substantial gas porosity found at 0° with a diameter of 30 μm.
Based on the microstructure of the SLM parts, the combinations of common observations could be integrated into a single schematic, as shown in Figure 16. Several melt pools were recorded with multiple columnar laths that could be observed as brightly colored grain. The columnar grain was observed to be vertical from the base and perpendicular from the bottom of the melt pools. Two main process-based porosities were observed, indicating excessive and insufficient energy density. All the porosities could be found in previous studies [27,54,55], but this study identified the location of all porosity types observed. Insufficient energy porosity appeared similar to a crescent moon and to un-melted powder attached at the bottom of melt pools. By contrast, porosity was observed to be a triangular shape within the melt pool boundary for excessive energy. The second type of porosity is the gas-driven porosity, which appears as spherical-shaped porosity. The distribution and size varied, based on the direction of the SLM specimen. Since the crescent porosity is commonly found at the bottom of the melt pool layer, addition of layers would increase the probability of crescent porosity. For each build direction, 0° build direction had the least build layers, as opposed to the 90° build direction that had the most build layers. The lowest porosity was observed at 0°, where the observed porosity was limited to a spherical shape.
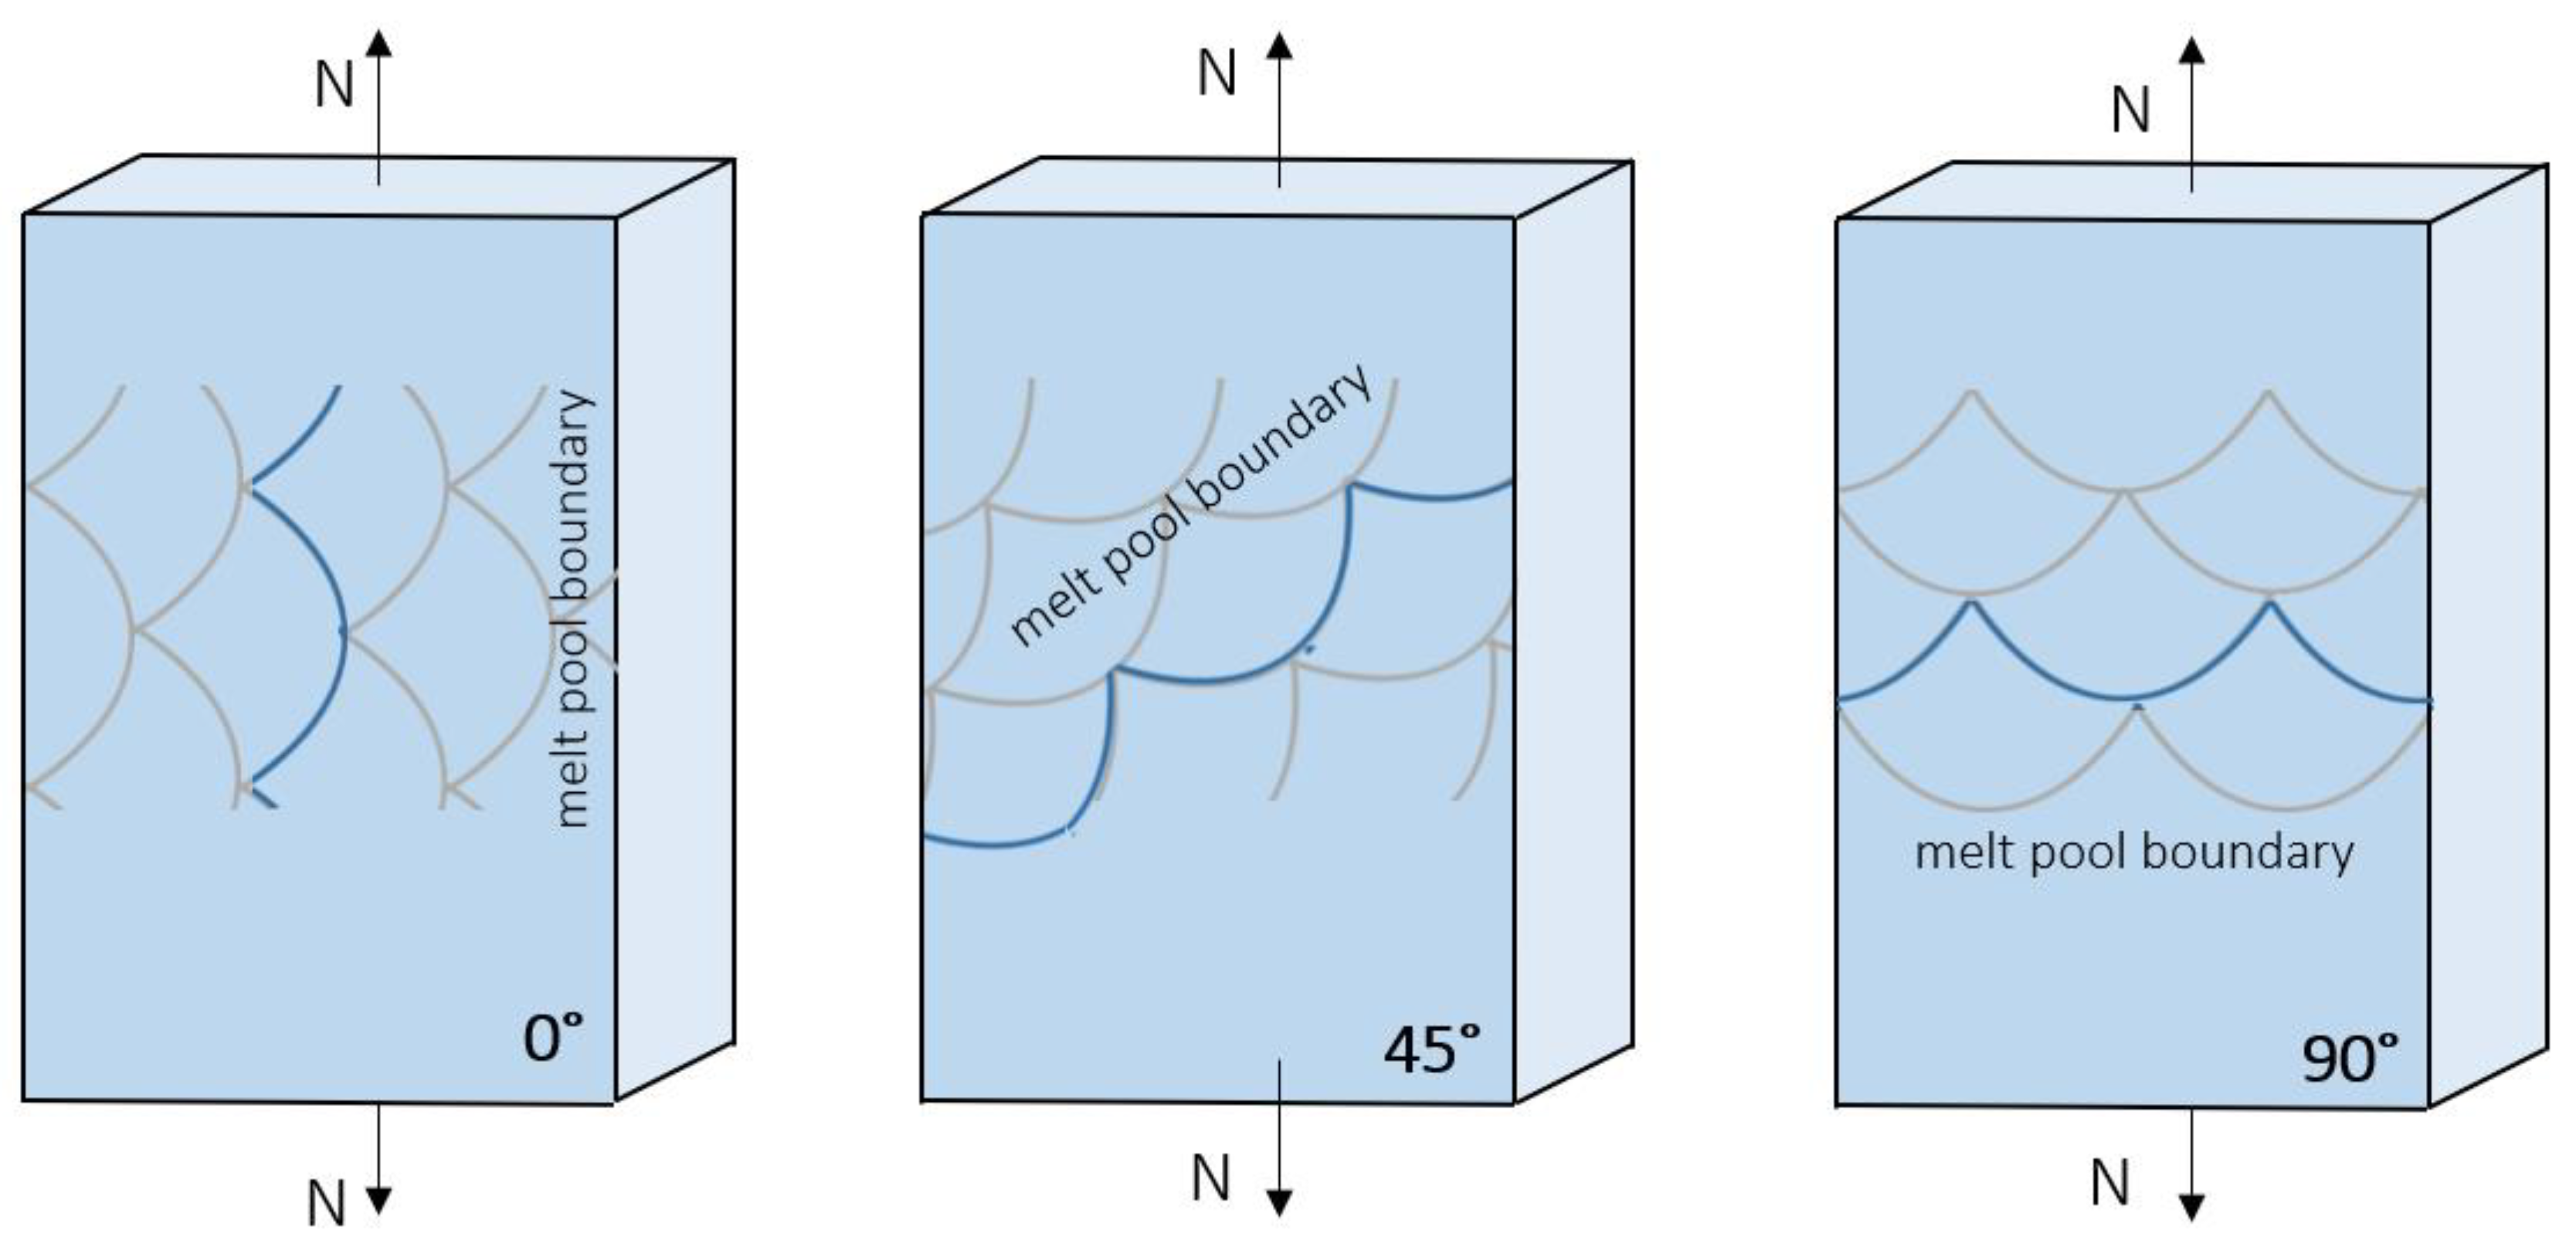
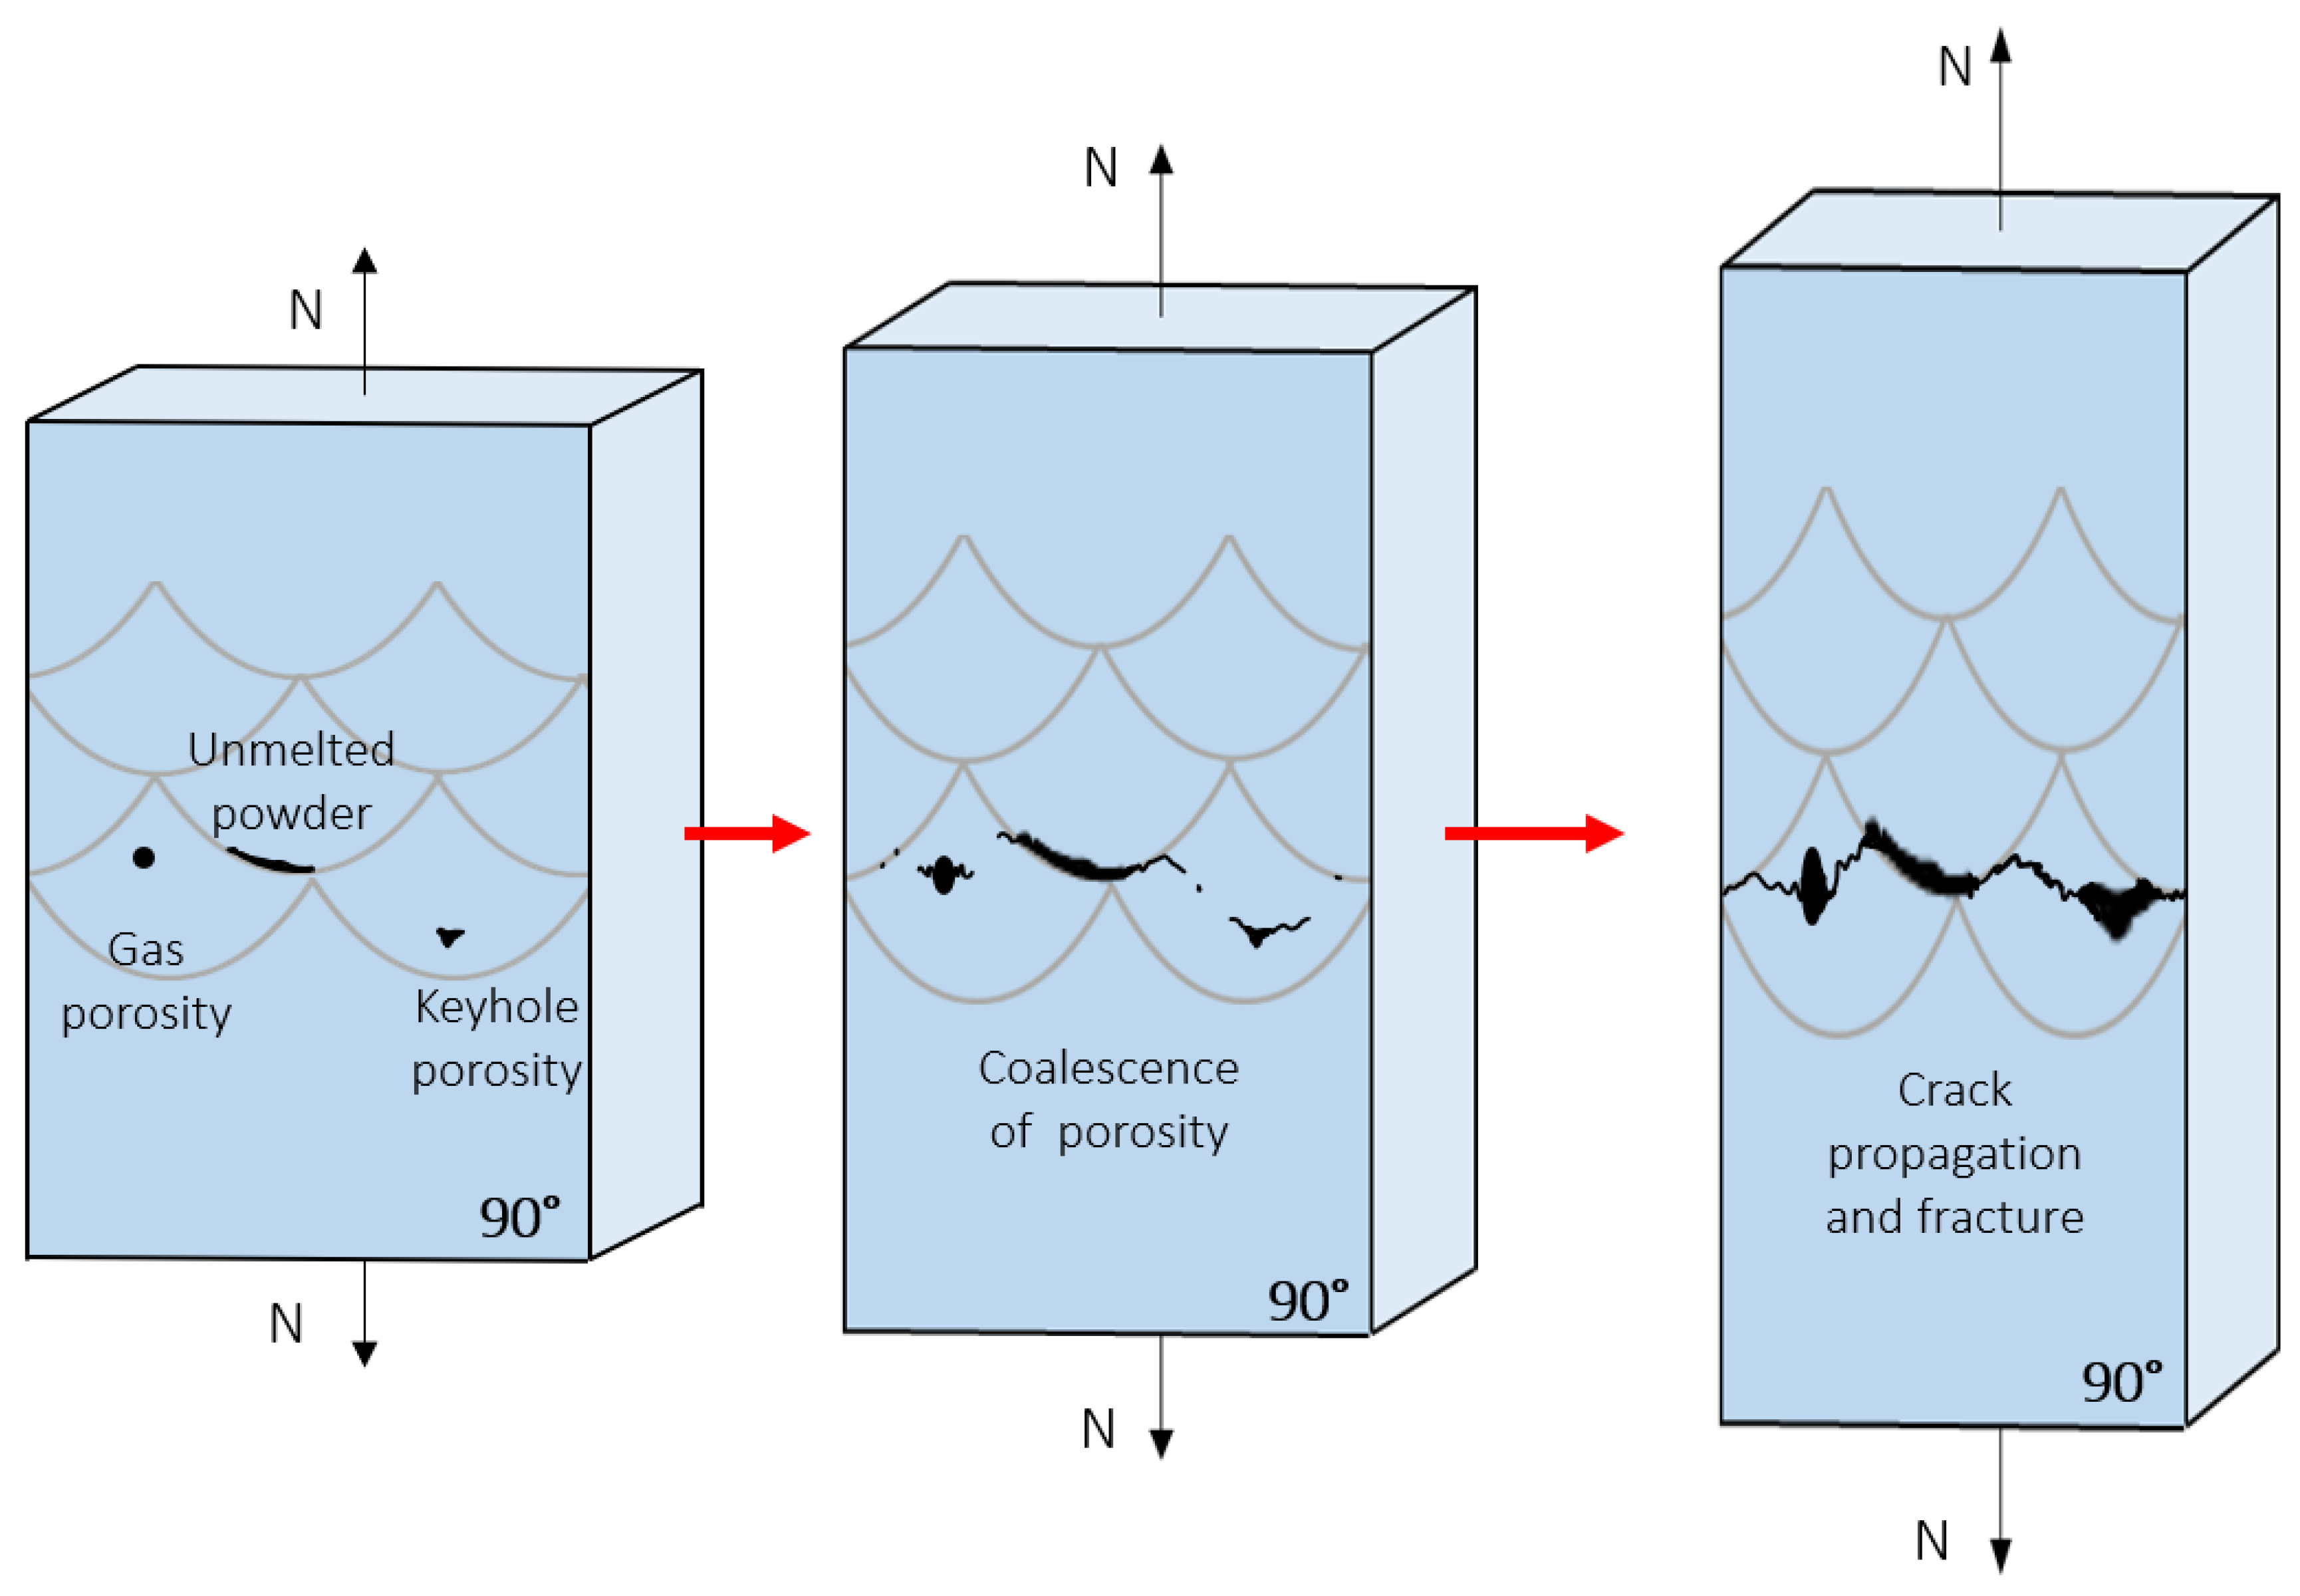
Four main mechanical properties were extracted based on the tensile test result shown in Table 3. The curve behavior for each build direction is shown in Figure 17. Tensile strength was highest for 0° at 958 MPa, followed by 45° and 90° at 743 and 614 MPa, respectively. The difference in tensile strength was attributed to the direction of the melt pool layers to load direction and porosity profiling. The melt pool boundary separated the solidified bottom layer beneath the upper liquidus layer. This difference in energy acted as a weak interfacial layer. Early yielding and lower strength and elongation causing failure of vertical samples could be caused by the orientation of layer boundaries in relation to the loading [28]. The 90° orientation had bottom melt pool layers perpendicular to load direction, consequently enabling easier porosity growth and coalescence, resulting in the lowest strength, as shown in Figure 18.
The second factor was the porosity distribution. Among the three types of porosities, the un-melted powder and crescent shape porosity always occurred along the melt pool boundary, as highlighted in the porosity analysis section. This porosity was observed most frequently for 90°, followed by 45°. The edge of the crescent acted as stress concentration, and the crack propagated easily across the specimen, given that it was perpendicular to load direction, as shown in Figure 19. The crescent shape did not contribute the same effect at 45°, which did not have a direction proportional to the load direction.
The qualitative aspect of the curve indicated that the 90° build direction had the most prolonged strain hardening effect, up to 35% elongation, whereas the 0° build orientation showed a yielding up to 7.5% before absorbing higher stress.
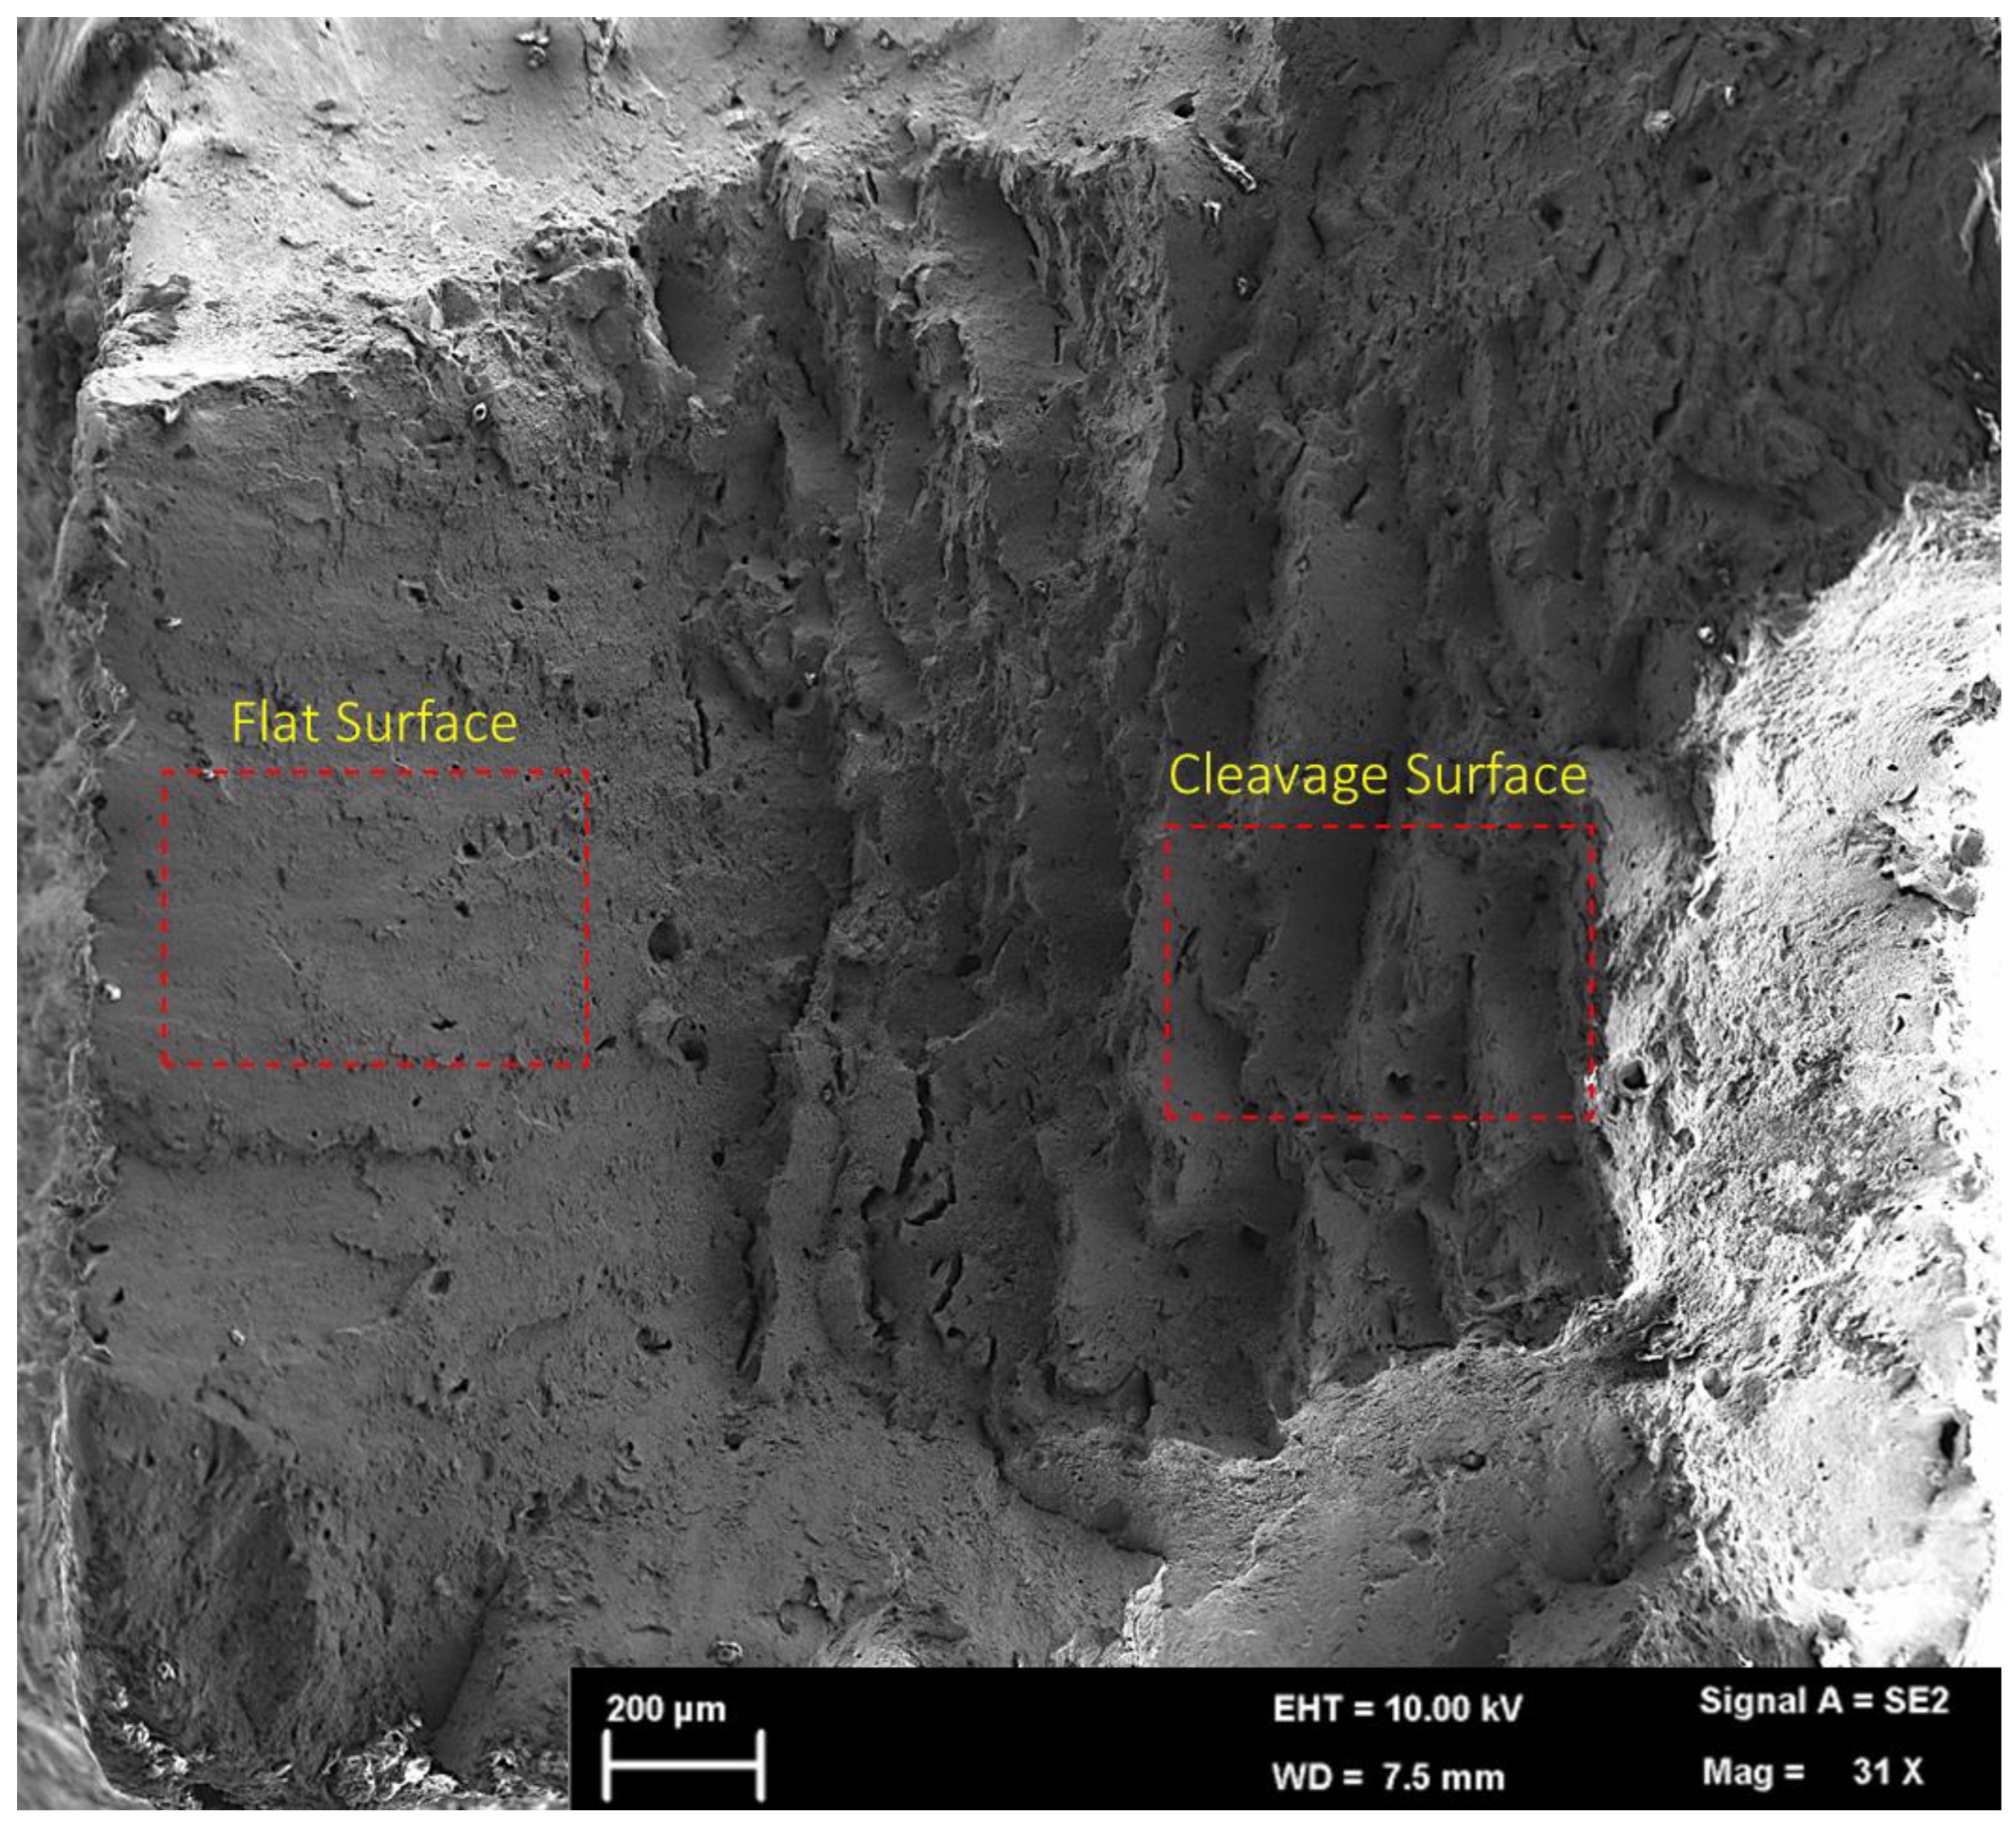
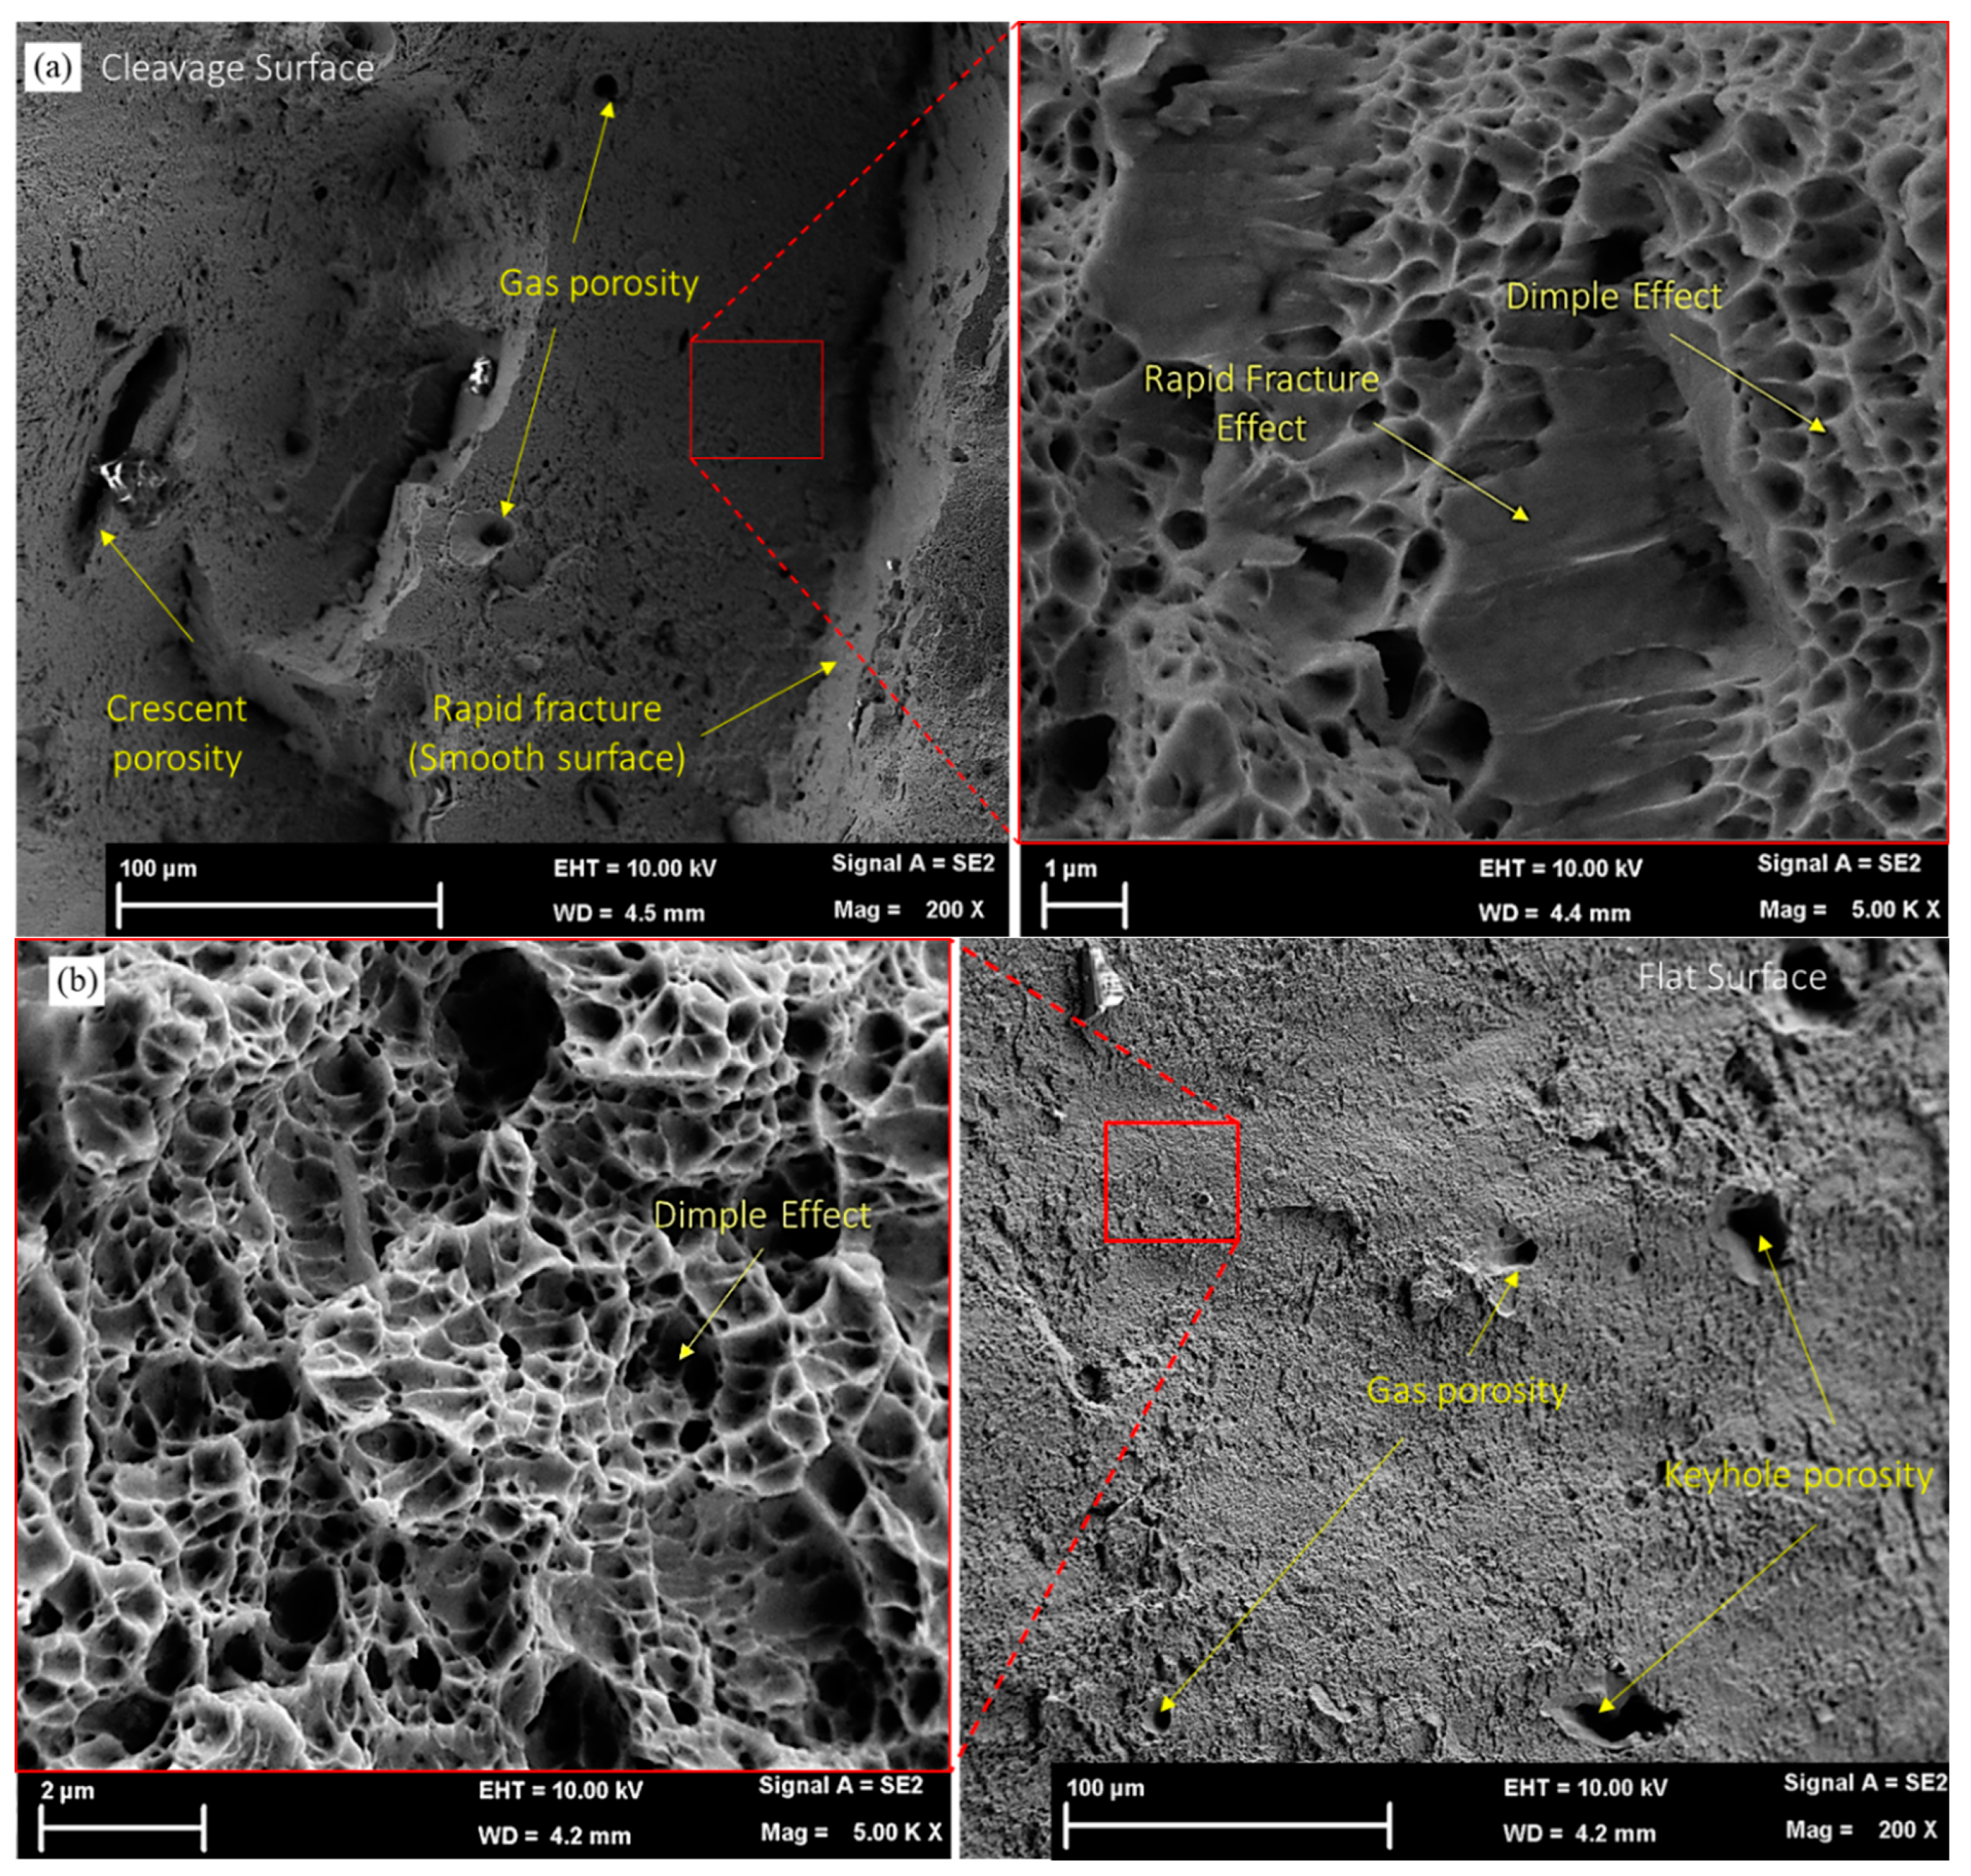
In this study, fractography analysis was further inspected under SEM observation for the 0° build orientation, as shown in Figure 20. The results showed that the overall photograph at 31X magnification, in Figure 20, consisted of two types of surfaces: flat and cleavage surfaces. The porosity nucleation and propagation appeared first on the flat surfaces, where slow fracture propagation occurred, and where the porosities grew and became coalescent with each other. This result was depicted previously in Figure 19. Rapid fracture existed as a cleavage surface occurred when the crack propagated to the critical limit.
Both surfaces were further zoomed in on under 500× and 5000× magnification, as shown in Figure 21. Asperities on the surface resulted from internal pores generated as a result of un-melted particles, and gas trapping was accountable for AM specimen failure. Generally, all types of porosity, crescent, keyhole, and gas could be found at 500× magnification. The size of the crescent appeared to be the largest at 80 µm, consistent with that in Figure 10. Keyhole porosity was found to be smaller at 40 µm and gas porosity at 10 µm. These findings were consistent with the microstructure observation in Figure 16.
No precipitation strengthening phases were observed, because no heat treatment was introduced. At 5000× magnification, the presence of fine dimples indicated sample failure in the ductile approach, despite many voids [56]. The small dimple with a size less than 1 µm was observed to be larger on the flat surface, whereas cleavage surfaces possessed a smooth fracture surface due to rapid fracture and separation of two adjacent grains. The dimple size was larger in the previous research on austenitic steels treated using the conventional process. The improved cellular structure generated nucleation and formation of micro-voids [28].

4. Conclusions

This study was initiated as integral to achieving optimal components for selective laser melted 17-4 PH. Therefore, the process began with understanding the phase, microstructure, and porosity profile in relation with the hardness and tensile strength. Initially, the chemical elements and physical conditions of powders were analyzed to obtain the size and volumetric distribution. The chemical element analysis was also extracted and served as the basis for understanding the phases present after components were successfully printed. Specimens were analyzed using material property modeling, JMatPro, and subsequently verified using XRD analysis, where two phases were mainly observed, namely, austenite and martensite, with compositions of 22% and 78%, respectively, for 0° build direction. The 90° build direction showed that austenite slightly increased to 29.1% and martensite reduced to 70.9%, due to smaller base area and lower cooling rate.
The optical microscope observed grain growth at the bottom of the melt pool in an upward direction, and austenite and martensite were observed as bright white regions and needle-like dark structures, respectively. The hardness value was higher for 0° build direction than 90° due to the higher martensite content. Tensile strength was highest for 0° at 958 MPa, compared with 45° and 90° at 743 and 614 MPa, respectively, due to the porosity profile and direction of melt pool interfacial layer. Porosity analysis validated that only the 90° build direction had all three types of porosity, and, specifically, the crescent type, which held un-melted powders, apart from keyhole and spherical porosity. The schematic for melt pool orientation and crack propagation was successfully generated. All types of porosity were validated in fractography analysis under SEM machine. This concluded that the 0° build direction demonstrated the best tensile strength, due to the highest martensite content, the lowest porosity, and the direction of the melt pool interfacial layer. The findings from this research could serve as a base reference for future microstructure manipulation work, such as heat treatment.

Author Contributions

Conceptualization, M.A.A. and Z.S.; methodology, M.A.A., A.H.B. and Z.S.; formal analysis, M.A.A. and A.M.A.; investigation, M.A.A.; writing—original draft preparation, M.A.A.; writing—review and editing, Z.S., N.H.J., J.S. and I.F.M.; supervision, Z.S., N.H.J. and I.F.M.; project administration, Z.S.; funding acquisition, Z.S. All authors have read and agreed to the published version of the manuscript.

Funding

The authors would like to thank the Ministry of Higher Education, Malaysia, for supporting this research project through the Fundamental Research Grant Scheme FRGS/1/2019/TK03/UKM/02/3.

Data Availability Statement

Not applicable.

Conflicts of Interest

The authors declare no conflict of interest.

References

  1. Blakey-Milner, B.; Gradl, P.; Snedden, G.; Brooks, M.; Pitot, J.; Lopez, E.; Leary, M.; Berto, F.; du Plessis, A. Metal additive manufacturing in aerospace: A review. Mater. Des. 2021, 209, 110008. [Google Scholar] [CrossRef]
  2. Zhou, B.; Xu, P.; Li, W.; Liang, Y.; Liang, Y. Microstructure and anisotropy of the mechanical properties of 316l stainless steel fabricated by selective laser melting. Metals 2021, 11, 775. [Google Scholar] [CrossRef]
  3. Babaev, A.; Promakhov, V.; Schulz, N.; Semenov, A.; Bakhmat, V.; Vorozhtsov, A. Processes of Physical Treatment of Stainless Steels Obtained by Additive Manufacturing. Metals 2022, 12, 1449. [Google Scholar] [CrossRef]
  4. Ma, M.; Wang, Z.; Zeng, X. A comparison on metallurgical behaviors of 316L stainless steel by selective laser melting and laser cladding deposition. Mater. Sci. Eng. A 2017, 685, 265–273. [Google Scholar] [CrossRef]
  5. Ansari, P.; Rehman, A.U.; Pitir, F.; Veziroglu, S.; Mishra, Y.K.; Aktas, O.C.; Salamci, M.U. Selective laser melting of 316l austenitic stainless steel: Detailed process understanding using multiphysics simulation and experimentation. Metals 2021, 11, 1076. [Google Scholar] [CrossRef]
  6. Harun, W.S.W.; Kamariah, M.S.I.N.; Muhamad, N.; Ghani, S.A.C.; Ahmad, F.; Mohamed, Z. A review of powder additive manufacturing processes for metallic biomaterials. Powder Technol. 2018, 327, 128–151. [Google Scholar] [CrossRef]
  7. American Iron and Steel Institute. Design Guidelines for the Selection and Use of Stainless Steel; Specialty Steel Industry of the United States; American Iron and Steel Institute: Detroit, MI, USA, 1993. [Google Scholar]
  8. Ko, G.; Kim, W.; Kwon, K.; Lee, T.K. The Corrosion of Stainless Steel Made by Additive Manufacturing: A Review. Metals 2021, 11, 516. [Google Scholar] [CrossRef]
  9. Jiao, Z.H.; Xu, R.D.; Yu, H.C.; Wu, X.R. Evaluation on Tensile and Fatigue Crack Growth Performances of Ti6Al4V Alloy Produced by Selective Laser Melting. Procedia Struct. Integr. 2017, 7, 124–132. [Google Scholar] [CrossRef]
  10. Waller, J.M.; Parker, B.H.; Hodges, K.L.; Burke, E.R.; Walker, J.L. Nondestructive Evaluation of Additive Manufacturing State-of-the-Discipline Report; Nasa/Tm-2014-218560; Langley Research Center, National Aeronautics and Space Administration: Hampton, VA, USA, 2014; pp. 1–36. [Google Scholar] [CrossRef]
  11. AlMangour, B.; Grzesiak, D.; Yang, J.M. Selective laser melting of TiB2/316L stainless steel composites: The roles of powder preparation and hot isostatic pressing post-treatment. Powder Technol. 2017, 309, 37–48. [Google Scholar] [CrossRef]
  12. Facchini, L.; Vicente, N.; Lonardelli, I.; Magalini, E.; Robotti, P.; Alberto, M. Metastable austenite in 17-4 precipitation-hardening stainless steel produced by selective laser melting. Adv. Eng. Mater. 2010, 12, 184–188. [Google Scholar] [CrossRef]
  13. Coulson, S. Analysis of Additively Manufactured 17-4ph Stainless Steel; McMaster University: Hamilton, ON, Canada, 2018; 4p. [Google Scholar]
  14. Syarif, J.; Yousuf, M.H.; Sajuri, Z.; Baghdadi, A.H.; Merabtene, M.; Omar, M.Z. Effect of partial solution treatment temperature on microstructure and tensile properties of 440C martensitic stainless steel. Metals 2020, 10, 694. [Google Scholar] [CrossRef]
  15. Khuenkaew, T.; Kanlayasiri, K. Resistance spot welding of SUS316L austenitic/SUS425 ferritic stainless steels: Weldment characteristics, mechanical properties, phase transformation and solidification. Metals 2019, 9, 710. [Google Scholar] [CrossRef] [Green Version]
  16. Kain, V. Stress Corrosion Cracking (SCC) in Stainless Steels; Woodhead Publishing Limited: Sawston, UK, 2011. [Google Scholar] [CrossRef]
  17. Mahmoudi, M.; Elwany, A.; Yadollahi, A.; Thompson, S.M. Mechanical and microstructural characterization of selective laser melted 17-4 PH stainless steel. Rapid Prototyp. J. 2017, 23, 280–294. [Google Scholar] [CrossRef] [Green Version]
  18. Fauzi, F.M.; Jamhari, F.I.; Ahmad Buhairi, M. Pencirian dan Perbandingan Serbuk Aloi Titanium (Ti6Al4V) yang Digunakan dalam Peleburan Laser Selektif (SLM). Sains Malaysiana 2022, 51, 1885–1894. [Google Scholar]
  19. Gorsse, S.; Hutchinson, C.; Gouné, M.; Banerjee, R. Additive manufacturing of metals: A brief review of the characteristic microstructures and properties of steels, Ti-6Al-4V and high-entropy alloys. Sci. Technol. Adv. Mater. 2017, 18, 584–610. [Google Scholar] [CrossRef] [PubMed] [Green Version]
  20. Aripin, M.A.; Sajuri, Z.; Junaidi, S.; Baghdadi, A.H.; Mohamed, I.F. Evaluation of Microstructure and Porosity for 3D Printed Stainless Steel. Mater. Today Proc. 2022, 66, 3082–3086. [Google Scholar] [CrossRef]
  21. Ahmad Buhairi, M.; Mohd Foudzi, F.; Jamhari, F.I.; Sulong, A.B.; Mohd Radzuan, N.A.; Muhamad, N.; Mohamed, I.F.; Azman, A.H.; Wan Harun, W.S.; Al-Furjan, M.S.H. Review on volumetric energy density: Influence on morphology and mechanical properties of Ti6Al4V manufactured via laser powder bed fusion. Prog. Addit. Manuf. 2022. [Google Scholar] [CrossRef]
  22. Zhang, B.; Li, Y.; Bai, Q. Defect Formation Mechanisms in Selective Laser Melting: A Review. Chin. J. Mech. Eng. Engl. Ed. 2017, 30, 515–527. [Google Scholar] [CrossRef] [Green Version]
  23. Gong, H.; Gu, H.; Zeng, K.; Dilip, J.J.S.; Pal, D.; Stucker, B. Melt pool characterization for selective laser melting of Ti-6Al-4V pre-alloyed powder. In Proceedings of the 25th Annual International Solid Freeform Fabrication Symposium: An Additive Manufacturing Conference, Austin, TX, USA, 4–6 August 2014; pp. 256–267. [Google Scholar]
  24. Jacob, G. Prediction of Solidification Phases in Cr-Ni Stainless Steel Alloys Manufactured by Laser Based Powder Bed Fusion Process; National Institute of Standards and Technology, US Department of Commerce: Washington, DC, USA, 2018; pp. 1–38. [Google Scholar]
  25. Yusuf, S.M.; Gao, N. Influence of energy density on metallurgy and properties in metal additive manufacturing. Mater. Sci. Technol. 2017, 33, 1269–1289. [Google Scholar] [CrossRef]
  26. Mfusi, B.J.; Tshabalala, L.C.; Popoola, A.P.I.; Mathe, N.R. The effect of selective laser melting build orientation on the mechanical properties of AlSi10Mg parts. IOP Conf. Ser. Mater. Sci. Eng. 2018, 430, 012028. [Google Scholar] [CrossRef] [Green Version]
  27. Ronneberg, T.; Davies, C.M.; Hooper, P.A. Revealing relationships between porosity, microstructure and mechanical properties of laser powder bed fusion 316L stainless steel through heat treatment. Mater. Des. 2020, 189, 108481. [Google Scholar] [CrossRef]
  28. Casati, R.; Lemke, J.; Vedani, M. Microstructure and Fracture Behavior of 316L Austenitic Stainless Steel Produced by Selective Laser Melting. J. Mater. Sci. Technol. 2016, 32, 738–744. [Google Scholar] [CrossRef]
  29. Sames, W.J.; List, F.A.; Pannala, S.; Dehoff, R.R.; Babu, S.S. The metallurgy and processing science of metal additive manufacturing. Int. Mater. Rev. 2016, 61, 315–360. [Google Scholar] [CrossRef]
  30. Tucho, W.M.; Lysne, V.H.; Austbø, H.; Sjolyst-Kverneland, A.; Hansen, V. Investigation of effects of process parameters on microstructure and hardness of SLM manufactured SS316L. J. Alloys Compd. 2018, 740, 910–925. [Google Scholar] [CrossRef]
  31. Adeyemi, A.; Akinlabi, E.T.; Mahamood, R.M. Powder bed based laser additive manufacturing process of stainless steel: A review. Mater. Today Proc. 2018, 5, 18510–18517. [Google Scholar] [CrossRef]
  32. ASTM. E975 Standard Practice for X-Ray Determination of Retained Austenite in Steel with Near Random Crystallographic Orientation; ASTM: West Conshohocken, PA, USA, 2013. [Google Scholar]
  33. Slotwinski, J.A.; Garboczi, E.J.; Stutzman, P.E.; Ferraris, C.F.; Watson, S.S.; Peltz, M.A. Characterization of metal powders used for additive manufacturing. J. Res. Natl. Inst. Stand. Technol. 2014, 119, 460–493. [Google Scholar] [CrossRef]
  34. Gu, H.; Gong, H.; Pal, D.; Rafi, K.; Starr, T.; Stucker, B. Influences of energy density on porosity and microstructure of selective laser melted 17-4PH stainless steel. In Proceedings of the 2013 International Solid Freeform Fabrication Symposium, Austin, TX, USA, 12–14 August 2013; pp. 474–489. [Google Scholar]
  35. Vander Voort, G.F.; Lucas, G.M.; Manilova, E.P. Metallography and Microstructures of Stainless Steels and Maraging Steels. Metallogr. Microstruct. 2004, 9, 670–700. [Google Scholar] [CrossRef]
  36. Blinn, B.; Klein, M.; Gläßner, C.; Smaga, M.; Aurich, J.C.; Beck, T. An investigation of the microstructure and fatigue behavior of additively manufactured AISI 316L stainless steel with regard to the influence of heat treatment. Metals 2018, 8, 220. [Google Scholar] [CrossRef] [Green Version]
  37. ASTM. A 240/A 240Ma: Standard Specification for Chromium and Chromium-Nickel Stainless Steel Plate, Sheet, and Strip for Pressure Vessels and for General Applications; ASTM: West Conshohocken, PA, USA, 2016. [Google Scholar]
  38. Irrinki, H.; Jangam, J.S.D.; Pasebani, S.; Badwe, S.; Stitzel, J.; Kate, K.; Gulsoy, O.; Atre, S.V. Effects of particle characteristics on the microstructure and mechanical properties of 17-4 PH stainless steel fabricated by laser-powder bed fusion. Powder Technol. 2018, 331, 192–203. [Google Scholar] [CrossRef]
  39. Bhaduri, A.K.; Gill, T.P.S.; Srinivasan, G.; Sujith, S. Optimised post-weld heat treatment procedures and heat input for welding 17-4PH stainless steel. Sci. Technol. Weld. Join. 1999, 4, 295–301. [Google Scholar] [CrossRef]
  40. Zai, L.; Zhang, C.; Wang, Y.; Guo, W.; Wellman, D.; Tong, X.; Tian, Y. Laser powder bed fusion of precipitation-hardened martensitic stainless steels: A review. Metals. 2020, 10, 255. [Google Scholar] [CrossRef] [Green Version]
  41. Gorni, A.A. Steel Forming and Heat Treating Handbook; Sao Vicente, Cape Verde, 2018; Available online: http://www.chte.org/d/file/p/2013-01-22/bbf30bc70b449796e79d568fe864a802.pdf (accessed on 15 April 2019). [CrossRef]
  42. Murr, L.E.; Martinez, E.; Hernandez, J.; Collins, S.; Amato, K.N.; Gaytan, S.M.; Shindo, P.W. Microstructures and properties of 17-4 PH stainless steel fabricated by selective laser melting. J. Mater. Res. Technol. 2012, 1, 167–177. [Google Scholar] [CrossRef] [Green Version]
  43. Donik; Kraner, J.; Paulin, I.; Godec, M. Influence of the Energy Density for Selective Laser Melting on the Microstructure and Mechanical Properties of Stainless Steel. Metals 2020, 10, 919. [Google Scholar] [CrossRef]
  44. Ponnusamy, P.; Masood, S.H.; Ruan, D.; Palanisamy, S.; Rahman Rashid, R.A.; Mohamed, O.A. Mechanical performance of selective laser melted 17-4 PH stainless steel under compressive loading. In Proceedings of the 2017 International Solid Freeform Fabrication Symposium, Austin, TX, USA, 7–9 August 2017; pp. 321–331. [Google Scholar]
  45. Pilehrood, A.E.; Mashhuriazar, A.; Baghdadi, A.H.; Sajuri, Z.; Omidvar, H. Effect of Laser Metal Deposition Parameters on the Characteristics of Stellite 6 Deposited Layers on. Materials 2021, 14, 5662. [Google Scholar] [CrossRef] [PubMed]
  46. Condruz, M.R.; Paraschiv, A.; Puscasu, C. Heat Treatment Influence on Hardness and Microstructure of Adam Manufactured 17-4 Ph. Turbo 2018, 5, 4–11. Available online: https://www.researchgate.net/publication/332423408 (accessed on 15 April 2019).
  47. Lass, E.A.; Zhang, F.A.N.; Campbell, C.E. Nitrogen Effects in Additively Manufactured Martensitic Stainless Steels: Conventional Thermal Processing and Comparison with Wrought. Metall. Mater. Trans. A 2020, 51, 2318–2332. [Google Scholar] [CrossRef]
  48. Sabooni, S.; Chabok, A.; Feng, S.C.; Blaauw, H.; Pijper, T.C.; Yang, H.J.; Pei, Y.T. Laser powder bed fusion of 17–4 PH stainless steel: A comparative study on the effect of heat treatment on the microstructure evolution and mechanical properties. Addit. Manuf. 2021, 46, 102176. [Google Scholar] [CrossRef]
  49. Leo, P.; D’Ostuni, S.; Perulli, P.; Sastre, M.A.C.; Fernández-Abia, A.I.; Barreiro, J. Analysis of microstructure and defects in 17-4 PH stainless steel sample manufactured by Selective Laser Melting. Procedia Manuf. 2019, 41, 66–73. [Google Scholar] [CrossRef]
  50. Yadollahi, A.; Shamsaei, N.; Thompson, S.M.; Elwany, A.; Bian, L. Effects of building orientation and heat treatment on fatigue behavior of selective laser melted 17-4 PH stainless steel. Int. J. Fatigue 2017, 94, 218–235. [Google Scholar] [CrossRef]
  51. Hu, Z.; Zhu, H.; Zhang, H.; Zeng, X. Experimental investigation on selective laser melting of 17-4PH stainless steel. Opt. Laser Technol. 2017, 87, 17–25. [Google Scholar] [CrossRef]
  52. Kamariah, M.S.I.N.; Harun, W.S.W.; Khalil, N.Z.; Ahmad, F.; Ismail, M.H.; Sharif, S. Mechanical Behaviours of Selective Laser Melting 316L Stainless Steel. J. Addit. Manuf. Adv. Mater. 2020, 257, 012021. [Google Scholar] [CrossRef]
  53. Li, L. Repair of directionally solidified superalloy GTD-111 by laser-engineered net shaping. J. Mater. Sci. 2006, 41, 7886–7893. [Google Scholar] [CrossRef]
  54. Cegan, T.; Pagac, M.; Jurica, J.; Skotnicova, K.; Hajnys, J.; Horsak, L.; Soucek, K.; Krpec, P. Effect of hot isostatic pressing on porosity and mechanical properties of 316L stainless steel prepared by the selective laser melting method. Materials 2020, 13, 4377. [Google Scholar] [CrossRef] [PubMed]
  55. Tascioglu, E.; Karabulut, Y.; Kaynak, Y. Correction to: Influence of heat treatment temperature on the microstructural, mechanical, and wear behavior of 316L stainless steel fabricated by laser powder bed additive manufacturing. Int. J. Adv. Manuf. Technol. 2020, 107, 1957. [Google Scholar] [CrossRef] [Green Version]
  56. Vallejo, N.D.; Lucas, C.; Ayers, N.; Graydon, K.; Hyer, H.; Sohn, Y. Process optimization and microstructure analysis to understand laser powder bed fusion of 316L stainless steel. Metals 2021, 11, 832. [Google Scholar] [CrossRef]
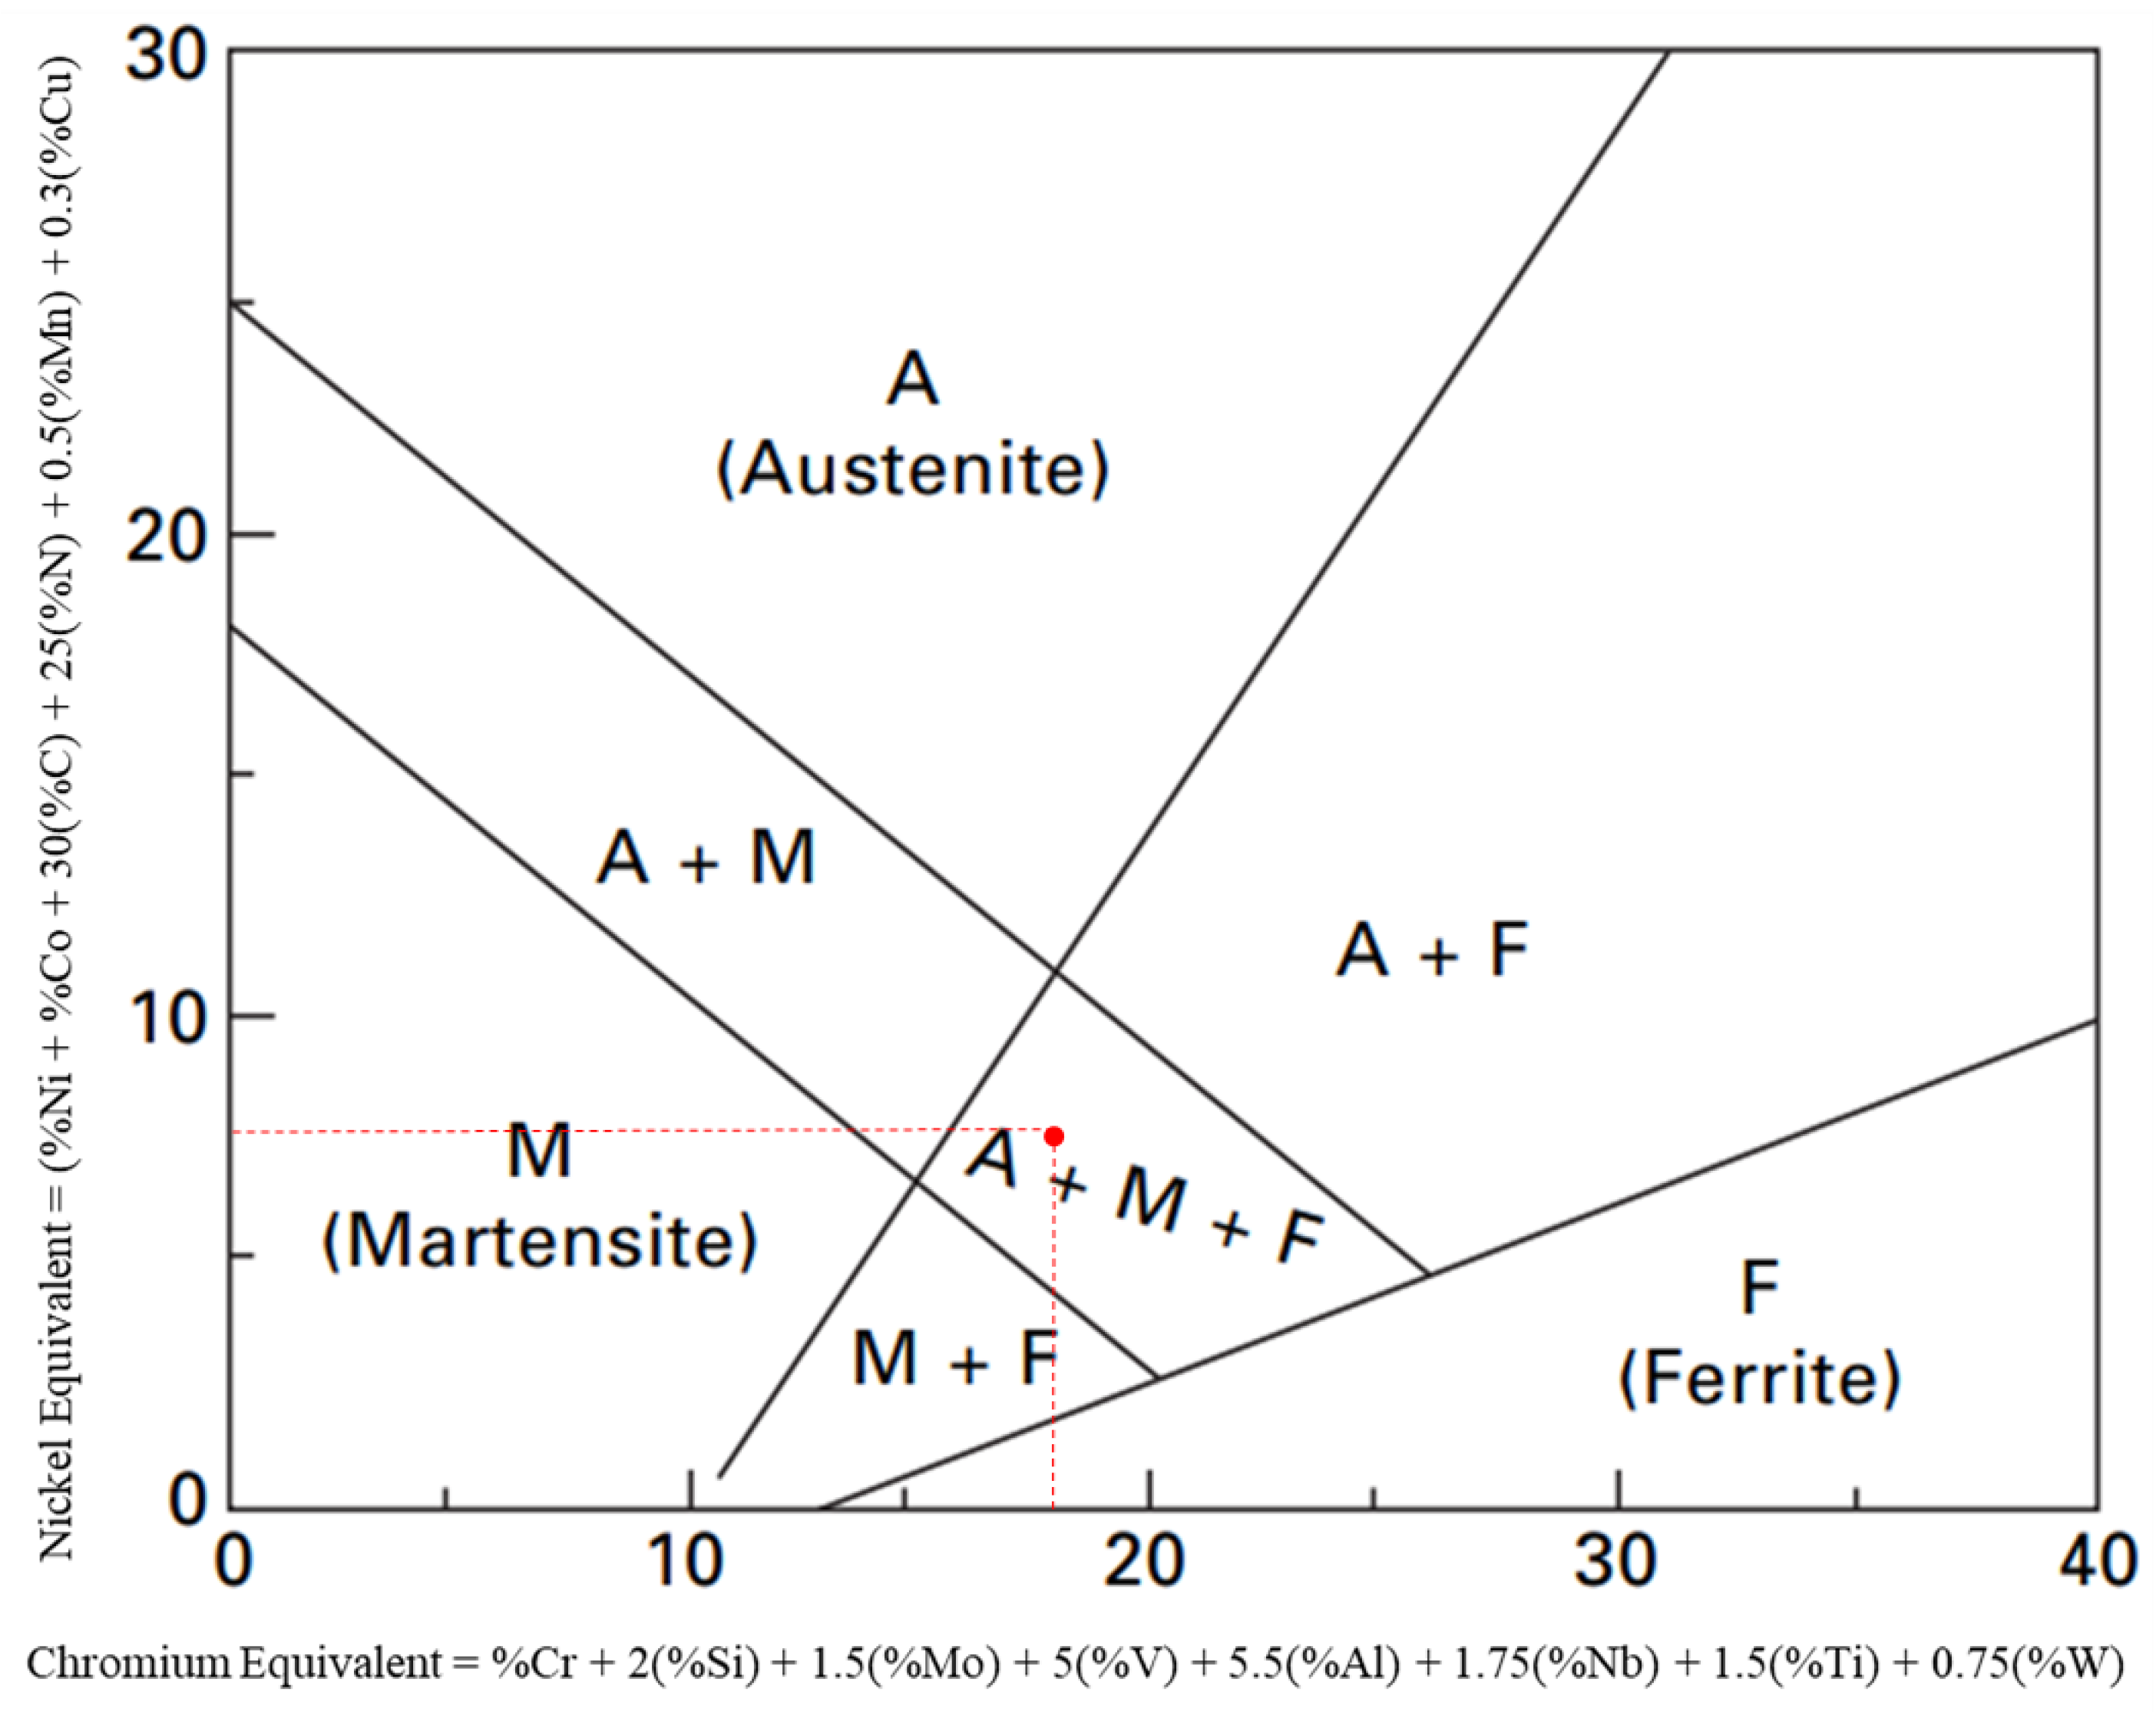
Figure 1. Possible phases of 17-4 PH shown in red dot according to Schaffler Diagram (reproduced with permission from Elsevier, 2022) [15,16].
Metals 12 01968 g001
Figure 2. (a) EOSINT machine, (b) schematic diagram of processing parameters, (c) schematic diagram of layers and laser paths, and (d) build orientation of the specimen.
Metals 12 01968 g002
Figure 3. Powder morphology reveal by SEM observation at (a) 250 and (b) 1000 magnification scale.
Metals 12 01968 g003
Figure 4. Particle size distribution of the 17-4 PH utilized in this research D10 = 33 μm, D50 = 43 μm and D90 = 52 μm.
Metals 12 01968 g004
Figure 5. The fraction of liquid and solid phase vs. temperature for 17-4 PH.
Metals 12 01968 g005
Figure 6. Volume fraction of phases recorded at (a) 0°, (b) 45° and (c) 90°.
Metals 12 01968 g006
Figure 7. Microstructure profile for 0° build direction.
Metals 12 01968 g007
Figure 8. Microstructure profile for 90° build direction.
Metals 12 01968 g008
Figure 9. Microstructure profile for 45° build direction.
Metals 12 01968 g009
Figure 10. Columnar lath generation acress multiple meltpools.
Metals 12 01968 g010
Figure 11. Identification of (a,b) austenite phase in build direction and transverse direction and (c,d) martensite phase in build and transverse direction.
Metals 12 01968 g011aMetals 12 01968 g011b
Figure 12. Hardness value for 0° and 90° build direction.
Metals 12 01968 g012
Figure 13. The types of porosity observed from three different areas of 90° build direction; (a) crescent shape, (b) unmelted powder, (c) keyhole and (d) spherical porosity.
Metals 12 01968 g013
Figure 14. The types of porosity observed from three different areas of 45° build direction; (a) crescent shape, (b) unmelted powder, (c) keyhole and (d) spherical porosity.
Metals 12 01968 g014
Figure 15. The type of porosity observed from three different areas of 0° build direction; (a) keyhole and (b) spherical porosity.
Metals 12 01968 g015
Figure 16. Schematic diagram of 14-7 microstructure produced by SLM method.
Metals 12 01968 g016
Figure 17. Stress strain curve for all build direction.
Metals 12 01968 g017
Figure 18. The direction of the melt pool boundary for each build direction respective to the load direction.
Metals 12 01968 g018
Figure 19. Crack coalescence and propagation for 90°.
Metals 12 01968 g019
Figure 20. Fracture surface overall under SEM observation including flat and cleavage surface.
Metals 12 01968 g020
Figure 21. SEM of a fractured surface under 200× and 5000× magnification for (a) cleavage surface and (b) flat surface.
Metals 12 01968 g021
Table 1. SLM process parameters.
Process ParametersParameters Value
Laser power200 W
Laser scanning speed800 mm/s
Layer thickness30 µm
Hatching distance100 ± 10 μm
Temperature range1075–1125 °C
Heat TreatmentAir-cooled
Average powder size43 µm
Table 2. Chemical composition of the 17-4 PH powder.
ElementFeCrNiCuCSiMn
wt. %Bal.15.764.024.080.071.230.59
Table 3. Mechanical properties for three different build orientations.
Build OrientationTensile Strength (MPa)Elongation (%)Yield Strength (MPa)Strain Energy (J)
958 ± 126 ± 0.6472 ± 968 ± 1.5
45°744 ± 925 ± 0.6481 ± 554 ± 0.8
90°615 ± 738 ± 1.5442 ± 577 ± 4.9
Publisher’s Note: MDPI stays neutral with regard to jurisdictional claims in published maps and institutional affiliations.