Abstract
This article describes a new quantitative evaluation method for the degree of dissociation of a compound depending on the curvature of the liquidus line curve. The main point of this method was to determine the specific expressions for dissociation parameters according to the mathematical model of the crystallization line of the compound on the phase diagram. This was based on generally accepted thermodynamic relations. Empirically, it has now been established that for many types of phase equilibria, a common feature is the presence of a correlation dependence between the ratios of the real Gibbs energy of the distribution of components to its ideal component. The osmotic coefficient of Bjerrum–Guggenheim was used as a measure of the deviation of the system from ideality. This coefficient can be in an analytical form depending on the temperature and composition of the phases. The obtained correlation dependence of the osmotic coefficient of Bjerrum–Guggenheim on the ratio of the activity of the liquid and solid phase has been used to develop a mathematical apparatus to analytically describe the lines and surfaces of the crystallization phases. Accordingly, a single analytical basis, as a universal dependence of the modified Schröder–Le Chatelier equation, has been applied. Based on this equation, the conditions have been defined to develop an equilibrium method with which to calculate the thermal dissociation of chemical compounds. The principle of this method has been examined based on the two-component iron-titanium system. The numerical results of the degree of dissociation of the congruent Fe2Ti compound have been obtained using the Gibbs energy of the dissociation reaction and the reaction constant. However, it has been found that the degree of dissociation in the compound Fe2Ti was 0.04%. Demonstrative material for the behavior of the osmotic coefficient of Bjerrum–Guggenheim under boundary conditions has been presented as an assessment criterion of melt structures. The diagrams of the Φi function of the crystallizing phases near the melting temperature of congruently melting compounds (Tm.) have been mathematically studied. Thus, this study demonstrates that Φ diagrams tended to zero and approached the melting temperature of the compound , i.e., above the melting temperature of this compound Φ→∞; then,→0, and, as a result, →1.
1. Introduction
The thermal dissociation theory has been steadily developing over the past few years. However, many issues regarding the assessment of the degree of dissociation have yet to be comprehensively studied. An analysis of the literature analysis has shown that the peak of thermal dissociation research was in the 1870–the 1880s [1]. The classical theory of thermal dissociation evaluate the state of the dissociation products of a chemical reaction. It was based on the transition of a substance from a condensed state into a gaseous state [1]. Thus, a question has arisen regarding the way in which to use this approach in the interaction of two condensed phases or simultaneously in several chemical reactions [2]. The most promising direction for developing the thermodynamic calculations of the degree of dissociation in compounds is the equilibrium method for calculating the dissociation parameters of a compound based on the analysis of the monovariant equilibrium line [3].
This article proposes a quantitative evaluation method to determine the degree of dissociation in a compound depending on the curvature of the liquidus line curve [1]. The essence of this method concerns the establishment of specific expressions for dissociation parameters according to the mathematical model of the crystallization line of the compound on a phase diagram. For this purpose, generally accepted thermodynamic relations have been applied. Empirically, it has now been established that for many types of phase equilibria, a common feature is the presence of correlation dependence between the ratios of the real Gibbs energy of the distribution of components to its ideal component. The osmotic coefficient of Bjerrum–Guggenheim can be easily represented in an analytical form depending on the temperature and phase composition. This coefficient can measure the deviation of a system from ideality [4]. The established correlation dependence of the osmotic coefficient of Bjerrum–Guggenheim to the ratio of the activity of the liquid and solid phase has created a mathematical apparatus to analytically describe the lines and surfaces of the crystallization phases. For this purpose, a single analytical basis, as a universal dependence of the modified Schröder–Le Chatelier equation, has been used. This equation might be applied to all types of phase diagrams (eutectic, isomorphic cigar-type, and those with extreme points on the monovariant equilibrium lines, with limited solubility of the components in the solid state and during phase separation) for a whole class of systems (metals, oxides, water, etc.) as a function of temperature and composition. The basic relations between the thermodynamic constants of the initial components of the systems and the coordinates of the singular points of their phase diagrams have been determined. They can be used to develop methods for determining the positions of liquidus, vapor, etc., according to the positions of the solidus lines or vice versa on the solid–liquid and liquid–vapor equilibrium diagrams, respectively.
The basic equations of the method of mathematically describing monovariant phase equilibrium lines.
The developed mathematical expression method regarding the crystallization fields of phases is based on the property deviation of the real solution (melt) from the ideal one. The known Bjerrum–Guggenheim coefficient (Φi) has been used as a measure of deviation [3].
Thus, the change in the distribution coefficients of the components between the solid and liquid phases along the liquidus and solidus lines on the phase diagrams can be represented as follows (1):
The ratio of the activities of the components in the melt along the phase equilibrium line and at the temperature for the real systems has been calculated using the Schröder–Le Chatelier formulas given in Equations (2) and (3):
where is the enthalpy of melting the first and second components at the melting temperature, J/mol; R is a universal gas constant, J/mol K; is the melting temperature of the first and second components; T is the crystallization temperature of the melts from the melting temperature to the eutectic, K; and ΔCp,1(2) is the change in heat capacity.
The coefficient (Φi) has characterized the deviation degree from the ideal energy state of the component under the equilibrium conditions. Therefore, when this deviation increased, the interparticle interaction of this component with other components was stronger.
This interaction could be divided into two components as follows: van der Waals interaction was an interatomic or intermolecular interaction in any system melt, and the directed interaction was related to the directed hetero- and homeopolar bonds between the components in the melt, i.e., to the formation of clusters. They are represented in the form of (4) and (5):
or
The expressions of (2, 3, 4) have derived the semi-empirical dependences as generalized Schröder–Le Chatelier equations. They could calculate the liquidus and solidus lines for any real system in the crystallization region of the relevant phase by the dependences (6):
The solution of Equation (6) has given the mathematical expressions for the solidus and liquidus lines for the real systems:
These equations of the liquidus line (L) and solidus line (S) were for any type of phase diagram. For these equations, first of all, it was necessary to find the empirical expressions of (4) and (5) for each crystallizing phase (plus the second component) in all parts of the phase diagram of the studied binary system.
Equations (4)–(7) have been used to develop a method for the processing of the experimental data [5,6,7,8,9,10,11,12,13].
Based on the two-component iron-titanium system (Figure 1), the principle of this method has been studied, and the numerical results on the degree of dissociation of the Fe2Ti congruent compound have been obtained using the Gibbs energy of the dissociation reaction and reaction constant.
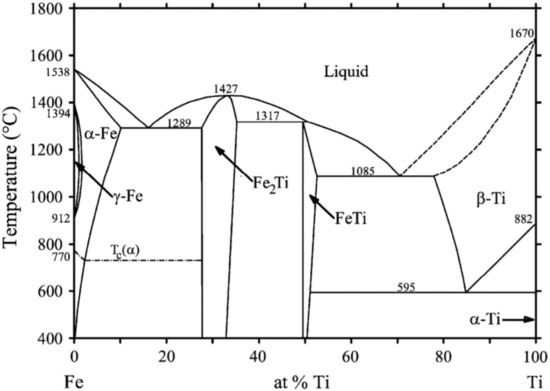
Figure 1.
The phase diagram of Fe-Ti [13].
The initial data have been processed from the melting temperature of Fe2Ti. The interval was one degree below the melting temperature of Fe2Ti, equal to 1700 K. The numerical values of the osmotic coefficient of Bjerrum–Guggenheim have been determined on the ratio of the activity of the liquid and solid phases / and are presented in Table 1.

Table 1.
The initial data of the Fe2Ti crystallization region of the Fe2Ti-Fe quasi-system.
Based on the initial data (Table 1), the dependence diagram of the osmotic coefficient of the Bjerrum–Guggenheim on the ratio of the activity of the liquid and solid phases has been plotted (Figure 2).
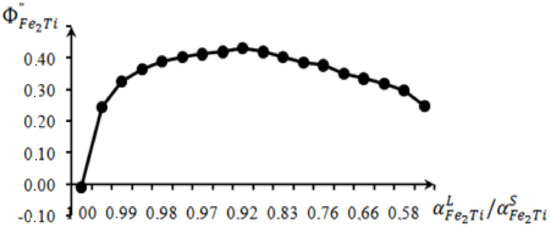
Figure 2.
The dependence of the Bjerrum–Guggenheim coefficient.
on for particular Fe2Ti-Fe systems.
The least squares method for a curvilinear dependence has obtained a mathematical expression for the osmotic coefficient of Bjerrum–Guggenheim on the ratio of the activity of the liquid and solid phases as follows (8):
For the curvelinear regression, the dispersion degree (σ) [6] is used by the formula:
The dispersion value is σ = 0.0032.
The liquidus line equation for the particular Fe2Ti-Fe system is presented below (10):
Table 2 determines the comparative analysis of the experimental compositions (from the phase diagram of Fe-Ti) and the calculated data under Equations (2) and (3).
Table 2.
The comparative analysis of the experimental and calculated data of Fe2Ti crystallization along the monovariant phase equilibrium line for the Fe2Ti-Fe system.
The dependence diagram (Figure 2) of the osmotic coefficient of Bjerrum–Guggenheim on the ratio of the activity has demonstrated a significant convexity of the diagram and an abrupt jump from the melting temperature. This fact has shown that the dissociation of the congruent compound Fe2Ti was observed in small amounts. Then, the smooth transition declined. The long-term observations of the behavior of the dependence diagrams on along the monovariant phase equilibrium line for the crystallization regions of the pure substances and the chemical compounds have resulted in the osmotic coefficient of Bjerrum–Guggenheim, which has a good structure-sensitive characteristic of the melt structure. For instance, at a temperature of the phase transition for the systems of Fe-Si, Fe-Al, etc., the dependence diagrams of the Bjerrum–Guggenheim coefficient have given an abrupt jump. We detected this abrupt jump before the publication of the collection of abstracts [7,8,9,10,11,12]. The change in the melt properties in the crystallization region of a chemical compound has shown that the convexity of the diagrams indicated dissociation, and the concavity of the diagrams pointed out the association of the components.
The Fe2Ti crystallization region and behavior of the osmotic coefficient of Bjerrum–Guggenheim on the ratio of activity should be studied using titanium. The initial data for the second crystallization region of the congruent Fe2Ti compound has been presented in Table 3. The thermodynamic characteristics to calculate the Schröder–Le Chatelier equation for the ideal system have been taken as described in [14,15] (ΔH 121,584.32 J/mol, Tm = 1700 K).
Table 3.
The initial data of the Fe2Ti crystallization region for the particular Fe2Ti-Ti system.
These diagrams had a weak dissociation. The practically rectilinear character of the change in Φ with temperature has indicated the presence of van der Waals interactions between the particles in the melt. The consistency of the degree of ferrotitanium dissociation has been observed during the melt composition change along the liquidus and solidus from its melting temperature to the eutectic temperature in the Fe2Ti- Ti system.
Figure 3 shows the dependence of the Bjerrum–Guggenheim coefficient on for the particular Fe2Ti-Ti system.
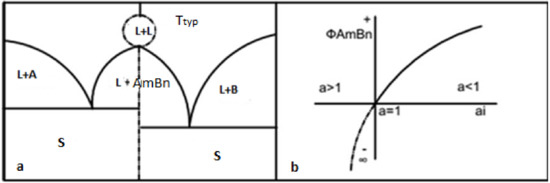
Figure 3.
(a) The schematic display image of the phase diagram with formation of a complex chemical compound and the continuation of the liquidus line above the melting temperature on one and the other side of the AmBn compound; (b) the dependence diagram of the Bjerrum–Guggenheim coefficient near the melting point of the AmBn compound.
The mathematical expression of the osmotic coefficient of Bjerrum–Guggenheim on the ratio of the activity of the liquid and solid phases have been obtained by the least-squares method for the curvilinear dependence as follows:
The liquidus line equation for the particular Fe2Ti-Ti system is presented by Formula (12):
Table 4 describes the comparative experimental and calculated data for Equations (4) and (5), and the variance of convergence is 0.0083.
Table 4.
The comparative experimental and calculated data of the Fe2Ti crystallization region using Fe2Ti-Ti titanium.
Therefore, two Fe2Ti crystallization regions have been examined. The mathematical expressions of the crystallization field have been presented as the modified Schröder–Le Chatelier equation with a good convergence of the calculated and experimental data. It has been shown graphically that the osmotic coefficient of Bjerrum–Guggenheim was a structurally sensitive characteristic. The example of the Fe-Ti system for two crystallization regions of Fe2Ti using iron and titanium has found that the compound was very stable; it dissociated poorly and had an acute maximum on the phase diagram.
2. The Equilibrium Method to Calculate Dissociation Parameters of the Congruent Compound Based on the Monovariant Equilibrium Line Analysis
The previously developed method to describe the monovariant phase equilibrium lines while using the osmotic coefficient of Bjerrum–Guggenheim has obtained a fairly accurate mathematical expression as the modified Schröder–Le Chatelier Equation (6). It described the real position of the liquidus and solidus lines on the phase diagram.
However, in the areas of congruently melting compounds, the dependence diagrams of Φiona/a did not reflect on the rectilinear segment. The same situation was observed when the compounds were recalculated on the particular systems. Thus, the purpose of this study was to determine the true Φi′ values when using the degree of dissociation of the chemical compound.
The study of complex systems with various chemical conversions has been accompanied by a change in composition, and it has required the introduction of new variable values characterizing these changes. One of the characteristics was the process completion rate. The process completion rate could be expressed by the degree of dissociation. The degree of dissociation was the ratio of the number of dissociated molecules of a substance at the moment of equilibrium to the total number of molecules of a given substance before dissociation, i.e., the fraction of a substance that dissociated at the moment that the equilibrium was equal to:
where, dni is the number of dissociated molecules; nio is the initial number of molecules.
The position of the monovariant phase equilibrium lines has been calculated in the ,=system of the arbitrary composition, including + = 1. Based on this approach, the degree of dissociation of a chemical compound has changed numerically from 0 to .
The number of substance moles has been calculated in the equilibrium state of the system after the decay of the moles of the AmB compound:
where is the rest undissociated moles of the AmB compound.
where is the increase in the number of A moles due to the A moles that appeared during the dissociation of the AmB compound.
where, is the number of B moles that appear during the dissociation of the AmB compound.
Where, , , is the number of moles of the AmB, A, B compounds in an equilibrium state, , , is the number of moles of the AmB and A compounds in the initial state.
The total number of moles of AmB, A, and B in the mixture is as follows:
Thus, if a pure compound was examined where = 1, could numerically (no dissociation) vary from zero to one, there would be a complete dissociation of the compound.
The first approximation has assumed that the dissociation field of the moles of the AmB compound into particles (i.e., components of AmB, A, and B) in the melt could form an ideal solution. Then, the mole fraction of each component in the mixture would be as follows:
The equilibrium constant has been expressed in the dissociation reaction by the mole fractions of the mixture components (i.e., this constant would be called a concentration constant):
This equation has determined the degree of dissociation in the congruently melting compound AB:
Thus, the instance to form the congruently melting compound AmB has shown a calculation method of the true position of the liquidus and solidus lines on the phase diagram using the degree of dissociation of the chemical compound.
The principle of this method has been examined on the basis of the two-component iron-titanium system (Figure 1). The numerical results on the degree of dissociation of the congruent Fe2Ti compound have been obtained using the Gibbs energy of the dissociation reaction and reaction constant.
The method of M.I. Temkin and L.A. Shvartsman [1] has calculated the equilibrium constant. The initial parameters to calculate Gp(T) and Kp are presented in Table 5.
Table 5.
Table of the standard thermodynamic values [15].
Based on the developed software to calculate the Gibbs energy of the hetero-homogeneous reactions for obtaining the calculated data on the equilibrium constant (Kp) and the degree of dissociation (α) of a congruently melting compound using the osmotic coefficient of Bjerrum–Guggenheim, the following temperature intervals have been chosen for the ferrotitanium dissociation reaction: 298,16–1033; 1033–1120; 1120–1185;1185–1667; 1667–1700; 1700–1811; 1811–1933; 1933–1941, and 1941–3000.
Then, the degree of dissociation of the congruently melting compounds was estimated using the osmotic coefficient of Bjerrum–Guggenheim in parallel with the calculation of Δ.
The Gibbs energies of the dissociation reaction of the stable chemical compound Fe2Ti have been obtained. The equilibrium constants along the monovariant phase equilibrium line and the degree of dissociation of the congruently melting compound Fe2Ti for the quasi-systems of Fe2Ti–Fe and Fe2Ti–Ti have been calculated (Table 6).
Table 6.
The calculated thermodynamic data of the Fe-Ti system.
The main condition to calculate correctly is the rectilinearity of the dependence diagrams Φi on a/a, including the degree of dissociation.
In this instance, the straightening of the diagram has not been observed, and thus, other titanium and iron compounds should be used.
However, for the Fe-Ti system, the degree of Fe2Ti dissociation was 0.04%. As a result, it has corresponded to the conclusions of N.S. Kurnakov about the acute maximum for the Fe2Ti compound, i.e., the congruently melting compound was practically stable at the melting temperature.
The evaluation of the degree of dissociation (association) of the congruently melting compound using the osmotic coefficient of Bjerrum–Guggenheim has been able to draw a conclusion about how strongly congruent compounds dissociate during the melting and whether two liquids appear, if so, in this instance a horizontal platform should be formed on the phase diagram.
Unfortunately, the literature review did not give results to search for any experimental data on the degree of the dissociation of titanium alloys. The only source for titanium oxides has given the degree of dissociation () at 1873K equal to 2.5 × 10⁻².
3. A Detailed Study of the Diagrams
The general thermodynamic justification for the existence of a singular maximum has not yet been studied [4,5,6,7,8,9,10,11,12].
A general pattern has been found during the analysis of some phase diagrams of the metallic and oxide systems using the osmotic coefficient of the Bjerrum–Guggenheim concept [9]. The value has fully corresponded to the boundary conditions of almost all types of phase diagrams found in nature and predicted by N.S. Kurnakov [1].
The preliminary studies on some systems of Fe-Ti, Fe-Si, Fe-Al, Fe-Mn, Mn-Si, etc., and the oxide systems of CaO-SiO2, CaO-Al2O3, MnO-SiO2, MnO-Al2O3, Al2O3-SiO2 [9,10,11] have shown that to continue the liquidus line above the melting temperature of the congruent compound, it made a loop and returned to unity (Figure 3a).
Figure 3b illustrates the dependence diagram on the activity.
The dependence diagrams Φ on the ratio of the activity of the liquid and solid phases are illustrated in Figure 3.
To continue the liquidus line above the melting temperature of the congruent compound at T > , thus →∞, as a result, →0, then →1.
The liquidus line, according to our method, has been described by the mathematical expression . This formula is expanded as follows:
where a numerator is a Schröder-Le-Chatelier equation, and a denominator is the osmotic coefficient of the studied phase on the liquidus line at T→ the numerator, and the denominator of this expression tends to zero, i.e., is not defined at the melting point .
The Lopital principle has previously determined that, for such cases, →const is calculated by the dependence coefficients of on the activity (ai, where i-AmBn) and is not numerically equal to one but is very close in value to it. Thus, it indicates the dissociation of the congruent compound during the melting [16,17,18,19,20,21,22,23,24].
In order to confirm the presence of a loop above the melting point of Fe2Ti, according to Equation (3), temperatures of 0.5 degrees below and one degree above the melting point of 1700 K have been used. They are presented in Table 7.
Table 7.
The calculated data to confirm the presence of the liquidus line loop using the Fe-Fe2Ti iron side by Equation (7).
To analyze Equation (7), the tabulated data show that at 1700 K, the composition corresponds to one, then it decreases, and at 1701 K, it is equal to one.
Thus, the presence of a loop has been proved for the crystallization region of the congruent Fe2Ti compound of the Fe2Ti-Fe quasi-system.
The area of the compound has not been detected at the crystallization temperature. This has been proved by the smooth curve of the dependence of the Bjerrum–Guggenheim coefficient on the ratio of the activity .
The acute maximum of the congruently melting compound on the phase diagram has indicated that this compound was dissociated poorly (0.04%) and has been proved by our studies below.
4. Conclusions
The mathematical description method of the monovariant phase equilibrium lines based on the Bjerrum–Guggenheim concept has been used to evaluate the thermal stability of a congruent compound [6].
The semi-empirical dependences of the composition on the temperature as the modified Schröder–Le Chatelier equation have been obtained.
The dependence diagrams of the osmotic coefficient of Bjerrum–Guggenheim on the ratio of the activity of the liquid and solid phases (Schröder–Le Chatelier equation for an ideal system) for the crystallization region of the congruent Fe2Ti compound at its melting temperature has determined a calculated composition close to the experimental data.
An equilibrium method to calculate the dissociation parameters of a compound based on the monovariant equilibrium line analysis has been proposed.
For the Fe-Ti system, the degree of dissociation of Fe2Ti was 0.04% and corresponded to the conclusions of N.S. Kurnakov in terms of the acute maximum for the Fe2Ti compound, i.e., the congruently melting compound was practically stable at the melting temperature.
Author Contributions
Conceptualization, V.V.T. and S.B.; formal analysis, G.I.N. and I.Y.K.; writing—review and editing, G.S.Y., V.V.T. and S.B. All authors have read and agreed to the published version of the manuscript.
Funding
This study was made under the project of the Committee of Science of the Ministry of Education and Science of the Republic of Kazakhstan for 2020–2022, IRN AP08855453/SPh.
Institutional Review Board Statement
Not applicable.
Informed Consent Statement
Not applicable.
Data Availability Statement
Not applicable.
Conflicts of Interest
The authors declare no conflict of interest.
References
- Kulikov, I.S. Thermal dissociation of compounds. In Metallurgy; Springer: Cham, Switzerland, 1966; p. 251. (In Russian) [Google Scholar]
- Kulikov, I.S. Thermodynamics of oxygen. In Metallurgy; Springer: Cham, Switzerland, 1986; p. 344. (In Russian) [Google Scholar]
- Kulikov, I.S. Thermodynamicscarbides and Nitrides. In Metallurgy; Springer: Cham, Switzerland, 2012; pp. 198–320. (In Russian) [Google Scholar]
- Patrick Fleming. Pressure Dependence of Kp—Le Châtelier’s Principle, 13 April 2022. Available online: https://chem.libretexts.org/Bookshelves/Physical_and_Theoretical_Chemistry_Textbook_Maps (accessed on 16 October 2022).
- Denisov, E.T.; Sarkisov, O.M.; Likhtenshtein, G.I. Reactions of ions and radical ions. In Chemical Kinetics, Fundamentals and New Developments; Elsevier: Amsterdam, The Netherlands, 2003; pp. 250–304. [Google Scholar]
- Ozerov, R.P.; Vorobyev, A.A. Molecular Physics, Physics for Chemists; Elsevier: Amsterdam, The Netherlands, 2007; pp. 169–250. [Google Scholar]
- Glazov, V.M.; Pavlova, L.M. Chemical thermodynamics and phase equilibria. In Metallurgy; Springer: Cham, Switzerland, 1981; p. 336. [Google Scholar]
- Kurnakov, N.S. Fav. Tr. T.1.–M.; Publishing House of the Academy of Sciences of the USSR: Moscow, Russian, 1961; p. 635. (In Russian) [Google Scholar]
- Glazov, V.M.; Pavlova, L.M. Chemical thermodynamics and phase equilibria. In Metallurgy; Springer: Cham, Switzerland, 1988; p. 555. [Google Scholar]
- Osipov, A.A.; Ivanov, K.D.; Ashadullin, R.S. Equilibrium dissociation model. In Nuclear Reactor Constants; State Scientific Centre of the Russian Federation: Moscow, Russia, 2018. (In Russian) [Google Scholar]
- Baisanov, S.O.; Tolokonnikova, V.V. Development of the Fundamental Foundations of the Theory of the Liquid State for Binary Systems from the Standpoint of Thermodynamics of Heterogeneous Phase Equilibria; Glassir: Karaganda, Kazahstan, 2017; p. 129. (In Russian) [Google Scholar]
- Ponamarev, A.B.; Pikuleva, A.A. Methodology of Scientific Research; Publishing House Perm National Research Polytechnic University: Perm, Russia, 2014; p. 186. (In Russian) [Google Scholar]
- Tolokonnikova, V.; Baisanov, S.; Narikbayeva, G.; Narikbayeva, I. Assessment of dissociation rate of FeCr2O4 using the Bjerrum-Guggenheim coefficient. Metalurgija 2021, 60, 303–305. [Google Scholar]
- Kubashevsky, O. State diagrams of iron-based binary systems. In Metallurgy; Springer: Cham, Switzerland, 1985; p. 184. (In Russian) [Google Scholar]
- Lukas, H.L.; Fries, S.G.; Sundman, B. Computational Thermodynamics, the Calphad Method; Cambridge University Press: Cambridge, UK, 2007; p. 324. [Google Scholar]
- Krestovnikov, A.N.; Vladimirov, L.P.; Gulyanitsky, V.S.; Fischer, A.Y. Handbook on Calculations of Equilibria of Metallurgical Reactions; GNTI Literature on Ferrous and Non-Ferrous Metallurgy: Moscow, Russia, 1968; p. 416. (In Russian) [Google Scholar]
- Ruzinov, L.P.; Gulyanitsky, V.S. Equilibrium transformations of metallurgical reactions. In Metallurgy; Springer: Cham, Switzerland, 1975; p. 417. (In Russian) [Google Scholar]
- Database. Available online: http://www.outokumpu.fi/hsc/ (accessed on 16 October 2022).
- Zakharov, M.A. Calculation of the types of the main state diagrams of binary solutions within the framework of a generalized lattice model. Bull. Novgorod State Univ. 2016, 98, 22–26. (In Russian) [Google Scholar]
- Shakhnazarov, K.Y. Signs of intermediate phases in Al-Si, Fe-C and Al-Cu systems. Bull. MSTU 2016, 14, 71–77. (In Russian) [Google Scholar]
- Voronin, G.F. New possibilities of thermodynamic calculation and construction of diagrams of phase states of heterogeneous systems. J. Phys. Chem. 2003, 77, 1874–1883. (In Russian) [Google Scholar]
- Moshchenskaya, E.Y.; Clepushkin, V.V. Method of liquids curves constructing of double eutectic systems. J. Inorg. Chem. 2015, 60, 78–84. [Google Scholar]
- Akberdin, A.A.; Kim, A.S.; Sultangaziev, R.B. Planning of numerical and physical experiment in simulation of technological processes. Izv. Ferr. Metall. 2018, 9, 737–742. [Google Scholar] [CrossRef]
- Nurgali, N.Z.; Kelamanov, B.S.; Tazhiev, E.B.; Sariev, O.R.; Abdirashit, A.M.; Burumbayev, A.G.; Zayakin, O.V. Modeling of metal systems Fe-Ti, Ti-Si, Ti-Al Chemical and metallurgical sciences. In KazUTZU Khabarshysy; Department of Physics, Mathematics And Digital Technology: Kostanay, Kazahstan, 2021; pp. 115–121. (In Russian) [Google Scholar]
Publisher’s Note: MDPI stays neutral with regard to jurisdictional claims in published maps and institutional affiliations. |
© 2022 by the authors. Licensee MDPI, Basel, Switzerland. This article is an open access article distributed under the terms and conditions of the Creative Commons Attribution (CC BY) license (https://creativecommons.org/licenses/by/4.0/).