Article

Interfacial Polarization-Dominated Dielectric Loss in SnO2@rGO Electromagnetic Wave Absorbers

1
Department of Applied Physics, School of Science, Chang’an University, Xi’an 710064, China
2
Chang’an Dublin International College of Transportation, Chang’an University, Xi’an 710064, China
3
MOE Key Laboratory of Material Physics and Chemistry Under Extraordinary Conditions, School of Physical Science and Technology, Northwestern Polytechnical University, Xi’an 710072, China
*
Authors to whom correspondence should be addressed.
Metals 2022, 12(12), 2154; https://doi.org/10.3390/met12122154
Submission received: 12 November 2022 / Revised: 5 December 2022 / Accepted: 9 December 2022 / Published: 15 December 2022

Abstract

:
Interfacial polarization is generally a major cause of dielectric loss, but its exact contribution to the electromagnetic wave (EMW) absorption capacity of absorbers remains to be elucidated. In this work, SnO2@rGO composite (S2) with tight interfaces formed by chemical bonds and SnO2/rGO mixture (S3) were synthesized by a simple chemical route followed by further calcined in argon, respectively. Compared with pure SnO2 (S1) and S3, S2 exhibits much better EMW-dissipation ability, with a smaller minimum reflection loss (RLmin) value of −20.5 dB at a matched thickness of 5 mm and a larger effective absorption bandwidth (fe) value of 5.8 GHz (from 11 GHz to 16.8 GHz) at 3.2 mm. By comprehensively comparing the defects, dipoles, and interfaces in S2 and S3, it is concluded that the excellent EMW absorption capacity of S2 is mainly caused by strong dielectric loss dominated by interfacial polarization as well as suitable impedance matching. This study provides an insight into the exact contribution of interfacial polarization to the EMW-dissipation ability of absorbers, showing that the EMW absorption of graphene-based composites can be effectively promoted by constructing well-connected interfaces between graphene and absorbers.

1. Introduction

Nowadays, electromagnetic waves (EMW) have been widely used in 5G communication technology, GPS positioning and navigation, automotive radar, and other industries, which greatly benefit our daily life. However, excessive EMW also bring some negative effects, such as interfering with the stable operation of equipment and posing potential threats to human health [1,2]. Under such circumstances, absorbers capable of effectively absorbing and dissipating EMW have attracted great attention [3,4]. Up to now, numerous candidate absorbers have been extensively explored, which can be briefly classified into three types according to the EMW loss mechanism, namely, dielectric loss materials (such as conductive polymers and carbon materials) [5,6], magnetic loss materials (e.g., ferrites) [7], and dual loss materials containing both magnetic loss components and dielectric loss components [8]. Among these absorbers, magnetic loss materials and dual loss materials generally suffer from significant decreases in EMW absorption at high temperatures due to the degradation of their magnetism, which undoubtedly hinders their practical applications [9]. Therefore, dielectric loss absorbers with temperature stability have become a research hotspot.
Among the reported dielectric loss materials, single-metal oxides such as ZnO, SnO2, and TiO2 have attracted much attention because of their advantages of good thermal and chemical stability, low cost, and environmental friendliness. Wang et al. [10] reported hierarchical ZnO microspheres with outstanding EMW absorption performance, with a minimum reflection loss (RLmin) value of −31.5 dB at only 2.0 mm thickness as well as a wide effective absorption bandwidth (EAB, denoted as fe) of ~8.1 GHz from 9.9 to 18 GHz at 2.4 mm. Lv et al. [11] successfully synthesized two-dimensional SnO/SnO2 heterojunctions which possess excellent performance with an RLmin value of −37.6 dB and an fe up to 4.30 GHz at 1.4 mm. Nevertheless, single-metal oxides have shortcomings such as improper impedance matching and poor conductivity, which hinder the improvement of their EMW-dissipation capabilities. As a novel EMW absorbing material, graphene has attracted great attention due to its unique physical and chemical properties, such as low density, high specific surface area, high conductivity, and excellent dielectric loss [12]. Coupling the EMW absorbers with graphene can effectively improve the impedance-matching characteristics and the conductivity of the materials, which offers a good strategy to overcome the shortages of single-metal oxides to improve their EMW absorption ability [13,14].
Thus far, numerous graphene/single-metal oxide composites with excellent EMW absorption capability have been reported. Wang et al. [15] successfully synthesized the SnO2–graphene composite, which shows an RLmin value of −15.28 dB at 15.94 GHz and an effective absorption region ranging from 15.3 to 16.6 GHz. Liu et.al. [16] obtained graphene oxide (rGO)/ZnO micro-rods composites by a simple combined mechanical mixing and freeze-drying method, which shows much better EMW absorption than pure ZnO, with an RLmin value of −38.5 dB and an fe ranging from 12.6 to 18 GHz at 2 mm. Shi et al. [17] reported the synthesis of rGO/TiO2 nanowire composites via a solvothermal and annealing method. By optimizing the mass ratio of rGO to TiO2, the complex permittivity can be well-controlled, and an excellent EMW absorption with RLmin value of −51.5 dB and an fe value of 6.46 GHz was achieved at 2.7 mm. Although various excellent graphene/single-metal oxide absorbers have been explored, the EMW absorption mechanism remains to be further elucidated. A common explanation is the synergistic effect of multiple mechanisms, including optimized impedance matching, enhanced conduction loss, polarization loss consisting of dipole polarization, defect polarization, and interfacial polarization [18]. However, the exact contribution of each mechanism (especially the interfacial polarization) remains unclear and further studies are required to better understand and construct more efficient graphene/single-metal oxide EMW absorbers.
In this work, we mainly focus on the exact contribution of interfacial polarization to EMW absorption capability. In order to explore the dielectric loss caused by interfacial polarization alone, simple dielectric materials SnO2 and rGO are selected to synthesize SnO2@rGO composite (S2) with well-constructed interfaces and SnO2/rGO mixture (S3, as a comparison). By setting the same SnO2/rGO content and going through the same calcination process, the dielectric losses caused by defects and dipoles in S2 and S3 are almost controlled to be the same. Compared with S3, S2 exhibits an excellent EMW absorption performance, with a small RLmin of −20.5 dB and a large fe of 5.8 GHz at optimized thicknesses, which is mainly caused by strong dielectric loss dominated by interfacial polarization as well as suitable impedance matching. This work will help to elucidate the exact contribution of interfacial polarization and provide an effective strategy for building graphene/single-metal oxide composites and other binary and ternary composites with good interfaces as efficient EMW absorbers.

2. Materials and Methods

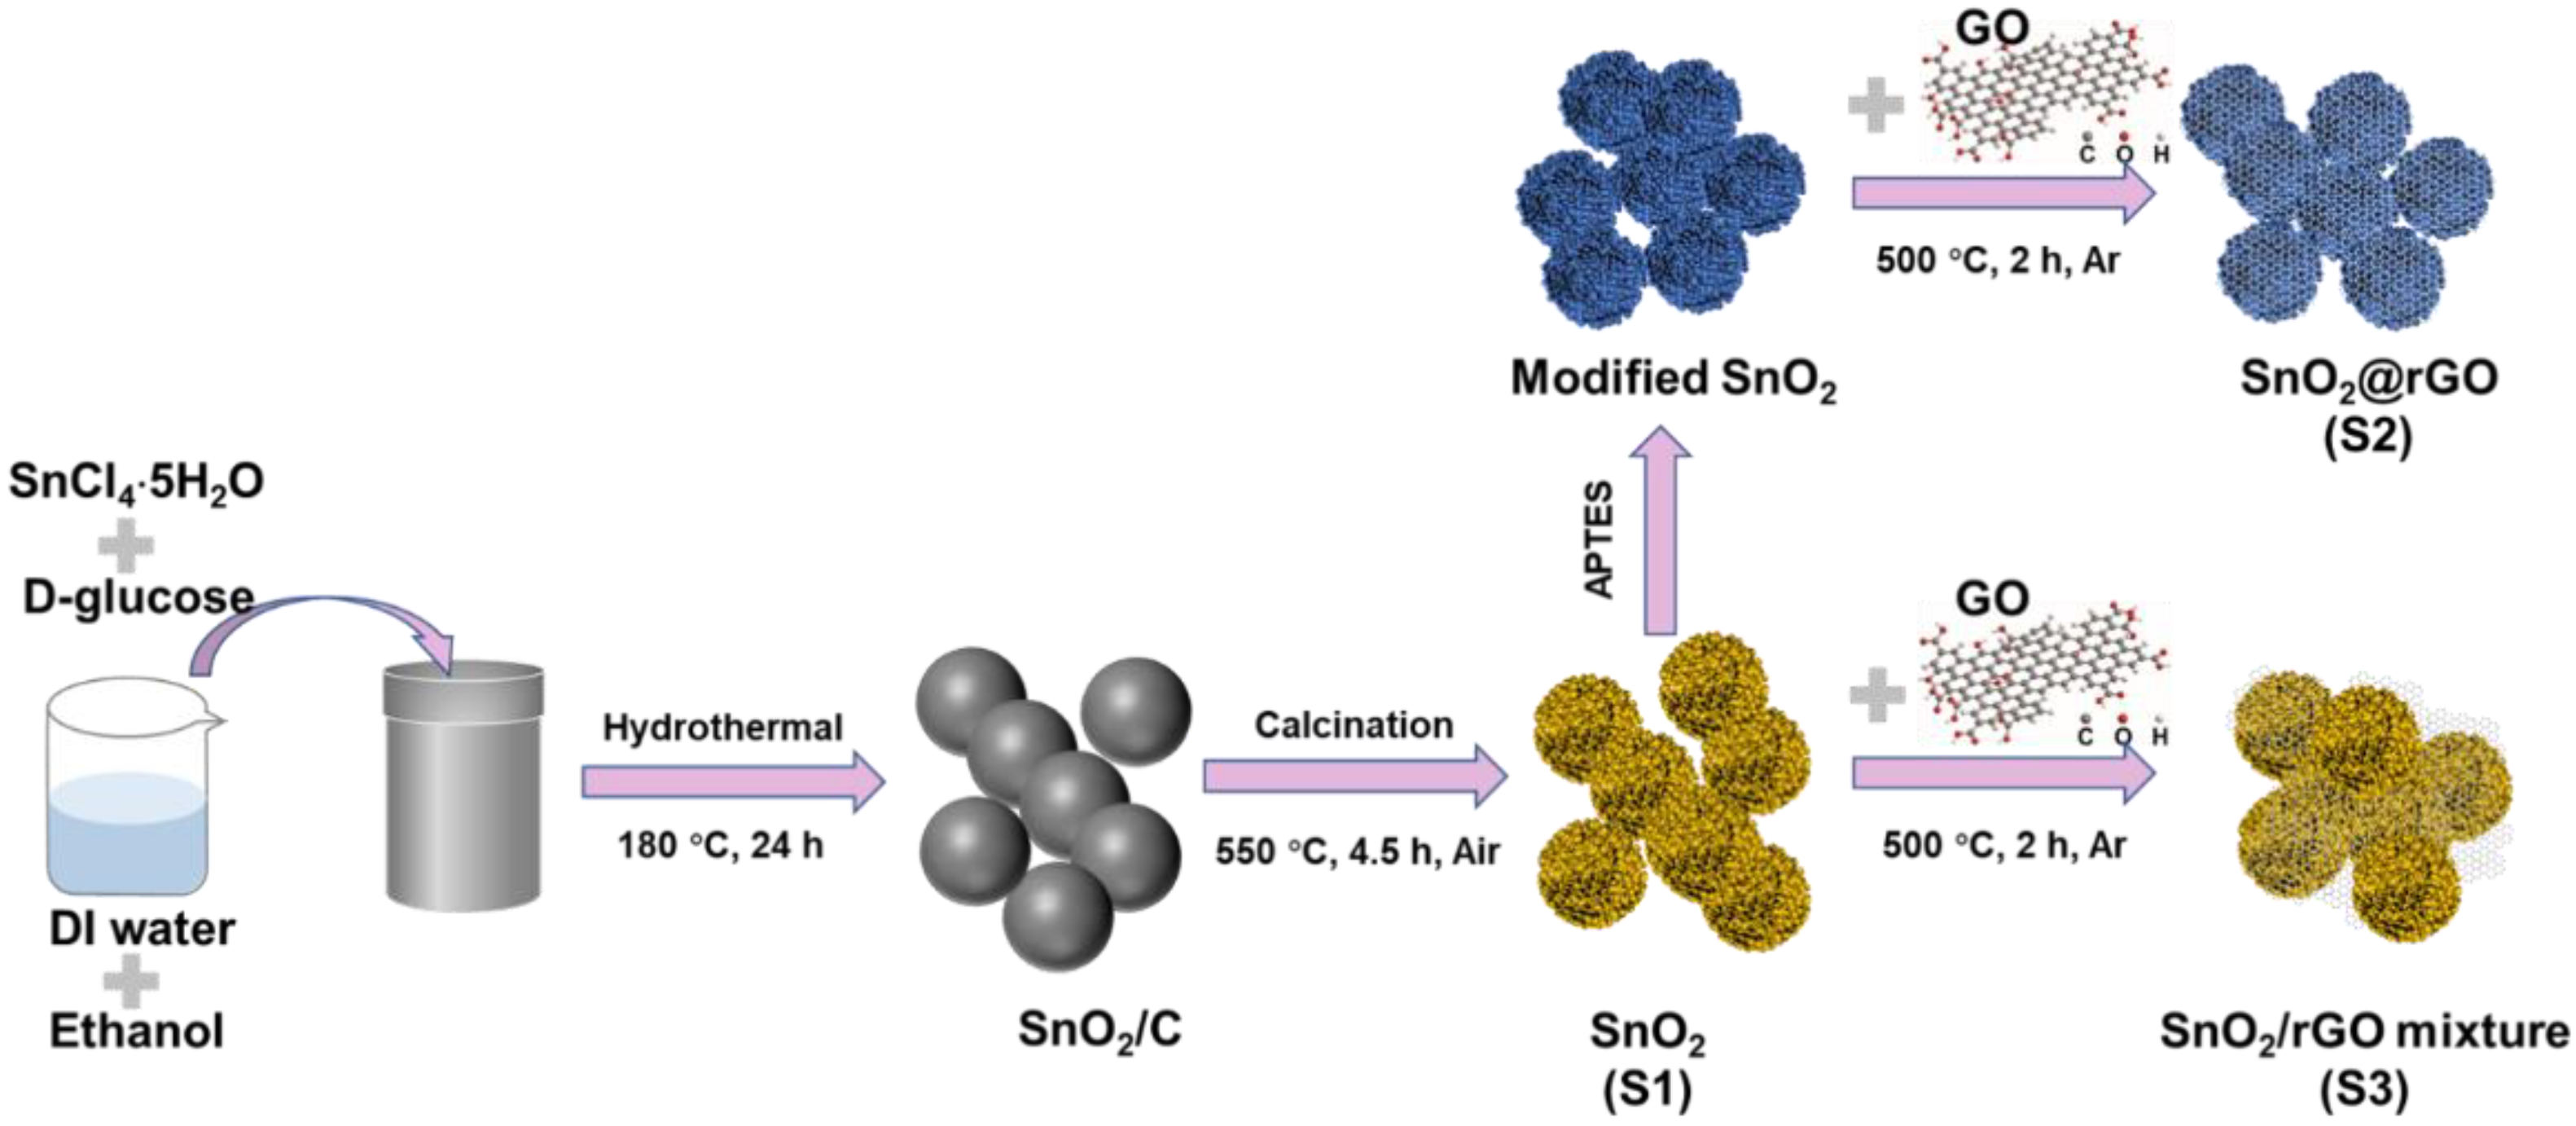
2.1. Synthesis of SnO2 Microspheres (Marked as S1)

As illustrated in Figure 1, 8 mmol of SnCl4∙5H2O and 20 mmol of D-glucose anhydrous were sequentially dissolved in 10 mL pure water and 60 mL ethanol. After magnetic stirring for 0.5 h, the transparent solution was transferred into a 100 mL autoclave and heated to 180 °C for 24 h in an oven. After the hydrothermal process was completed, the obtained product was washed and dried at 80 °C overnight. After that, the product was further calcined for 4.5 h at 550 °C in air to obtain SnO2 microspheres.

2.2. Synthesis of SnO2@rGO Composites (Marked as S2)

Graphene oxide (GO) suspension was first prepared by dispersing 12 mg graphite oxide into 30 mL pure water under sonication for 4 h. A 0.5 g measure of SnO2 microspheres was dispersed in a solvent of 50 mL ethanol and 0.5 mL (3-Aminopropyl)triethoxysilane (APTES). After stirring for 4 h, the SnO2 suspension was centrifuged and washed. Then, the modified SnO2 microspheres were dispersed into 50 mL pure water under magnetic stirring, and the prepared GO suspension was added dropwise. After 4 h of continuous stirring, the participants were centrifuged and washed 3 times each with pure water and ethanol. After drying in an oven, the resulting product was further calcined in argon at 500 °C for 2 h.

2.3. Synthesis of SnO2/rGO Mixture (Marked as S3)

The synthesis process of SnO2/rGO mixture was the same as that of SnO2@rGO composites, except that the SnO2 microspheres were used directly without modification.

2.4. Material Characterization

The zeta potential (ζ) of the samples was detected by a zeta-potential analyzer (Zetasizer Nano ZS90, Malvern Panalytical, Malvern, UK). The phase, structure, and surface morphologies of the samples were investigated by the following characterizations: X-ray diffraction (XRD, PANalytical X’pert MPD PRO, Cu Kα, λ = 0.15406 nm, Malvern Panalytical, Malvern, UK), Raman spectroscopy (Renishaw inVia Raman spectrometer, Renishaw, London, UK), Fourier transform infrared (FTIR) spectroscopy (Bruker TENSOR27, Bruker, Beijing, China), Scanning electron microscopy (SEM, JSM-7000 F, JEOL, Beijing, China), and Transmission electron microscope (TEM, Tecnai F30 G2, FEI, Hillsboro, OR, USA). Photoluminescence (PL) spectra were recorded on a Gangdong F-320 fluorescence spectrophotometer (Gangdong, Tianjin, China). The chemical state of the samples was investigated by a Kratos Axis Ultra DLD X-ray photoelectron spectroscopy system (Kratos, Manchester, UK). To evaluate the EMW absorption capacity, the obtained samples were first mixed with paraffin wax at a mass ratio of 50% and then pressed into annular cylinders with an outer diameter of 7.0 mm and an inner diameter of 3.04 mm. EM parameter data were collected on a vector network analyzer (Agilent N5230A, Agilent, Beijing, China) in 2–18 GHz.

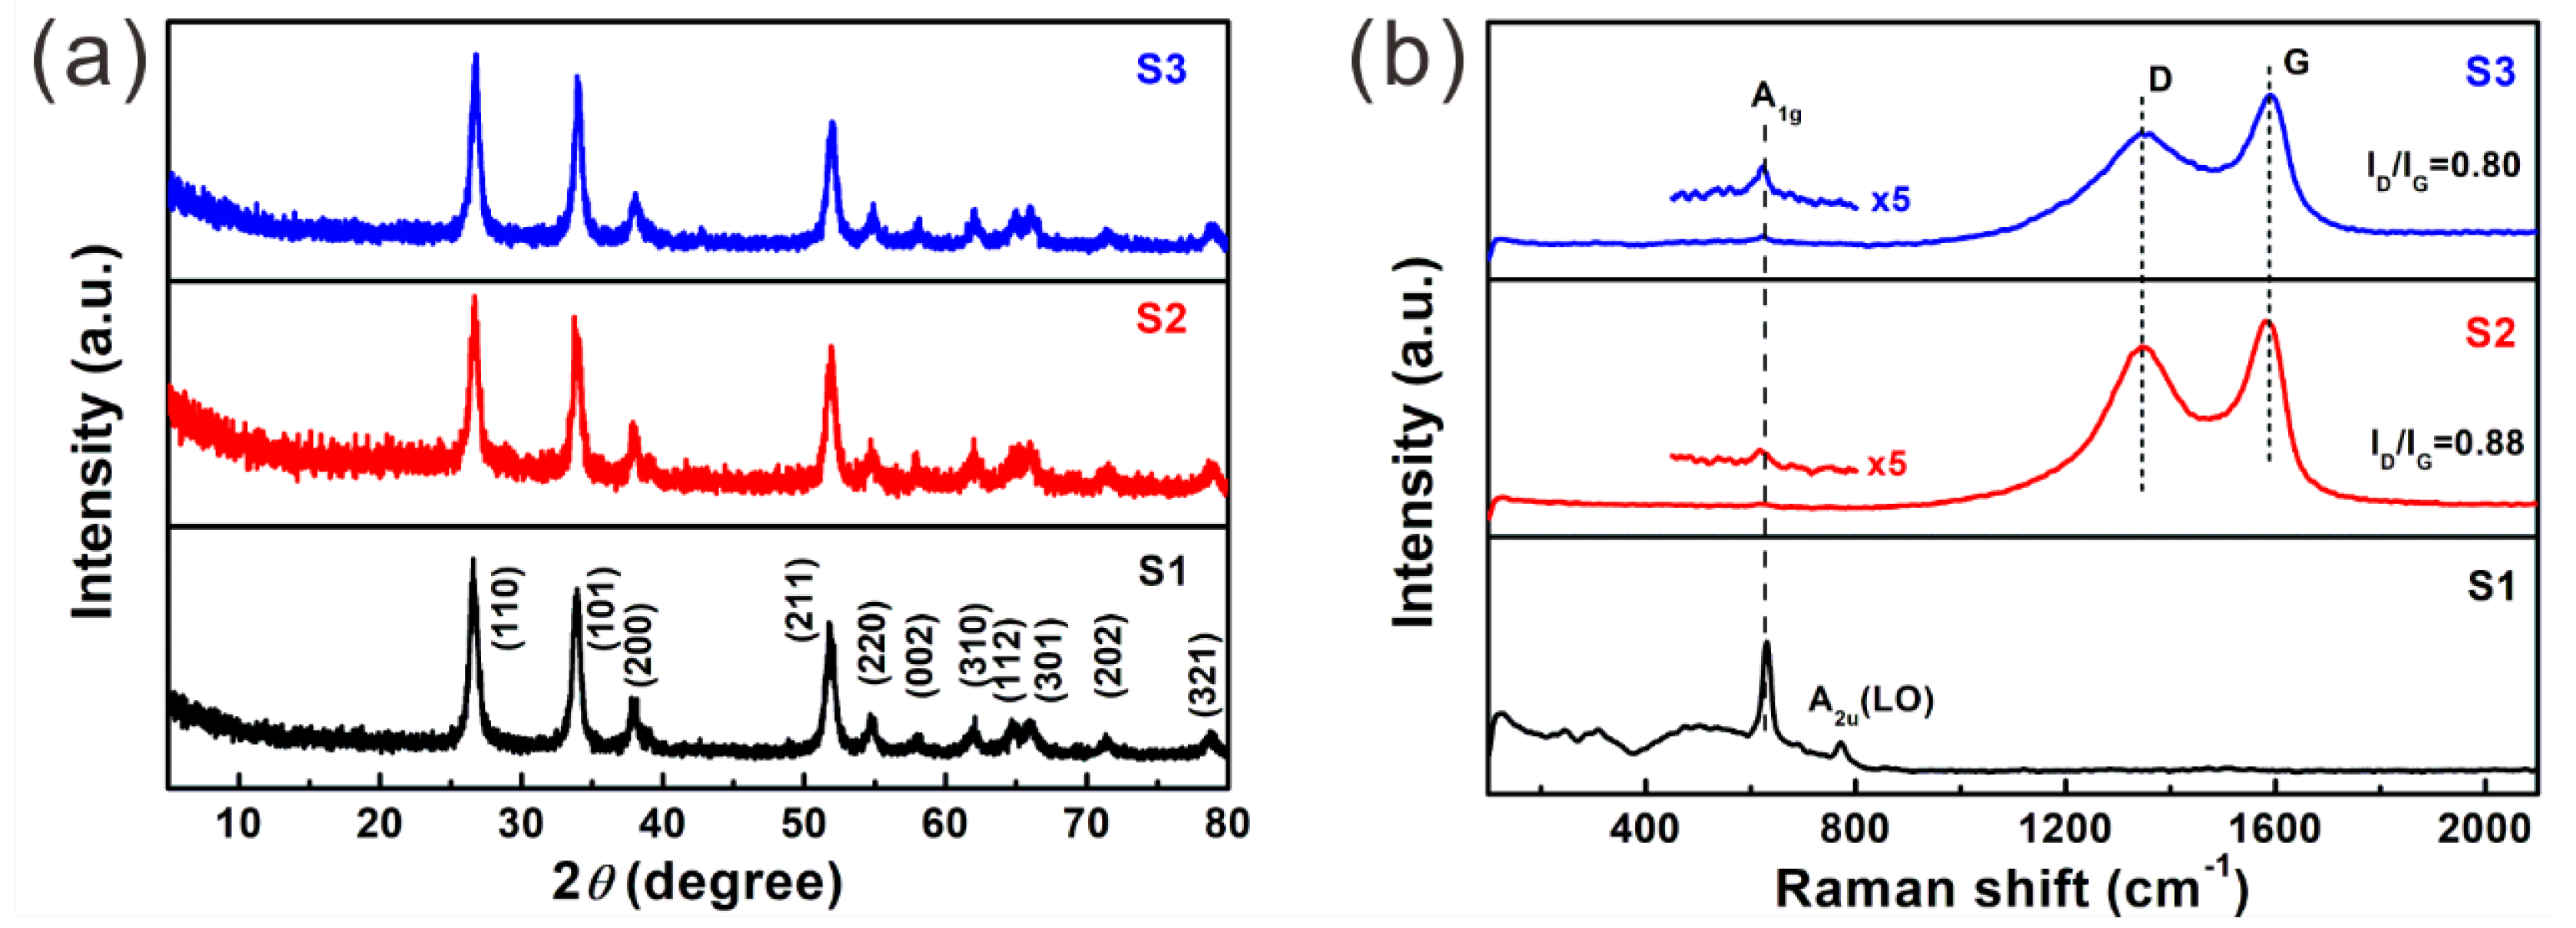
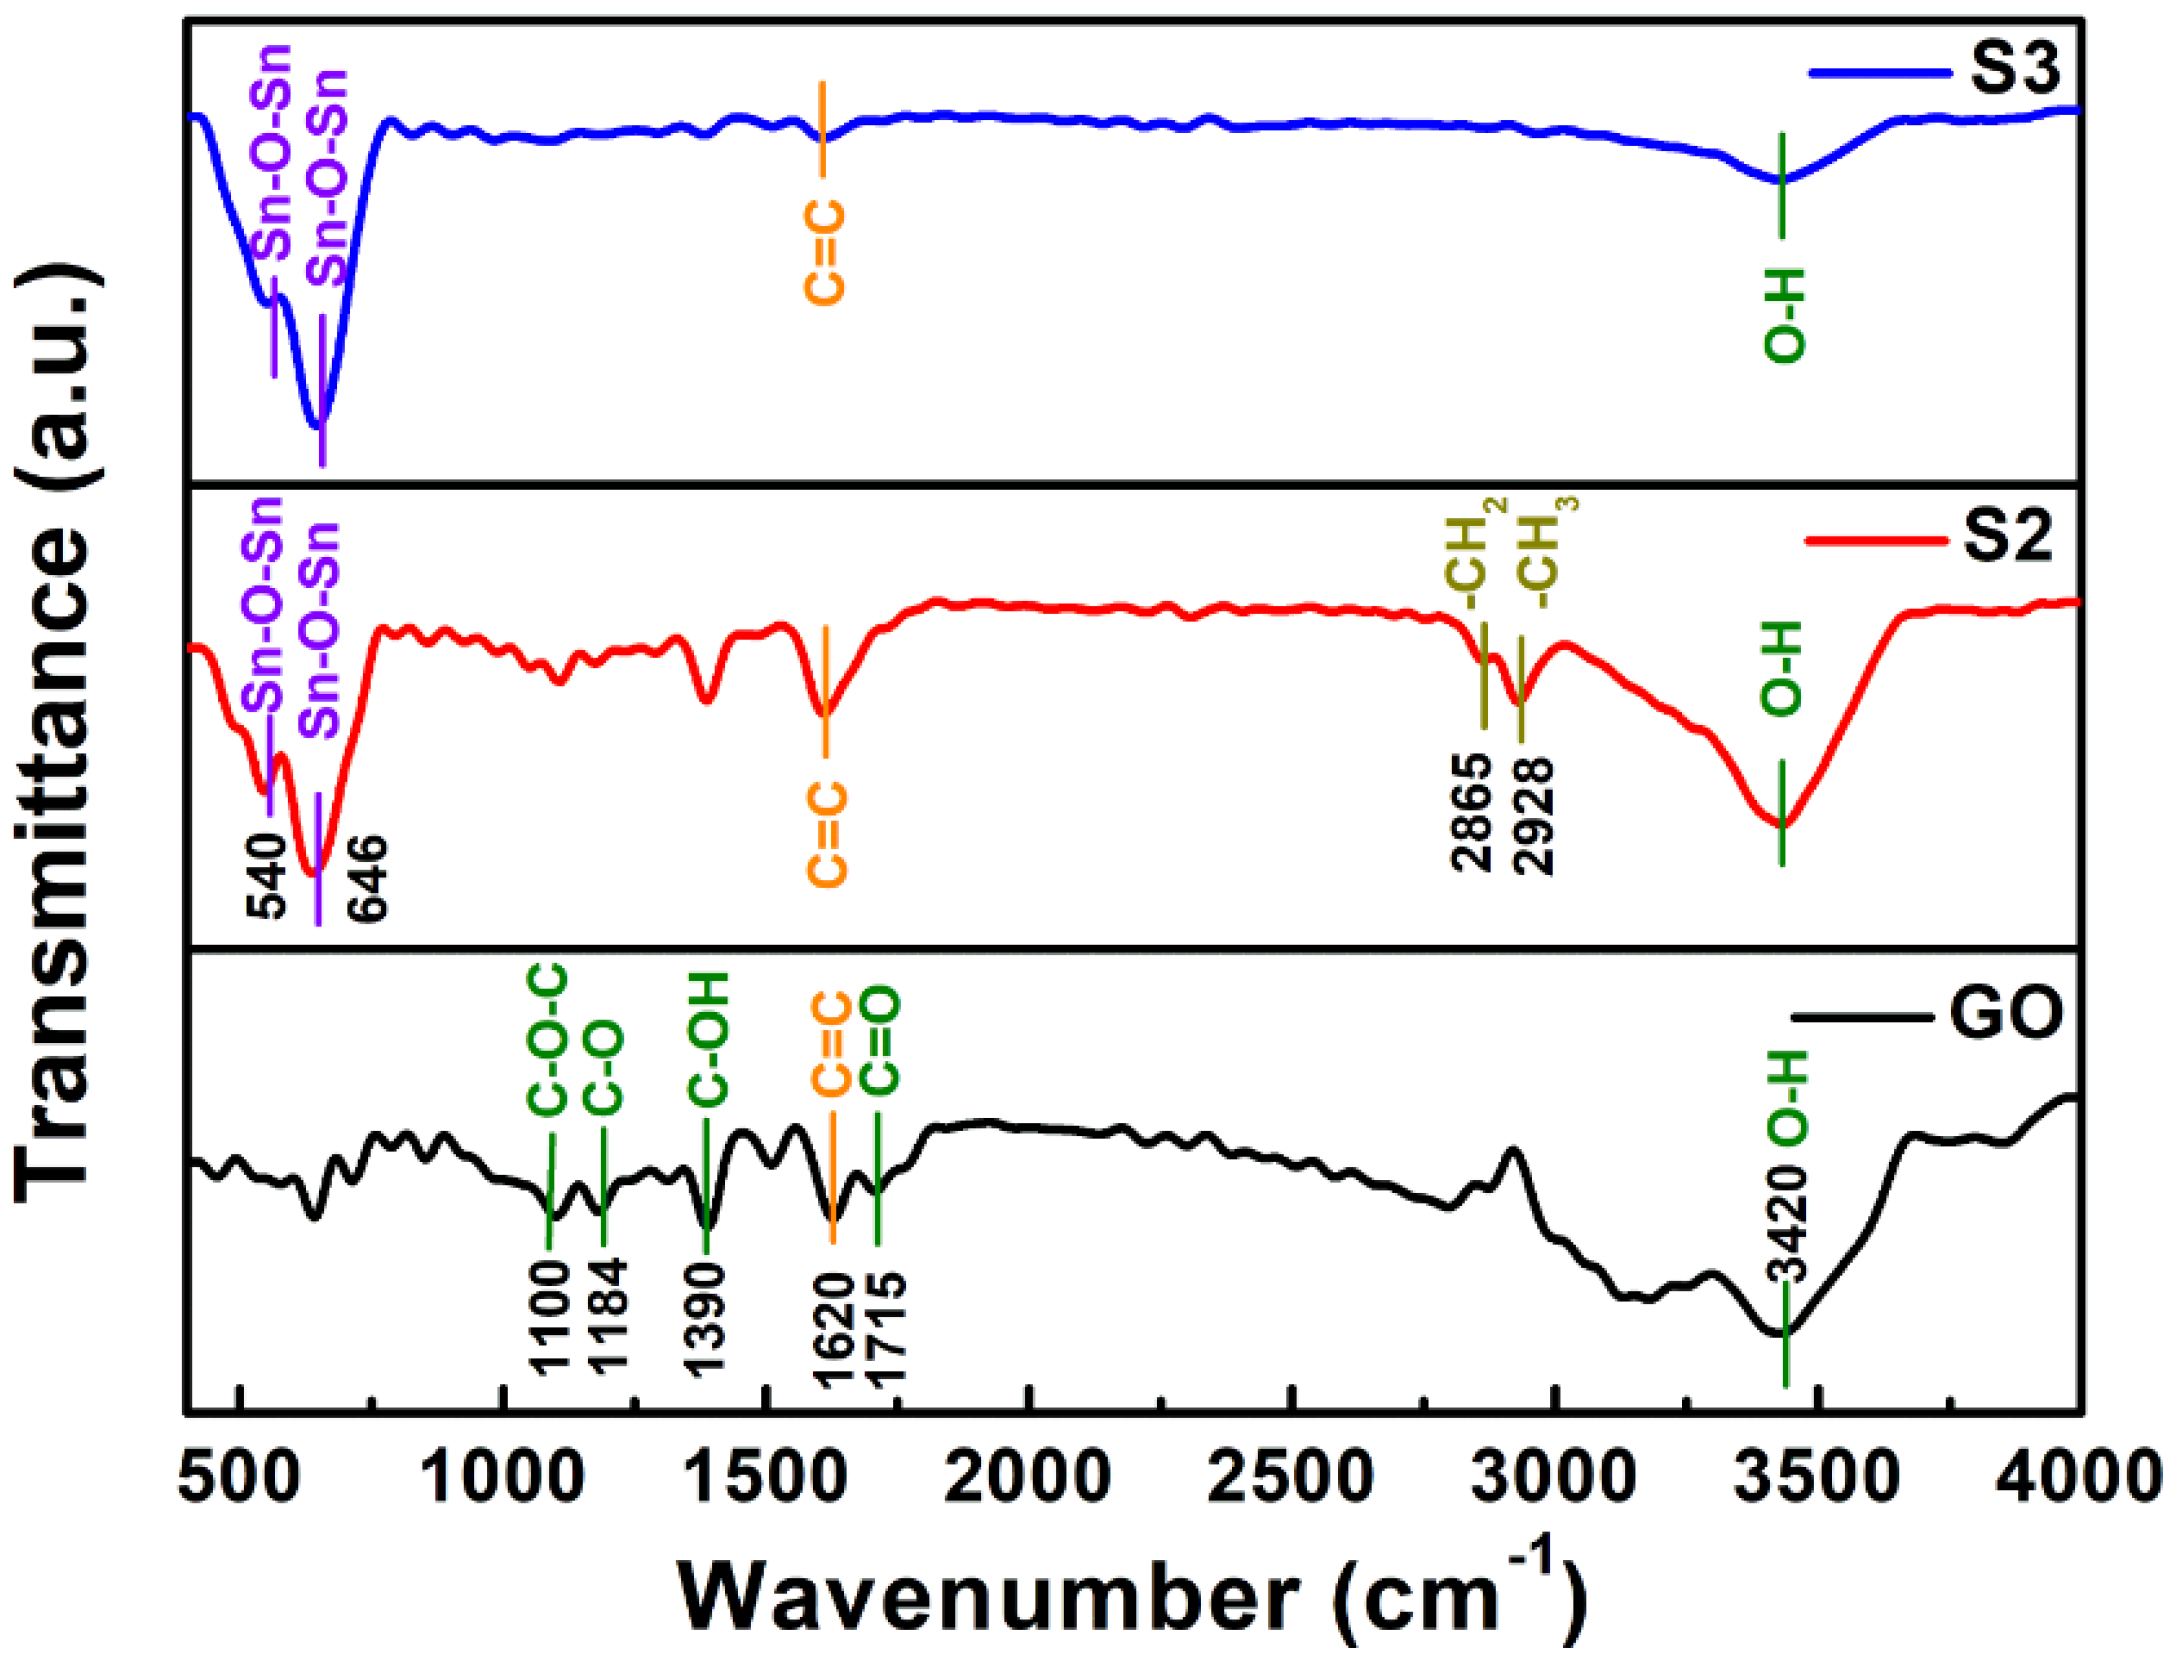
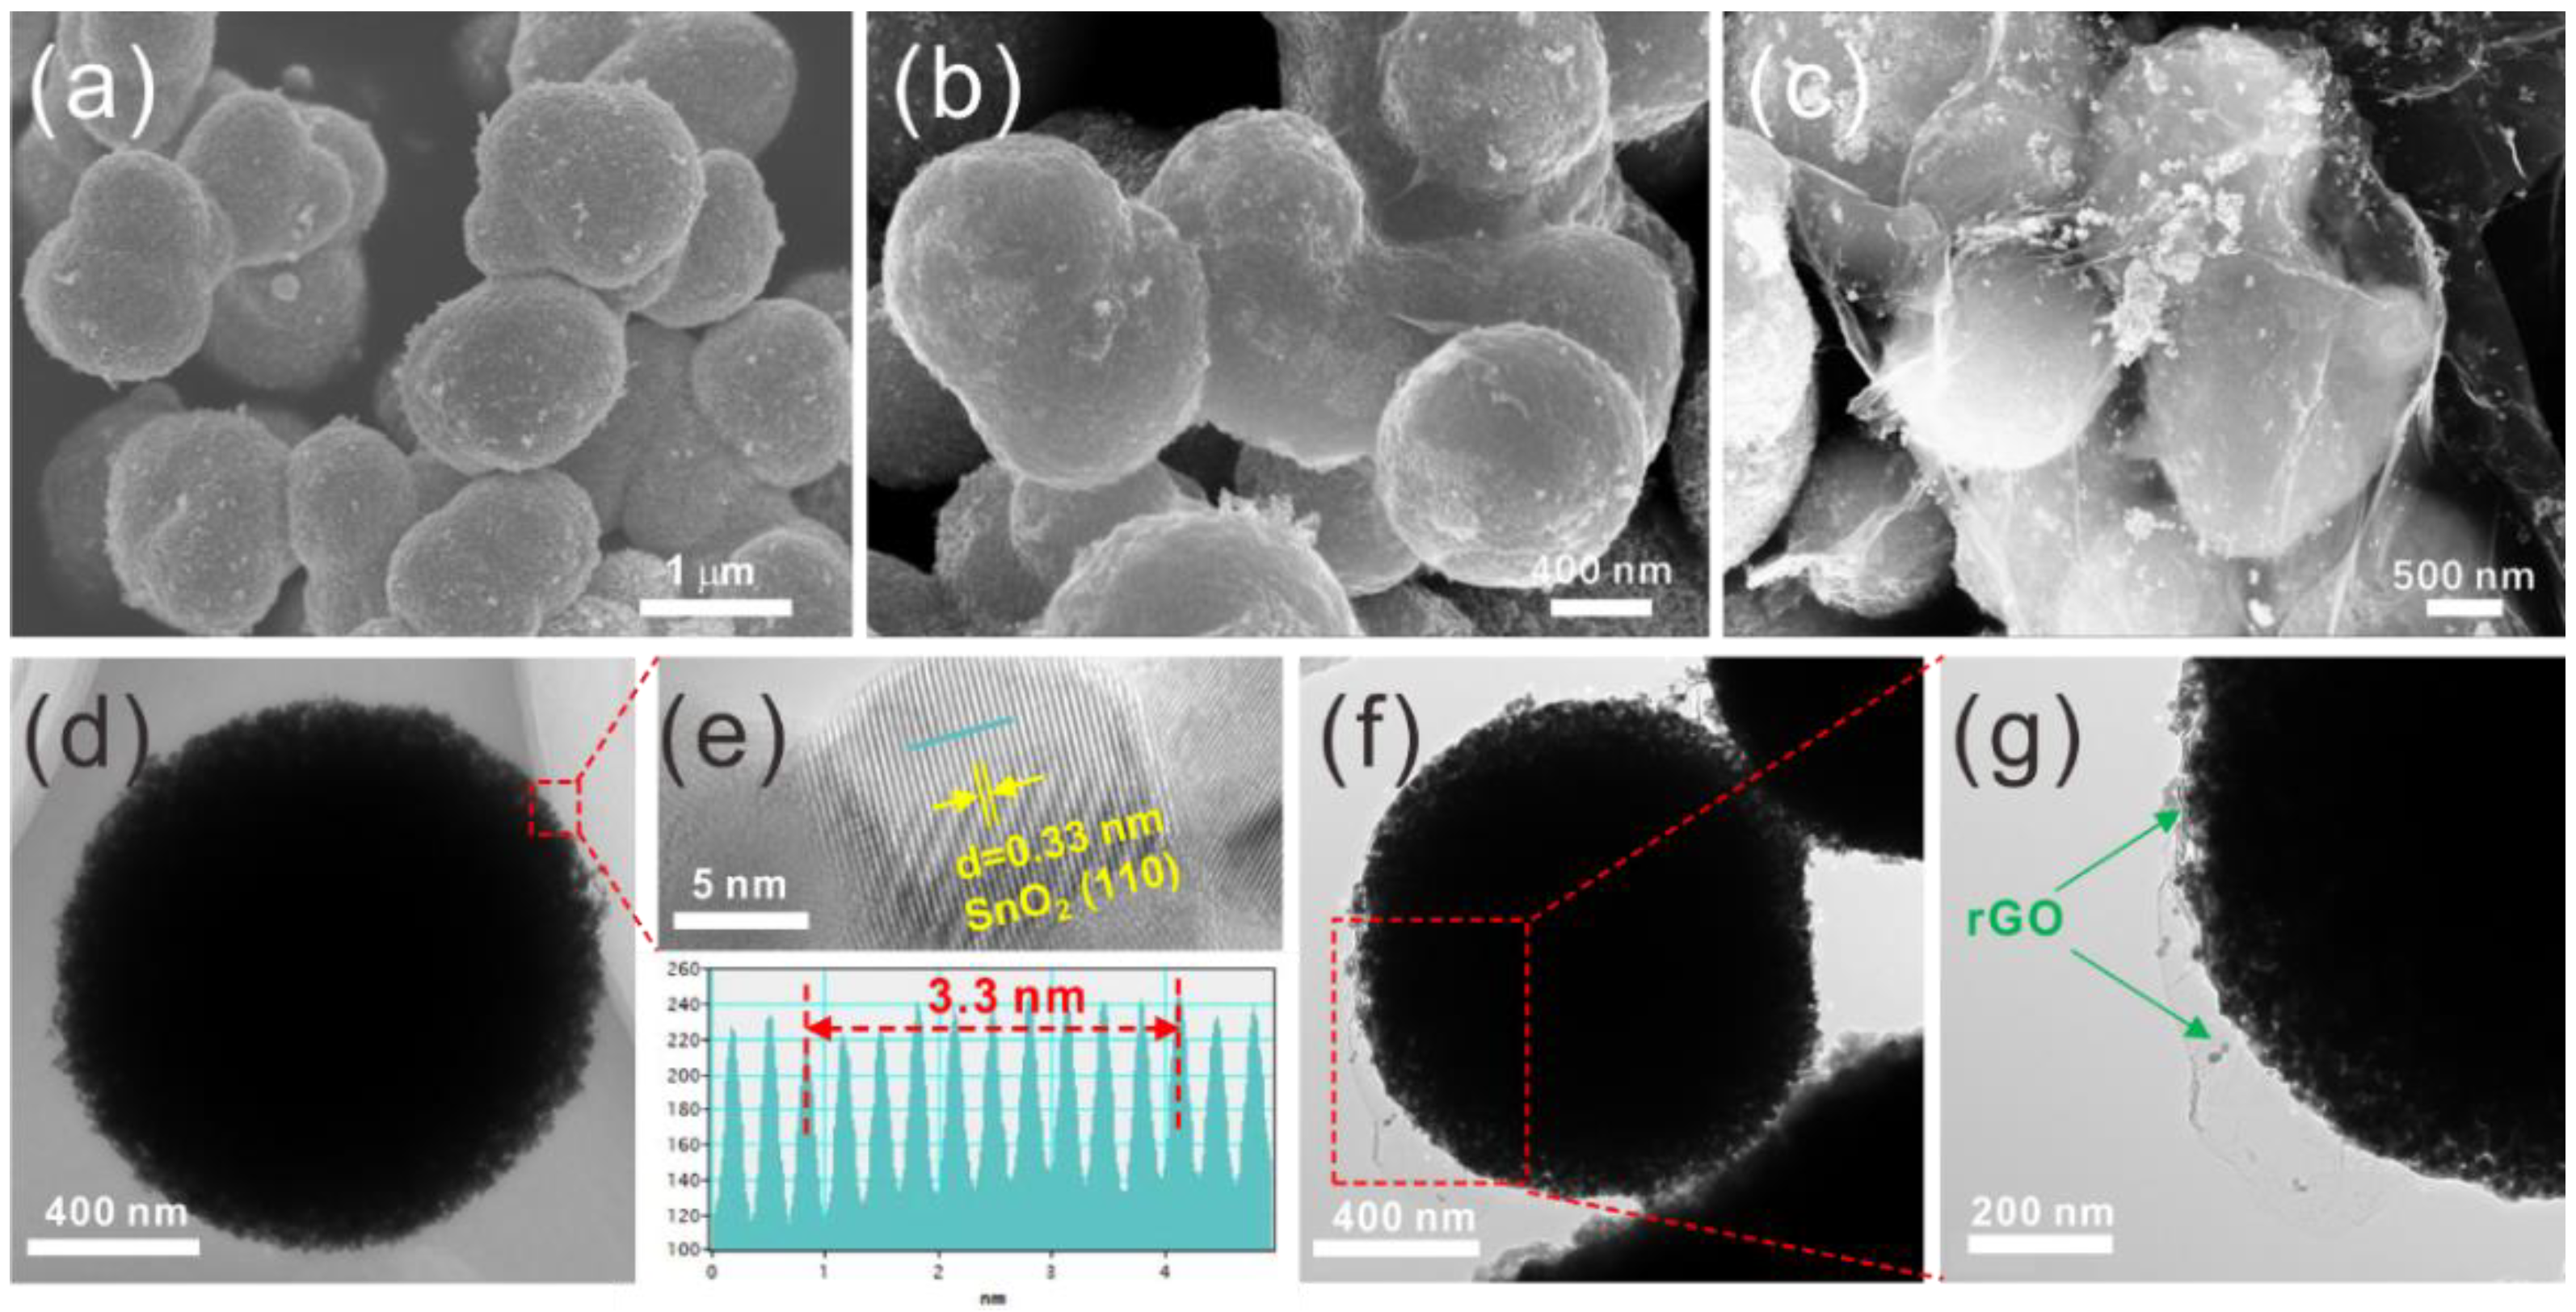
3. Results and Discussion

The crystal structure of S1–S3 was studied by XRD patterns, as displayed in Figure 2a. The evident diffraction peaks at 26.6°, 33.9°, 37.9°, 51.8°, 54.7°, 57.8, 62.0°, 64.7°, 66.0°, 71.3°, and 78.7° correspond well with the (110), (101), (200), (211), (220), (002), (310), (112), (301), (202), and (321) planes of the rutile SnO2 (PDF# 41-1445), respectively [19]. According to the Scherrer formula, the crystallize size is calculated to be ~13 nm. No distinguishable peaks related to reduced graphene oxide (rGO) can be observed for S2 and S3, which might be due to the relatively low content of the rGO sheet (about 2.4 wt.%) in these samples, whose signals might be covered by the strong diffraction peaks of SnO2.
Nonetheless, the presence of rGO in S2 and S3 was confirmed by Raman spectra. As shown in Figure 2b, two typical peaks due to rGO appear at ~1348 cm−1 and ~1588 cm−1, which are generally called the D band and G band, respectively [20]. The former arises from the in-plane vibrations of disordered amorphous carbon and the latter corresponds to the stretching vibrations of the sp2-bonded carbon atoms [21]. The intensity ratio of the D band to the G band (ID/IG) generally reflects the graphitization degree of the carbon materials [22]. The ID/IG ratio was calculated to be 0.88 and 0.80 for S2 and S3, respectively, which indicates a comparable disorder degree of rGO in S2 and S3.
The disorder degree of rGO in the S2 and S3 was further studied by FTIR spectra. As seen in Figure 3, the spectrum of GO shows several peaks at 1110 cm−1, 1184 cm−1, 1390 cm−1, and 1715 cm−1, which can be well-attributed to the stretching vibrations of C-O-C, C-O, C-OH, and C=O, respectively [23]. These peaks become much weaker or even disappear in the spectra of S2 and S3, which should be due to the removal of the oxygen-containing functional groups and the restoration of the graphene network, i.e., the GO was reduced to rGO to some extent after calcination in argon. In contrast, the specific absorption peak (at 1620 cm−1) of the C=C bond still exists, which confirms the successful reduction of GO in these two samples. Two typical peaks related to SnO2 could also be observed in the spectra of S2 and S3, and arise from the symmetric and anti-symmetric Sn-O-Sn stretching of SnO2 [24]. Two extra peaks at 2865 cm−1 and 2928 cm−1 in the S2 spectrum are attributed to the -CH2 and -CH3 groups, which originate from APTES during the SnO2 modification process [25]. The FTIR results confirm that APTES-modified SnO2 is well-combined with GO to form SnO2@GO composites, which are further reduced to SnO2@rGO (S2) by calcination in argon.
To investigate the morphologies of S1−S3, SEM and TEM images were recorded. As shown in Figure 4a, the prepared microspheres present a relatively uniform size, about 1−2 μm in diameter. High-resolution TEM images (Figure 4d,e) further reveal that the microsphere consists of numerous nanoparticles. The interplanar spacing of the nanoparticles is about 0.33 nm, which corresponds well to the (110) plane of SnO2. Figure 4b shows that rGO sheets are well-wrapped on the surface of the SnO2 microsphere, forming a tight interface between SnO2 and rGO, which is further confirmed by the high-resolution TEM images (Figure 4f,g). The tight interface may cause possible electronic interactions between rGO and SnO2, which will facilitate the charge transfer and enhance the interfacial polarizations under alternating EM fields [26]. In contrast, the rGO sheets in S3 are loosely covered on the microspheres (Figure 4c) without forming a tight connection, i.e., S3 is a mixture of SnO2 microspheres and rGO sheets.
The formation of the tight interface between APTES-modified SnO2 and rGO was further explored by XPS spectra and PL spectra. As shown in the XPS survey spectrum of S2 (Figure 5a), in addition to typical peaks related to the C, O, and Sn atoms, the N 1s peak can also be observed, which confirms the successful modification of SnO2 by APTES. The spectrum of N 1s core-level can be further deconvoluted into three peaks by using a combined Gaussian (70%)–Lorentzian (30%) fitting with Shirley background subtraction. As displayed in Figure 5b, the peaks at 398.9 eV and 401.7 eV are due to free amines (-NH2) and protonated amines (-NH3+), respectively [27]. Due to the presence of protonated amines, the modified SnO2 is positively charged (zeta potential ζ = +38.9 mV), which will electrostatically attract with the negatively charged GO sheet (ζ = −9.8 mV), leading to encapsulation of GO on the SnO2 surface (as shown in Figure 4b,f,g). The free amines (-NH2) in APTES-modified SnO2 chemically react with carboxyl groups (-COOH) in GO to form peptide bonds (-CO-NH-), which results in the center peak at 400.1 eV in the N 1s spectra [28]. Therefore, it can be concluded that the tight interface between GO and SnO2 is formed by chemical bonds. Figure 5c shows that the spectrum of C 1s core-level can be deconvoluted into four components, which correspond to the C-C/C=C, C-N, C-O, and C=O bands, respectively [29]. The presence of abundant functional groups in S2 will lead to dipole polarization and enhance its EMW-dissipation capability to a certain extent. Figure 5d displays the O 1s core-level spectra of S2 and S3, both of which can be deconvoluted into four components, i.e., OI (528.9 eV), OII (530.2 eV), OIII (531.1 eV), and OIV (532.2 eV), which corresponds to Sn-O bonds, oxygen in a hydroxyl group, oxygen vacancies (VO) in SnO2, and absorbed water, respectively [30]. As reported in previous literature, oxygen vacancies are the main cause of defect polarization in metal-oxide EMW absorbers [31]. VO is only generated in the SnO2 microsphere, which has almost the same concentration in S2 and S3. Thus, it can be predicted that the VO defects-induced polarization will contribute almost equally to EWM absorption for S2 and S3.
The presence of VO defects in SnO2 leads to a broad emission band in the UV–Vis region for all the samples (Figure 5e), which can be further Gaussian-fitted to several typical peaks at ~365 nm, ~388 nm, ~425 nm, ~464 nm, ~485 nm, and ~525 nm, as shown in Figure 5f. Among these, the UV emission with the peak at ~365 nm is attributed to the band-to-band emission, while the peak at ~388 nm should correspond to the near band-edge emission of SnO2 [32]. The typical peak at ~464 nm arises from the instrument and remains stable in all the spectra. The rest peaks at ~425 nm, ~485 nm, and ~525 nm are visible-light emissions related to VO defects [33]. It is evident that S2 possesses much weaker PL intensity than S1 and S3, which confirms the formation of a tight interface between SnO2 and conductive rGO where photogenerated electrons can be effectively transferred from SnO2 to rGO and hinder the recombination of electrons and holes [34]. Considering the good interfacial connection formed by chemical bonds between the conductive rGO and SnO2, it can be predicted that interfacial polarization, as well as conduction loss, may occur in S2 when exposed to alternating EM fields, which will certainly promote its dissipation of EMW.
To evaluate the EMW absorption ability of S1−S3, their complex permeability ( μ r = μ j μ ), and permittivity ( ε r = ε j ε ) were measured and studied. As non-magnetic absorbers, the real part (μ′) and imaginary part (μ″) of permeability for S1–S3 is approximately 1 and 0 in 2–18 GHz, respectively. The real part of permittivity (ε′) of S1 slightly fluctuates in the range of 4–5 in 2–18 GHz (Figure 6a), while the ε′ of S2 and S3 shows a similar decreasing trend from 5 to 3.5 due to the presence of rGO. The imaginary part of permittivity (ε″) of S1 possesses small values close to 0, which indicates its poor dielectric loss ability. Compared with S1, S2, and S3 have larger ε″ values, which decrease gradually from 4 to 1 for S2 and from 2 to 1 for S3, respectively. The dielectric loss tangent ( tan δ ε ) was further calculated to evaluate the dielectric loss capacity of the absorbers. As shown in Figure 6c, S2 possesses a much larger tan δ ε value than S1 and S3 in 2–18 GHz, implying its better dielectric loss ability. Generally, the dielectric loss in the gigahertz frequency range is composed of conduction loss and polarization loss caused by dipoles, defects, and interfaces under alternating EM fields [35]. According to Debye theory, the polarization behavior can be characterized by the Cole–Cole semicircles obtained from the equation below [36]:
( ε ε s + ε 2 ) 2 + ( ε ) 2 = ( ε s ε 2 ) 2
where ε s and ε are static- and infinite-frequency permittivity, respectively. As shown in Figure 6d, several irregular semicircles can be observed in the spectra of S2, verifying the coexistence of multiple polarizations, which might be caused by the oxygen vacancies in SnO2, points defects and functional groups in rGO, and the interfaces between rGO and SnO2. In addition, conduction loss may also occur in S2 as well as S3 due to the presence of conductive rGO. However, due to the low content of rGO in our samples, the typical linear tail corresponding to conduction loss cannot be observed, which indicates a relatively weak conduction loss in our samples, and the main dielectric loss should come from the polarization loss caused by defects, dipoles, and interfaces.
To assess the EMW absorption capability of the absorbers, their reflection loss (RL) was calculated based on transmission-line theory via the equations below [37]:
R L ( d B ) = 20 log | Z i n Z 0 Z i n + Z 0 |
Z i n = Z 0 μ r ε r tanh | j ( 2 π f d c ) ε r μ r |
where Z0 and Zin are the input impedance of the air and the absorber, f is the EMW frequency, d is the absorber thickness, and c is the light speed in a vacuum. Figure 7 shows the RL value versus frequency for S1–S3 with varied thicknesses. As seen from Figure 7a–c, the RL values of S1 with different thicknesses are all above −10 dB and an RLmin value of −9.2 dB is obtained at 6.8 GHz when the absorber thickness is 5 mm, which indicates its poor dissipation ability of EMW. Compared with S1, the RLmin value of S2 with a thickness of 5 mm can reach as low as −20.5 dB at 7.9 GHz (Figure 7d–f). In addition, a large fe of 5.8 GHz (from 11 GHz to 16.8 GHz) can be obtained when the absorber has an optimized thickness of 3.2 nm. In terms of SnO2/rGO mixture (S3), an RLmin value of −16 dB and an fe of 2 GHz can be obtained at 3 mm (Figure 7g–i). It is clear that S2 has the best EMW-dissipation ability among all three samples, which is ascribed to the enhanced dielectric loss induced by the introduction of rGO.
Since only dielectric-loss components exist in our composites, conduction loss, and polarization loss caused by defects, dipoles, and interfaces should be the reasons for the excellent EMW absorption performance of S2. According to the result of the Cole–Cole plot, conduction loss does not seem to be significant for our samples, due to the quite-low content of rGO, which does not contribute much to the enhanced EMW absorption performance of S2 and S3. Therefore, polarization loss should be considered the main cause of their dielectric loss. Considering that both S2 and S3 consist of rGO and SnO2 with the same content ratio and undergo the same annealing process, rGO is expected to have a comparable degree of carbonization in both samples, which has been demonstrated by Raman and FTIR spectroscopy. Therefore, it can be deduced that the defects and dipole polarization induced by rGO are comparable in S2 and S3 under incident EMW. Compared with S3 (a mixture of SnO2 and rGO), S2 forms a good interfacial connection between SnO2 and rGO through chemical bonds. The SnO2/rGO interface will cause electron accumulation and result in interfacial polarization under alternating EM fields, which should be the main reason for the enhanced dielectric loss and promoted EMW-dissipation capability of S2.
To further understand the superior EMW absorption behavior of S2, the impedance-matching characteristic ( Z = | Z i n / Z 0 | ) of the samples was calculated and presented in Figure 8. Generally, the incident EMW can enter absorbers with less reflection when the value of Z is closer to the ideal value of Z = 1. As shown in Figure 8a,b, the RLmin values of S2 with varied thicknesses are obtained when Z values are in a narrow range (of 1.0–1.5) close to Z = 1. The good impedance-matching characteristic of S2 ensures that the EMW effectively enters the absorber and is further dissipated as heat and other energies. Compared with S2, the Z values of S1 and S3 with optimized thickness deviate more from the ideal value (Z = 1), especially in the high-frequency range from ~11 GHz to ~17 GHz, implying their deteriorative impedance-matching characteristic, which will inhibit their actual EMW attenuation performance.
The attenuation constant (α) was further calculated to check the total EMW attenuation ability of the absorbers, which is derived by the equation below [38]:
α = 2 π f c × ( μ ε μ ε ) + ( μ ε μ ε ) 2 + ( μ ε + μ ε ) 2
As shown in Figure 8d, S2 possesses larger α values than S1 and S3 in 2–18 GHz, which confirms its best EMW attenuation ability among all three samples. As analyzed above, the excellent EMW-dissipation ability of S2 arises from multiple dielectric loss processes, as shown in Figure 9. First, the good impedance-matching characteristic ensures that the incident EMW effectively enters the absorber with limited reflection. Second, conduction loss occurs due to the presence of conductive rGO, which slightly helps to dissipate the incident EMW energy. Third, the dielectric loss caused by defect polarization and dipole polarization contributes to the EMW absorption to a certain extent. Finally, the strong dielectric loss caused by interfacial polarization mainly results in the excellent EMW-dissipation ability of S2 with an RLmin value of −20.5 dB and an fe of 5.8 GHz at 3.2 mm.

4. Conclusions

In conclusion, SnO2@rGO composite was successfully synthesized by a simple chemical route, followed by being further calcined in argon. The structure, morphology, and interface were investigated by multiple characterization methods, including XRD, Raman, FTIR, SEM, TEM, and XPS. Results show that rGO is well-wrapped on the SnO2 surface, forming a tight interface through chemical bonds. Compared with pure SnO2 and SnO2/rGO mixture, SnO2@rGO composite possesses much better EMW-dissipation ability with a smaller RLmin value of −20.5 dB at 5 mm and a larger fe value of 5.8 GHz at 3.2 mm. The excellent EMW-dissipation capacity is mainly caused by suitable impedance matching and strong dielectric loss dominated by interfacial polarization as well as defect polarization and dipole polarization. This study provides an insight into the effect of interfacial polarization on the EMW-dissipation ability of the absorbers, suggesting that the EMW absorption of graphene-based composites can be effectively promoted by constructing well-connected interfaces between graphene and absorbers.

Author Contributions

Conceptualization, H.S. and Z.W.; methodology, H.S. and X.S.; validation, H.S. and P.Z.; formal analysis, H.S. and Z.H.; investigation, H.S. and P.Z.; writing—original draft preparation, H.S.; writing—review and editing, C.X., X.S. and L.Z.; visualization, H.S. and X.S.; supervision, L.Z., Z.W. and H.W.; funding acquisition, H.S. and H.W. All authors have read and agreed to the published version of the manuscript.

Funding

This research was funded by the Natural Science Basic Research Plan in Shaanxi Province of China (Grant No. 2021JQ-257, 2020JM-118, and 2017JQ5116), the Fundamental Research Funds for the Central Universities, CHD (Grant No.300102120305 and 300102122106), the National Natural Science Foundation of China (Grant No. 51872238, 52074227. and U1806129), and the Fundamental Research Funds for the Central Universities of China (Grant No. 3102018zy045 and 3102019AX11).

Data Availability Statement

Not applicable.

Acknowledgments

The authors would like to thank Shiyanjia Lab (www.shiyanjia.com, accessed on 16 May 2022) for their support of material characterization.

Conflicts of Interest

The authors declare no conflict of interest.

References

  1. Younes, H.; Shoaib, N.; Rahman, M.M.; Abu Al-Rub, R.; Hong, H.; Christensen, G.; Chen, H.; Younes, A.B.; Al Ghaferi, A. Thin carbon nanostructure mat with high electromagnetic interference shielding performance. Synth. Met. 2019, 253, 48–56. [Google Scholar] [CrossRef]
  2. Miller, A.B.; Sears, M.E.; Morgan, L.L.; Davis, D.L.; Hardell, L.; Oremus, M.; Soskolne, C.L. Risks to health and well-being from radio-frequency radiation emitted by cell phones and other wireless devices. Front Public Health 2019, 7, 223. [Google Scholar] [CrossRef] [PubMed] [Green Version]
  3. Liu, J.L.; Zhang, L.M.; Wu, H.J. Anion-doping-induced vacancy engineering of cobalt sulfoselenide for boosting electromagnetic wave absorption. Adv. Funct. Mater. 2022, 32, 2200544. [Google Scholar] [CrossRef]
  4. Qin, M.; Zhang, L.; Zhao, X.; Wu, H. Defect induced polarization loss in multi-shelled spinel hollow spheres for electromagnetic wave absorption application. Adv. Sci. 2021, 8, 2004640. [Google Scholar] [CrossRef]
  5. Kumar, R.; Sahoo, S.; Joanni, E.; Singh, R.K.; Tan, W.K.; Kar, K.K.; Matsuda, A. Recent progress on carbon-based composite materials for microwave electromagnetic interference shielding. Carbon 2021, 177, 304–331. [Google Scholar] [CrossRef]
  6. Zeng, X.; Cheng, X.; Yu, R.; Stucky, G.D. Electromagnetic microwave absorption theory and recent achievements in microwave absorbers. Carbon 2020, 168, 606–623. [Google Scholar] [CrossRef]
  7. Houbi, A.; Aldashevich, Z.A.; Atassi, Y.; Telmanovna, Z.B.; Saule, M.; Kubanych, K. Microwave absorbing properties of ferrites and their composites: A review. J. Magn. Magn. Mater. 2021, 529, 167839. [Google Scholar] [CrossRef]
  8. Bao, W.; Chen, C.; Si, Z. An easy method of synthesis CoxOy@C composite with enhanced microwave absorption performance. Nanomaterials 2020, 10, 902. [Google Scholar] [CrossRef]
  9. Lv, H.; Yang, Z.; Pan, H.; Wu, R. Electromagnetic absorption materials: Current progress and new frontiers. Prog. Mater. Sci. 2022, 127, 100946. [Google Scholar] [CrossRef]
  10. Wang, L.; Huang, M.; Yu, X.; You, W.; Zhao, B.; Liang, C.; Liu, X.; Zhang, X.; Che, R. Engineering polarization surface of hierarchical ZnO microspheres via spray-annealing strategy for wide-frequency electromagnetic wave absorption. J. Mater. Sci. Technol. 2022, 131, 231–239. [Google Scholar] [CrossRef]
  11. Lv, H.; Wu, C.; Tang, J.; Du, H.; Qin, F.; Peng, H.; Yan, M. Two-dimensional SnO/SnO2 heterojunctions for electromagnetic wave absorption. Chem. Eng. J. 2021, 411, 128445. [Google Scholar] [CrossRef]
  12. Ojha, G.P.; Pant, B.; Park, S.J.; Park, M.; Kim, H.Y. Synthesis and characterization of reduced graphene oxide decorated with CeO2-doped MnO2 nanorods for supercapacitor applications. J. Colloid Interface Sci. 2017, 494, 338–344. [Google Scholar] [CrossRef] [PubMed]
  13. Zhi, D.; Li, T.; Li, J.; Ren, H.; Meng, F. A review of three-dimensional graphene-based aerogels: Synthesis, structure and application for microwave absorption. Compos. Part B Eng. 2021, 211, 108642. [Google Scholar] [CrossRef]
  14. Song, Q.; Ye, F.; Kong, L.; Shen, Q.; Han, L.; Feng, L.; Yu, G.; Pan, Y.; Li, H. Graphene and MXene nanomaterials: Toward high-performance electromagnetic wave absorption in gigahertz band range. Adv. Funct. Mater. 2020, 30, 2105190. [Google Scholar] [CrossRef]
  15. Wang, X.; Yu, J.; Dong, H.; Yu, M.; Zhang, B.; Wang, W.; Dong, L. Synthesis of nanostructured MnO2, SnO2, and Co3O4: Graphene composites with enhanced microwave absorption properties. Appl. Phys. A 2015, 119, 1483–1490. [Google Scholar] [CrossRef]
  16. Liu, Y.; Du, X.; Wu, C.; Liu, Y.; Liu, Y.; Zhao, G. Reduced graphene oxide decorated with ZnO microrods for efficient electromagnetic wave absorption performance. J. Mater. Sci. Mater. Electron. 2020, 31, 8637–8648. [Google Scholar] [CrossRef]
  17. Shi, S.; Hao, S.; Yang, C.; Chen, Y.; Chu, H.; Dai, S. Enhanced microwave absorption properties of reduced graphene oxide/TiO2 nanowire composites synthesized via simultaneous carbonation and hydrogenation. J. Mater. Chem. C 2022, 10, 9586–9595. [Google Scholar] [CrossRef]
  18. Qin, M.; Zhang, L.; Wu, H. Dielectric loss mechanism in electromagnetic wave absorbing materials. Adv. Sci. 2022, 9, 2105553. [Google Scholar] [CrossRef]
  19. Wang, Q.; Yao, N.; An, D.; Li, Y.; Zou, Y.; Lian, X.; Tong, X. Enhanced gas sensing properties of hierarchical SnO2 nanoflower assembled from nanorods via a one-pot template-free hydrothermal method. Ceram. Int. 2016, 42, 15889–15896. [Google Scholar] [CrossRef]
  20. Gao, Y.; Fan, Y.; Zhang, J.; Liu, X.; Wang, N.; Yang, S. The study of graphene oxide on the regulations and controls of the sol-gel film structure and its performance. Metals 2021, 12, 20. [Google Scholar] [CrossRef]
  21. Shen, H.; Wang, Z.; Wang, C.; Zou, P.; Hou, Z.; Xu, C.; Wu, H. Defect- and interface-induced dielectric loss in ZnFe2O4/ZnO/C electromagnetic wave absorber. Nanomaterials 2022, 12, 2871. [Google Scholar] [CrossRef] [PubMed]
  22. Rosoiu, S.P.; Pantazi, A.G.; Petica, A.; Cojocaru, A.; Costovici, S.; Zanella, C.; Visan, T.; Anicai, L.; Enachescu, M. Electrodeposition of NiSn-rGO composite coatings from deep eutectic solvents and their physicochemical characterization. Metals 2020, 10, 1455. [Google Scholar] [CrossRef]
  23. Huang, L.; Zhu, P.; Li, G.; Lu, D.; Sun, R.; Wong, C. Core–shell SiO2@RGO hybrids for epoxy composites with low percolation threshold and enhanced thermo-mechanical properties. J. Mater. Chem. A 2014, 2, 18246–18255. [Google Scholar] [CrossRef]
  24. Shen, H.; Zhao, X.R.; Duan, L.B.; Liu, R.D.; Li, H. Enhanced visible light photocatalytic activity in SnO2@g-C3N4 core-shell structures. Mater. Sci. Eng. B 2017, 218, 23–30. [Google Scholar] [CrossRef]
  25. Elci, A.; Demirtas, O.; Ozturk, I.M.; Bek, A.; Nalbant Esenturk, E. Synthesis of tin oxide-coated gold nanostars and evaluation of their surface-enhanced Raman scattering activities. J. Mater. Sci. 2018, 53, 16345–16356. [Google Scholar] [CrossRef]
  26. Zhou, G.; Wang, D.W.; Yin, L.C.; Li, N.; Li, F.; Cheng, H.M. Oxygen bridges between NiO nanosheets and graphene for improvement of lithium storage. ACS Nano 2012, 6, 3214–3223. [Google Scholar] [CrossRef]
  27. Serodre, T.; Oliveira, N.; Miquita, D.; Ferreira, M.; Santos, A.; Resende, V.; Furtado, C. Surface silanization of graphene oxide under mild reaction conditions. J. Braz. Chem. Soc. 2019, 30, 2488–2499. [Google Scholar] [CrossRef]
  28. Min, H.; Girard-Lauriault, P.L.; Gross, T.; Lippitz, A.; Dietrich, P.; Unger, W.E. Ambient-ageing processes in amine self-assembled monolayers on microarray slides as studied by ToF-SIMS with principal component analysis, XPS, and NEXAFS spectroscopy. Anal. Bioanal. Chem. 2012, 403, 613–623. [Google Scholar] [CrossRef]
  29. Cong, R.; Park, H.H.; Jo, M.; Lee, H.; Lee, C.S. Synthesis and electrochemical performance of electrostatic self-assembled nano-silicon@N-doped reduced graphene oxide/carbon nanofibers composite as anode material for lithium-ion batteries. Molecules 2021, 26, 4831. [Google Scholar] [CrossRef]
  30. Liu, J.; Liang, H.; Wu, H. Hierarchical flower-like Fe3O4/MoS2 composites for selective broadband electromagnetic wave absorption performance. Compos. Part A-Appl. Sci. Manuf. 2020, 130, 105760. [Google Scholar] [CrossRef]
  31. Liu, Y.; Zhou, X.; Jia, Z.; Wu, H.; Wu, G. Oxygen vacancy-induced dielectric polarization prevails in the electromagnetic wave-absorbing mechanism for Mn-based MOFs-derived composites. Adv. Funct. Mater. 2022, 32, 2204499. [Google Scholar] [CrossRef]
  32. Shewale, P.S.; Ung Sim, K.; Kim, Y.-b.; Kim, J.H.; Moholkar, A.V.; Uplane, M.D. Structural and photoluminescence characterization of SnO2:F thin films deposited by advanced spray pyrolysis technique at low substrate temperature. J. Lumin. 2013, 139, 113–118. [Google Scholar] [CrossRef]
  33. Deshmukh, S.M.; Patil, S.S.; Babar, S.B.; Alshehri, S.; Ghoneim, M.M.; Tamboli, A.M.; Lam, N.H.; Truong, N.T.N.; Kim, C.D.; Tamboli, M.S.; et al. TiO2–SnO2 nanocomposites for photocatalytic environmental remediation under UV-light. Metals 2022, 12, 733. [Google Scholar] [CrossRef]
  34. Alaizeri, Z.M.; Alhadlaq, H.A.; Aldawood, S.; Akhtar, M.J.; Ahamed, M. One-pot synthesis of SnO2-rGO nanocomposite for enhanced photocatalytic and anticancer activity. Polymers 2022, 14, 2036. [Google Scholar] [CrossRef]
  35. Chang, Q.; Liang, H.; Shi, B.; Li, X.; Zhang, Y.; Zhang, L.; Wu, H. Ethylenediamine-assisted hydrothermal synthesis of NiCo2O4 absorber with controlled morphology and excellent absorbing performance. J. Colloid Interface Sci. 2021, 588, 336–345. [Google Scholar] [CrossRef]
  36. Chai, L.; Wang, Y.; Zhou, N.; Du, Y.; Zeng, X.; Zhou, S.; He, Q.; Wu, G. In-situ growth of core-shell ZnFe2O4@ porous hollow carbon microspheres as an efficient microwave absorber. J. Colloid Interface Sci. 2021, 581, 475–484. [Google Scholar] [CrossRef]
  37. Chen, G.; Zhang, L.; Luo, B.; Wu, H. Optimal control of the compositions, interfaces, and defects of hollow sulfide for electromagnetic wave absorption. J. Colloid Interface Sci. 2022, 607, 24–33. [Google Scholar] [CrossRef] [PubMed]
  38. Luo, X.; Zhang, K.; Zhou, Y.; Wu, H.; Xie, H. In situ construction of Fe3Al@Al2O3 core-shell particles with excellent electromagnetic absorption. J. Colloid Interface Sci. 2022, 611, 306–316. [Google Scholar] [CrossRef]
Figure 1. The schematic diagram of the synthesis process of S1, S2, and S3.
Metals 12 02154 g001
Figure 2. XRD pattern (a) and Raman spectra (b) of S1−S3.
Metals 12 02154 g002
Figure 3. FTIR spectra of GO, S2, and S3.
Metals 12 02154 g003
Figure 4. SEM images of S1 (a), S2 (b), and S3 (c); TEM images of S1 (d,e) and S2 (f,g).
Metals 12 02154 g004
Figure 5. XPS survey spectra (a), N1s spectra (b), and C1s spectra (c) of S2; (d) O1s spectra of S2 and S3; (e) PL spectra of S1−S3; (f) Gaussian fitting of S2.
Metals 12 02154 g005
Figure 6. The real part (a) and imaginary part (b) of complex permittivity; (c) the dielectric loss tangent; (d) the Cole–Cole plot of S2.
Metals 12 02154 g006
Figure 7. A 1D plot, 2D map, and 3D diagram of RL value as a function of frequency and thickness: (ac) S1, (df) S2, and (gi) S3.
Metals 12 02154 g007
Figure 8. (a) RL value and (b) impedance-matching characteristics of S2 with various thicknesses; (c) the impedance-matching characteristics of S1−S3 under optimized thickness; (d) the attenuation constant (α) of S1−S3.
Metals 12 02154 g008
Figure 9. Schematic diagram of multiple EMW absorption mechanisms in SnO2@rGO composites.
Metals 12 02154 g009
Publisher’s Note: MDPI stays neutral with regard to jurisdictional claims in published maps and institutional affiliations.

