Article

Strain-Controlled Fatigue Behavior of a Nodular Cast Iron in Real Off-Highway Axles: Effects of Casting Skin and Strain Ratio

by
Federico Scacco
,
Alberto Campagnolo
,
Mattia Franceschi
and
Giovanni Meneghetti
*
Department of Industrial Engineering, University of Padova, Via Venezia 1, 35131 Padova, Italy
*
Author to whom correspondence should be addressed.
Metals 2022, 12(3), 426; https://doi.org/10.3390/met12030426
Submission received: 18 January 2022 / Revised: 17 February 2022 / Accepted: 22 February 2022 / Published: 28 February 2022
(This article belongs to the Special Issue Recent Advances in Cast Irons)

Abstract

:
Nodular cast irons are widely adopted in off-highway vehicles, since they allow to obtain components with complex shapes as well as good mechanical properties. However, the fatigue strength of such components is a major issue, which is typically addressed by adopting the strain-life approach, since it considers the local strains at stress concentrators where fatigue cracks are prone to initiate. In the fatigue design of off-highway components, the detrimental effect of casting skin, due to both surface and subsurface features, must be accounted for in all cases where machining is not needed. Moreover, the local strain ratio at stress raisers can be different from the nominal one due to forward plasticity. In this paper, static tensile as well as strain-controlled fatigue tests have been executed on specimens taken from real EN-GJS-450-10 off-highway axles. Static tensile tests have been performed on specimens with machined surfaces, while fatigue tests at a strain ratio equal to −1 have been carried out on specimens with surfaces in both machined and as-cast conditions. In addition, machined specimens have been tested at strain ratios equal to 0.1 and 0.5 to investigate the material sensitivity to the mean strain. Finally, the high-cycle downgrading effect of the casting skin has been evaluated, and experimental data of machined specimens tested at different strain ratios have been summarized by using the Smith–Watson–Topper expression.

1. Introduction

Nodular cast irons are preferred materials for manufacturing axles of off-highway vehicles because their complex shape can be manufactured at affordable costs and with adequate mechanical properties for structural applications. However, such components must withstand severe cyclic loadings during the in-service conditions; therefore, reliable material data and approaches are necessary to design against fatigue.
Several papers in the literature have been devoted to investigate the fatigue behavior of nodular cast irons, providing both material data and fatigue criteria, among them: stress-life approaches [1,2,3,4,5,6], fracture-mechanics-based methodologies [7,8,9,10,11,12], and strain-life approaches [13,14,15,16]. In the context of the fatigue design of off-highway axles made of nodular cast irons, the strain-life approach is widely employed, since it considers the local strains at stress concentrators where fatigue cracks are prone to initiate.
According to the experimental data collected in the literature, the mechanical properties of nodular cast irons, and particularly the fatigue resistance, are strongly influenced by the microstructure. The latter depends on the chemical composition, technological processes, heat treatments, geometry of the raw cast, and also the locations where specimens are taken.
Another relevant microstructural feature in nodular cast iron components is the casting skin, which represents the rim zone of the casting and can lead to a detrimental effect on the fatigue strength, not only for the high surface roughness but also for the deviating microstructure, since discontinuities such as inhomogeneous microstructures (e.g., decarburization or graphite degeneration and a ferritic or pearlitic rim, imperfections, pores, defects, and/or sand inclusions coming from the mold) are typically concentrated there [2]. The influence of the casting skin on the fatigue strength of cast iron components has been widely investigated in the recent literature [9,17,18,19,20,21,22,23,24,25]. This effect must be accounted for in the fatigue design of components where machining is not needed, such as the case of axles of off-highway vehicles.
Dealing with the loading condition, strain-controlled fatigue tests for material characterization are usually performed under completely reversed strains, that is, at a strain ratio Rε = −1. However, strain ratios different from −1 are typically present in the critical locations of axles of off-highway vehicles, especially at stress raisers where the local strain ratio could be different from the nominal one due to forward plasticity. To treat such cases, on one hand, mean stress/strain corrections [4,26] have been proposed to correct the strain-life fatigue approach, where the material parameters are calibrated on experimental results generated under push-pull, strain-controlled fatigue loading. On the other hand, the mean stress/strain sensitivity is a material-dependent feature [27]; therefore, it should be experimentally investigated through dedicated fatigue tests, as performed in [28,29,30], dealing with nodular cast irons.
In the present paper, specimens taken from real off-highway axles and made of nodular cast iron EN-GJS-450-10 have been tested to investigate previous topics relevant to the fatigue design of off-highway axles. In the relevant literature, to the best of the authors’ knowledge, there is a scarcity of experimental results relevant to the fatigue behavior of EN-GJS-450-10 nodular cast iron. In fact, only the works by Heinrietz and Hesseler [31] and Bleicher et al. [29] provided experimental results generated by testing EN-GJS-450-10 nodular cast iron under stress-controlled fatigue loading, while Bleicher et al. [29] also provided experimental results generated under strain-controlled fatigue loading, but only at a strain ratio Rε = −1. Moreover, no research work has been devoted to the specific topics of the casting skin and strain ratio effects on the fatigue strength of EN-GJS-450-10 nodular cast iron. In this context, the present work aims at filling these gaps. To do this, specimens with either machined or as-cast surfaces have been fatigue tested under strain-control loading to determine the high-cycle downgrading factor due to the cast skin effect. Finally, machined specimens have been fatigue tested under different strain ratios to analyze the influence of the mean strain.

2. Materials and Methods

2.1. Specimens’ Position

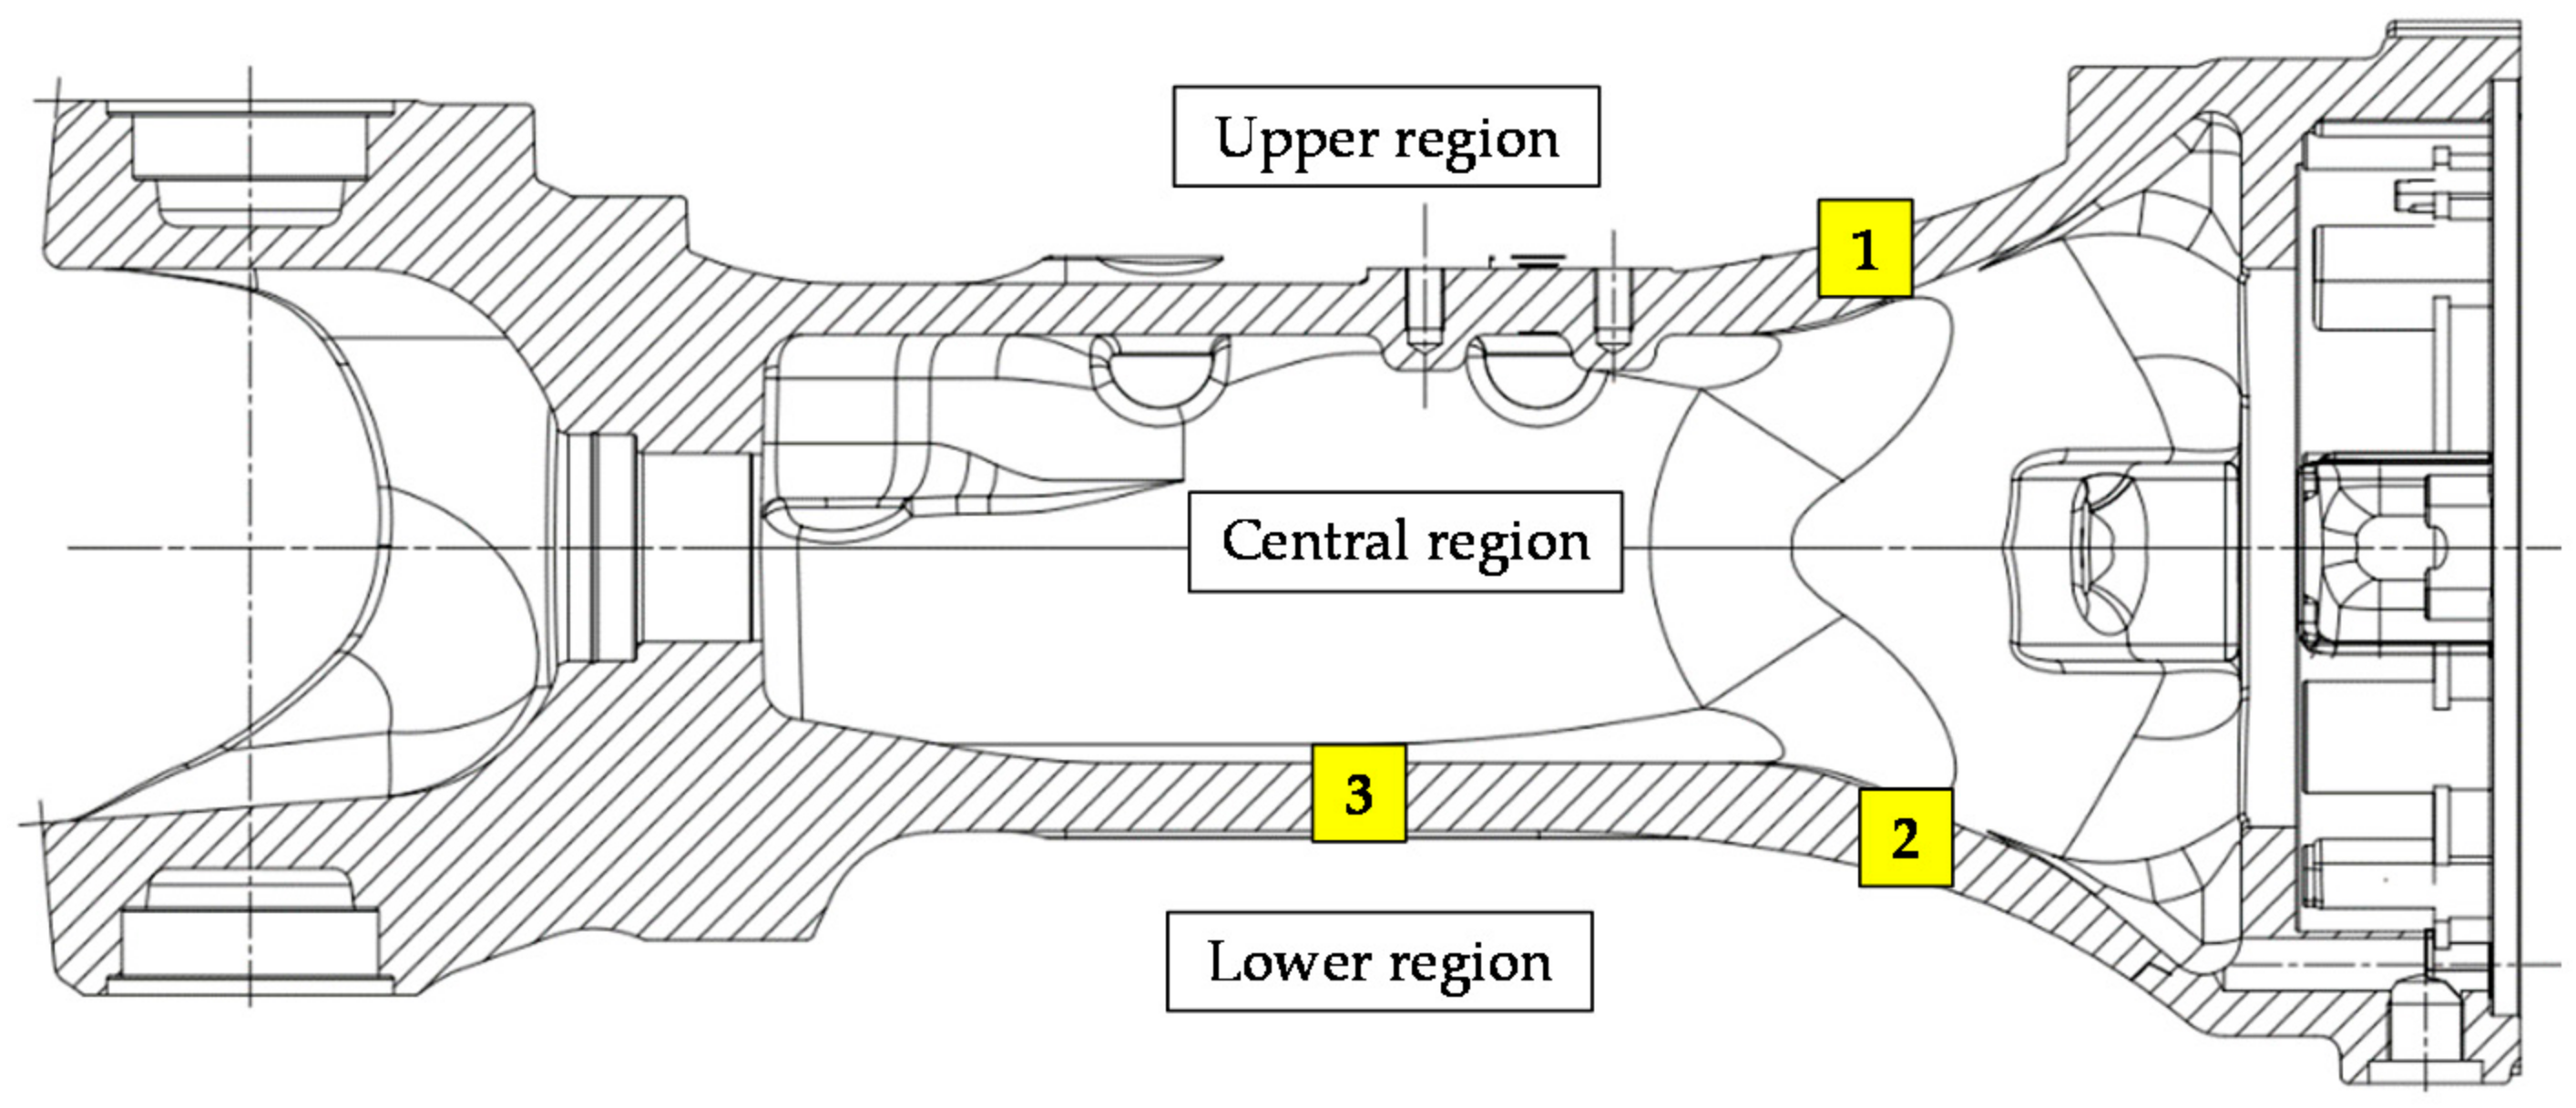
The analyzed material is a ferritic-pearlitic nodular cast iron, EN-GJS-450-10. Specimens were taken from a real off-highway axle, in order to include the effects of the manufacturing processes. Figure 1 shows the overall geometry of the axle along with the definition of the upper, central, and lower regions. Specimens were located in the wall thickness of the axle; more precisely, cylindrical specimens were taken from the radiused lower-right region, while flat specimens with the casting skin have been taken from the straight, lower-central region, as highlighted in Figure 1. The specimens’ geometry will be presented in the following sections.

2.2. Metallographic Analyses and Hardness Measurements on the Axle

Metallographic analyses and Brinell hardness measurements according to [32,33] have been performed on three regions of the real off-highway axle as defined in Figure 2. The microstructure was observed with an Olympus BX51M optical microscope, while hardness has been measured by using a Wolpert UH3001 tester. Figure 3 shows the microstructures before and after Nital 4% etching, which allow one to classify the shape and size of graphite nodules and to define the composition of the matrix on the basis of a visual inspection, according to [32]. Table 1 summarizes the obtained results, while Table 2 reports the Brinell hardness measurements. As a result, graphite nodules have a regular spheroidal shape (shape VI [32]), with a diameter typically in the range between 15 μm and 60 μm (size 6/7 [32]); the matrix is approximately composed half by ferrite and half by pearlite, and the average Brinell hardness is between 182 and 186.

2.3. Static and Fatigue Testing: Parameters and Specimens’ Geometry

Static tensile tests and strain-controlled fatigue tests have been performed at room temperature by adopting an MTS 858 MiniBionix II axial servo-hydraulic testing machine (MTS, Eden Prairie, MN, USA), with a load capacity of 15 kN and equipped with an MTS TestStar IIm controller. The uniaxial extensometer MTS 634.12F-24 with gauge length of 25 mm has been adopted to measure the axial strain.
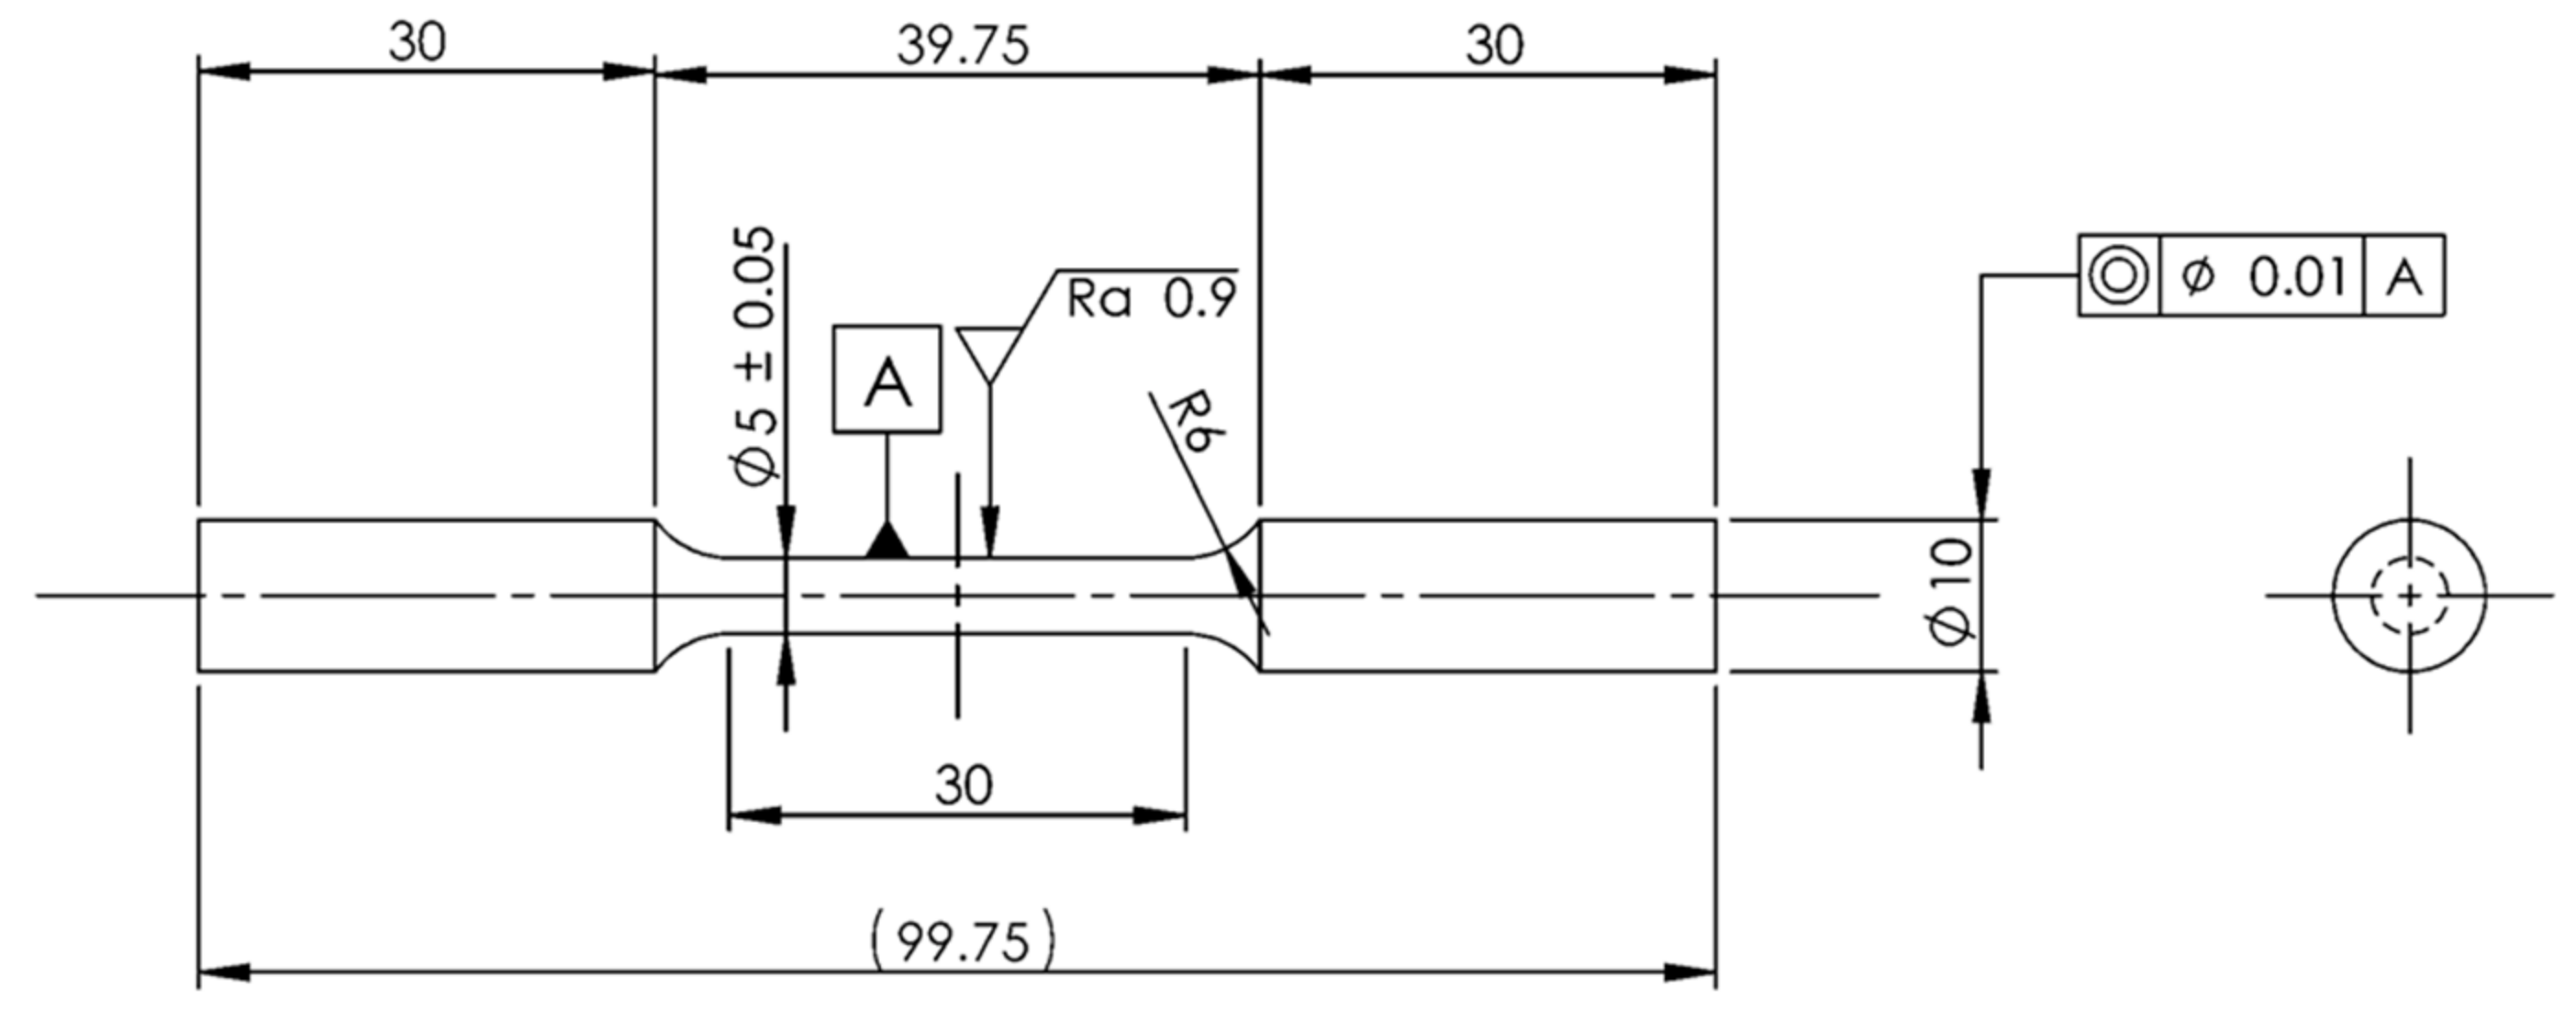
Static tensile tests have been performed on plain cylindrical specimens with machined surface (Figure 4) by applying a displacement rate equal to 0.5 mm/min under displacement control according to ISO 6892-1:2016 [34]. All in all, seven specimens have been tested. The MTS controller acquired the applied load from the load cell of the testing machine and the strain from the extensometer during each static test. After each test, the static Young’s modulus Es, the engineering proof stress σp,0.2, the engineering tensile strength σR, the elongation after fracture A%, and the reduction of area Z% have been derived.
Fatigue tests have been performed on plain cylindrical specimens with machined surface (Figure 5) by imposing a sinusoidal wave form under closed-loop total strain control mode according to ISO 12106:2017 [35]. In more detail, the cylindrical surface of the specimens has been machined by fine turning and then polished with fine emery papers to achieve a roughness of Ra = 0.9 μm. It is worth noting that specimens adopted for static tensile tests (Figure 4) have a smaller cross-section area as compared to that of specimens adopted in the fatigue tests (Figure 5). In fact, the diameter of the tested specimens has been properly selected to keep the maximum applied load below the load capacity of the testing machine (i.e., 15 kN). A nominal strain ratio Rε (defined as the ratio between the minimum and the maximum applied strain) equal to −1, 0.1, and 0.5 has been adopted in the tests to investigate the material sensitivity to the mean strain. In more detail, Rε = −1 is typically the reference strain ratio, as suggested also by ISO 12106:2017 [35]; while Rε = 0.1 and 0.5 are of interest for the specific application of real off-highway axles. In fact, strain ratios Rε approximately equal to 0.1 and 0.5 have been derived by both strain gauge measurements and elastic-plastic FE calculations performed close to the actual crack initiation location in real off-highway axles under two different in-service loading conditions. Test frequencies between 0.2 and 1 Hz have been adopted. During each fatigue test, the hysteresis loops have been measured by taking advantage of the signals acquired by the MTS controller from the load cell and the extensometer. Stabilised hysteresis loops have been defined at half the fatigue life of each specimen [35,36]. Long-run tests up to 2∙106 cycles in the elastic regime have been performed by switching to load-controlled mode and by adopting a test frequency of 15–18 Hz [36]. Fatigue tests have been interrupted when either specimen complete separation or run out condition, defined at 2∙106 cycles, occurred.
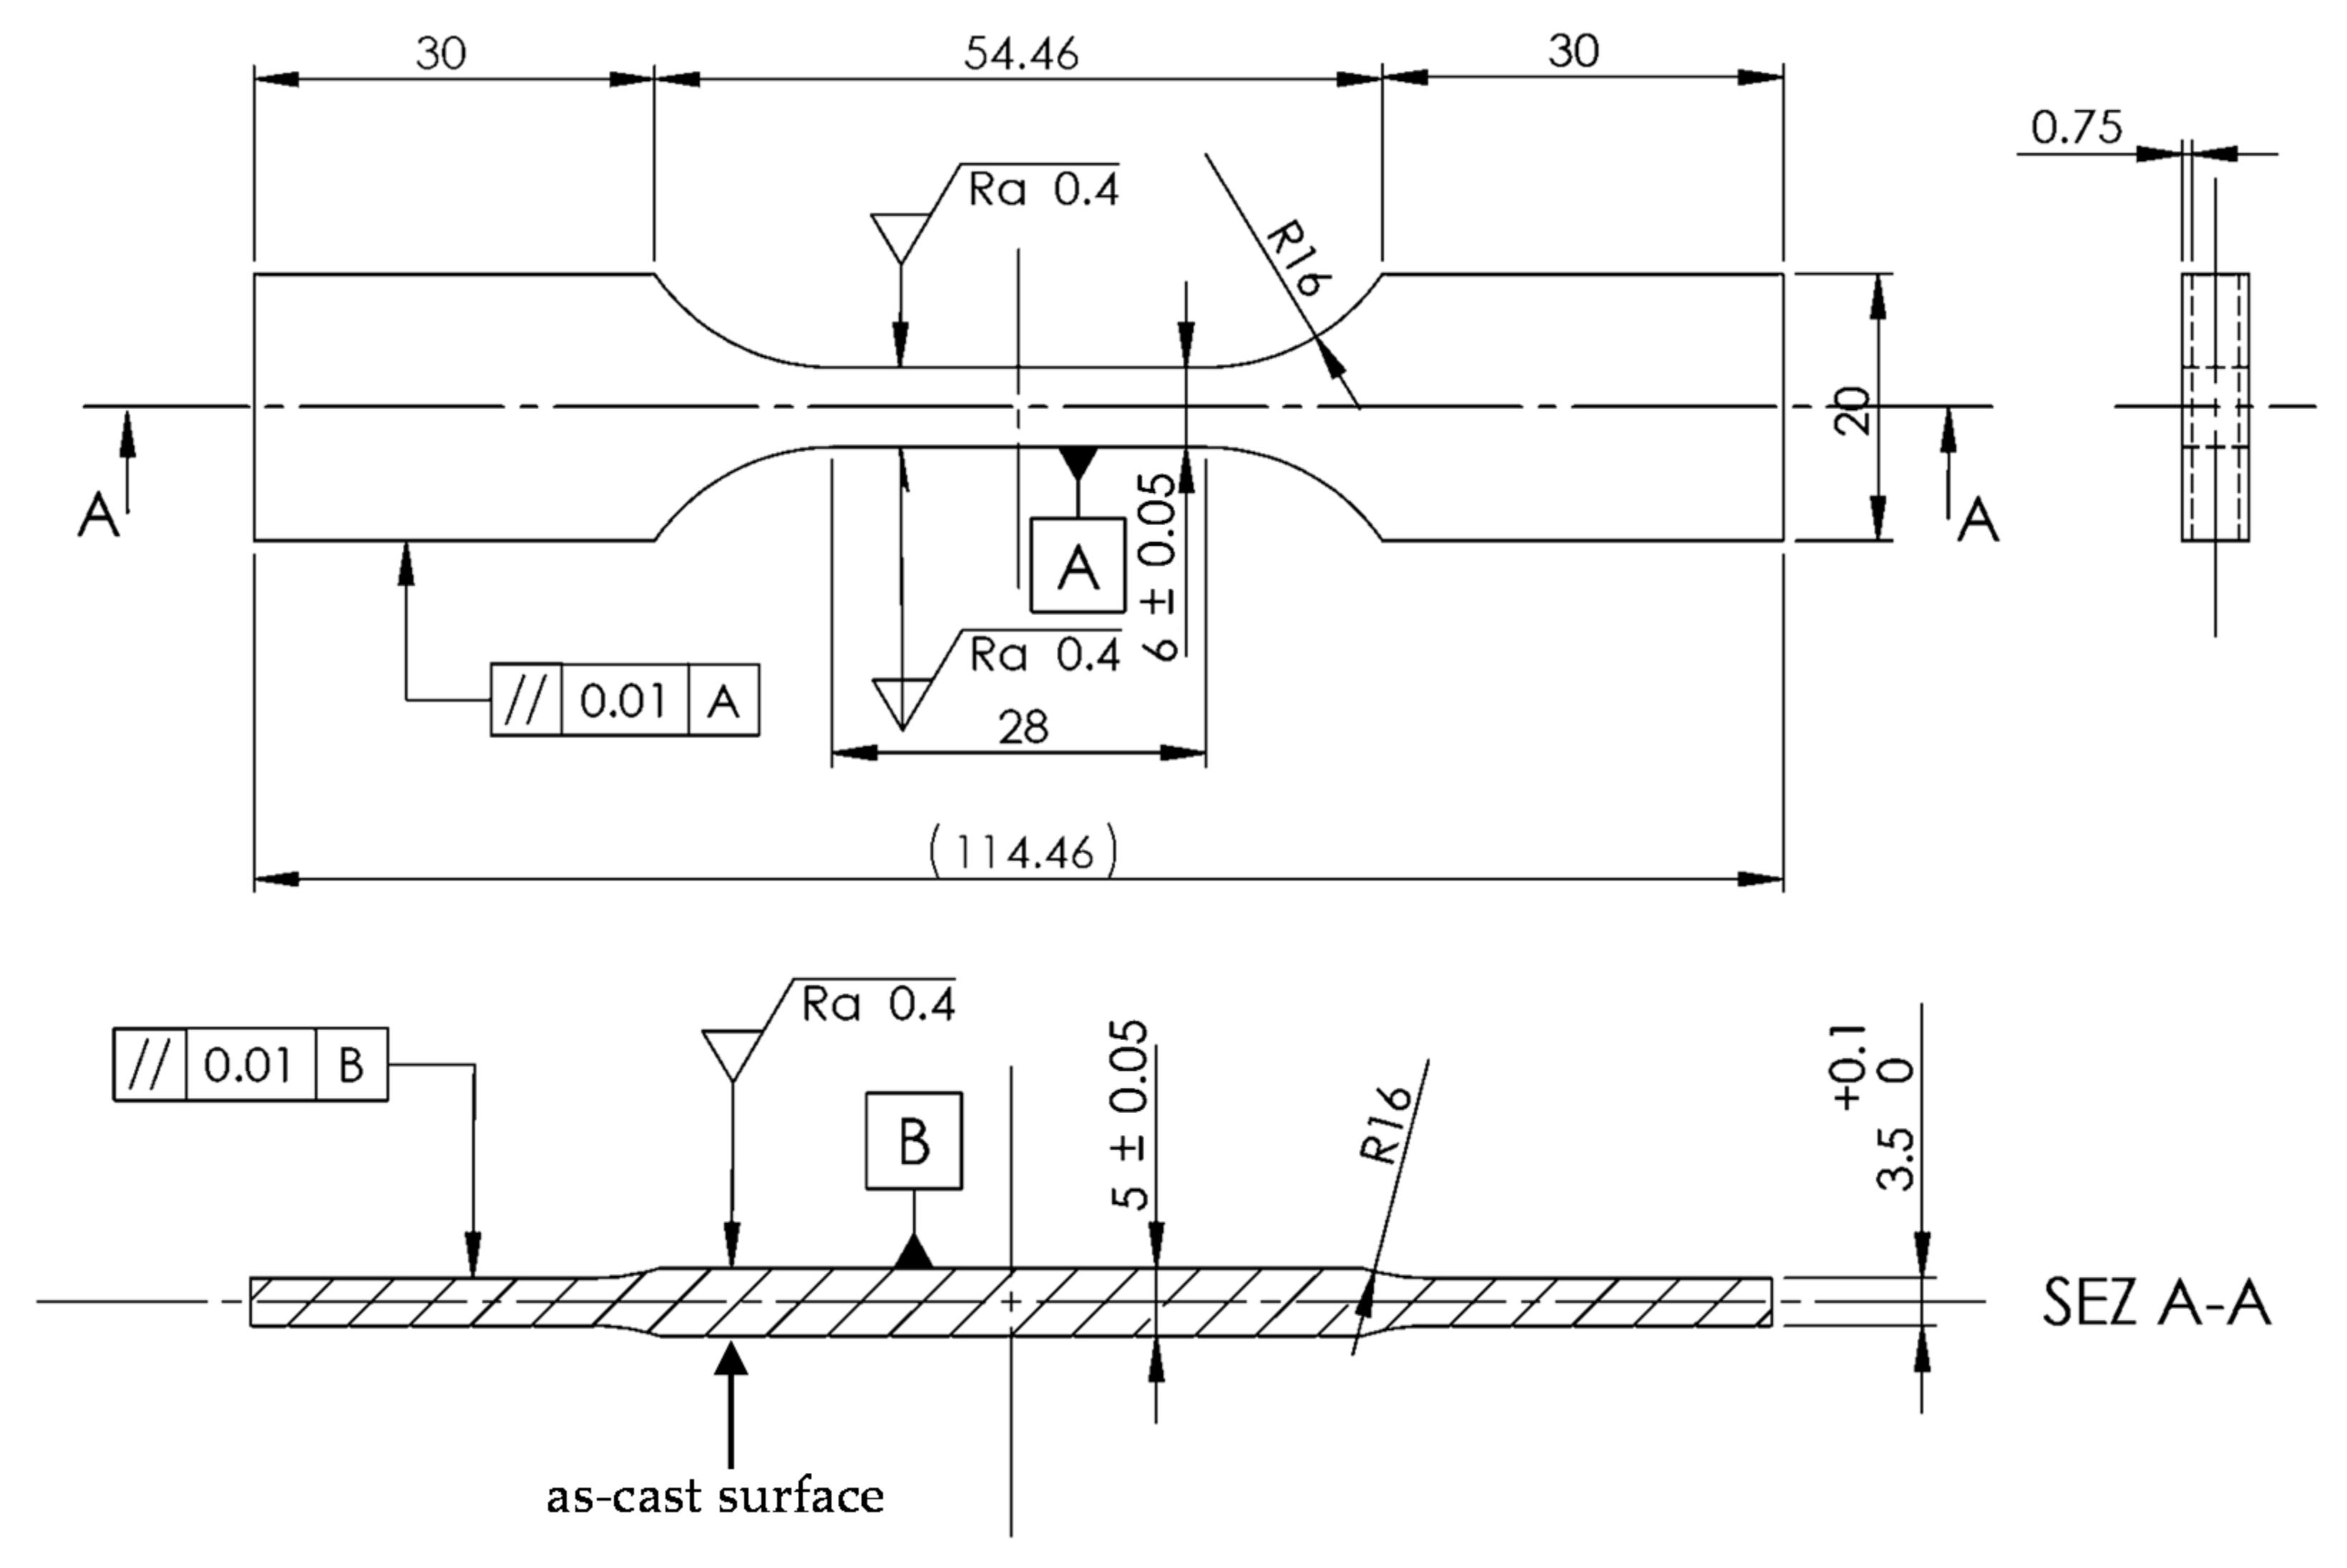
To investigate the detrimental effect of the casting skin, strain-controlled fatigue tests have been performed again under total strain control mode on plain flat specimens with three surfaces machined by milling to achieve a roughness of Ra = 0.4 μm, while one has been kept as-cast (Figure 6). A nominal strain ratio Rε = −1 has been adopted, and other testing parameters are kept the same as described above for cylindrical machined specimens.
It is worth noting that specimens have been taken only from regions 2 (Figure 4 and Figure 5) and 3 (Figure 6) of the off-highway axle shown in Figure 2, while no specimens were taken from region 1, due to the incompatibility of the size of the specimens with the available material in region 1 of the axle.
In all previous cases, given the load applied to the specimen and acquired by the MTS controller, the nominal stress σ has been calculated from the following expression:
σ = F A net = F π 4 · d net 2   for   cylindrical   specimens F W · t   for   flat   specimens  
where dnet = 5 mm (Figure 4) or 5.5 mm (Figure 5), while W = 6 mm and t = 5 mm (Figure 6).
Finally, Table 3 summarizes the surface conditions and geometries of the tested specimens and the parameters of the static and strain-controlled fatigue tests.
The fracture surfaces generated after static and fatigue tests have been analyzed by using a Leica Cambridge 440 Scanning Electron Microscope (SEM) (Leica, Wetzlar, Germany) equipped with EDS EDAX microbeam. Occasionally, fatigue fracture surfaces have also been analyzed by a Dino-Lite optical microscope (model AM4115ZT).

3. Results

3.1. Metallographic Analyses and Hardness Measurements on the Tested Samples

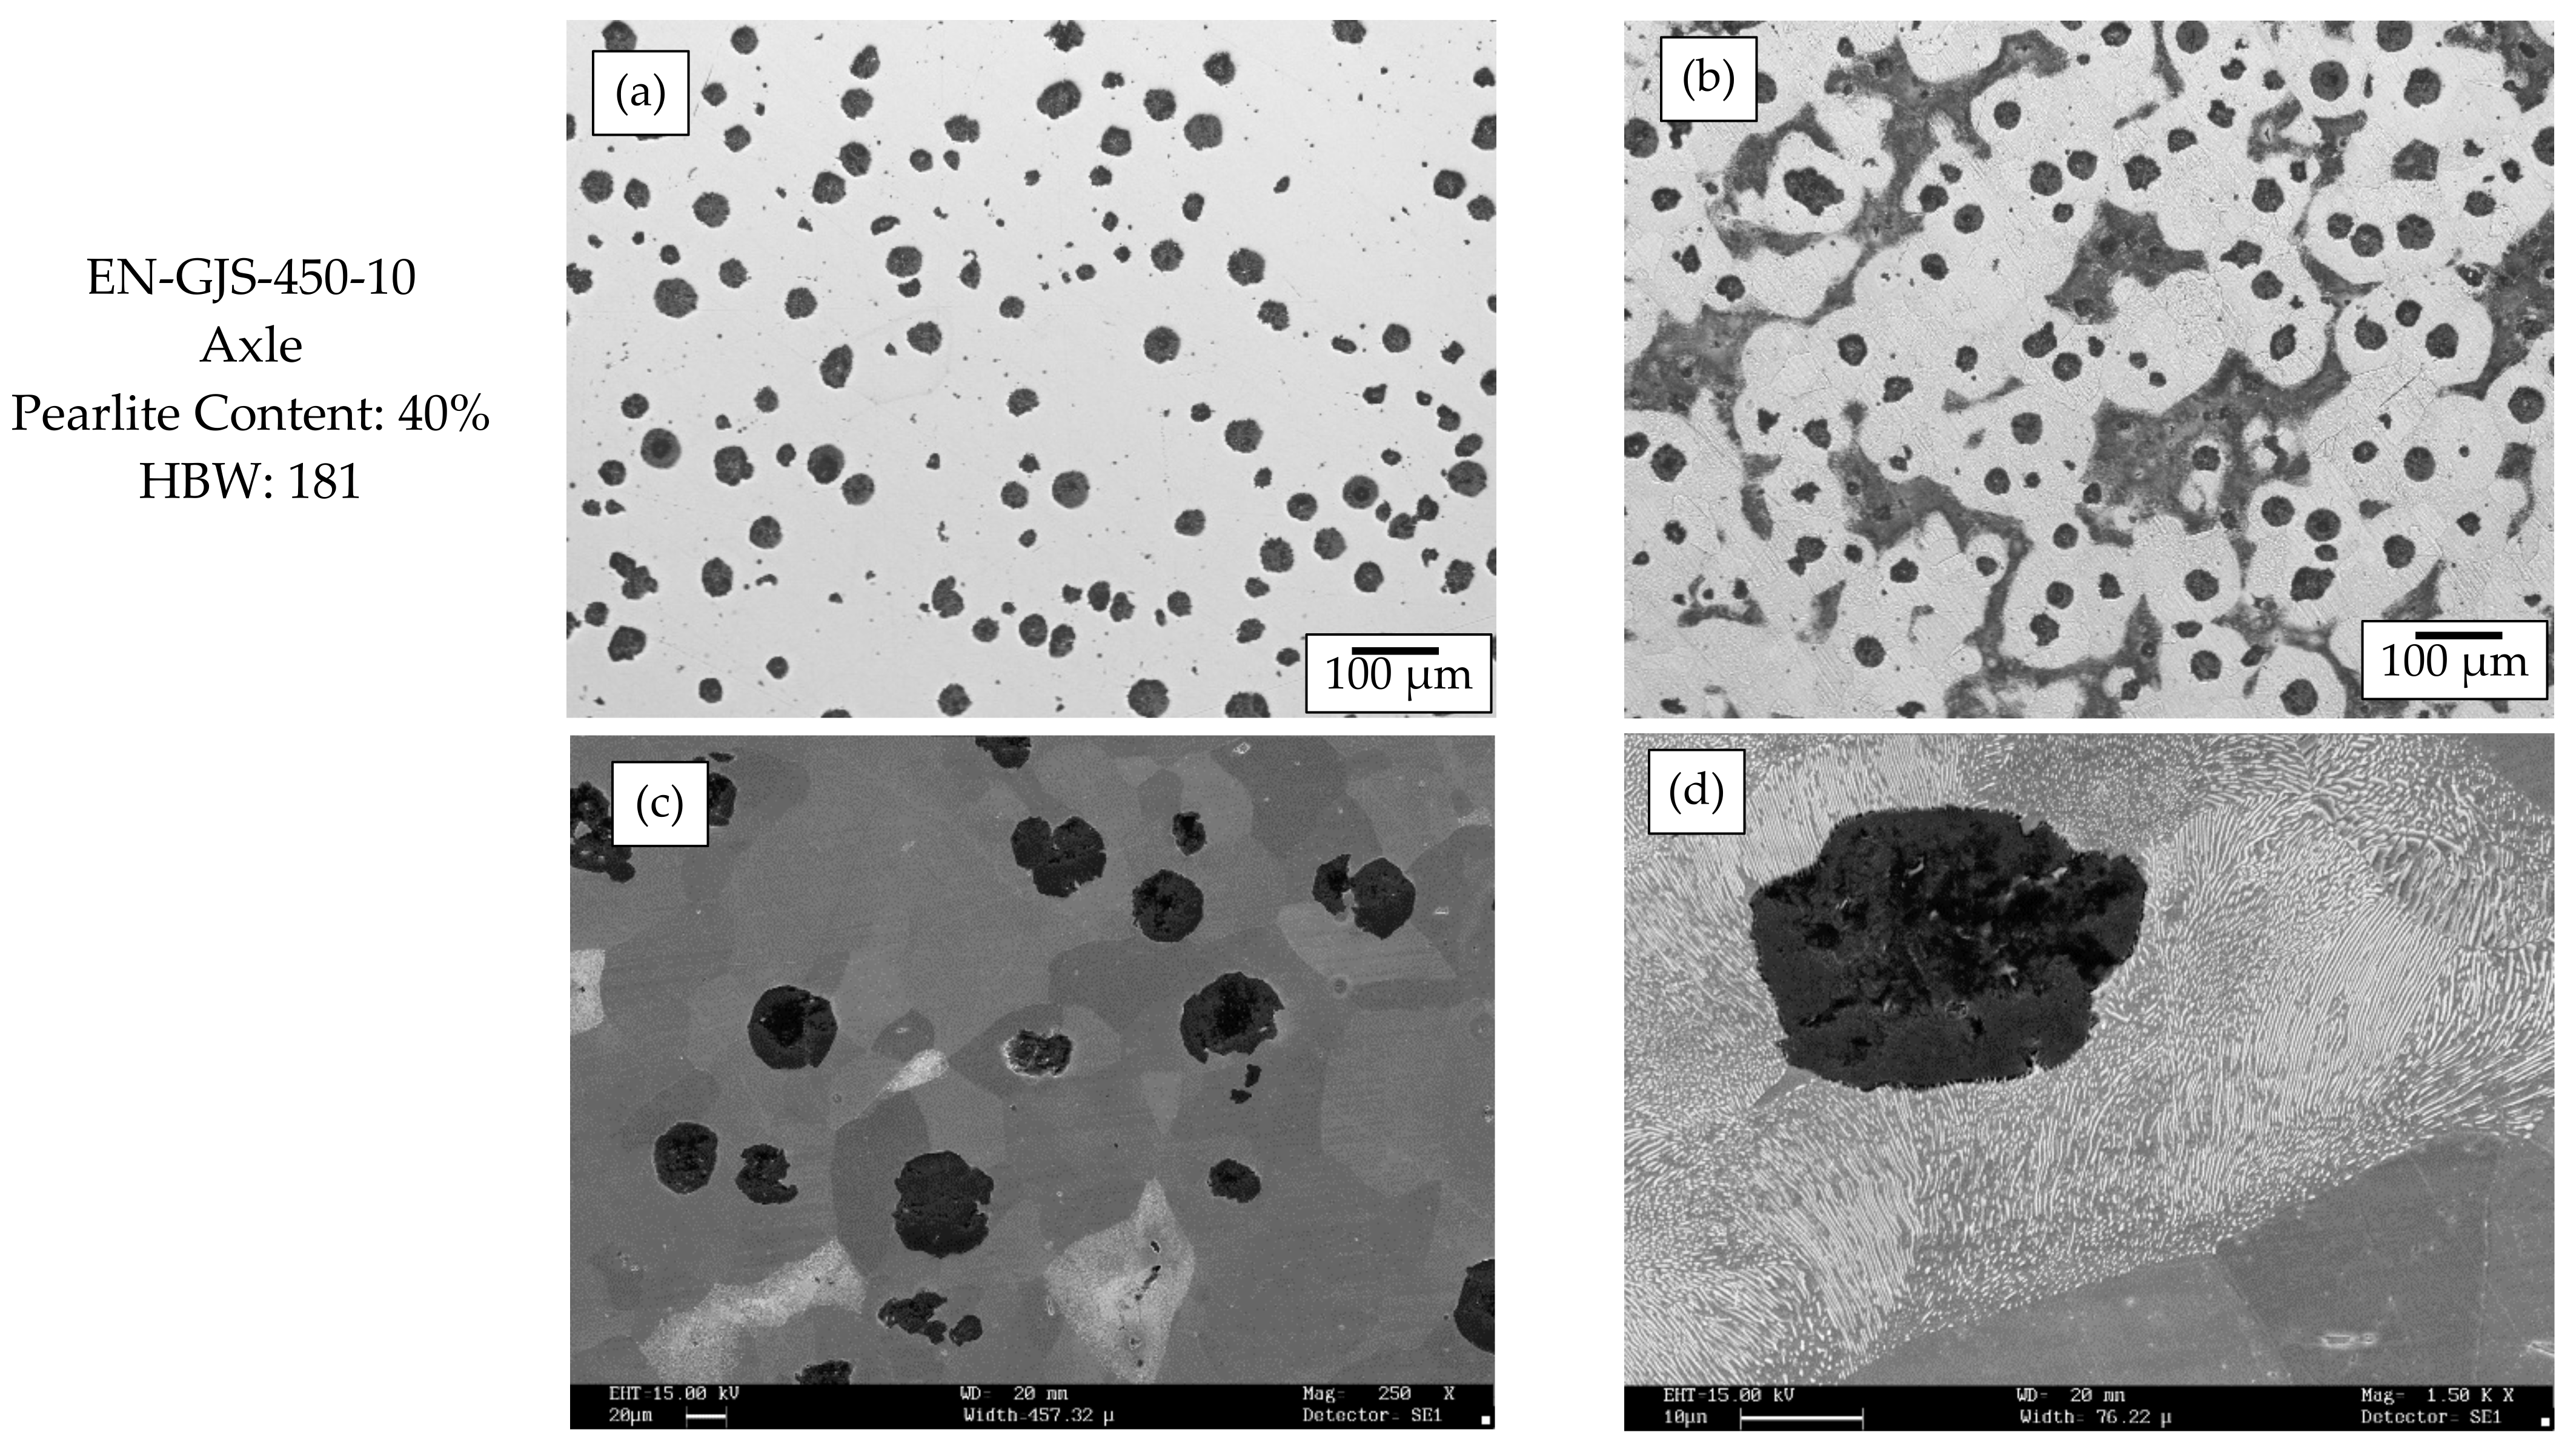
Metallographic analyses and Brinell hardness measurements according to [32,33] have been performed on six specimens taken from the real off-highway axle. Figure 7a,b reports the typical microstructures observed before and after Nital 4% etching, which allow to define the composition of the matrix, according to [32]. Table 4 summarizes the obtained results and shows that the pearlite content is in the range between 20% and 50%, the average value being around 40%, as documented in Figure 7, while the Brinell hardness is in the range between 170 and 206. Such results are in fairly good agreement with those collected in Figure 3 and Table 1 and Table 2 when analyzing some regions of the real off-highway axle. It is worth noting that the slight difference between the results reported here and in Section 2.2 can be explained due to the different analyzed region (i.e., the axle surface in Section 2.2 and the axle wall thickness in the present section). Moreover, only one metallographic analysis and three hardness measurements have been performed for each axle region in Section 2.2, while in the present section, six metallographic analyses and hardness measurements have been carried out.

3.2. Static Tensile Test Results

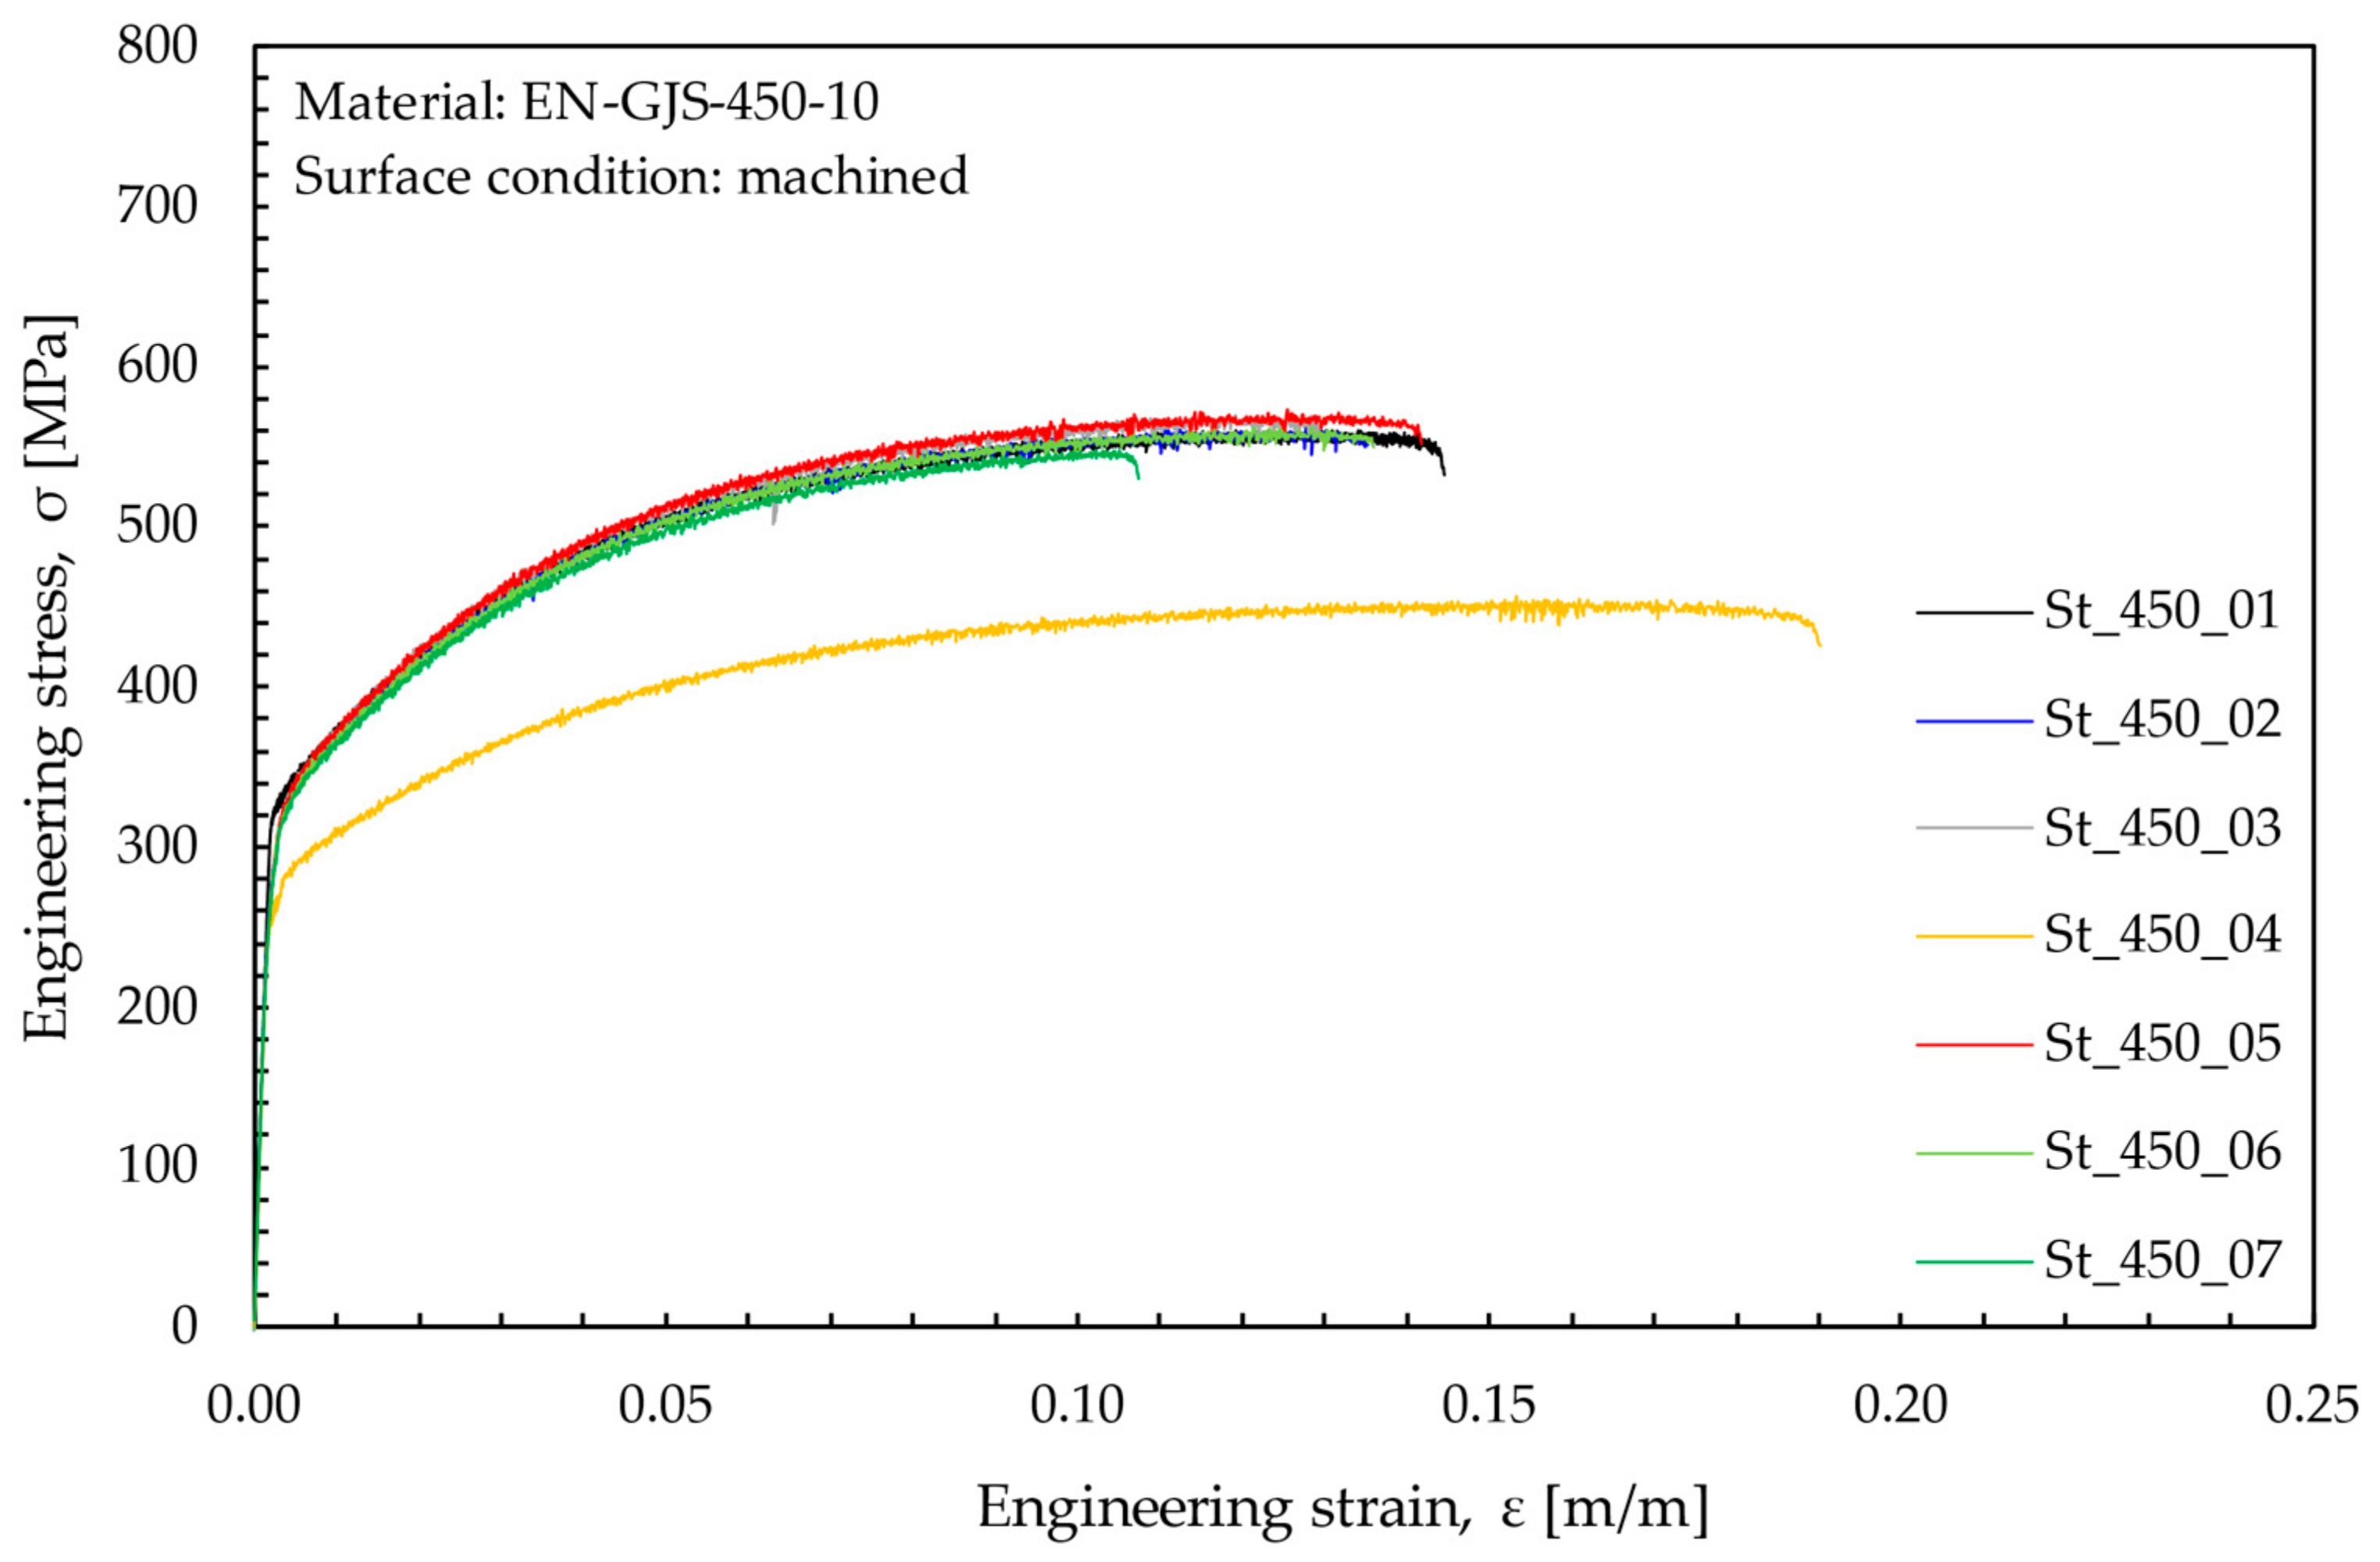
Tensile engineering stress-strain curves obtained from the static tests of seven samples have been reported in Figure 8. It can be observed that all specimens provided a similar stress-strain curve, with only the exception of the sample St_450_04, which will be commented upon later, and it has been excluded from the calculation of the average mechanical properties. Table 5 summarizes the average mechanical properties obtained from the tensile tests. As a result, the static Young’s modulus Es equals 169,174 MPa, the proof stress σp,02 results equal to 328 MPa, and the ultimate tensile strength σR is 538 MPa, while the elongation after fracture A% and the reduction of area Z% are equal to 12.9% and 10%, respectively. Therefore, all values are in good agreement with those prescribed by [37] for an EN-GJS-450-10 nodular cast iron (i.e., σp,02,min = 310 MPa, σR,min = 450 MPa, and A%min = 10%). Finally, the true stress-true strain experimental results have been fitted by using a Ramberg–Osgood expression:
ε = σ E s + σ K 1 n
The strength coefficient K and the strain hardening exponent n, resulting from the fitting of all curves (apart from that derived from sample St_450_04), are reported in Table 5.
It has been observed from Figure 8 that the stress-strain curve of sample St_450_04 is different from those generated by all other samples. In more detail, sample St_450_04 exhibited a lower ultimate tensile strength σR and a higher elongation after fracture A%, while its elastic modulus resulted in Es = 166036 MPa, which is only 2% lower than the average value derived by other samples (see Table 5). To learn more about the reasons for such different behaviours, metallographic analyses and Brinell hardness measurements according to [32,33] have been performed on sample St_450_04 and also on sample St_450_05, for comparison purposes. Figure 9 shows the microstructures observed before and after Nital 4% etching and highlights that sample St_450_04 has a pearlite content between 20% and 30% and a Brinell hardness of 127, while sample St_450_05 has a pearlite content between 40% and 50% and a Brinell hardness of 199. In several works in the literature [38,39,40,41], it has been shown that as the pearlite content increases in the microstructure, the Brinell hardness, the proof stress σp,02, and the ultimate tensile strength σR increases, making the material less ductile. In more detail, in [41], a Follansbee and Estrin-Kocks–Mecking approach accounting for the ferritic grain size and volume fraction of pearlite has been adopted to explicitly correlate the tensile behavior of EN-GJS-400 with its microstructural parameters. The results obtained here are in agreement with those reported in the literature, since sample St_450_04 has a significantly lower pearlite content than other samples, and it therefore also exhibited lower values of the Brinell hardness, the proof stress σp,02, and the ultimate tensile strength σR.

3.3. Strain-Controlled Fatigue Test Results

Each specimen tested under strain-controlled fatigue loading provided the number of reversals to failure 2Nf as a function of the applied strain amplitude εa and the stress-strain hysteresis loops recorded during the test.
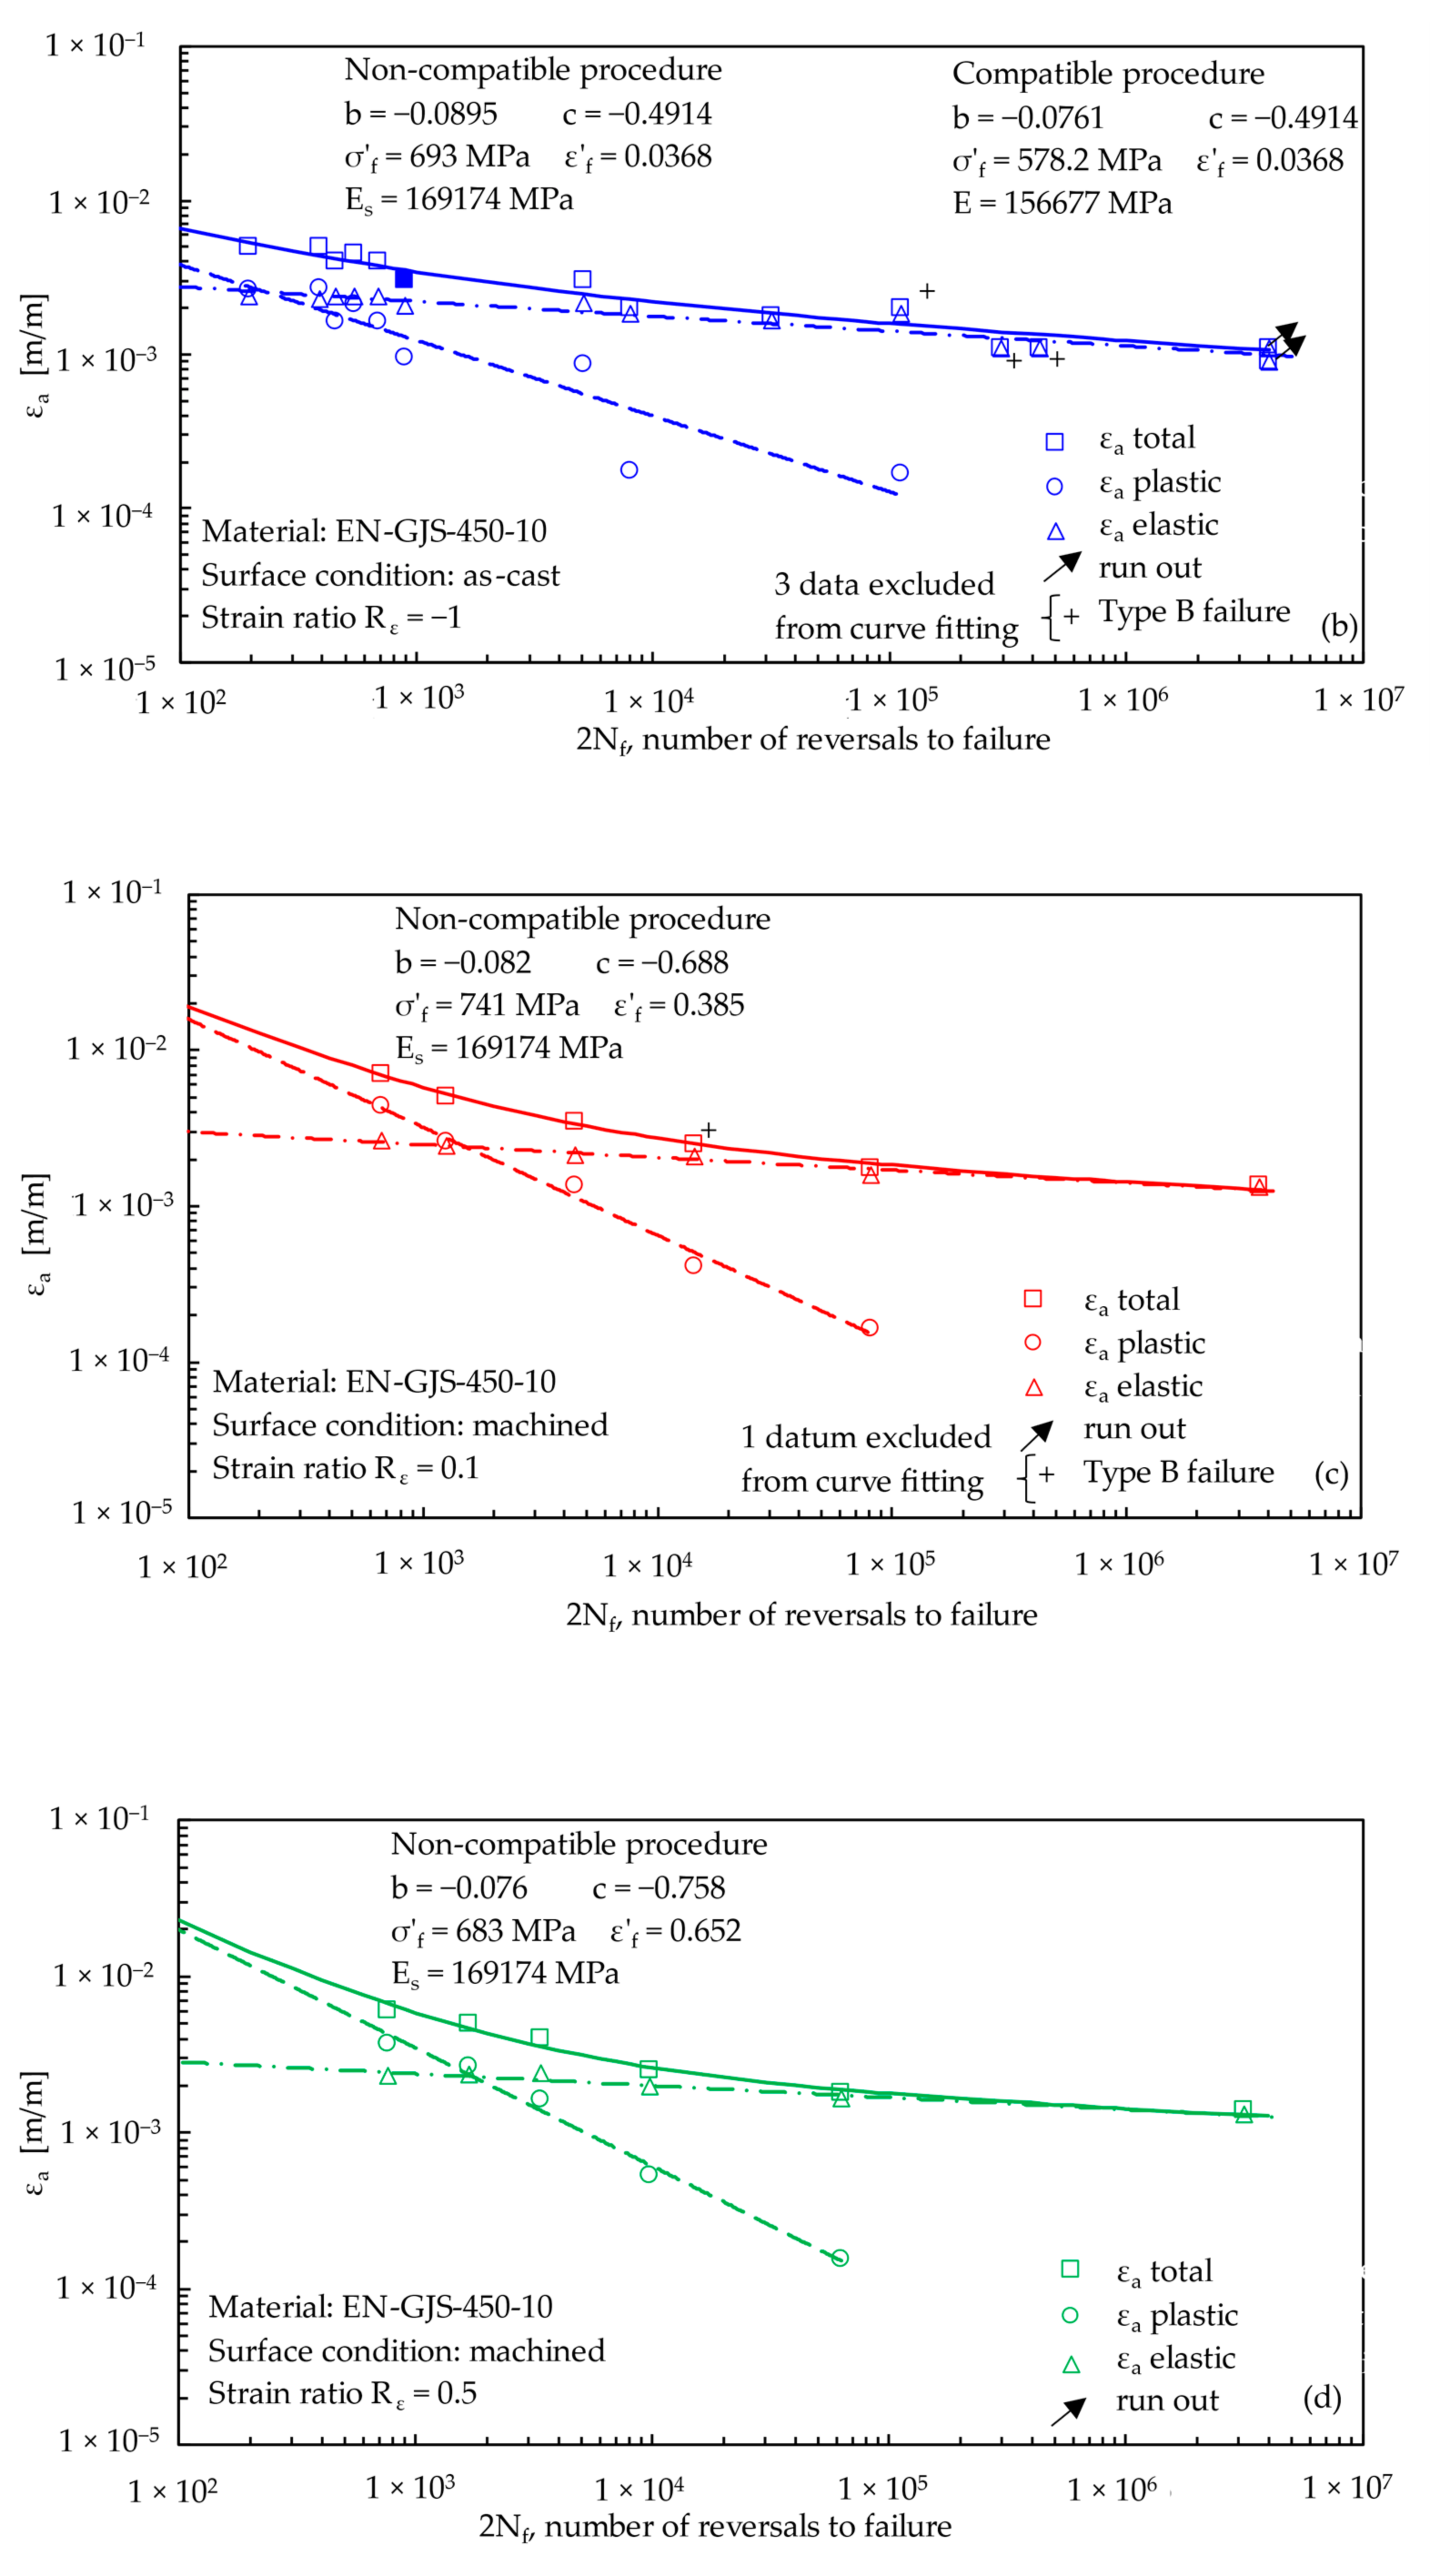
The experimental data 2Nf versus εa have been collected in Figure 10 for each test series, and they have been fitted using the Basquin [42], Manson [43], and Coffin [44] equations, according to which the total strain amplitude εa is divided into its elastic (εa,el) and plastic (εa,pl) components [45]:
ε a = ε a , el + ε a , pl = σ f E 2 N f b + ε f 2 N f c
The previous expression shows that four unknown material parameters, σ′f, ε′f, b and c, in addition to the modulus of elasticity E, must be derived by fitting the experimental fatigue results. The same strain-controlled fatigue data are usually employed to fit the material parameters K’ and n’ of a Ramberg–Osgood-type equation, which describes the stabilized stress-strain relationship due to cycling loadings:
ε = ε el + ε pl = σ E + σ K 1 n
By equating the elastic and plastic strain components of Equations (3) and (4), respectively, and removing the dependence on the number of reversals to failure 2Nf, the following compatibility equations can be derived [26]:
n = b c K = σ f ε f b c  
Such expressions highlight that only five among the seven material parameters (σ′f, ε′f, b, c, E, K’, and n’) appearing in Equations (3) and (4) are independent. In the recent literature [16,46,47], the compatibility between material properties has been further investigated with the aim of providing a unified treatment of the stress-strain-life experimental data.
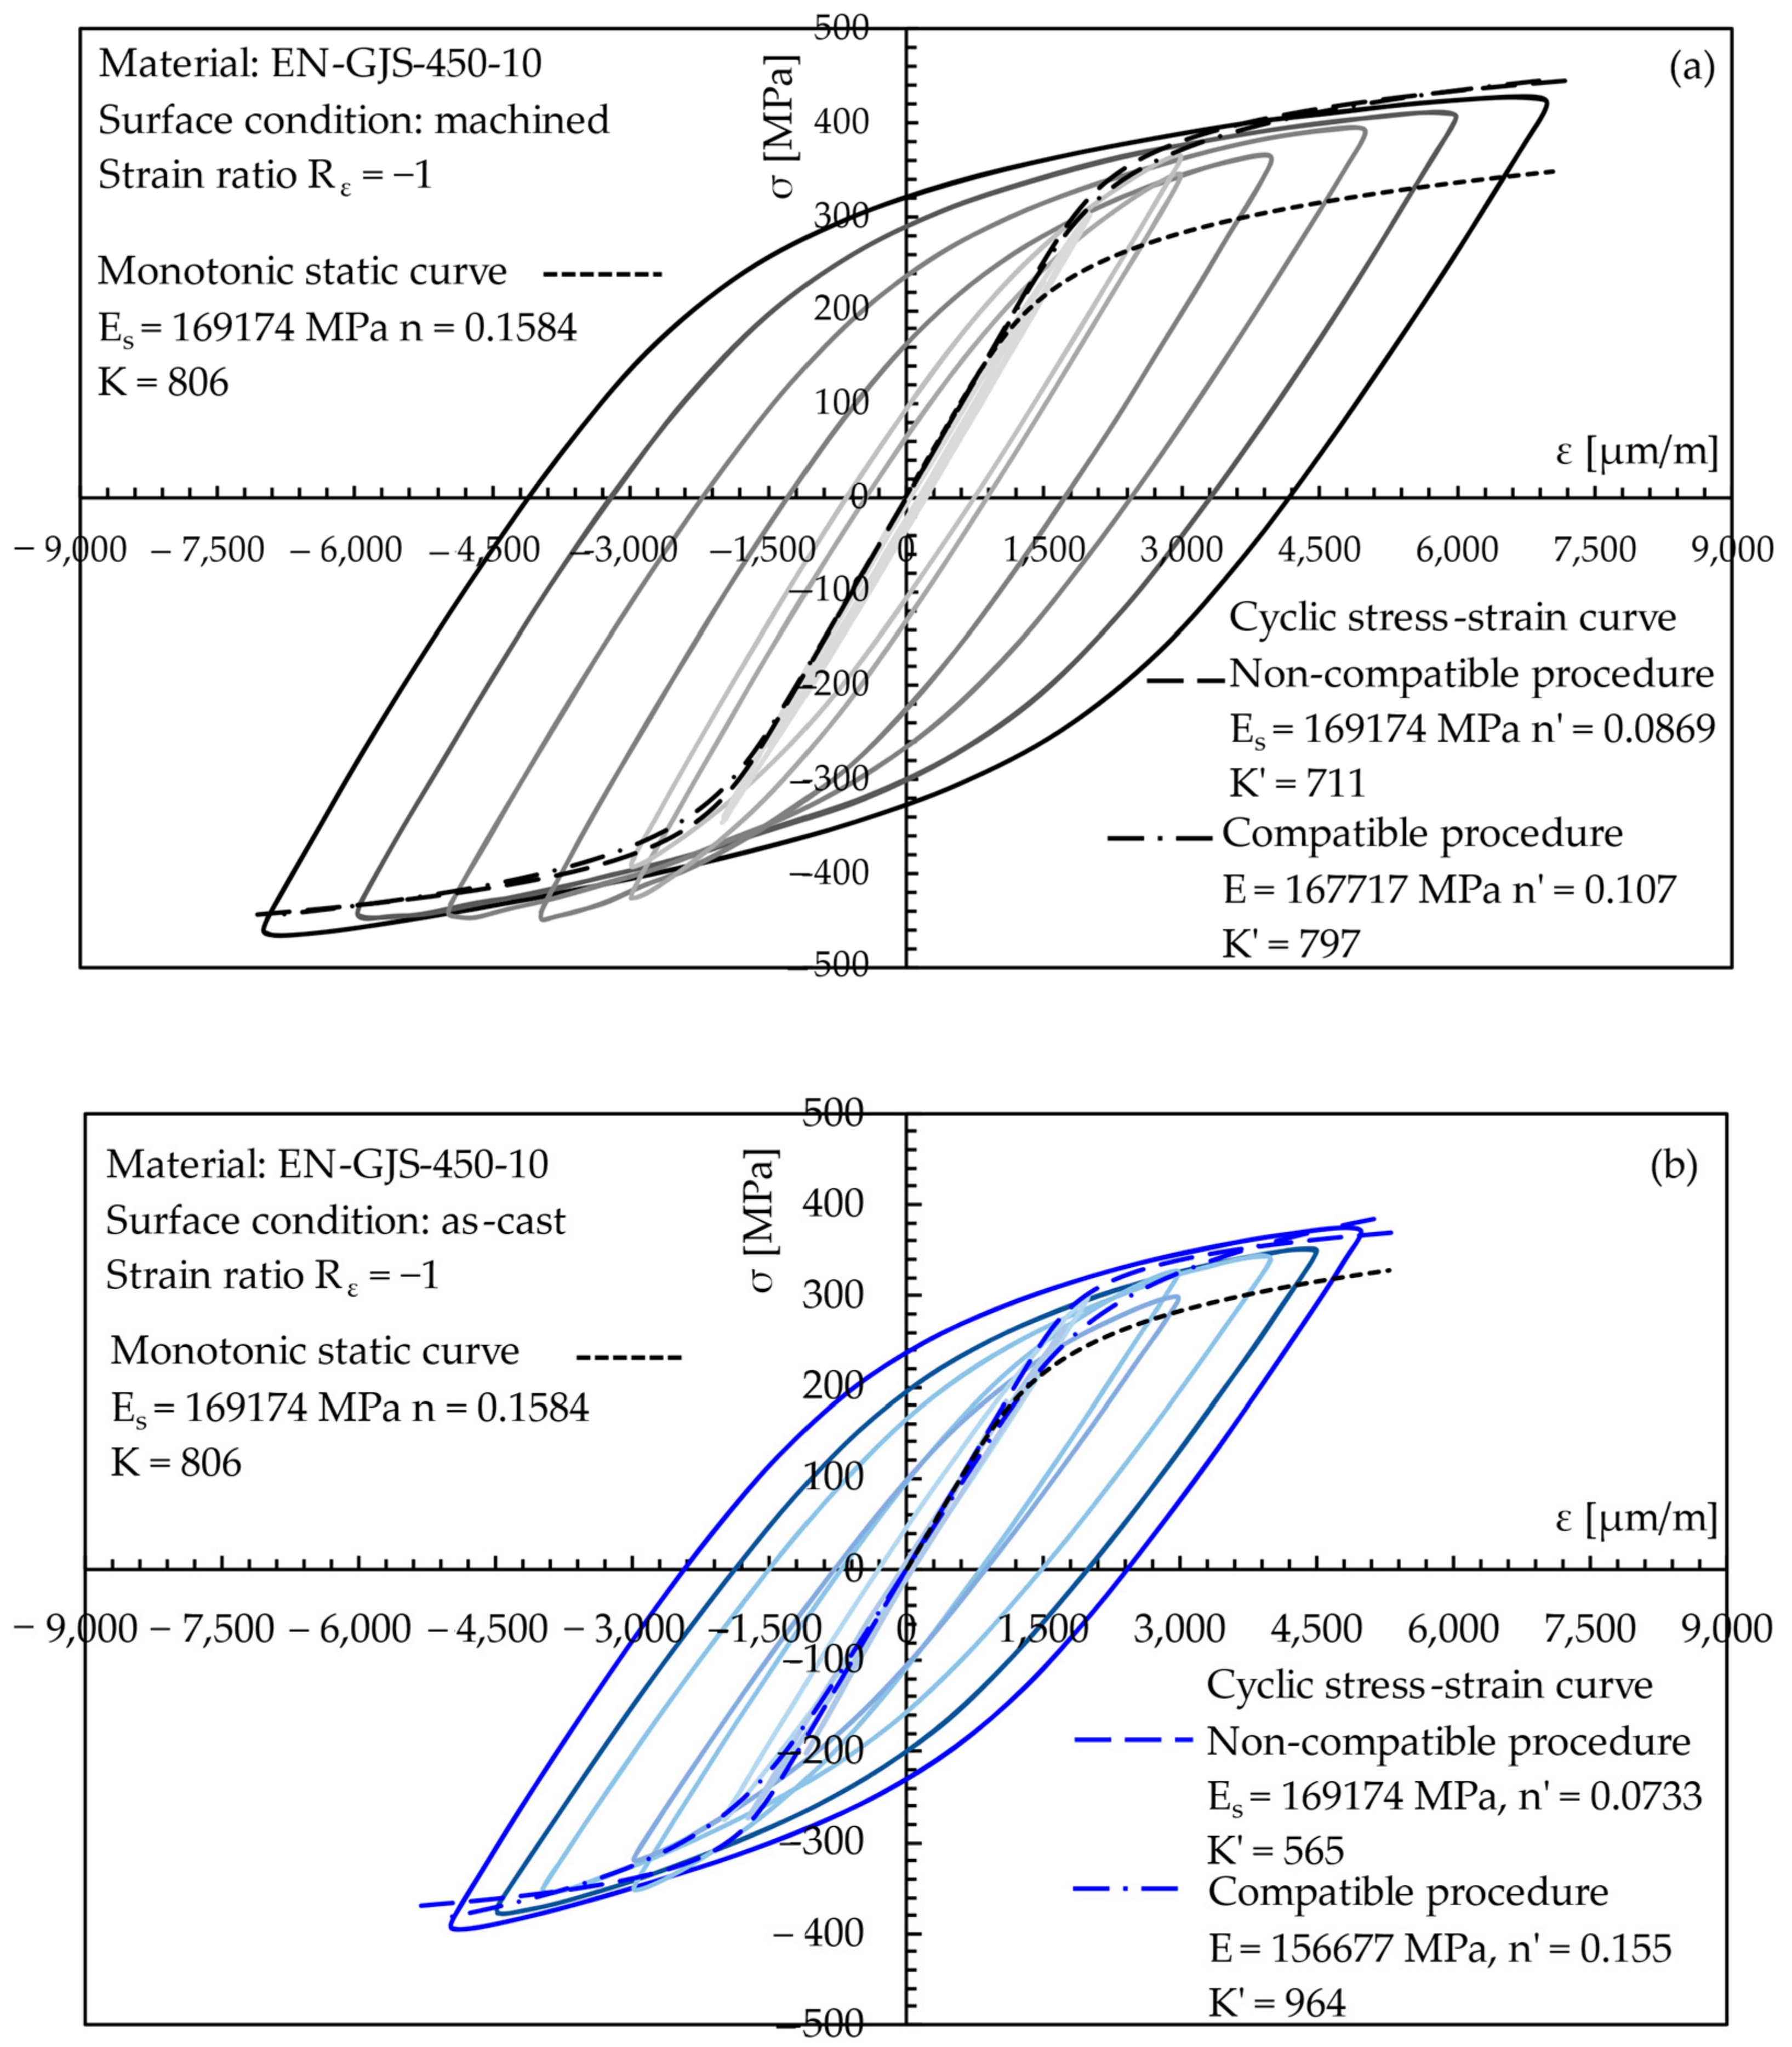
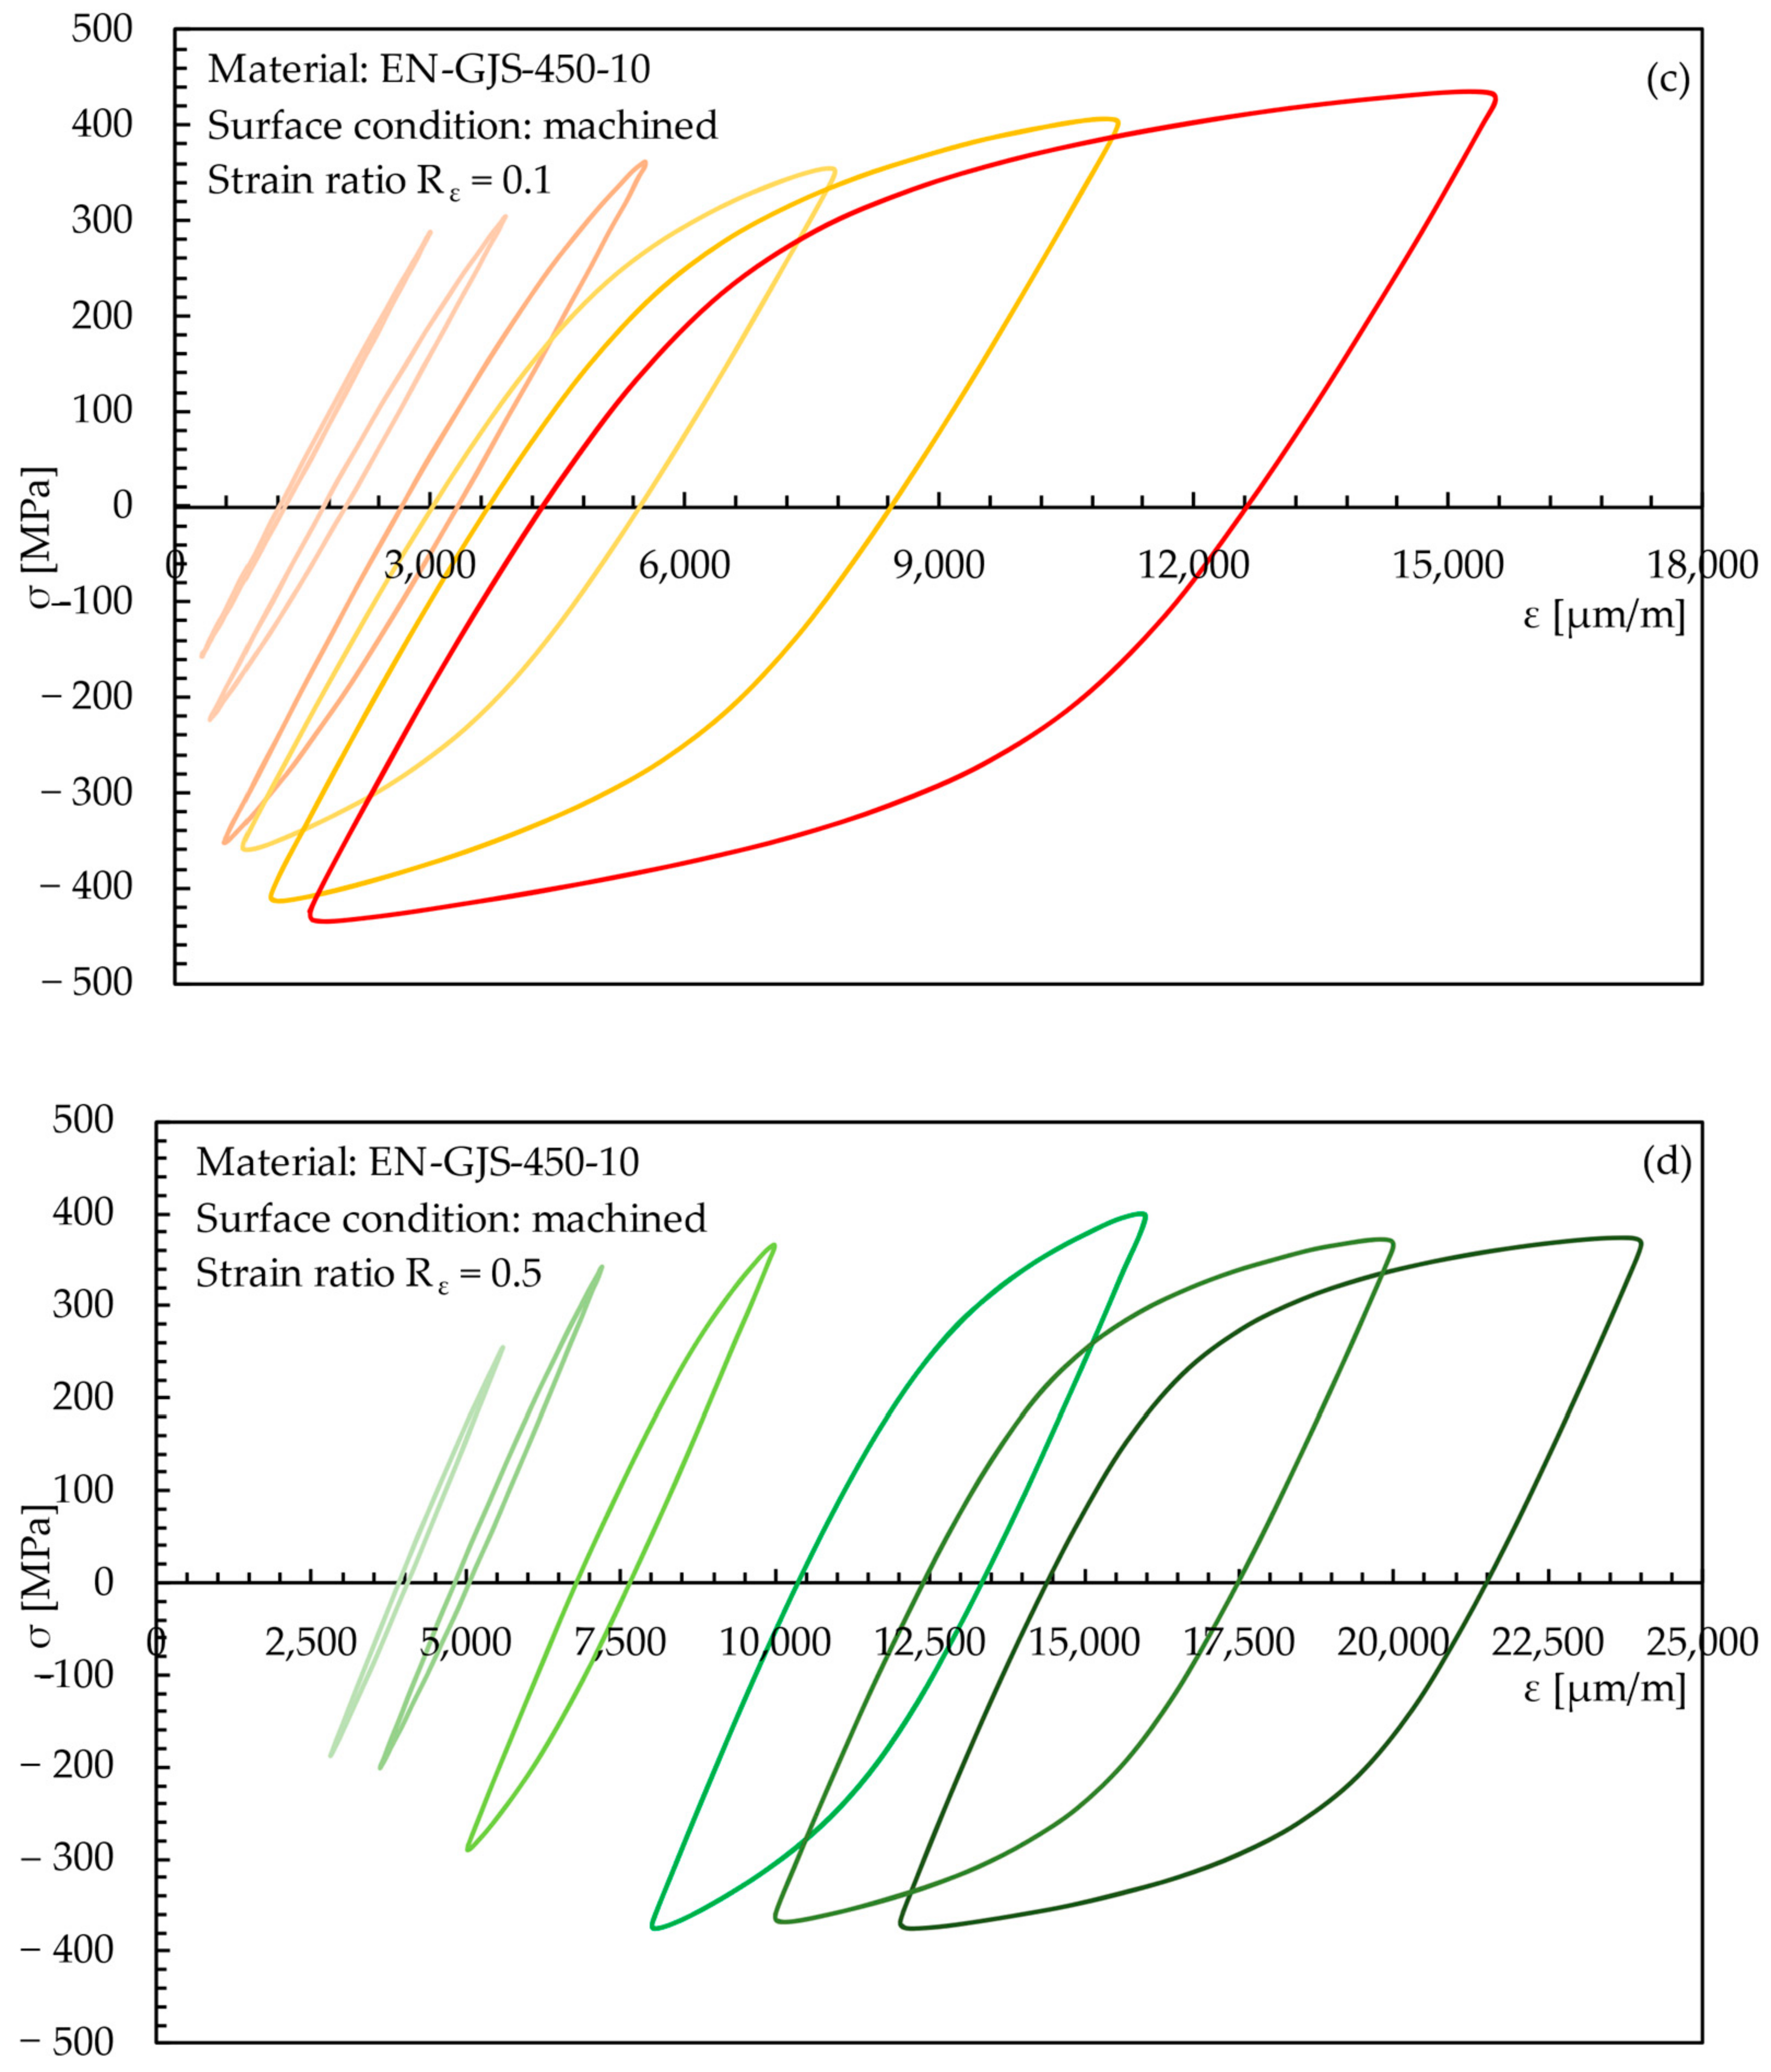
Before fitting the experimental results to derive the material parameters to be input in Equations (3) and (4), the stress-strain hysteresis loops have been analyzed. The tested EN-GJS-450-10 material does not show a stabilized stress-strain behavior during the applied cyclic deformations; therefore, the hysteresis loops recorded at half the fatigue life, reported in Figure 11, have been evaluated for each tested specimen. First, the elastic strain component has been derived by considering the tangent to the decreasing and increasing linear parts of the analyzed hysteresis loop [35,36], which exhibit almost identical slopes. After that, the plastic strain amplitude was evaluated as half the difference between the total and the elastic strain ranges (i.e., maximum minus minimum values), that is, εa,pl = (Δε-Δεel)/2. The plastic strain component has been evaluated only for specimens exhibiting plastic strains greater than a limit value ε0 [46,48], which has been set here to 0.01% (100 με, where 1 με = 10−6 m/m) based on the accuracy of the adopted experimental equipment. Finally, the stress range Δσ has been derived as the difference between the maximum stress and the minimum stress of the considered hysteresis loop, then the stress amplitude resulted in σa = Δσ/2. It should be noted that the hysteresis loops recorded at half fatigue life were characterized by a stress ratio Rσ (defined as the ratio between the minimum and the maximum measured stresses), which is different from the nominal strain ratio Rε. In particular, it ranged between −1.23 and −1.08 in Figure 11a (machined, Rε = −1), between −1.36 and −0.76 in Figure 11b (as-cast, Rε = −1), between −1.02 and −0.55 in Figure 11c (machined, Rε = 0.1), and between −1 and −0.59 in Figure 11d (machined, Rε = 0.5).
Having in hand the strain components εa,el and εa,pl, the stress amplitude σa, and the fatigue life 2Nf of each tested specimen, Equations (3) and (4) can be fitted to derive the unknown material parameters. To this aim, two different procedures have been adopted here, (i) a non-compatible one and (ii) a compatible one, depending on whether Equation (5) was strictly satisfied or not.
According to the non-compatible procedure, which is typically employed in practice, the two sets of material parameters appearing in Equations (3) and (4), respectively, are derived by fitting the relevant experimental results independently from the others, even if they have been generated by a unique series of experiments. As a consequence, the compatibility conditions (Equation (5)) are verified only approximately [26]. Moreover, the elastic modulus is assumed equal to that derived in static tensile tests (Es). Therefore, the equations to be fitted according to the standard procedure [49] are the following:
ε a , el = σ f E s 2 N f b ε a , pl = ε f 2 N f c     output   σ f ,   ε f , b , c ε a , pl = σ a K 1 n   output   n ,   K
On the other hand, the compatible procedure assures that the compatibility conditions (Equation (5)) are strictly verified. First, the elastic strain-life data, converted in a stress-based form according to Basquin [42], and the plastic strain-life data are fitted according to the standard procedure [49] to derive the material constants σ′f, ε′f, b, and c. After that, the compatibility equations (Equation (5)) are applied to determine the coefficients of the cyclic stress-strain curve. Finally, the dynamic modulus of elasticity E is derived by fitting the elastic strain-life data.
σ a = σ f 2 N f b   ε a , pl =   ε f 2 N f c     output   σ f ,   ε f , b , c   n = b c   K =   σ f   ε f b c   output   n ,   K ε a , el = σ f E 2 N f b   output   E  
The application of the compatible procedure and the derivation of the coefficients of the cyclic stress-strain curve (Equation (4)) have been performed here only for the cases relevant to a strain ratio Rε = −1. In such cases, the non-compatible (Equation (6)) and the compatible procedures (Equation (7)) provided similar results, so that the straight lines of Figure 10 derived on the basis of the two methods would be hardly distinguishable one from the other. Therefore, only the strain-life curves evaluated according to the non-compatible procedure have been reported in Figure 10; however, the material parameters obtained following both methods have been included in the same figure, where available.
Figure 11 reports the hysteresis loops recorded at half the fatigue life and the resulting cyclic stress-strain curve according to both the non-compatible (Equation (6)) and the compatible procedures (Equation (7)), where available. Figure 11a,b refers to the case Rε = −1 and include also the monotonic static curve previously derived in Figure 8; they show that the tested EN-GJS-450-10 material exhibited a hardening behavior. On the other hand, when a strain amplitude lower than 0.2% is applied at Rε = −1, nearly elastic strains are applied, and the material response is stable during the fatigue test.

3.4. Failure Location and Fracture Surface Analyses

The failure criterion adopted in both static and fatigue tests was the complete separation of the specimen. Three different failure locations have been observed: (A) within the gauge length, where the stress state is uniaxial and uniform; (B) at the end of the fillet radius, where a stress concentration factor Kt in the range between 1.07 (Figure 5) and 1.10 (Figure 6) exists; and (C) where the extensometer knife edges were in contact with the specimen surface. Figure 12 shows these failure locations, while Table 6 summarizes the number of failures of each type observed during static and fatigue tests. It is worth noting that only experimental fatigue results generated from specimens exhibiting failure of type (A) (Figure 12 and Table 6) have been adopted to fit the parameters of Equations (3) and (4). Nevertheless, experimental results generated from specimens exhibiting failure of type (B) and (C) have been included in the plots εa versus 2Nf of Figure 10, for comparison purposes.
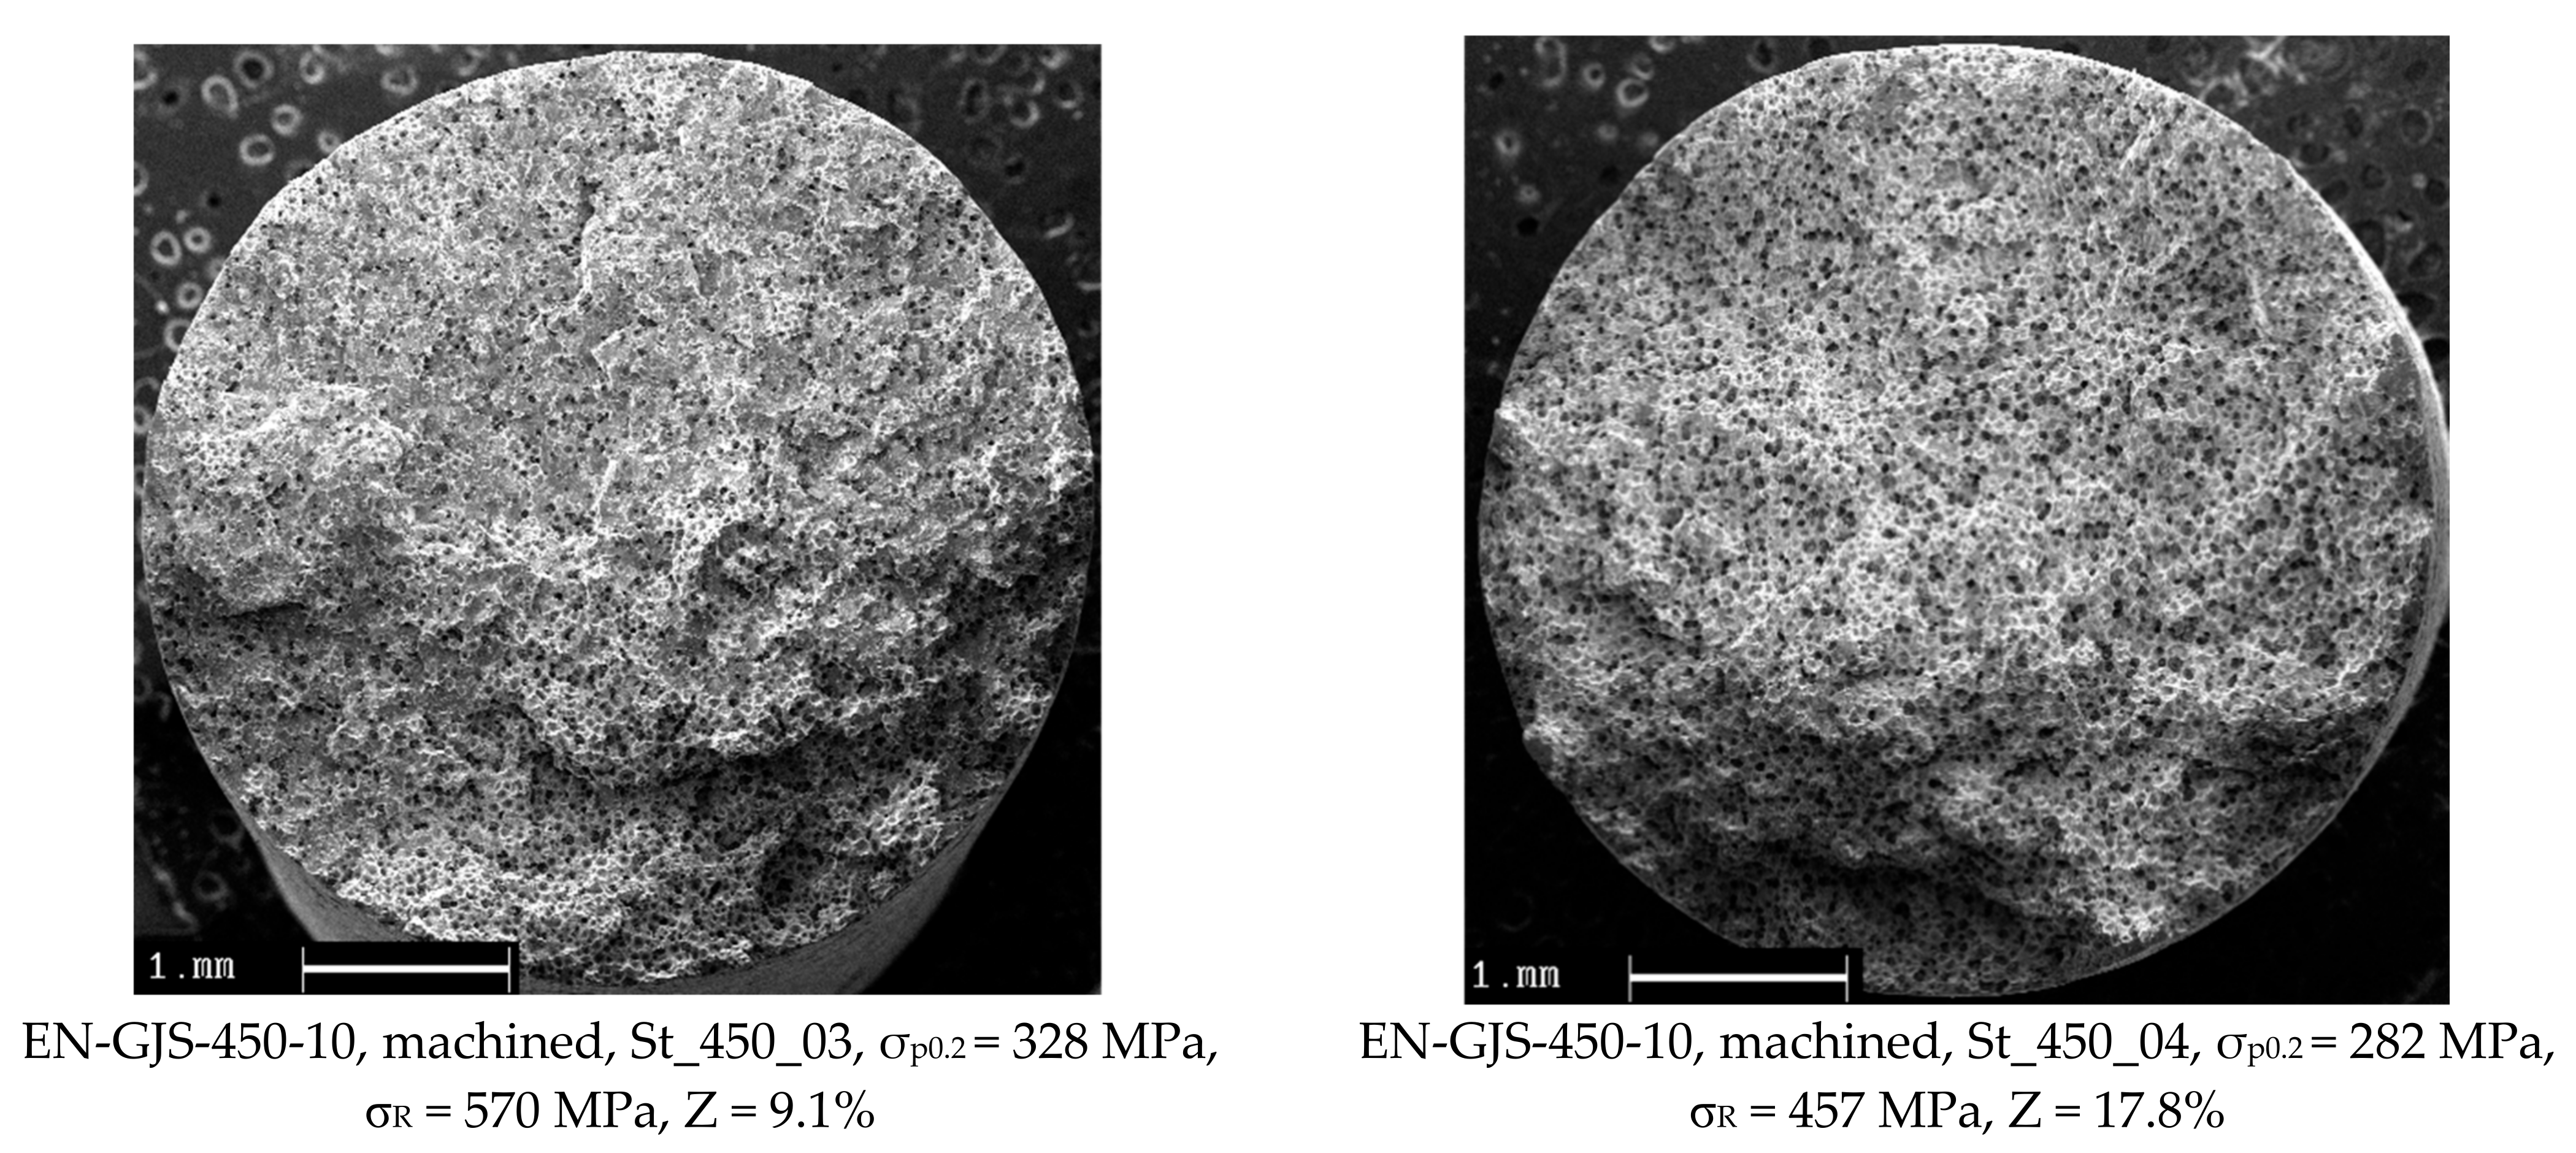
Figure 13 reports some examples of fracture surfaces generated by static testing plain cylindrical specimens (Figure 4). It can be observed that EN-GJS-450-10 specimens exhibited an almost flat fracture surface both for specimen St_450_03 and St_450_04, the last one having provided a stress-strain curve different from the others, as already discussed in Section 3.2.
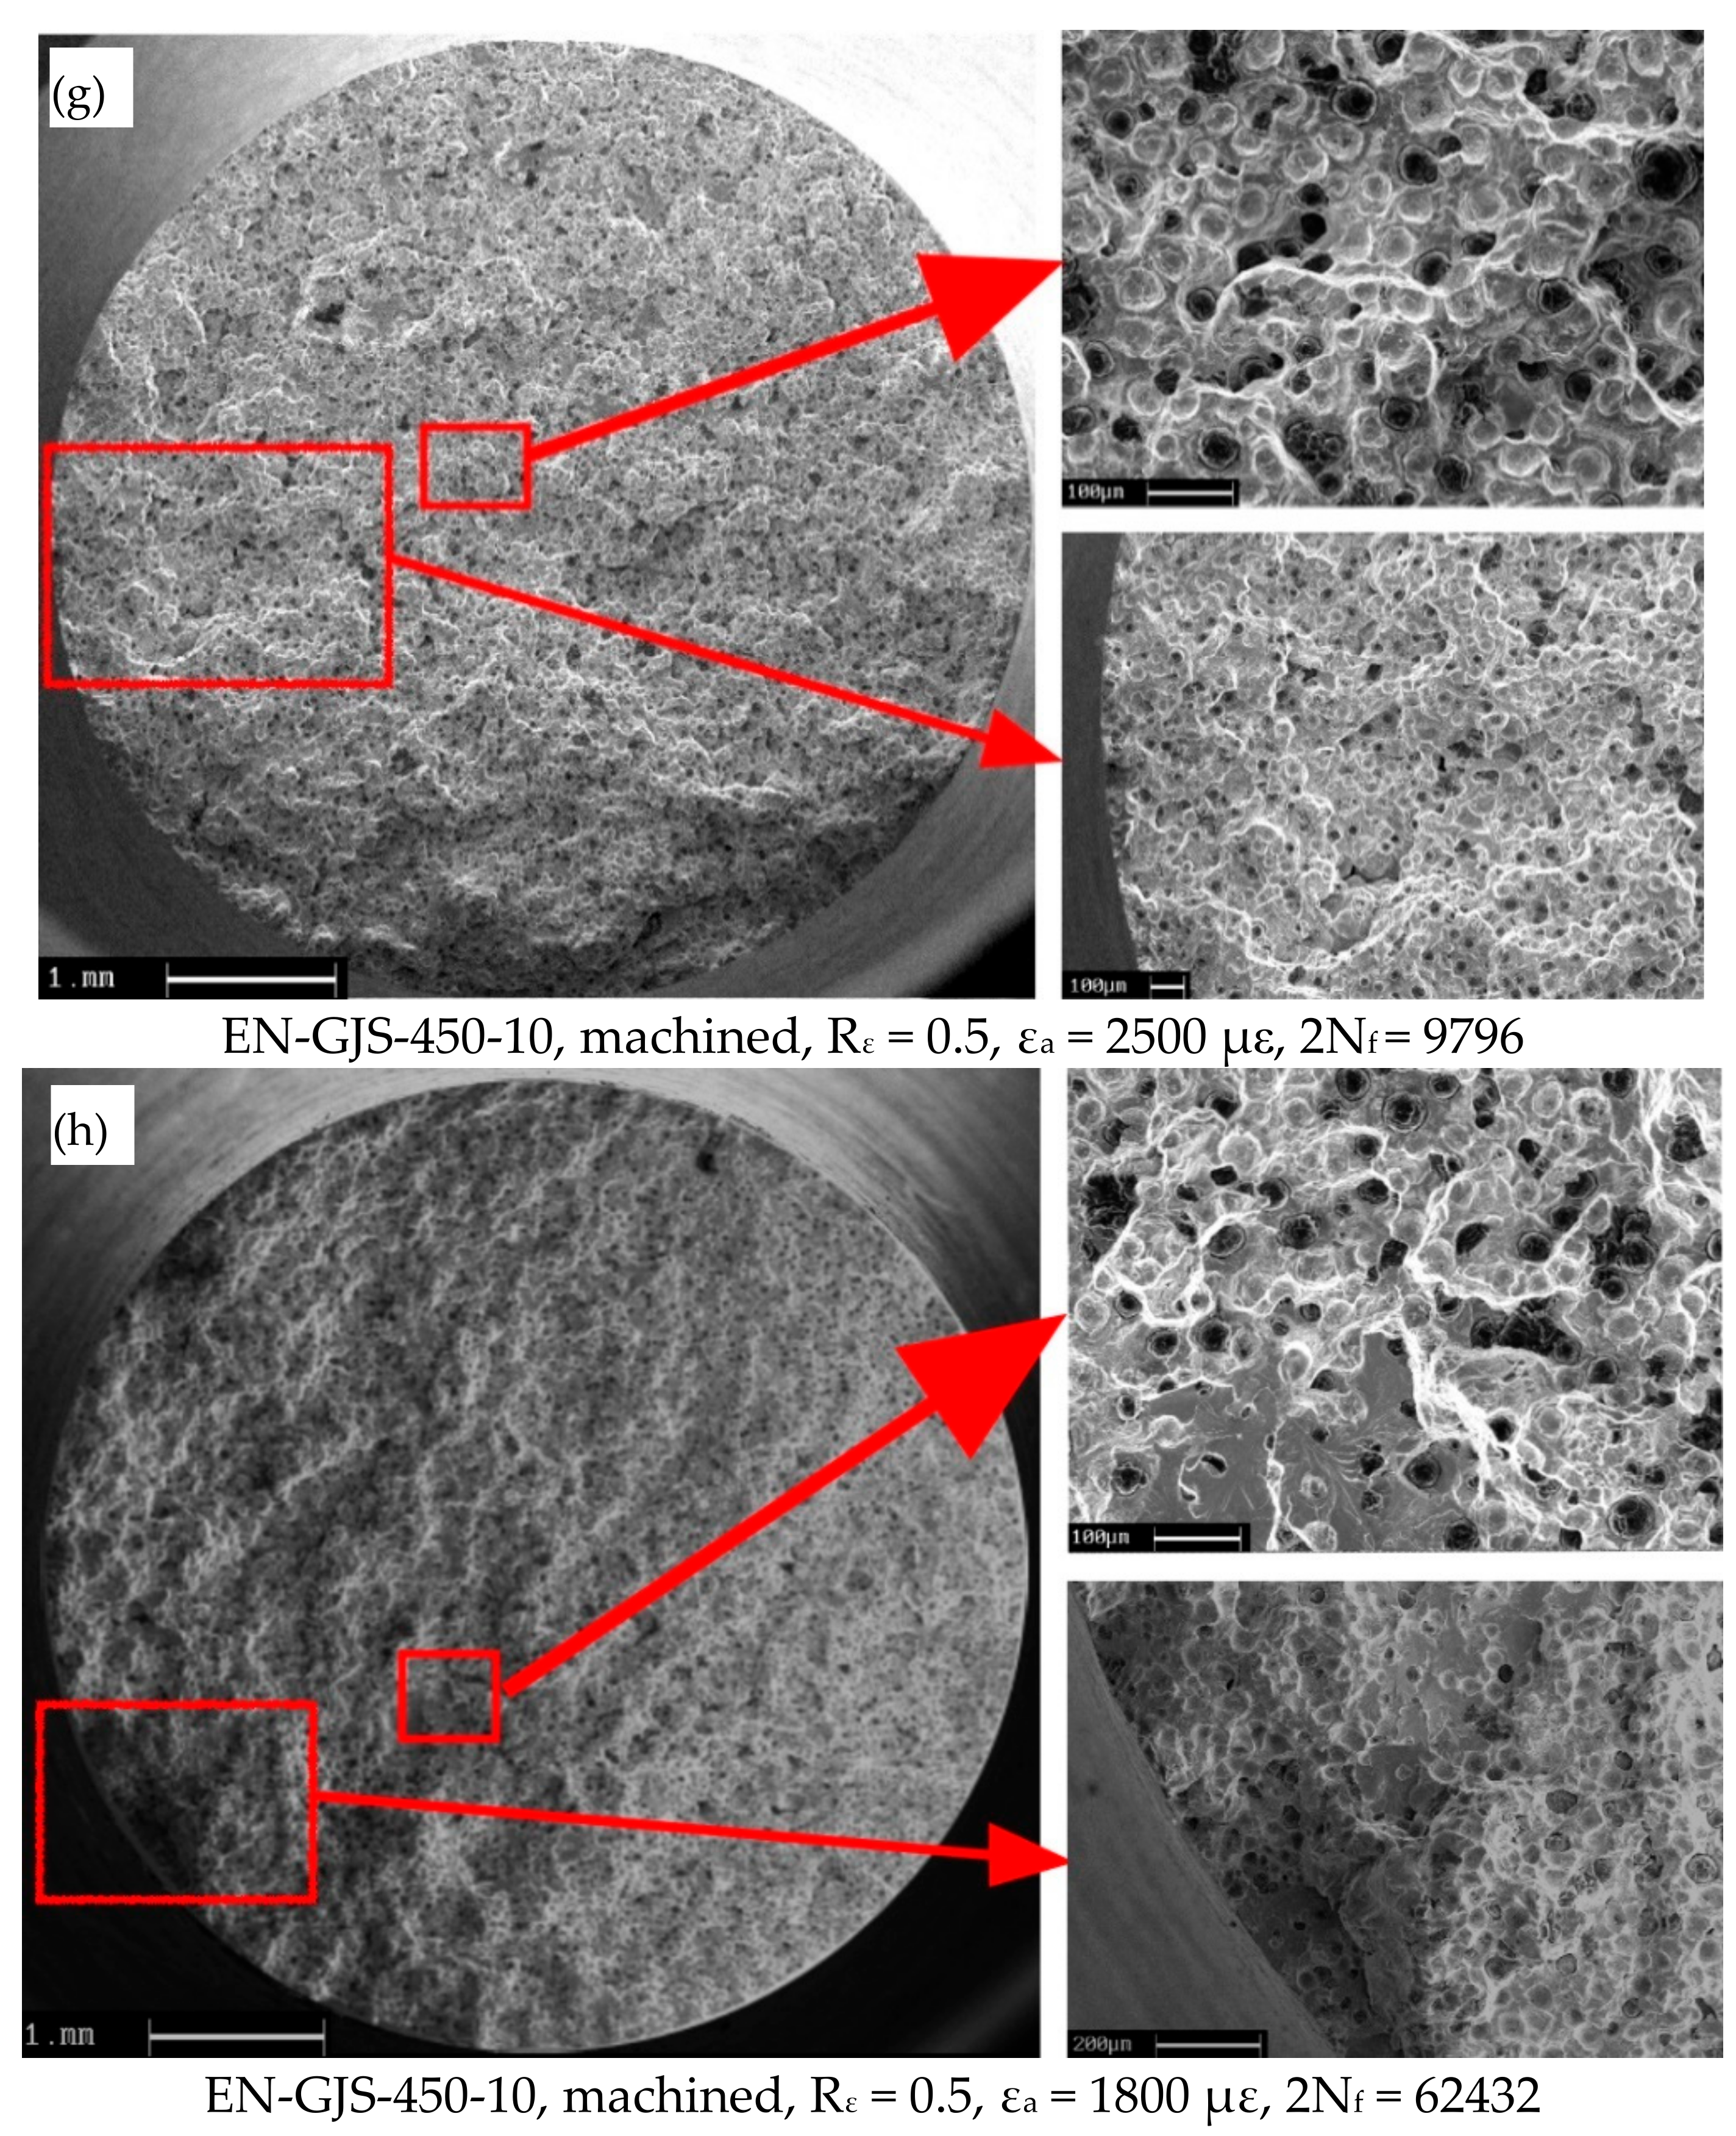
Figure 14 reports some typical fracture surfaces of plain cylindrical (Figure 5) and plain flat (Figure 6) specimens made of EN-GJS-450-10 subjected to strain-controlled fatigue tests. In more detail, the figure reports two examples of fracture surfaces for each test series: one referred to a high strain amplitude, and the other to a medium-low strain amplitude.
It can be observed that machined specimens (Figure 14a,b,e–h) exhibited crack initiation from the surface, while no evident defects have been observed.
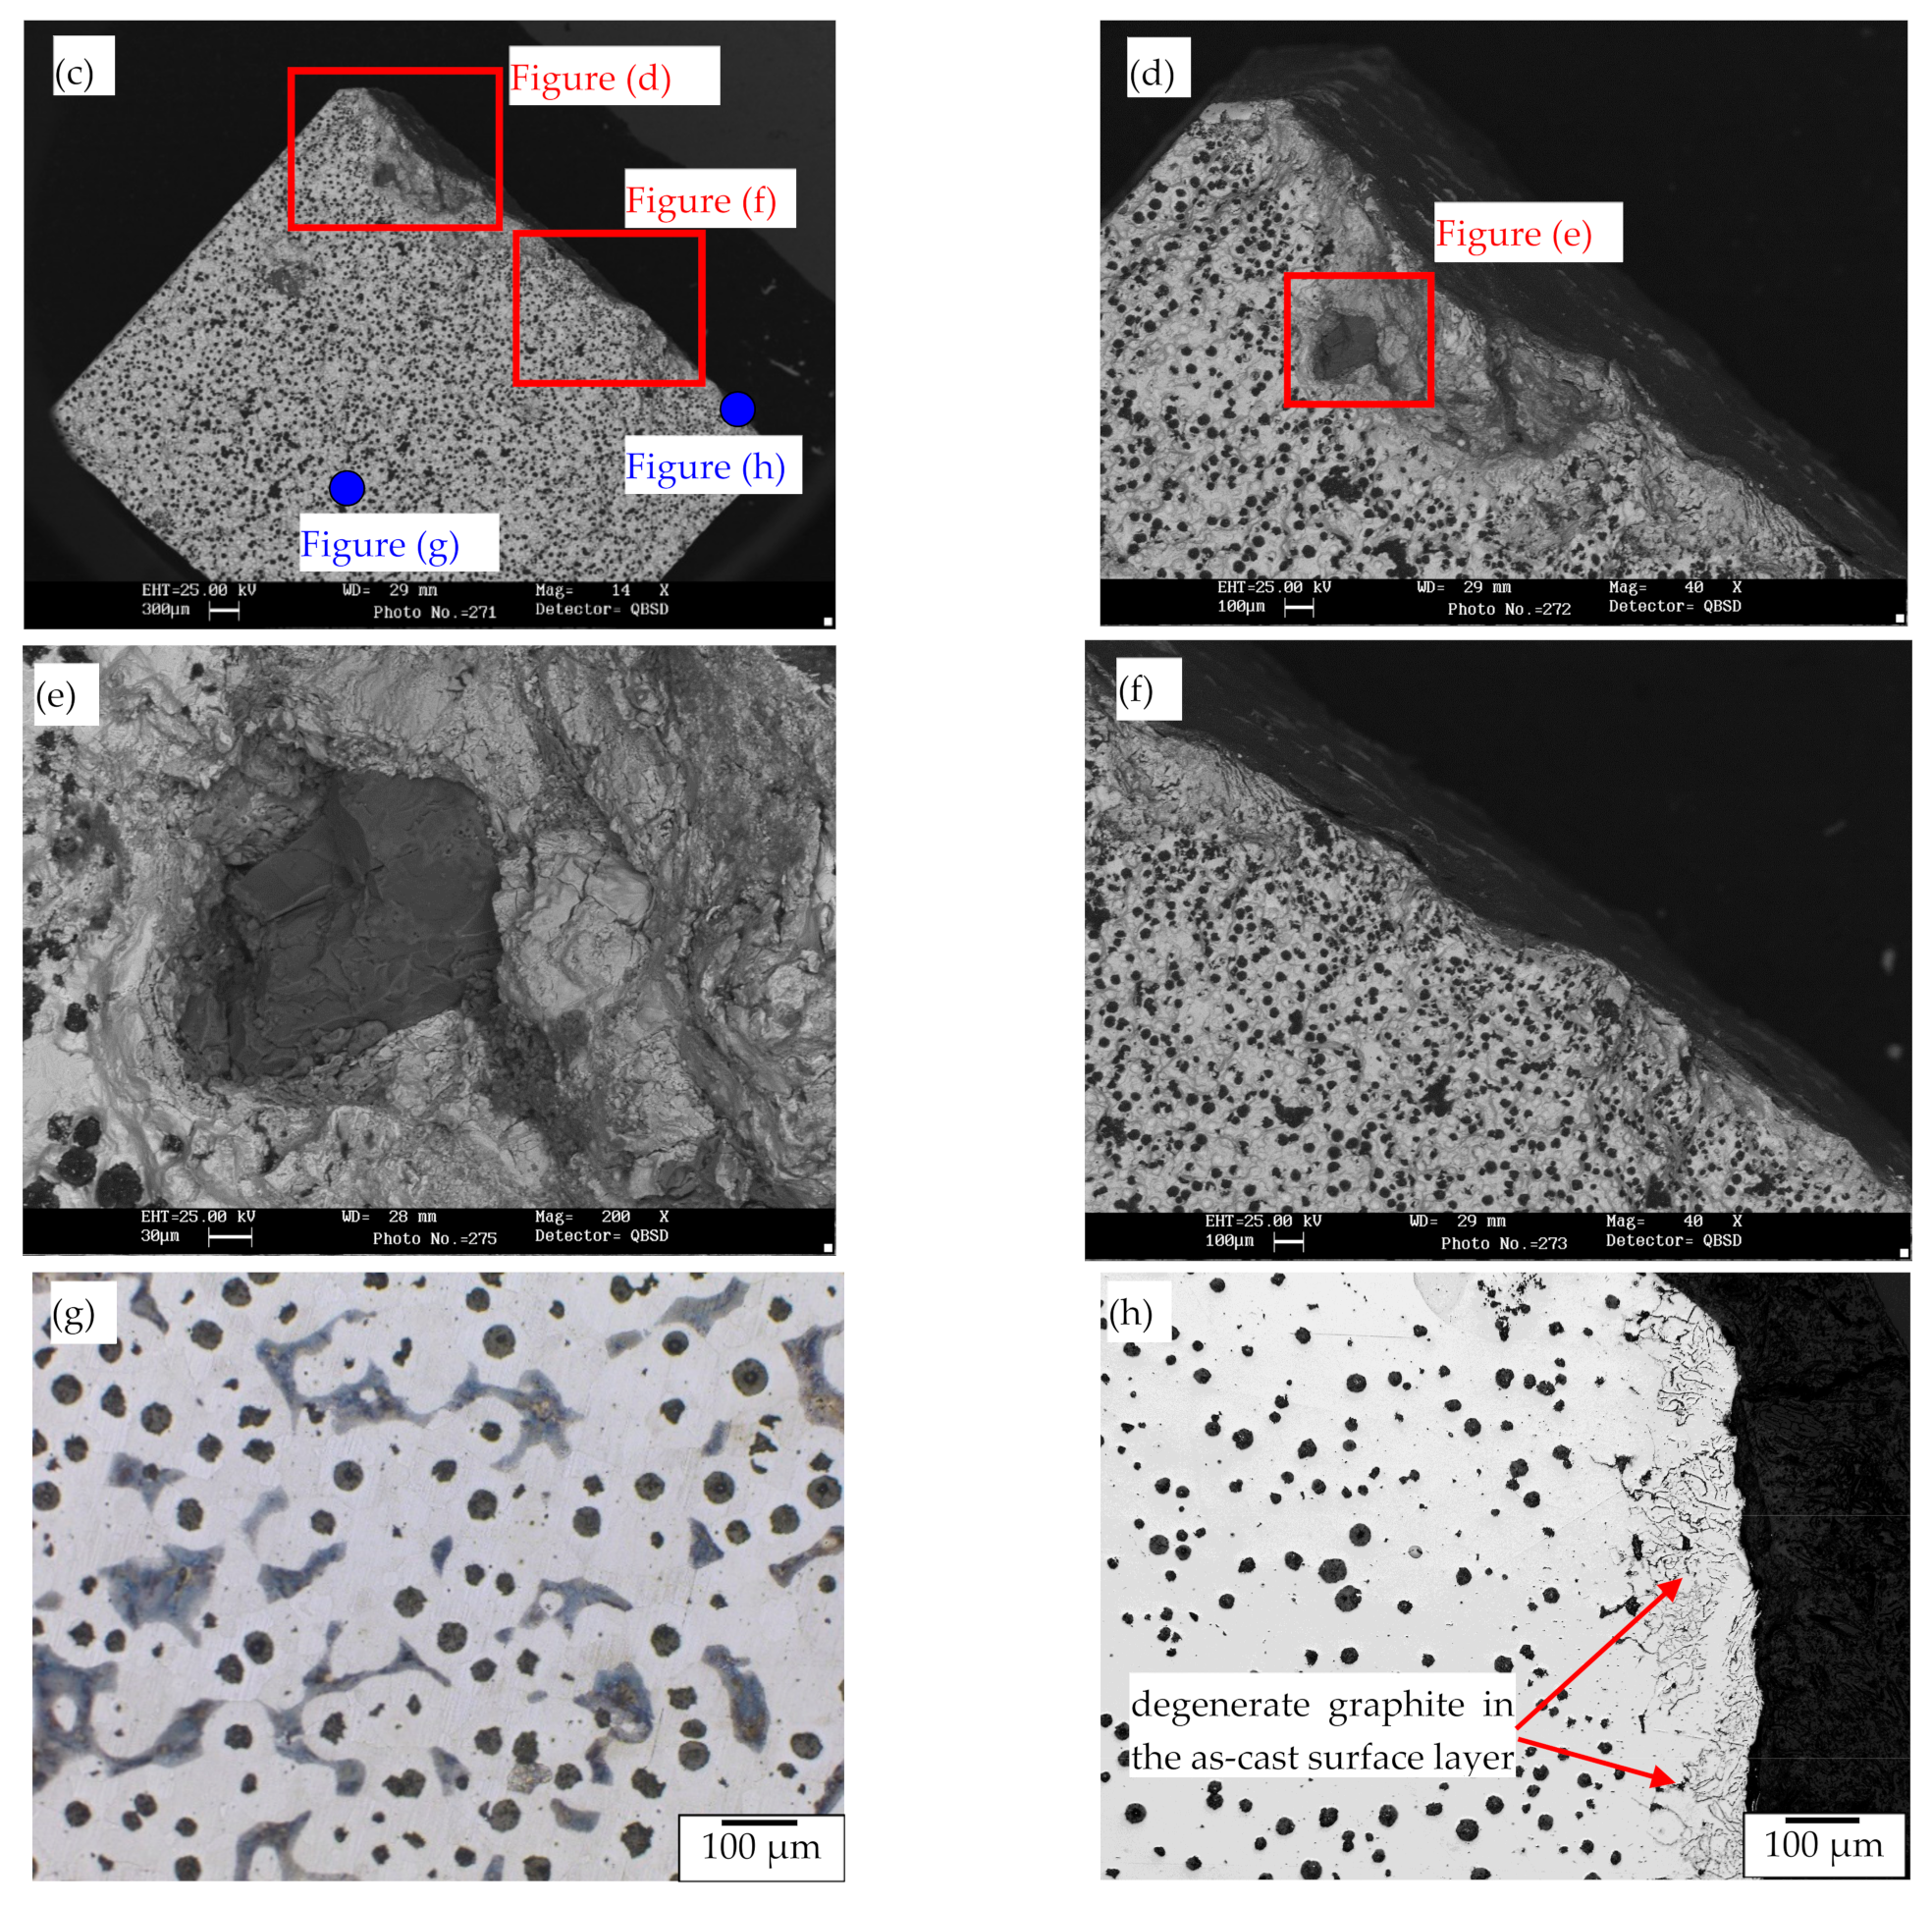
Dealing with specimens tested with an as-cast surface, crack initiation occurred in most cases from the as-cast surface (Figure 14c), but in a few cases, crack initiation was observed also from one of the machined surfaces (Figure 14d). Moreover, some samples failed prematurely as compared to the average trend; see, for example, the experimental result represented with filled marker in Figure 10b. Its fracture surfaces are reported in Figure 15a,b, which show that a defect was present close to the as-cast surface. To investigate in more detail the type of defect, an SEM analysis of the fracture surface has been performed. Figure 15c–e show that the defect was an inclusion formed by a silicon oxide, as demonstrated by EDS analysis shown in Figure 16a, while Figure 16b reports the EDS analysis of the material region close to the defect and shows that other elements such as oxygen, silicon, magnesium, and iron were detected. Therefore, the defect appears as a slag inclusion resulting from the casting process. Moreover, Figure 15g,h report the microstructures observed by optical microscope at the center of the sample and at the as-cast surface, respectively, and show that degenerate graphite is present in a 0.1 mm layer close to the as-cast surface, due to the rapid cooling process.
Finally, the crack propagation phase is distinguishable only in cases of medium-low strain amplitudes (Figure 14b,d,f,h), while it is almost invisible in the cases of high strain amplitudes (Figure 14a,c,e,g).

4. Discussion

It has been observed in Section 3.3 by comparing Figure 10a,b that as-cast specimens have exhibited a lower fatigue life as compared to machined specimens when subjected to strain-controlled fatigue tests under the same strain amplitude at a strain ratio Rε = −1. This is due to a twofold effect of:
  • the higher roughness of as-cast surface as compared to the machined one;
  • the presence of defects underneath the as-cast surface.
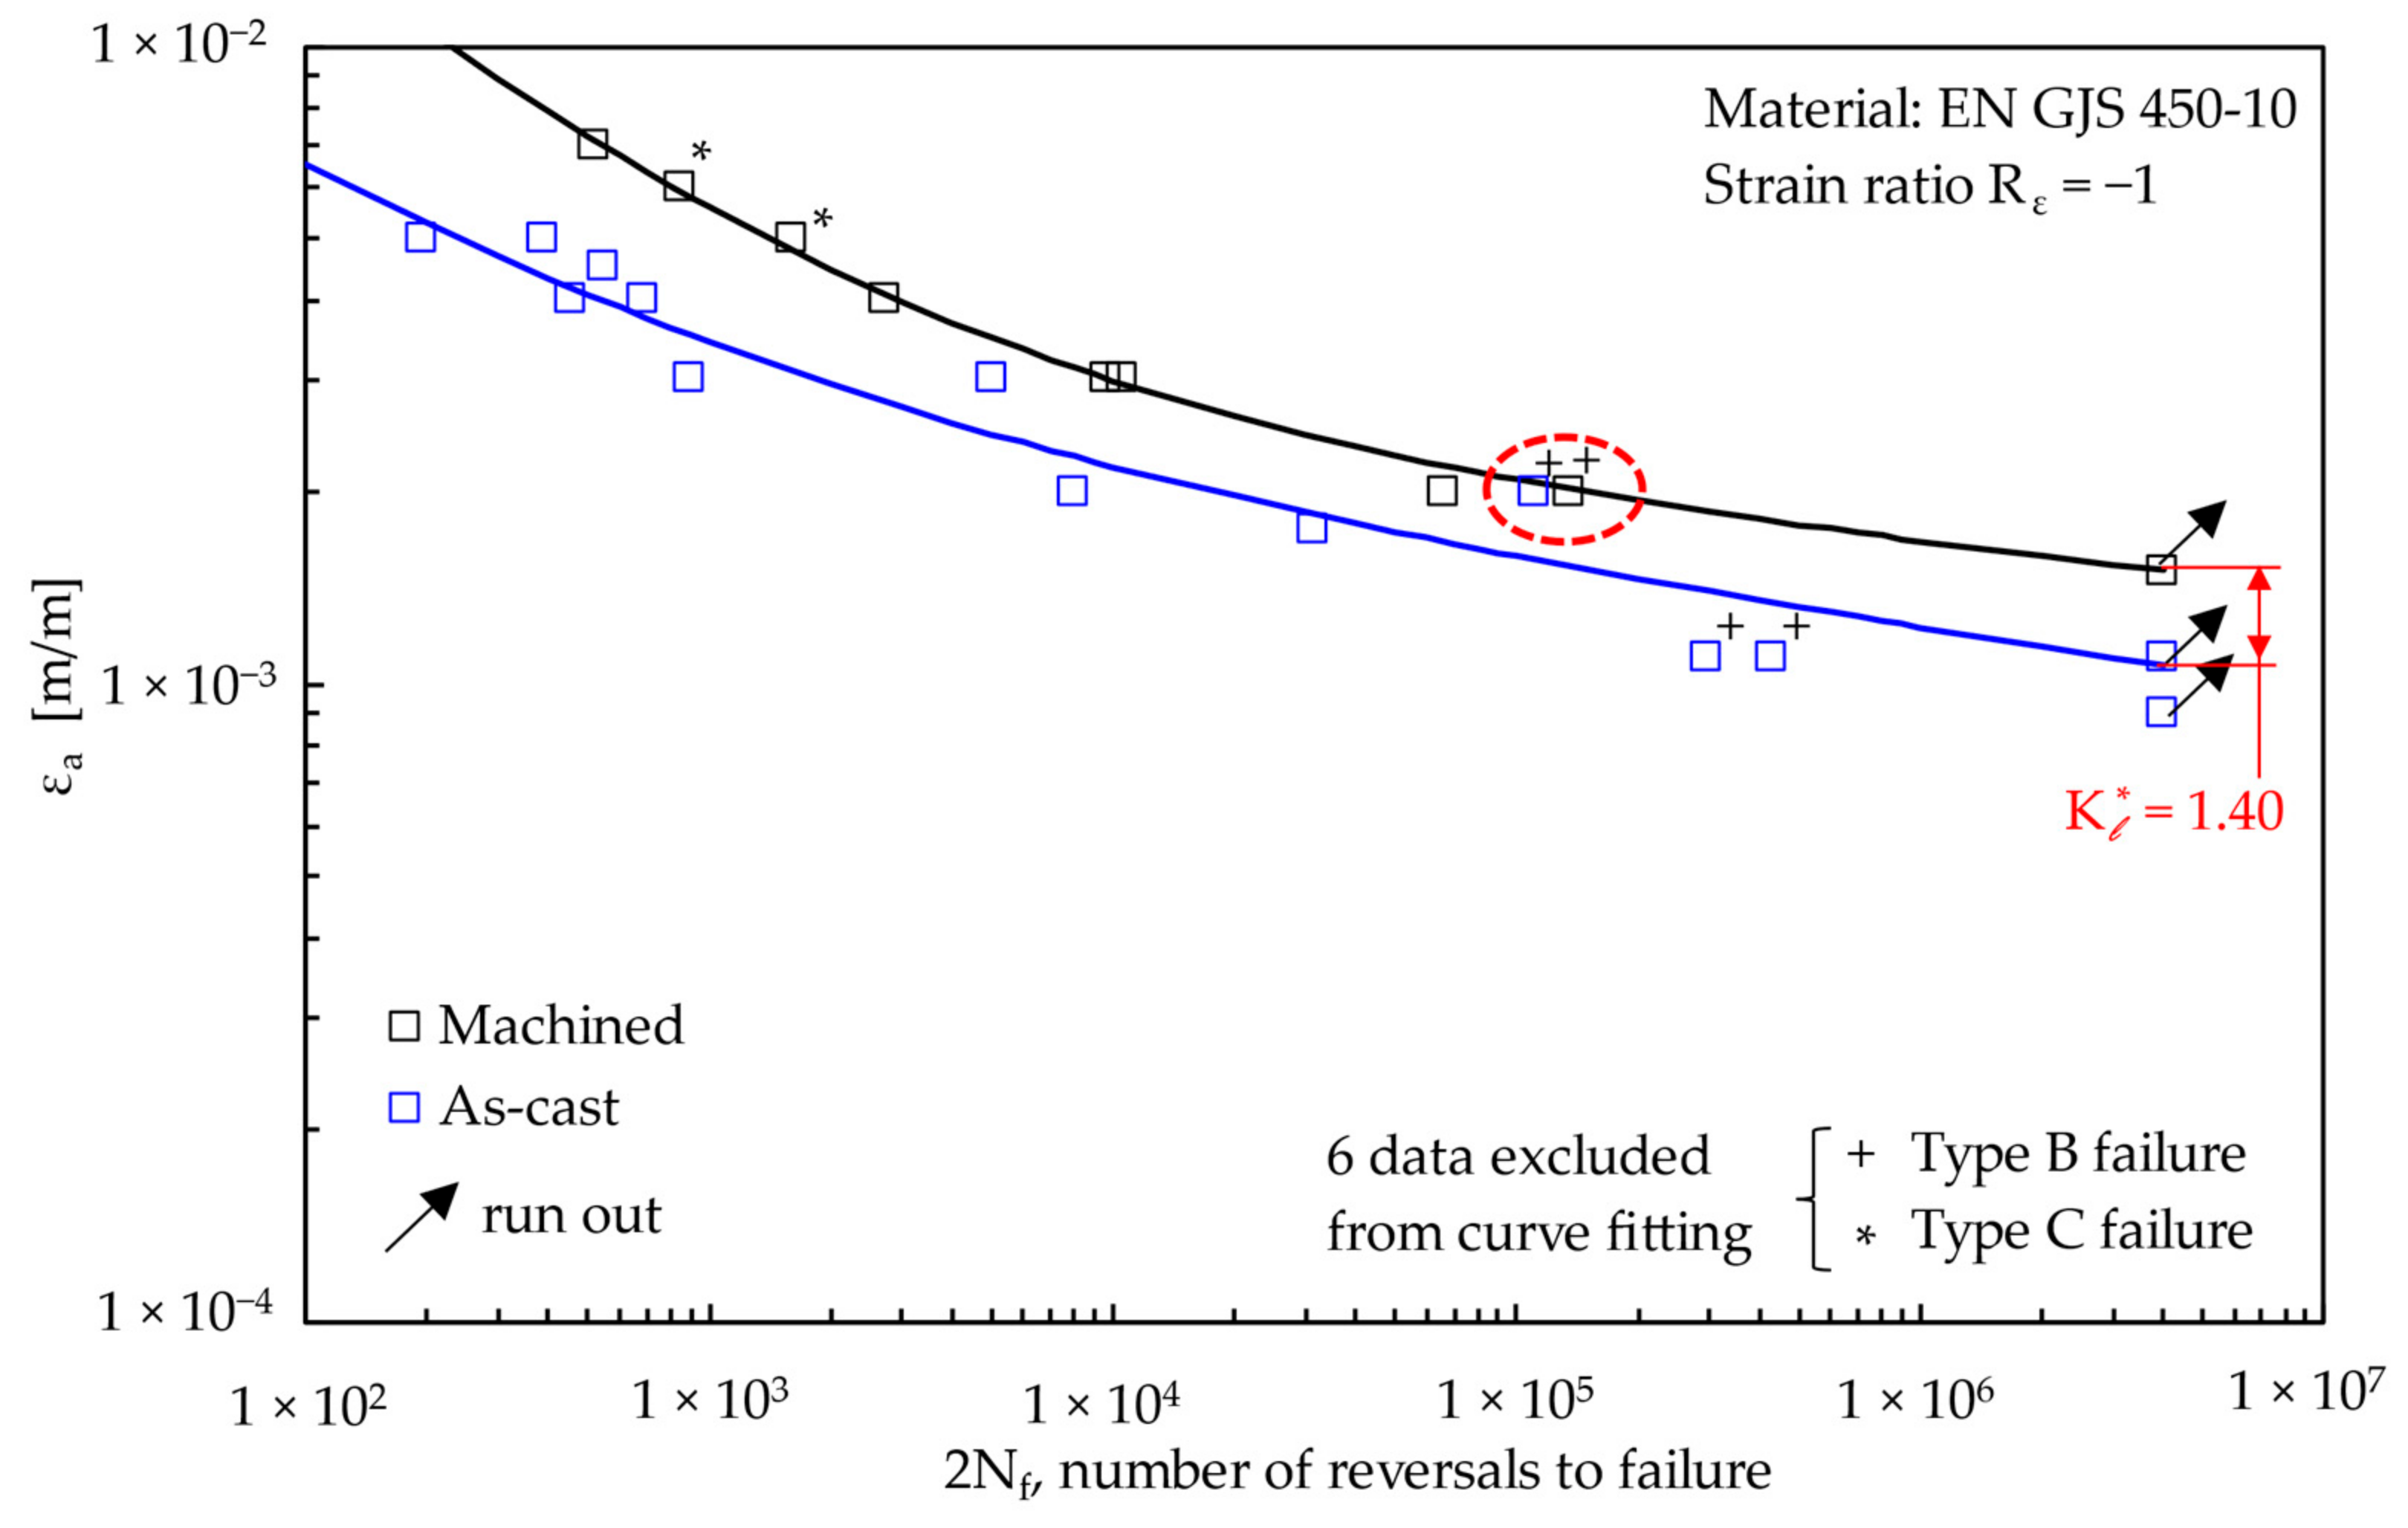
Therefore, in the present work, the casting skin is defined as the rim zone of the casting, consisting of both surface roughness and a deviating microstructure, which includes both degenerated graphite layer (DGL) with lamellar graphite (Figure 15h) and slag inclusions (see for example Figure 15c–e). The high-cycle downgrading effect of the casting skin at a strain ratio Rε = −1 can be quantified by introducing a reduction coefficient Kl*, which has been defined at 2 million cycles (i.e., 2Nf = 4∙106 reversals) to failure, according to the following expression:
K l * = ε a , R ε = 1 , 2 N f = 4 · 10 6 , machined ε a , R ε = 1 , 2 N f = 4 · 10 6 , as cast
Figure 17 compares the Manson–Coffin curves of specimens made of EN-GJS-450-10 and tested under Rε = −1 in the machined and as-cast conditions and shows that the coefficient Kl* is equal to 1.40. In addition, a red circle in Figure 17 highlights that an as-cast sample has almost the same fatigue life of a machined one lying close to the relevant fatigue curve, both samples having been tested at εa = 2000 με. However, it should be noted that the as-cast sample failed from one of the machined surfaces, as documented in Figure 14d, which precisely shows the fracture surface of the considered sample. Therefore, the experimental results circled in red are not surprising, the fatigue crack initiating in both cases from a machined surface.
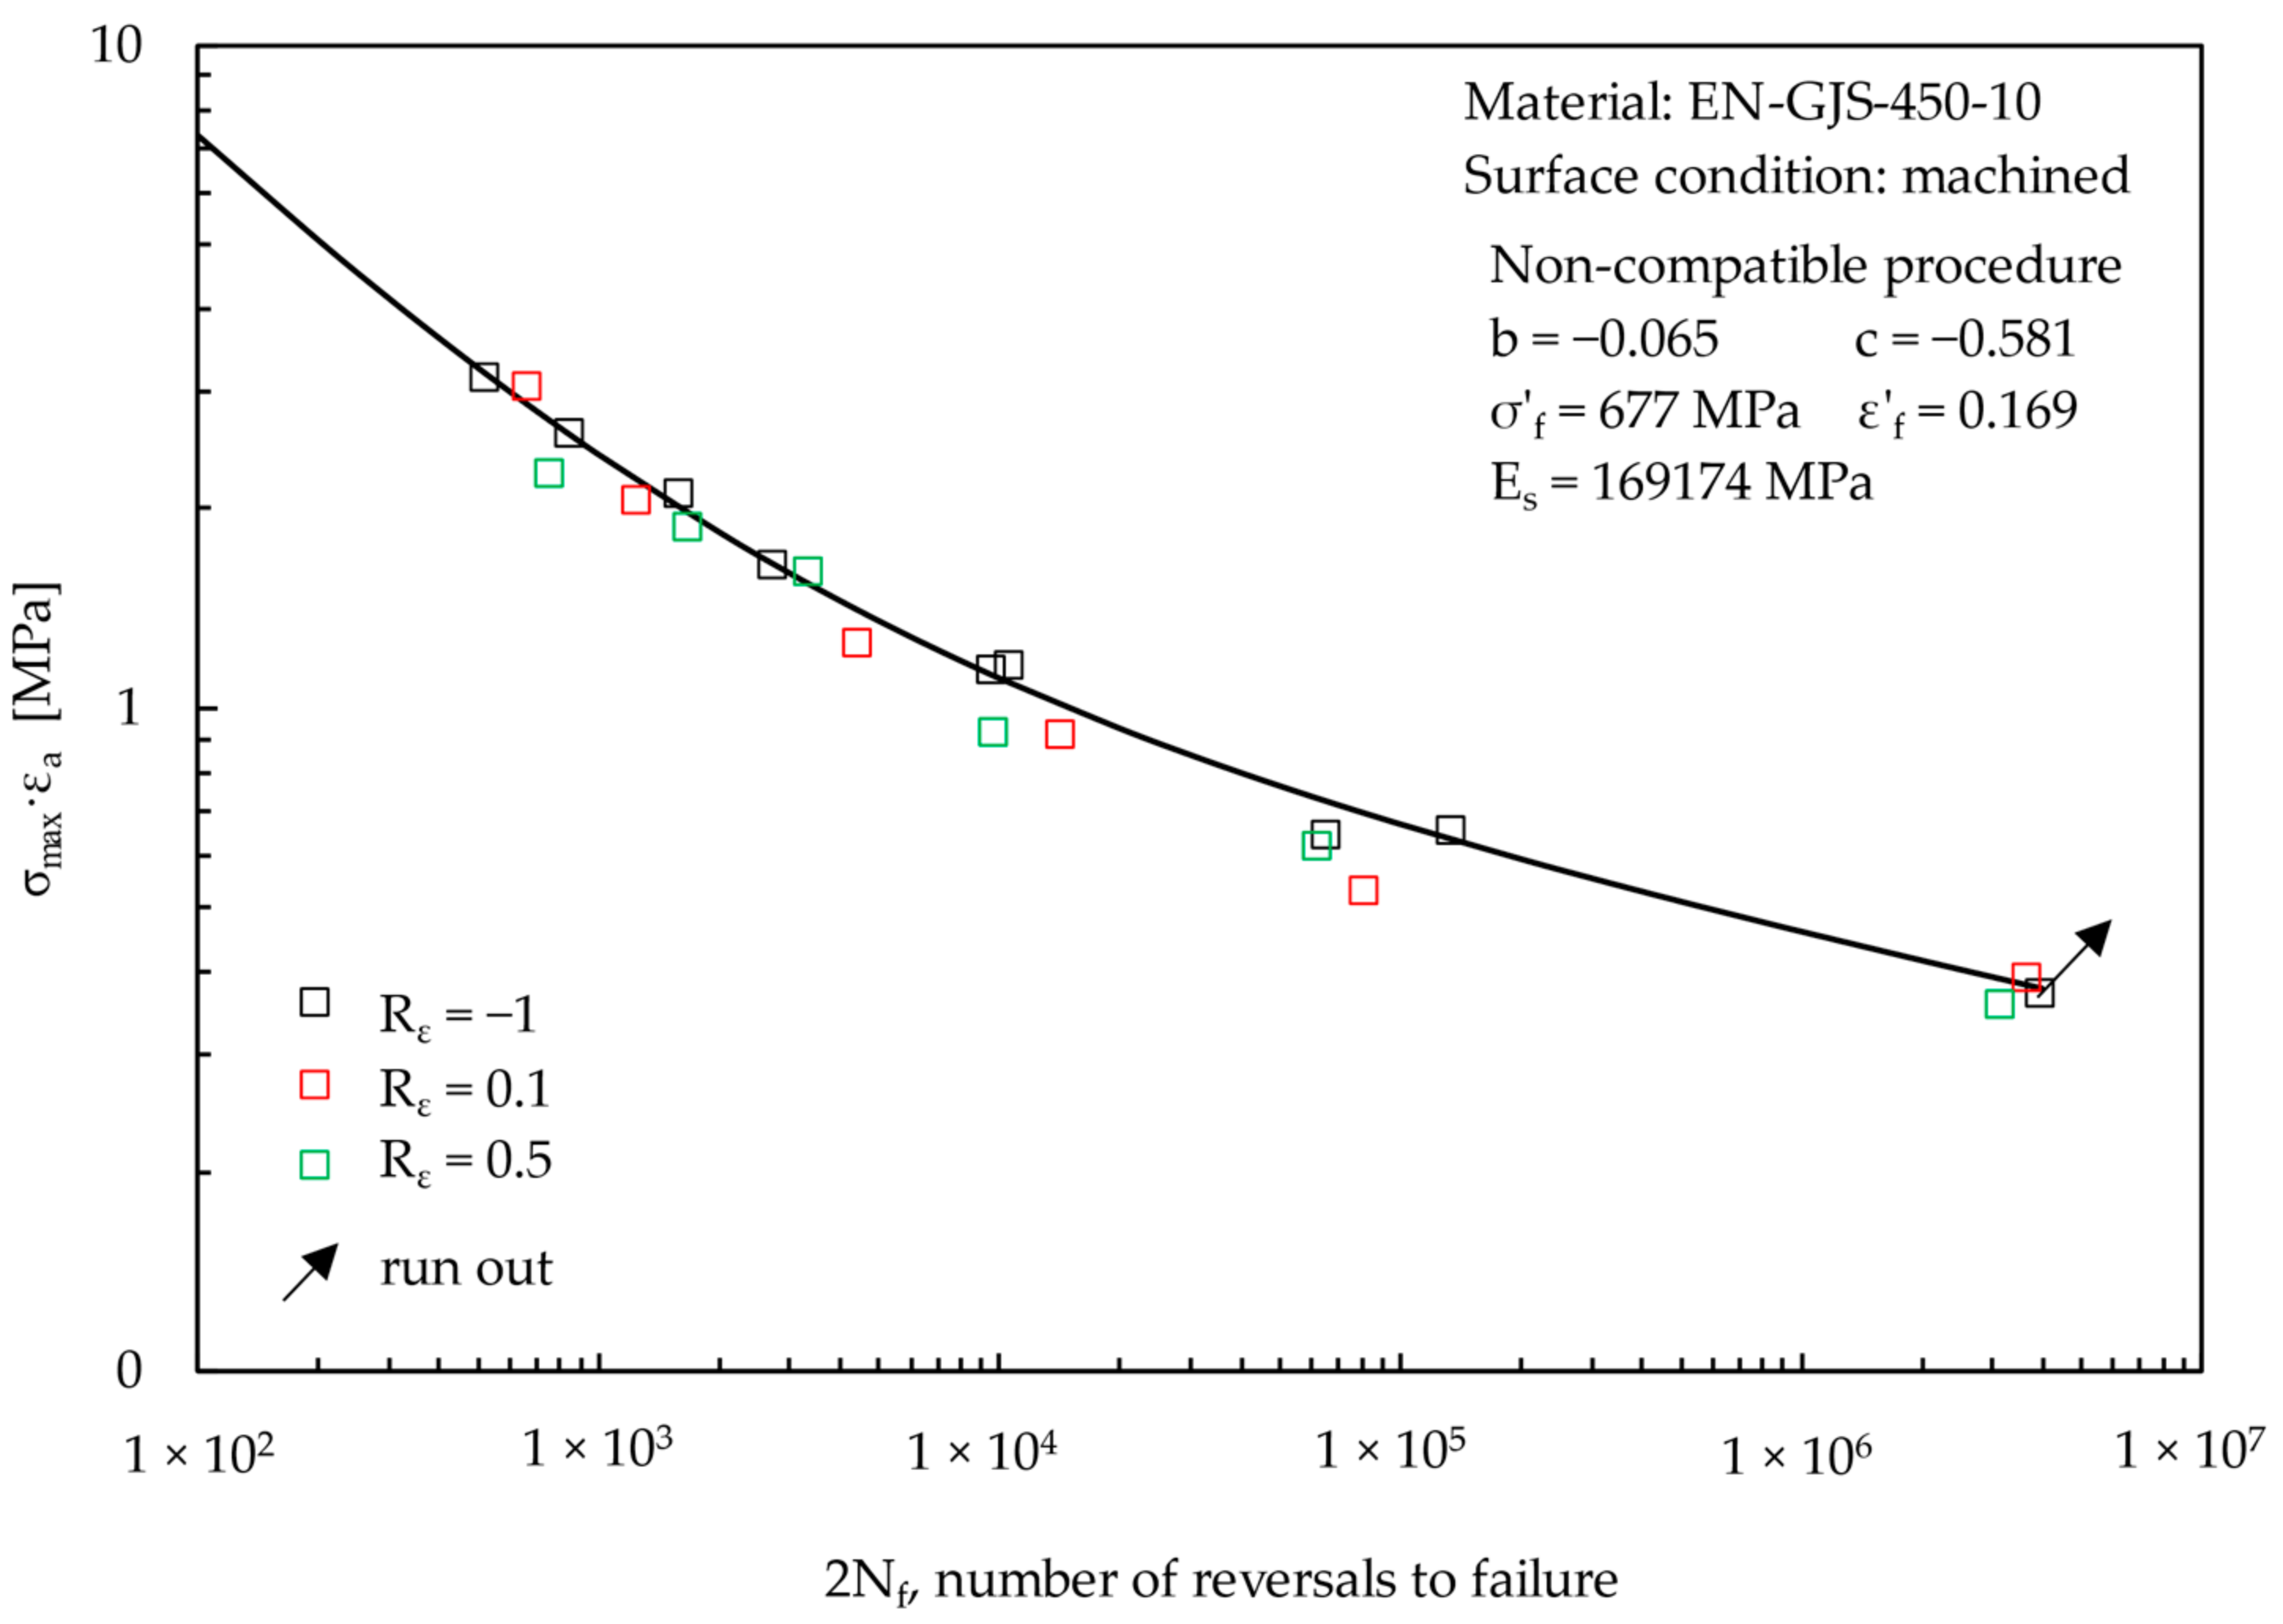
It has been shown in Section 3.3 that machined specimens made of EN-GJS-450-10 have been tested under strain-controlled fatigue loading by adopting different values of the strain ratio Rε, namely −1, 0.1, and 0.5. By comparing Figure 10a with Figure 10c,d, it can be observed that specimens subjected to a given strain amplitude exhibited a lower fatigue life when increasing the strain ratio Rε from −1 to 0.5. Such experimental data can be summarized by using the Smith–Watson–Topper (SWT) expression [50] (Equation (9)), which is able to account for different mean strains.
σ max ε a = σ f 2 E 2 N f 2 b + σ f ε f 2 N f b + c
In the previous expression, parameters σ′f, ε′f, b, and c are those referring to the strain ratio Rε = −1.
Figure 18 compares the experimental results of machined specimens generated under Rε = −1, 0.1, and 0.5, which have been expressed in terms of number of reversals to failure 2Nf as a function of the parameter σmax∙εa. The figure includes the curve σmax∙εa versus 2Nf (Equation (9)), where the adopted material parameters are those fitted by applying the “non-compatible procedure” only to experimental results relevant to Rε = −1 (see Figure 10a). It can be observed that this curve is also in fairly good agreement with experimental results relevant to Rε = 0.1 and 0.5. Accordingly, the SWT expression (Equation (9)) appears to be useful for design engineers to account for the strain ratio effect of EN-GJS-450-10 nodular cast iron under fatigue loading conditions.
Finally, the results reported in the present work appear useful for engineers engaged in the fatigue design of real off-highway axles made of EN-GJS-450-10. In more detail, the cyclic stress-strain curve of the material can be given as input to an FE code in order to properly simulate the elastic-plastic behavior of the material in real off-highway axles under in-service loading conditions. The local strain amplitude εa and local strain ratio Rε can be calculated at the potential crack initiation location from the elastic-plastic FE analysis. After that, the fatigue life 2Nf can be estimated by comparing the calculated strain amplitude εa with the proper Manson–Coffin curve, by taking into account both the local strain ratio Rε, through the Smith–Watson–Topper (SWT) expression, and the surface condition, through the reduction coefficient Kl*.

5. Conclusions

In the present paper, the effects of the casting skin and the strain ratio on the strain-controlled fatigue behaviour of a nodular cast iron EN-GJS-450-10 employed in a real off-highway axle have been investigated. To do this, specimens were taken from a real axle to include the effects of the manufacturing processes. The microstructures of both the axle and the specimens have been identified by metallographic analysis and Brinell hardness measurements. Afterwards, plain specimens made of EN-GJS-450-10 with machined surface have been tested under static and strain-controlled fully reversed (Rε = −1) fatigue loadings. Fatigue tests have been performed also on specimens with as-cast surface under Rε = −1, to investigate the detrimental effect of the casting skin, as well as on machined specimens under Rε = 0.1 and 0.5, to analyze the strain ratio effect. All fracture surfaces have been analyzed by SEM.
The following conclusions can be drawn:
  • The analysed EN-GJS-450-10 has graphite nodules with regular spheroidal shape dispersed in a matrix consisting of 50% ferrite and 50% pearlite. Specimens tested under static tensile loading exhibited an almost flat fracture surface and provided a proof stress σp,02 equal to 328 MPa, an ultimate tensile strength σR equal to 538 MPa, and an elongation after fracture A% and a reduction of area Z% equal to 12.9% and 10%, respectively.
  • Concerning the fatigue behaviour, the experimental data were fitted by the Manson–Coffin equation according to the common practice, as well as to a recent procedure, which assures, strictly speaking, the compatibility conditions between stress-strain-life data.
  • The analysis of the half fatigue life hysteresis loops shows that the stress ratio Rσ was different from the nominal strain ratio Rε. In particular, it ranged between -1.36 and −0.76 when Rε = −1, between −1.02 and −0.55 when Rε = 0.1, and between −1 and −0.59 when Rε = 0.5. Moreover, the comparison of the cyclic stress-strain curve with the monotonic static curve highlighted that the tested material exhibited a hardening behavior.
  • The analysis of the fracture surfaces shows that machined specimens exhibited crack initiation from the surface, while as-cast specimens failed in most cases from the as-cast surface or from sub-surface defects, such as silicon oxides. A reduction coefficient Kl* has been defined to account for the high-cycle downgrading effect of the casting skin. At 2Nf = 4∙106 reversals to failure and with reference to a strain ratio Rε = −1, Kl* was equal to 1.40.
  • Finally, it has been observed that the higher the strain ratio, the shorter the fatigue life for a given strain amplitude. Experimental fatigue data generated from machined specimens tested under different strain ratios, from −1 to 0.5, have been successfully correlated by using a Smith–Watson–Topper (SWT) expression, previously fitted only on experimental results relevant to Rε = −1.

Author Contributions

Conceptualization, G.M.; methodology, F.S., A.C., G.M., M.F.; investigation, F.S.; data curation, F.S.; writing—original draft preparation, A.C.; writing—review and editing, A.C., M.F., G.M.; visualization, F.S., A.C., M.F.; validation, A.C., G.M., supervision, G.M. All authors have read and agreed to the published version of the manuscript.

Funding

This research received no external funding.

Institutional Review Board Statement

Not applicable.

Informed Consent Statement

Not applicable.

Data Availability Statement

All data are contained within the present article.

Conflicts of Interest

The authors declare no conflict of interest.

References

  1. Borsato, T.; Berto, F.; Ferro, P.; Carollo, C. Effect of in-mould inoculant composition on microstructure and fatigue behaviour of heavy section ductile iron castings. Procedia Struct. Integr. 2016, 2, 3150–3157. [Google Scholar] [CrossRef]
  2. Konečná, R.; Kokavec, M.; Nicoletto, G. Surface conditions and the fatigue behavior of nodular cast iron. Procedia Eng. 2011, 10, 2538–2543. [Google Scholar] [CrossRef] [Green Version]
  3. Benam, A.S. Effect of Shot Peening on the High-Cycle Fatigue Behavior of High-Strength Cast Iron with Nodular Graphite. Met. Sci. Heat Treat. 2017, 58, 568–571. [Google Scholar] [CrossRef]
  4. Meyer, N.; Fatemi, A.; McCutcheon, S.; Havard, B.; Fairchilds, W. Fatigue Behavior of Cast Iron Including Mean Stress Effects. SAE Int. J. Mater. Manuf. 2015, 8, 425–434. [Google Scholar] [CrossRef]
  5. Shirani, M.; Härkegård, G. Large scale axial fatigue testing of ductile cast iron for heavy section wind turbine components. Eng. Fail. Anal. 2011, 18, 1496–1510. [Google Scholar] [CrossRef]
  6. Shirani, M.; Härkegård, G. Fatigue life distribution and size effect in ductile cast iron for wind turbine components. Eng. Fail. Anal. 2011, 18, 12–24. [Google Scholar] [CrossRef]
  7. Clement, P.; Angeli, J.P.; Pineau, A. Short crack behaviour in nodular cast iron. Fatigue Fract. Eng. Mater. Struct. 1984, 7, 251–265. [Google Scholar] [CrossRef]
  8. Agha, H.Y.; Beranger, A.-S.; Billardon, R.; Hild, F. High-cycle fatigue behaviour of spheroidal graphite cast iron. Fatigue Fract. Eng. Mater. Struct. 1998, 21, 287–296. [Google Scholar] [CrossRef] [Green Version]
  9. Yamabe, J.; Kobayashi, M. Influence of casting surfaces on fatigue strength of ductile cast iron. Fatigue Fract. Eng. Mater. Struct. 2006, 29, 403–415. [Google Scholar] [CrossRef]
  10. Zambrano, H.R.; Härkegård, G.; Stärk, K.F. Fracture toughness and growth of short and long fatigue cracks in ductile cast iron EN-GJS-400-18-LT. Fatigue Fract. Eng. Mater. Struct. 2011, 35, 374–388. [Google Scholar] [CrossRef] [Green Version]
  11. Shirani, M.; Härkegård, G.; Morin, N. Fatigue life prediction of components made of spheroidal graphite cast iron. Procedia Eng. 2010, 2, 1125–1130. [Google Scholar] [CrossRef] [Green Version]
  12. Nadot, Y. Influence of casting defects on the fatigue limit of nodular cast iron. Int. J. Fatigue 2004, 26, 311–319. [Google Scholar] [CrossRef]
  13. SAE J 1099; Technical Report on Low Cycle Fatigue Properties: Ferrous and Non Ferrous Materials. SAE International: Warrendale, PA, USA, 2002.
  14. Petrenec, M.; Tesařová, H.; Beran, P.; Šmíd, M.; Roupcová, P. Comparison of low cycle fatigue of ductile cast irons with different matrix alloyed with nickel. Procedia Eng. 2010, 2, 2307–2316. [Google Scholar] [CrossRef] [Green Version]
  15. Šamec, B.; Potrč, I.; Šraml, M. Low cycle fatigue of nodular cast iron used for railway brake discs. Eng. Fail. Anal. 2011, 18, 1424–1434. [Google Scholar] [CrossRef]
  16. Meneghetti, G.; Ricotta, M.; Masaggia, S.; Atzori, B. Comparison of the low-cycle and medium-cycle fatigue behaviour of ferritic, pearlitic, isothermed and austempered ductile irons. Fatigue Fract. Eng. Mater. Struct. 2013, 36, 913–929. [Google Scholar] [CrossRef]
  17. Boonmee, S.; Stefanescu, D.M. Effect of Casting Skin on Fatigue Properties of CG Iron. Int. J. Met. 2013, 7, 15–26. [Google Scholar] [CrossRef]
  18. Nasu, S.; Fujita, S.; Furusato, N.; Yamada, S.; Hiratsuka, S. Effect of Casting Skin Condition on Fatigue Strength of Gray Cast Iron. Int. J. Met. 2016, 11, 155–161. [Google Scholar] [CrossRef]
  19. Rehmer, B.; Skrotzki, B.; Glaubitz, S. Influence of casting skin on the fatigue lifetime of ferritic ductile cast iron. Mater. Test. 2016, 59, 5–10. [Google Scholar] [CrossRef]
  20. Nain, P.K.S. The Effect of Remaining Casting Skin on Cast Iron Components Fatigue Strength. Int. J. Eng. Res. Comput. Sci. Eng. 2017, 4, 157–165. [Google Scholar]
  21. Gróza, M.; Váradi, K. Fatigue Design of Ferritic-Pearlitic Nodular Cast Iron Components with Surface Discontinuities. Stroj. Vestn. J. Mech. Eng. 2018, 64, 373–382. [Google Scholar] [CrossRef] [Green Version]
  22. Lundberg, M.; Peng, R.L.; Ahmad, M.; Bäckström, D.; Vuoristo, T.; Johansson, S. Fatigue Strength of Machined and Shot Peened Grey Cast Iron. Adv. Mater. Res. 2014, 891–892, 30–35. [Google Scholar] [CrossRef]
  23. Bergner, K.; Bleicher, C.; Wagener, R. Influence of remaining casting skin on the fatigue strength of cast iron components. Procedia Struct. Integr. 2019, 18, 792–801. [Google Scholar] [CrossRef]
  24. Bergner, K.; Hesseler, J.; Bleicher, C. Fatigue analysis of cast iron components considering the influence of casting skin. Procedia Struct. Integr. 2019, 19, 140–149. [Google Scholar] [CrossRef]
  25. Anca, D.; Chisamera, M.; Stan, S.; Stan, I.; Riposan, I. Sulfur and Oxygen Effects on High-Si Ductile Iron Casting Skin Formation. Coatings 2020, 10, 618. [Google Scholar] [CrossRef]
  26. Dowling, N.E. Mechanical Behavior of Materials—Engineering Methods for Deformation, Fracture and Fatigue, 4th ed.; Pearson: Harlow, UK, 2013. [Google Scholar]
  27. Sonsino, C.M. Light-weight design chances using high-strength steels. Mater. Werkst. 2007, 38, 9–22. [Google Scholar] [CrossRef]
  28. Hübner, P.; Pusch, G.; Krodel, L. Fatigue Behaviour of Cast Iron with Globular Graphite. Adv. Eng. Mater. 2004, 6, 541–544. [Google Scholar] [CrossRef]
  29. Bleicher, C.; Wagener, R.; Kaufmann, H.; Melz, T. Fatigue strength of nodular cast iron with regard to heavy-wall applications. Mater. Test. 2015, 57, 723–731. [Google Scholar] [CrossRef]
  30. Bleicher, C.; Wagener, R.; Kaufmann, H.; Melz, T. Influence of Different Load Histories on the Cyclic Material Behavior of Nodular Cast Iron for Thick-Walled Application. In Proceedings of the International Offshore and Polar Engineering Conference, San Francisco, CA, USA, 25–30 June 2017. [Google Scholar]
  31. Heinrietz, A.; Hesseler, J. An approach for the fatigue estimation of porous cast iron based on non-destructive testing results. MATEC Web Conf. 2014, 12, 05001. [Google Scholar] [CrossRef] [Green Version]
  32. ISO/TR 945-3:2016; Microstructure of Cast Irons, Part1: Graphite Classification by Visual Analysis. International Organization for Standardization (ISO): Geneva, Switzerland, 2016.
  33. ISO 6506-1:2014; Metallic Materials—Brinell Hardness Test. International Organization for Standardization (ISO): Geneva, Switzerland, 2014.
  34. ISO 6892-1:2016; Metallic Materials—Tensile Testing. International Organization for Standardization (ISO): Geneva, Switzerland, 2016.
  35. ISO 12106:2017; Metallic Materials—Fatigue Testing—Axial-Strain-Controlled Method. International Organization for Standardization (ISO): Geneva, Switzerland, 2017.
  36. ASTM E 606-04; Standard Practice for Strain-Controlled Fatigue Testing. ASTM International: West Conshohocken, PA, USA, 2004.
  37. EN 1563:2018; Founding—Spheroidal Graphite Cast Irons. European Standard, 2018. Available online: https://standards.iteh.ai/catalog/standards/cen/e04bc999-3e91-4f24-855b-06dd6cf1d728/en-1563-2018 (accessed on 10 January 2022).
  38. Toktaş, G.; Tayanç, M.; Toktaş, A. Effect of matrix structure on the impact properties of an alloyed ductile iron. Mater. Charact. 2006, 57, 290–299. [Google Scholar] [CrossRef]
  39. Aristizabal, R.; Druschitz, A.; Druschitz, E.; Bragg, R.; Hubbard, C.; Watkins, T.; Ostrander, M. Intercritically Austempered Ductile Iron. In Proceedings of the American Foundry Society Transactions, Schaumburg, IL, USA, 5–8 April 2011; pp. 1–6. [Google Scholar]
  40. Durmuş, A.; Aydın, H.; Tutar, M.; Bayram, A.; Yiğit, K. Effect of the microstructure on the notched tensile strength of as-cast and austempered ductile cast irons. Proc. Inst. Mech. Eng. Part C J. Mech. Eng. Sci. 2012, 226, 2214–2229. [Google Scholar] [CrossRef]
  41. Angella, G.; Donnini, R.; Ripamonti, D.; Górny, M.; Zanardi, F. The Role of Microstructure on the Tensile Plastic Behaviour of Ductile Iron GJS 400 Produced through Different Cooling Rates—Part II: Tensile Modelling. Metals 2019, 9, 1019. [Google Scholar] [CrossRef] [Green Version]
  42. Basquin, O.H. The exponential law of endurance tests. Am. Soc. Test Mater. Proc. 1910, 10, 625–630. [Google Scholar]
  43. Manson, S.S. Behavior of Materials under Conditions of Thermal Stress. Report No. NACA TN-2933; Nasa: Washington, DC, USA, 1945. [Google Scholar]
  44. Coffin, L.F. A study of the effect of cyclic thermal stresses on a ductile metal. Trans. ASME 1954, 76, 931–950. [Google Scholar]
  45. Morrow, J. Cyclic Plastic Strain Energy and Fatigue of Metals. In Internal Friction, Damping, and Cyclic Plasticity; ASTM International: West Conshohocken, PA, USA, 1965; pp. 43–45. [Google Scholar]
  46. Niesłony, A.; El Dsoki, C.; Kaufmann, H.; Krug, P. New method for evaluation of the Manson–Coffin–Basquin and Ramberg–Osgood equations with respect to compatibility. Int. J. Fatigue 2008, 30, 1967–1977. [Google Scholar] [CrossRef]
  47. Atzori, B.; Meneghetti, G.; Ricotta, M. A Three Dimensional Graphical Aid for Fatigue Data Analysis. Key Eng. Mater. 2011, 488–489, 755–758. [Google Scholar] [CrossRef]
  48. Williams, C.; Lee, Y.-L.; Rilly, J. A practical method for statistical analysis of strain–life fatigue data. Int. J. Fatigue 2002, 25, 427–436. [Google Scholar] [CrossRef]
  49. ASTM E739-10 (2010); Standard Practice for Statistical Analysis of Linear or Linearized Stress-Life (S-N) and Strain-Life (ε-N) Fatigue Data. ASTM International: West Conshohocken, PA, USA, 2015.
  50. Smith, R.; Watson, P.; Topper, T. A stress–strain function for the fatigue of metal. J. Mater. 1970, 5, 767–778. [Google Scholar]
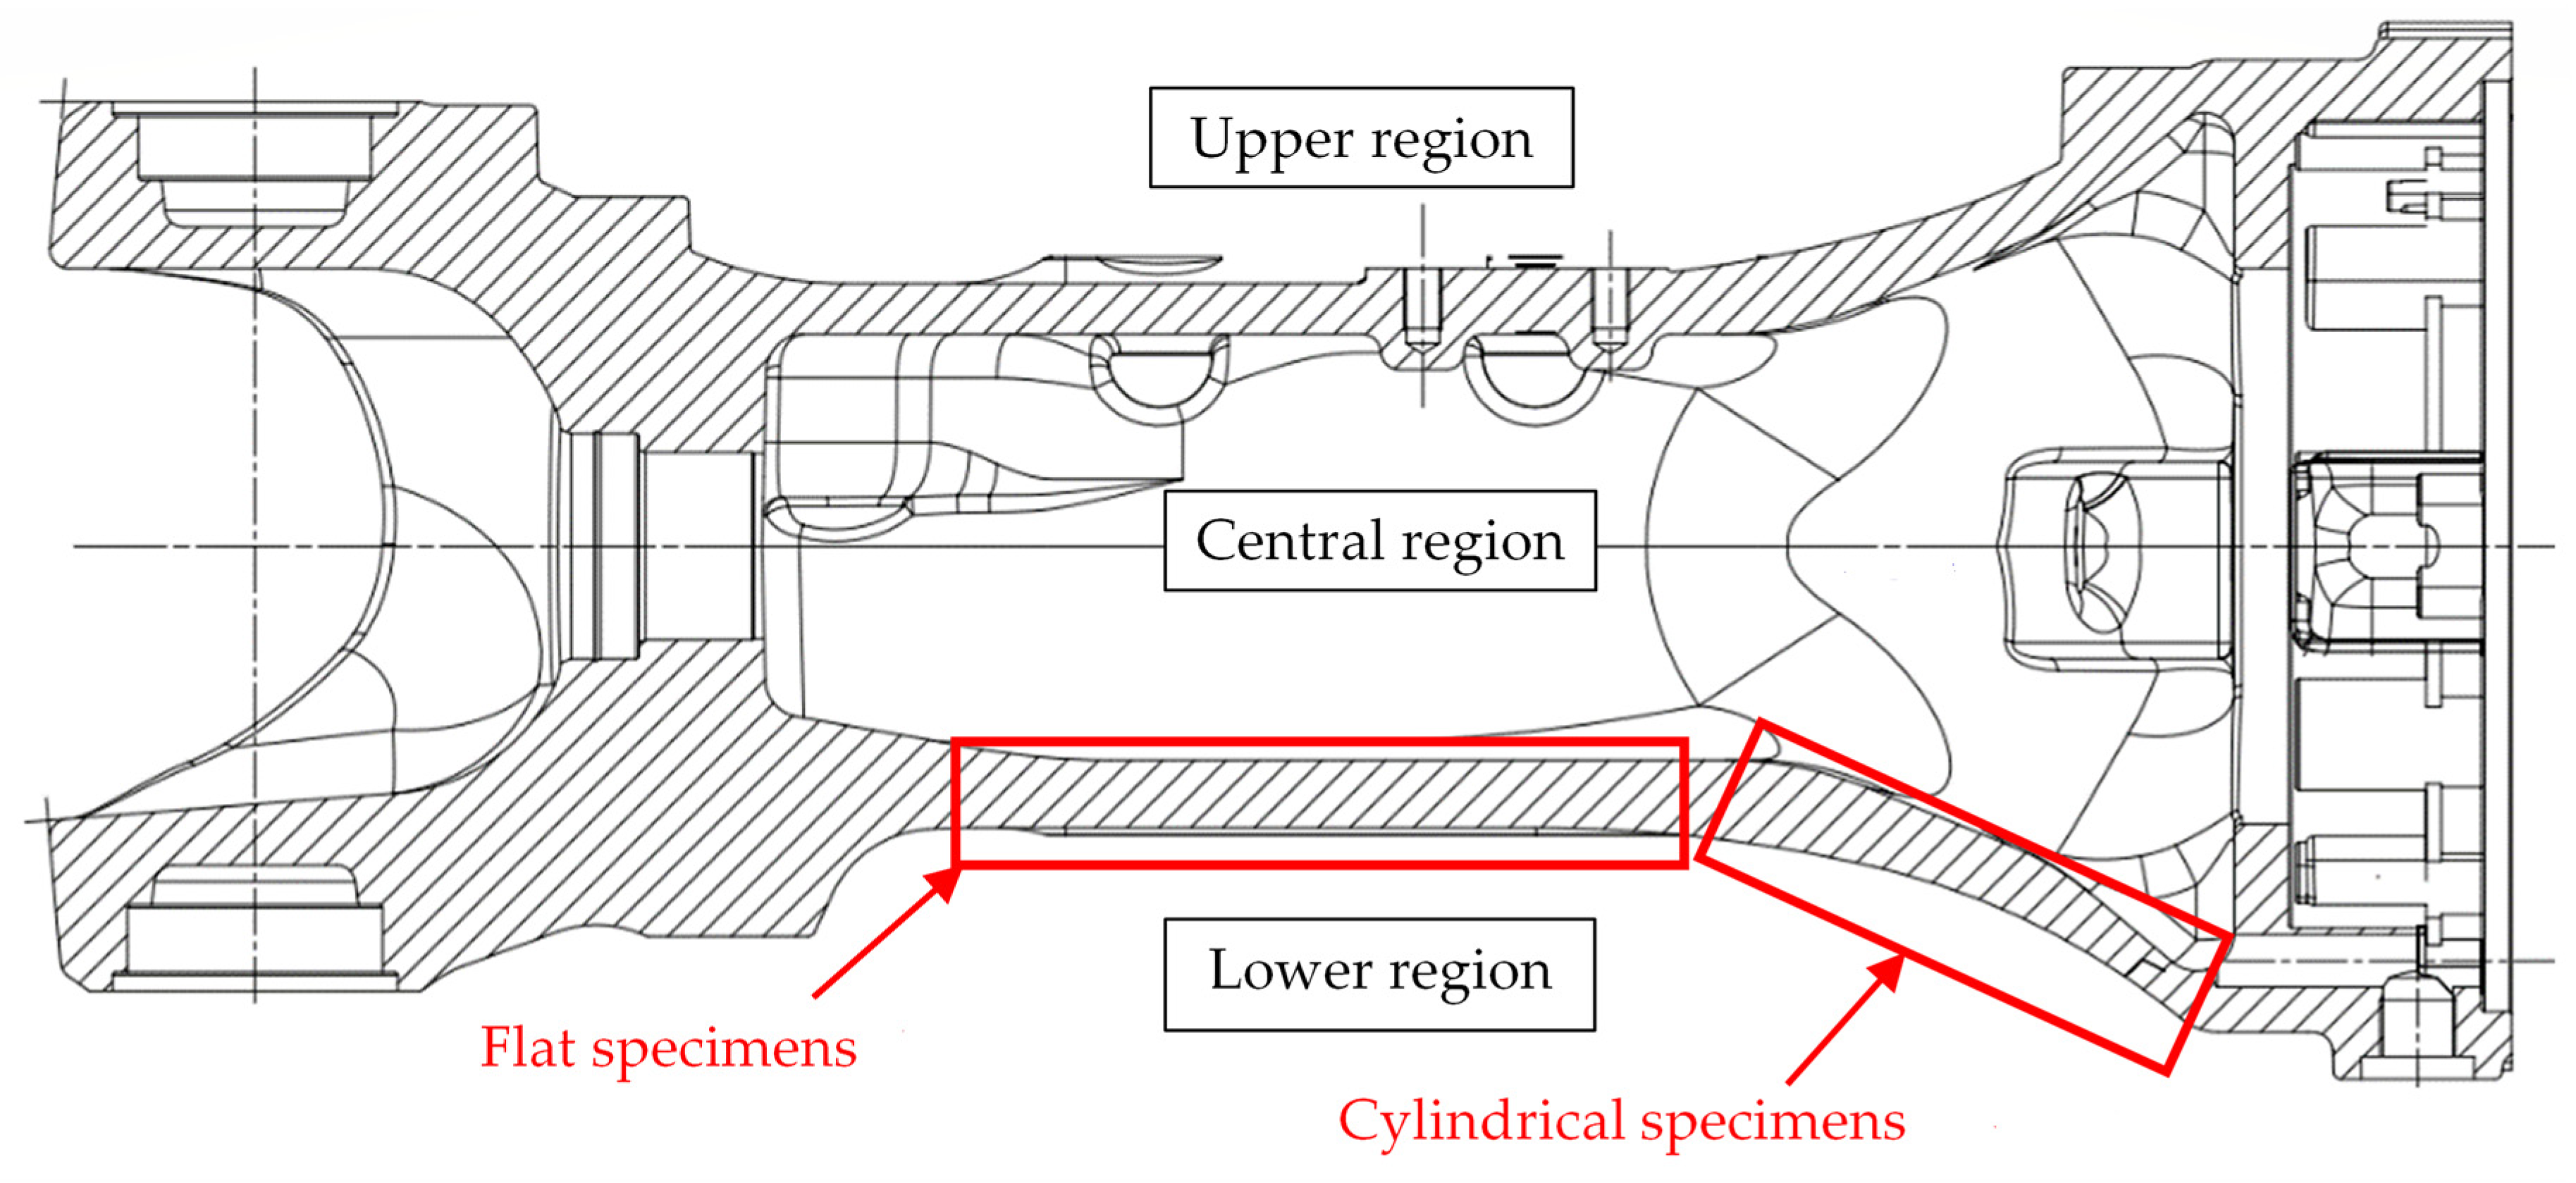
Figure 1. Regions of the axle where samples were taken.
Metals 12 00426 g001
Figure 2. Regions of the axle where metallographic analyses and Brinell hardness measurements have been performed.
Metals 12 00426 g002
Figure 3. Microstructures (1a), (2a), (3a) before and (1b), (2b), (3b) after Nital 4% etching as analysed in regions 1, 2 and 3 of the axle (see Figure 2), respectively. Size of graphite nodules and matrix type.
Metals 12 00426 g003
Figure 4. Geometry of plain cylindrical specimens tested under static tensile loading (dimensions are in mm). Specimens have been taken from the axle (see Figure 1 and region 2 of Figure 2), and after that, the cylindrical surface has been machined (Ra = 0.9 μm).
Metals 12 00426 g004
Figure 5. Geometry of plain cylindrical specimens tested under strain-controlled fatigue loading (dimensions are in mm). Specimens have been taken from the axle (see Figure 1 and region 2 of Figure 2), and after that, the cylindrical surface has been machined (Ra = 0.9 μm).
Metals 12 00426 g005
Figure 6. Geometry of plain flat specimens tested under strain-controlled fatigue loading (dimensions are in mm). Specimens have been taken from the axle (see Figure 1 and region 3 of Figure 2), and after that, three surfaces have been machined (Ra = 0.4 μm), while one has been kept as-cast.
Metals 12 00426 g006
Figure 7. Microstructure of specimens made of EN-GJS-450-10 observed by (a,b) optical microscope and by (c,d) SEM. Microstructure (a) unetched and (b) after Nital 4% etched.
Metals 12 00426 g007
Figure 8. Static engineering stress-strain curves for EN-GJS-450-10.
Metals 12 00426 g008
Figure 9. Comparison of the microstructures and Brinell hardnesses of specimens St_450_05 and St_450_04 tested under static tensile loading.
Metals 12 00426 g009
Figure 10. Manson–Coffin curves of EN-GJS-450-10 tested under Rε = −1 in the (a) machined and (b) as-cast conditions; (c) Rε = 0.1 and (d) Rε = 0.5 in the machined conditions. The figures include the curves fitted by the non-compatible procedure and the parameters to input in Equation (3) according to both the non-compatible and the compatible procedures.
Metals 12 00426 g010aMetals 12 00426 g010b
Figure 11. Half-life hysteresis loops of EN-GJS-450-10 tested under Rε = -1 in the (a) machined and (b) as-cast conditions; (c) Rε = 0.1 and (d) Rε = 0.5 in the machined conditions. For comparison purposes, the figures relevant to Rε = −1 include the monotonic static curve, according to Equation (2) and the parameters of Table 5, and the cyclic stress-strain curves, according to Equation (4) and the parameters fitted by both the non-compatible and the compatible procedures.
Metals 12 00426 g011aMetals 12 00426 g011b
Figure 12. Failure locations observed after the static and the strain-controlled fatigue tests. The figure reports examples relevant to plain cylindrical specimens (Figure 4 and Figure 5); however, the same definitions also apply to plain flat specimens (Figure 6).
Metals 12 00426 g012
Figure 13. Fracture surfaces of plain cylindrical specimens (Figure 4) after static tensile tests.
Metals 12 00426 g013
Figure 14. Fracture surfaces after strain-controlled fatigue tests of EN-GJS-450-10 plain specimens (Figure 5 and Figure 6): (a,b) Rε = −1, machined conditions, (c,d) Rε = −1, as-cast conditions; (e,f) Rε = 0.1 and (g,h) Rε = 0.5 in the machined conditions.
Metals 12 00426 g014aMetals 12 00426 g014bMetals 12 00426 g014c
Figure 15. Fracture surfaces of a plain specimen (Figure 6) made of EN-GJS-450-10 and tested at εa = 3000 με under Rε = −1 in the as-cast conditions. Failure occurred at 2Nf = 898. Fracture surfaces observed with (a,b) a digital microscope and (cf) a SEM microscope. Microstructure observed by optical microscope at (g) the center of the sample and (h) the as-cast surface.
Metals 12 00426 g015aMetals 12 00426 g015b
Figure 16. EDS pattern of (a) the defect observed in the fracture surface shown in Figure 15; (b) the material region closed to the defect.
Metals 12 00426 g016
Figure 17. Comparison of the Manson–Coffin curves of EN-GJS-450-10 tested under Rε = −1 in the machined (Figure 10a) and as-cast (Figure 10b) conditions. Derivation of the parameter Kl*.
Metals 12 00426 g017
Figure 18. Strain-controlled fatigue test results generated from EN-GJS-450-10 specimens tested under Rε = −1 (Figure 10a), 0.1 (Figure 10c), and 0.5 (Figure 10d) in the machined conditions and expressed in terms of the parameter σmax∙εa, according to Smith–Watson–Topper [50]. The figure includes the curve σmax∙εa versus 2Nf (Equation (9)), the material parameters being those fitted only on experimental results relevant to Rε = −1, as reported inside the figure.
Metals 12 00426 g018
Table 1. Size and shape of graphite nodules and matrix composition in the regions of the axle defined in Figure 2 according to ISO 945-1:2018 [32].
RegionShape # and Size * of Graphite NodulesMatrix Composition
1VI-7 Spheroidal graphiteferritic (50%)–pearlitic (50%)
2VI-6/7 Spheroidal graphiteferritic (50%)–pearlitic (50%)
3VI-7 Spheroidal graphiteferritic (50%)–pearlitic (50%)
# shape of graphite nodules: VI corresponds to regular spheroidal graphite. * size of graphite nodules: 6 corresponds to a diameter in the range between 30 μm and 60 μm, and 7 to a diameter in the range between 15 μm and 30 μm.
Table 2. Brinell hardness [33] measured in the regions of the axle defined in Figure 2.
RegionHBW—Test 1HBW—Test 2HBW—Test 3HBW—AverageHBW—Standard Deviation
1182182183182.30.577
2182184183183.01.000
3185187187186.31.155
Table 3. Summary of static and fatigue tests performed on specimens made of nodular cast irons.
MaterialRaw ComponentSpecimen SurfaceTestSpecimen GeometryRεN° Testsf
[Hz]
Rate [mm/min]Failure Criterion
EN-GJS-450-10Off-highway axlemachinedStaticFigure 4n.a.7n.a.0.5separation
Fatigue *Figure 5−1
0.1
0.5
10
6
6
0.2–18
0.2–15
0.2–15
n.a.
n.a.
n.a.
separation
separation
separation
as-castFatigue *Figure 6−1150.2–18n.a.separation
* Strain-controlled fatigue test. n.a. = not applicable.
Table 4. Pearlite content and Brinell hardness of tested specimens.
MaterialRaw ComponentPearlite ContentHBW
EN-GJS-450-10off-highway axle20–50%170–206
Table 5. Static tensile properties of EN-GJS-450-10. Average values and standard deviations.
MaterialRaw ComponentParameterEsσp0.2σRAZKn
(MPa)(MPa)(MPa)(%)(%)(MPa)(/)
EN-GJS-450-10off-highway axleAverage value169,17432856312.9108060.1584
Standard deviation2383491.31260.0113
Table 6. Summary of the failure locations observed after the static and fatigue tests (see definitions in Figure 12).
MaterialRaw ComponentSpecimen SurfaceTestN° TestsType AType BType CRun Out
EN-GJS-450-10off-highway axlemachinedStaticn.a.7601n.a.
Fatigue *−1
0.1
0.5
10
6
6
6
5
6
1
1
0
2
0
0
1
0
0
as-castFatigue *−1149302
* strain-controlled fatigue test. n.a. = not applicable.
Publisher’s Note: MDPI stays neutral with regard to jurisdictional claims in published maps and institutional affiliations.