Article

Investigation into the Corrosion Wear Resistance of CoCrFeNiAlx Laser-Clad Coatings Mixed with the Substrate

School of Materials Engineering, Shanghai University of Engineering Science, Shanghai 201620, China
*
Author to whom correspondence should be addressed.
Metals 2022, 12(3), 460; https://doi.org/10.3390/met12030460
Submission received: 8 February 2022 / Revised: 6 March 2022 / Accepted: 8 March 2022 / Published: 9 March 2022

Abstract

:
CoCrFeNiAlx (x = 0 and 1.0) high-entropy alloy coatings were synthesized on Ti6Al4V via laser cladding to improve their corrosion and wear resistance under corrosive conditions. Results indicated that the coating (CoCrFeNi) was largely composed of irregular primary α(Ti) and honeycomb-like eutectics of α(Ti) + Ti2Ni as the matrix, with TiC dendrites as the reinforcement. When Al was introduced into the cladding material, irregular α(Ti) grains were transformed into equiaxed grains, besides which the area fraction in eutectics was considerably reduced, and TiC dendrites were also transformed into spherical particles. Compared with the coating without Al, the introduction of Al contributed to the improvement in corrosion resistance because corrosion potential was enhanced from −0.524 V to −0.393 V, whereas corrosion current density and steady current density were reduced from 2.249 × 10⁻⁷ A·cm−2 and 1.021 × 10⁻⁶ A·cm−2 to 1.260 × 10⁻⁷ A·cm−2 and 2.506 × 10⁻⁷ A·cm−2, respectively. The substrate was still at the break-in stage during a long-term sliding of 10 h because its wear rate exhibited an approximately linear reduction tendency (2.09 × 10⁻³ mm3·N−1·m−1 for 2 h and 7.44 × 10⁻⁴ mm3·N−1·m−1 for 10 h). With respect to the coatings, they transitioned from the break-in stage into the stable wear stage when the sliding duration exceeded 4 h, during which a comparatively stable wear rate of 2.88 × 10⁻⁴ mm3·N−1·m−1 was obtained. The wear mechanism of the substrate was identified as slight microcutting and serious oxidation for the long-term sliding of 10 h. It changed into a combination of slight microcutting, serious oxidation, and moderate brittle debonding for the coatings. Generally speaking, the introduction of Al can refine the microstructure and improve the microstructural uniformity. Moreover, the passive film can be formed more rapidly on the coating surface and presents higher stability when introducing Al. Finally, the introduction of Al also promotes the coating to enter into the stable wear stage more rapidly and causes the decrease in friction coefficient and wear rate.

1. Introduction

Ti6Al4V is a commonly used corrosion resistance alloy in the engineering field [1] (e.g., bolts, gaskets, and spiral-riveted pipes made of Ti6Al4V in the chemical industry). Service conditions mostly include an acidic medium [2], an alkaline medium [3], a NaCl solution [4], and seawater [5]. The excellent corrosion resistance of Ti6Al4V primarily arises from a dense and inert oxidation film with a thickness of approximately 1–10 nm that is spontaneously formed and tightly adheres onto its surface [6]. However, the film may be seriously damaged when the alloy comes in contact with other components, exhibits relative motion, or undergoes high-speed collision with hard particles dispersed in the medium, causing the alloy to be subjected to chemical/electrochemical dissolution. Moreover, the exposed alloy will suffer from severe microcutting under the applied load because of its low hardness, causing its drastic loss. Therefore, the wear resistance of Ti6Al4V in the corrosion medium must be improved by modifying its surface properties due to wear and corrosion failure that all originate from the surface [7,8,9,10,11].
As a promising surface modification technology, laser cladding attracted widespread interest and developed rapidly; in this technique, the thick coating with a strong metallurgical bonding with the substrate can be prepared to meet different performance requirements by flexibly adjusting its microstructure and chemical composition [12,13,14]. A large number of studies were performed to improve wear and corrosion resistance by fabricating ceramic particle-reinforced metal-based coatings using laser cladding on Ti6Al4V (Ti-based coatings reinforced by TiB2/TiB [15], TiB [16], TiC [17], TiC/TiB2 [18], TiC/Ti2Ni [19], and SiC [20]; Co-based coatings reinforced by CeO2 [21], WC [22], TiN [23], and Ti5Si3/TiC [24]; and Ni-based coatings reinforced by TiC/TiN [25], TiB2/TiC [26], WS2/hBN [27], and TiN/Ni3Ti/Ti3AlN [28]). These composite coatings exhibit outstanding resistance to microcutting due to their high hardness of approximately 850–1300 HV [29]. However, the accompanying low plasticity and toughness will enhance the coatings’ cracking susceptibility [30,31]. Considering the rapid melting and cooling characteristic involved in laser cladding, the huge residual stress in the coatings further aggravates their cracking susceptibility. Cracks may easily initiate and propagate in coatings that sustain repeated load during wear, causing a portion of the surface zones to debond brittlely from the coatings. When wear loss from brittle debonding predominates over that from microcutting, the effect of the combination may weaken the wear resistance of the coatings. By contrast, the substrate zone covered with the coatings may be directly exposed to the corrosion medium when cracks propagate into the substrate, causing serious chemical/electrochemical dissolution. Therefore, to obtain the most outstanding wear resistance under corrosive conditions, a laser-clad coating with low cracking susceptibility should be developed at the expense of appropriately reducing hardness.
In 2004, Yeh et al. [32] and Cantor et al. [33] first proposed the concept of multicomponent high-entropy alloys (HEAs) that differ from traditional alloys. HEAs mostly contain single solid solutions and are nearly free of hard intermetallic particles due to the effects of high entropy, lattice distortion, and slow diffusion [34,35,36], providing a new approach for solving the aforementioned shortcomings in ceramic particle-reinforced metal-based coatings. Recently, some investigations into the wear behavior of HEA-clad coatings on Ti6Al4V were reported. Zhao et al. [37] successfully prepared AlNbTaZr0.8 HEA coating composed of two simple solid solutions, i.e., body-centered cubic (BCC) + hexagonal close-packed (HCP), via laser cladding on Ti6Al4V. The wear resistance of the coating was investigated through dry-sliding tests with a sliding time of 2 h. The coating demonstrated better wear resistance than the substrate because its wear rate (1.66×10⁻⁴ mm3·N−1·m−1) was reduced by 31% compared with that of the substrate (2.41×10⁻⁴ mm3·N−1·m−1). Huang et al. [38] fabricated TiCrAlSi HEA laser-clad coating on Ti6Al4V; this coating was composed of a single BCC solid solution and uniformly dispersed (Ti,V)5Si3 precipitates. Dry-sliding wear tests were performed for 1 h to investigate wear behavior. The coating demonstrated excellent wear resistance because of its lower wear rate (2.4 × 10⁻⁵ mm3·N−1·m−1) compared with that of the substrate (7.5 × 10⁻⁵ mm3·N−1·m−1). Wang et al. [39] synthesized FeCoCrNi HEA coating that consisted of face-centered cubic (FCC) and BCC solid solutions via laser cladding on Ti6Al4V. Dry-sliding wear tests for 10 min confirmed that the wear resistance of the coating (8.33 × 10⁻⁵ mm3·s−1) was improved by 6.1 times relative to the substrate (5.08 × 10⁻⁴ mm3·s−1). Juan et al. [40] obtained HEA coating by laser cladding FeCrCoNiAlMo powder on Ti6Al4V. The coating, which was free of defects, was mostly composed of a single solid solution (BCC) and exhibited good metallurgical bonding with the substrate. When subjected to wear tests for 180 min in air, the friction coefficient of the coating (0.61) was significantly lower than that of the substrate (1.04), and its wear volume (0.823 ± 0.012 mm3) was reduced by 48% relative to that of the substrate (2.329 ± 0.025 mm3). Zhang et al. [41] prepared TiAlCoCr2FeNi HEA coating that contained an HCP solid solution by laser cladding on Ti6Al4V. Dry-sliding wear tests performed for 2 h demonstrated that the wear resistance of Ti6Al4V was considerably improved by laser cladding the HEA coating because the wear volume of the coating was approximately 40% that of Ti6Al4V. However, most current investigations focus on the short-term wear behavior of HEA coatings in air (typically less than 2 h), while only a few reports on the long-term wear resistance in a corrosive medium are reported. Wear is typically divided into three stages: the break-in, stable wear, and severe wear stages. The components mostly serve during the stable wear stage, which has a low/stable wear rate and a long duration. Wear tests with a short duration may only reflect wear performance during the break-in stage and cannot be applied to evaluate wear performance precisely during the stable wear stage. Moreover, wear tests performed in air are unsuitable for characterizing actual service performance under corrosive conditions.
In the current work, HEA coatings were prepared by laser cladding CoCrFeNiAlx (x = 0 and 1.0) on Ti6Al4V to improve its wear performance under corrosive conditions. The effects of Al introduction on microstructure, corrosion resistance, and wear resistance in the 3.5 wt.% NaCl solution were investigated comprehensively. Wear tests were performed for different durations (2 h, 4 h, 6 h, 8 h and 10 h), during which the change in wear rate with sliding time was clearly investigated to identify the wear process. The corrosion and wear mechanisms were also identified and described in detail.

2. Materials and Methods

2.1. Preparation of the Coatings

In this study, a commercial Ti6Al4V alloy rod with a diameter of 50 mm and a length of 50 cm was used to prepare the substrate. A DK7730C electric discharge machine (Haishu Guoding Numerical Control Machinery Co. Ltd., Ningbo, China) was utilized to cut the rod into several plates to produce substrates with a diameter of 50 mm and a thickness of 10 mm. The plates were ground with #240 silicon carbide sandpaper and cleaned in acetone with an ultrasonic cleaner for 30 min. The cladding powder (CoCrFeNiAlx, x = 0 and 1.0) was prepared by weighting and mixing commercial Co, Cr, Fe, Ni, and Al (≥99.5 wt.% in purity and 53–105 µm in size). The formulated powder was dried at 80 °C for 5 h, placed into a Teflon grinding jar that contained agate balls of different diameters, and finally, ground using a GQM-2-15 grinder (Changsha Tianchuang Powder Technology Co., Ltd., Changsha, China) at a speed of 300 rpm for 12 h. Before laser cladding, the substrate was coated with an adhesive (4 wt.% polyvinyl alcohol) using a brush and then placed in a circular mold (inner diameter of 50.3 mm and height of 11.0 mm). In the ring model, the empty space above the surface of the substrate was filled with cladding powder. An initial preplaced layer with a precise thickness of 1.0 mm was produced and then pressed using a BJ-30 press under a load of 30 MPa for 120 s. Finally, a YSL-5000 fiber laser system (IPG Photonics Corporation, Oxford, MS, USA) was used for laser cladding under the best parameters (power: 3 kW, spot diameter: 6 mm, and scanning speed: 5 mm·s−1).

2.2. Microstructure Characterization

The phase compositions of the coatings were detected with a Panalytical X’ Pert Pro X-ray diffractometer (Malvern Panalytical Co., Ltd., Shanghai, China) with Cu Kα radiation (λ = 0.1540560 nm). A Hitachi S-3400 scanning electron microscope (Hitachi, Tokyo, Japan) and a Genesis EDAX spectrometer (EDAX Inc., Philadelphia, PA, USA) were used to observe the cross-sectional microstructure of the coatings under magnifications of 500× and 2000×. Before observation, the cross-sections of the coatings were ground using 240–2000# silicon carbide sandpapers and polished using 1.0 µm diamond paste. Then, the samples were cleaned in ethanol for 15 min with an ultrasonic cleaner (Shanghai Kedao Ultrasonic Instrument Co., Ltd., Shanghai, China) and etched for 45 s in the solution (4 mL deionized water, 6 mL HNO3, and eight drops of HF).

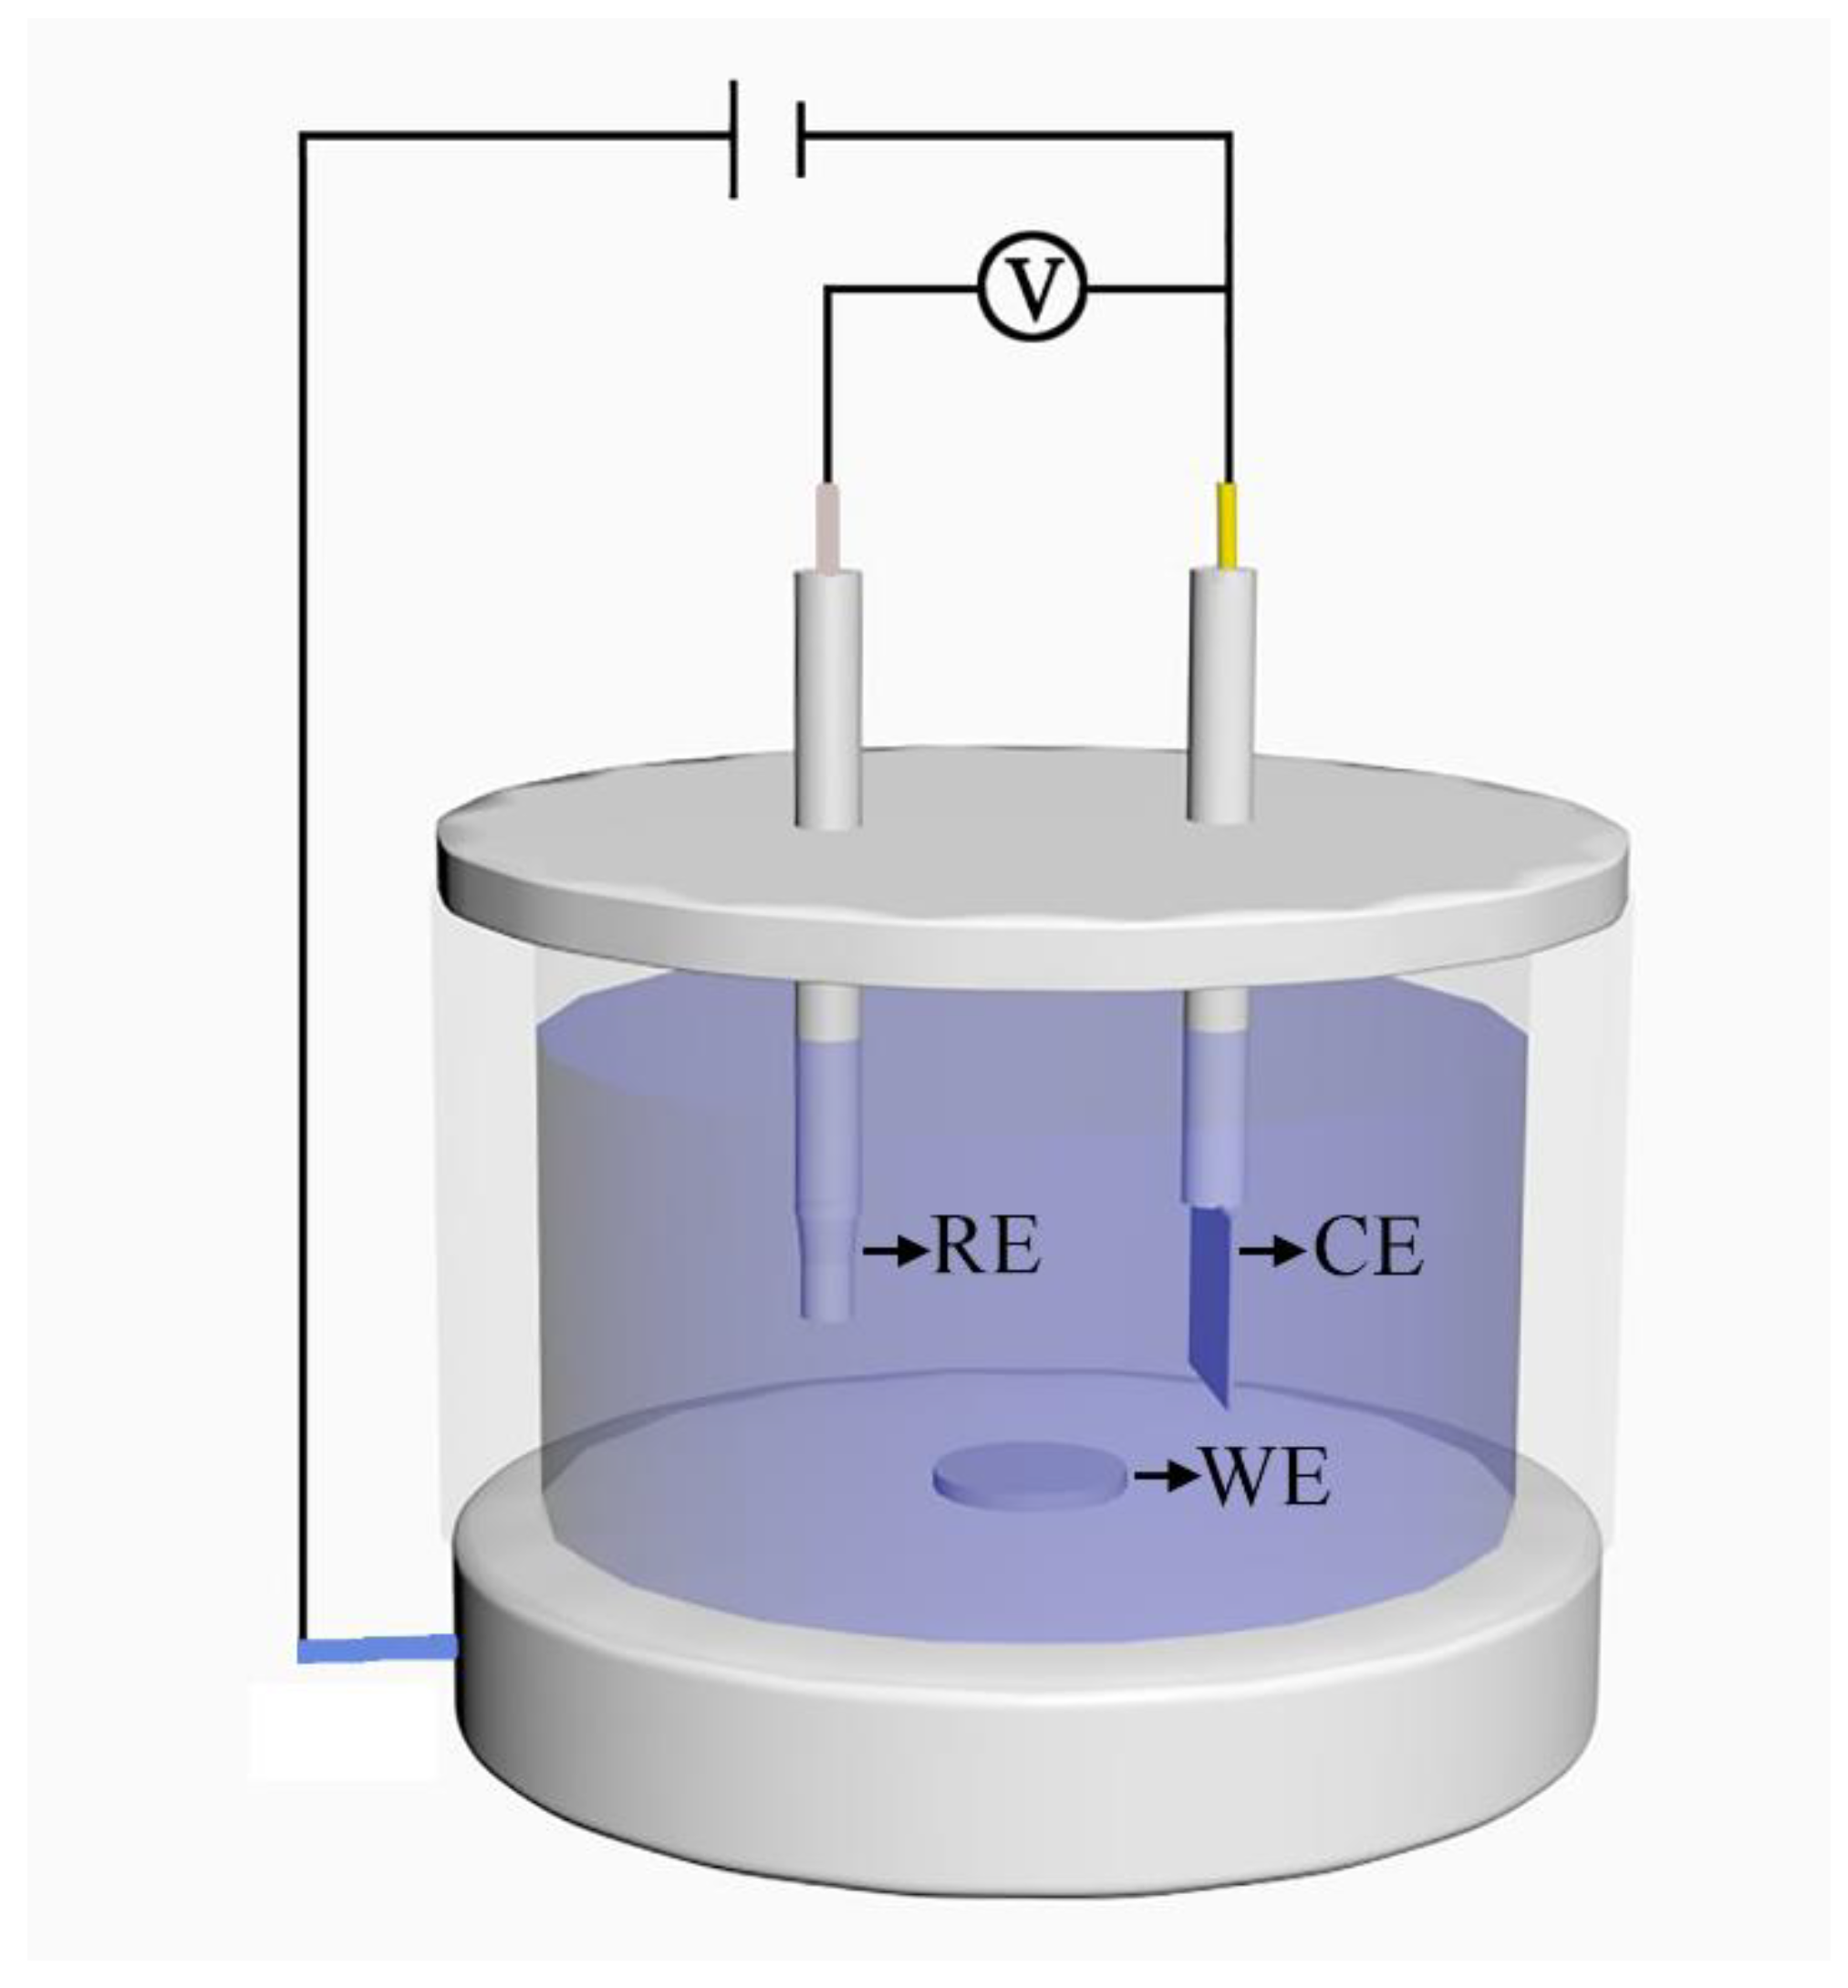
2.3. Electrochemical Performance

The electrochemical performance of the samples was tested in the 3.5 wt.% NaCl solution at room temperature on a CHI 760E electrochemical workstation. The traditional three-electrode system (Figure 1) was adopted with the samples as the working electrode (WE), a platinum plate as the counter electrode (CE), and a saturated calomel electrode as the reference electrode (RE). System stability is crucial for the accuracy of results. In this study, five measures were taken to ensure system stability. First, the RE and CE were the same. Second, the WEs were processed by the same steps prior to conducting the electrochemical experiments. The surface area exposed to the electrolyte was precisely controlled within 0.25 cm in diameter, ensuring that the surface finish degree and exposed testing area were constant. Third, the relative position among the three electrodes was precisely fixed using a commercial testing instrument. Fourth, the applied electrolyte was not reused and instead was reprepared for every electrochemical test, ensuring stability in solution concentration. Finally, the samples were soaked in the solution for 30 min prior to the electrochemical tests, and the change in open circuit potential (OCP) with time was tested to ensure that OCP tends toward stability (approximately 400 s). The potentiodynamic polarization curves were tested under a potential window of −0.8 V to 1.0 V at a scanning speed of 1 mV·s−1. Electrochemical impedance spectroscopy (EIS) was measured with an amplitude of 10 mV under OCP conditions and frequencies ranging from 100 kHz to 0.01 Hz.
To study the passive behavior of the coating (CoCrFeNiAl), an ESCALAB 250XI X-ray photoelectron spectroscope, manufacturer (Thermo Fisher Scientific, Waltham, MA, USA) was employed to analyze the chemical valence states in the oxidation film.

2.4. Mechanical Performance

The microhardness of the polished cross-sections of the coatings was measured with an XHD-1000TMSC/LCD Vickers microhardness tester (Shanghai Taiming Optical Instrument Co., Ltd., Shanghai, China) with a load of 200 gf and a residence time of 15 s. The tests were performed on the basis of the Chinese standard (GB/T 4340.1-2009: Metallic Materials-Vickers Hardness Test-Part 1: Test Method). Three indentations were first prepared at the central zones with a distance of 0.1 mm from the coating surface. Among which, a distance of 0.05 mm was maintained. Then, the same number of indentations was prepared at the zones with the same distance (0.1 mm) from the former zones along the depth direction. Finally, the tests were completed at the zone close to the interface. Approximately 90 indentations were prepared for each coating. The obtained data were processed to obtain the average value for comparing the difference in microhardness of the two coatings.
Wear tests of the samples were performed in the 3.5 wt.% NaCl solution via the reciprocating mode on a CFT-1 super functional wear tester (load: 20 N; speed: 600 rpm; reciprocating distance: 3 mm; and sliding time: 2 h, 4 h, 6 h, 8 h, and 10 h). High-hardness YG6 W steel balls with a diameter of 5 mm were selected as counterparts. The friction coefficient was recorded in real-time during the sliding wear. After the sliding wear tests, the wear profiles were detected using a surface mapping profiler (MT-500) (Lanzhou Zhongke Kaihua Technology Development Co., Ltd., Lanzhou, China). The wear volumes were automatically calculated on the basis of the wear profiles. To reduce error, three wear profiles for a given sample were measured to obtain the average value. The wear rate (K) of the samples was further calculated using the following formula:
K = V N d
where V represents the amount of wear (mm3), N signifies the applied load (N), and d denotes the sliding distance (m).
Wear morphologies and chemical compositions at different zones were analyzed to identify the wear mechanism via scanning electron microscopy (SEM) and energy-dispersive X-ray spectroscopy (EDS).

3. Results and Discussion

3.1. X-ray Diffraction (XRD) Analyses

The XRD patterns of the CoCrFeNi and CoCrFeNiAl alloy coatings are presented in Figure 2. By using Jade 6.5 software, the d values of α(Ti) (NO.00-001-1198), Ti2Ni (NO.00-018-0898), and TiC (NO.00-001-1222) can be consistent with those of the diffraction peaks. With regard to the intensities of the corresponding peaks, a conclusion can be drawn that α(Ti) and Ti2Ni are synthesized as the matrix phase, and a small amount of TiC is also precipitated during solidification. The synthesized phases are all rich in Ti, indicating that a portion of the substrate suffers from melting, and the major element (Ti) in the substrate enters into the molten pool and participates in chemical reactions. The elements in the cladding material mostly exist in the form of solutes. By comparing the two diffraction patterns, the two strong peaks located at 2θ = 40.545° and 2θ = 41.568° slightly shift to the left with the introduction of Al, indicating that the lattice is expanded on the basis of Bragg’s equation ( 2 d sin θ = n λ ). This phenomenon should be attributed to the atomic radius of Al being larger than those of Co, Fe, and Ni (Al: 1.82 Å, Co: 1.67 Å, Fe: 1.72 Å, and Ni: 1.62 Å). The produced solid solution strengthening promotes an improvement in the hardness and wear resistance of the coatings.
A new method was established to predict the formed possibility and preference of a compound in a multicomponent system, which is described as liquid phase separation [42]. For a system, the possibility and preference of the binary alloys among the different components are closely associated with the mixing enthalpy of between two components of A and B (ΔHmix). When ΔHmix is larger than zero, no compounds are formed in the binary system due to the central miscibility gap in the liquid phase. On the contrary, the compounds can exist stably in the system with the negative ΔHmix. Moreover, the more negative ΔHmix results in a stronger binding force between the two components, which promotes the compound to be easily separated or segregated from the liquid during solidification [43]. The values of each pair of elements in this system are provided in Table 1. It is clear that the binary alloys may be precipitated in the Ti-Co-Cr-Fe-Ni-Al system during solidification owing to their negative values. Comparatively, the Ti-Ni compound with the more negative −35 can be synthesized more easily (Table 1). Considering that the content of Ti is much higher than that of Ni, it can be concluded that the compound rich in Ti (Ti2Ni) is most likely to be formed. This is well in accordance with the XRD result. For the compound between the metallic component (Ti, Co, Cr, Fe, Ni, Al) and the nonmetallic component (C), the calculated result also demonstrates that TiC is most likely to be formed owing to its most negative value of −109 (Table 1), which also agrees with the XRD result.

3.2. Microstructural Characterization

Figure 3(a1,b1) show the cross-sectional macromorphologies of the coatings. The profiles of the two coatings are highly similar. The maximum width and depth are approximately 6.6 mm and 3.0 mm, respectively. The microstructure is extremely dense, and no cracks, pores, and unmalting particles can be clearly identified. A concave interface between the coating and the substrate can be observed, showing that a strong metallurgical bond formed between the two. Linear scanning analyses were performed to detect the change in chemical composition along the scanning trace (Figure 3(a1,b1)). Based on the linear scanning results (Figure 3(a2,b2)), the coating and the substrate can clearly be identified due to the significant change in chemical composition in the joint interface. A close inspection reveals that a transition zone with a thickness of approximately 100 μm can be clearly identified in the joint interface, in which the elements of Ti and Al, rich in the substrate, present the gradual upward tendency and the elements of Co, Cr, Fe, Ni, rich in the cladding material, demonstrate the opposite change along the depth direction of the coatings. The morphology of the interface is indicated in Figure 4, in which the microstructure in the transition zone is different from that in the coating. The zone was also observed in the interface of explosively welded bronze–carbon steel [45], in which the alloying elements of the flyer and base plates were involved. The investigation indicated that a thin transition can also be formed in the interface between the precipitates and the matrix during casting and cooling in the CrFeNiMn0.5Cu0.5 high entropy alloy [46].
Figure 5 clearly depict the morphologies of different phases in the coatings. As shown in Figure 5(a1,a2), the CoCrFeNi alloy coating is largely composed of irregular protruded blocky grains. Among which, a cellular-like structure can be clearly observed. In addition, some dendrites are sporadically distributed in the coating. The whole area shown in Figure 5(a1) is selected to obtain chemical composition via EDS. The results indicate that the zone is composed of 64.58 at.% Ti, 5.93 at.% Co, 6.49 at.% Cr, 6.07 at.% Fe, 6.13 at.% Ni, 9.94 at.% Al, and 0.85 at.% C. EDS was performed to determine the chemical compositions of phases with different morphologies (Figure 5(a3)). As indicated in Table 2, a blocky grain (marked as A) is rich in Ti (62.61 at.%). In addition, small amounts of Co (4.64 at.%), Cr (9.03 at.%), Fe (5.46 at.%), Ni (3.69 at.%), and Al (11.95 at.%) were also detected. Combined with the XRD analysis, the blocky phase can be confirmed as the α(Ti) solid solution. For the cellular-like structure, two phases that correspond to the fine protruding phase (marked as B) and concave phase (marked as C) are involved. The EDS results indicate that the protruding phase has similar chemical compositions to those of the blocky phase, implying that the phase should be α(Ti). The concave phase is composed of 49.93 at.% Ti, 10.51 at.% Co, 3.92 at.% Cr, 6.87 at.% Fe, 18.46 at.% Ni, and 8.87 at.% Al. This phase can be determined as the Ti2Ni secondary solid solution. The atomic radii of Ti, Ni, Cr, Co, Fe, and Al are 2.00, 1.62, 1.85, 1.67, 1.72, and 1.82 Å, respectively. Therefore, Ti in Ti2Ni may be replaced by Al and Cr due to their similar atomic radii. Similarly, the atomic radius of Ni is closer to that of Co and Fe, and thus, Ni in Ti2Ni is substituted for Co and Fe. Apart from the atomic radius, the difference in electronegativity also further confirms the aforementioned speculation, i.e., the similar electronegativity among Ti (1.54), Al (1.61), and Cr (1.66) and among Ni (1.92), Co (1.88), and Fe (1.83). The molar ratio of (Ti + Al + Cr) and (Ni + Co + Fe) was calculated as 1.75:1, which is close to 2:1, further confirming the existence of Ti2Ni. The coarse blocky phase should be the primary α(Ti), and the cellular-like structure should be the eutectics that contain α(Ti) and Ti2Ni. The dendrites (marked as D), which are rich in Ti (72.43 at.%) and C (11.36 at.%), can be identified as TiC in view of the XRD results.
When Al is introduced into the cladding material, the microstructure of the coating is illustrated in Figure 5(b1–b3). The EDS results indicate that the whole area is shown in Figure 5(b1) is composed of 60.64 at.% Ti, 5.94 at.% Co, 6.58 at.% Cr, 6.22 at.% Fe, 5.99 at.% Ni, 14.00 at.% Al, and 0.63 at.% C. The marked zones in Figure 5(b3) were also analyzed via EDS (Table 2). The irregular blocky grains are transformed into the regular equiaxed grains (marked as E) with a smooth margin and approximately the same size. The area among the equiaxed grains is considerably reduced, indicating that the volume fraction of the eutectics (marked as F) is significantly decreased. Moreover, TiC dendrites (marked as G) are also changed into fine spherical particles. The aforementioned changes will produce a non-negligible effect on the wear and corrosion resistance of the coatings.

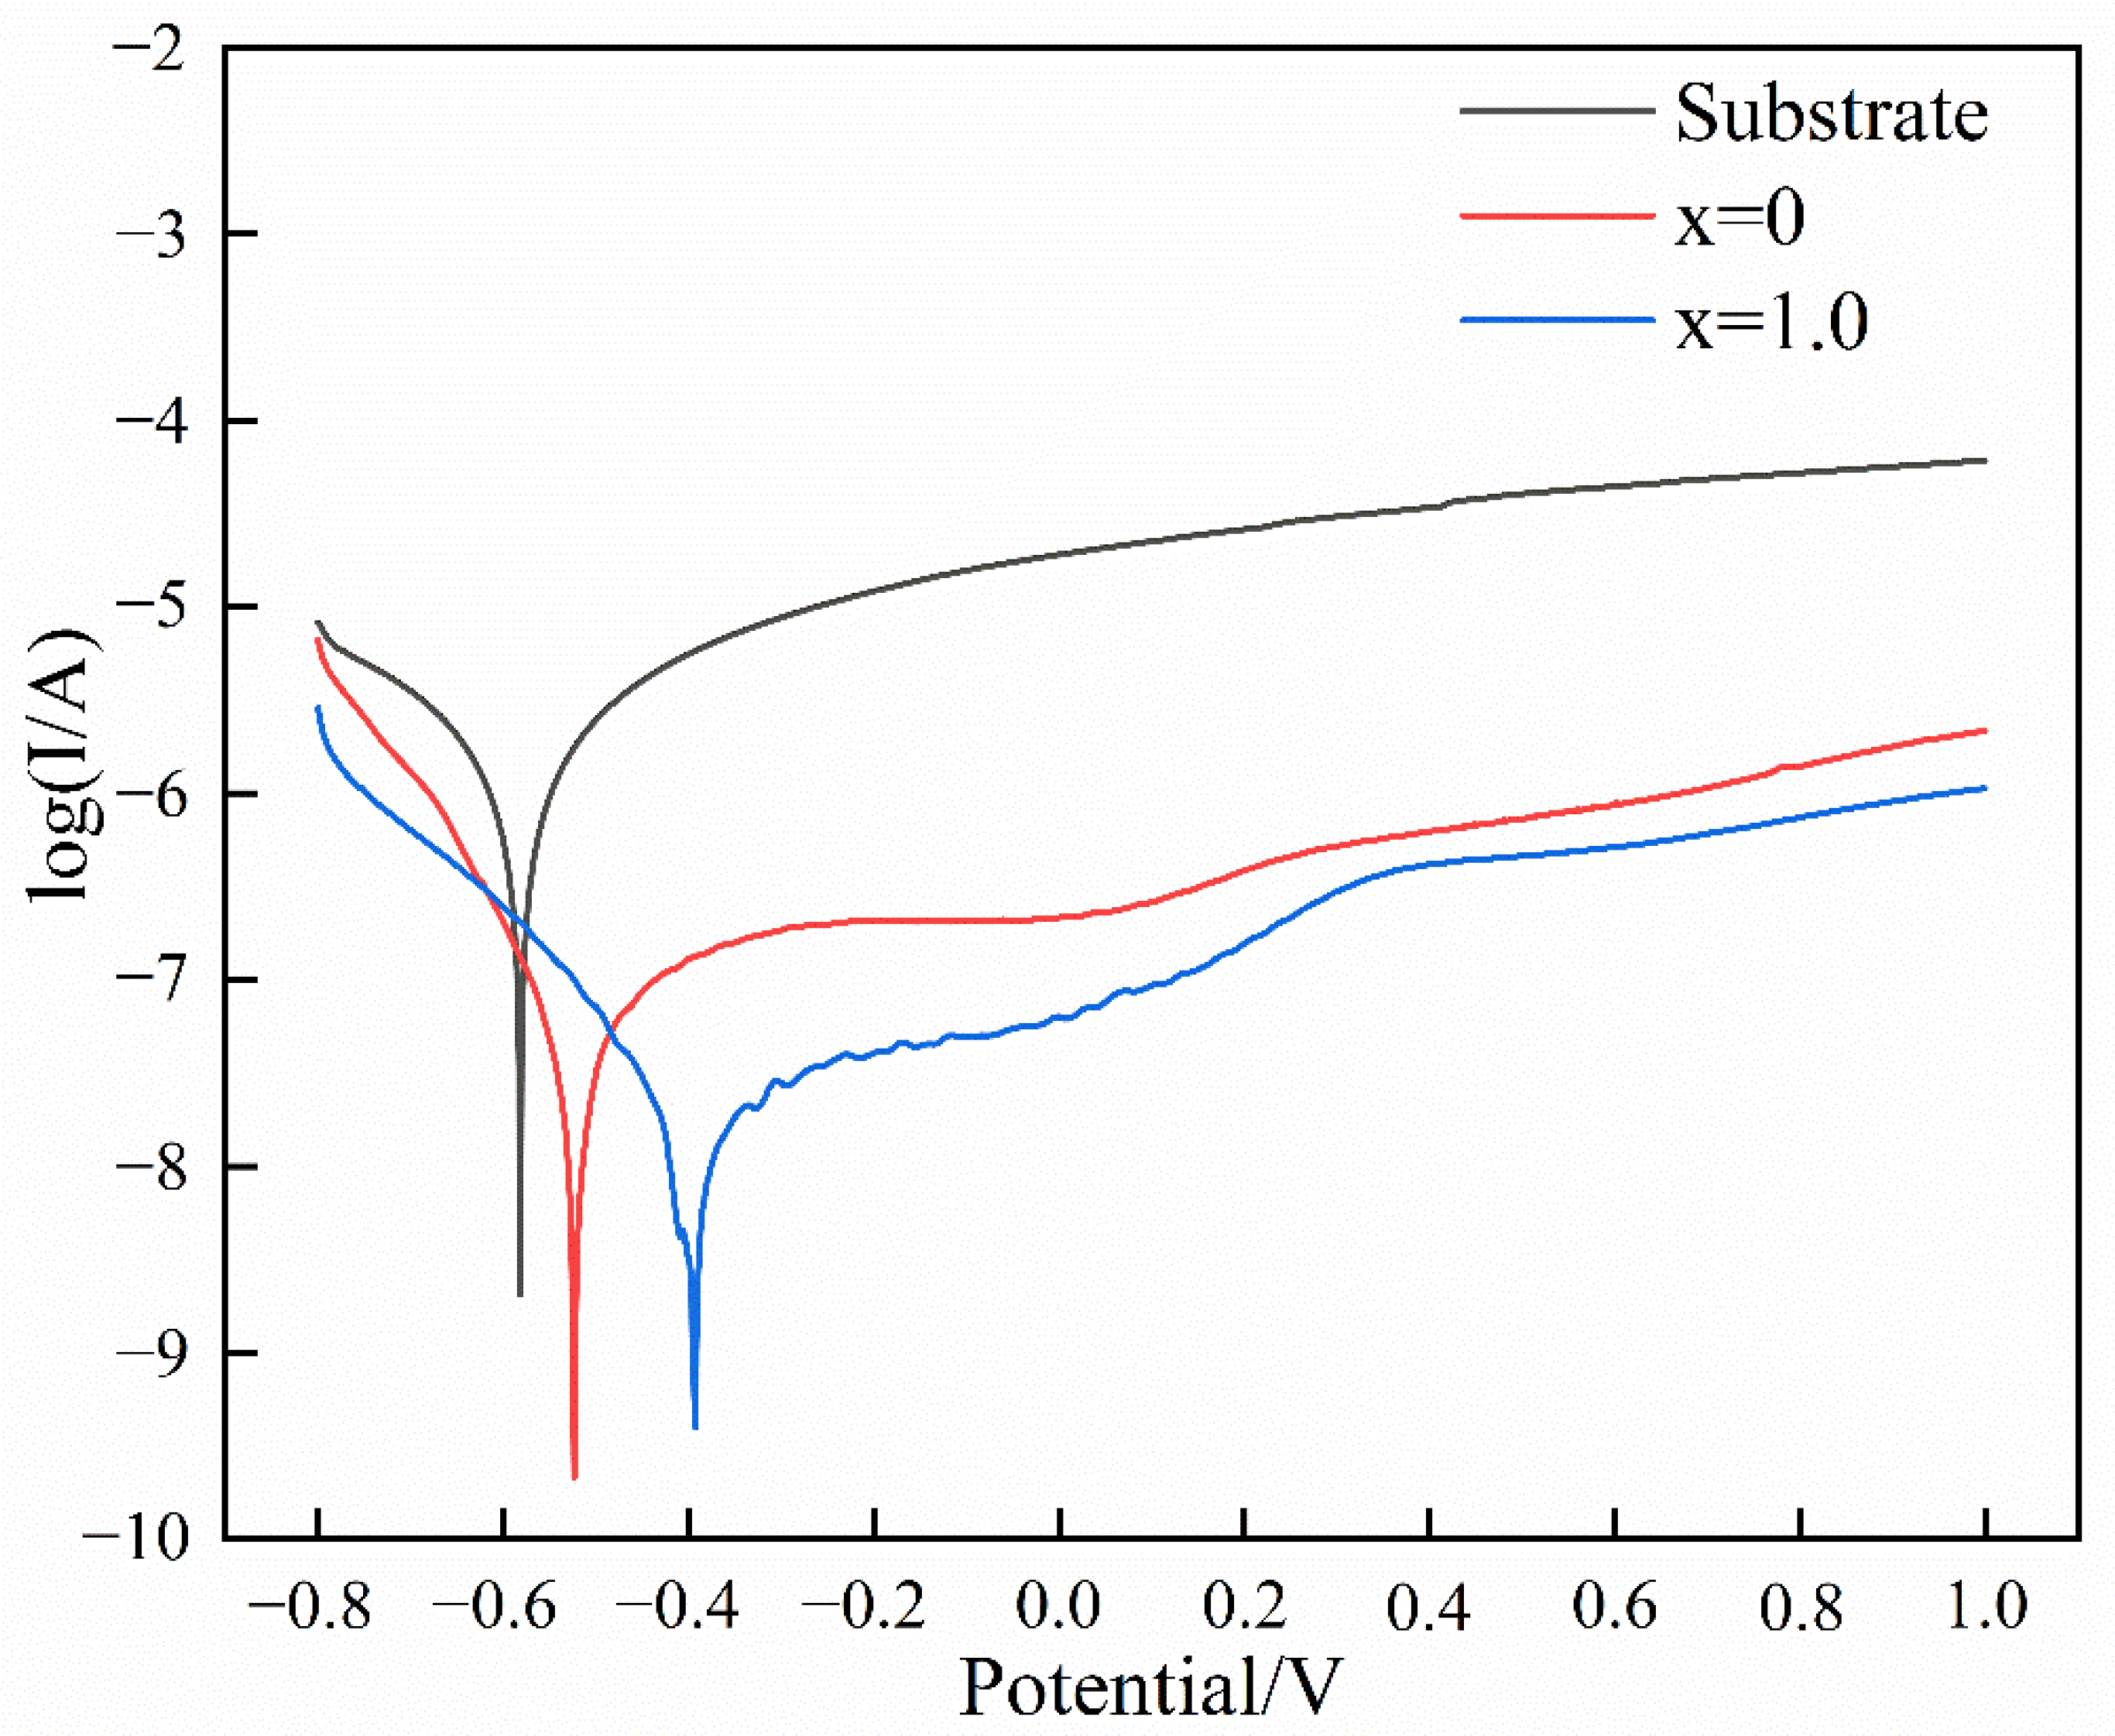
3.3. Corrosion Resistance

Potentiodynamic polarization curves were recorded on the substrate and the two coatings in the 3.5 wt.% NaCl solution (Figure 6). Some characteristic parameters in terms of Ecorr, icorr, Ea-s, and is can be obtained from the curves (Table 3). Ecorr, which refers to the corrosion potential, can be used to identify the corrosion tendency of the sample. When the sample comes in contact with a given material in a corrosion system, the sample with a more positive Ecorr is inclined to act as the anode, which will be effectively protected from corrosion. By contrast, oxidation reactions may occur on the sample, causing the sample to suffer from serious loss. As indicated in Table 3, the Ecorr of the substrate (−0.582 V) can be improved to a certain extent by laser cladding the CoCrFeNi or CoCrFeNiAl coatings onto it, showing that the corrosion tendency of the substrate is efficiently reduced. With regard to the coatings, their corrosion tendency can be further reduced by introducing Al into the cladding material because Ecorr is enhanced from −0.524 V to −0.393 V. With regard to icorr (corrosion current density), the value presents a downward tendency as follows: 6.620 × 10⁻⁶ A∙cm−2 (substrate), 2.249 × 10⁻⁷ A∙cm−2 (CoCrFeNi coating), and 1.260 × 10⁻⁷ A∙cm−2 (CoCrFeNiAl coating). The coatings exhibit a lower corrosion rate when compared with the substrate. In terms of the coatings, the introduction of Al can further reduce their corrosion rate by approximately 44%. The current sharply rises along with an increase in potential when the applied potential exceeds Ecorr, implying that the electrode is in an active state (metallic elements are subject to oxidation and dissolve into the electrolyte in the form of ions). When the potential reaches Ea-s, the current is increased very slowly with enhanced potential, finally tending toward an approximately constant value. This finding indicates that the electrode is transformed from an active state into a comparatively stable state due to the thin and dense oxidation film that formed on its surface. The difference between Ea-s and Ecorr can be applied to characterize the difficulty from the active state to the stable state, namely, the formation difficulty of the oxidation film. The calculated result shows that the oxidation film is formed most easily on the CoCrFeNiAl coating (0.161 V), followed by the CoCrFeNi coating (0.225 V), and then the substrate (0.512 V). is is defined as the current density in the stable state, and it can be used to evaluate the protective ability of the oxidation film. Evidently, the oxidation film that formed on the coatings can shield them from corrosion more efficiently than the film that formed on the substrate because the is value drops by approximately 2–3 orders of magnitude. The is value of the coating can be further reduced by approximately 75% by adding Al into the cladding material. On the basis of the preceding analyses, a conclusion can be easily drawn that the corrosion resistance of the substrate (Ti6Al4V) can be significantly improved by laser cladding the CoCrFeNiAl coating.
Camila et al. [47] prepared the CoCrFeNiAl high-entropy alloy by arc furnace melting and evaluated its corrosion behavior by potentiodynamic polarization in 3.5 wt.% NaCl solution at room temperature. The applied reference electrode and the counter electrode are identical to those used in this study. Ecorr and is are −0.319 V and 6.3 × 10⁻⁶ A∙cm−2. Peng et al. [48] used an arc melting method to prepare CoCrFeNiAl high-entropy alloy and also investigated its corrosion behaviors in the same system. Ecorr and icorr are −0.756 V and 7.462 × 10⁻⁶ A∙cm−2. In this study, Ecorr, is, and icorr are −0.393 V, 2.506 × 10⁻⁷ A∙cm−2, and 1.260 × 10⁻⁷ A∙cm−2. It is clear that the prepared alloy in this study presents more excellent corrosion resistance when compared with those mentioned above.
In order to investigate the stability of the passive film formed on the surfaces of three samples, Nyquist plots were recorded (Figure 7). The incomplete depressed semicircles can clearly be observed. The diameter of the semicircles is related to the charge transfer resistance, which is responsible for the stability of the passive film. The large diameter means that the passive film with high stability is formed and demonstrates strong resistance to charge transfer. Consequently, the sample shows excellent corrosion resistance. It can be concluded that the CoCrFeNiAl coating possesses the best corrosion resistance, followed by the CoCrFeNiAl and the substrate. The result is also in agreement with that obtained in the potentiodynamic polarization test.
The difference in corrosion resistance among the three is closely associated with the oxidation film, including its formation tendency, thickness, compactness, and inherent nature. Therefore, X-ray photoelectron spectroscopy (XPS) was performed to detect the chemical compositions and chemical valence states of the oxidation film formed on the CoCrFeNiAl coating, and thus, determine the corrosion mechanism of the three samples (Figure 8). Figure 8a show the survey spectrum of the surface of the CoCrFeNiAl coating, indicating that a thin oxidation film is formed due to the detected Al, Co, Cr, Fe, Ni, Ti, and O. The chemical valence states of these metallic elements can be further determined from the high-resolution narrow spectra (Figure 8b–g). For the Al element, a strong Al2p peak can clearly be detected at 74.19 eV (Figure 8b), confirming that Al exists in the form of Al2O3. Two strong peaks are observed at 780.52 eV and 795.98 eV in Figure 8c, while two weak satellite peaks appear at 785.96 eV and 803.71 eV, proving the presence of CoO. Figure 8d illustrate the Cr2p peak, which is composed of the Cr2p3/2 peak at 576.55 eV and the Cr2p1/2 peak at 586.14 eV. The two peaks confirm the synthesis of Cr2O3 during the electrochemical tests. For the Fe2p narrow spectrum (Figure 8e), the two weak peaks at 717.13 eV and 728.23 eV are related to the formation of FeO, while the two strong peaks at 710.91 eV and 723.22 eV are attributed to the existence of Fe2O3. The spectrum of Ni2p can be fitted into four peaks that contained a pair of Ni2p1/2 and Ni2p3/2 peaks at 856.05 eV and 873.31 eV and two corresponding satellite peaks at 861.77 eV and 879.72 eV (Figure 8f). They are highly consistent with the standard values of Ni in NiO. The Ti2p spectrum presents two strong peaks at 458.35 eV and 43.96 eV (Figure 8g), which originate from the synthesis of TiO2. Therefore, the thin film composed of Al2O3, CoO, Cr2O3, FeO, Fe2O3, NiO, and TiO2 is formed on the surface of the coating. These oxides are synthesized during the electrochemical tests by the following reactions:
4Al + 3O2 = 2Al2O3
2Co + O2 = 2CoO
4Cr + 3O2 = 2Cr2O3
2Fe + O2 = 2FeO
4Fe + 3O2 = 2Fe2O3
2Ni + O2 = 2NiO
Ti + O2 = TiO2
The change in the standard Gibbs free energy (ΔGθ) for the preceding reactions at room temperature (298 K) can be calculated as follows: −3163.88 KJ·mol−1 for Reaction (2), −430.37 KJ·mol−1 for Reaction (3), −2096.35 KJ·mol−1 for Reaction (4), −502.96 KJ·mol−1 for Reaction (5), −1487.28 KJ·mol−1 for Reaction (6), −424.90 KJ·mol−1 for Reaction (7), and −889.53 KJ·mol−1 for Reaction (8). Evidently, these reactions can occur spontaneously in thermodynamics because their ΔGθ values are negative. The reaction tendency exhibits a gradual declining trend as follows: Reaction (2) > Reaction (4) > Reaction (6) > Reaction (8) > Reaction (5) > Reaction (3) > Reaction (7). That is, the introduction of Cr and Fe into the cladding material promotes the formation of the oxidation film on the coatings more rapidly than that on the substrate. Moreover, adding Al to CoCrFeNi can further accelerate the formation of the oxidation film due to the most negative ΔGθ value of Reaction (2).
For the oxidation film, the ability to protect the coating from corrosion primarily depends on its compactness. The metallic elements in a thin layer of the sample’s surface will be transformed into the corresponding oxides during the electrochemical tests. Simultaneously, the volume of the thin layer will suffer from expansion or shrinkage. The volume change will be responsible for the compactness of the oxidation film. For a given oxidation reaction, AX + BO2 = CXmOn, the Pilling–Bedworth ratio (PBR) can be used to characterize the volume change of a given metal element (X) before and after oxidation. The PBR value can be calculated as follows [49]:
PBR = C ρ X Z X m O n A ρ X m O n Z X ,  
where A and C, respectively, represent the mole number of the metallic element ( X ) and the corresponding oxide ( X m O n ), ρ X and ρ X m O n denotes the density of X and X m O n , Z X and Z X m O n signify the atomic weight of X and the molecular weight of X m O n , and X and X m O n represent the reactant ( X ) and product ( X m O n ).
For Reactions (2)–(8), their PBR values are calculated as 1.46, 1.86, 2.02, 1.77, 2.14, 1.66, and 1.77, indicating that the thin layer of the sample undergoes volume expansion and efficiently inhibits the invasion of O into the sample below it. Compared with the substrate, three metallic elements (Co, Cr, and Fe) introduced into the cladding material significantly enhance the compactness of the oxidation film due to their higher PBR values than those of Ti and Al in the substrate. Consequently, the is recorded on the CoCrFeNi coating is smaller than that of the substrate. The high PBR value can increase the compactness of the oxidation film. However, the internal stress generated inside the oxidation film will be correspondingly enhanced. Some fine cracks may initiate and propagate, resulting in a portion of the sample being re-exposed to the electrolyte and subject to corrosion. When Al is introduced into the CoCrFeNi cladding material, the cracking susceptibility of the oxidation film formed on the coating is reduced due to the low PBR value of Al. Therefore, the coating with Al has lower is than that without Al.

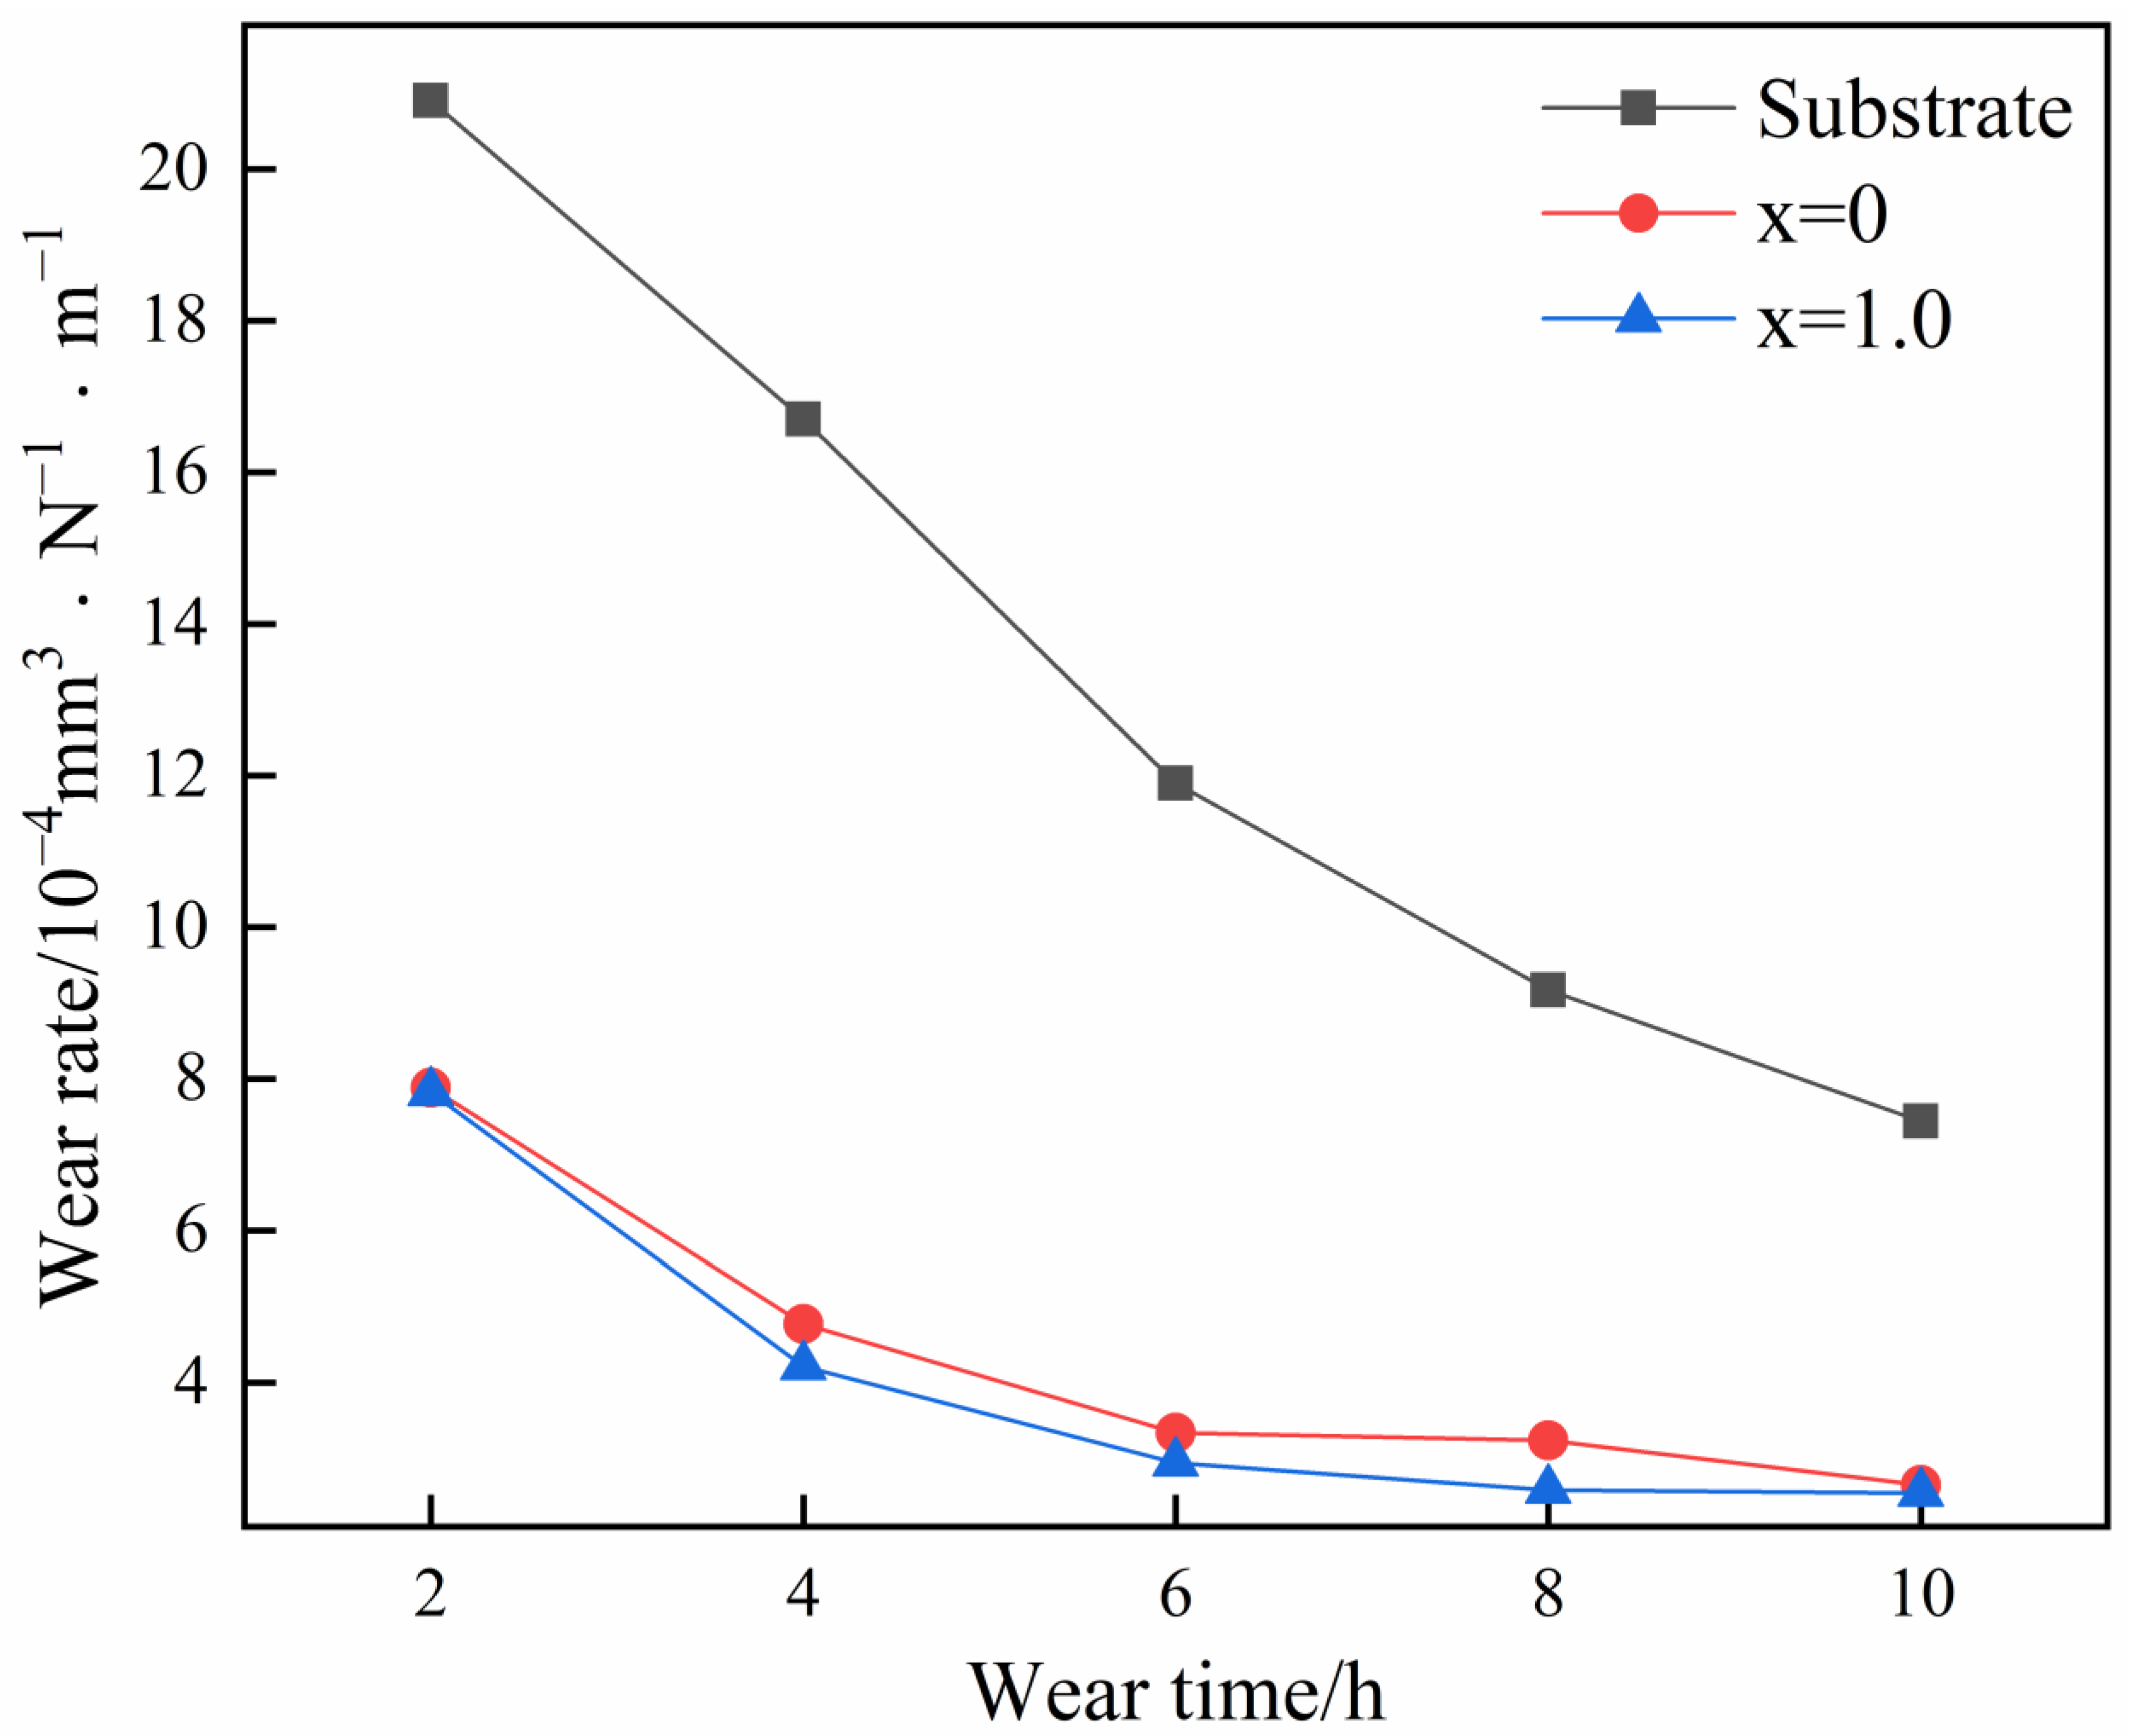
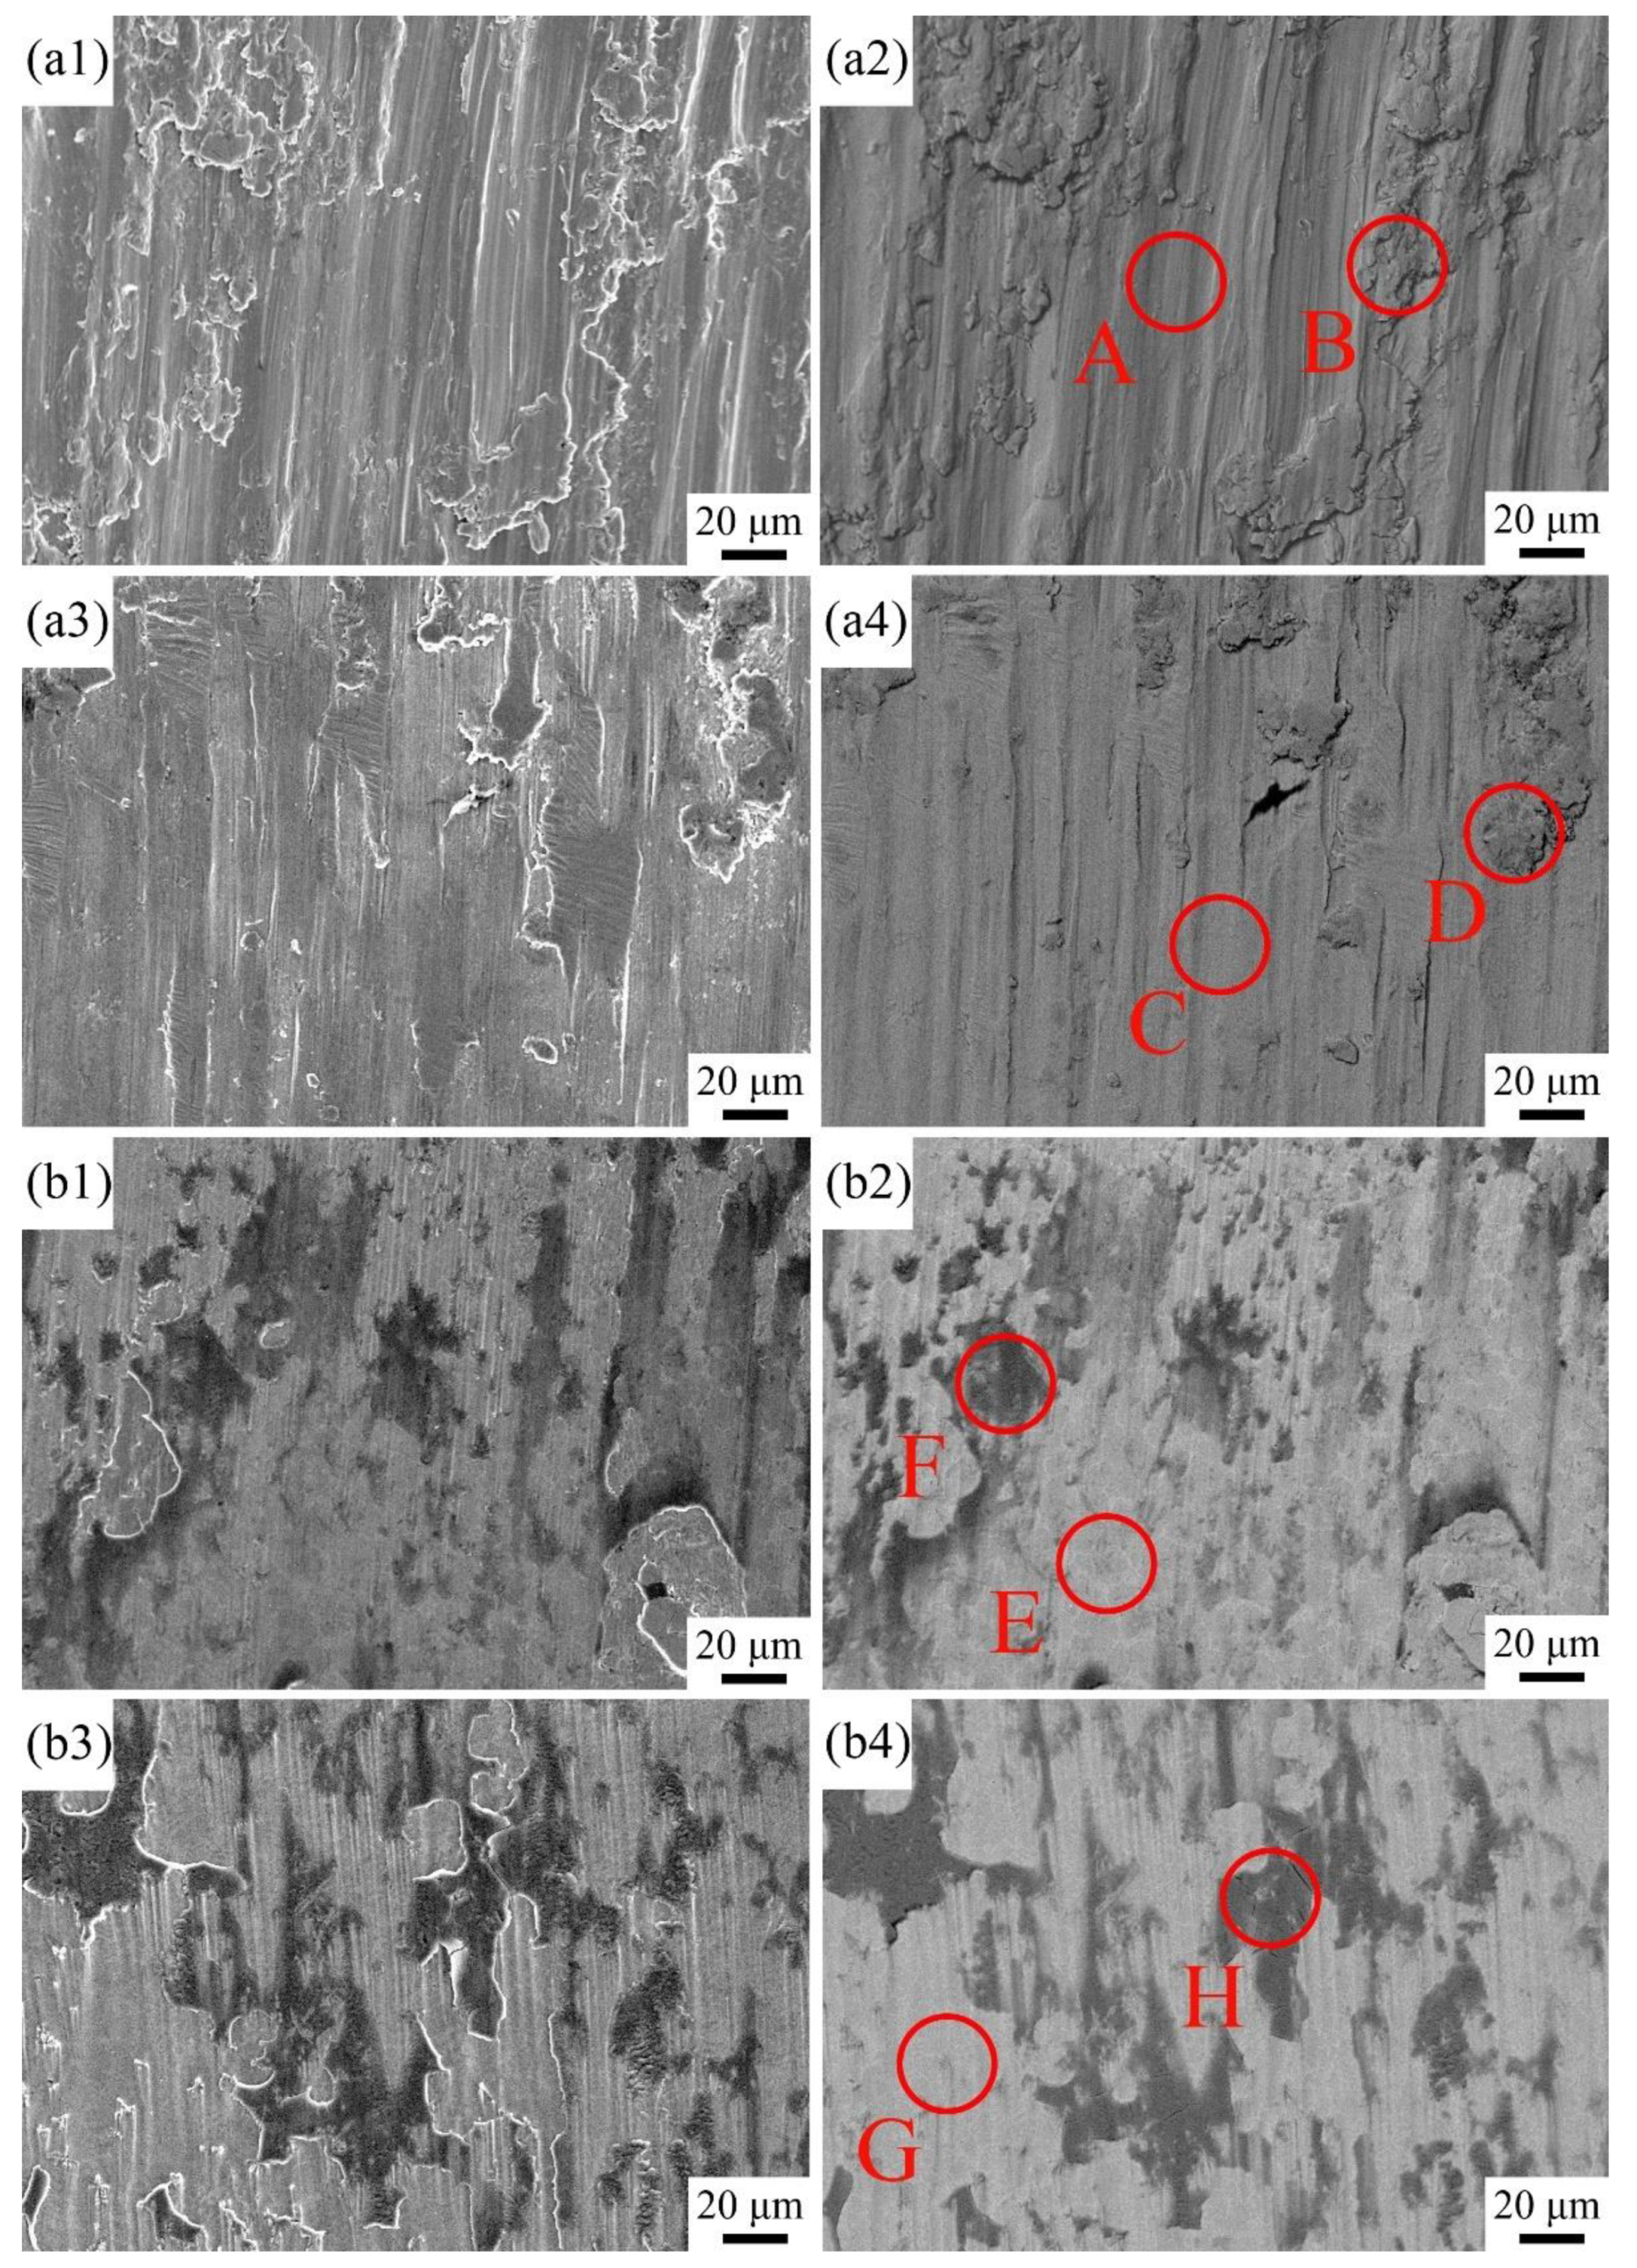
3.4. Corrosion Wear Resistance

Figure 9 show the change in the friction coefficient of the samples with sliding time in the 3.5 wt.% NaCl solution. Two stages can be clearly identified, namely, the initial and stable wear stages. The friction coefficient exhibits an upward tendency in the former but is maintained at a relatively stable level in the latter. The friction coefficient of the substrate fluctuates drastically with sliding time and presents a higher average value of approximately 0.82 when compared with that of the coatings (0.63 in average value). This result indicates that the coatings exhibit a better anti-friction effect, contributing to the improvement in wear resistance. The phenomenon is mostly associated with the difference in microhardness between the substrate and the coatings. With respect to the substrate with low hardness (340 HV0.2), protrusions on the counterpart can be easily impressed onto its surface, considerably enhancing sliding resistance due to a significant increase in the contact area between the two. In accordance with the formula f = μ N , the friction coefficient is correspondingly improved for a given applied load. The sharp protrusions will produce microcutting on the substrate surface, and the blunt protrusions may cause different levels of plastic deformation of the microzones. The substrate surface is in a considerably unstable state, causing a drastic change in friction coefficient with sliding time. The hardness of the coatings is significantly improved by approximately 110% (713 HV0.2) compared with that of the substrate (340 HV0.2), implying that their resistance to plastic deformation and microcutting is also considerably increased. A clear examination shows that the introduction of Al can reduce the average friction coefficient from 0.695 to 0.578. Such reduction should be attributed to the improvement in microstructural uniformity.
The wear profiles of the samples subject to wear at 2, 4, 6, 8, and 10 h are presented in Figure 10. On the basis of the wear volume obtained from Figure 10, the wear rate (Table 4) is further calculated using Formula (1). The relationship between wear rate and sliding time is clearly illustrated in Figure 11. With regard to the substrate, the wear rate exhibits an approximately linear reduction tendency with sliding time. The wear rate is reduced from 2.09 × 10⁻³ mm3·N−1·m−1 for the initial 2 h to 7.44 × 10⁻⁴ mm3·N−1·m−1 for 10 h, implying that the substrate is in a break-in state. For the two coatings, their average wear rates (7.85 × 10⁻⁴ mm3·N−1·m−1 for the initial 2 h to 2.60 × 10⁻⁴ mm3·N−1·m−1 for 10 h) are considerably reduced by approximately 62.4% and 65.1% compared with those of the substrate at the same sliding time. Moreover, the reduction in wear rate is significantly slowed down when sliding time exceeds 4 h, and the value is maintained at a comparatively stable level of 2.88 × 10⁻⁴ mm3·N−1·m−1 along with prolonging sliding time, indicating that the coatings have transitioned into the stable wear stage. The change in wear rate with sliding time is extremely similar for the two coatings, and a slight reduction in wear rate occurs when introducing Al (Δwear rate = 0.2 × 10⁻⁴ mm3·N−1·m−1). The results indicate that hard coatings can shield the soft substrate from serious wear and facilitate its rapid transition into the stable wear state. The introduction of Al can improve the wear resistance of the coating to a certain extent.
The wear resistance of the CoCrFeNiAl high-entropy alloy reported in Ref. [48] was also investigated. The alloy demonstrated excellent wear resistance because of its low wear rate (0.99 × 10⁻⁴ mm3·N−1·m−1), which was approximately 39% that in this study (2.54 × 10⁻⁴ mm3·N−1·m−1). The reason for this is as follows: the adapted counterpart in Ref. [48] is the GCr15 ball, which possesses a lower hardness than the YG6 tungsten steel ball applied in this study. The low hardness produces weak microcutting on the testing sample, causing low wear loss. On the other hand, the wear test in Ref. [48] was performed in air, but this was carried out in the corrosion circumstance. The studies showed that the material loss under the mechanical–chemical interaction was much higher than that under the purely mechanical action [50]. The above two factors result in the difference in wear rate reported in Ref. [48] and this study.
Figure 12 show the wear morphologies of the samples. The wear surface of the substrate subject to wear for 2 h is extremely rough (Figure 12(a1,a2)), and a large number of grooves (Zone A) parallel to the sliding direction can be clearly observed. The occurrence of these patterns is mostly attributed to the mechanical action from the counterpart. The sharp protrusions on the counterpart’s surface at the given load may produce the microcutting effect on the substrate, and the blunt protrusions may cause the plastic deformation of the substrate during the subsequent relative motion, leaving long and irregular groove-like patterns. Microcutting directly causes wear loss of the substrate. In addition, some irregular blocky substances with white edges can be observed as tightly adhering to the wear surface. These should be the debonding debris particles undergoing crushing. EDS was performed to analyze the chemical compositions in the two zones, i.e., Zones A and B in Figure 12(a2). Their chemical compositions are similar to those of the substrate (Table 5), demonstrating that the debris particles (Zone B) primarily originate from the debonding substrate. A small amount of O was detected in the two zones, indicating that they are partially oxidated during sliding. The O content in Zone B is higher than that in Zone A, and such finding is associated with the larger contact surface area of debris particles with O. When wear time was prolonged to 10 h, the wear surface of the substrate becomes smoother, and the involved O content in Zones C and D is increased by approximately 2–2.5 times compared with that in Zones A and B. Therefore, the oxidation of the wear surface is aggravated by prolonging sliding time, resulting in the higher volume fraction of formed metallic oxides with high hardness. Moreover, long-term sliding will produce a strong strain hardening effect on the wear surface, further improving surface hardness. The combination of the two effects improves the resistance of the substrate to microcutting, obtaining a smoother wear morphology and a lower wear rate. The wear mechanism can be identified as serious microcutting and slight oxidation for short-term wear (2 h), and it is changed into slight microcutting and serious oxidation for long-term wear (10 h). For the coating subject to short-term wear (2 h), the wear surface is extremely smooth (Figure 12(b1,b2)), on which a small number of fine grooves and some black fixtures are observed. A thorough inspection reveals that a portion of the fixtures brittlely debonded from an integral part, leaving the debonding pits with irregular edges. The elements involved in Zones E and F are similar to those in the coating (Table 5); however, the O content in Zone F is higher than that in Zone E. This condition indicates that the black fixtures (Zone F) should be the debris particles falling from the coating. The debris particles suffering from serious oxidation are crushed into the film, tightly adhering onto the wear surface. Some cracks may initiate and propagate in the oxidation film with high hardness subject to repeated load during the reciprocating sliding due to poor plastic deformation. Consequently, a portion of the oxidation film may fall off, and bonding pits are formed. When sliding time is prolonged to 10 h, the wear surface of the coating undergoes more serious oxidation because Zones G and H have higher O content than Zones E and F. Moreover, the area fraction of debonding pits exhibit a significant increase. Therefore, the wear mechanism can be determined as a combination of slight microcutting, moderate oxidation, and slight brittle debonding for the coating subject to short-term wear (2 h). It is changed into a combination of slight microcutting, serious oxidation, and moderate brittle debonding with prolonged sliding time (10 h).

4. Conclusions

The major conclusions that can be drawn from the conducted research are as follows.
(1)
CoCrFeNiAlx HEA coatings (x = 0 and 1.0) were fabricated on Ti6Al4V via laser cladding. Primary α(Ti), α(Ti) + Ti2Ni eutectics and TiC dendrites were synthesized. The introduction of Al improved microstructural uniformity by reducing the area fraction of the eutectics and refining TiC dendrites.
(2)
The coatings exhibited more outstanding corrosion resistance than the substrate in the 3.5 wt.% NaCl solution due to their lower corrosion potential, corrosion current density, and current density in the stable stage. The introduction of Al accelerated the formation of the oxidation film and reduced its cracking susceptibility, further improving corrosion resistance.
(3)
The coatings demonstrated a lower wear rate than the substrate at different wear times in the 3.5 wt.% NaCl solution, transitioning more rapidly into the stable wear stage. The introduction of Al reduced the wear rate in stable wear to a certain extent (2.07 × 10⁻⁴ mm3·N−1·m−1 for the coating with Al and 2.68 × 10⁻⁴ mm3·N−1·m−1 for the coating without Al).

Author Contributions

W.L.: Investigation, Experiment, Formal analysis, Writing—original draft. J.L.: Resources, Supervision, Methodology. Y.X.: Experiment, Formal analysis, Validation. All authors have read and agreed to the published version of the manuscript.

Funding

This work was financially supported by the National Natural Science Foundation of China (51471105) and the Natural Science Foundation of Shanghai (20ZR1422200).

Data Availability Statement

Not applicated.

Conflicts of Interest

We declare that we do not have any commercial or associative interest that represents a conflict of interest in connection with the work submitted.

References

  1. Lv, Y.H.; Li, J.; Tao, Y.F.; Hu, L.F. Oxidation behaviors of the TiNi/Ti2Ni matrix composite coatings with different contents of TaC addition fabricated on Ti6Al4V by laser cladding. J. Alloys Compd. 2016, 679, 202–212. [Google Scholar] [CrossRef]
  2. Obadele, B.A.; Olubambi, P.A.; Andrews, A.; Pityana, S.; Mathew, M.T. Electrochemical behaviour of laser-clad Ti6Al4V with CP Ti in 0.1 M oxalic acid solution. J. Alloys Compd. 2015, 646, 753–759. [Google Scholar] [CrossRef]
  3. Zakerin, N.; Morshed-Behbahani, K. Perspective on the passivity of Ti6Al4V alloy in H2SO4 and NaOH solutions. J. Mol. Liq. 2021, 333, 115947. [Google Scholar] [CrossRef]
  4. He, Y.; Xiao, H.; Gan, W.; Yu, Q.; Yin, F. The Electrochemical Dissolution Behavior Research of Titanium Alloy under Different Electrolyte. Procedia CIRP 2018, 68, 751–756. [Google Scholar] [CrossRef]
  5. Chen, J.; Zhang, Q.; Li, Q.-A.; Fu, S.-L.; Wang, J.-Z. Corrosion and tribocorrosion behaviors of AISI 316 stainless steel and Ti6Al4V alloys in artificial seawater. Trans. Nonferrous Met. Soc. China 2014, 24, 1022–1031. [Google Scholar] [CrossRef]
  6. Zhou, Y.; Yang, F.; Shao, Y.; Lu, B.; Lu, T.; Guo, Z. Electrochemical Corrosion Behavior of Powder Metallurgy Ti6Al4V Alloy. J. Mater. Eng. Perform. 2020, 30, 556–564. [Google Scholar] [CrossRef]
  7. Hu, S.; Li, T.; Su, Z.; Liu, D. Research on suitable strength, elastic modulus and abrasion resistance of Ti–Zr–Nb medium entropy alloys (MEAs) for implant adaptation. Intermetallics 2022, 140, 107401. [Google Scholar] [CrossRef]
  8. Jin, G.; Cai, Z.; Guan, Y.; Cui, X.; Liu, Z.; Li, Y.; Dong, M.; Zhang, D. High temperature wear performance of laser-cladded FeNiCoAlCu high-entropy alloy coating. Appl. Surf. Sci. 2018, 445, 113–122. [Google Scholar] [CrossRef]
  9. Liu, D.; Ma, Z.; Zhang, W.; Huang, B.; Zhao, H.; Ren, L. Superior antiwear biomimetic artificial joint based on high-entropy alloy coating on porous Ti6Al4V. Tribol. Int. 2021, 158, 106937. [Google Scholar] [CrossRef]
  10. Motallebzadeh, A.; Peighambardoust, N.S.; Sheikh, S.; Murakami, H.; Guo, S.; Canadinc, D. Microstructural, mechanical and electrochemical characterization of TiZrTaHfNb and Ti1.5ZrTa0.5Hf0.5Nb0.5 refractory high-entropy alloys for biomedical applications. Intermetallics 2019, 113, 106572. [Google Scholar] [CrossRef]
  11. Siddiqui, A.A.; Dubey, A.K. Recent trends in laser cladding and surface alloying. Opt. Laser Technol. 2021, 134, 106619. [Google Scholar] [CrossRef]
  12. Seo, J.-W.; Kim, J.C.; Kwon, S.-J.; Jun, H.-K. Effects of Laser Cladding for Repairing and Improving Wear of Rails. Int. J. Precis. Eng. Manuf. 2019, 20, 1207–1217. [Google Scholar] [CrossRef]
  13. Wang, Q.; Shi, J.; Zhang, L.; Tsutsumi, S.; Feng, J.; Ma, N. Impacts of laser cladding residual stress and material properties of functionally graded layers on titanium alloy sheet. Addit. Manuf. 2020, 35, 101303. [Google Scholar] [CrossRef]
  14. Kolodziejczak, P.; Golanski, D.; Chmielewski, T.; Chmielewski, M. Microstructure of Rhenium Doped Ni-Cr Deposits Produced by Laser Cladding. Materials 2021, 14, 2745. [Google Scholar] [CrossRef]
  15. Lin, Y.; Yao, J.; Lei, Y.; Fu, H.; Wang, L. Microstructure and properties of TiB2 –TiB reinforced titanium matrix composite coating by laser cladding. Opt. Lasers Eng. 2016, 86, 216–227. [Google Scholar] [CrossRef]
  16. Wang, W.F.; Jin, L.S.; Yang, J.G.; Sun, F.J. Directional growth whisker reinforced Ti-base composites fabricated by laser cladding. Surf. Coat. Technol. 2013, 236, 45–51. [Google Scholar] [CrossRef]
  17. Mahamood, R.M.; Akinlabi, E.T. Effect of the Scanning Speed of Treatment on the Microstructure, Microhardness, Wear, and Corrosion Behavior of Laser Metal-Deposited Ti–6AL–4V/TiC Composite. Mater. Sci. 2017, 53, 76–85. [Google Scholar] [CrossRef]
  18. Zhang, T.G.; Zhuang, H.F.; Zhang, Q.; Yao, B.; Yang, F. Influence of Y2O3 on the microstructure and tribological properties of Ti-based wear-resistant laser-clad layers on TC4 alloy. Ceram. Int. 2020, 46, 13711–13723. [Google Scholar] [CrossRef]
  19. Yanan, L.; Ronglu, S.; Wei, N.; Tiangang, Z.; Yiwen, L. Effects of CeO2 on microstructure and properties of TiC/Ti2Ni reinforced Ti-based laser cladding composite coatings. Opt. Lasers Eng. 2019, 120, 84–94. [Google Scholar] [CrossRef]
  20. Li, N.; Xiong, Y.; Xiong, H.; Shi, G.; Blackburn, J.; Liu, W.; Qin, R. Microstructure, formation mechanism and property characterization of Ti + SiC laser cladded coatings on Ti6Al4V alloy. Mater. Charact. 2019, 148, 43–51. [Google Scholar] [CrossRef]
  21. Weng, F.; Yu, H.; Chen, C.; Liu, J.; Zhao, L.; Dai, J. Fabrication of Co-Based Coatings on Titanium Alloy by Laser Cladding with CeO2 Addition. Mater. Manuf. Processes 2016, 31, 1461–1467. [Google Scholar] [CrossRef]
  22. Weng, F.; Yu, H.; Chen, C.; Liu, J.; Zhao, L. Microstructures and properties of TiN reinforced Co-based composite coatings modified with Y2O3 by laser cladding on Ti–6Al–4V alloy. J. Alloys Compd. 2015, 650, 178–184. [Google Scholar] [CrossRef]
  23. Li, W.; Xu, P.; Wang, Y.; Zou, Y.; Gong, H.; Lu, F. Laser synthesis and microstructure of micro- and nano-structured WC reinforced Co-based cladding layers on titanium alloy. J. Alloys Compd. 2018, 749, 10–22. [Google Scholar] [CrossRef]
  24. Weng, F.; Yu, H.; Liu, J.; Chen, C.; Dai, J.; Zhao, Z. Microstructure and wear property of the Ti5Si3/TiC reinforced Co-based coatings fabricated by laser cladding on Ti-6Al-4V. Opt. Laser Technol. 2017, 92, 156–162. [Google Scholar] [CrossRef]
  25. Wu, F.; Chen, T.; Wang, H.; Liu, D. Effect of Mo on Microstructures and Wear Properties of In Situ Synthesized Ti(C,N)/Ni-Based Composite Coatings by Laser Cladding. Materials 2017, 10, 1047. [Google Scholar] [CrossRef] [PubMed] [Green Version]
  26. Bai, L.L.; Li, J.; Chen, J.L.; Song, R.; Shao, J.Z.; Qu, C.C. Effect of the heat treatment time on microstructure and fracture toughness of laser-clad TiB2-TiC pseudoeutectic reinforced TiNi/Ti2Ni intermetallic matrix composite coating. Metall. Res. Technol. 2016, 113, 304. [Google Scholar] [CrossRef]
  27. Liu, K.; Yan, H.; Zhang, P.; Zhao, J.; Yu, Z.; Lu, Q. Wear Behaviors of TiN/WS2 + hBN/NiCrBSi Self-Lubricating Composite Coatings on TC4 Alloy by Laser Cladding. Coatings 2020, 10, 747. [Google Scholar] [CrossRef]
  28. Kumar, S.; Mandal, A.; Das, A.K.; Dixit, A.R. Parametric study and characterization of AlN-Ni-Ti6Al4V composite cladding on titanium alloy. Surf. Coat. Technol. 2018, 349, 37–49. [Google Scholar] [CrossRef]
  29. Li, W.G.; Li, J.; Xu, Y.S. Optimization of Corrosion Wear Resistance of the NiCrBSi Laser-Clad Coatings Fabricated on Ti6Al4V. Coatings 2021, 11, 960. [Google Scholar] [CrossRef]
  30. Qu, C.C.; Li, J.; Bai, L.L.; Shao, J.Z.; Song, R.; Chen, J.L. Effects of the thickness of the pre-placed layer on microstructural evolution and mechanical properties of the laser-clad coatings. J. Alloys Compd. 2015, 644, 450–463. [Google Scholar] [CrossRef]
  31. Li, M.; Huang, J.; Zhu, Y.Y.; Li, Z.G. Effect of heat input on the microstructure of in-situ synthesized TiN–TiB/Ti based composite coating by laser cladding. Surf. Coat. Technol. 2012, 206, 4021–4026. [Google Scholar] [CrossRef]
  32. Yeh, J.W.; Chen, S.K.; Lin, S.J.; Gan, J.Y.; Chin, T.S.; Shun, T.T.; Tsau, C.H.; Chang, S.Y. Nanostructured High-Entropy Alloys with Multiple Principal Elements: Novel Alloy Design Concepts and Outcomes. Adv. Eng. Mater. 2004, 6, 299–303. [Google Scholar] [CrossRef]
  33. Cantor, B.; Chang, I.T.H.; Knight, P.; Vincent, A.J.B. Microstructural development in equiatomic multicomponent alloys. Mater. Sci. Eng. A 2004, 375–377, 213–218. [Google Scholar] [CrossRef]
  34. Chew, Y.; Bi, G.J.; Zhu, Z.G.; Ng, F.L.; Weng, F.; Liu, S.B.; Nai, S.M.L.; Lee, B.Y. Microstructure and enhanced strength of laser aided additive manufactured CoCrFeNiMn high entropy alloy. Mater. Sci. Eng. A 2019, 744, 137–144. [Google Scholar] [CrossRef]
  35. Lee, C.; Song, G.; Gao, M.C.; Feng, R.; Chen, P.; Brechtl, J.; Chen, Y.; An, K.; Guo, W.; Poplawsky, J.D.; et al. Lattice distortion in a strong and ductile refractory high-entropy alloy. Acta Mater. 2018, 160, 158–172. [Google Scholar] [CrossRef]
  36. Li, R.; Niu, P.; Yuan, T.; Cao, P.; Chen, C.; Zhou, K. Selective laser melting of an equiatomic CoCrFeMnNi high-entropy alloy: Processability, non-equilibrium microstructure and mechanical property. J. Alloys Compd. 2018, 746, 125–134. [Google Scholar] [CrossRef]
  37. Zhao, P.; Li, J.; Zhang, Y.; Li, X.; Xia, M.M.; Yuan, B.G. Wear and high-temperature oxidation resistances of AlNbTaZrx high-entropy alloys coatings fabricated on Ti6Al4V by laser cladding. J. Alloys Compd. 2021, 862, 158405. [Google Scholar] [CrossRef]
  38. Huang, C.; Zhang, Y.; Vilar, R.; Shen, J. Dry sliding wear behavior of laser clad TiVCrAlSi high entropy alloy coatings on Ti–6Al–4V substrate. Mater. Des. 2012, 41, 338–343. [Google Scholar] [CrossRef]
  39. Wang, L.; Gao, Z.; Wu, M.; Weng, F.; Liu, T.; Zhan, X. Influence of Specific Energy on Microstructure and Properties of Laser Cladded FeCoCrNi High Entropy Alloy. Metals 2020, 10, 1464. [Google Scholar] [CrossRef]
  40. Juan, Y.; Li, J.; Jiang, Y.; Jia, W.; Lu, Z. Wear-resistant single-phase high-entropy alloy coatings prepared on Ti6Al4V with laser cladding. Mater. Tehnol. 2019, 53, 751–758. [Google Scholar] [CrossRef]
  41. Zhang, Y.; Li, J.; Jiang, Y.; Kang, D.; Juan, Y.; Lu, Z. Investigation into corrosion and wear behaviors of laser-clad coatings on Ti6Al4V. Mater. Res. Express 2020, 7, 016587. [Google Scholar] [CrossRef]
  42. Park, B.J.; Chang, H.J.; Kim, D.H.; Kim, W.T. In situ formation of two amorphous phases by liquid phase separation in Y–Ti–Al–Co alloy. Appl. Phys. Lett. 2004, 85, 6353–6355. [Google Scholar] [CrossRef]
  43. Yang, X.; Zhang, Y. Prediction of high-entropy stabilized solid-solution in multi-component alloys. Mater. Chem. Physics 2012, 132, 233–238. [Google Scholar] [CrossRef]
  44. Akira, T.; Inoue, A. Classification of Bulk Metallic Glasses by Atomic Size Difference, Heat of Mixing and Period of Constituent Elements and Its Application to Characterization of the Main Alloying Element. Mater. Trans. 2005, 46, 2817–2829. [Google Scholar] [CrossRef] [Green Version]
  45. Gharahshiran, M.R.K.; Khoshakhlagh, A.; Khalaj, G.; Bakhtiari, H.; Banihashemi, A.R. Effect of postweld heat treatment on interface microstructure and metallurgical properties of explosively welded bronze—carbon steel. J. Cent. South Univ. 2018, 25, 1849–1861. [Google Scholar] [CrossRef]
  46. Shim, S.H.; Pouraliakbar, H.; Hong, S.I. Hierarchical structured as-cast CrFeNiMn0.5Cu0.5 high entropy alloy with excellent tensile strength/ductility properties. Scr. Mater. 2022, 210, 114473. [Google Scholar] [CrossRef]
  47. Nascimento, C.B.; Donatus, U.; Ríos, C.T.; Antunes, R.A. Electronic properties of the passive films formed on CoCrFeNi and CoCrFeNiAl high entropy alloys in sodium chloride solution. J. Mater. Res. Technol. 2020, 9, 13879–13892. [Google Scholar] [CrossRef]
  48. Lyu, P.; Gao, Q.; Peng, T.; Yuan, H.; Guan, Q.; Cai, J.; Liu, H.; Liu, X. Microstructure and properties of CoCrFeNiAlx (x = 0.1, 0.5, 1) high-entropy alloys enhanced by laser surface remelting. Mater. Charact. 2022, 185, 111717. [Google Scholar] [CrossRef]
  49. Rashid, R.A.R.; Abaspour, S.; Palanisamy, S.; Matthews, N.; Dargusch, M.S. Metallurgical and geometrical charac-terisation of the 316L stainless steel clad deposited on a mild steel substrate. Surf. Coat. Technol. 2017, 327, 174–184. [Google Scholar] [CrossRef]
  50. Gao, P.; He, D.Q.; Zheng, S.X.; Pu, J.B.; Guo, F. In situ study on friction-corrosion interaction of carbon-based and nitride-based coatings. J. Tribol. 2015, 35, 138–146. [Google Scholar] [CrossRef]
Figure 1. The schematic diagram of the three-electrode system.
Metals 12 00460 g001
Figure 2. XRD patterns of the coatings.
Metals 12 00460 g002
Figure 3. The cross-sectional macromorphologies and the elemental distribution along the depth direction of the coatings: (a1,a2) without Al; (b1,b2) with Al.
Metals 12 00460 g003
Figure 4. The morphology of the interface in the CoCrFeNiAl coating.
Metals 12 00460 g004
Figure 5. SEM and BSE images of the microstructure of the coatings: (a1a3) coating without Al and (b1b3) coating with Al.
Metals 12 00460 g005
Figure 6. Polarization curves of the samples in the 3.5 wt.% NaCl solution.
Metals 12 00460 g006
Figure 7. Nyquist plots recorded on the samples in the 3.5 wt.% NaCl solution.
Metals 12 00460 g007
Figure 8. Fitting results of the peaks of (a) survey spectrum, (b) Al2p, (c) Co2p, (d) Cr2p, (e) Fe2p, (f) Ni2p, and (g) Ti2p recorded on the CoCrFeNiAl coating subject to the corrosion tests.
Metals 12 00460 g008
Figure 9. Variation of the friction coefficient of the samples with sliding time.
Metals 12 00460 g009
Figure 10. Wear profiles of the samples: (a) 2, (b) 4, (c) 6, (d) 8, and (e) 10 h.
Metals 12 00460 g010
Figure 11. Change in wear rate of the samples with wear time.
Metals 12 00460 g011
Figure 12. SEM and BSE images of the wear morphologies of the samples: the substrate of (a1,a2) for 2 h and (a3,a4) for 10 h; the CoCrFeNiAl coating of (b1,b2) for 2 h and (b3,b4) for 10 h.
Metals 12 00460 g012
Table 1. The mixing enthalpy (ΔHmix, KJ·mol−1) for each pair of elements adapted from [44].
ΔHmixTiCoCrFeNiAlC
Ti-------
Co−28------
Cr−7−4-----
Fe−17−1−1----
Ni−350−7−2---
Al−30−19−10−11−22--
C−109−42−61−50−39−39-
Table 2. EDS analyses of chemical compositions (at.%) for the marked zones are shown in Figure 5.
CoatingsMarked ZonesElements
TiCCoCrFeNiAl
CoCrFeNiA62.612.614.649.035.463.6911.95
B60.951.685.266.855.1313.536.60
C49.931.4410.513.926.8718.468.87
D72.4311.363.452.253.033.414.07
CoCrFeNiAlE60.291.493.786.084.113.8420.42
F54.711.167.394.966.787.3917.37
G76.9411.621.761.041.422.185.04
Table 3. Electrochemical parameters obtained from Figure 6.
SamplesEcorr/VEa-s/VEa-s − Ecorr/Vicorr/A∙cm−2is/A∙cm−2
Substrate−0.582−0.0700.5126.620 × 10−61.436 × 10⁻⁴
x = 0−0.524−0.2990.2252.249 × 10−71.021 × 10⁻⁶
x = 1.0−0.393−0.2310.1611.260 × 10−72.506 × 10⁻⁷
Table 4. Wear rates of the samples at different wear times (mm3⋅N−1⋅m−1).
Samples2 h4 h6 h8 h10 h
Substrate2.09 × 10−31.67 × 10−31.19 × 10−39.17 × 10−47.44 × 10−4
x = 07.88 × 10−44.77 × 10−43.34 × 10−43.24 × 10−42.65 × 10⁻⁴
x = 1.07.82 × 10−44.21 × 10−42.94 × 10−42.58 × 10−42.54 × 10−4
Table 5. Chemical compositions (at.%) marked in Figure 12.
SamplesTimes (h)ZonesElements
TiCCoCrFeNiAlVO
Substrate2A83.580.5310.523.561.81
B79.500.9111.124.324.15
10C79.540.9511.122.945.45
D73.030.918.253.4814.33
x = 1.02F57.821.264.203.443.174.383.942.1919.59
E65.160.704.874.635.855.758.053.001.99
10G51.111.401.525.381.261.973.881.3732.12
H58.320.705.188.586.174.4710.793.572.22
Publisher’s Note: MDPI stays neutral with regard to jurisdictional claims in published maps and institutional affiliations.

