Article

Characterization of a Medium Mn-Ni Steel Q&P Treated by a High Partitioning Temperature Cycle

1
Tecnalia, Basque Research and Technology Alliance (BRTA), Parque Científico y Tecnológico de Bizkaia, Astondo Bidea 700, 48160 Derio, Spain
2
Department Mining, Metallurgical and Materials Science, UPV/EHU, Plaza Torres Quevedo 1, 48013 Bilbao, Spain
3
ArcelorMittal Maizieres Research SA, Voie Romaine-BP30320, 57283 Maizières-lès-Metz, France
4
Swerim AB, Isafjordsgatan 28A, 164 40 Stockholm, Sweden
5
Centro Ricerche Fiat, Corso Settembrini 40, Porta 8, Corpo 1, 10135 Torino, Italy
6
Department of Materials Science and Engineering, Delft University of Technology, Mekelweg 2, 2628 CD Delft, The Netherlands
*
Author to whom correspondence should be addressed.
Metals 2022, 12(3), 483; https://doi.org/10.3390/met12030483
Submission received: 16 February 2022 / Revised: 4 March 2022 / Accepted: 10 March 2022 / Published: 13 March 2022

Abstract

:
In this work, a medium Mn-Ni steel was treated through Quenching and Partitioning (Q&P) with a partitioning temperature (PT) of 650 °C, which corresponded to the start of the austenite reverse transformation (ART) phenomenon. The influence of the quenching temperature (QT) and partitioning time (Pt) on austenite stabilization and mechanical properties was investigated. A strong influence of the quenching temperature was observed. Results were compared with those obtained after a Q&P treatment with 400 °C partitioning temperature. The Q&P cycle with quenching to room temperature and a high partitioning temperature produced a steel with a high retained austenite (RA) volume fraction and exceptional strength–ductility balance. The analysis of the mechanical stability of the retained austenite revealed a significant stress-induced transformation. Nevertheless, the austenite, which was stable at stresses above the yield stress, provided significant TRIP-assisted ductility. Bending, hole expansion and post-stamping properties were also evaluated for the most promising conditions.

1. Introduction

In the development of Third-Generation Advanced High-Strength Steels for the automotive sector, Quenching & Partitioning (Q&P) steels and intercritically annealed medium Mn steels (MMnS) are considered the most promising candidates. These steels are able to simultaneously provide high strength and ductility, which is needed for the reduction of vehicles’ weight and increased passenger safety [1,2]. Both are multiphase steels containing a high amount of retained austenite (RA) in their microstructures. Under mechanical loading, the retained austenite transforms into martensite, leading to their high elongation and, also in part, strength, through the transformation-induced plasticity (TRIP) effect. The Q&P concept is based on the stabilization of austenite by carbon partitioning from pre-quenched martensite [3]. In medium Mn steels, austenite is formed by austenite reversion in the intercritical domain and it is stabilized by manganese partitioning [4,5].
Medium Mn steels contain a rather high volume fraction of retained austenite, in the range of 0.20–0.40 [6,7,8]. The stability of retained austenite and the ultra-fine microstructure seem to play a key role in the impressive strength–ductility balance of these steels [9,10,11,12]. The stability of retained austenite, and thereby the work hardening behavior, is determined by the parameters of the annealing process and the chemical composition of the material [6,13]. Furthermore, a high yield ratio (Yield strength (YS)/Tensile strength (TS)) can be achieved under certain processing conditions [6], which is usually correlated with good localized deformation such as hole expansion. Comparatively, Q&P steels present in general a lower strength–ductility balance. However, considering typical retained austenite fractions of 0.05–0.10 and a low fraction of fresh martensite, the yield ratio is rather high, which represents a clear advantage in terms of safety and localized deformation performance, such as during hole expansion tests [14,15].
Alloying with Mn is a common practice in both types of steels. In Q&P steels, Mn is added to reduce the bainite formation window and increase the bainite incubation time [16,17]. In MMnS steels, higher amounts of Mn (4–10 wt.%) are added to promote austenite stabilization. Recently, steels containing medium Mn additions have also been investigated for being treated by the Q&P thermal route. In the latter, the increase in Mn content responds to two different targets:
  • The shift of the martensitic transformation temperature to a lower value, allowing the selection of near room temperature as the quenching stop temperature (QT). In this approach, the key is to obtain the optimum austenite volume fraction and stability with room temperature quenching [18,19,20]. The benefit is clear in terms of process control, as the control of the quenching temperature during Q&P to higher temperatures requires sophisticated cooling equipment.
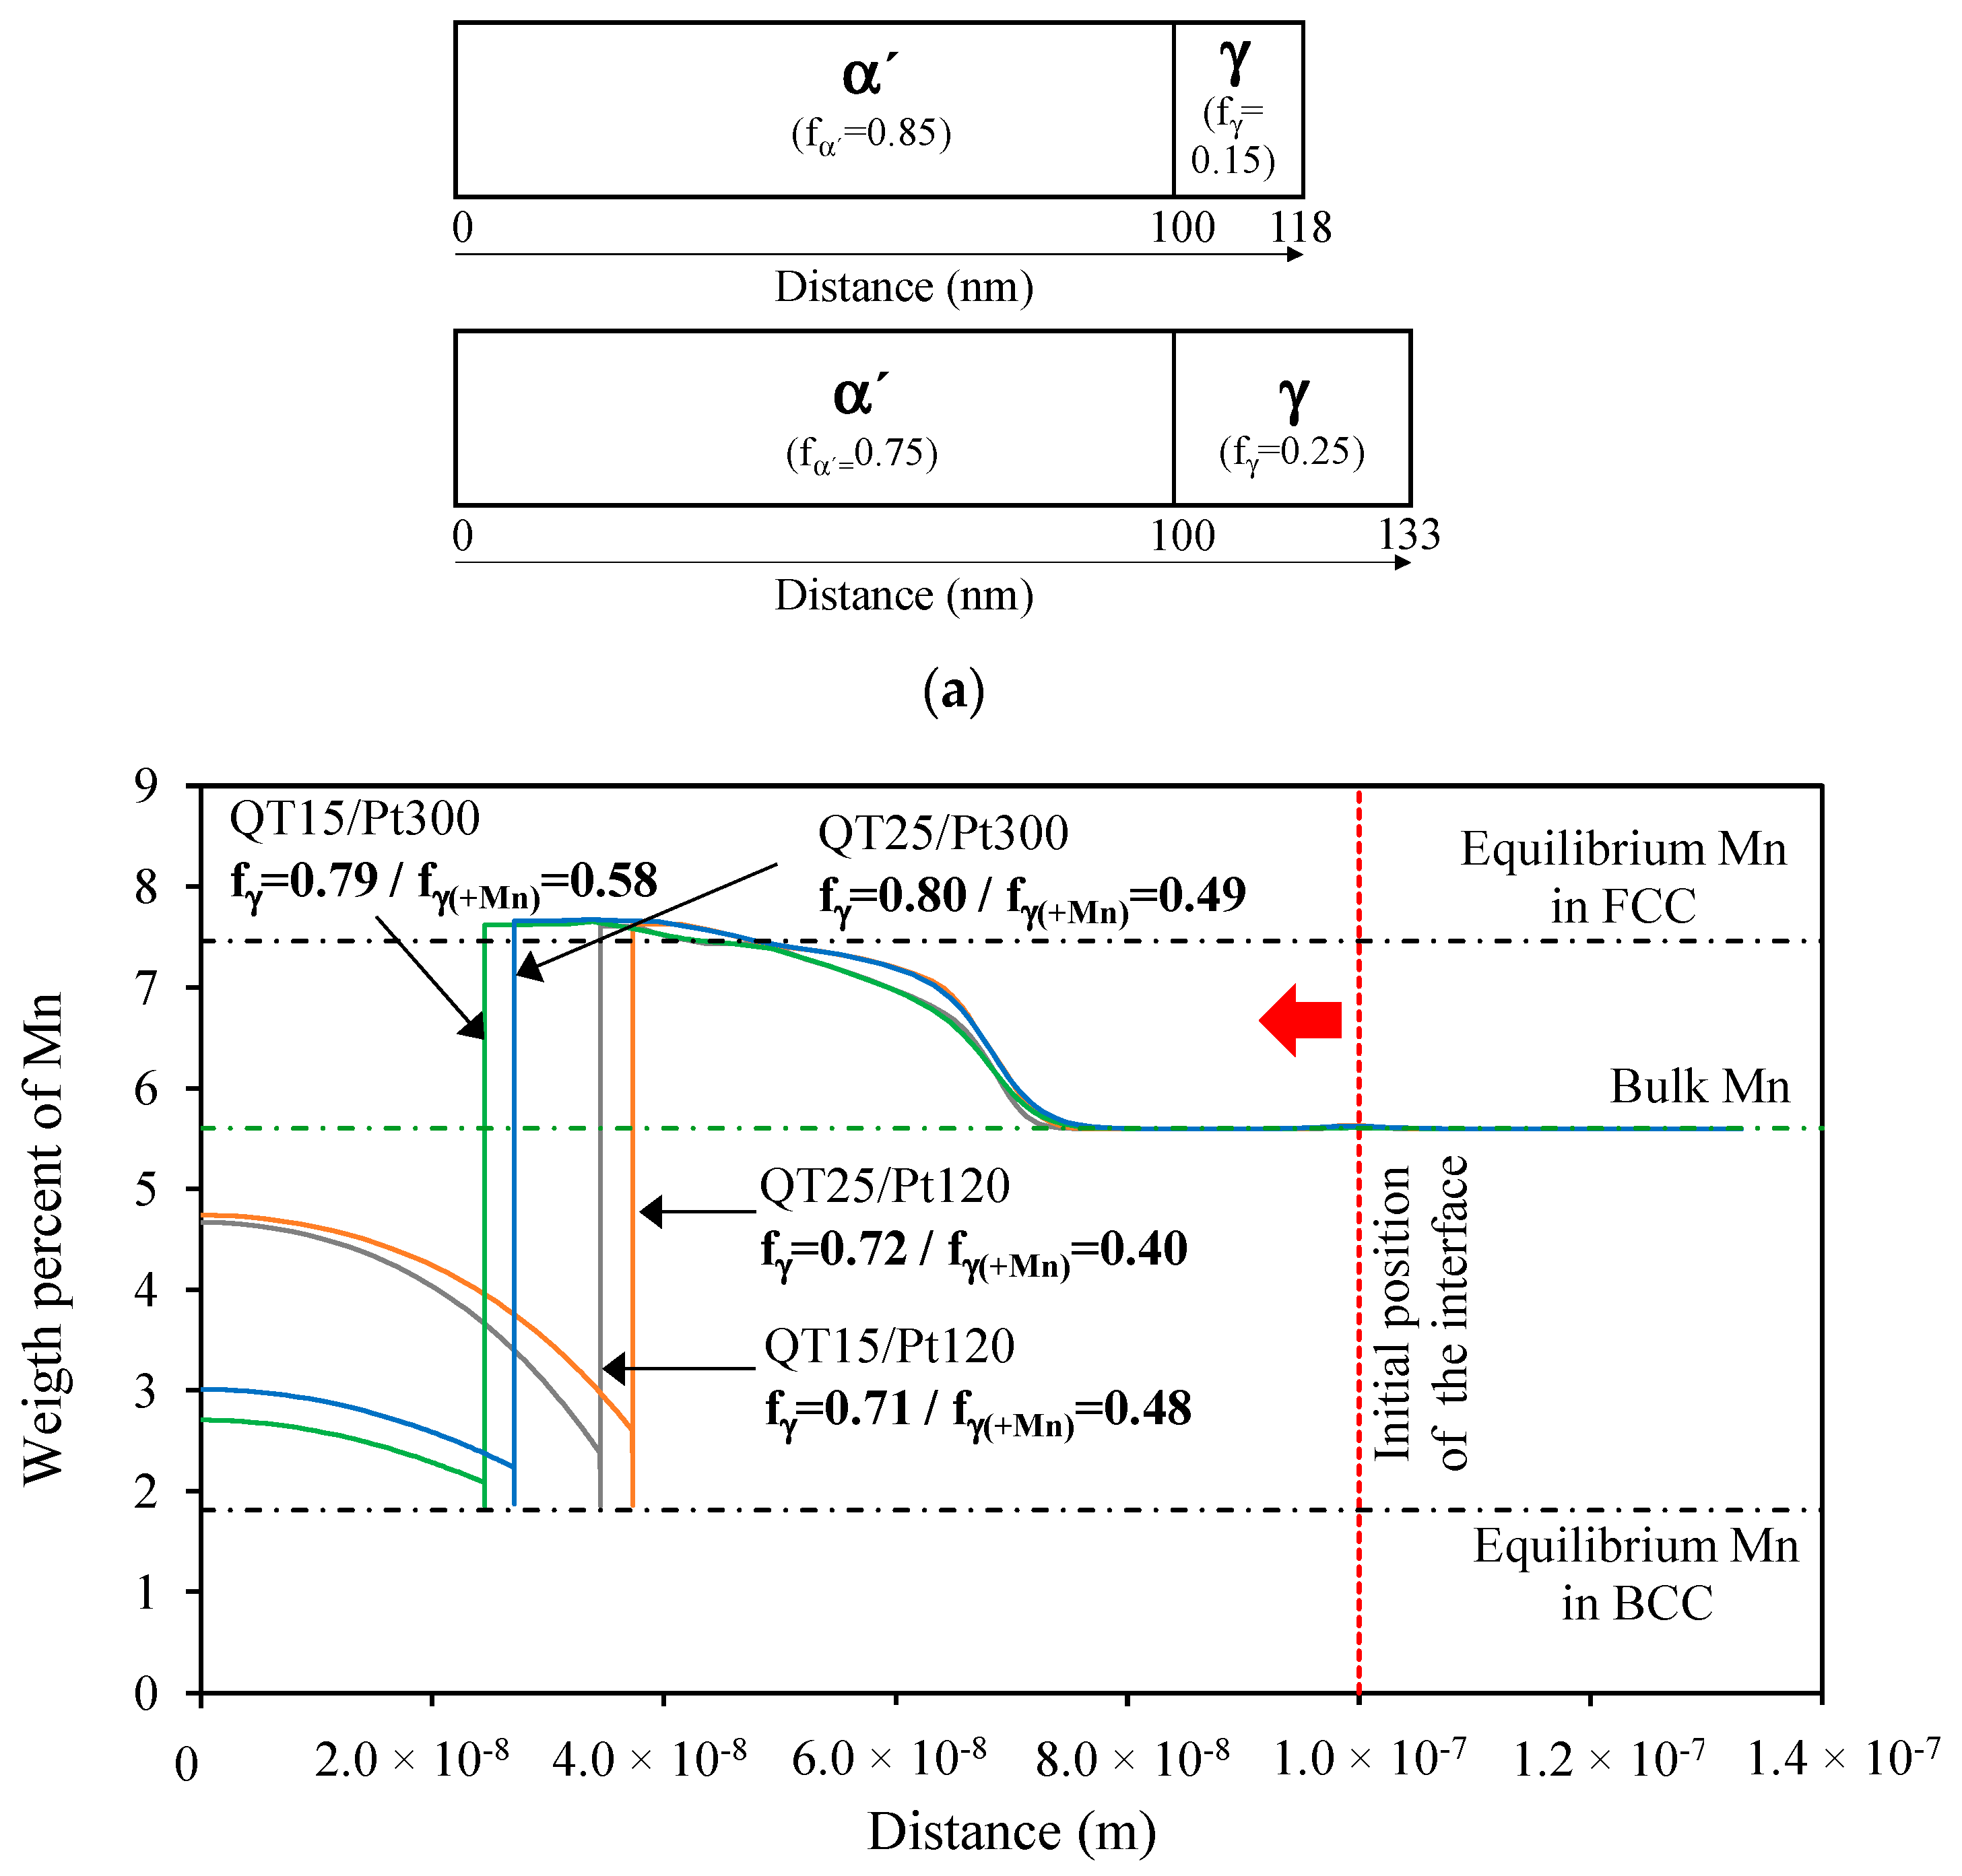
  • The stabilization of austenite not only by carbon, but also by Mn enrichment of austenite. Early assumptions considered that the Q&P process implies the partitioning of only carbon from martensite to austenite by diffusion through an immobile martensite/austenite interface. However, a later study considered the possible interface migration during partitioning, highlighting the importance of interface migration to adjust the retained austenite fraction [21]. Afterward, many publications experimentally analyzed and modeled the martensite/austenite interface migration and the formation of austenite and provided evidence for the partitioning of both interstitial carbon and substitutional Mn during the Q&P processing [22,23,24,25]. In these publications, the Mn content was equal to or higher than 3 wt.% and the partitioning temperature (PT) was limited to 450 °C. It was observed that the partitioning of Mn only occurred a few nanometers away from the interface. In [21], it was presumed that at elevated partitioning temperatures, interface migration was likely to be of the greatest importance due to the higher mobility of iron and substitutional alloying elements.
In relation to the second target, the present work analyzes the effects of increasing the partitioning temperature on a Q&P thermal route applied to a medium Mn steel. Until now, little research on this issue has been available in the literature [26,27,28]. These studies reported that the heat treatments with partitioning temperatures in the range of 500 °C to 600 °C were not effective for stabilizing austenite due to the abundant competitive reactions (mainly pearlite formation and cementite precipitation). However, partition treatments performed at higher temperatures, within the intercritical range, resulted in high austenite volume fractions in the final microstructure, as a result of the austenite reverse transformation (ART) phenomenon, leading to effective austenite stabilization. However, the high austenite volume fraction did not result in a significant improvement in mechanical properties [27], which was potentially due to the formation of secondary martensite after partitioning and the poor mechanical stability of austenite. In a related work [29], an initial primary martensite + pre-existing austenite microstructure was reheated to the intercritical region and the formation of new austenite was studied in a Fe 0.2C 8Mn 2Al steel alloy. It was observed that a small amount of pre-existing austenite could apparently accelerate the austenite reversion kinetics as compared with the conventional ART. Moreover, an excessive fraction of pre-existing austenite resulted in coarse secondary martensite, which made the material very brittle.
The aim of the present work was to investigate new conditions of the so-called high partitioning temperature Q&P process, specifically a partitioning temperature equal to the ART start temperature and lower partitioning times (Pt). Additionally, we aim to provide a new understanding of the thermal and mechanical stability of the austenite obtained by this thermal route. The new thermal cycles were applied to a medium Mn steel containing Ni. The addition of both Mn and Ni was made to promote the partitioning of these elements in order to increase the stability of the austenite. Although, in comparison with Mn, the amount of experimental work in the field of Ni partitioning is lower, the published results in the field suggest effective austenite stabilization by Ni [30,31]. The addition of Ni was also motivated by its lower segregation in comparison with Mn.

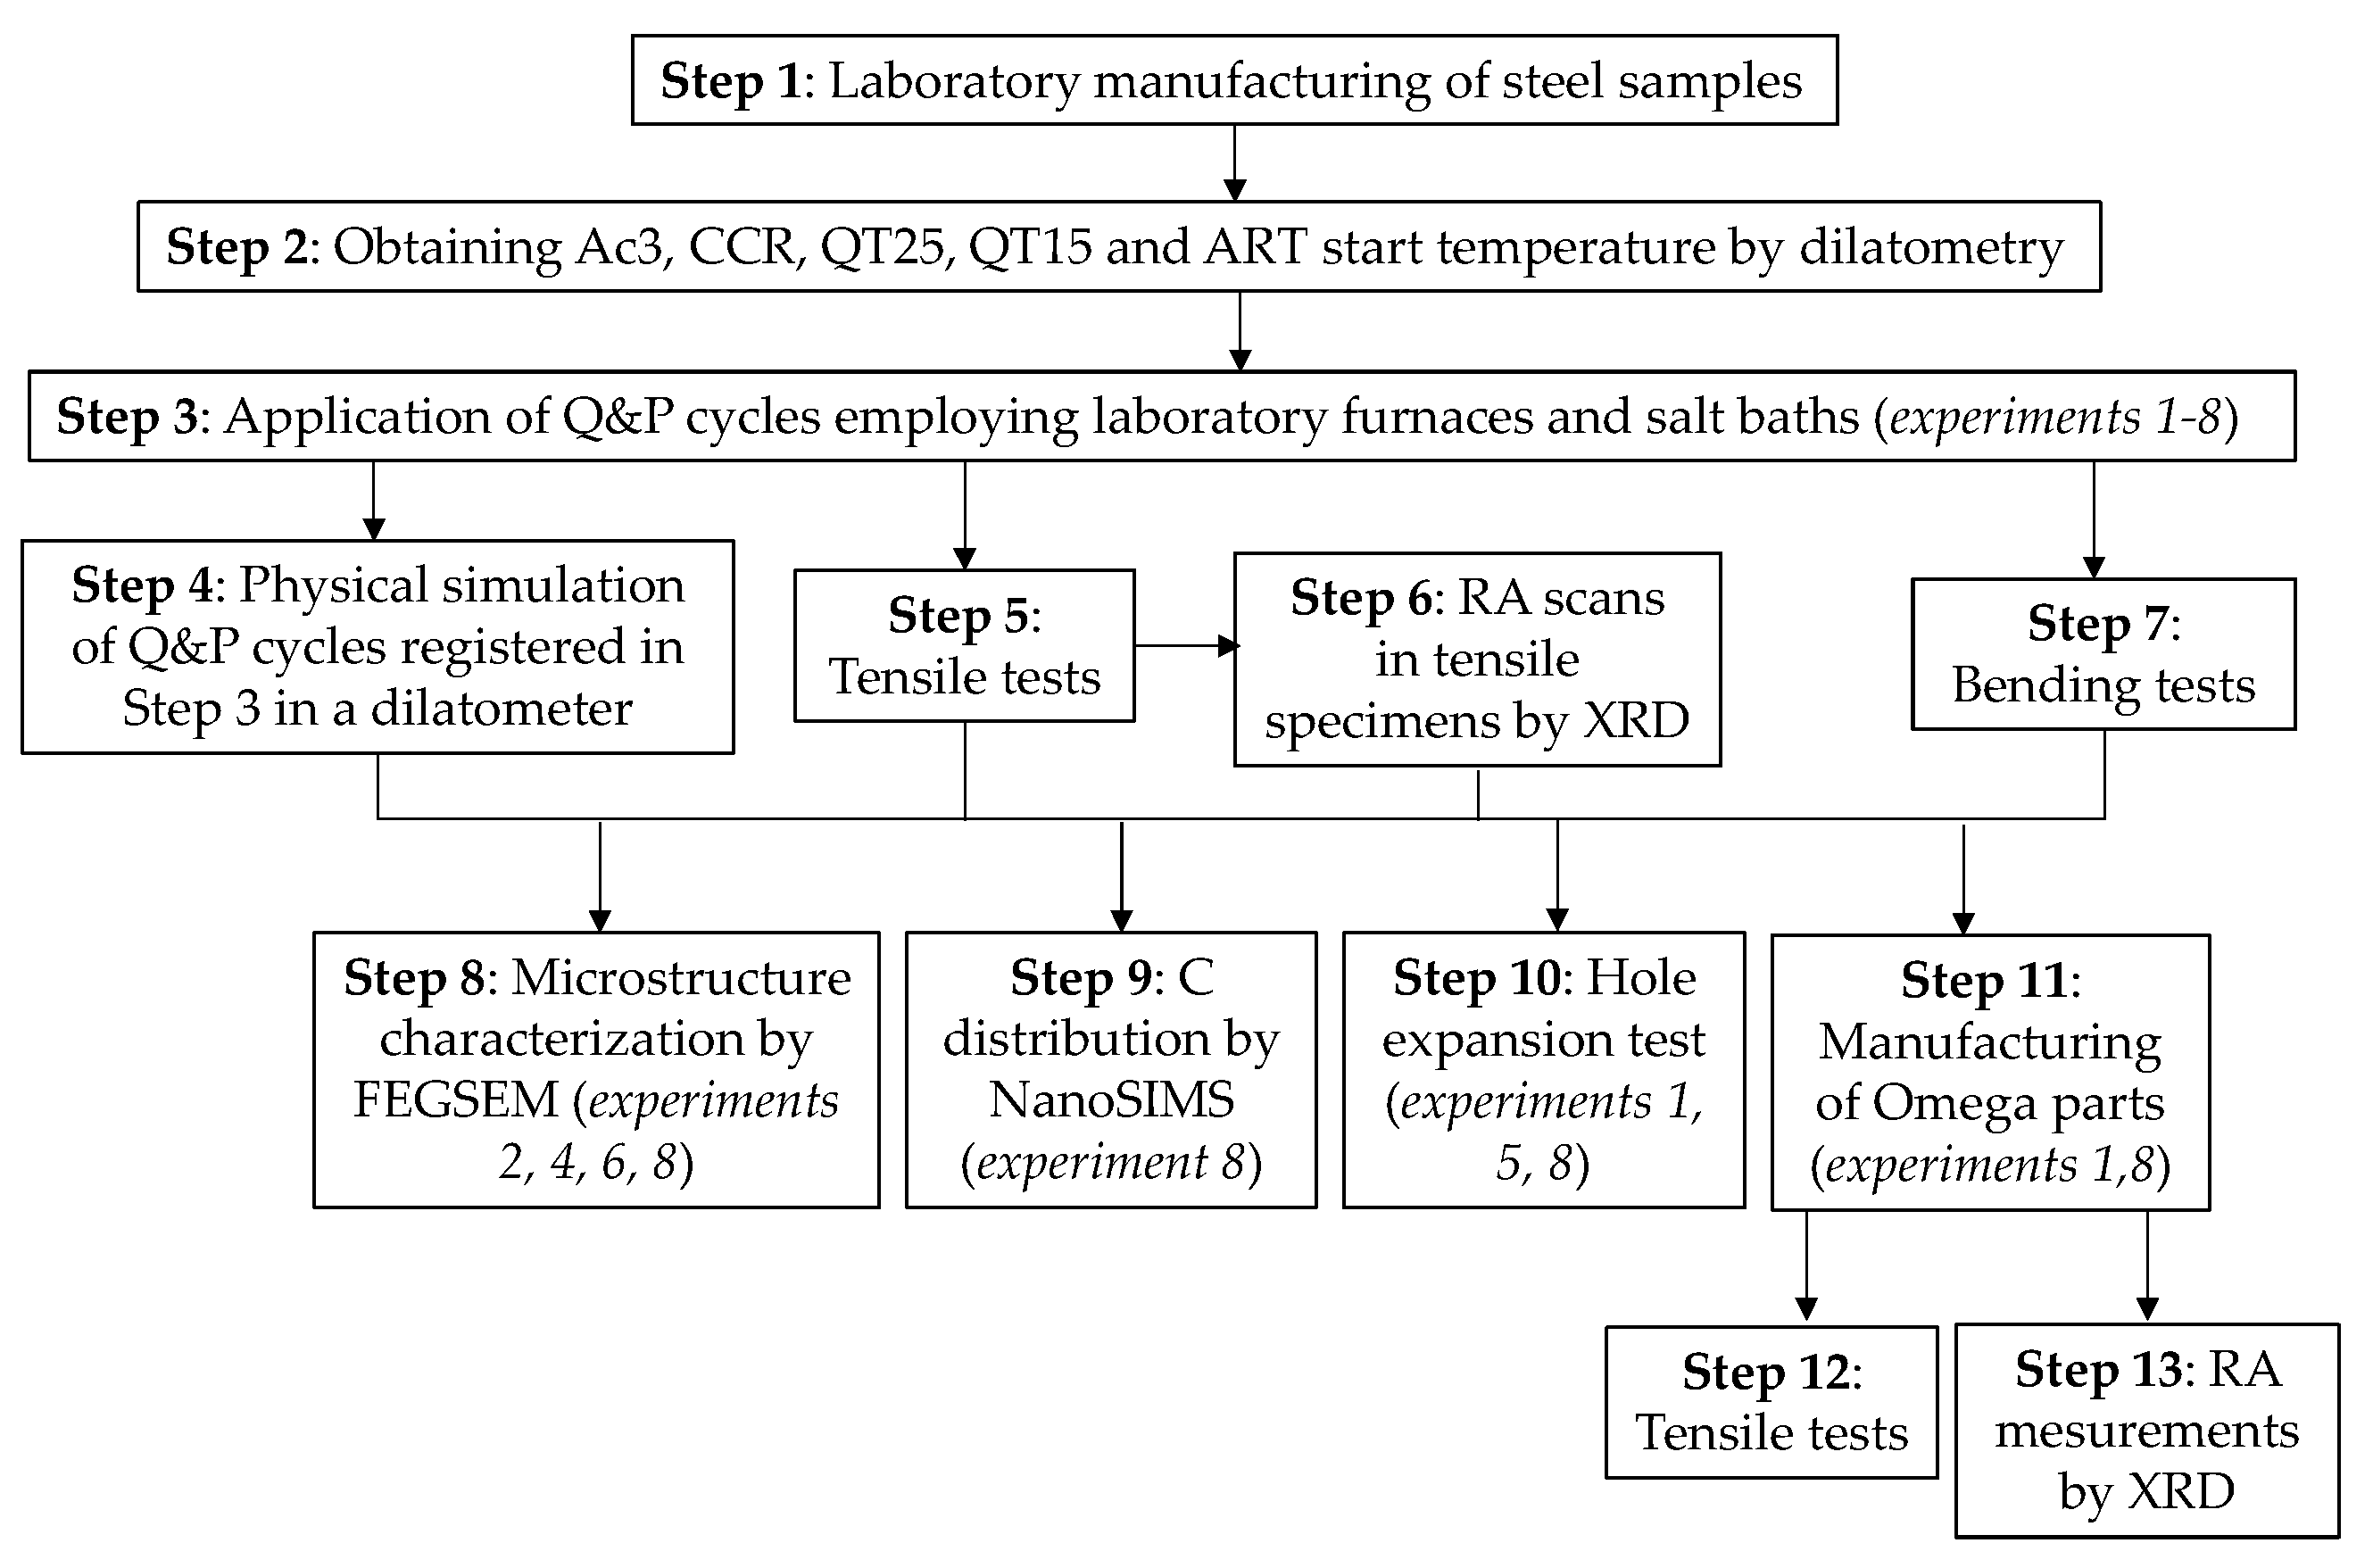
2. Materials and Methods

A low-carbon, medium Mn- and Ni-containing steel (hereafter M-MnNi steel) was produced in the laboratory using a vacuum induction melting furnace. The chemical composition of this steel was based on the steel with better performance in terms of austenite stabilization investigated in [27]. Here, the carbon content was slightly raised with the aim of further increasing the stability of austenite. Additionally, a lower Mn and Ni free steel (hereafter L-Mn steel), representative of a more standard Q&P steel, was also produced in the laboratory and Q&P-treated employing a conventional partitioning temperature, for comparison purposes. The carbon content in L-Mn steel was slightly lower than in M-MnNi steel, the Mn and Ni content being the main difference. Table 1 shows the chemical composition for both steels.
The ingots were reheated to ~1250 °C and a roughing stage was firstly performed to decrease the thickness from 60 mm to 30 mm. The obtained slabs were then cut into 5 small ingots, which were hot-rolled after being reheated to ~1250 °C. The hot rolling consisted of five hot rolling passes (end temperature of rolling approximately above 900 °C) and coiling at 500 °C. The hot-rolled sheets of approximately 4 mm thickness were ground on both surfaces to decrease the thickness to 2.8 mm. Then, the sheets were cold-rolled with approximately 50% reduction to 1.5 mm thickness sheets. In the case of M-MnNi steel, a softening annealing was applied before cold rolling, which consisted of holding at 600 °C for 1 h followed by water quenching.
The details of the Q&P thermal cycles are shown in Figure 1. The low-Mn steel was heat-treated by a Q&P cycle (Figure 1a) in which a quenching temperature corresponding to 0.25 austenite volume fraction (hereafter QT25) was selected and a partitioning stage was applied at 400 °C (hereafter low PT) for 120 s and 300 s (hereafter Pt120 and Pt300, respectively). The medium Mn and Ni steel was heat-treated by different Q&P cycles where QT, PT and Pt were varied. Partitioning temperatures were 400 °C (low PT) and 650 °C (hereafter high PT). In the low PT condition, the QT25 condition was considered (Figure 1b). The high PT condition (650 °C) corresponded to the temperature at which the ART phenomenon started, which was determined by dilatometry in advance, as described later. With the aim of analyzing the ART phenomenon starting from different austenite/martensite balances, two quenching temperatures were selected, which corresponded to 0.25 (QT25) and 0.15 (hereafter QT15) austenite volume fractions (Figure 1b,c, respectively). Partitioning times were 120 s and 300 s. The list of experimental conditions, experimental groups, variables analyzed and control group is shown in Table 2. The variables listed in the table are steel grade, QT and PT. Additionally, two Pt conditions were considered in each experimental group. The influence of PT was studied in experimental groups 1 and 2. The investigation of new PT conditions close to the ART start temperature, in combination with new Pts, would be part of a future work. The aim would be the definition of the optimum temperature and time conditions to further improve the mechanical properties.
The first austenization temperature was defined as Ac3 + 50 °C in both steels. Preliminary dilatometer experiments were accomplished in order to determine Ac3 temperatures and, also, critical cooling rates (CCR) to avoid diffusion-based phase transformation. A LINSEIS L78 RITA dilatometer and cylindrical samples with 3 mm diameter and 10 mm length were employed. First, Ac3 temperatures were determined by heating the samples at 5 °C/s up to 1000 °C. Then, CCR and quenching temperatures QT25 and QT15 were determined by considering an austenization temperature equal to Ac3 + 50 °C with a holding time of 120 s. Critical cooling rates were determined to be 60 °C/s and 0.1 °C/s in L-Mn and M-MnNi steels, respectively. In order to determine quenching temperatures, samples were cooled down to room temperature by employing a cooling rate above CCR, specifically at 100 °C/s for L-Mn steel and at 20 °C/s in M-MnNi steel, and then were reheated up to 500 °C at 5 °C/s. From the resulting dilatometry curves, applying the lever rule between the expansion of the untransformed austenite curve and that from the reheating, martensite transformation curves were calculated. Thus, QT25 were determined to be 300 °C and 75 °C in L-Mn and M-MnNi steels, respectively. Concerning the QT15 temperature in M-MnNi steel, 0.15 austenite volume fraction was measured in the direct quenching done in the dilatometer experiments. The measurement of retained austenite in the quenched microstructure was determined by magnetic saturation experiments. Therefore, QT15 in M-MnNi steel was defined to be room temperature.
The temperature for the start of the ART phenomenon in M-MnNi steel was also obtained by dilatometry. In this case, samples were heated at Ac3 + 50 °C, held for 120 s, cooled down as previously described until QT25 and QT15, and afterwards the samples were reheated again up to Ac3 + 50 °C at 10 °C/s. The temperature at which the austenite reverse transformation started was determined from the volume contraction observed in the dilatometry curve, being 650 °C in both QT conditions analyzed.
The defined Q&P cycles were applied employing one classical resistance furnace for the first heating and two standard salt baths. The dimensions of the employed specimens were 200 mm in length and 150 mm in width. In L-Mn steel, the quenching step was done employing a salt bath heated at 300 °C. For M-MnNi steel, given that the critical cooling rate was 0.1 °C/s, forced air cooling was employed in the quenching step to 75 °C and room temperature. The temperature was controlled during the cycle using standard thermocouples. In the case of the Q&P cycle with the target QT being room temperature, the registered QT was 35 °C. After reaching the QT temperature in each case, the samples were moved to a second salt bath heated at the defined partitioning temperatures and held for the defined partitioning times. Afterwards, the samples were water quenched. The performed thermal cycles were physically simulated in the dilatometer in order to contribute to the understanding of microstructure evolution.
The microstructures of the Q&P-treated samples were observed in a JEOL JSM-6500F field emission gun scanning electron microscope (FEG-SEM), operating at 15 kV. After the application of the heat treatments, the specimens were cut perpendicular to the rolling direction and the surface was prepared by grinding with P800, P1000 and P1200 abrasive papers and polishing with 6, 3 and 1 µm diamond paste. The polished specimens were etched with a 2% Nital solution for the subsequent observation.
Characterization of the carbon distribution was done in the Luxembourg Institute of Science and Technology (LIST) using CAMECA NanoSIMS 50. 12C ion maps of 10 × 10 μm2 areas were obtained using a focused Cs+ primary ion beam. The method of C mapping in steels is based on the measured Secondary Ion Mass Spectrometry (SIMS) intensities and was developed by Valle et al. [32]. To do so, image analysis of obtained 12C ion maps of the studied sample and of a reference sample with known C content was performed. Six areas of the selected sample were analyzed.
Tensile specimens with 50 mm gauge length were cut from the salt bath samples longitudinally to the rolling direction. Three tensile tests were performed in each Q&P condition employing a universal tensile testing machine equipped with load cell 200 kN. A mechanical extensometer for strain measurement was employed. The samples were cut using a waterjet machine, and then the edges were polished in order to avoid any crack edge effect. The strain rate was 0.00025 s−1 in the elastic region and 0.002 s−1 in the plastic region.
X-ray Diffraction (XRD) scans were performed on the broken tensile samples in order to determine the RA fraction along the samples. Prior to measurement, each sample was prepared by chemical polishing using the reagent 20% H2O2 in 10% H2SO4 solution saturated with C2O2(OH)2, in order to remove surface relief from deformation during the tensile test. The XRD measurements were performed using a Bruker Discover D8 diffractometer fitted with a digitally controlled x-y table for sample positioning. Diffraction was made using a Cu-Kα radiation (1.54 Å) source with a LynxEye position-sensitive energy-dispersive detector. Data were collected using goniometer angles in the range of 2θ = 47.5–93°. In this range, austenite Bragg peaks with <hkl> <200>, <220> and <311> and ferrite peaks <200> and <211> can be detected. Peak detection was performed on the raw diffraction data with the Rietveld method using the Topas version 4 software provided by Bruker. RA fractions were evaluated using the (200), (211) and (220) peak spectra. The diffractometer was programmed to measure a sequence of line scans along the length of the broken tensile samples, recording a complete diffraction measurement set at discrete points along the line scan path. The line scans were done from a starting point in the grip zone close to the shoulder, to the fracture tip. Twenty measurements were done in each scan. The carbon content in retained austenite was calculated from XRD measurements done at an undeformed portion of the tensile specimens ends. The FCC lattice parameter was measured (aγ) and Equation (1) [33] was used to calculate the carbon content. This equation is a combination of the equations of Ruhl and Cohen [34] for Mn, Si and C and Dyson and Holmes [35] for Al.
aγ (Å) = 3.572 + 0.033 (wt.% C) + 0.0012(wt.% Mn) − 0.00157 (wt.% Si) + 0.0056 (wt.% Al)
Bending tests following Verband der Automobilindustrie e.V. (VDA) standards and employing 30 mm length and 19 mm width samples were performed in the Q&P-treated samples. Three bending tests were done in each Q&P condition. A bending radius of 0.4 mm was used for the tests. The tests were carried out on universal tensile machine equipped with a bending device on the lower side. The test parameters employed in the bending tests were: 30 N preload, 10 mm/min speed preload, 20 mm/min test speed and 50 N force shutoff.
Hole expansion tests were performed following the ISO 16630 standard. The hole expansion test is a popular technique for quantifying the edge stretch limit. The method consists of a pre-machined hole expanded by a punch head until fracture. The hole expansion ratio (HER) refers to the ratio of the expanded hole to the initially punched hole. The initial hole was made using a circular punch and die. It was then expanded with a conical punch until the fracture occurred in at least one point around the hole perimeter, over the entire length of the punched hole edge. The ratio of the expanded hole to the initially punched hole was defined by HER(λ)(in%) = (Df – D0)/D0, where Df was the expanded hole diameter (mm) and D0 was the initial punched hole diameter. A hole of diameter D0 was punched at the center of the sample using a 10 mm diameter punch with a die satisfying that clearance was 12 ± 2% for a sample thickness less than 2.0 mm.
Finally, Omega stamping tests were performed with the Q&P-treated samples employing a hydraulic press. Figure 2 shows a schematic of the Omega stamping die (a = 50 mm, b = 52.8—sheet thickness) The samples were located with the rolling direction parallel to the width of the punch. The samples were pressed up to the height (h) of 40 mm. The Omega parts were characterized to determine the post-stamping tensile properties and retained austenite content. For this, one tensile specimen was cut from the flat top area of the Omega part (unstrained area) and one from the drawn side (strained area). In this case, the gauge length of the tensile specimen was 30 mm. After performing tensile tests, XRD measurements were performed on the unstrained ends of the broken tensile specimens taken from each Omega. This was done using the same sample preparation technique and equipment as before.
In Figure 3, the experimental flow chart is presented. Steps 4 to 7 were performed for all experimental conditions. Then, based on the obtained results and the material available, the most interesting conditions were selected for the remaining steps.

3. Results

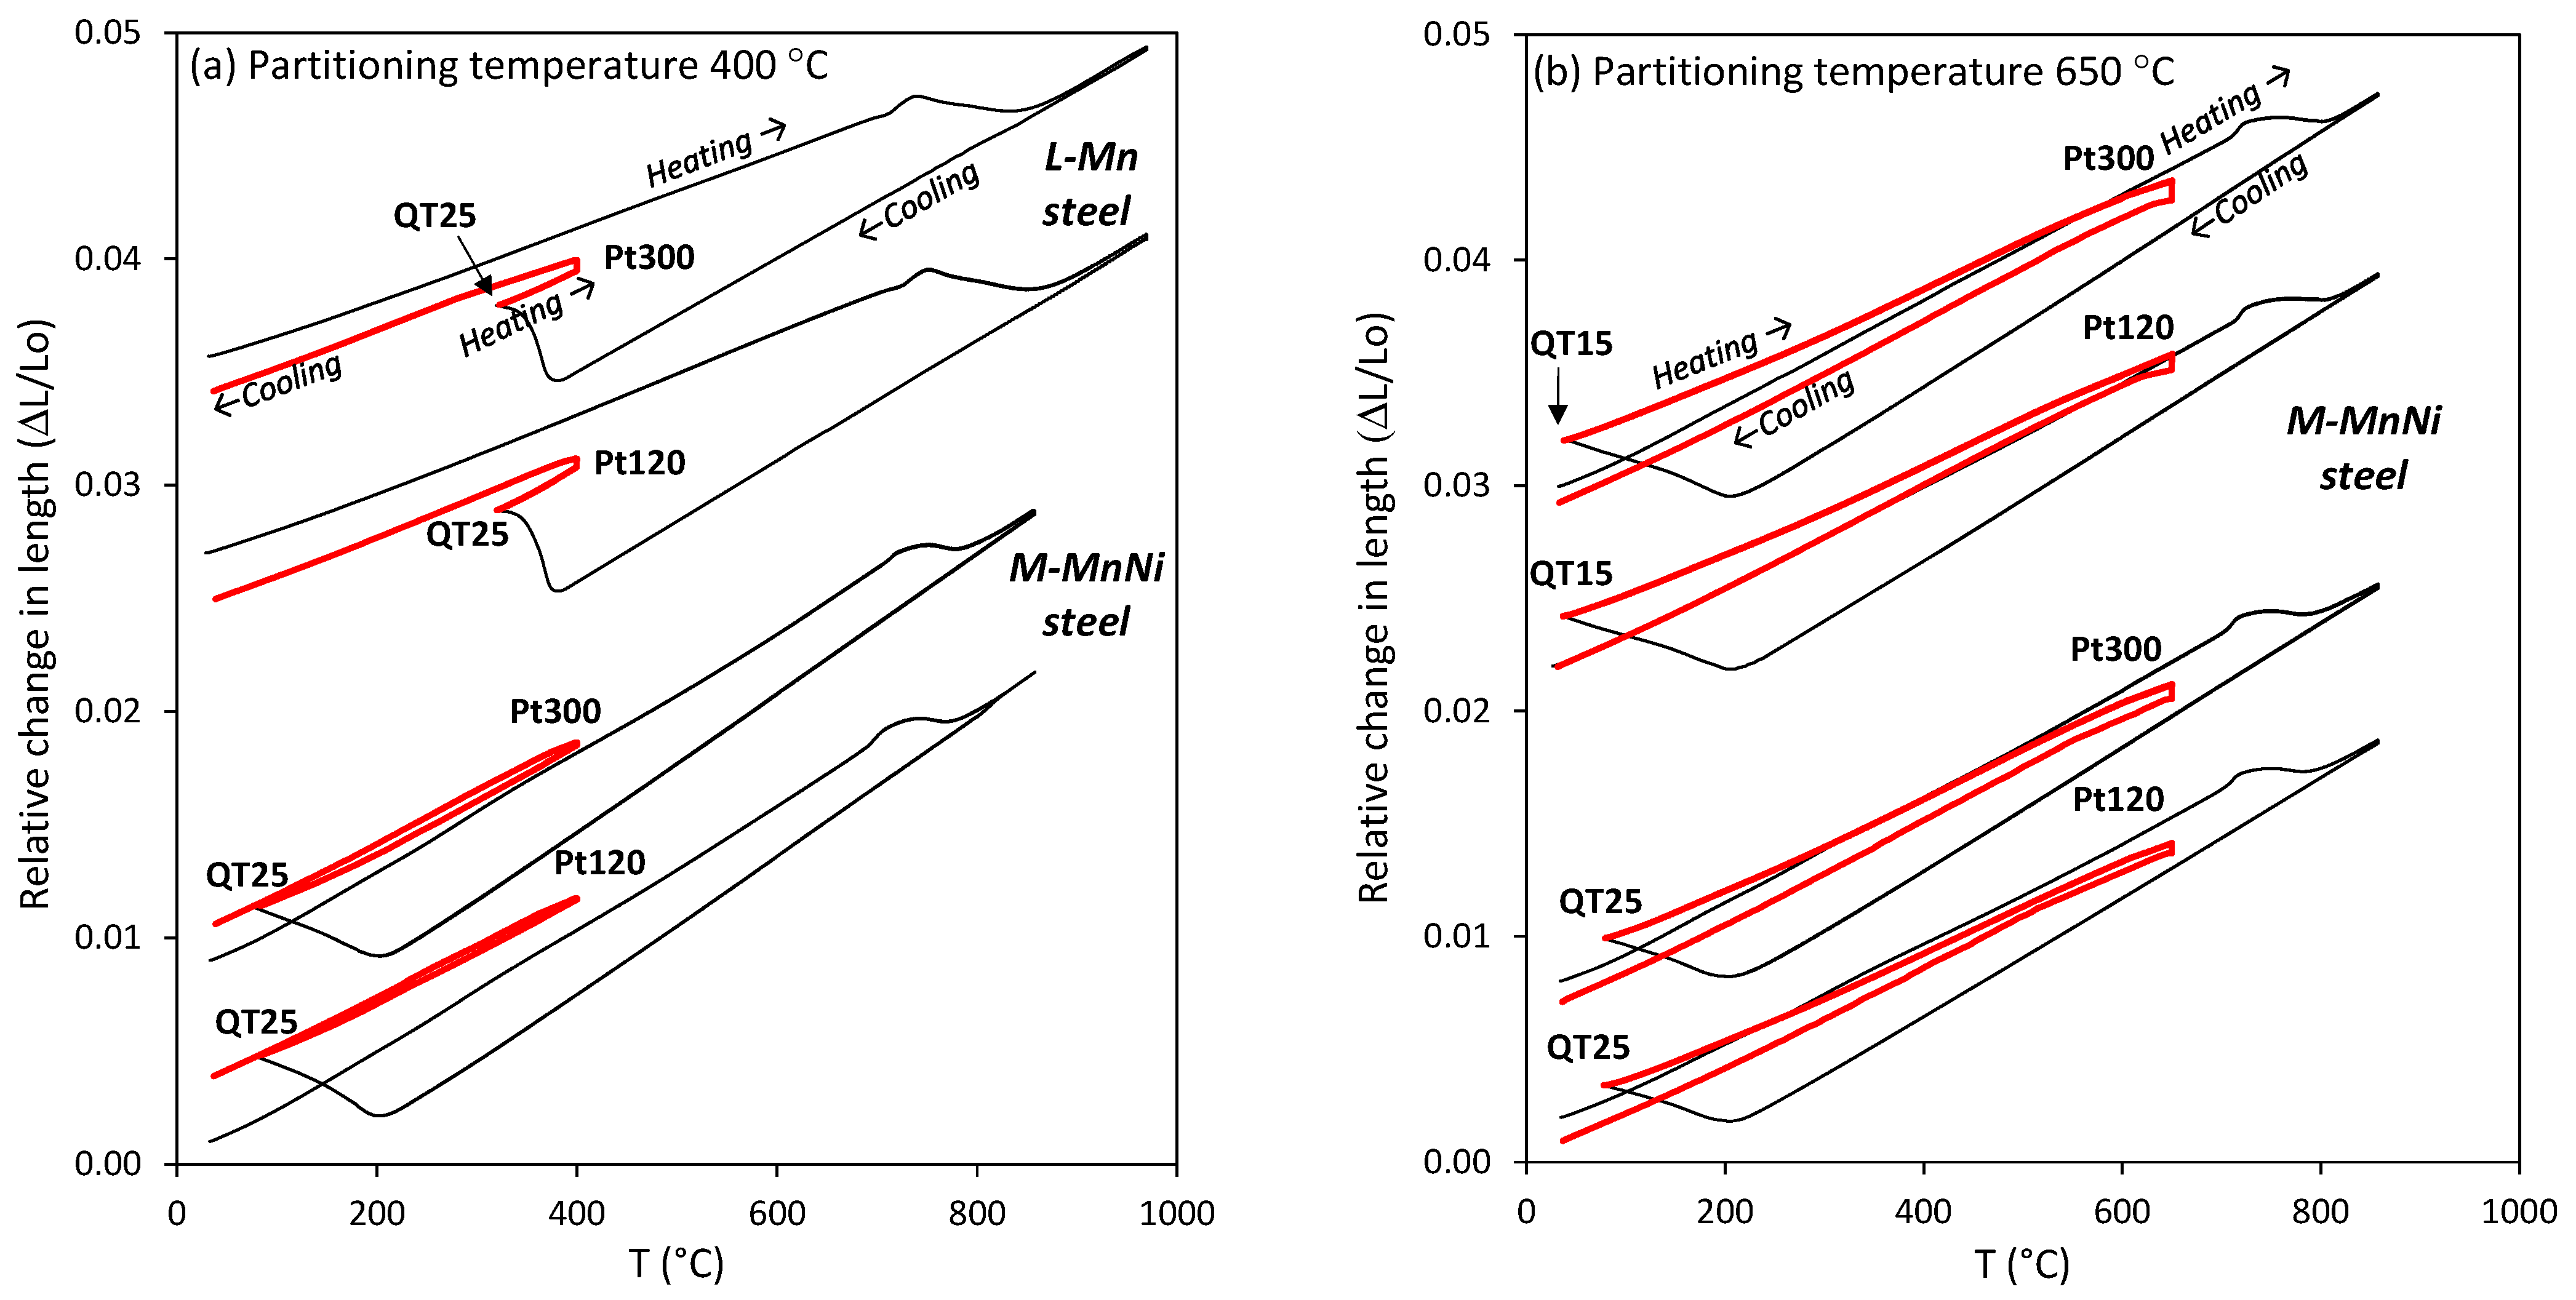
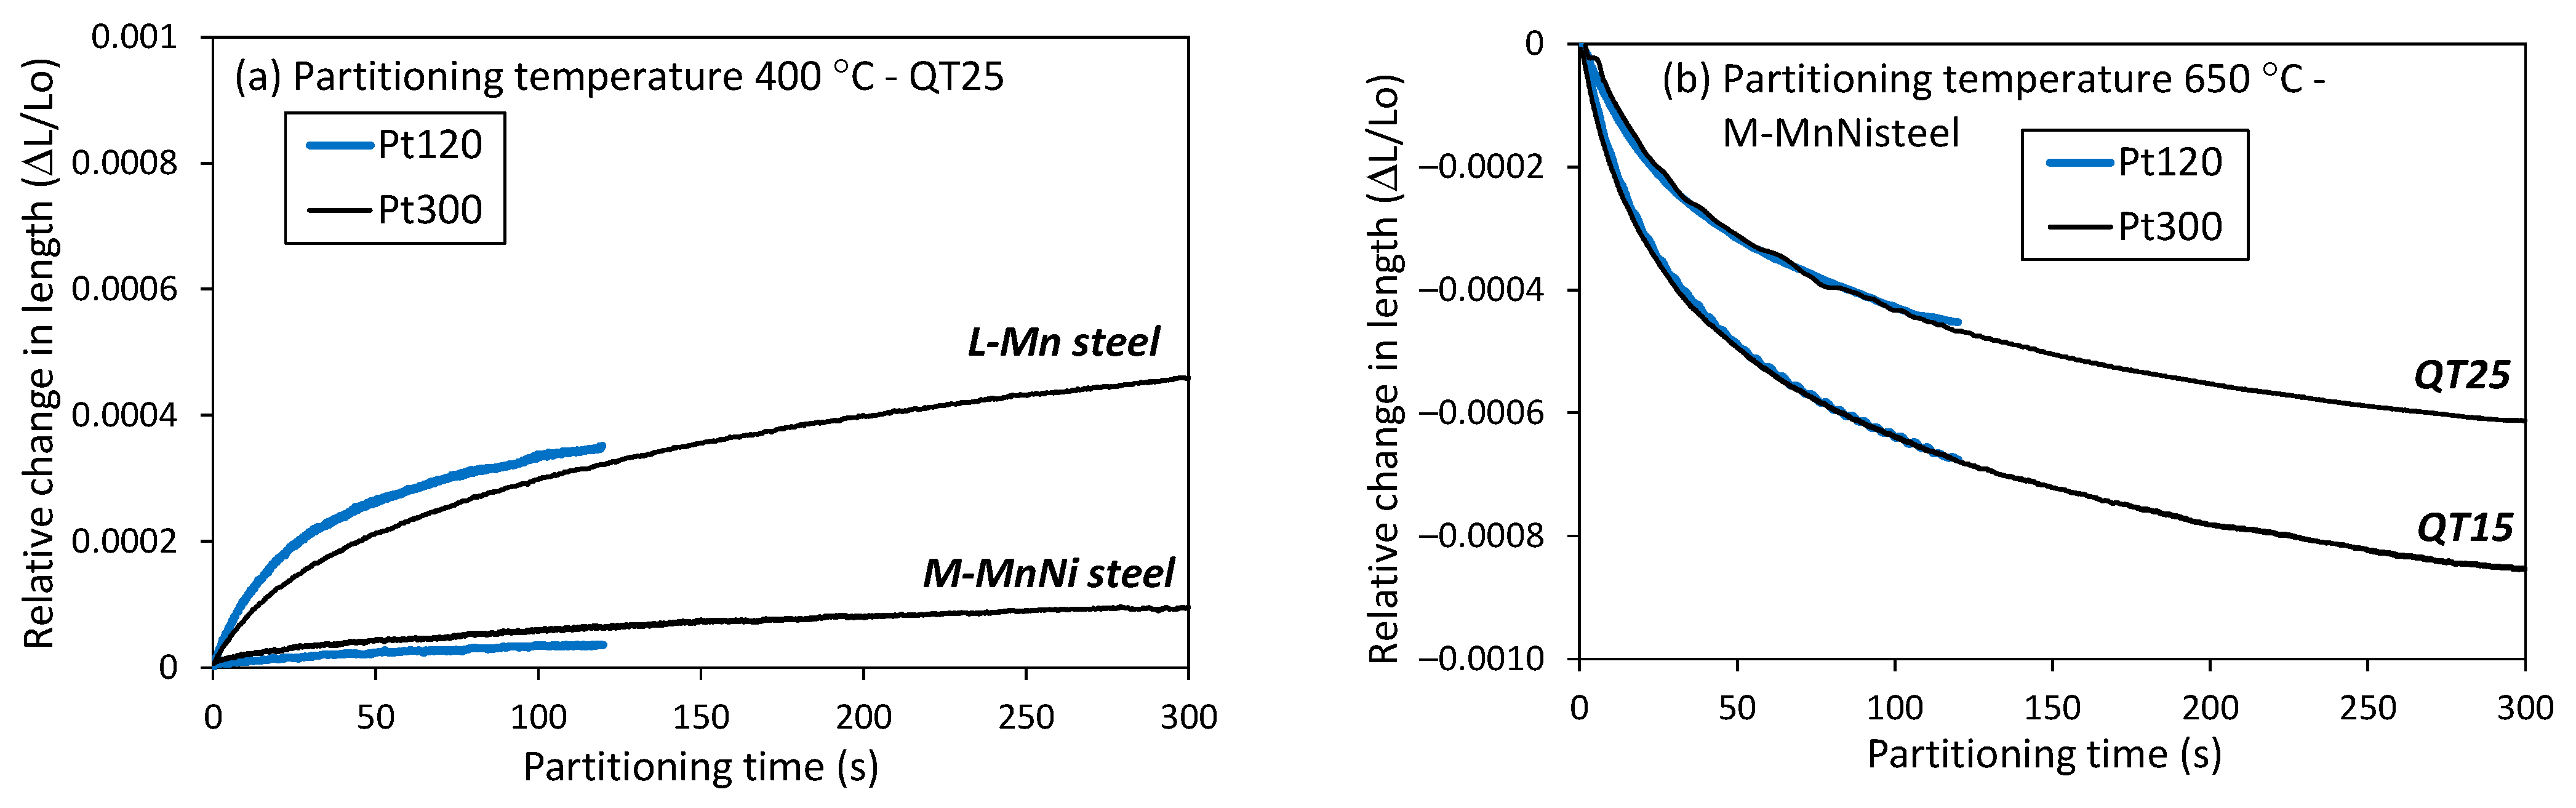
3.1. Dilatometry Curves of the Q&P Heat Treatments

Figure 4 shows dilatometry curves obtained for the Q&P thermal cycles performed in the salt baths with both steel grades. The black portion of the curves corresponds to the initial heating to Ac3 + 50 °C, holding at this temperature and subsequent quenching to QT. The red trace portion of the curves corresponds to the heating from QT to PT, maintaining at PT for the defined Pt and the final cooling to room temperature. Figure 5 represents the relative change in length measured during the partitioning stage as a function of the partitioning time for all the Q&P cycles.
In Figure 4a and Figure 5a, the curves corresponding to a partitioning temperature of 400 °C are presented for both steels. In these Q&P cycles, the quenching temperature was QT25 in all cases and two partitioning time conditions were employed, 120 s and 300 s. Continuous expansion of the sample was obtained in the partitioning stage in all the cases. The degree of expansion slightly increased with Pt and was considerably lower in M-MnNi steel (Figure 5a). In the final cooling, the linear contraction of the sample was observed in all cases (Figure 4a), indicating that the formation of secondary martensite was not significant.
In Figure 4b and Figure 5b, the dilatometry curves obtained in high partitioning temperature Q&P cycles with M-MnNi steel are shown. In these Q&P cycles, two quenching temperatures were applied, QT15 and QT25, and two partitioning time conditions were employed, 120 s and 300 s. Contrarily to the 400 °C partitioning temperature cycles, continuous contraction was obtained in the partitioning stage in all the cases. The contraction increased with partitioning time and was clearly higher in the QT15 condition (Figure 5b). In the final cooling to room temperature, the contraction was linear in all the conditions, which means that secondary martensite transformation did not occur to a significant extent (Figure 4b).

3.2. Microstructure after Q&P Heat Treatments

Figure 6 presents FEGSEM micrographs obtained in both steels considering the different Q&P conditions with a partitioning time of 300 s. Three different types of regions can be observed in the microstructures, which can be associated with three main constituents of Q&P steels: a rough gray matrix with fine inclusions, which is supposed to be primary martensite (M1) containing carbides; fine white features with a blocky or lath-like appearance, which are expected to be retained austenite; and larger islands with a dark gray aspect center and white edges, which are supposed to be MA (martensite/austenite) islands.
Figure 6a,b present FEGSEM micrographs obtained in L-Mn and M-MnNi steels, respectively, after partitioning treatment done at 400 °C. In both cases, retained austenite and primary martensite were observed. In M-MnNi steel, less carbides were observed inside primary martensite. Additionally, the volume fraction of the MA constituent was low. Figure 6c presents FEGSEM micrographs obtained in M-MnNi steel partition-treated at 650 °C for the QT25 condition. In comparison with the low PT condition, coarser MA blocks were present. Additionally, the amount of carbides within the martensitic matrix was notably higher as a result of the tempering processes. Figure 6d presents the microstructure observed in M-MnNi steel partition-treated at 650 °C for the QT15 condition. In comparison with the QT25 condition, the fraction of lath-type RA was significantly higher. Moreover, the width of the RA laths and the size of MA islands were notably finer.
Figure 7 shows retained austenite measurements obtained in the first point of the XRD line scans performed in the broken tensile specimen, which correspond to the unstrained zone. The results are presented as a function of partitioning time for both steels and all the Q&P conditions applied. In the lowest PT condition of 400 °C, the M-MnNi steel showed large fractions of retained austenite. On the contrary, L-Mn steel retained a much lower amount of austenite in the final microstructure. This result indicates that the combination of Mn and Ni alloying elements and higher carbon content in a Q&P steel strongly contributed to the stabilization of austenite.
The high PT treatments applied in M-MnNi steel resulted in higher fractions of retained austenite. A clear influence of QT was observed, obtaining significantly higher fractions of retained austenite in QT15 conditions. An increase in partitioning time in the QT15 condition resulted in a lower fraction of austenite, whereas a higher fraction was obtained in the QT25 condition. The high PT treatments applied starting from the QT15 condition resulted in a final fraction of austenite higher than the initial one existing at QT, which indicates that austenite reverse transformation occurred in the partitioning. In the QT25 condition, the final austenite volume fraction was higher than the initial one when the partitioning time was 300 s, which also revealed the existence of the ART phenomenon.
The characterization of the carbon distribution was done in the M-MnNi steel sample partition-treated at 650 °C during 300 s and in the QT15 condition. This condition was selected due to the high volume fraction of retained austenite attained and, as shown later, the interesting mechanical properties reached. The characterization was performed in six different zones of the sample. In Figure 8, an example of the characterization done in one of the zones is presented. On the left side, the corresponding 12C ion map is presented, where the areas selected for carbon analysis (15 areas) are surrounded in purple. The selected areas tried to include retained austenite and MA islands, excluding tempered martensite, which was present as a dark phase. The associated measured values of carbon content (wt.%) are presented for each area on the right side of Figure 8. It can be observed that carbon was rather homogeneously distributed in the studied areas. The mean carbon content was 0.296 wt.%, with the standard deviation being 0.038. The variation in mean carbon content between the six zones analyzed in the sample was also limited, with the mean estimated carbon content in the sample being 0.28 wt.%. Additionally, some white regions were observed within the dark phase in the zone shown in Figure 8, which were also observed in the other zones. This is the typical appearance of carbides in NanoSIMS images. However, the size of the carbides was too small for the NanoSIMS resolution; hence, proper analysis of these features was not possible. The presence of carbides in the partitioned martensite means that not all carbon was available for austenite stabilization.
The carbon content estimated by NanoSIMS in M-MnNi steel was, first, compared with the mean carbon content calculated considering the full-equilibrium and para-equilibrium fractions of the austenite and, second, with the carbon content calculated from XRD measurements done at the undeformed portion of the tensile specimen. The full-equilibrium and para-equilibrium fractions of the austenite were calculated at the partitioning temperature of 650 °C by means of ThermoCalc (v.2021), obtaining 0.67 and 1, respectively. The mean carbon contents were 0.36 and 0.24 wt.%, respectively. Hence, the carbon content estimated from NanoSIMS (0.28 wt.%) was between the C content calculated considering both types of equilibrium conditions. Given that Mn and Ni are assumed to be non-partitioned under the para-equilibrium condition, the fact that the experimentally measured C content was above the para-equilibrium C content and below the full-equilibrium C content may imply a certain degree of Mn and Ni partitioning.
The carbon content calculated from XRD measurements was significantly higher, at 0.41 wt.%. In the following, two possible explanations for the discrepancy found between NanoSIMS and XRD measurements are given. First, in NanoSIMS, it is not possible to observe a difference between RA and secondary martensite. Therefore, the whole carbon contained in RA (with an expected higher carbon content) and secondary martensite (with an expected lower carbon content) is measured; thus, it is close to the carbon content predicted by ThermoCalc. In the case of XRD, only the carbon content in RA is estimated and, therefore, the carbon content can be higher. Second, in XRD measurements, both Mn and carbon cause lattice dilatation and their effects are indistinguishable. However, the Mn content of the austenite was unknown; therefore, the bulk Mn concentration was assumed. An increased Mn content in the austenite as a result of the partitioning stage would decrease the effective carbon content estimate, making it somewhat closer to the NanoSIMS value.
The carbon content estimated from XRD measurements in M-MnNi steel and the aforementioned condition was also compared with the carbon content estimated in the reference L-Mn steel after partition treatment at 400 °C during 300 s and in the QT25 condition. In the latter, 1.05 wt.% carbon content was calculated from XRD measurements, which was in accordance with the typical values reported in Q&P-type microstructures [36], and, as expected, was considerably higher than the value found in M-MnNi steel (0.41 wt.%).

3.3. Mechanical Properties after Q&P Thermal Treatments

Figure 9 shows representative engineering stress–strain behavior for all Q&P cycles. The curves are presented for the 120 s (Figure 9a) and 300 s (Figure 9b) partitioning time conditions. Table 3 summarizes average tensile data (0.2% offset YS, TS, yield to tensile ratio and total elongation (TEL)) obtained from triplicate tensile tests. The scattering of the data was very similar for both alloys and all Q&P conditions considered. The analysis of the engineering stress–strain curves revealed interesting features depending on the steel and the Q&P condition.
The L-Mn steel sample partition-treated at 400 °C exhibited the highest tensile strength, a high yield to tensile ratio and an elongation close to 10%. The tensile curves obtained with this steel indicate good local formability, which means that the material undergoes high plastic deformation in a local area without fracture. The behavior of this condition is similar to the stress–strain response observed in other Q&P steels [37,38]. In Q&P steels, continuous yielding normally prevails [39] and this was also the case for L-Mn steel. The increase in Mn and Ni content in M-MnNi steel did not significantly affect the strength; however, the elongation drastically decreased, with this steel exhibiting a very brittle behavior after 400 °C partitioning temperature treatment.
With an increase in partitioning temperature, a very different stress–strain response was obtained in M-MnNi steel, which is described next:
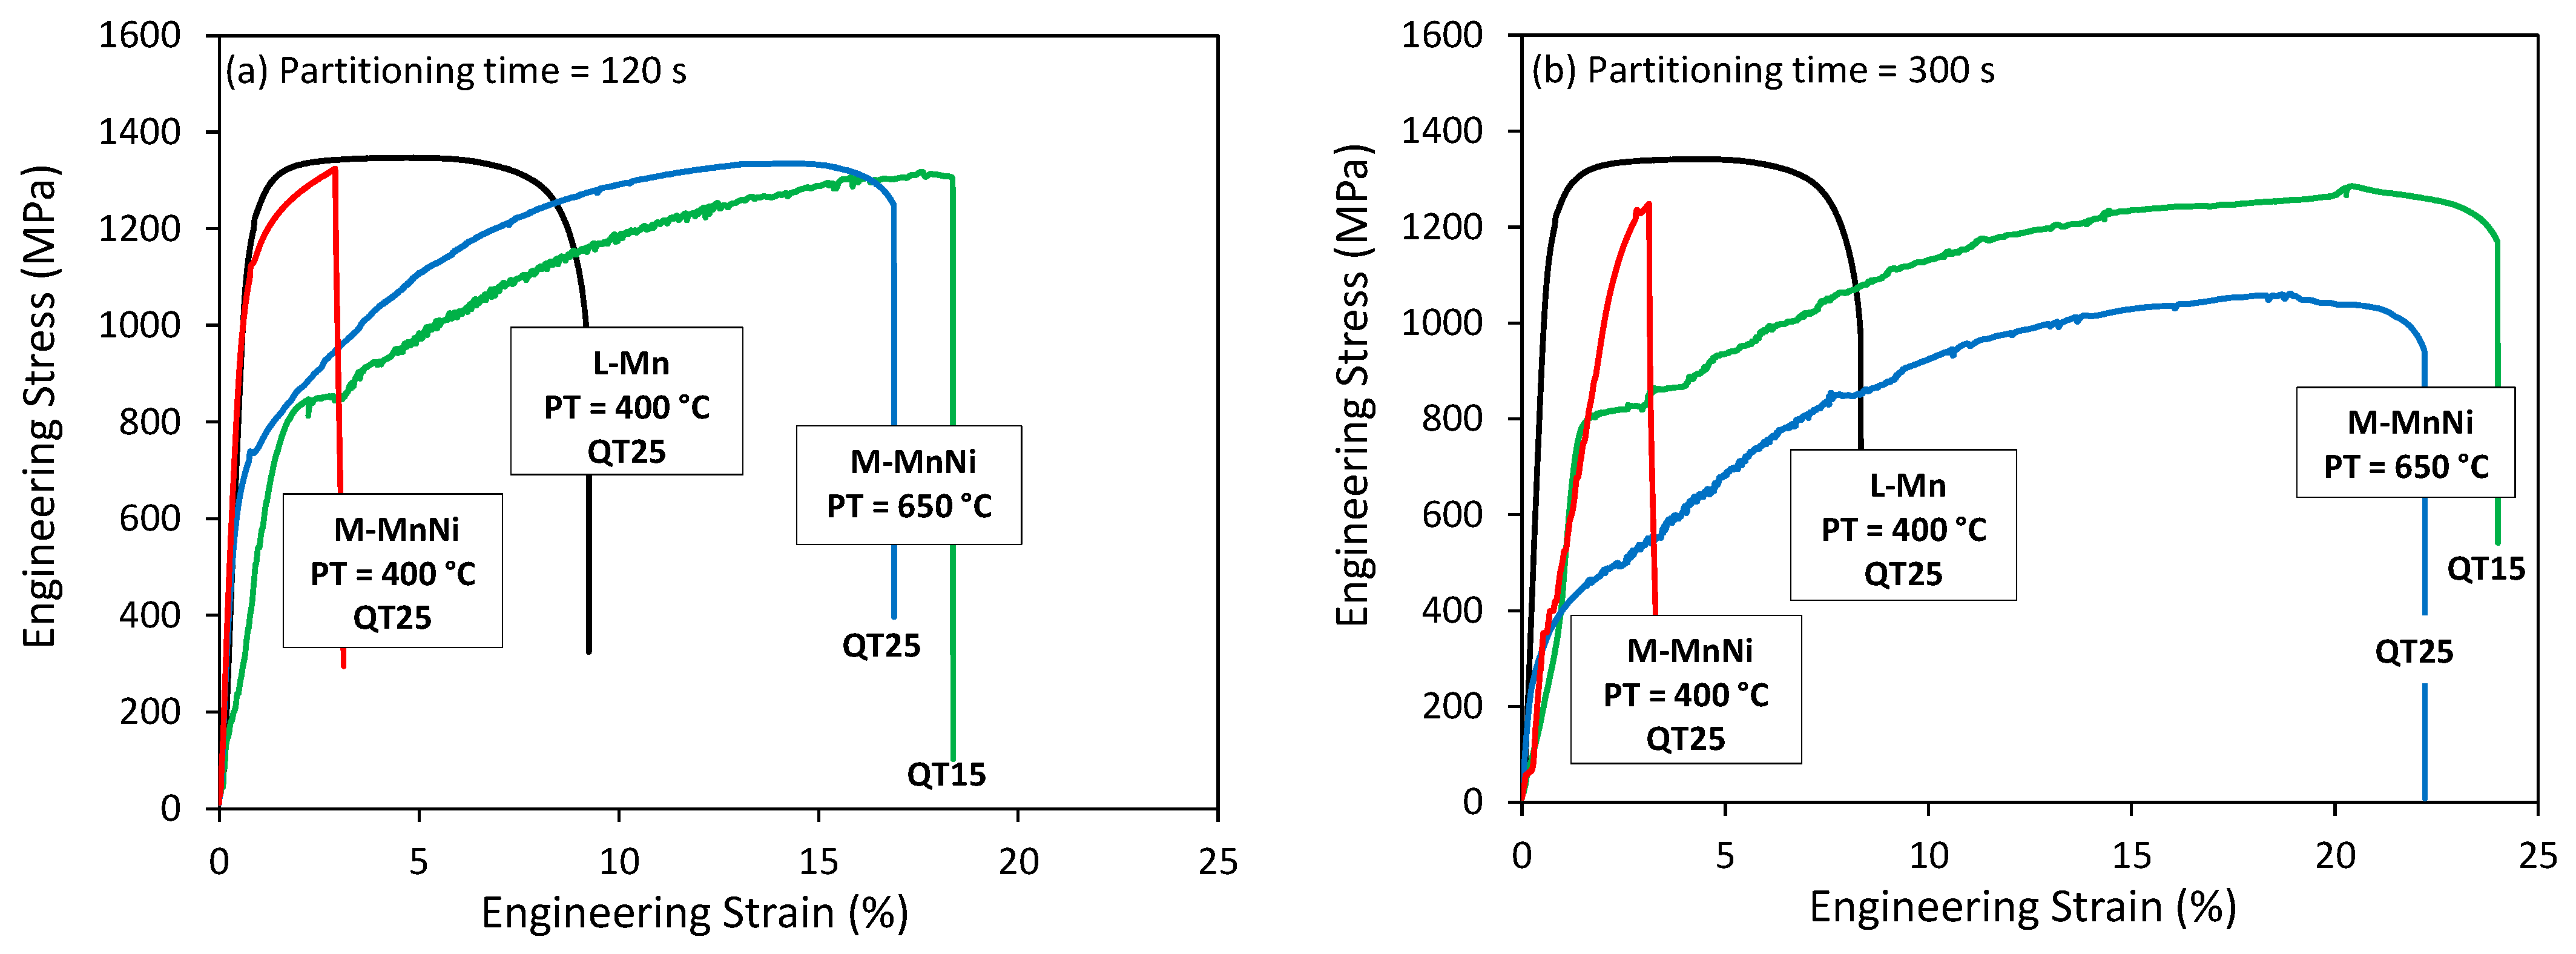
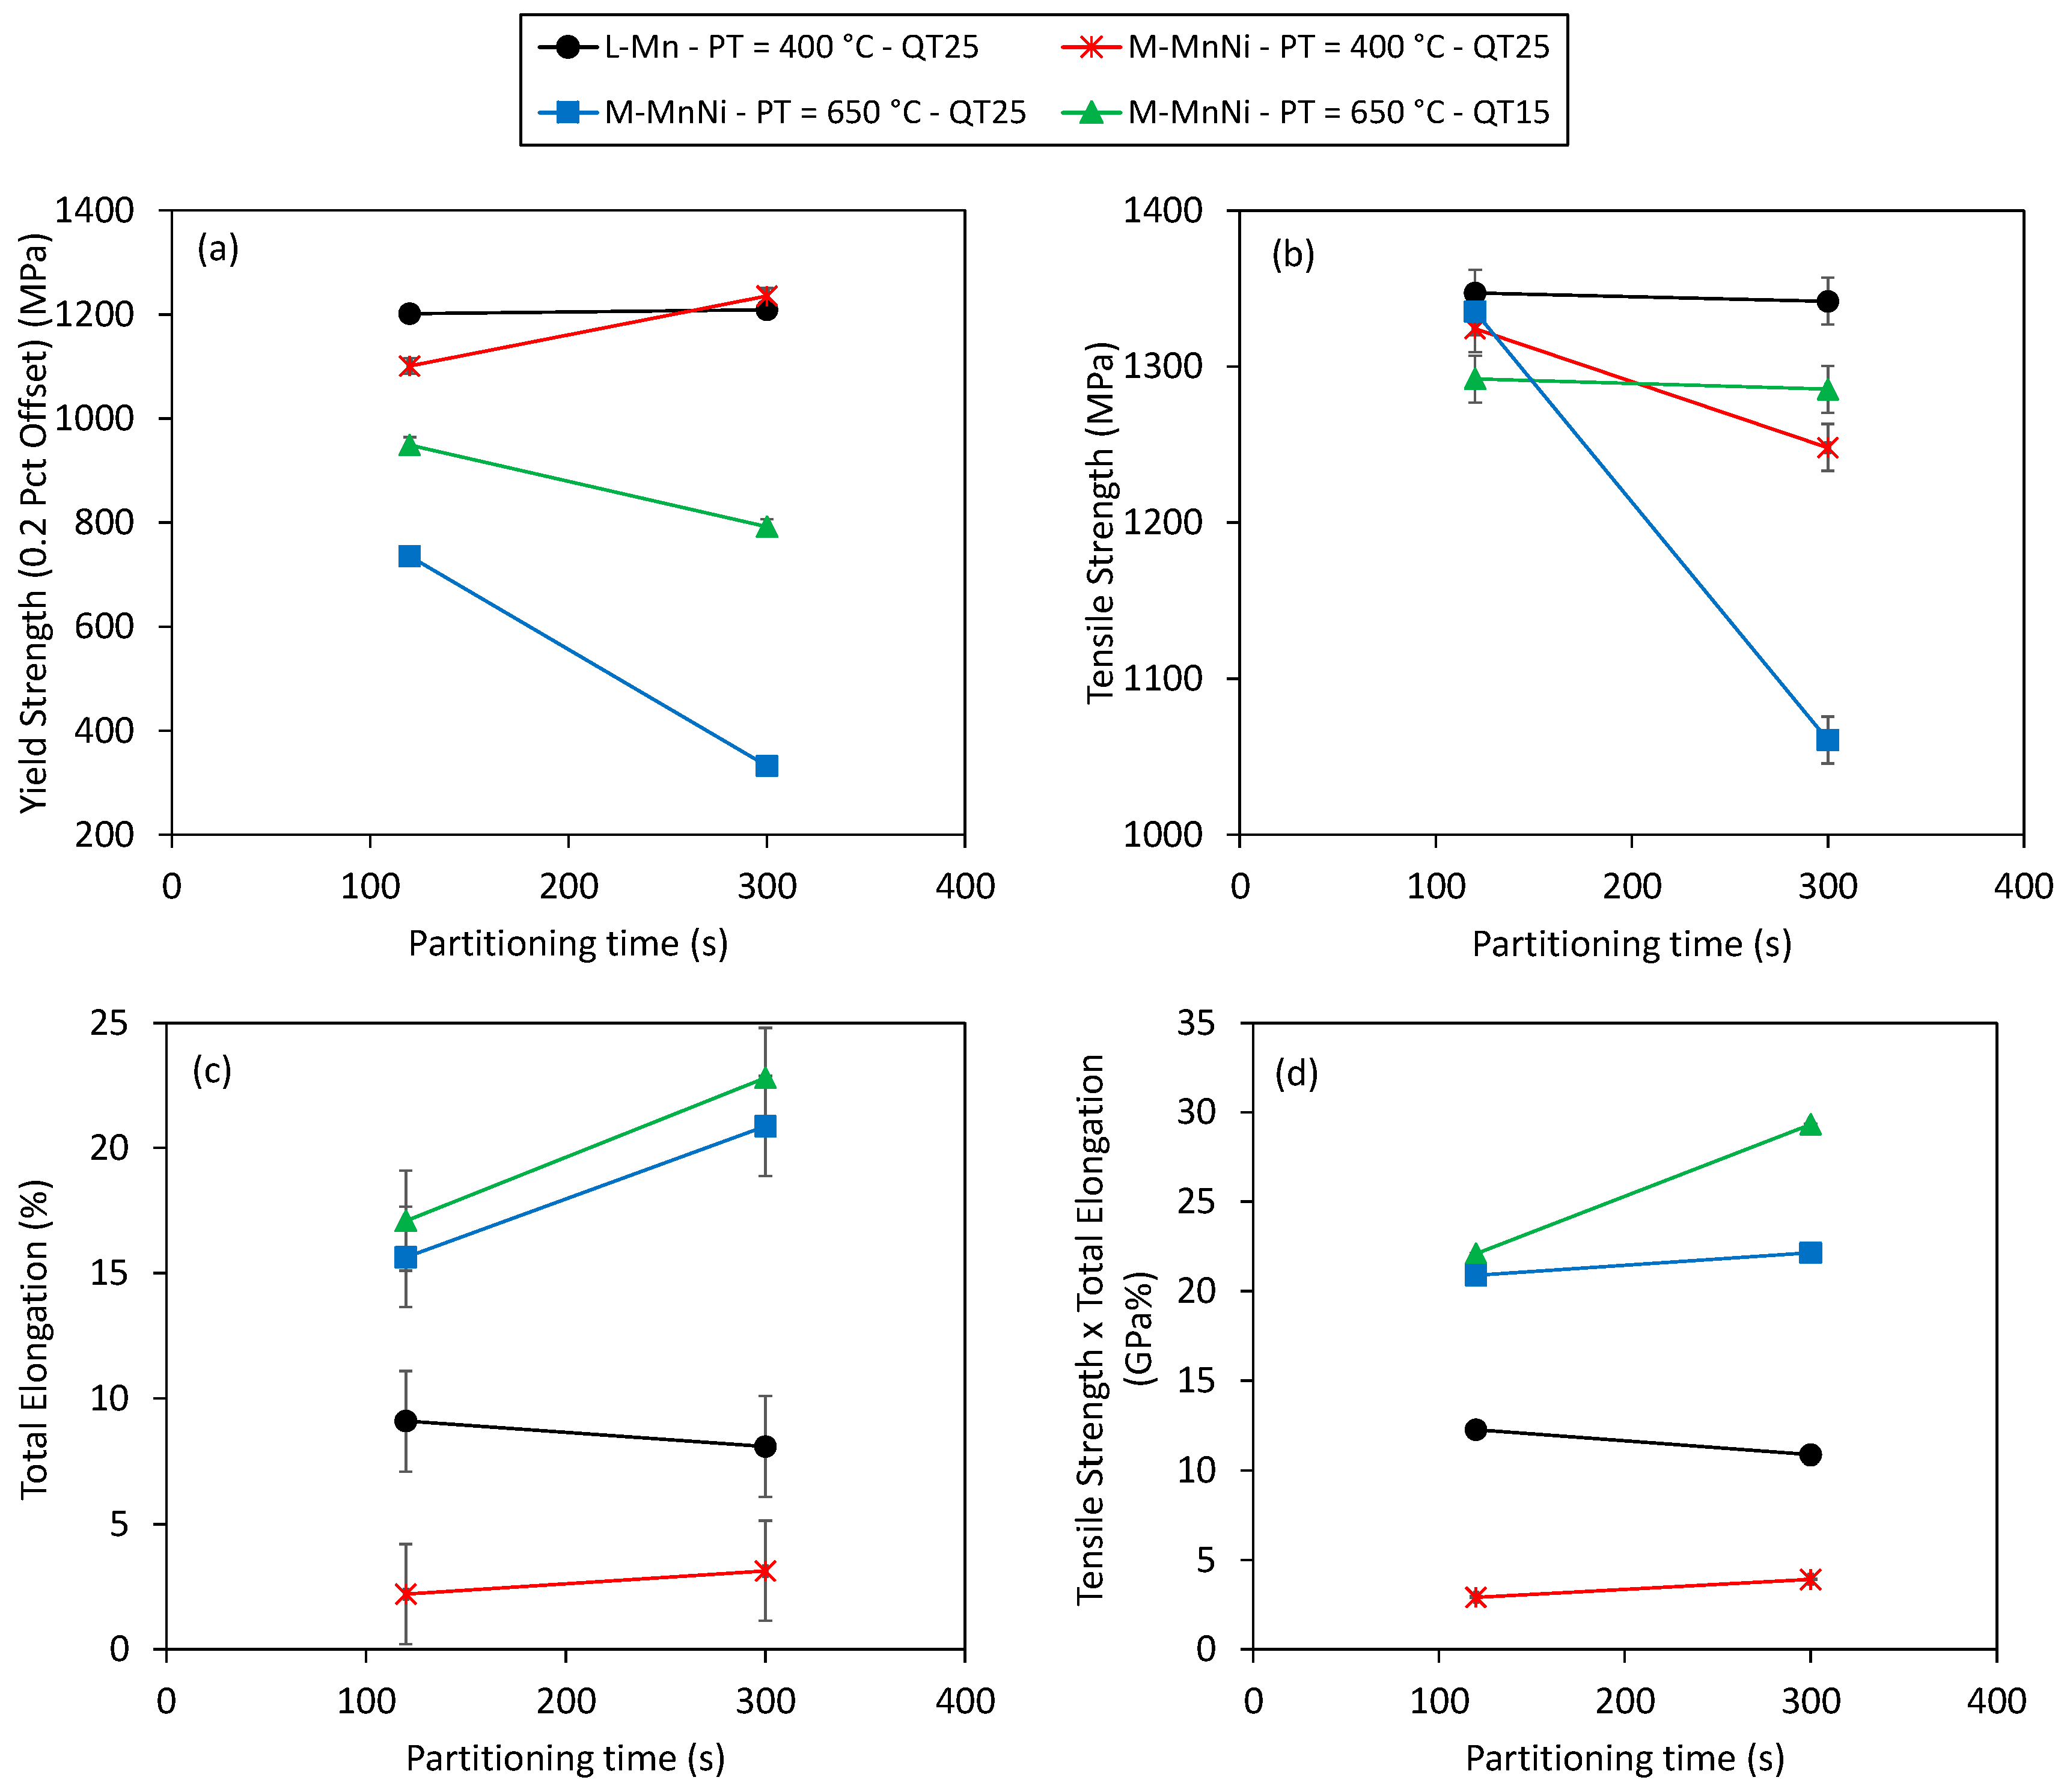
  • Tensile curves indicated good global formability, which denotes the ability of the material to undergo plastic deformation without formation of a localized neck or distributing strain uniformly.
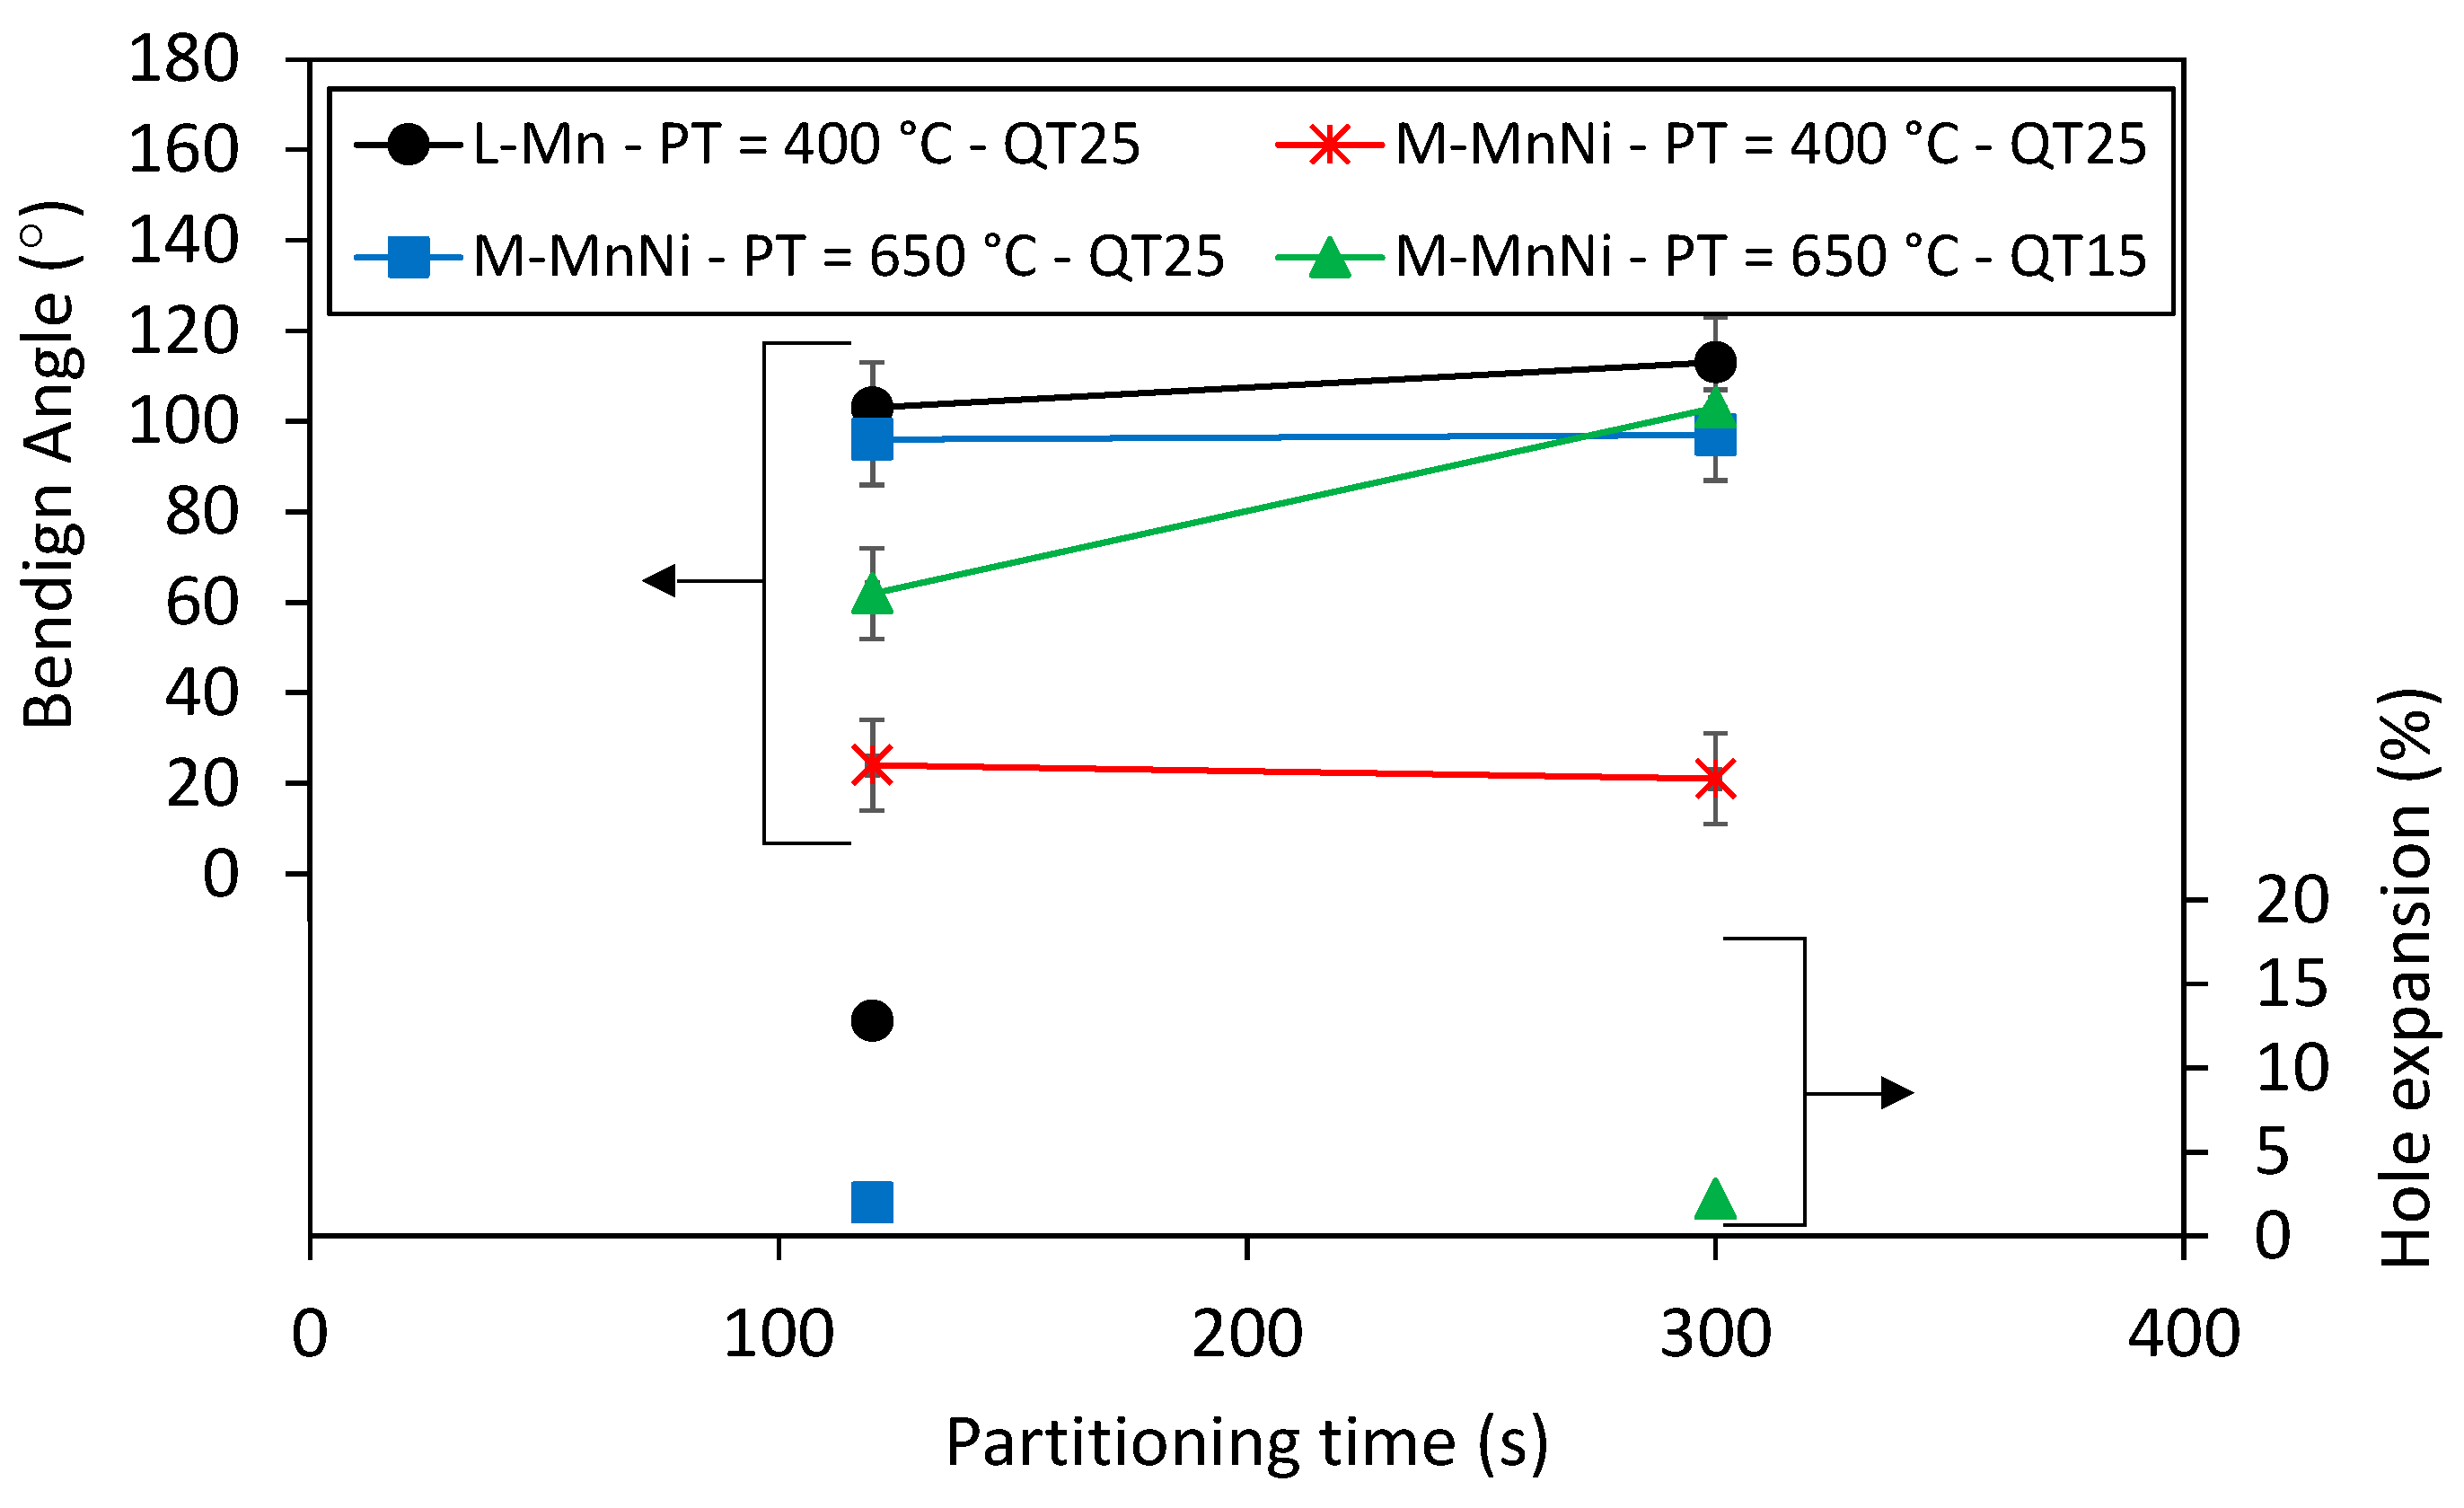
  • Tensile strength values were not significantly affected, while yield strength showed a noteworthy reduction. The decrease in yield strength was particularly strong for the QT25 and 300 s partitioning time condition. The lower yield strength can be detrimental for certain automotive applications that require anti-intrusion capacity. The low yield to tensile strength ratio can also be related to poor hole expansion capacity.
  • Total elongation values after high partitioning temperature treatments were notably higher, ranging from 16% to 23%. In this case, the values were higher for the QT15 condition and increased with the partitioning time. The product of tensile strength and total elongation revealed outstanding properties after high PT treatments, particularly in the QT15 and 300 s partitioning time condition, which resulted in 29 GPa%. In comparison, the QT25 condition resulted in a lower product of tensile strength and total elongation close to 22 GPa%, which is a more common value for the standard TRIP grades [40].
  • Continuous yielding was observed in the QT25 condition, whereas discontinuous yielding appeared in the QT15 condition. Among all Advanced High-Strength Steels, intercritically annealed medium Mn steels most frequently present discontinuous yielding [41,42]. In addition to discontinuous yielding, the Portevin–Le Chatelier (PLC) effect was another plastic instability observed in M-MnNi steel after high partitioning temperature treatment. This effect is characterized by serrated plastic flow in the tensile curves and normally is proposed to be the consequence of dynamic strain aging (DSA) [43].
In Table 3, bending and hole expansion results are also presented. Hole expansion tests were performed in some of the most interesting conditions obtained with M-MnNi steel at high partitioning temperatures. Specifically, the hole expansion behavior corresponding to the QT15 and QT25 conditions was examined. The reference L-Mn steel Q&P treated at low PT was also characterized. As can be seen from the table, very poor hole expansion results were obtained with M-MnNi steel, whereas the bending angle strongly depended on the Q&P condition.

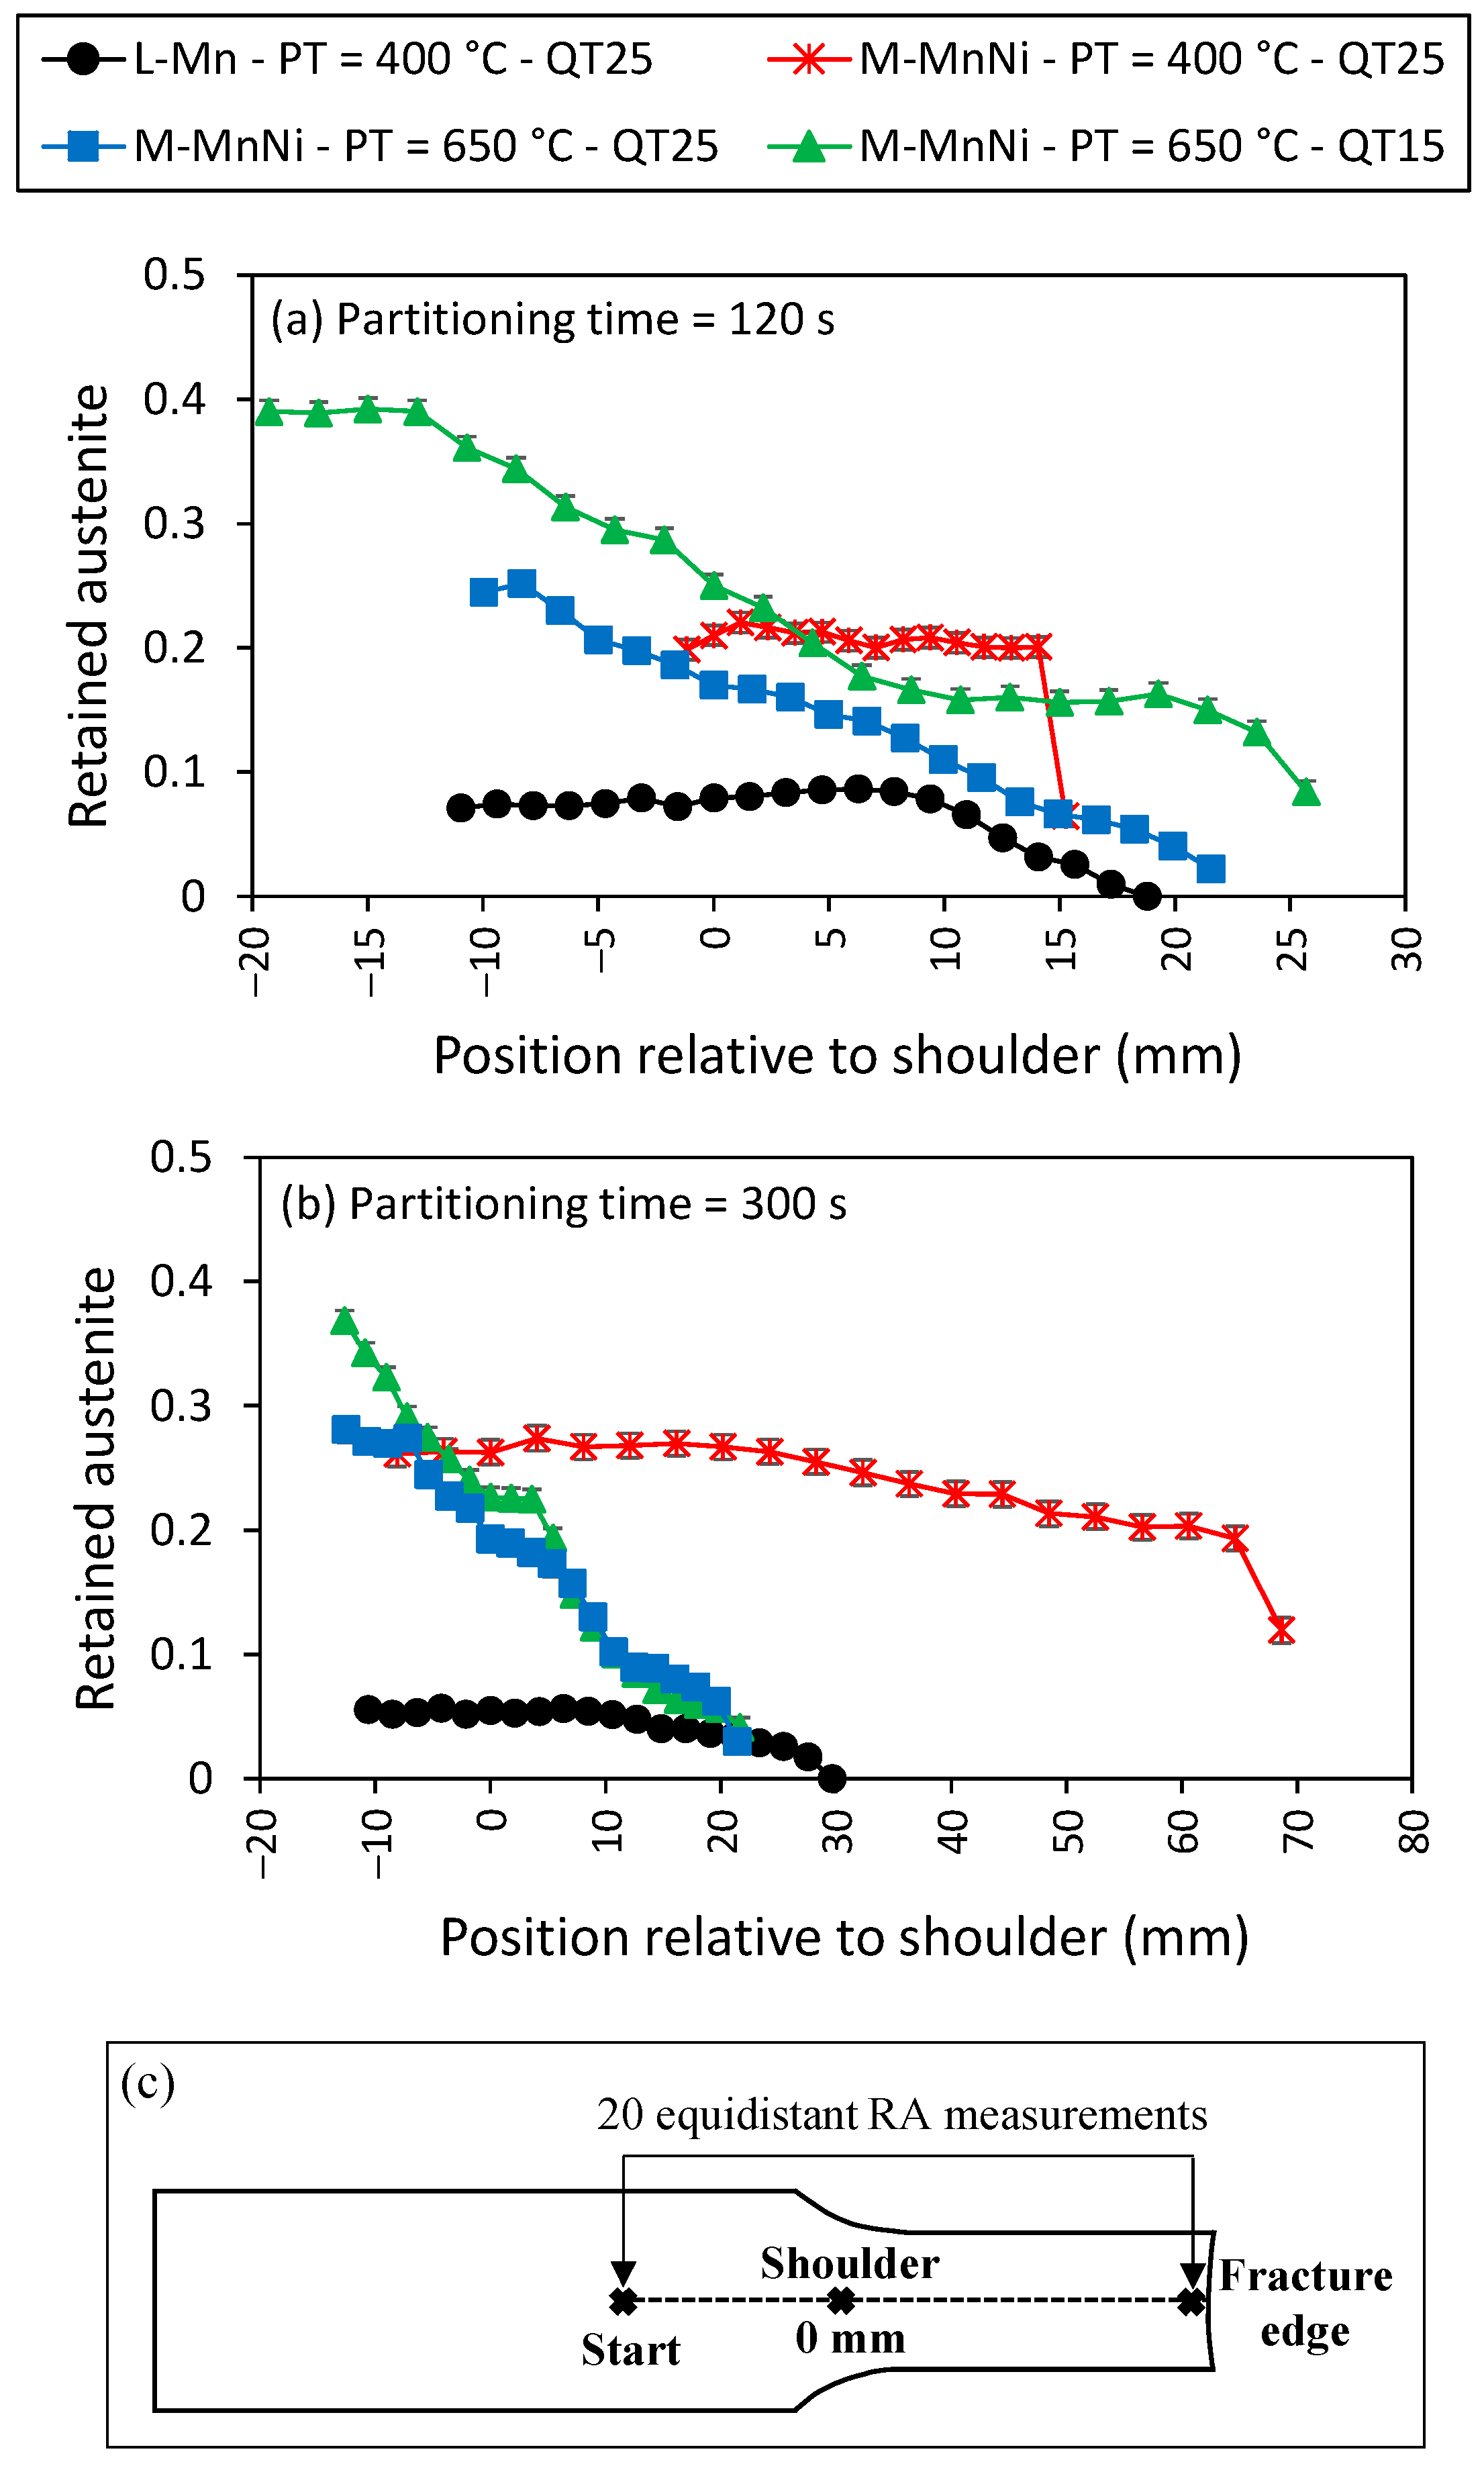
3.4. Retained Austenite Volume Fraction along Tensile Specimen Length

The evolution of the retained austenite volume fraction along the tensile specimen length measured for L-Mn and M-MnNi steels is shown for all Q&P conditions in Figure 10. In this figure, all XRD line scans are aligned at the shoulder position of the tensile test piece (denoted as 0 mm), with negative values indicating regions on the head of the sample and positive ones indicating positions on the sample shoulder radius or gauge length. In Figure 10c, a schematic of the tensile specimen showing the line where RA scans were performed is shown. The results of the line scan measurements showed a number of interesting characteristics related to the variation in austenite content with position along the tensile gauge length, which are described next:
  • The line scan for L-Mn steel shows a very flat retained austenite profile on the specimen head and radius, and then a continuous decrease in austenite content to 0% at the fracture tip. The reduction of austenite only in the plastically deformed zone of the samples suggests that the austenite transformation was induced solely by plastic strain.
  • In contrast, the M-MnNi steel with the high temperature partitioning cycle shows a progressive decrease in austenite content from the head of the specimen, through the shoulder and on the plastically deformed gauge length. This behavior is common for the two quenching temperature conditions considered. Given that the shoulder and head of the tensile specimen only experienced elastic stresses during the tensile tests, the transition in austenite content on the head and radius was interpreted as being the result of stress-induced transformation, with the austenite reduction to the fracture tip being related to strain-induced transformation.
  • The third distinct case was exemplified by M-MnNi steel given a low-temperature partitioning cycle, which showed an almost completely constant austenite content from head to within 1 mm of the fracture tip, when there is a sharp drop in the austenite fraction from 0.20 to below 0.07 and from 0.19 to 0.11, in 120 s and 300 s partitioning time conditions, respectively. As shown before, M-MnNi steel exhibited, in the low PT condition, low ductility and high yield strength (Figure 9), so it is likely that the only transformation mechanism that could operate is stress-induced transformation.

3.5. Characterization of Cold-Formed Q&P Omega Parts

Omega parts were produced by a cold-forming operation with selected L-Mn and M-MnNi steel sheets. In L-Mn steel, the Q&P condition corresponded to a QT25 quenching temperature, with the partitioning temperature and time being 400 °C and 120 s, respectively. In M-MnNi steel, the selected Q&P-treated sheet was the one with the QT15 quenching temperature and 650 °C and 300 s partitioning temperature and time. These conditions were selected since the best tensile results in terms of the product of tensile strength and total elongation (Figure 9 and Table 3) were obtained in each steel.
The Omega parts were characterized to determine the post-stamping tensile properties and retained austenite content. The results are presented in Table 4 for both steels, comparing the results found in the non-deformed and deformed areas of the part. The corresponding engineering stress–strain curves are presented in Figure 11. Both steels showed similar strengths after the stamping operation. It can be observed that the stamping operation resulted in a very significant increase in yield strength in M-MnNi steel, approaching the yield strength values shown by L-Mn steel. This behavior resulted in a notable increase in the yield to tensile ratio in M-MnNi steel after forming, in comparison with the non-deformed condition, which can be advantageous for crash resistance. Additionally, the post-stamping elongation shown by M-MnNi steel was significantly better than in L-Mn steel, which can be related to more energy absorbed during a crash event. In the non-deformed condition, some differences could be observed with regard to the properties found in the tensile tests performed with the Q&P-treated sheets (Table 3), which were the consequence of the different geometry of the tensile specimen. In particular, the total elongation found in Omega parts was significantly higher due to the lower gauge length of the tensile specimen.
In Table 4, retained austenite fractions measured on the unstrained ends of the broken tensile specimens taken from deformed and non-deformed areas are also presented. The unstrained top section of each sample showed austenite content close to the initial content, whereas the drawn sides of the part showed a significant reduction in austenite content, consistent with the combined effects of stress- and strain-induced phase transformations. In M-MnNi steel, a 0.05 austenite fraction was measured in the deformed area, which, potentially, could be useful for post-forming ductility by the TRIP effect and energy dissipation in crash testing.

4. Discussion

4.1. Microstructure Evolution during Q&P Cycles

The microstructure evolution during low and high PT cycles was analyzed based on the microstructure characterization results and dilatometry experiments.

4.1.1. Microstructure Evolution during Low Partitioning Temperature Cycles (PT = 400 °C)

The expansion during the partitioning has been related in the literature to the decomposition of austenite to bainite [16], although carbon partitioning from supersaturated martensite to austenite can also result in expansion [23,44]. Comparatively, austenite decomposition to bainite gives rise to a more pronounced expansion [16]. In the case of L-Mn steel, the volume expansion was evident, and it was likely related to austenite decomposition into bainite. The fraction of austenite measured in the final microstructure (0.07) in this steel was significantly lower than the initial austenite existing at QT (0.25), which was in agreement with the potential decomposition of austenite into bainite during the partitioning stage. The longer partitioning time likely led to a higher fraction of austenite transformed into bainite and consequently to a lower final austenite fraction. Additionally, the formation of secondary martensite was not evident in the final cooling, indicating that the untransformed austenite fraction was stable.
In the case of M-MnNi steel, the volume expansion in the partitioning was very low and XRD measurements indicated the stabilization of most of the austenite existing at QT. Therefore, in this steel, the volume expansion was likely the result of carbon partitioning from martensite to austenite. The addition of Mn and Ni contributed to effectively retarding bainite transformation and stabilizing austenite [23,28]. Furthermore, a longer partitioning time likely favored carbon homogenization in austenite, obtaining more austenite in the final microstructure. In this case, MA islands observed by FEGSEM were not detected by dilatometry.

4.1.2. Microstructure Evolution during High Partitioning Temperature Cycles (PT = 650 °C)

The high PT cycles resulted in retained austenite volume fractions equal to (QT25 and 120 s partitioning time condition) or higher than (rest of conditions) the austenite content existing at QT (Figure 7). The higher austenite content indicated the occurrence of austenite reverse transformation in the partitioning stage. Thus, the contraction observed in the dilatometry curves (Figure 5b) was related to the formation of new austenite in the partitioning. In the case where the final austenite volume fraction was the same as the initial fraction, 0.25, contraction was also observed in the partitioning, which likely means that austenite reverse transformation also occurred in the partitioning, although to a lesser extent and leading to a less stable austenite.
The high austenite volume fractions measured in the final microstructure, particularly in the QT15 condition, are comparable with values reported for intercritically annealed medium Mn steels [6,7,8]. In fact, some of the characteristics of the thermal treatments applied in the present work resemble the intercritical annealing of medium Mn steels (mainly the application of the partitioning step in the intercritical domain). The main difference with respect to this process is, on the one hand, that the stabilization of the high amounts of austenite was produced in partitioning times of 120 s and 300 s, which are notably lower than the conventional times (hours) employed in the intercritical annealing of medium Mn steels. On the other hand, there is a significant amount of austenite present in the initial microstructure and its influence on the austenite reversion phenomenon needs to be taken into consideration. Wei et al. [45] studied austenite growth during intercritical annealing from as-quenched martensite containing interlath retained austenite, concluding that austenite grew from thin austenite films between laths retained upon quenching, but also austenite nucleated at lath boundaries and packet boundaries of martensite and within laths. Similar results were obtained in [29], where it was also concluded that the fact that the existing austenite could grow directly without nucleation would enhance the kinetics of austenite reversion. This means that the time needed for the austenite reversion process would decrease and may explain the high austenite fractions obtained in the present work when employing significantly lower partitioning times.
In addition, the quenching temperature strongly influenced the final RA fractions and microstructure features, thereby obtaining a higher volume fraction of RA and finer lath-type RA and MA islands in the QT15 condition. The quenching temperature determines the characteristics of the microstructure prior to the austenite reversion. The martensitic transformation starts with the formation of coarse martensite. At lower temperatures, the formation of fine martensite laths separates austenite into smaller sizes. Liu et al. [46] found that the austenite lath size strongly decreased with QT. Thus, in the present work, it is likely that the QT15 condition provided a finer initial martensite/austenite microstructure and/or more sites for the nucleation of new austenite in the partitioning, which resulted in a finer final microstructure. In the case of the QT25 condition, coarse MA blocks were identified in the microstructure (Figure 6c), which may indicate the prevalence of austenite growth during the partitioning stage and subsequent transformation during cooling.
The higher final fractions of RA measured in the QT15 condition could be explained based on the following observations.
  • The comparison among the dilatometry traces obtained with the two QT conditions (Figure 5b) reveals that the lower initial austenite volume fraction (QT15 condition) resulted in a more pronounced contraction of the dilatometry sample. This means that the amount of newly formed austenite was higher in QT15. Ding et al. [29] also found that the contraction in partitioning increased with a decreasing amount of pre-existing austenite. In any case, the curves revealed that equilibrium was not reached in any of the conditions applied, as contraction continuously decreased without showing a plateau.
  • After partitioning, secondary martensite transformation was not observed, regardless of the QT condition. However, FEGSEM images revealed the formation of secondary martensite, particularly for the QT25 condition. This means that the fraction was low and/or that the transformation occurred below the temperature where the dilatometry ended, which was around 35 °C. Moreover, the QT15 condition was expected to result in less secondary martensite formed in the final cooling. This can be explained based on the influence of the initial austenite size on Mn partitioning, as follows. The measured carbon content seemed to be rather low to stabilize such an amount of austenite at room temperature. This means that there are other factors that allow such stabilization. In many publications on medium Mn steels, the austenite stability is explained by Mn partitioning between ferrite and austenite during long-term soaking in the intercritical temperature range [4,8,47]. However, some investigations demonstrate that Mn partitioning occurs also in short annealing periods. De Moor et al. [48] pointed out that the high density of dislocations and the grain boundaries should facilitate Mn diffusion. In [13], the concentration of Mn in austenite reached 11.6 wt.% after annealing for a short time of 180 s in 6 wt.% Mn-containing steel. Therefore, in this work, a certain Mn partitioning could be expected, contributing to austenite stabilization. Additionally, the relatively strong partitioning of Mn is also facilitated by the small size of austenite grains (short diffusion paths). Based on this, the finer austenite grains in the QT15 condition could be favorable for Mn partitioning and result in more effective austenite stabilization. Finally, the finer structure at QT15 is expected to result in a finer austenite after partitioning, and hence in a more stable austenite [49].
Therefore, the higher final fractions of RA measured in the QT15 condition could be explained as being the result of more austenite formed in the partitioning, as denoted by the higher contraction in the dilatometry curve, and increased austenite stabilization due to a finer microstructure and possibly Mn partitioning, assuming that the transformation into martensite in the final cooling occurred to a lesser extent.

4.2. Analysis of Mn and Ni Partitioning Using DICTRA

From the previous discussion, it is clear that the potential Mn partitioning occurring in the partitioning stage becomes relevant. To better understand the Mn partitioning phenomenon, the austenite formation process during the partitioning stage was theoretically studied by means of DICTRA. For the diffusion simulations in the vicinity of the martensite/austenite interface, linear cell geometry was used as it is considered appropriate for this kind of system [50]. A single cell with two regions (martensite on the left and austenite on the right) was used considering that the interface between the two regions was mobile. The conditions at the moving interface were determined by the local equilibrium approach, which means that the chemical potentials of all diffusing elements assume the same value in ferrite and austenite. Diffusion of Mn and Ni was considered in the calculations. Data for initial austenite and martensite lath size were taken from the literature. A constant martensite lath width equal to 200 nm was assumed for the initial conditions. This is based on the transmission electron microscopy observations of Krauss and co-workers, indicating that most martensitic lath widths range approximately from 150 to 200 nm [51,52]. Corresponding austenite dimensions were obtained using the “constant ferrite width approach” [53]. Considering 0.15 and 0.25 volume fractions of austenite (QT15 and QT25 conditions, respectively), austenite lath widths equal to 36 and 66 nm were obtained. Because of symmetry, only the half thickness was considered in DICTRA in the calculation domain. Figure 12a shows a schematic of the system considered in the simulations.
Figure 12b,c show the composition profiles of Mn and Ni alloying elements, respectively. The profiles were calculated at PT = 650 °C for M-MnNi steel, considering 120 s and 300 s partitioning times. The interface moved towards the ferrite side, leaving behind an austenite with changed composition. It can be seen that the QT15 condition resulted in more new austenite formed, as the interface was shifted to longer distances. Consequently, the final austenite volume fractions, indicated as fg in Figure 12b, were quite similar for both QT conditions. This was true for both partitioning time conditions and agrees with the previously described higher contraction observed in dilatometry curves in the QT15 condition and the results reported in [29].
The simulations revealed that both Mn and Ni were partitioned from martensite to austenite. Moreover, the fraction of austenite phase enriched in Mn and Ni depended on the QT condition. In the case of the QT15 condition, the fractions of austenite enriched in Mn were 0.48 and 0.58, for 120 s and 300 s partitioning time conditions, respectively. In the case of the QT25 condition, these fractions were 0.40 and 0.49, hence significantly lower. Similar behavior was observed for Ni partitioning. This is in line with the previously discussed higher austenite thermal stability in the QT15 condition due to the higher partitioning of substitutionals. The austenite area enriched in Mn presented a quite homogeneous Mn concentration, which was close to the equilibrium value, 7.46 wt.%. Concerning the Ni concentration, it was less homogeneous and, close to the interface, presented values above equilibrium in the 300 s partitioning time conditions.
For the QT15 and 300 s partitioning time condition, the local fraction of austenite that was stable upon quenching to room temperature was estimated by using the Andrews equation for martensite start temperature calculation [54] and the Koistinen–Marburger relationship [55]. The final retained austenite fraction was calculated by integration of the area under the local fraction of stable austenite curve. This procedure was explained in [56] and predicted that the austenite retained in this condition was 0.15. This value was significantly lower than the experimentally measured value, 0.37 (Figure 7), which means that DICTRA calculation could underestimate the Mn and Ni enrichment of austenite. One possible explanation could be related to the fact that, in the defined system, ferrite was considered instead of martensite, since martensite is not included as a separate phase in the thermodynamic and kinetic databases. The thermodynamic properties of martensite are very much the same as those of ferrite; however, the kinetic parameters may deviate between the two phases due to the larger number of lattice defects, particularly dislocations, in martensite. Dimitrieva et al. [57] demonstrated that, provided that the mobilities of all alloying elements in martensite were increased compared to ferrite, the composition profiles obtained by means of DICTRA agreed with those experimentally measured. In the present work, more experimental research employing high-resolution techniques such as Transmission Electron Microscopy or Atom Probe Tomography would be needed to better elucidate Mn and Ni partitioning from martensite to austenite. On the other hand, the stability of the austenite according to DICTRA simulations could be underestimated also due to the austenite size effect (sizes were very small, which can enhance the stability) and the effect of constraining by the martensite matrix, which were not taken into account.

4.3. Mechanical Stability of Austenite

It has long been accepted that mechanically induced α’ martensite can form in steels by two distinct methods: stress-induced transformations below the yield strength, where elastic stresses can modify the driving force required to initiate transformation to such a degree that transformation occurs isothermally from the same sites, which would otherwise form martensite athermally during cooling [58]; and strain-induced transformations above the yield strength, where the rotation and intersection of slip planes produced by plastic strain in the FCC lattice form martensite nucleation sites, from which stresses then induce the martensitic transformation [59].
The line scans presented very different trends when comparing L-Mn steel and M-MnNi steel at low PT and M-MnNi steel at high PT (Figure 10), which were interpreted as being directly related to apparent differences in austenite behavior and transformation mechanisms.
  • In L-Mn steel, the austenite fraction was only 0.08 before deformation; therefore, very little stress-assisted transformation was estimated to have occurred, and almost all the austenite appeared to be consumed by strain-induced transformation above the yield stress. This is probably close to ideal behavior, in that the austenite that is present appears to be progressively consumed during plastic straining, without transformation at lower stress levels.
  • In M-MnNi steel at high PT, retained austenite content was rather high before deformation. Under mechanical loading, significant stress-induced transformation occurred below the yield stress. Thus, stress-assisted austenite transformation contributed to the initial yielding behavior, resulting in a low yield strength. The austenite, which was stable at stresses above the yield stress, provided significant TRIP-assisted ductility. However, probably, the overall austenite stability was lower than in the case of low-temperature partitioning cycles.
  • The transformation stability of austenite is affected by the local carbon content in austenite, the grain size, morphology, the constraining effect of the phases surrounding the austenite and the crystallographic orientation of the austenite with respect to the loading direction [60,61,62]. In this case, the carbon content was significantly lower than in L-Mn steel, which likely strongly determined the mechanical stability. Additionally, Hidalgo et al. [63] demonstrated that austenite surrounded by a stronger martensite matrix was mechanically more stable than austenite surrounded by a weaker martensite. Thereby, in the present case, the weaker martensite at higher temperatures would likely also contribute to decreasing austenite stability. The grain size effect on transformation driving force and austenite stability is poorly understood for small austenite grain sizes and non-polygonal austenite, both of which are present in these types of Q&P/austenite reversion annealing microstructures. As a result, more theoretical work is required before a robust material design framework can be made available to allow the optimization of austenite’s mechanical stability.
  • In M-MnNi steel at low PT, given the observed extremely sharp transition in austenite to the fracture tip, it was hypothesized that local high elastic stresses around microcracks or other damage features produced local massive stress-induced transformations and an early fracture.

4.4. Relationship between Mechanical Properties and Microstructure

The effects of high partitioning temperature treatments on Mn- and Ni-containing steel were evident in the resulting microstructural constituents (significant fractions of austenite were successfully stabilized) and tensile stress–strain curves (significant global formability, lower yield strength and different yielding behavior depending on QT condition). In multiphase steels, generally, materials with strong hardness differences among the phases present better global formability [64]. In contrast, steels with a low hardness ratio among the phases give rise to higher local forming ability. When comparing the microstructures resulting from low and high PT treatments applied in M-MnNi and L-Mn steels, respectively, there were several microstructural features that may influence the expected hardness ratio. On the one hand, after high PT treatments, the martensitic matrix was expected to be softer as a result of the more intense tempering. On the other hand, the lower-stability RA likely transformed quite early to martensite, introducing a hard phase into the microstructure. Therefore, the softer matrix and the early introduction of a hard constituent in the microstructure could indicate a higher hardness ratio after high PT treatments.
The effects of QT in high partitioning temperature cycles were evident in the yielding behavior. Different mechanisms have been proposed for the occurrence of discontinuous yielding. These mechanisms have been recently reviewed by Raabe et al. in [39]. One of the mechanisms is related to the presence of a high area fraction of the grain boundaries in ultrafine-grained microstructures. It has been observed that, in some materials, such as pure Al, austenitic steels and interstitial-free (IF) steels, which normally show a continuous yielding behavior, discontinuous yielding becomes prevalent when their grain sizes are reduced to an ultrafine level [65]. According to Sun et al. [41], ultrafine grain size could also play a significant role in the occurrence of discontinuous yielding in intercritically annealed medium Mn steels. In the present work, the fact that discontinuous yielding was observed in the QT15 condition could be related to the presence of a finer microstructure, as observed by means of FEGSEM, although a more detailed examination of the microstructure would be required.
The Portevin–Le Chatelier (PLC) effect was another plastic instability observed in M-MnNi steel after high partitioning temperature treatment. Medium Mn steels with an ultrafine-grained ferrite and austenite microstructure with a globular grain morphology have also been reported to present this effect. Raabe et al. [39] argue that the proposed mechanisms to explain PLC steels cannot be directly adopted for these types of steel, due to their very different microstructures and deformation mechanisms. In [39], some findings related to this phenomenon in medium Mn steels are reviewed, such as the occurrence of this phenomenon only in the intermediate austenite stability range [42] and the formation of PLC bands always accompanied by local martensite formation inside these bands [66].
The influence of quenching temperature and partitioning time conditions on tensile properties was related to the observed microstructure. In Figure 13, the average values of YS (Figure 13a), TS (Figure 13b), TEL (Figure 13b) and the product of TS and TEL (Figure 13d) are represented as a function of partitioning time for both steels and QT conditions. In the low PT treatment, M-MnNi steel presented slightly lower tensile strength than the L-Mn steel, which means that neither the higher alloying content nor the higher amount of RA contributed to increasing strength. In the high PT treatments, higher strengths were obtained at shorter times, at both the QT15 and QT25 conditions. Moreover, interestingly, the strengths obtained at the shortest times were comparable to the strengths obtained at low partitioning temperature conditions. It seems that at a shorter time, the strain-induced transformation of austenite provided enough hardening to compensate for the expected softening of the martensitic phase by tempering. At longer times, however, a stronger softening of the martensite could be expected, which, overall, decreased the tensile strength. The decrease in strength with Pt was significant particularly for the QT25 condition, which could be a consequence of the coarser microstructure in comparison with the QT15 condition. The decrease in YS was particularly strong for the QT25 condition, which, as for TS, could be related to the coarser microstructure in this case, although austenite’s mechanical stability could also play a role.
The total elongation strongly depended on the alloy and the Q&P condition. In the high PT treatments, outstanding elongation values were obtained, which were related to the strain-induced transformation of austenite. In this case, elongation improved by increasing the partitioning time, which could be related to the stronger tempering of martensite at longer times and/or a better TRIP effect. The elongation was higher in the QT15 condition, which means that the finer microstructure observed in this case contributed to the enhanced elongation, although, as indicated earlier, austenite’s mechanical stability could also play a role.
Bending and hole expansion results are also represented as a function of partitioning time in Figure 14. The reference L-Mn steel exhibited a very good bending angle, which was in agreement with the behavior observed in the tensile test (high local formability). The low PT applied in M-MnNi steel resulted in a very poor bending angle, in agreement with the low elongation values obtained in this condition. Interestingly, M-MnNi steel treated at high PT also presented a very good bending angle. In the low QT and 300 s Pt condition, the bending angle was almost as good as in L-Mn steel. However, it was not accompanied by a good response in the hole expansion test, showing that the M-MnNi steel has poor hole expansion behavior. In the hole expansion test, the strain is more localized than in the bending tests. The microstructure of steels processed by a low PT cycle, containing tempered martensite, low bainite, retained austenite and fresh martensite in various proportions, possesses a very serious advantage as the difference in hardness between microstructure constituents is not very significant so that the stress distribution upon loading is relatively uniform [14]. It can explain the better hole expansion results obtained in L-Mn steel. In M-MnNi steel, low-stability RA likely transformed quite early to martensite, introducing a hard and brittle phase into the area of highest strain. A significant hardness difference between microstructural constituents has been found detrimental for hole expansion [64,67]. Additionally, given the low expected mechanical stability of austenite, likely a fraction of martensite was available after punching the hole due to the massive TRIP effect during the punching operation, which further contributes to the hardness gradients, resulting in very poor hole expansion. Hole expansion could be improved by decreasing the strength difference between the soft and hard phases. This could be achieved in two different ways: (i) additional tempering for the hard phase; (ii) increase in the strength of the soft phase by microalloying, although this would imply a change in the composition and it would be necessary to find new optimum conditions. Additionally, laser cutting could be a solution (as in hot stamping) for the industrialization of M-MnNi steel.

5. Conclusions

In the present study, the effects of applying a high partitioning temperature that corresponded to the start of the ART phenomenon were investigated in a medium Mn-Ni steel. The major conclusions of this investigation are as follows:
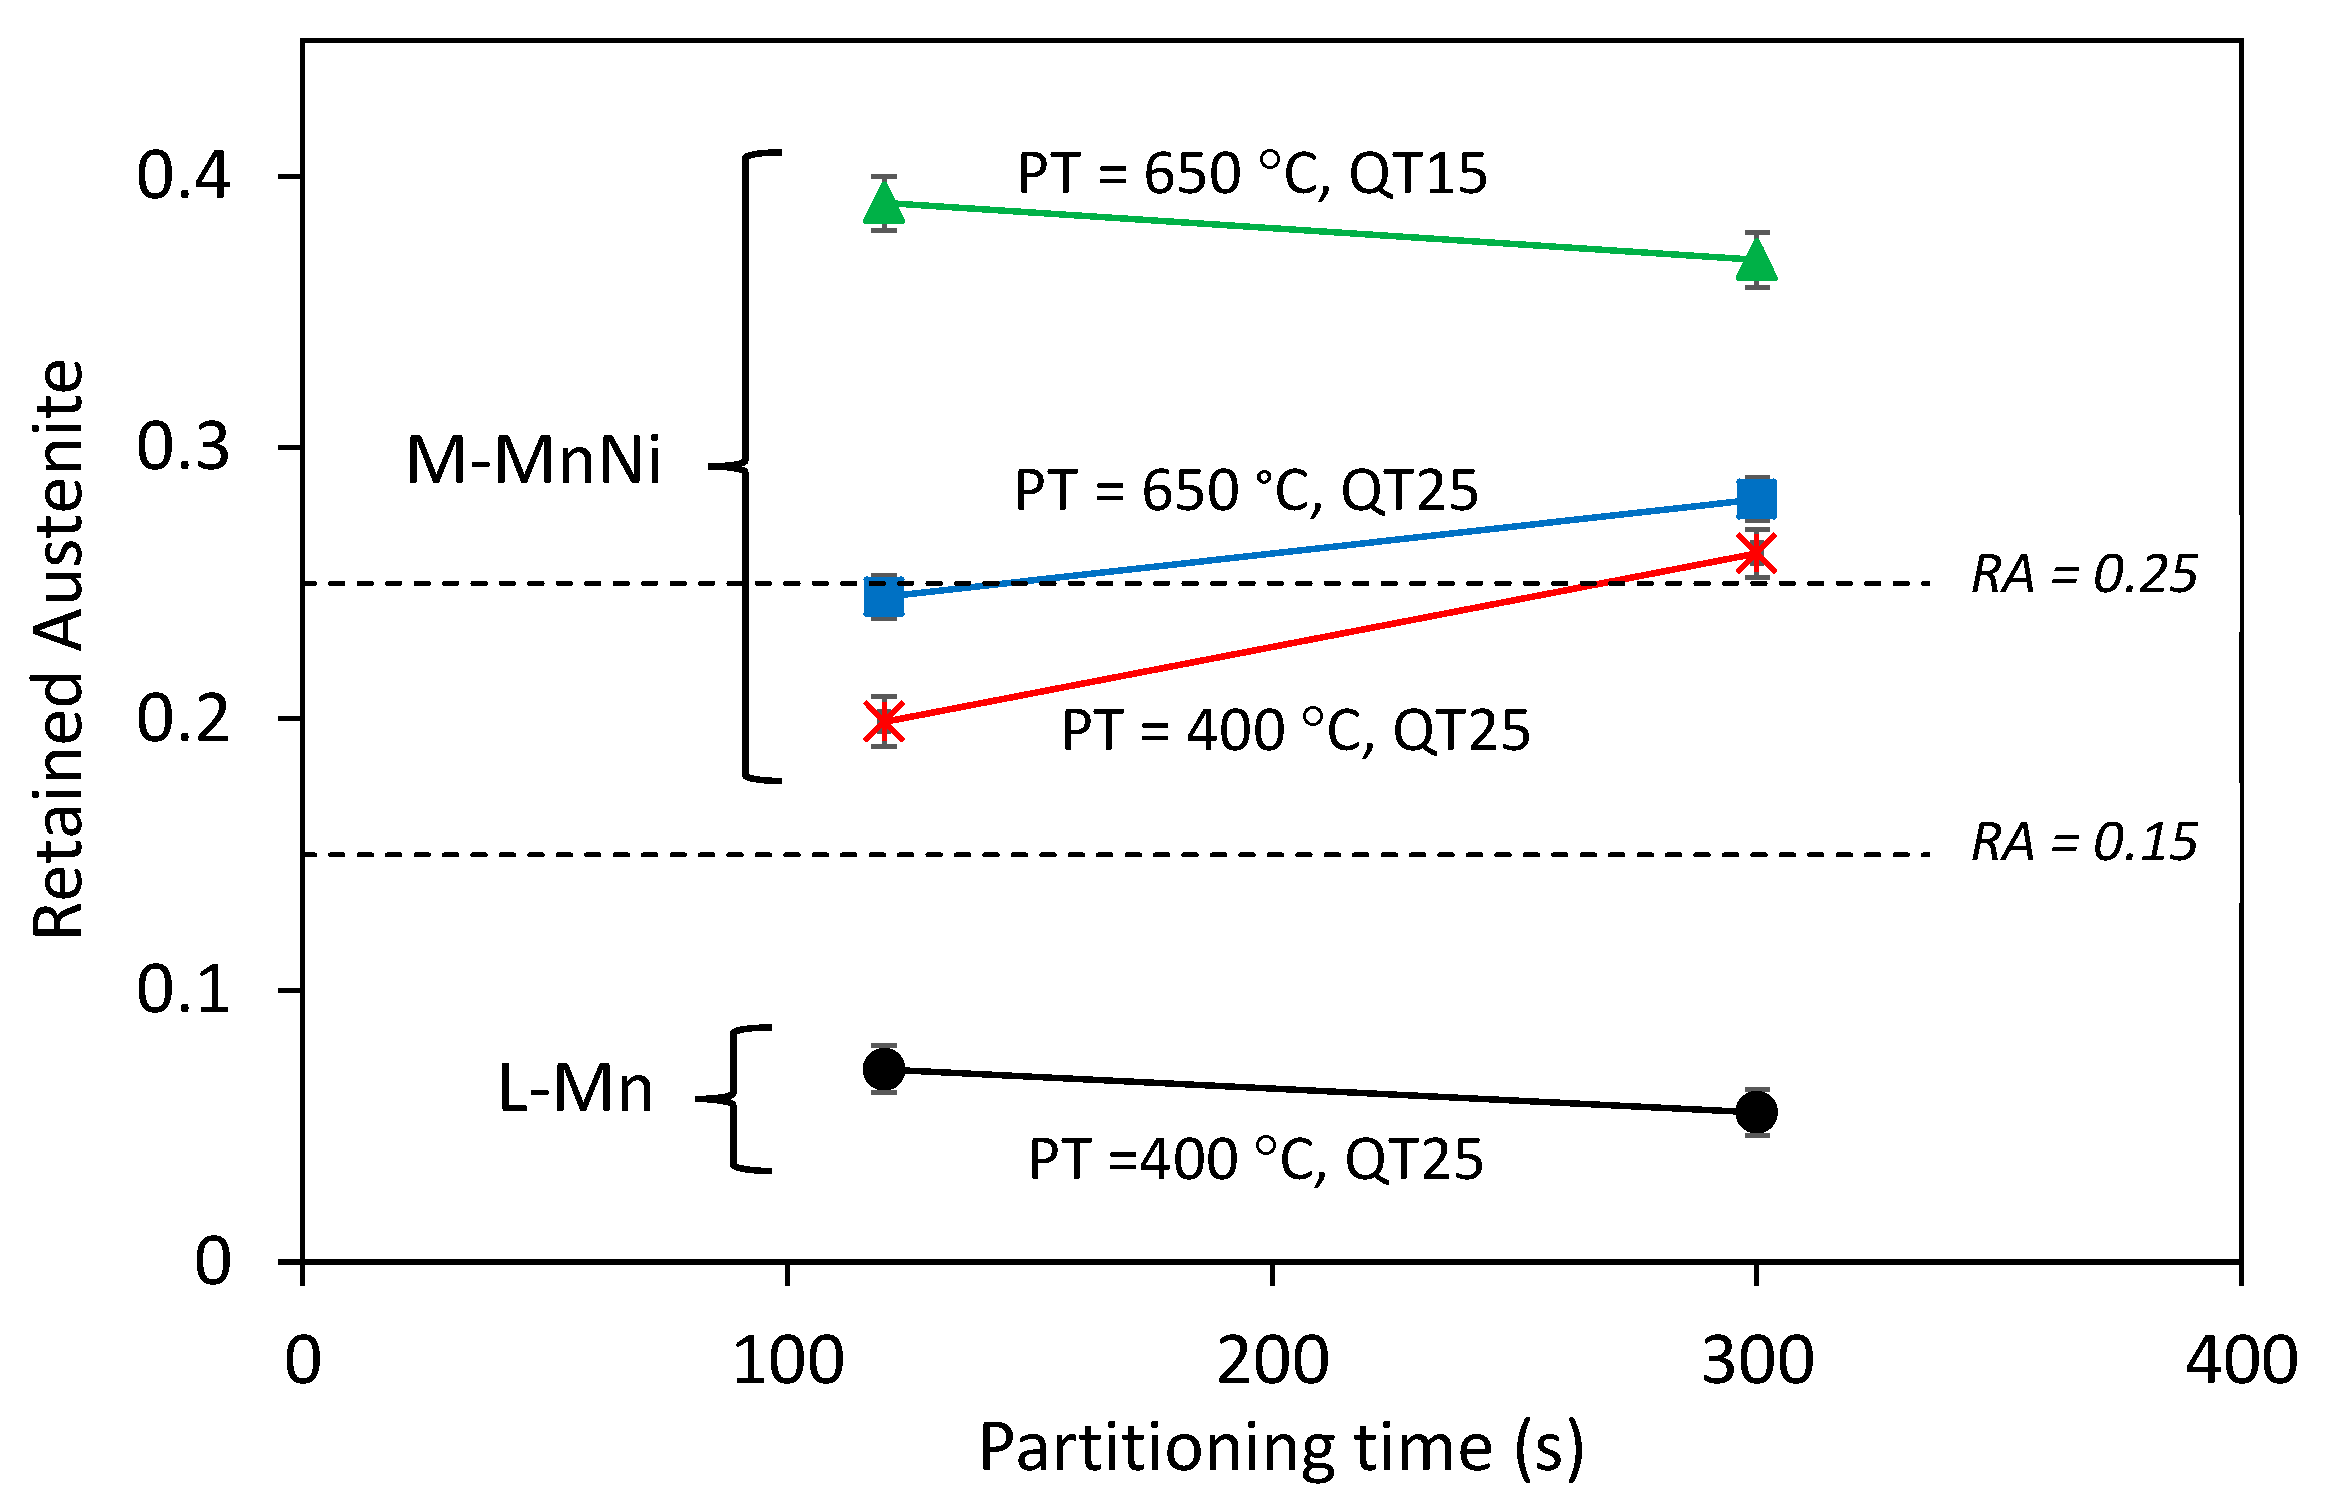
  • High volume fractions of austenite, in the range of 0.25–0.40, were obtained after short partitioning times, which was explained by the fact that new austenite could form not only by nucleating new grains but also by the direct growth of initial austenite, enhancing the kinetics of austenite reversion.
  • Quenching temperature strongly influenced both the final microstructure features and the austenite’s thermal stability. The lowest QT condition led to a final microstructure with more and finer retained austenite and finer MA islands.
  • The medium Mn-Ni steel and associated high partitioning temperature Q&P cycles resulted in very promising tensile strength/elongation balances. The best results (29 GPa%) were obtained in the lowest QT condition. Under mechanical loading, significant stress-induced transformation was expected to have occurred below the yield stress. The austenite that was stable at stresses above the yield stress provided significant TRIP-assisted ductility. However, the overall austenite stability was considered to be relatively low due to the low carbon content of austenite and the constraining effect of the weaker surrounding martensite.

Author Contributions

Conceptualization, M.A., A.A., D.M., D.D.C. and M.J.S.; Funding acquisition, M.A., T.G., A.A., D.M., D.D.C. and M.J.S.; Investigation, M.A., E.D.M., T.G., A.A., D.M., S.A. and M.J.S.; Project administration, M.A. and T.G.; Writing—original draft, M.A.; Writing—review and editing, M.A., E.D.M., T.G., A.A., D.M., S.A. and M.J.S. All authors have read and agreed to the published version of the manuscript.

Funding

This research was funded by the Research Fund for Coal and Steel, grant number 709855.

Institutional Review Board Statement

Not applicable.

Informed Consent Statement

Not applicable.

Data Availability Statement

The raw data required to reproduce the findings of this research study cannot be shared at this time as the data also form part of an ongoing study.

Conflicts of Interest

The authors declare no conflict of interest. The funders had no role in the design of the study; in the collection, analyses, or interpretation of data; in the writing of the manuscript, or in the decision to publish the results.

References

  1. Matlock, D.K.; Speer, J.G.; De Moor, E.; Gibss, P. Recent developments in advanced high strength sheet steels for automotive applications: An overview. Jestech 2012, 15, 1–12. [Google Scholar]
  2. Radhakanta, R. Special issue on medium manganese steels. Mater. Sci. Technol. 2019, 35, 2039–2044. [Google Scholar] [CrossRef]
  3. Speer, J.; Matlock, D.K.; De Cooman, B.C.; Schroth, J.G. Carbon partitioning into austenite after martensite transformation. Acta Mater. 2003, 51, 2611–2622. [Google Scholar] [CrossRef]
  4. Miller, R.L. Ultrafine-Grained Microstructures and Mechanical Properties of Alloy Steels. Metall. Trans. 1972, 3, 905–912. [Google Scholar] [CrossRef]
  5. Furukawa, T. Dependence of strength—Ductility characteristics on thermal history in low carbon 5 wt.% Mn steels. Mater. Sci. Technol. 1989, 5, 465–470. [Google Scholar] [CrossRef]
  6. Gibbs, P.J.; De Moor, E.; Merwin, M.J.; Clausen, B.; Speer, J.G.; Matlock, D.K. Austenite stability effects on tensile behavior of manganese-enriched-austenite transformation-induced plasticity steel. Metall. Mater. Trans. A 2011, 42A, 3691–3702. [Google Scholar] [CrossRef]
  7. Arlazarov, A.; Gouné, M.; Bouaziz, O.; Hazotte, A.; Petitgand, G.; Barges, P. Evolution of microstructure and mechanical properties of medium Mn during double annealing. Mater. Sci. Eng. A 2012, 542, 31–39. [Google Scholar] [CrossRef]
  8. Kim, D.E.; Park, Y.K.; Lee, O.Y.; Jin, K.G.; Kim, S.J. Formation of retained austenite and mechanical properties of 4~8%Mn hot rolled TRIP steels. Korean J. Mater. Res. 2005, 15, 115–120. [Google Scholar] [CrossRef] [Green Version]
  9. Merwin, M.J. Microstructure and properties of cold rolled and annealed low carbon manganese TRIP steels. In Proceedings of the AIST Steel Properties & Applications Conference, Detroit, MI, USA, 16–20 September 2007. [Google Scholar]
  10. Shi, J.; Sun, X.; Wang, M.; Hui, W.; Dong, H.; Cao, W. Enhanced work-hardening behavior and mechanical properties in ultrafine-grained steels with large-fractioned metastable austenite. Scr. Mater. 2010, 63, 815–818. [Google Scholar] [CrossRef]
  11. Bhattacharya, A.; Bokinala, P.K.; Mitra, R.; Chakrabarti, D. Relative effect of C and Mn on strength-toughness of medium Mn steels. Mater. Sci. Technol. 2019, 35, 55–67. [Google Scholar] [CrossRef]
  12. Du, P.J.; Yang, D.P.; Bai, M.K.; Xiong, X.C.; Wu, D.; Wang, G.D.; Yi, H.L. Austenite stabilisation by two step partitioning of manganese and carbon in a Mn-TRIP steel. Mater. Sci. Technol. 2019, 35, 2084–2091. [Google Scholar] [CrossRef]
  13. Lee, S.; De Cooman, B.C. On the Selection of the Optimal Intercritical Annealing Temperature for Medium Mn TRIP Steel. Metall. Mater. Trans. A 2011, 44, 5018–5024. [Google Scholar] [CrossRef] [Green Version]
  14. Fonstein, N. Advanced High Strength Sheet Steels, Physical Metallurgy, Design, Processing and Properties; Springer International Publishing: Cham, Switzerland, 2015. [Google Scholar]
  15. De Moor, E.; Matlock, D.K.; Speer, J.G.; Fojer, C.; Penning, J. Comparison of Hole Expansion Properties of Quench & Partitioned, Quenched & Tempered and Austempered Steels; SAE Technical Paper Series. In Proceedings of the SAE International 2012 World Congress & Exhibition, Detroit, MI, USA, 24–26 April 2012. [Google Scholar]
  16. Santofimia, M.; Zhao, L.; Petrov, R.; Kwakernaak, C.; Sloof, W.G.; Sietsma, J. Microstructural development during the quenching and partitioning process in a newly designed low carbon steel. Acta Mater. 2011, 59, 6059–6068. [Google Scholar] [CrossRef]
  17. De Moor, E.; Speer, J.G.; Matlock, D.K.; Kwak, J.-H.; Lee, S.-B. Effect of carbon and manganese on the quenching and partitioning response of CMnSi steels. ISIJ Int. 2011, 51, 137–144. [Google Scholar] [CrossRef] [Green Version]
  18. He, B.; Liu, L.; Huang, M. Room temperature quenching and partitioning steel. Metall. Mater. Trans. A 2018, 49, 3167–3172. [Google Scholar] [CrossRef]
  19. Hou, Z.; Zhao, X.; Zhang, W.; Liu, H.; Yi, H. A medium manganese steel designed for water quenching and partitioning. Mater. Sci. Technol. 2018, 34, 1168–1175. [Google Scholar] [CrossRef]
  20. He, B.B.; Pan, S.; Huang, M.X. Extra work hardening in room-temperature quenching and partitioning medium Mn steel enabled by intercritical annealing. Mater. Sci. Eng. A 2020, 797, 140106. [Google Scholar] [CrossRef]
  21. Speer, J.G.; Hackenberg, R.E.; De Cooman, B.C.; Matlock, D.K. Influence of interface migration during annealing of martensite/austenite mixtures. Philos. Mag. Lett. 2007, 87, 379–382. [Google Scholar] [CrossRef]
  22. Santofimia, M.J.; Zhao, L.; Povstugar, I.; Choi, P.-P.; Raabe, D.; Sietsma, J. Carbon redistribution in a quenched and partitioned steel analysed by atom probe tomography. In Proceedings of the 3rd International Symposium on Steel Science, The Iron and Steel Institute of Japan, Kyoto, Japan, 27–30 May 2012; pp. 155–158. [Google Scholar]
  23. De Knijf, D.; Santofimia, M.J.; Shi, H.; Bliznuk, V.; Föjer, C.; Petrov, R.; Xu, W. In situ austenite–martensite interface mobility study during annealing. Acta Mater. 2015, 90, 161–168. [Google Scholar] [CrossRef]
  24. Seo, E.J.; Cho, L.; De Cooman, B.C. Kinetics of the partitioning of carbon and substitutional alloying elements during quenching and partitioning (Q&P) processing of medium Mn steel. Acta Mater. 2016, 107, 354–365. [Google Scholar] [CrossRef]
  25. Thomas, G.A.; Speer, J.G. Interface migration during partitioning of Q&P steel. Mater. Sci. Technol. 2014, 30, 998–1007. [Google Scholar] [CrossRef]
  26. Ayenampudi, S.; Celada-Casero, C.; Sietsma, J.; Santofimia, M.J. Microstructure evolution during high-temperature partitioning of a medium-Mn quenching and partitioning steel. Materialia 2019, 8, 100492. [Google Scholar] [CrossRef]
  27. Arribas, M.; Gutiérrez, T.; Del Molino, E.; Arlazarov, A.; De Diego-Calderón, I.; Martin, D.; De Caro, D.; Ayenampudi, S.; Santofimia, M.J. Austenite Reverse Transformation in a Q&P Route of Mn and Ni Added Steels. Metals 2020, 10, 862. [Google Scholar] [CrossRef]
  28. Ayenampudi, S.; Celada-Casero, C.; Arechabaleta, Z.; Arribas, M.; Arlazarov, A.; Sietsma, J.; Santofimia, M.J. Microstructural Impact of Si and Ni During High Temperature Quenching and Partitioning Process in Medium-Mn Steels. Metall. Mater. Trans. A 2021, 52, 1321–1335. [Google Scholar] [CrossRef]
  29. Ding, R.; Dai, Z.; Huang, M.; Yang, Z.; Zhang, C.; Chen, H. Effect of pre-existed austenite on austenite reversion and mechanical behavior of a Fe-0.2C-8Mn-2Al medium Mn steel. Acta Mater. 2018, 147, 59–69. [Google Scholar] [CrossRef]
  30. Kim, K.; Lee, S.-J. Effect of Ni addition on the mechanical behavior of quenching and partitioning (Q&P) steel. Mater. Sci. Eng. A 2017, 698, 183–190. [Google Scholar] [CrossRef]
  31. Pierce, D.T.; Coughlin, D.R.; Clarke, K.D.; De Moor, E.; Poplawsky, J.; Williamson, D.L.; Mazumder, B.; Speer, J.G.; Hood, A.; Clarke, A.J. Microstructural evolution during quenching and partitioning of 0.2C-1.5Mn-1.3Si steels with Cr or Ni additions. Acta Mater. 2018, 151, 454–469. [Google Scholar] [CrossRef]
  32. Valle, N.; Drillet, J.; Bouaziz, O.; Migeon, H.-N. Study of the carbon distribution in multi-phase steels using the NanoSIMS 50. Appl. Surf. Sci. 2006, 252, 7051–7053. [Google Scholar] [CrossRef]
  33. McDermid, J.R.; Zurob, H.S.; Bian, Y. Stability of retained austenite in high-Al, low-Si TRIP assisted steels processed via continuous galvanizing heat treatment. Metall. Mater. Trans. A 2011, 42S, 3627–3637. [Google Scholar] [CrossRef]
  34. Ruhl, R.; Cohen, M. Splat Quenching of Iron-Carbon Alloys. Transactions of the American Institute of Mining, Metallurgical and Petroleum Engineers. Metallurgical Society 1969, 245, 241–251. [Google Scholar]
  35. Dyson, D.; Holmes, B. Effect of alloying additions on the lattice parameter of austenite. J. Iron and Steel Inst. 1970, 208, 469–474. [Google Scholar]
  36. Clarke, A.J.; Speer, J.G.; Miller, M.K.; Hackenber, R.E.; Edmonds, D.V.; Matlock, D.K.; Rizzo, F.C.; Clarke, K.D.; De Moor, E. Carbon partitioning to austenite from martensite or bainite during the quench and partition (Q&P) process: A critical assessment. Acta Mater. 2008, 56, 16–22. [Google Scholar] [CrossRef]
  37. Arlazarov, A.; Ollat, M.; Masse, J.P.; Bouzat, M. Influence of partitioning on mechanical behavior of Q&P steels. Mater. Sci. Eng. A 2016, 661, 79–86. [Google Scholar] [CrossRef]
  38. De Knifj, D.; Petrov, R.; Föjer, C.; Kestens, L.A.I. Effect of fresh martensite on the stability of retained austenite in quenching and partitioning steel. Mater. Sci. Eng. A 2014, 615, 107–115. [Google Scholar] [CrossRef]
  39. Raabe, D.; Sun, B.; Kwiatkowski Da Silva, A.; Gault, B.; Yen, H.-W.; Sedighiani, K.; Sukumar, P.T.; Souza Filho, I.R.; Katnagallu, S.; Jägle, E.; et al. Current Challenges and Opportunities in Microstructure-Related Properties of Advanced High-Strength Steels. Metall. Mater. Trans. A 2020, 51, 5517–5586. [Google Scholar] [CrossRef]
  40. Zhang, M.; Li, L.; Fu, R.Y.; Krizan, D.; De Cooman, B.C. Continuous cooling transformation diagrams and properties of micro-alloyed TRIP steels. Mater. Sci. Eng. A 2006, 438–440, 296–299. [Google Scholar] [CrossRef]
  41. Sun, B.; Ma, Y.; Vanderesse, N.; Varanasi, R.S.; Song, W.; Bocher, P.; Ponge, D.; Raabe, D. Macroscopic to nanoscopic in situ investigation on yielding mechanisms in ultrafine grained medium Mn steels: Role of the austenite-ferrite interface. Acta Mater. 2019, 178, 10–25. [Google Scholar] [CrossRef]
  42. Sun, B.; Fazeli, F.; Scott, C.; Guo, B.; Aranas, C.; Chu, X.; Jahazi, M.; Yue, S. Microstructural characteristics and tensile behavior of medium manganese steels with different manganese additions. Mater. Sci. Eng. A 2018, 729, 496–507. [Google Scholar] [CrossRef]
  43. McCormick, P.G. A model for the Portevin-Le Chatelier effect in substitutional alloys. Acta Metall. 1972, 20, 351–354. [Google Scholar] [CrossRef]
  44. Santofimia, M.J.; Zhao, L.; Sietsma, J. Volume Change Associated to Carbon Partitioning from Martensite to Austenite. Mater. Sci. Forum 2012, 706, 2290–2295. [Google Scholar] [CrossRef]
  45. Wei, R.; Enomoto, M.; Hadian, R.; Zurob, H.S.; Purdy, G.R. Growth of austenite from as-quenched martensite during intercritical annealing in an Fe-0.1C-3Mn-1.5Si alloy. Acta Mater. 2013, 61, 697–707. [Google Scholar] [CrossRef]
  46. Liu, L.; He, B.B.; Cheng, G.J.; Yen, H.W.; Huang, M.X. Optimum properties of quenching and partitioning steels achieved by balancing fraction and stability of retained austenite. Scr. Mater. 2018, 150, 1–6. [Google Scholar] [CrossRef]
  47. De Cooman, B.C.; Lee, S.; Kumar, S.S. Ultra-fine grained manganese TRIP steels. In Proceedings of the 2nd International Conference “Super-High Strength Steels”, Peschiera del Garda, Italy, 17–20 October 2010; pp. 1–11. [Google Scholar]
  48. De Moor, E.; Kang, S.; Speer, J.G.; Matlock, D.K. Manganese Diffusion in Third Generation Advanced High Strength Steels. In Proceedings of the International Conference on Mining, Material and Metallurgical Engineering, Prague, Czech Republic, 11–12 August 2014. [Google Scholar]
  49. Arlazarov, A.; Gouné, M.; Bouaziz, O.; Hazotte, A. Critical factors governing the thermal stability of austenite in an ultra-fined grained Medium-Mn steel. Philos. Mag. Lett. 2017, 97, 125–131. [Google Scholar] [CrossRef]
  50. Borgenstam, A.; Höglund, L.; Ågren, J.; Engström, A. DICTRA, a tool for simulation of diffusional transformations in alloys. J. Phase Equilibria 2000, 21, 269–280. [Google Scholar] [CrossRef]
  51. Apple, C.A.; Caron, R.N.; Krauss, G. Packet microstructure in Fe-0.2 pct C martensite. Metall. Trans. A 1974, 5, 593–599. [Google Scholar] [CrossRef]
  52. Swarr, T.; Krauss, G. The effect of structure on the deformation of as-quenched and tempered martensite in an Fe-0.2 pct C alloy. Metall. Trans. A 1976, 7A, 41–48. [Google Scholar] [CrossRef]
  53. Clarke, A.J. Carbon Partitioning into Austenite from Martensite in a Silicon-Containing High-Strength Sheet Steel. Ph.D. Thesis, Colorado School of Mines, 18 July 2006. [Google Scholar]
  54. Andrews, K.W. Empirical Formulae for the Calculation of Some Transformation Temperatures. J. Iron Steel Inst. 1965, 203, 721–727. [Google Scholar]
  55. Koistinen, D.P.; Marburger, R.E. A general equation prescribing the extent of the austenite-martensite transformation in pure iron-carbon alloys and plain carbon steels. Acta Metall. 1959, 7, 59–60. [Google Scholar] [CrossRef]
  56. Santofimia, M.J.; Speer, J.G.; Clarke, A.J.; Zhao, L.; Sietsma, J. Influence of interface mobility on the evolution of austenite–martensite grain assemblies during annealing. Acta Mater. 2009, 57, 4548–4557. [Google Scholar] [CrossRef] [Green Version]
  57. Dmitrieva, O.; Ponge, D.; Inden, G.; Millán, J.; Choi, P.; Sietsma, J.; Raabe, D. Chemical gradients across phase boundaries between martensite and austenite in steel studied by atom probe tomography and simulation. Acta Mater. 2011, 59, 364–374. [Google Scholar] [CrossRef] [Green Version]
  58. Olson, G.B.; Cohen, M. Stress-assisted isothermal martensitic transformation: Application to TRIP steels. Metall. Trans. A 1982, 13, 1907–1914. [Google Scholar] [CrossRef]
  59. Olson, G.B.; Cohen, M. Kinetics of strain-induced martensitic nucleation. Metall. Trans. A 1975, 6, 791–795. [Google Scholar] [CrossRef]
  60. Van Dijk, N.H.; Butt, A.M.; Zhao, L.; Sietsma, J.; Offerman, S.E.; Wright, J.P.; Van der Zwaag, S. Thermal stability of retained austenite in TRIP steels studied by synchrotron X-ray diffraction during cooling. Acta Mater. 2005, 53, 5439–5447. [Google Scholar] [CrossRef]
  61. Timokhina, I.B.; Hodgson, P.D.; Pereloma, E.V. Effect of Microstructure on the Stability of Retained Austenite in Transformation-Induced-Plasticity Steels. Metall. Mater. Trans. A 2004, 35, 2331–2340. [Google Scholar] [CrossRef] [Green Version]
  62. De Knijf, D.; Föjer, C.; Kestens, L.A.I.; Petrov, R. Factors influencing the austenite stability during tensile testing on Quenching and Partitioning steel determined via in-situ electro backscatter diffraction. Mater. Sci. Eng. A 2015, 638, 219–227. [Google Scholar] [CrossRef]
  63. Hidalgo, J.; Huizenga, R.M.; Findley, K.O.; Santofimia, M.J. Interplay between metastable phases controls strength and ductility in steels. Mater. Sci. Eng. A 2019, 745, 185–194. [Google Scholar] [CrossRef]
  64. Hasegawa, K.; Kawamura, K.; Urabe, T.; Hosoya, Y. Effects of microstructure on stretch-flange-formability of 980 MPa grade cold-rolled ultra high strength steel sheets. ISIJ Int. 2004, 44, 603–609. [Google Scholar] [CrossRef]
  65. Tsuji, N.; Ito, Y.; Saito, Y.; Minamino, Y. Strength and ductility of ultrafine grained aluminium and iron produced by ARB and annealing. Scr. Mater. 2002, 47, 893–899. [Google Scholar] [CrossRef]
  66. Sun, B.; Vanderesse, N.; Fazeli, F.; Scott, C.; Chen, J.; Bocher, P.; Jahazi, M.; Yue, S. Discontinuous strain-induced martensite transformation related to the Portevin-Le Chatelier effect in a medium manganese steel. Scr. Mater. 2017, 133, 9–13. [Google Scholar] [CrossRef]
  67. Linke, B.M.; Gerber, T.; Hatscher, A.; Salvatori, I.; Aranguren, I.; Arribas, M. Impact of Si on Microstructure and Mechanical Properties of 22MnB5 Hot stamping steel treated by Quenching & Partitioning (Q&P). Metall. Mater. Trans. A 2018, 49, 54–65. [Google Scholar] [CrossRef]
Figure 1. Schemes of the Q&P processing cycles applied in (a) L-Mn steel; (b) M-MnNi steel—quenching temperature corresponding to 0.25 austenite volume fraction (QT25); and (c) M-MnNi steel—quenching temperature corresponding to 0.15 austenite volume fraction (QT15).
Metals 12 00483 g001
Figure 2. Omega stamping die.
Metals 12 00483 g002
Figure 3. Experimental flow chart.
Metals 12 00483 g003
Figure 4. Dilatometry curves of the applied Q&P cycles: (a) partitioning temperature (PT) of 400 °C in L-Mn and M-MnNi steels, with QT25 condition; (b) partitioning temperature of 650 °C in M-MnNi steel, with QT25 and QT15 conditions. The curves corresponding to 120 s and 300 s partition times (Pt120 and Pt300, respectively) are shown in each condition.
Metals 12 00483 g004
Figure 5. Relative change in length measured during the partitioning stage: (a) partitioning temperature of 400 °C in L-Mn and M-MnNi steels, with QT25 condition; (b) partitioning temperature of 650 °C in M-MnNi steel, with QT25 and QT15 conditions. The curves corresponding to Pt120 and Pt300 are shown in each condition.
Metals 12 00483 g005
Figure 6. Field emission gun scanning electron microscopy (FEGSEM) micrographs corresponding to the following materials and conditions: (a) L-Mn steel, QT25, PT = 400 °C, Pt = 300 s; (bd) M-MnNi steel, where: (b) QT25, PT = 400 °C, Pt = 300 s; (c) QT25, PT = 650 °C, Pt = 300 s; (d) QT15, PT = 650 °C, Pt = 300 s. M1: primary martensite; MA: martensite/austenite islands; RA: retained austenite.
Metals 12 00483 g006
Figure 7. Retained austenite (RA) fraction as a function of partitioning time after Q&P treatments of L-Mn and M-MnNi steels with different partitioning temperatures (400 °C and 650 °C) and quenching temperatures (QT15 and QT25).
Metals 12 00483 g007
Figure 8. Example of one 12C ion map (left side) and carbon content estimated in different areas of this zone (right side) in M-MnNi steel sample partition-treated at 650 °C during 300 s and in QT15 condition. The areas selected for carbon content analysis are surrounded in purple in the 12C ion map.
Metals 12 00483 g008
Figure 9. Engineering stress–strain curves obtained after Q&P treatments for L-Mn steel (QT25/PT = 400 °C) and for M-MnNi steel (QT25/PT = 400 °C, QT25/PT = 650 °C and QT15/PT = 650 °C): (a) partitioning time = 120 s; (b) partitioning time = 300 s. Tests performed using standard 50 mm gauge length samples.
Metals 12 00483 g009
Figure 10. Retained austenite results of the X-ray Diffraction scans performed along tensile specimen length after Q&P treatments of L-Mn and M-MnNi steels with different PTs (400 °C and 650 °C), QTs (QT25 and QT15) and Pts: (a) 120 s and (b) 300 s. All line scans were aligned at the shoulder position of the tensile test specimen (denoted as 0 mm). (c) Schematic of the tensile specimen showing the line where RA scans were performed.
Metals 12 00483 g010
Figure 11. Engineering stress–strain curves after cold forming Q&P sheets of L-Mn steel (QT25/PT = 400 °C/Pt = 120 s) and of M-MnNi steel (QT15/PT = 650 °C/Pt = 300 s). The curves obtained in the non-deformed and deformed areas of the Omega part are compared.
Metals 12 00483 g011
Figure 12. (a) Schematic of the system considered in DICTRA simulations; (b,c) DICTRA calculations of the Mn and Ni composition profiles, respectively, at the martensite (left)/austenite (right) system. The calculation was done considering the chemical composition of M-MnNi steel, 650 °C (PT), 120 s and 300 s (Pt) and 0.15 and 0.25 austenite volume fractions as initial conditions (QT15 and QT25, respectively).
Metals 12 00483 g012aMetals 12 00483 g012b
Figure 13. Tensile properties as a function of partitioning time after Q&P treatments of L-Mn and M-MnNi steels with different PTs (400 °C and 650 °C) and QTs (QT15 and QT25): (a) Yield strength; (b) Tensile strength; (c) Total elongation; (d) Product of tensile strength and total elongation.
Metals 12 00483 g013
Figure 14. Bending angle as a function of partitioning time after Q&P treatments of L-Mn and M-MnNi steels with different PTs (400 °C and 650 °C) and QTs (QT15 and QT25). Hole expansion results in some of the Q&P conditions in both steels.
Metals 12 00483 g014
Table 1. Chemical composition of the steels (wt.%).
SteelCMnNiSiPSN
L-Mn0.1942.010.0011.490.00120.0020.002
M-MnNi0.2435.601.8111.440.0080.0020.001
Table 2. Experimental conditions, experimental groups, variables and control group.
Experimental ConditionsExperimental GroupVariableControl Group
NoSteelQTPT (°C)Pt (s)---
1L-MnQT25400120--x (of group 1)
2L-MnQT25400300--
3M-MnNiQT25400120Group 1Steel gradex (of group 2)
4M-MnNiQT25400300
5M-MnNiQT25650120Group 2PTx (of group 3)
6M-MnNiQT25650300
7M-MnNiQT15650120Group 3QT-
8M-MnNiQT15650300
Table 3. Summary of tensile (yield strength (YS), tensile strength (TS) and total elongation (TEL)), bending and hole expansion (hole expansion ratio (HER)) properties for L-Mn and M-MnNi steels after Q&P treatments.
SteelQT (°C)PT (°C)Pt (s)YS 0.2% Offset (MPa)
(Error ± 15 MPa)
TS
(MPa)
(Error ± 15 MPa)
YS/TS (%)TEL in 50 mm Gauge (%)
(Error ± 2%)
TS x TEL (GPa%)Bending Angle (° (Error ± 10°))HER (%)
L-Mn300 (QT25)400120120213478991210312.80
3001209134290811113
M-MnNi75 (QT25)40012011011324832324
30012361248993421
Room Temperature (QT15)650120949129273172262
30079212856223291032.20
75 (QT25)1207351335551621961.98
300332106131212297
Table 4. Tensile properties and retained austenite fractions obtained from the deformed and non-deformed areas of Omega parts of M-MnNi steel partition-treated at 650 °C and of L-Mn steel partition-treated at 400 °C.
YS 0.2% Offset (MPa) TS
(MPa)
TEL in 30 mm Gauge (%) RA
Steel—Q&P conditionL-Mn—QT25—PT = 400 °C—Pt = 120 s
Non-deformed13161329130.06
Deformed1213144060.02
Steel—Q&P conditionM-MnNi—QT15—PT = 650 °C—Pt = 300 s
Non-deformed7681400390.24
Deformed11171494150.05
Publisher’s Note: MDPI stays neutral with regard to jurisdictional claims in published maps and institutional affiliations.

