Article

Unveiling Liquation and Segregation Induced Failure Mechanism in Thick Dissimilar Aluminum Alloy Electron-Beam Welds

1
Defence Research and Development Laboratory, Kanchanbagh, Hyderabad 500058, India
2
Department of Mechanical and Aerospace Engineering, Indian Institute of Technology Hyderabad, Hyderabad 502285, India
3
Defence Metallurgical Research Laboratory, Kanchanbagh, Hyderabad 500058, India
4
Department of Mechanical Engineering, Indian Institute of Technology Patna, Patna 801106, India
5
Department of Materials Engineering, Faculty of Engineering Technology, KU Leuven, Campus de Nayer, 2860 Sint-Katelijne Waver, Belgium
*
Authors to whom correspondence should be addressed.
Metals 2022, 12(3), 486; https://doi.org/10.3390/met12030486
Submission received: 9 February 2022 / Revised: 4 March 2022 / Accepted: 11 March 2022 / Published: 13 March 2022
(This article belongs to the Special Issue Current Developments in Welding and Joining Technologies)

Abstract

:
This study presents new findings on the underlying failure mechanism of thick dissimilar electron-beam (EB) welds through a study on the AA 2219-AA 5083 pair. Contrary to the prior studies on EB welding of thin Al alloys, where liquation in the grain boundaries (GBs) in the partially melted zone (PMZ) was not observed, the present investigation for thick EB welds reports both liquation and increased segregation of Cu in the PMZ. The work is thus directed towards understanding the unusual observation in the PMZ of thick EB weld through investigation of the microstructural variation across the various regions of the produced weld. The microstructural results are correlated with the mechanical properties of the weld, i.e., hardness variation and tensile response. Results of this investigation suggest that unlike the convention that EB welding produces sound dissimilar Al welds, the weld performance for thick EB Al welds is affected by the heat input, the associated cooling rates, and most importantly by the base material thickness. Extensive liquation and Cu segregation induced failure in the PMZ on the AA 2219 side of the dissimilar weld. The underlying failure mechanism is explained through a heat-transfer analysis. Beyond a certain plate thickness, the heat transfer changes from two to three-dimensional. As a result, retarded cooling promotes liquation and Cu segregation in thick EB welds.

1. Introduction

Fusion welding of aluminum (Al) alloys is always challenging for certain apparent reasons such as the presence of a tenacious and insulating oxide layer, high thermal conductivity, and a high coefficient of thermal expansion [1,2]. Additionally, fusion welding of Al alloys often poses certain quality issues such as gas porosity, solidification cracking, and post-weld distortions [3]. Controlling the gas porosity in fusion welds of Al alloys demands utmost care during pre-weld preparation and in situ while welding. Previous works by Guo et al. [4], Xiao et al. [5], and Cam et al. [6] brought out occurrences of severe porosity formation in the gas-metal-arc (GMA)-welded Al-Zn-Mg alloy, laser-beam (LB)-welded Al-Li alloy, and high-energy-density LB-welded AA 5005, respectively. Moreover, the high reflectivity, high thermal conductivity, and large linear expansion coefficient properties of Al alloys pose several challenges during conventional laser welding [7]. Additionally, the instability of Al alloys during laser welding leads to formations of several defects including pores, cracks, excessive deformation, undercuts, weld discontinuity, etc. [7]
The outstanding mechanical properties, corrosion resistance, and good weldability of precipitation-hardenable Al-Copper (Cu) alloy AA 2219 make it suitable for numerous aerospace applications, and it is widely used in manufacturing airframes and fuel tanks. However, AA 2219 suffers from poor as-welded joint efficiencies when welded using gas tungsten arc (GTA) and GMA welding [8]. Strain-hardenable AA 5083 exhibits excellent corrosion resistance, weldability, and higher as-welded joint efficiencies [1] than the other high-strength precipitation-hardenable Al alloys, and is widely employed in constructing large ships, naval systems, and airframes. Certain subsystems demand a combination of high strength and corrosion resistance wherein welding between AA 2219 and AA 5083 is beneficial.
The GTA/GMA welds of precipitation-hardenable (heat-treatable) Al alloys (e.g., AA 2219) suffer from poor joint efficiencies due to severe heat-affected-zone (HAZ) softening, dissolution, or overaging of strengthening precipitates in the fusion zone (FZ) or HAZ. The loss of strength due to welding is recovered by post-weld heat treatment vis-a-vis solutionizing plus ageing. The higher the heat input, the more pronounced the HAZ softening in heat-treatable Al alloys [9]. Brungraber and Nelson [9] developed analytical relations to relate the extent of HAZ with the heat input. Their investigation revealed that the extent of HAZ increased linearly with the heat input. It was also found that the joint strength decreased with the increase in heat input, or in other words, the increase in the extent of the HAZ. For a case study on GMA welding of a heat-treatable Al alloy (6xxx series), it was found that for an increase in heat input from around 200 to 1800 watt-min/inch2, the tensile strength of the joint reduced from around 45 to 30 ksi [9]. The loss of joint strength is more severe in the case of high-thickness (>12 mm) heat-treatable Al alloys [10]. For thicker sections, the use of a multi-pass welding procedure causes differential contraction under the cooling thermal cycles, which leads to the generation of high shrinkage stresses in the weldment. The presence of these shrinkage stresses degrades the weld mechanical properties. The absence of precipitate-forming elements (Cu, Zn, etc.) is a positive attribute for welding strain-hardenable (non-heat-treatable) Al alloys, e.g., 5xxx Al alloys. The fusion welds of non-heat-treatable Al alloys lose the strain-hardening/cold-working effect in HAZ [9], but not as severely as in the heat-treatable Al alloys. Therefore, 5xxx Al alloys are extensively used in welded pressure-vessel systems where reasonable joint efficiencies are achievable in the as-welded condition itself, without the need for any further post-weld heat treatment [9].
Fusion welding tends to make Al alloys susceptible to liquation along grain boundaries (GBs) in the partially melted zone (PMZ), which is a very narrow region immediately outside the FZ. Grain-boundary liquation in Al welds makes the PMZ vulnerable to hot cracking during welding or post-weld loss of ductility [11]. Huang et al. [12,13,14], and Rao et al. [15] studied the PMZ in GMA welds of AA 2219 and observed extensive liquation both along GBs and at large θ (Al2Cu) particles. Severe Cu segregation was observed at the GBs and grain interior, resulting in a Cu-depleted phase. The welds performed poorly under tensile loading, with premature fracturing occurring in the PMZ. To reduce the Cu segregation, decrease the precipitate coarsening, and improve the performance of the welded joint, low heat input or high-weld-cooling-rate fusion-welding processes are deemed suitable. For this purpose, high-energy-density welding processes, such as LB or electron beam (EB), have been commonly employed [5,16,17,18]. The EB welding process offers further advantages such as high depth-to-width ratio, narrow HAZ, low residual stress, and little distortion of the welded materials, combined with the prospect of producing porosity-free joints. On the contrary, Al alloys pose a reflectivity problem during LB welding [7].
Previous work on EB welding has substantially improved the understanding of liquation and solidification in the PMZ of Al welds [11]. Considerable work conducted on parameter optimization and assessment of mechanical properties of AA 2219 EB welds have shown that EB welds possess superior mechanical properties compared to their GMA/GTA counterparts [19,20,21]. The improved performance was attributed to the uniform distribution of Cu in the matrix, i.e., reduced Cu segregation and reduced porosity. In addition, liquation along GBs in the PMZ was not observed. However, most reported results correspond to thin (≤8 mm) base material. Additionally, to the best of the authors’ knowledge, no literature has been reported on dissimilar EB welding of thick Al alloys.
Contrary to the prior studies on EB welding of thin Al alloys (≤8 mm) where liquation in the GBs in the PMZ was not observed, primarily due to the existence of high cooling rates, preliminary investigation by the authors (for thick EB welds) suggested both liquation and increased segregation of Cu in the PMZ. This study is thus motivated by the unusual observations in the PMZ for the case of thick dissimilar EB welds. The purpose of the present study is to provide more insight into the process behavior and weld joint quality, particularly for the case of thick dissimilar EB welding of Al alloys. The alloy combination considered in this investigation is prominent in aerospace and defense applications, i.e., AA 2219-AA 5083. The core objective of this study is to elucidate the failure mechanism in thick dissimilar EB Al welds. For this purpose, the present work focuses on understanding the microstructural variations across the different regions of the AA 2219-AA 5083 dissimilar EB weld and correlating the microstructure with the mechanical properties. A particular focus is on understanding the microstructural and metallurgical changes occurring in the PMZ. A mathematical analysis based on heat transfer is presented to understand the failure mechanism better. The analysis considers the effect of welding-heat input and cooling rates and relates the same with base-material thickness. A critical plate thickness is suggested that governs the failure mechanism. The rest of this paper is organized as follows: Section 2 details the experimental procedure, Section 3 provides a detailed discussion of the obtained results, and Section 4 draws conclusions and provides related suggestions.

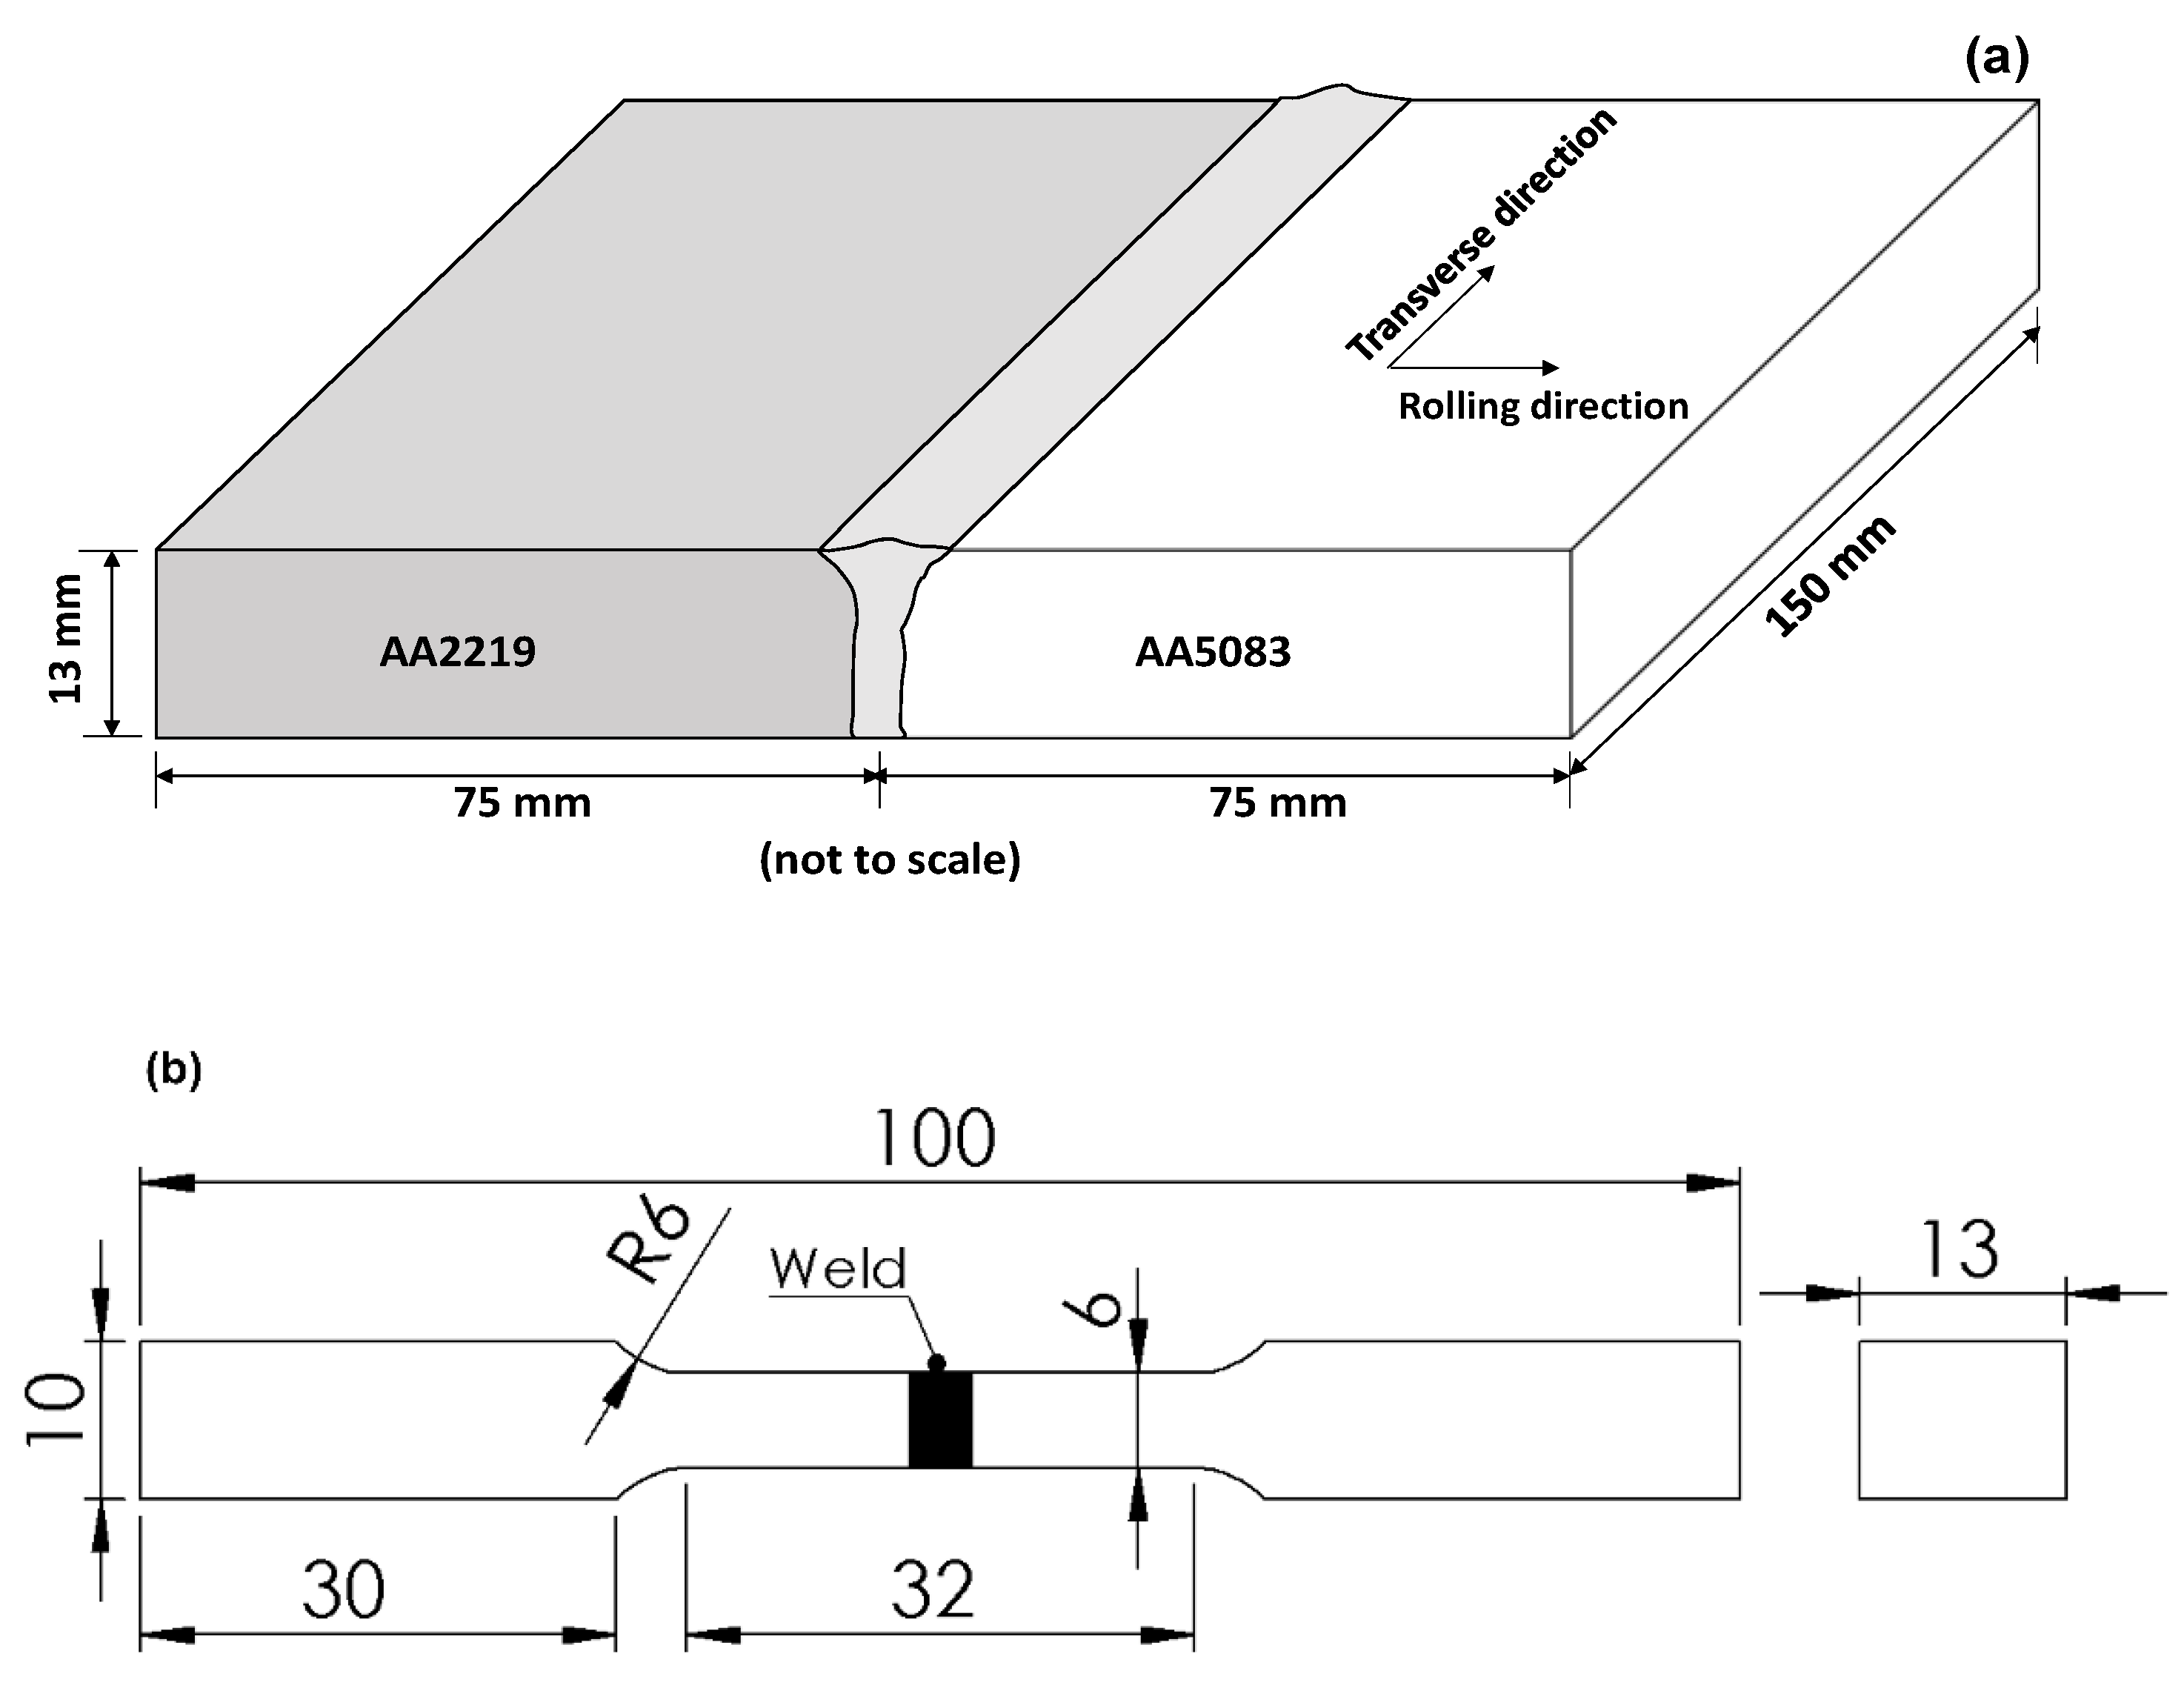
2. Materials and Methods

The base materials employed in the present study were AA 2219-T6 Al-Cu alloy and AA 5083-H116 Al-Mg alloy. The analyzed chemical compositions and the mechanical properties of the base materials are listed in Table 1 and Table 2, respectively. The width of the weld specimen was maintained along the plate rolling direction. EB welding of 75 mm width × 125 mm length × 13 mm thick plates was conducted in a CNC-controlled low-kV EB-welding machine (TECHMETA, Épagny Metz-Tessy, France). The welding was carried out in square butt-joint configuration after positioning and firmly clamping the plates on a CNC work-table. The schematic arrangement of the weld specimen is shown in Figure 1a. The operating levels of each welding parameter were decided based upon the authors’ previous EB welding work on a similar material combination [21]. In addition, to finalize the operating parameters, a certain number of bead-on-plate trials were also conducted, such that the resulting EB-welded joints would have uniform top reinforcement and bottom penetration. The final selected welding process parameters considered for the present investigation are mentioned in Table 3. The weld joints were initially visually inspected, and further subjected to X-ray radiography to inspect for the presence of various internal and surface defects. Metallographic samples were prepared using standard metallographic procedures (grinding with SiC emery papers of grit sizes varying from 100–2000, followed by polishing with 1 µm diamond paste). The polished samples were etched using modified Keller’s reagent. The weld macrostructures of the transverse section were examined under a BX-53 optical metallurgical microscope (OLYMPUS, Tokyo, Japan). The grain size distribution in the FZ was analyzed using an image analysis software (OLYMPUS Stream 2.2) inbuilt with the metallurgical microscope, following the planimetric method as per the standard ASTM E112-13. The distribution of alloying elements along the fusion interface, PMZ and in the FZ was analyzed by Electron Probe Micro Analysis (EPMA) using an MBX MICRO-439 microprobe (CAMECA, Gennevilliers, France). The weight percentage (wt.%) of all alloying elements (Cu, Mg, Si, Mn, Fe, Zn, and Al) was analyzed in each zone over a length of 300 µm with an interval of 5 µm. Microstructural variations across the different regions in the PMZ of the AA 2219-AA 5083 dissimilar EB weld were captured using an EVO MA10 scanning electron microscope (SEM) (ZEISS, Oberkochen, Germany).
Microhardness was measured using a Vickers microhardness tester (MMT-X7, Matsuzawa, Japan) with a 100 g load and a dwell time of 15 s. The microhardness indentations were spaced at intervals of 0.25 mm, covering the different zones of weldments and base materials across the mid-thickness of the transverse-weld cross-section. Tensile test specimens were extracted along the transverse direction of the weld joint as per the standard ASTM E8. The dimensions of the tensile samples are indicated in Figure 1b. The room-temperature tensile properties of three specimens for each experiment were evaluated in as-welded condition after machining the top reinforcement and back penetration on a universal tensile testing machine (100 kN capacity, INSTRON, Norwood, MA, USA), at a crosshead speed of 1 mm/min. Strain during the tensile testing was recorded with the help of a contact-type extensometer of 25 mm gauge length, and yield strength was recorded at 0.2% offset strain. To understand the failure mode, the fractured surfaces of tensile test specimens were examined under the SEM (ZEISS, EVO MA10) at an accelerating voltage of 20 kV.

3. Results and Discussions

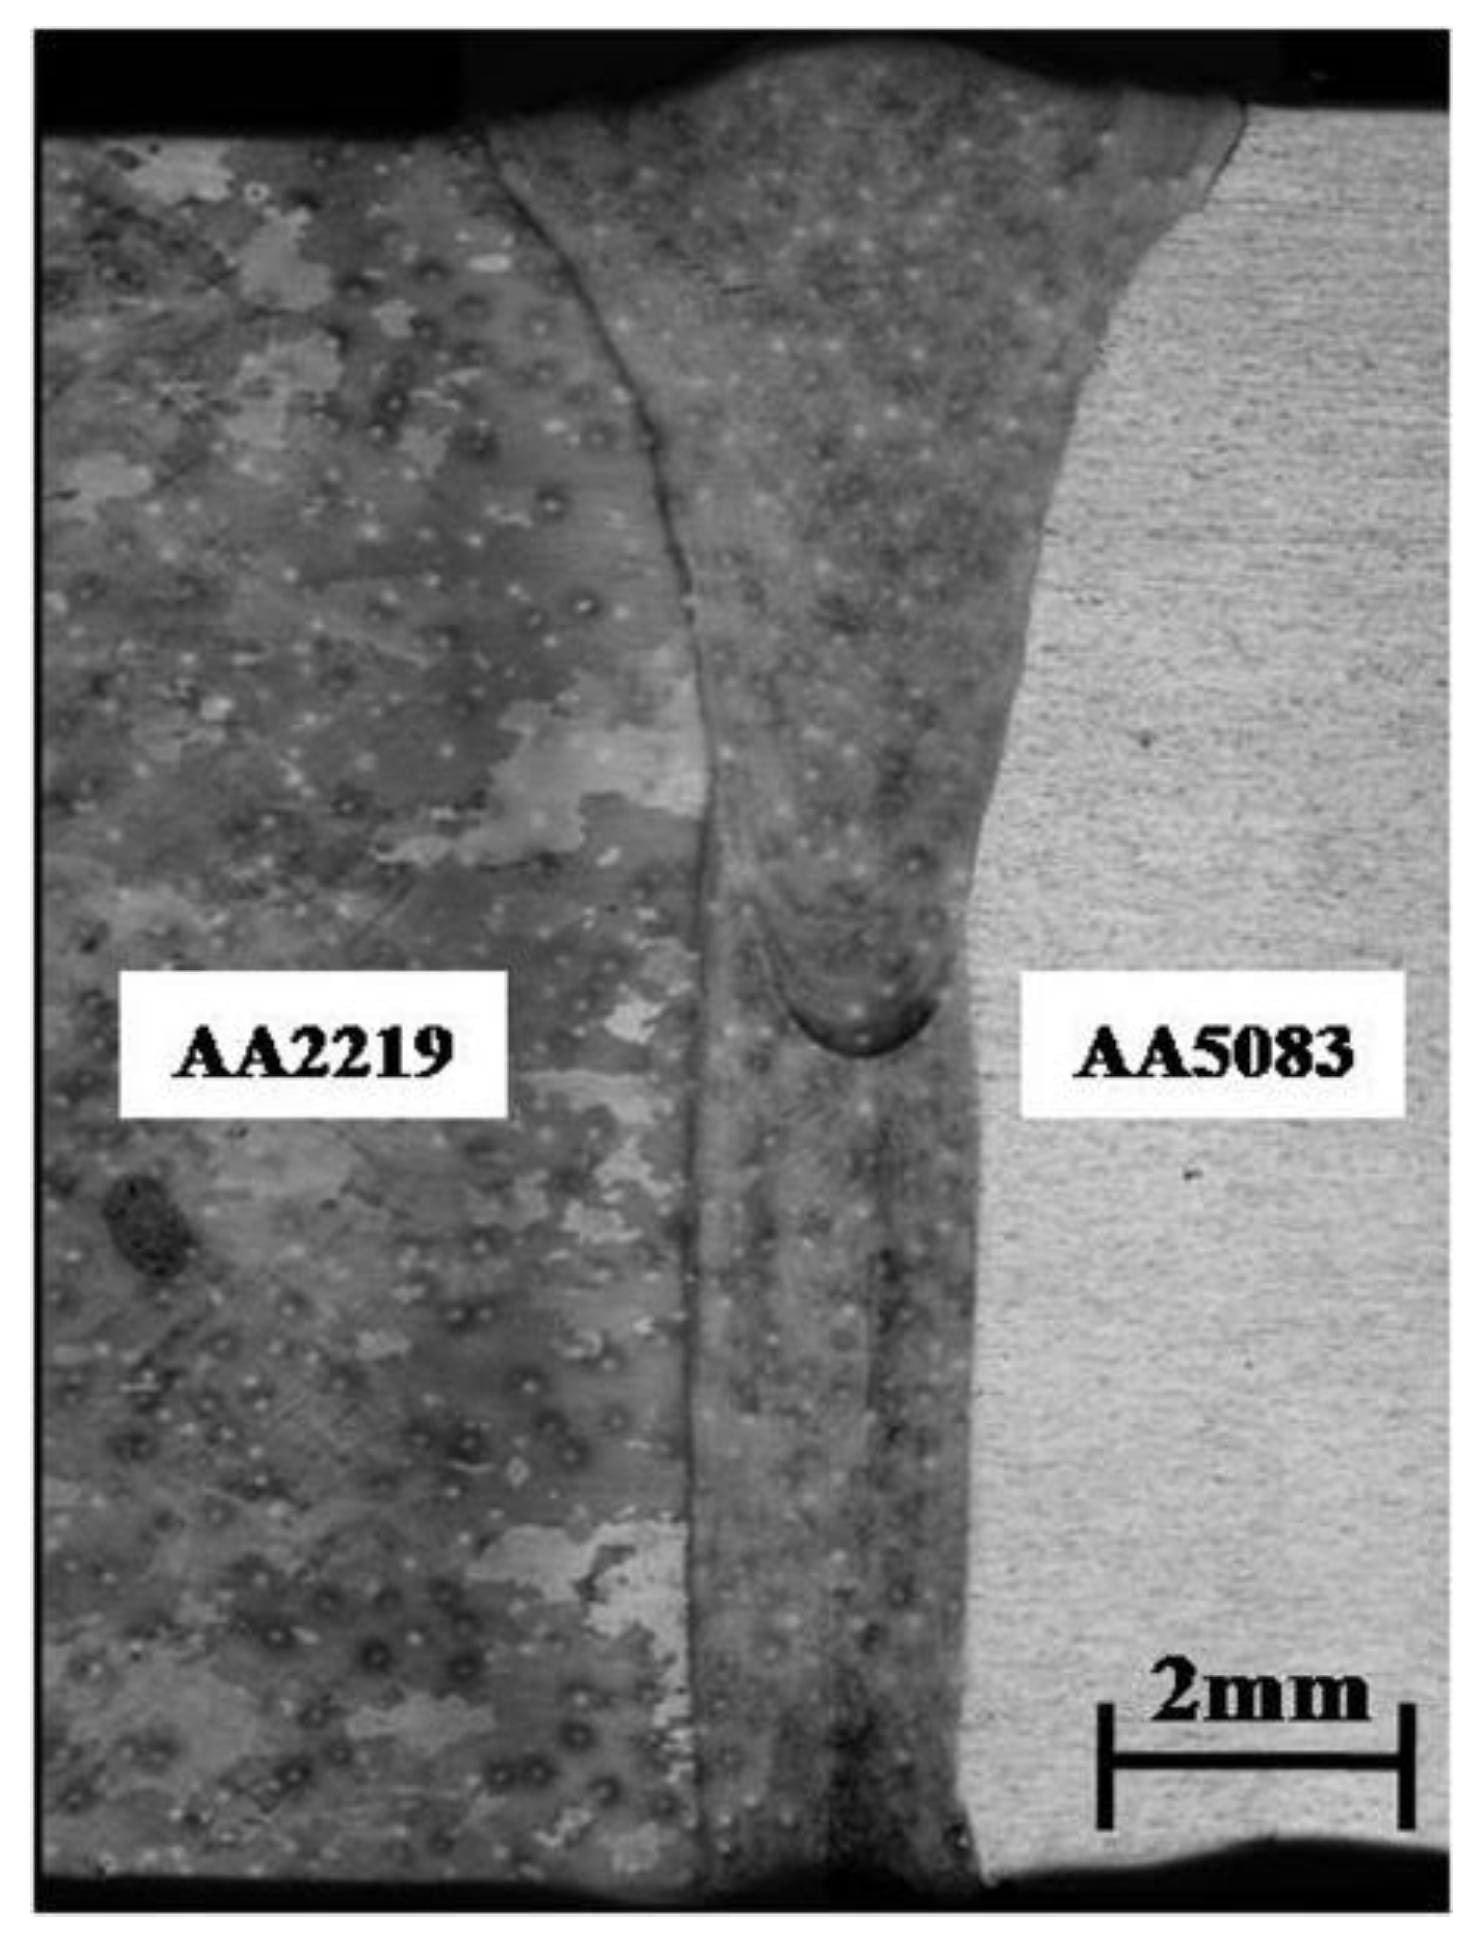
3.1. Weld Appearance

Figure 2a presents a representative image depicting the top side of the dissimilar AA 2219-AA 5083 EB weld. The corresponding X-ray radiograph is shown in Figure 2b. The weld joint has a consistent reinforcement in the FZ on the top side. The X-ray radiograph of the weld joint reveals the presence of no significant observable defect.
The macrostructure of the representative AA 2219-AA 5083 dissimilar EB weld joint is shown in Figure 3. The weld-bead macrostructure is observed to have a uniform top reinforcement, and the overall weld-bead geometry has a ‘nail-head’-shaped morphology. The weld zone at the top of the cross-section has slightly more width, while it has near-parallel fusion interfaces at the middle and bottom of the weld zone. The macrostructure indicates that the considered EB-welding parameters can produce a weld in ‘keyhole mode’. The maximum width of the weld bead at the reinforcement side is equal to 5 mm, while at the bottom, it is approximately 3 mm. The macrostructure of the weld joint broadly indicates that the HAZs on both sides, i.e., on the AA 2219 and AA 5083 sides, are very obscure. AA 2219 has a coarse grain size, while AA 5083 has a finer grain than AA 2219 alloy. Note that the dark round feature in the center of the FZ (Figure 3) is a grinding and polishing artifact and not a crack.

3.2. Metallurgical Analysis

For the purpose of better understanding, AA 2219 is considered as a binary Al-6.3% Cu alloy that completely melts at 642 °C and has a eutectic temperature of 548 °C, where liquid metal transforms to a two-phase structure in solid-state (α + θ) with concentration (%) of Cu v/s Al as 33/67. The Al2Cu phase, also called θ-phase, has 53% Cu versus 67% Al. The θ-particle is an intermetallic compound that stays incoherent to the Al-rich α-matrix.

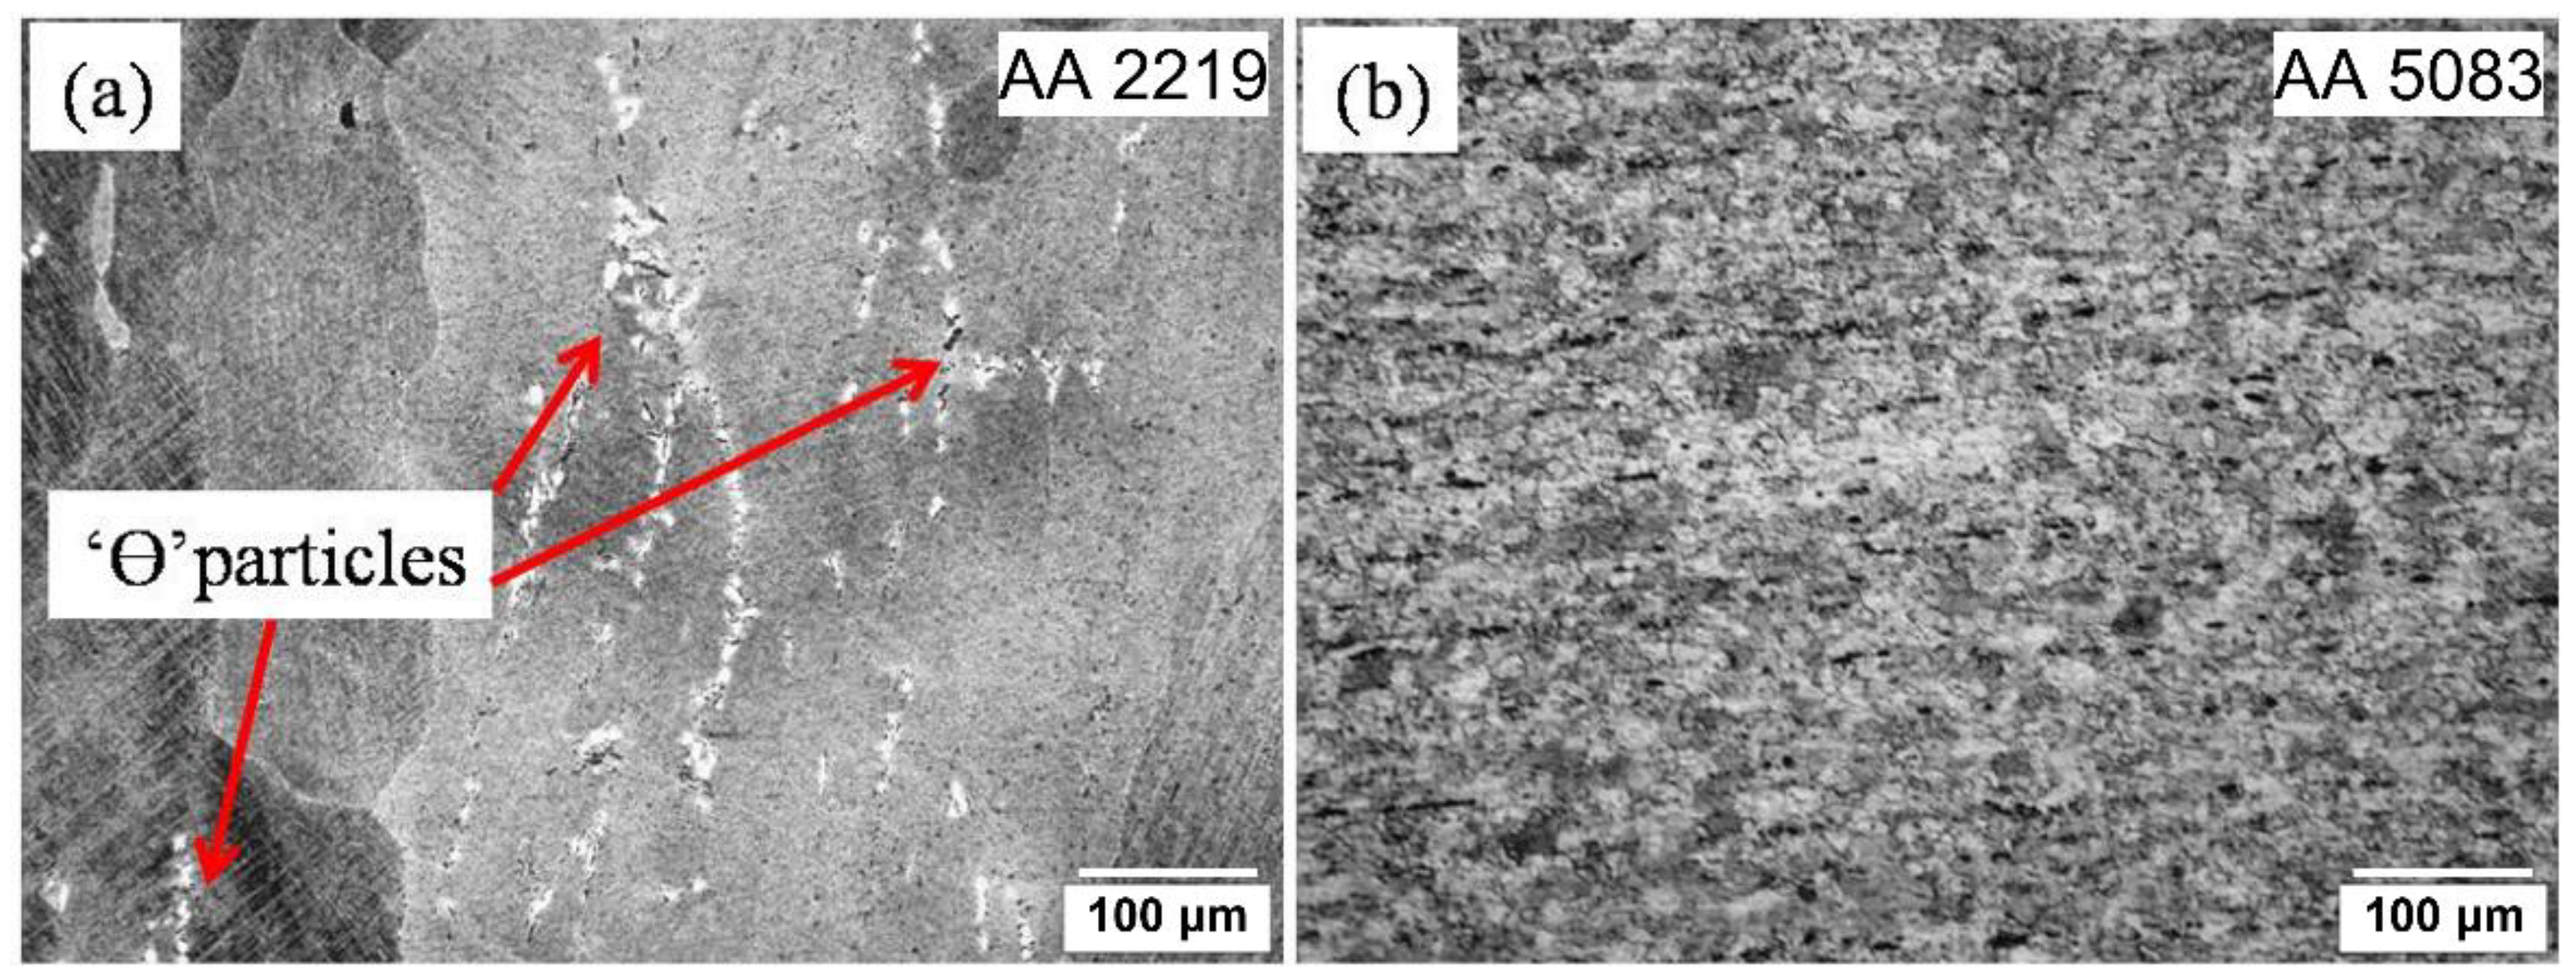
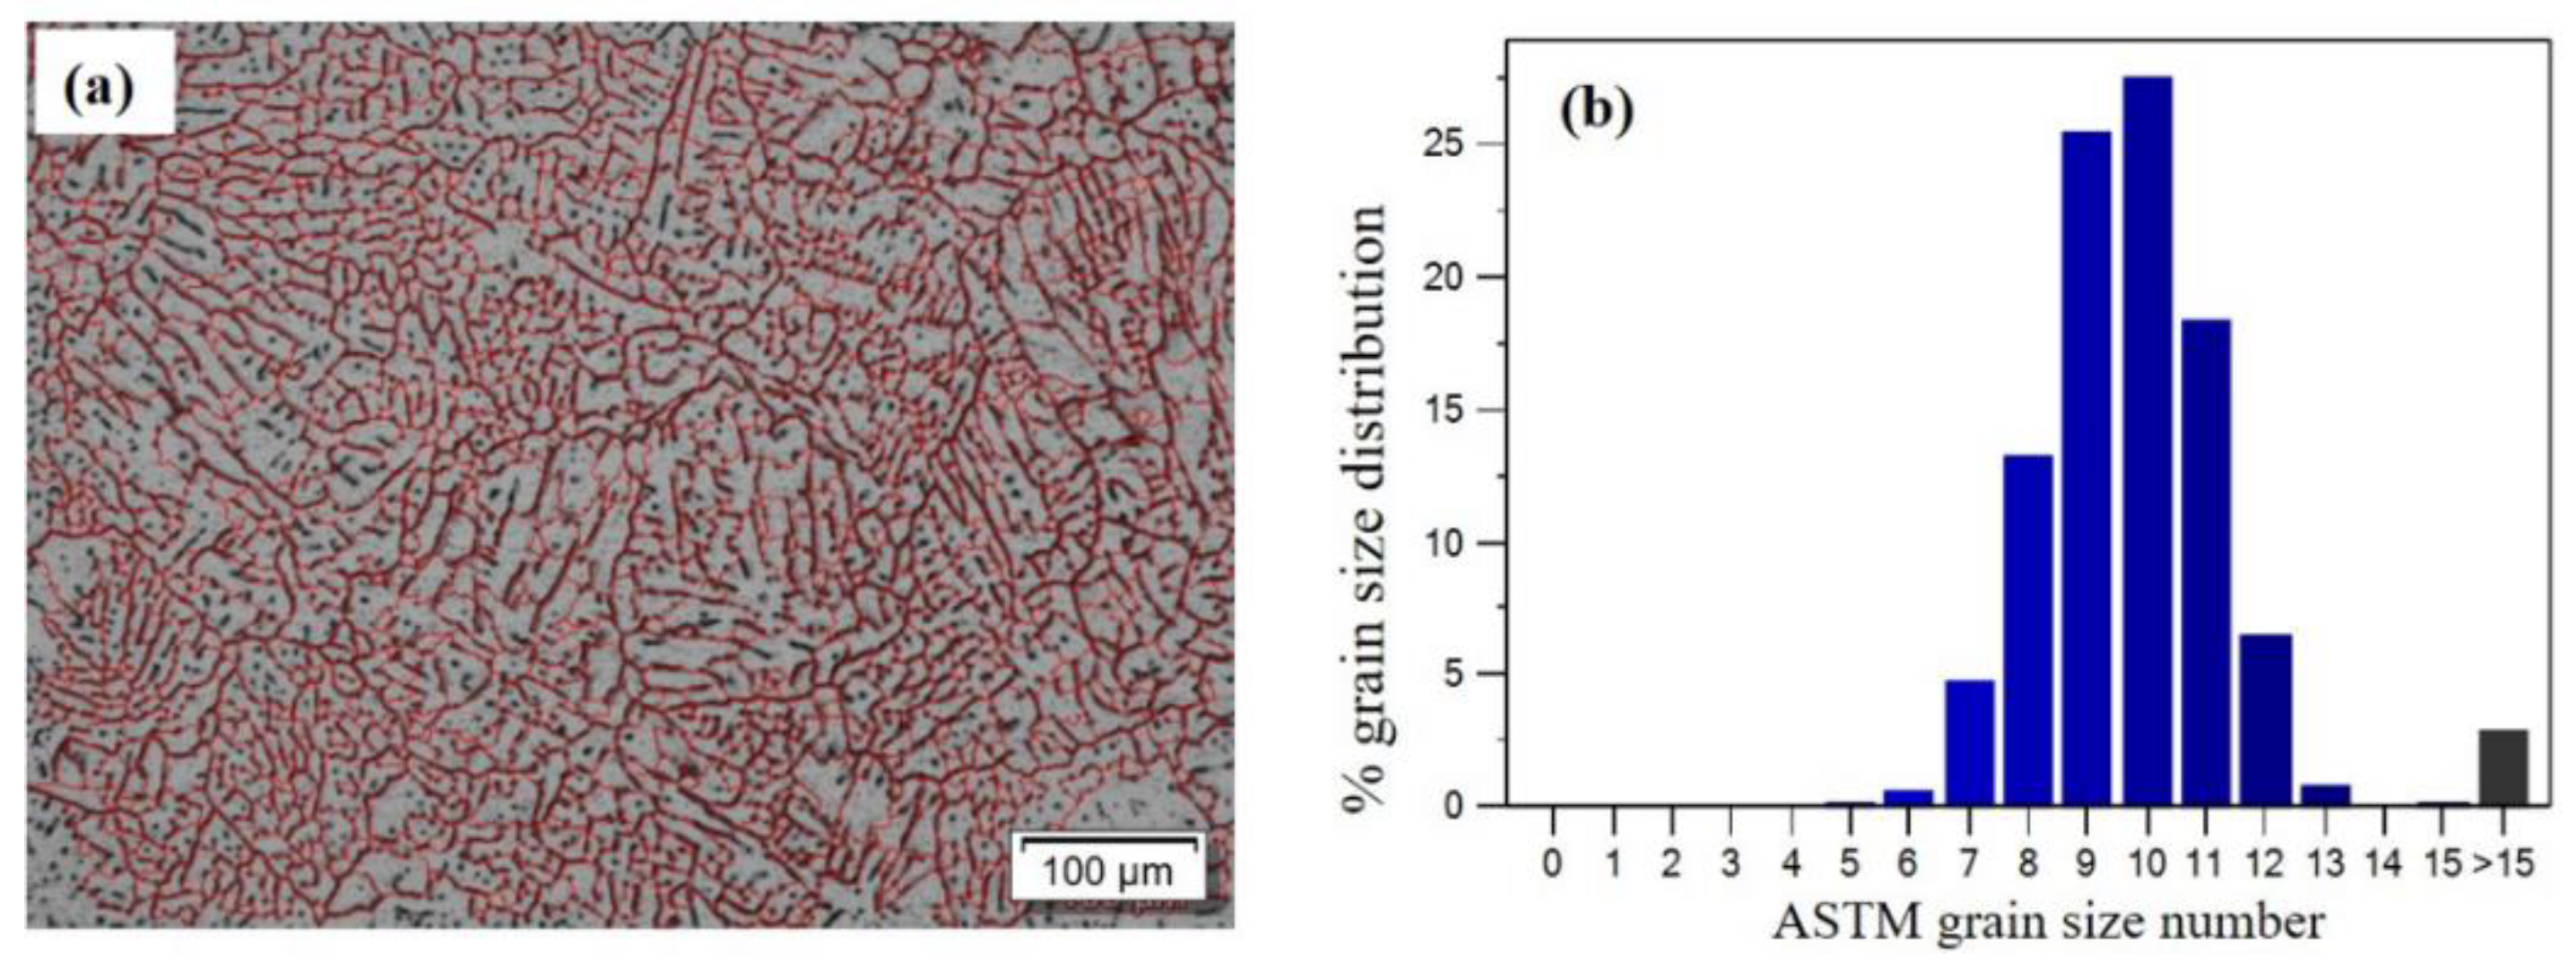
3.2.1. Base Material

The typical optical microstructures of the base materials, i.e., AA 2219-T6 and AA 5083-H116, are shown in Figure 4. As seen in Figure 4a, the AA 2219 base material consists of typically coarse grains measuring approximately 1.5 to 2.0 mm, with the presence of θ (Al2Cu) particles spread across the whole matrix, at GBs and the interior to the grains. The microstructure (refer Figure 4b) of the AA 5083 base material contains uniformly distributed fine grains with slightly elongated grains in the direction of rolling.

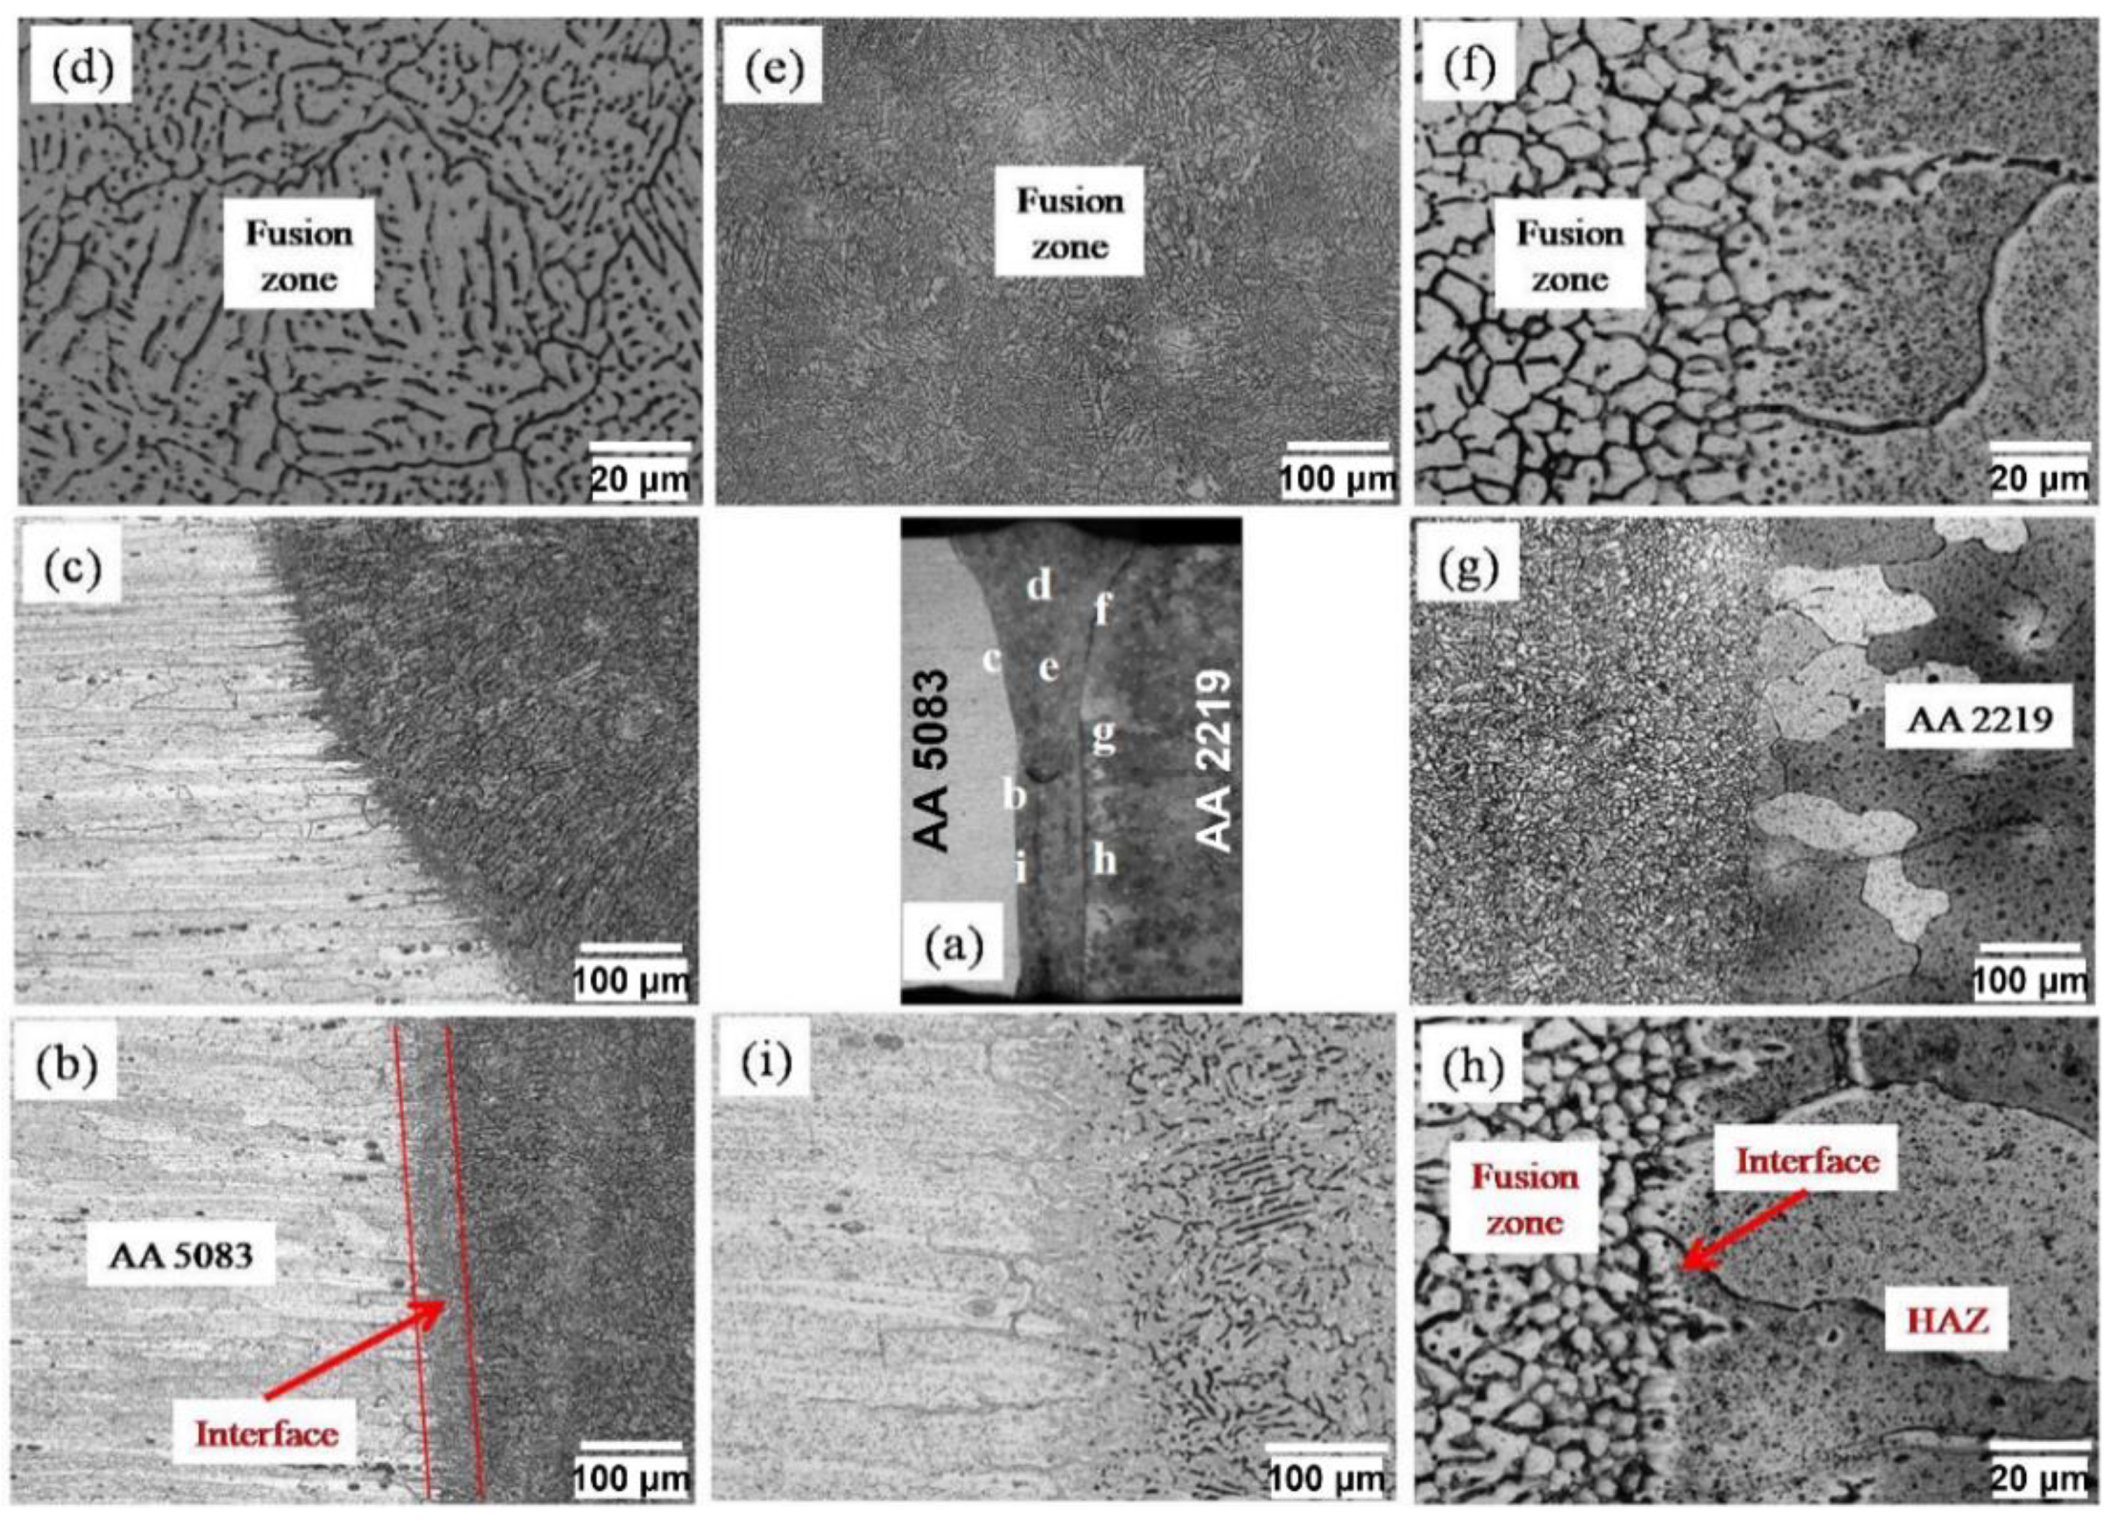
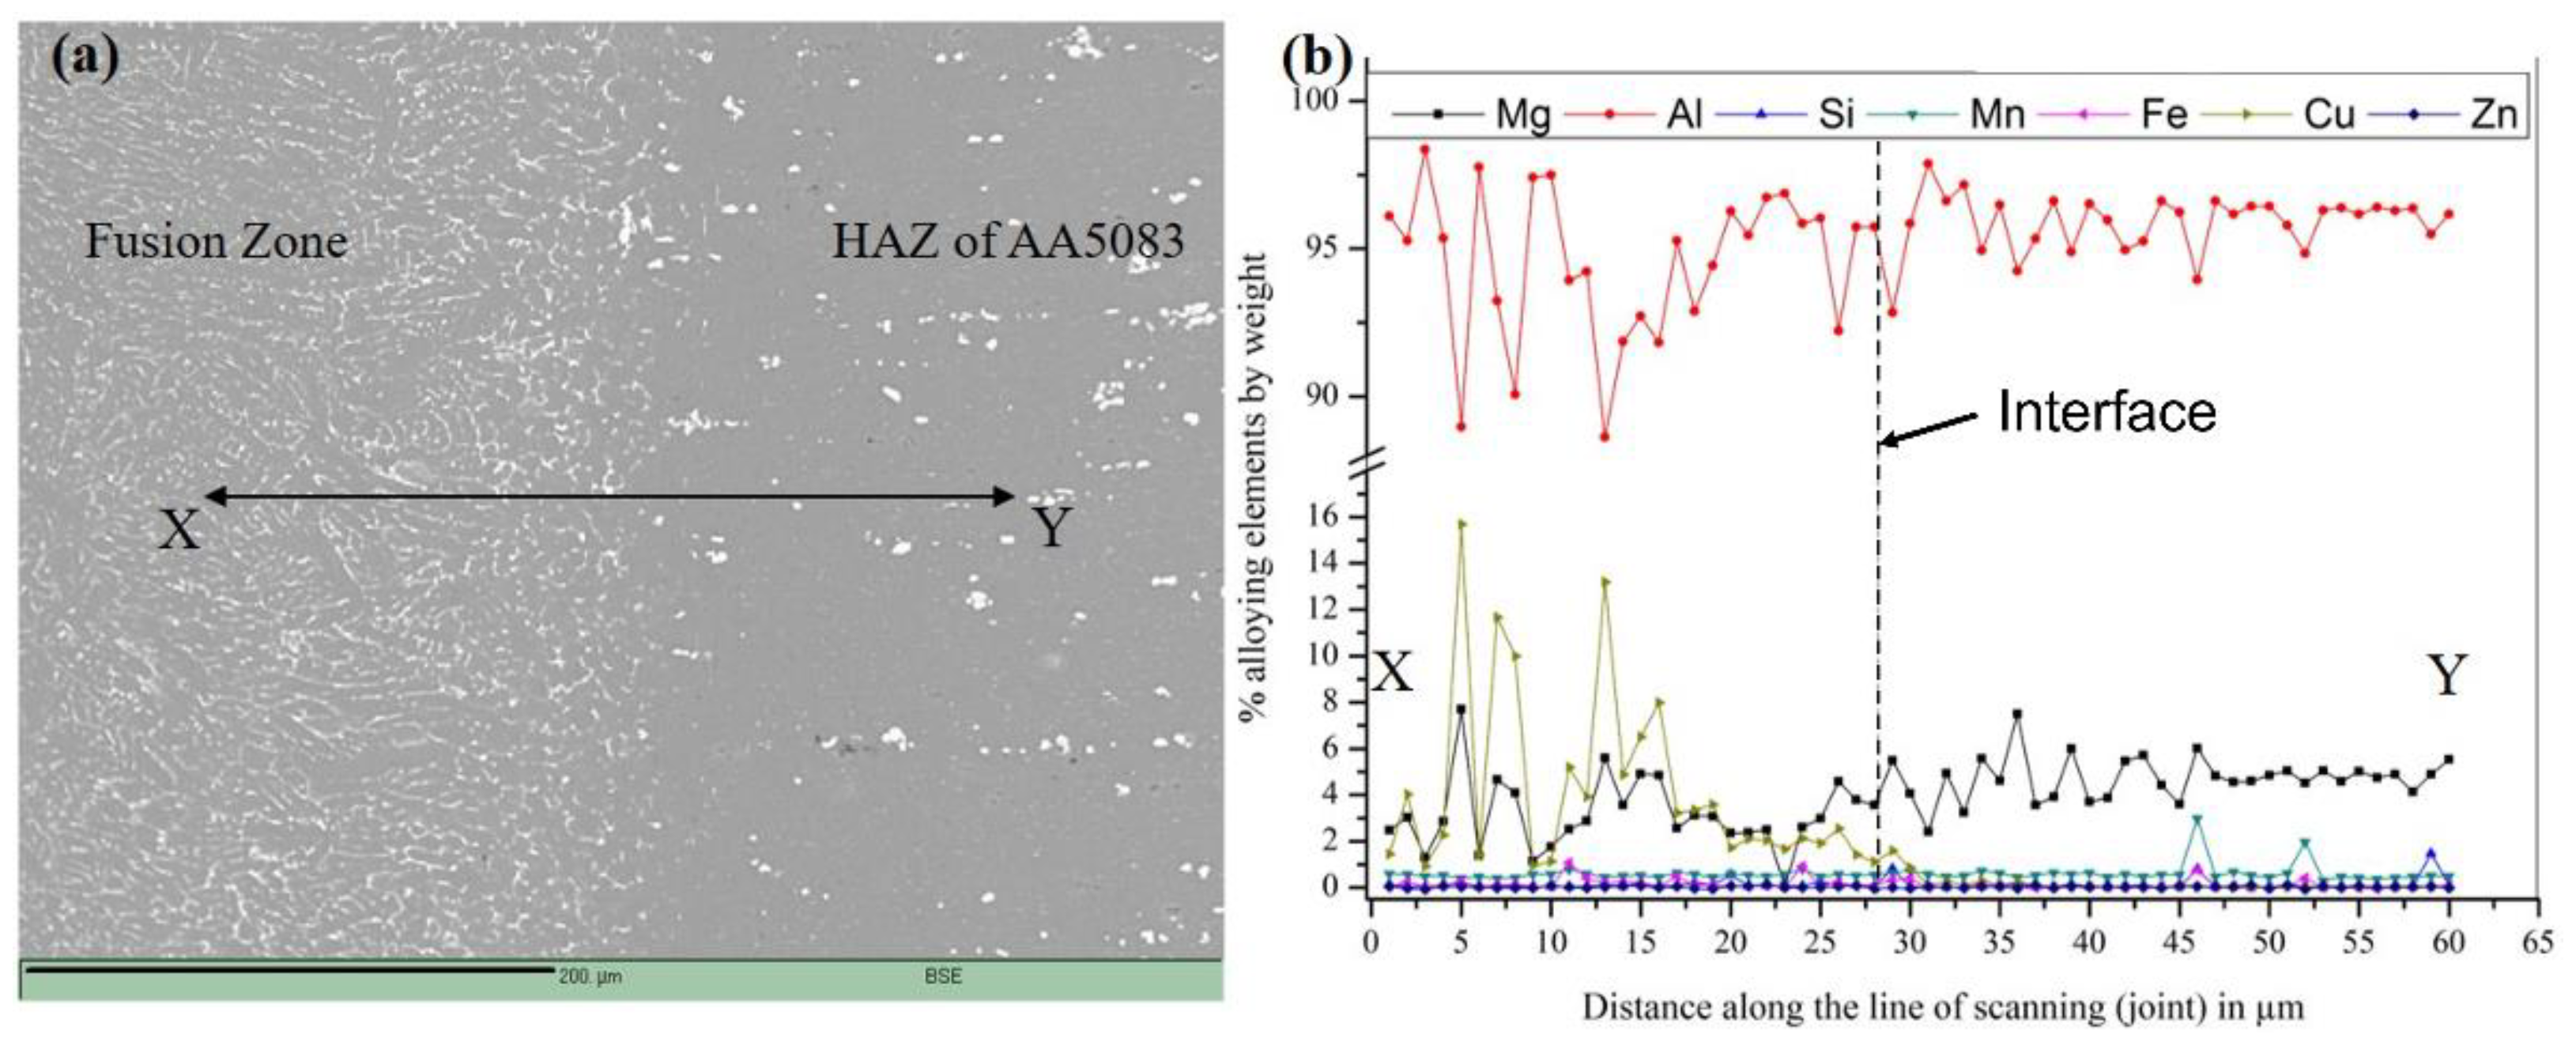
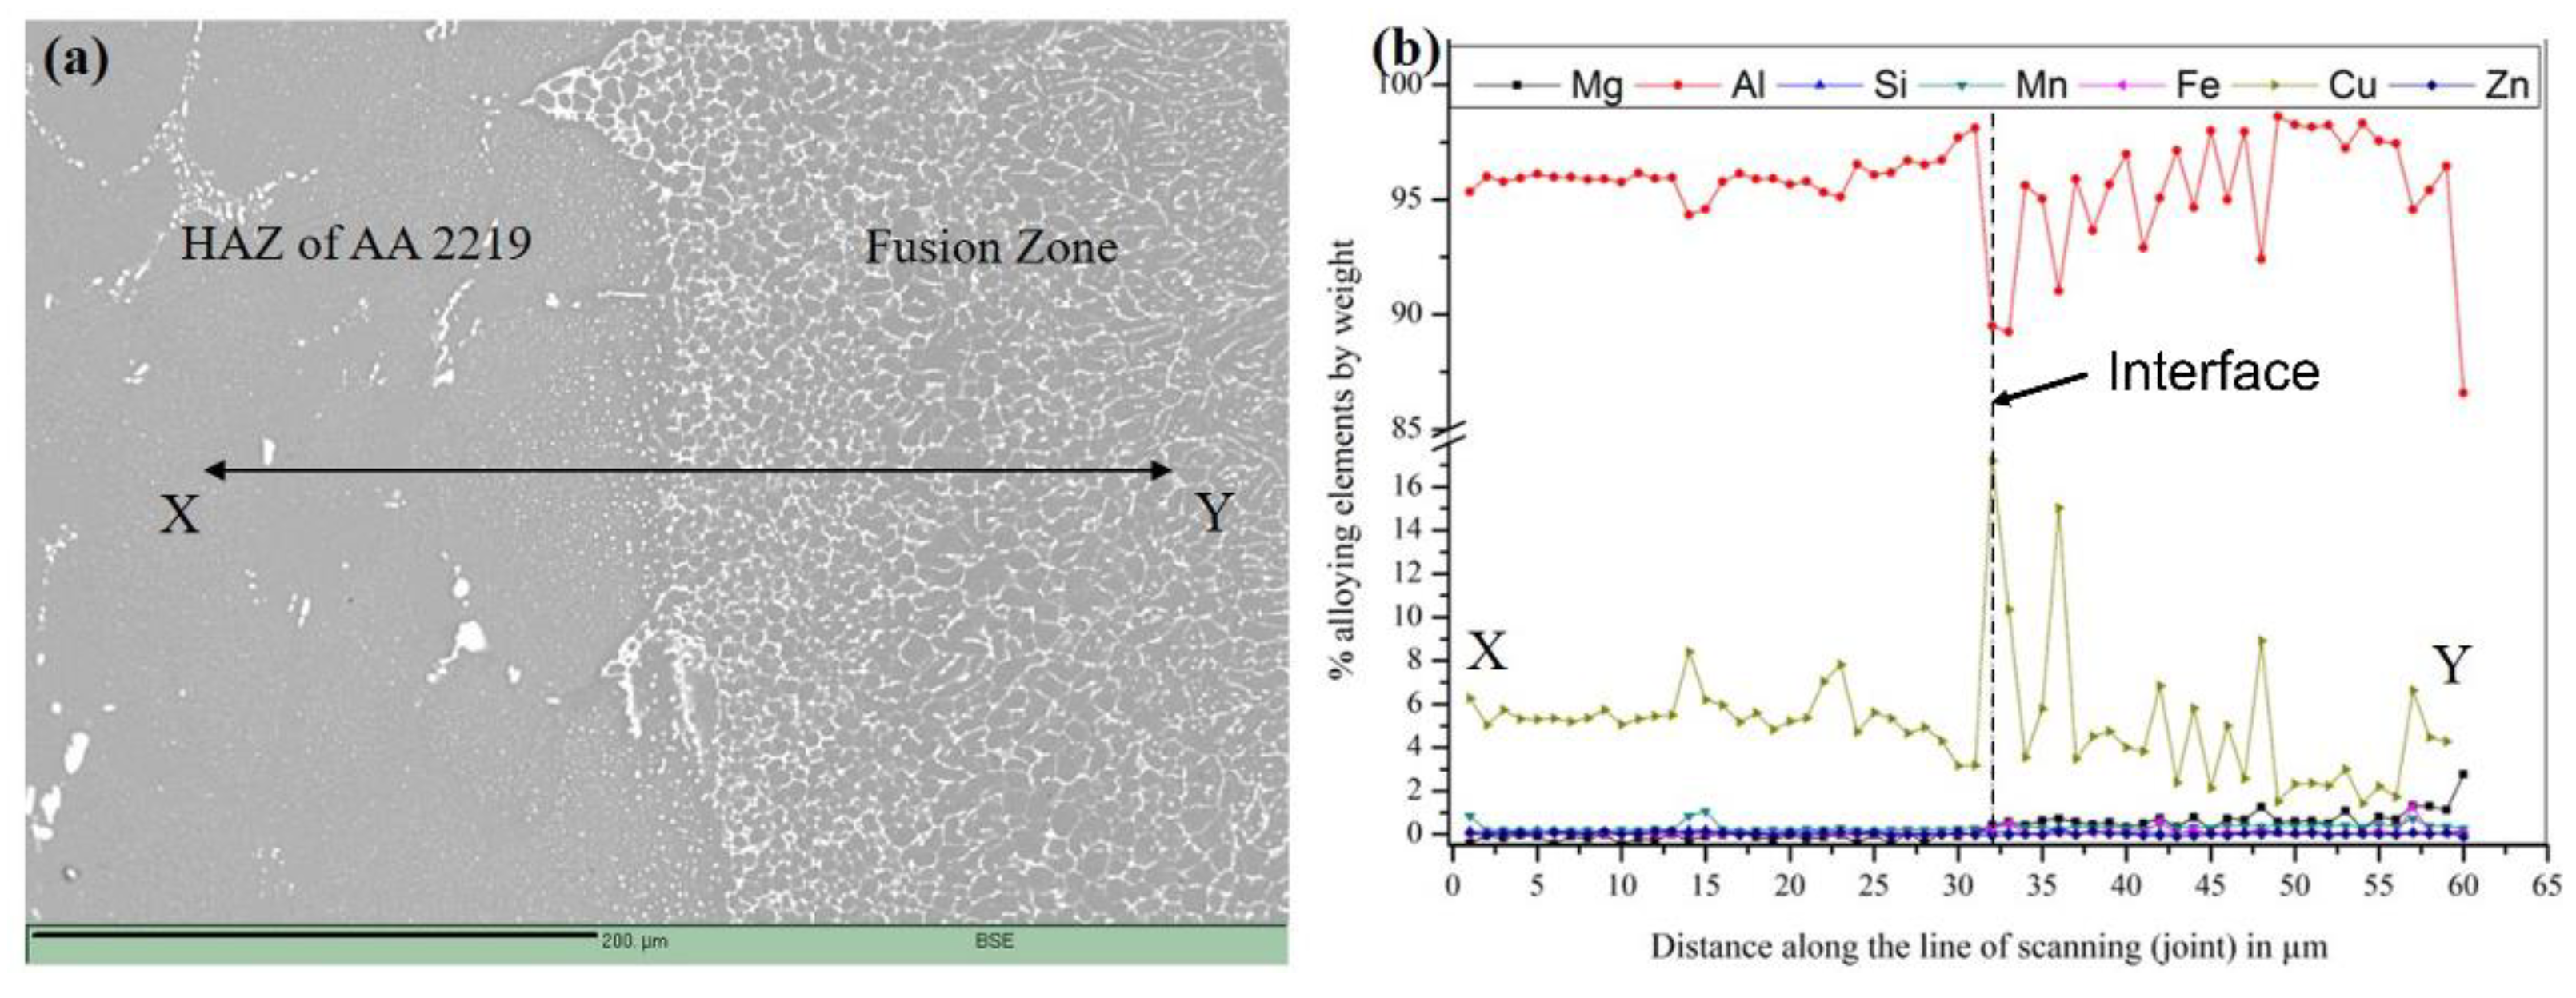
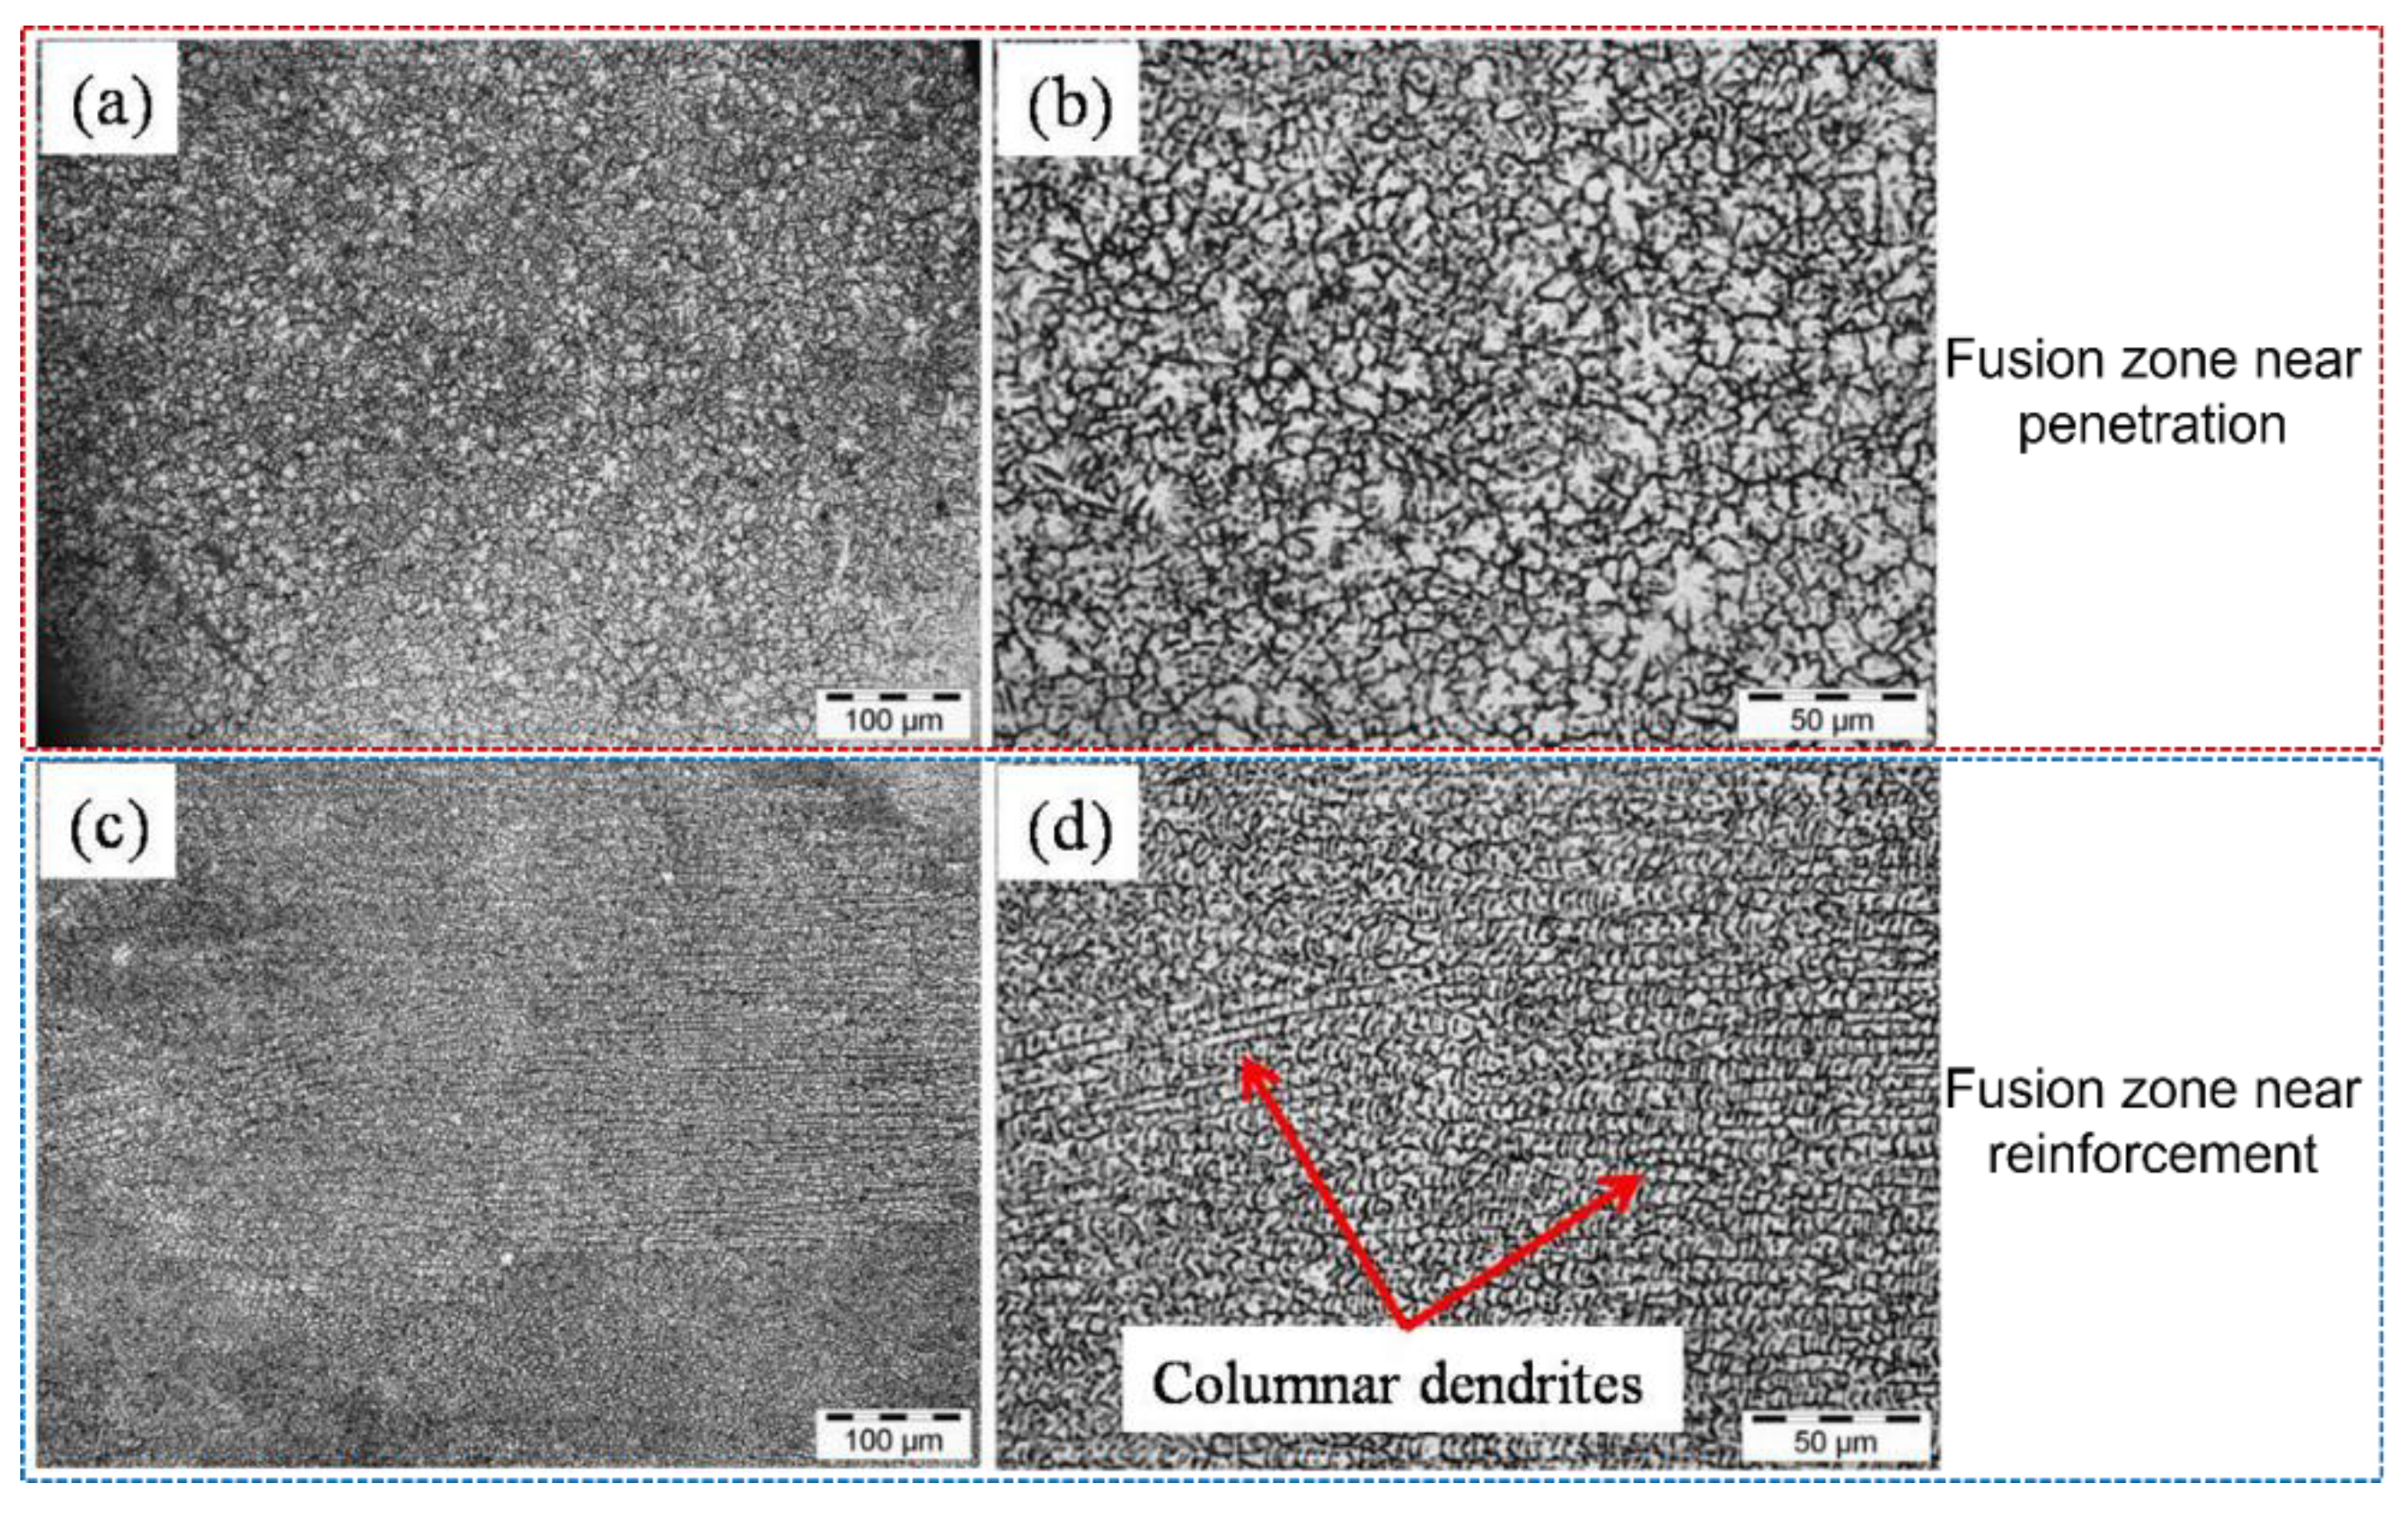
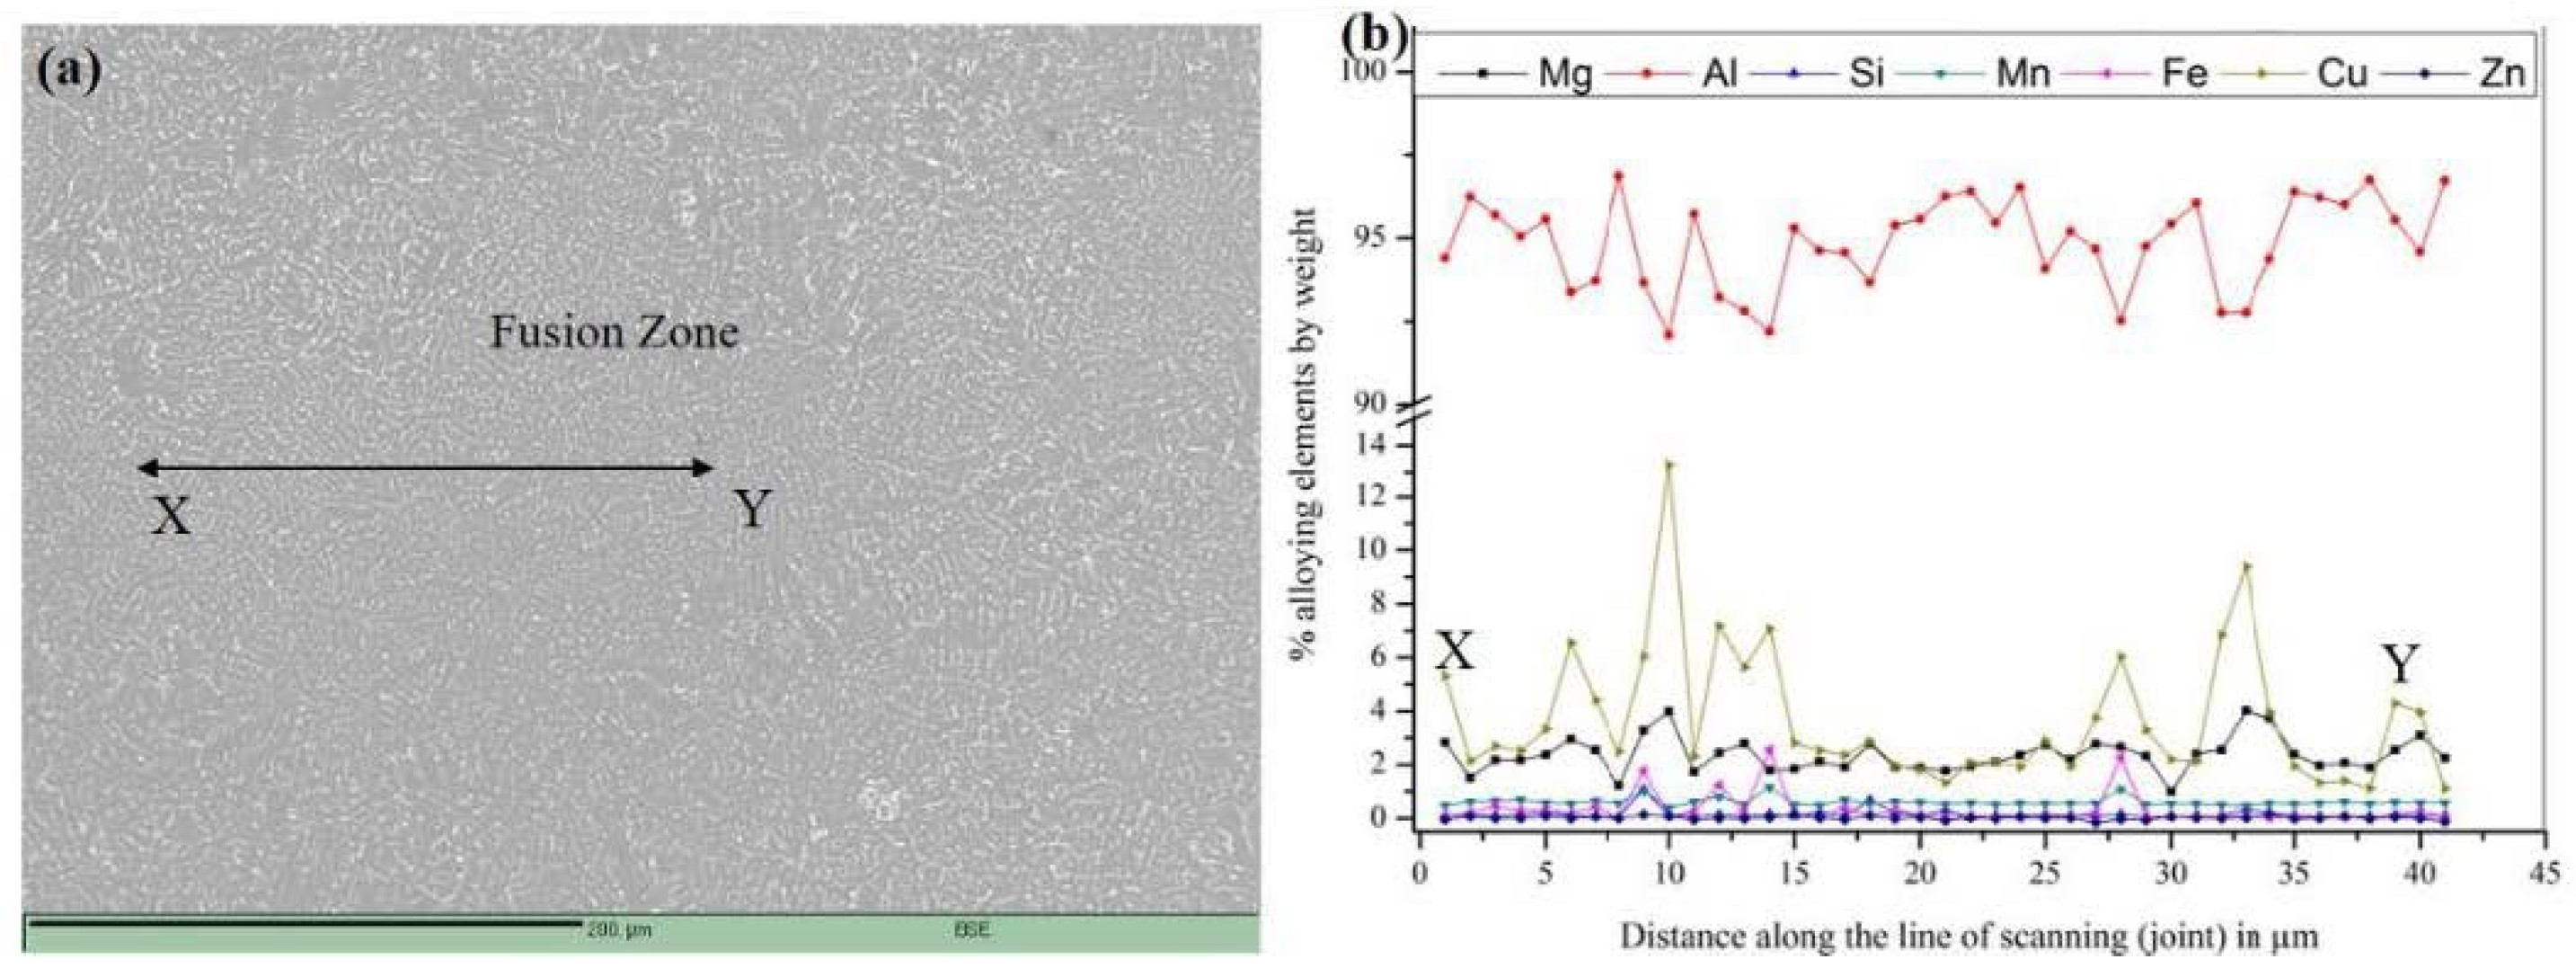
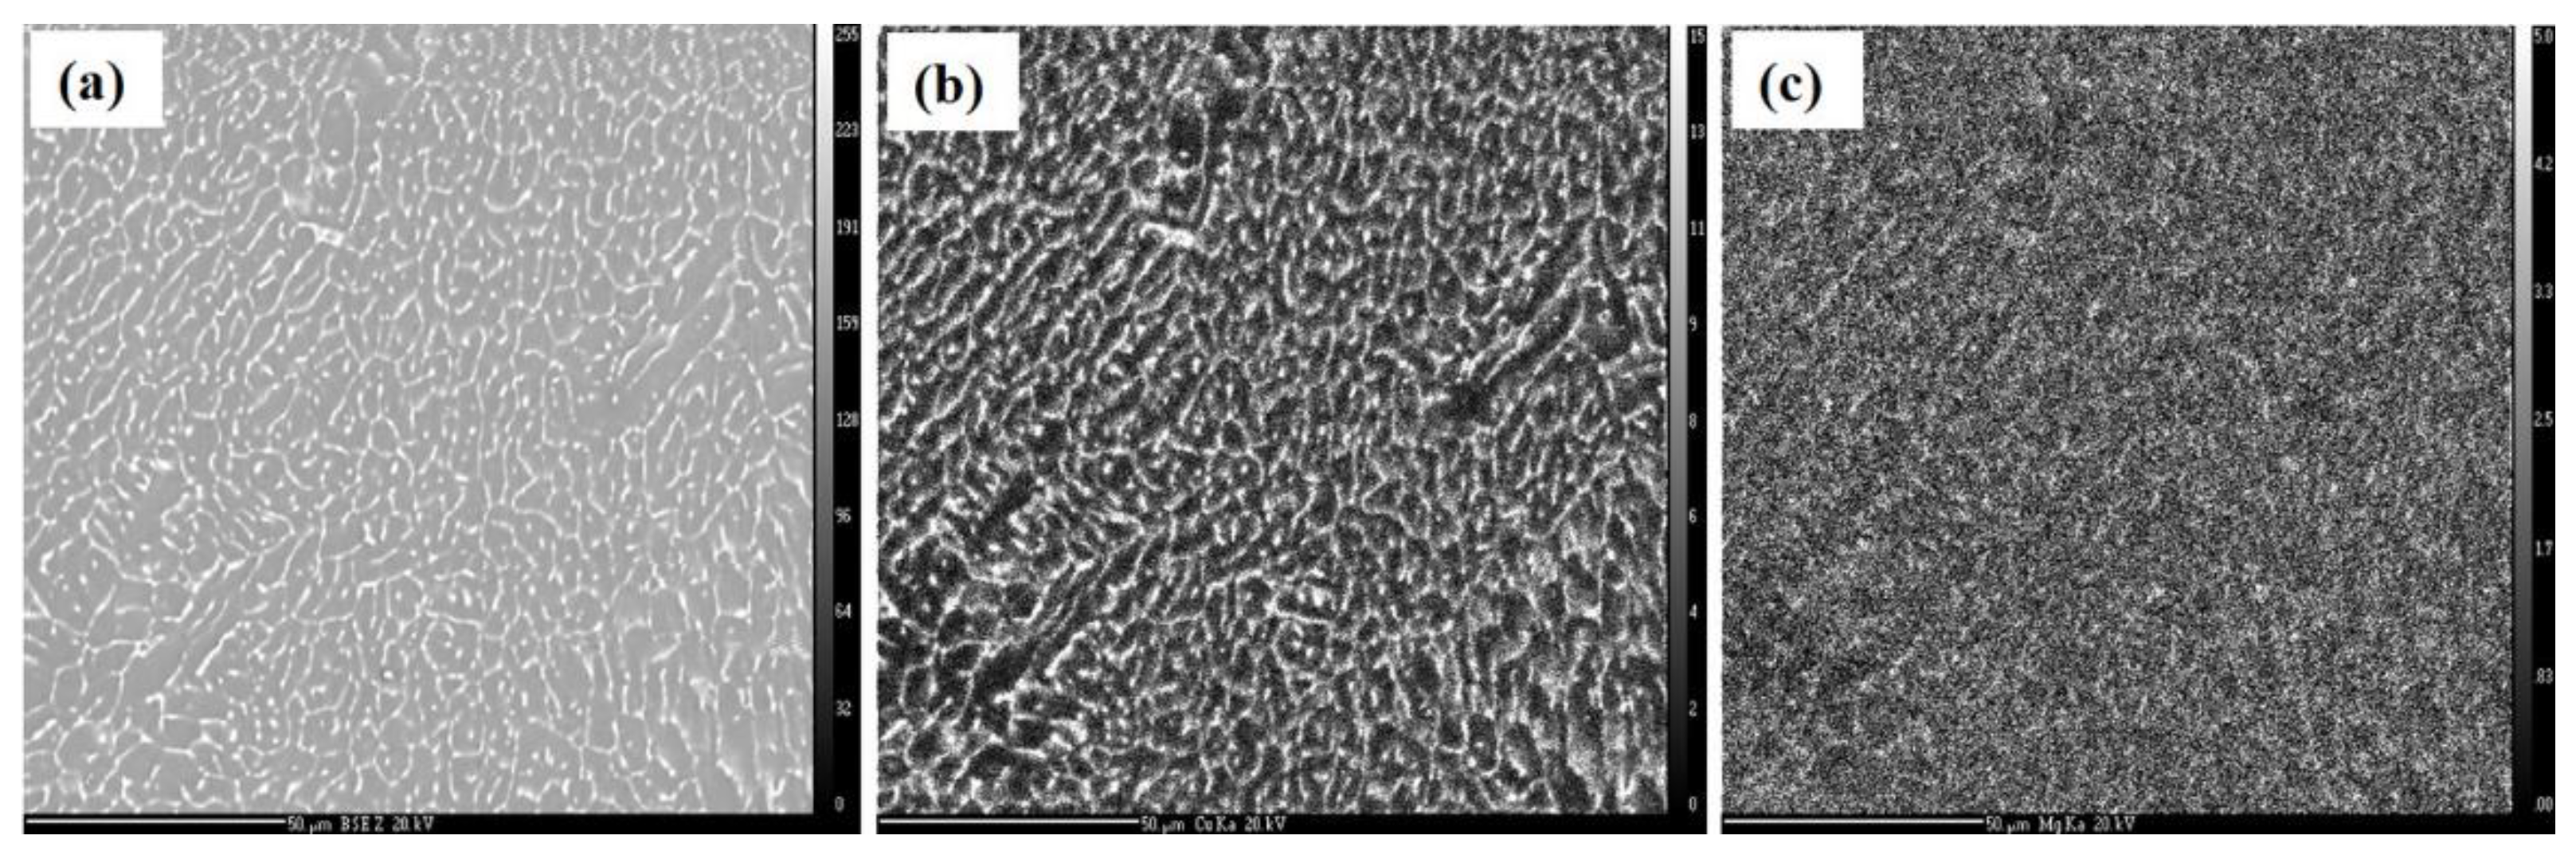
3.2.2. Weld, Fusion Zone, and Interface

The microstructures of different zones of a representative AA 2219-AA 5083 dissimilar EB-welded joint are shown in Figure 5. The macrostructure is provided in Figure 5a, and the different zones of the weld cross-section are marked from Figure 5b to Figure 5i. The interface near the AA 2219 side is very clear and distinct, from which the FZ grains are noticed to be originating. The microstructures close to the AA 5083 interface are shown in Figure 5b,c. The fusion interface near AA 5083 is found to be more diffused over a wide area (see Figure 5b), while the interface at the AA 2219 side is found to be a sharp line (refer to Figure 5g), which is clearly distinct. This phenomenon is because the thermal diffusivity of AA 5083 (0.45 cm2/s) is lower than that of AA 2219 (0.5 cm2/s), which leads to the accumulation of the major portion of welding heat at the fusion interface of AA 5083 alloy instead of being transferred to the HAZ or base material.
Elemental distribution across fusion interfaces towards the AA 5083 and AA 2219 sides obtained by EPMA are presented in Figure 6 and Figure 7, respectively. The variation of different alloying elements across the fusion interface along path XY (depicted in Figure 6b) demarcates both the FZ and the PMZ/HAZ. The weight percentage of Mg is 5% in HAZ/base material of AA 5083 side, while in the FZ, the same is found to be varying from 2 to 8%. The lower weight percentage could be due to the evaporation of Mg in the presence of high-power density prevailing in the keyhole of the EB-welding process. The local increase in Mg concentration in the FZ is mainly because of dilution from AA 5083. It can be observed that at the fusion interface near the AA 5083 side, there is no sudden change in the concentration of alloying elements. However, at the fusion interface near the AA 2219 side, there is a steep increase in the concentration of Cu, i.e., up to 17% (see Figure 7b). At the location where Cu concentration increased, %wt. of Al is reduced. This observation is discussed in detail in a later part of this section.
Optical microstructures of the FZ near the weld-penetration side and reinforcement side are shown in Figure 8. The grain size in the FZ (Figure 8a–d) is observed to be very fine (~10 µm). The grain size distribution in the FZ varies from ASTM grain size number 8 to 10, as shown in Figure 9. It is typically smaller by a few orders than the AA 2219 base material. The fine grain size in the FZ results from faster cooling rates prevailing in the keyhole mode during the EB welding. Similar observations on grain size in the FZ are made by Nair et al. [8] and Chen et al. [22]. The central and lower part of the FZ consists of equiaxed fine grains (Figure 8a,b), formed due to the faster cooling rate during welding. The formation of the equiaxed fine grains can be also attributed to the thermal gradient existing within the FZ, which is further aided by the different thermophysical properties of the two dissimilar Al alloys used in this work [23]. In the lower part of the FZ, the weld bead consists of near-parallel fusion interfaces (see Figure 5); therefore, during solidification, the heterogeneous nucleation predominantly produces uniform grain size. The upper part of the FZ is found to have primarily very fine horizontal columnar dendrites originating from the fusion interface (Figure 8c,d). The solidification front moves perpendicular to the fusion interface, thus resulting in the fine columnar dendrites. The grain size in the lower part of the FZ is slightly coarser than that of the upper part of the FZ, as evidenced from Figure 8. Note that the grain size measurement conducted using image analysis (software inbuilt with the metallurgical microscope), following the planimetric method as per the standard ASTM E112-13 gives only a qualitative idea of the size. For precise measurement of grain size, sample preparation and analysis need to be carried out by methods that are sensitive to crystallographic orientation, e.g., electron backscatter diffraction (EBSD). Another thing to note is that the microstructure depicted in Figure 9a represents a dendritic solidification structure and the characteristic length scale is the dendrite arm spacing.
The results of EPMA (elemental distribution along path XY) in FZ is shown in Figure 10b with the corresponding backscattered electron micrograph in Figure 10a. The FZ weld chemistry indicates that all alloying elements are dispersed with varied concentrations. One of the important observations in the EPMA analysis of FZ is that Cu has segregated at GBs (%Cu~10 to 14%), while Mg is found to be evaporated moderately (%Mg~2 to 3.5%). A similar observation is evident from Figure 11, where the Cu segregation at GBs (Figure 11b) and uniform distribution of Mg in the entire matrix (Figure 11c) is clear.

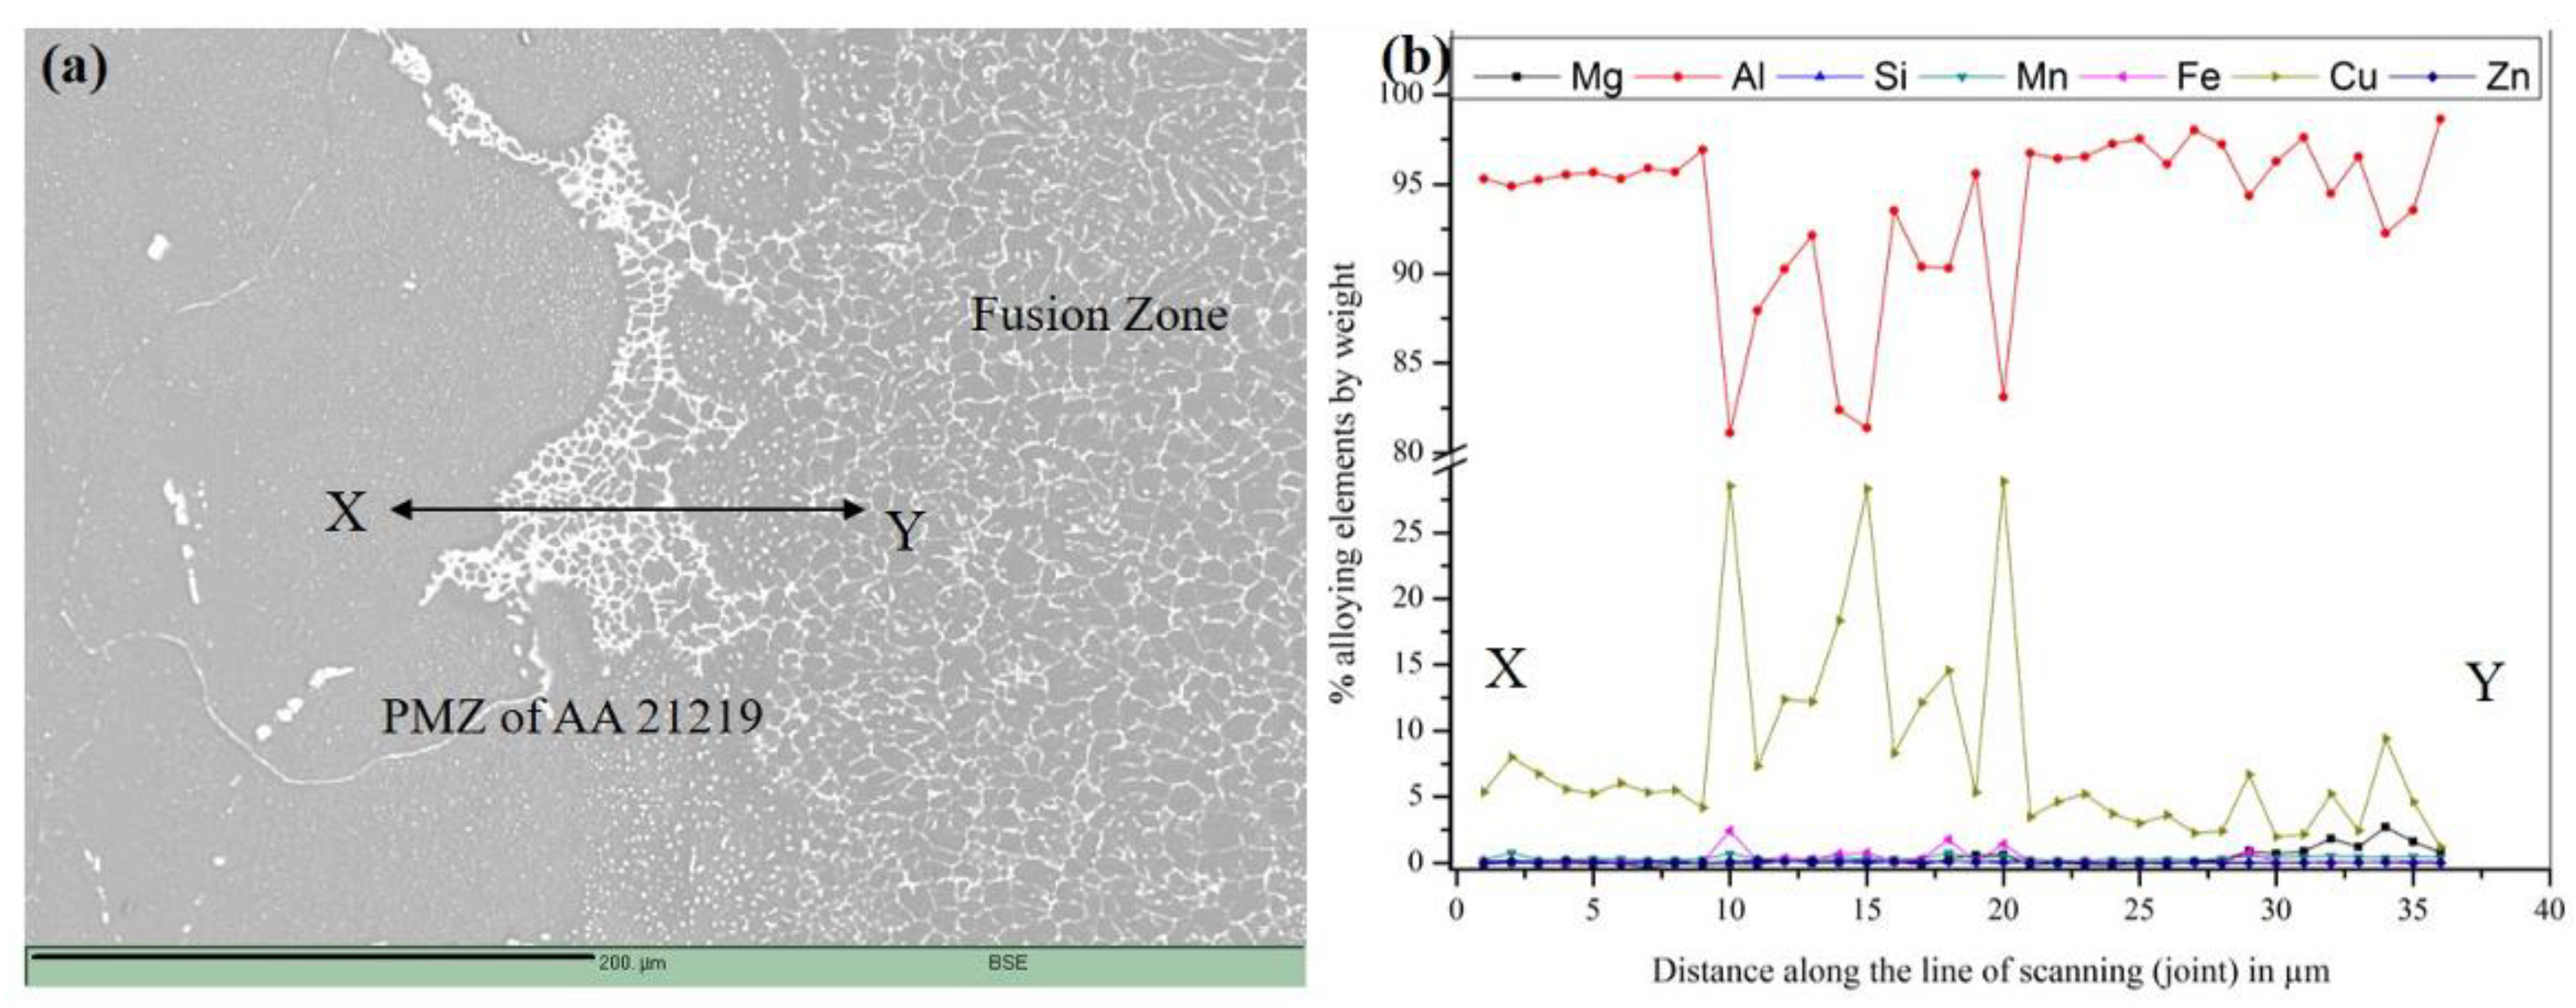
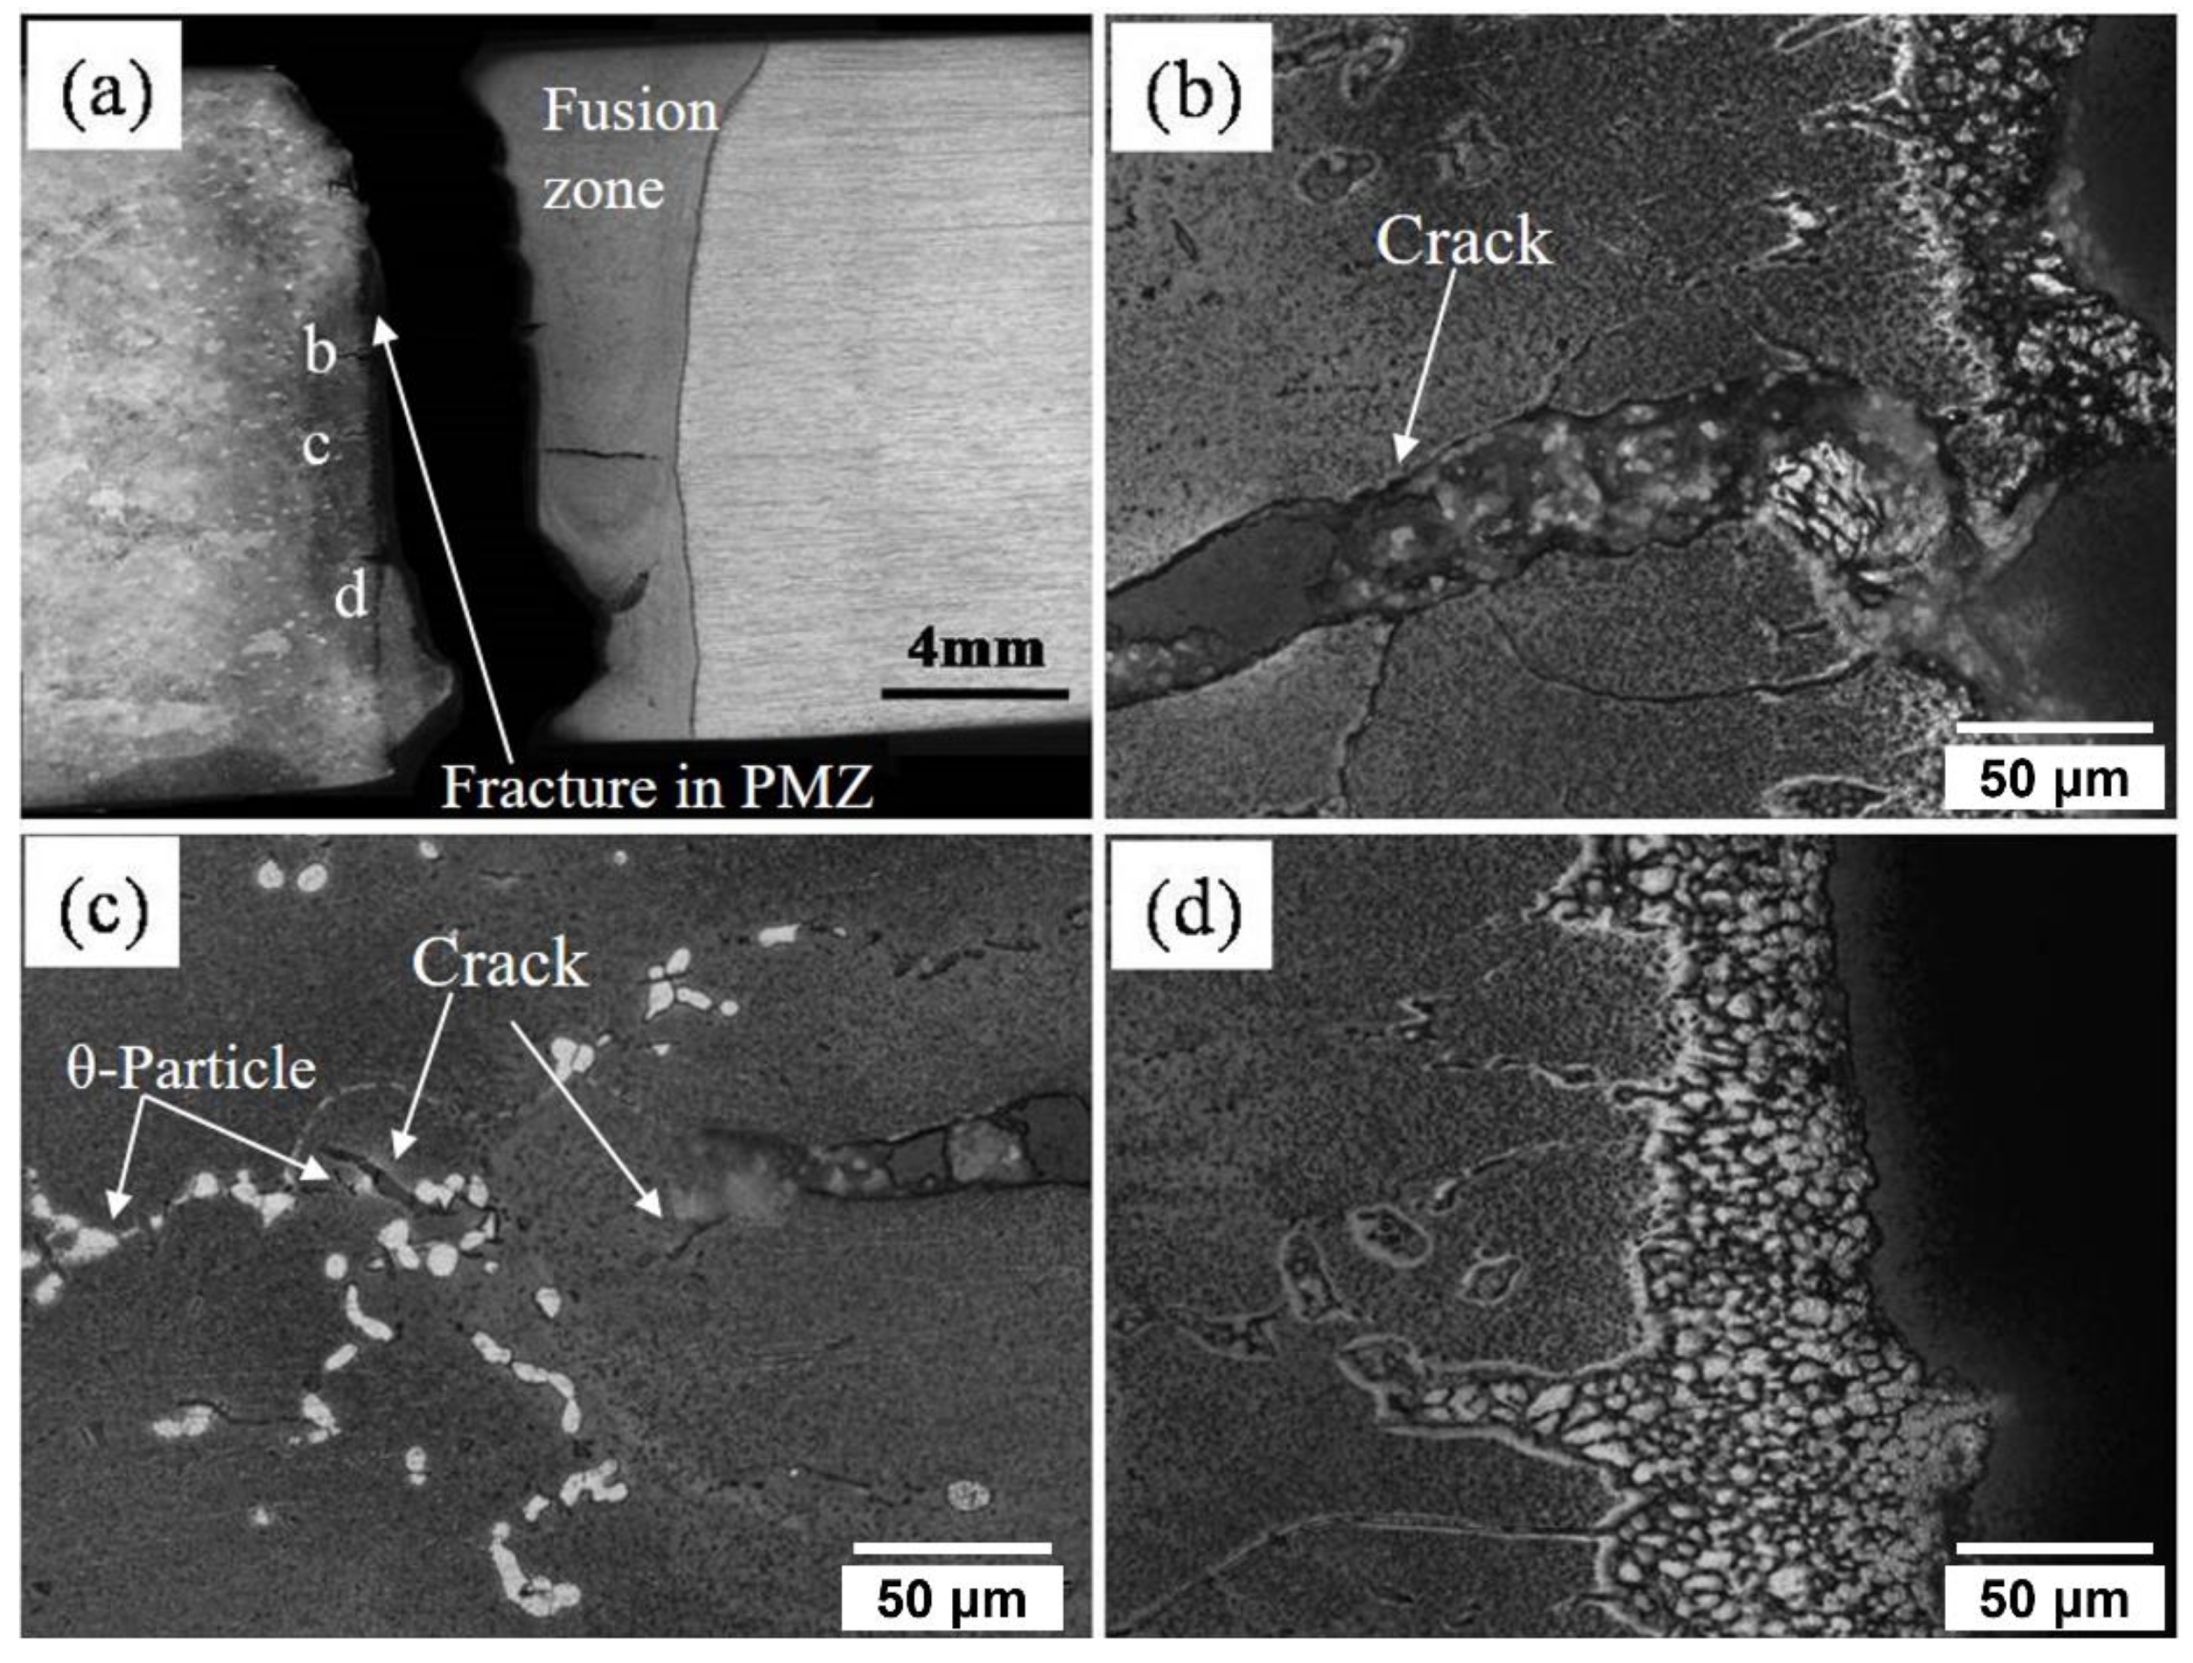
3.2.3. Partially Melted Zone (PMZ)

The low- and high-magnification microstructures of various locations of PMZ of AA 2219 side of dissimilar EB weld are shown in Figure 12. The liquation in PMZ can primarily occur at two locations: (i) along the GBs near the fusion interface, and (ii) at locations of large-sized prior θ-particles within the grain. The optical microstructure given in Figure 12a depicts the presence of large-sized eutectic phase (prior θ-particles) spread along the GBs and within the GBs of the supersaturated Al-Cu solid solution in AA 2219 base material. Figure 12b,c shows the microstructure of the fusion interface on the AA 2219 alloy side at two different locations. GBs and liquated prior θ-particles are darkened along the fusion interface compared to the adjacent matrix, which is seen as a brighter area. Some of these areas of interest along the fusion interface are observed at higher magnification and shown in Figure 12d–f. Upon exposure to the severe welding thermal cycles, re-melting of eutectic GBs and the prior existing θ-particle occurs as it is the last to solidify. During the solidification after liquation, the prior θ-particle becomes enriched with solute (Cu) (darker areas as shown in Figure 12f), thereby increasing the %Cu up to 53% (refer to Figure 13b). This phenomenon, in turn, results in depletion of Cu from the surrounding α-matrix (brighter areas as shown in Figure 12f). Similar observations are seen in Figure 12d. The GBs close to the fusion interface experience higher temperatures during welding and become liquated upon reaching the melting point. During resolidification, the GBs become enriched with Cu (darker dendrites, as shown in Figure 12e) by depleting Cu from the surrounding α-matrix (brighter areas shown in Figure 12e). It should be mentioned that the results presented in this section merit further investigation due to the limited structural resolution of the microscopy technique used. It is important to note that unlike normal eutectic, which is characterized by the simultaneous growth of α and θ in a coupled fashion, the GB eutectic in the PMZ is often divorced and displays no coupling [12,14]. The α phase of the eutectic grows upon—and is thus indistinguishable from—the primary α of the matrix, leading to θ alone being visible. For divorced eutectic, the GB eutectic appears thin, whereas for normal eutectic it is thicker. For the proper (qualitative and quantitative) distinction between normal and divorced eutectic and the θ phase, high-resolution microscopy techniques are warranted.
The extent of Cu segregation along the GBs was measured using EPMA and found to be up to 33%, as shown in Figure 13b. The adjacent α-matrix where Cu depletion occurred recorded 2 to 3 wt.% Cu concentration during EPMA measurements (Figure 13b). In general, the PMZ is very narrow in high-energy-density welds, mostly covering a width of one or two grains [24], due to a small amount of heat input compared to conventional arc-welding processes. However, the present study reveals that although the extent of PMZ is narrow due to low heat inputs in the EB welding process, the presence of PMZ and associated metallurgical changes such as softened α-matrix and incoherent Cu enriched GBs and θ-particles led to the easy initiation of crack under tensile loading, as explained in next section.

3.3. Mechanical Analysis

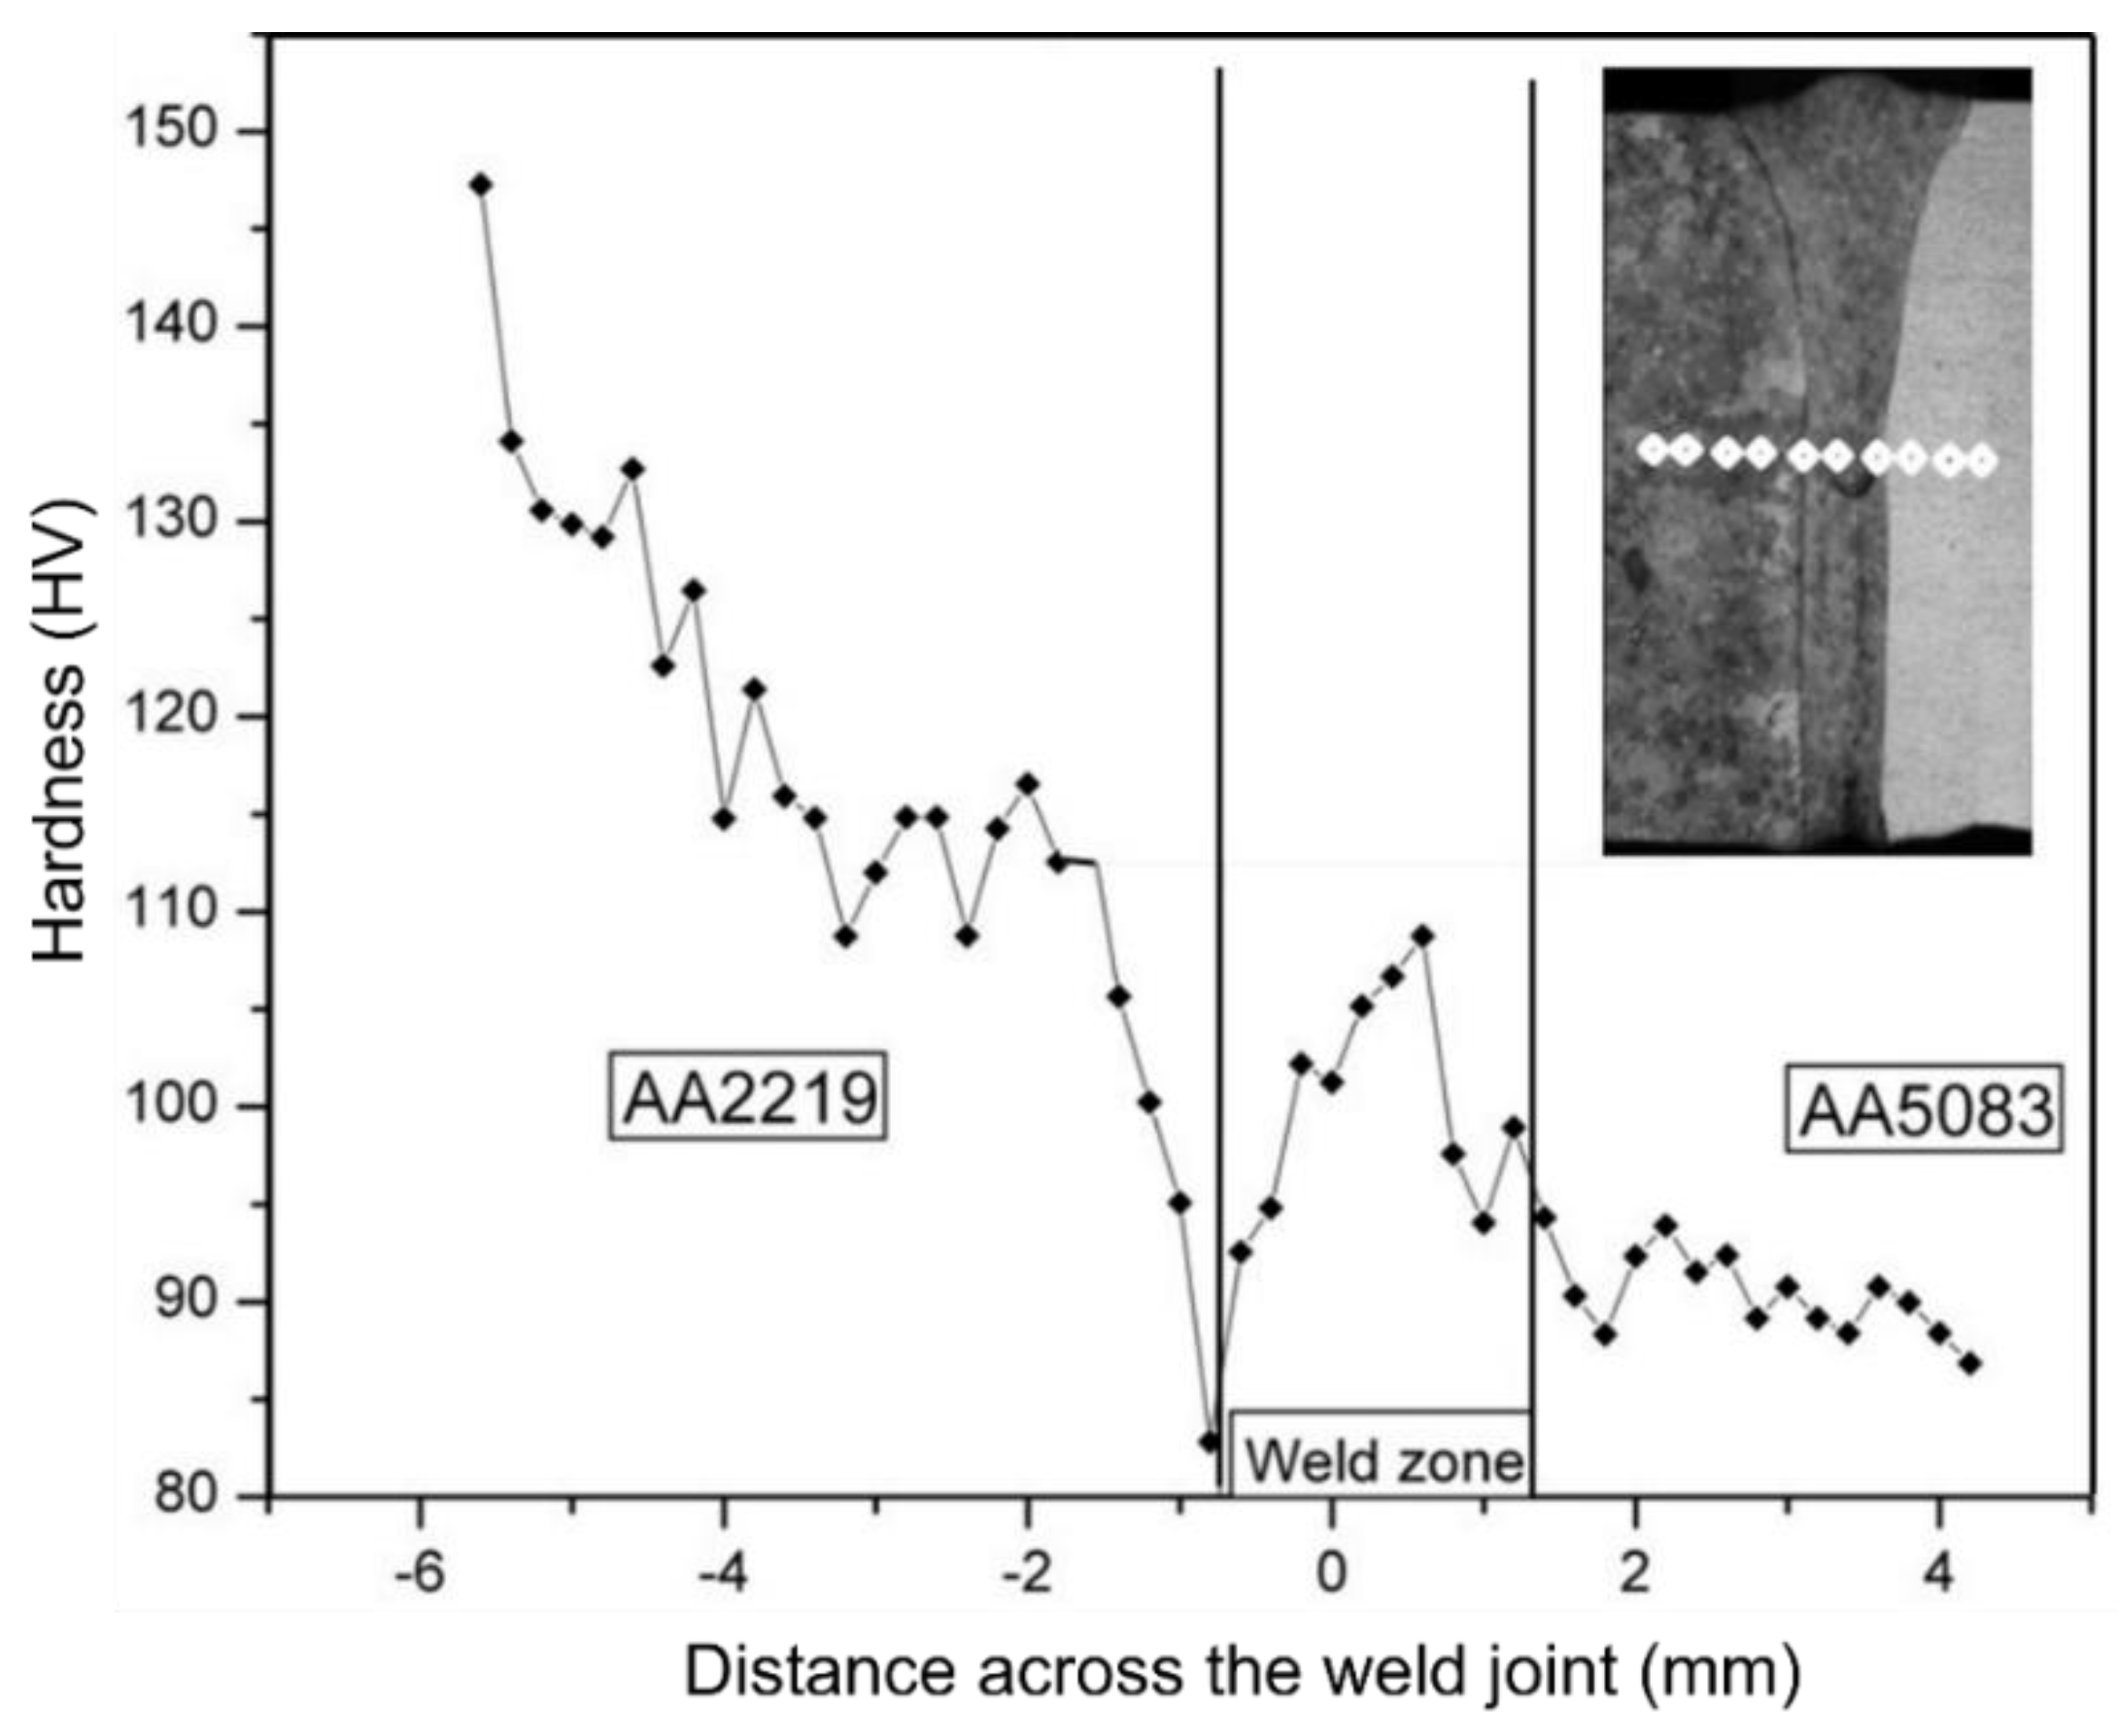
3.3.1. Hardness Variation

The typical variation of microhardness along the mid-thickness of a transverse cross-section of the AA 2219-AA 5083 dissimilar EB weld is shown in Figure 14. It may be noted that the hardness of the AA 2219 base material is substantially higher than that of the AA 5083 base material. As can be seen, there is a drop in the hardness at the HAZ close to the AA 2219 side compared to the unaffected AA 2219 base material. The hardness in PMZ, which is close to the fusion interface of AA 2219, was minimal, and the hardness declined very sharply in this PMZ. A similar trend in HAZ towards the AA 5083 side is observed compared to the unaffected AA 5083 base material. The hardness of the FZ is significantly lower than that of the AA 2219 base material and slightly higher than the AA 5083 base material. The reduction in hardness in HAZ of AA 2219 could be due to dissolution or coarsening of Al2Cu precipitates due to the exposure to welding-heat input. The depletion of Cu from the α-matrix that exists surrounding the GBs and large-sized prior θ-particles can explain the sharp decline in hardness in PMZ. A reduction in hardness in PMZ of AA 2219 GMA welds was reported earlier by Huang et al. [14]. FZ hardness is less than the AA 2219 alloy base material due to the complete dissolution of strengthening precipitates in the FZ.
At the same time, it can also be observed from Figure 14 that the FZ hardness is slightly higher than that of AA 5083 because of alloying of both Cu and Mg, which results in enhanced solid-solution strengthening. Similarly, the drop in hardness of HAZ of the AA 5083 alloy side can be correlated to the loss of cold working/softening due to decreased dislocation density during the EB-welding process. Cam et al. [17,18], Chen et al. [22], Mastanaiah et al. [25], etc., have reported a reduction in hardness in HAZ of several types 5xxx Al alloys. In the present case of AA 2219-AA 5083 EB weld, the lowest hardness was observed in the PMZ of AA 2219. Note that similar to a previous study [20], the stabilization of the hardness occurs at a larger distance from the weld center. A detailed investigation concerning this observed phenomenon will be explored in the authors’ future work.

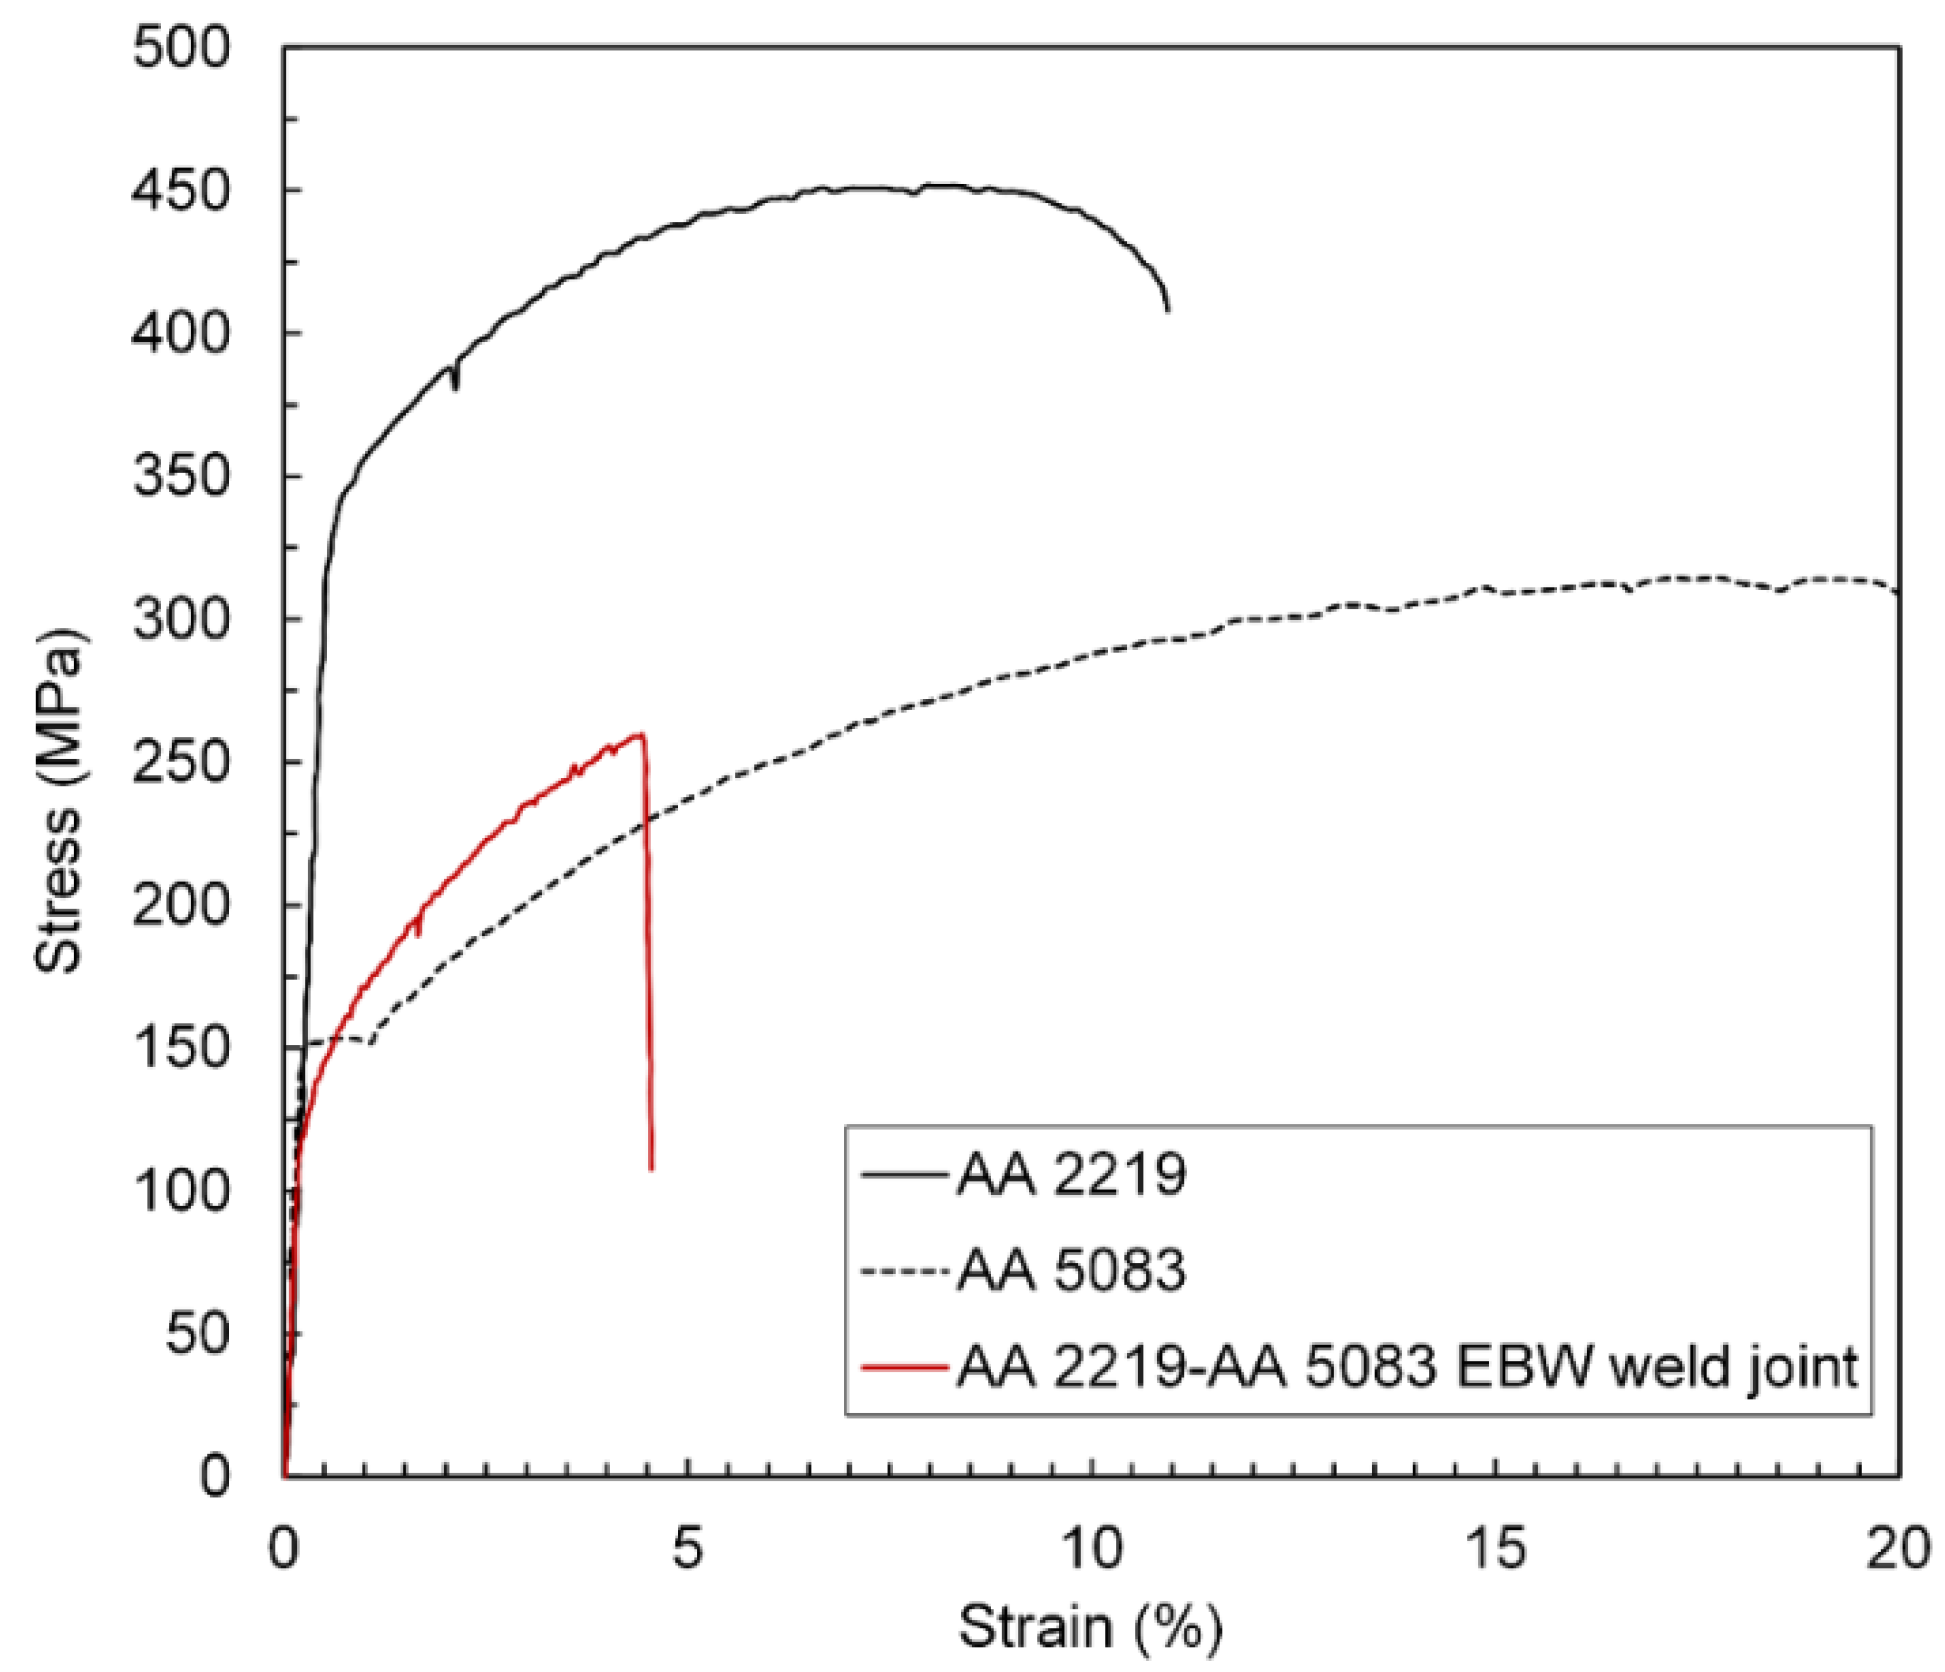
3.3.2. Tensile Properties, Failure Location, and Failure Mode

Representative tensile stress versus strain plots of EB weld joints and the corresponding AA 2219 and AA 5083 base materials are presented in Figure 15. It can be easily deduced from Figure 15 that the dissimilar weld joint possesses tensile strength (265 ± 7 MPa) moderately lower than the AA 5083 alloy base material, which is weaker among the two dissimilar alloys. However, the yield strength of the joint (140 ± 2 MPa) is quite comparable with that of the AA 5083 base material. The optical macrograph of the fractured tensile-test specimen of the weld joint is shown in Figure 16a. It is evident from Figure 16b,c that the crack initiated at the interface of the Cu-depleted α-matrix and Cu-enriched θ-particle in the PMZ. This could be because the Cu-depleted α-matrix readily deformed under the influence of tensile load. In contrast, the Cu-enriched θ-particle was separated from the matrix, allowing crack initiation. Figure 16c depicts the initiation of multiple cracks at such interfaces of the α-matrix and Cu-enriched θ-particle. Thus, it can be concluded that the fracture of the weld joint was initiated from PMZ of AA 2219 side, which possessed minimum hardness compared to the other zones of weld joint (Figure 14) and propagated to the FZ in the bottom of the weld joint (Figure 16d). Thus, the weld is observed to have both strength and % elongation (4.5 ± 0.6) lower than those of both the base materials.
The fractured surfaces of the weld-joint tensile-test specimens were observed to understand the failure mode. The fractographs, presented in Figure 17, suggest that occasional cleavage-like features are evident in the grain interiors, in addition to the microvoid features. The fracture of this particular weld joint appears to be a shear-dominated phenomenon.

3.4. Failure Mechanism: Thin v/s Thick EB Welds

The metallurgical structure of the weld zone is determined by the cooling rate from the maximum or reference temperature (Tc). The cooling rate in a plate depends upon the plate thickness. The thin plates cool fast, while the thick plates contain the heat for a longer duration because of increased thermal mass. The heat conduction is two-dimensional vis-à-vis the welding direction and the lateral direction for thin plates. The heat conduction in thick plates is three-dimensional, including welding, lateral, and thickness directions. The cooling rates (Rc) for two-dimensional and three-dimensional heat flow in welds are given by the following relations:
Cooling rate for three-dimensional heat flow:
R c = 2 π k ( T c T o ) 2 H n e t
Cooling rate for two-dimensional heat flow:
R c = 2 π k ρ C ( T c T o ) 3 ( h H n e t ) 2
where k , ρ , C , h , and T o are thermal conductivity, density, specific heat of the material, plate thickness, and initial plate temperature, respectively. H n e t is the heat input per unit length given by η V I / s ; η is the heat source efficiency; V is the voltage; I is the current; and s is the welding speed.
Thin and thick plates follow two- and three-dimensional flow, respectively. However, thickness is a relative term. For a hypothetical thickness (known as critical thickness, h c ), the two- and three-dimensional flow relation should yield the same cooling rate. Thus,
2 π k ρ C ( T c T o ) 3 ( h c H n e t ) 2 = 2 π k ( T c T o ) 2 H n e t
or
h c = H n e t ρ C ( T c T o )
The designation of a plate as thin or thick, based on heat flow, is a relative term. Therefore, a relative plate thickness ( τ ) is defined:
τ = h h c = h ρ C ( T c T o ) H n e t
The thick- and thin-plate equations apply when τ > 0.9 and τ < 0.6 , respectively. When τ falls between 0.6 and 0.9, it is an intermediate condition [26].
To illustrate the cooling mechanism of the weld, the relative plate thickness is calculated at the eutectic temperature. The values of material properties and welding parameters are given in Table 4. Two cases of thin (previously investigated EB-welded plate of 5 mm thickness [20]) and thick (present investigation of EB-welded plate of 13 mm thickness) are compared. Though the thickness of the thick plate is 2.6 times that of the thick plate, the heat input ( H n e t ) is only 1.9 times. However, segregation is observed in the thick-plate weld, unlike the EB welding of the plate of 5 mm thickness [20]. This means that the cooling rate predominates the segregation phenomenon. The relative plate thickness for the EB-welded plate of 5 mm thickness is 0.52, which is a case of two-dimensional heat flow. On the other hand, in the present case of plate thickness of 13 mm, the relative plate thickness is 1.03, indicating three-dimensional heat flow vis-à-vis slow cooling responsible for liquation and segregation. In addition, the presence of AA 5083 on the other side of the weld, in the present case, retarded the cooling because of the lower thermal diffusivity of AA 5083. The liquation and segregation in thick welds may be prevented by providing external cooling to the substrate, which merits further investigation.

4. Conclusions

The present work reports an in-depth and comprehensive metallurgical characterization of electron-beam weld joint made between two popular high-thickness dissimilar Al alloys (AA 2219 and AA 5083). The following conclusions are drawn based on the results of the present study:
  • Contrary to the existing notion in the available literature that electron-beam welding offers welding of aluminum alloy of 2xxx series without Cu segregation and liquation, the phenomena are observed in thick-plate welding.
  • A defect-free weld is obtained by employing the electron-beam-welding process for the dissimilar combination of AA 2219 and AA 5083 at suitable process conditions. However, the fusion interface close to the AA 2219 alloy showed a drop in hardness that can be correlated to the presence of copper-depleted α-matrix in the partially melted zone or heat-affected zone softening, caused by dissolution of precipitates due to exposure to severe temperatures caused by welding heat input.
  • The failure location of the high-thickness dissimilar electron-beam weld is affected by the extent of liquation in the partially melted zone on the AA 2219 side of the weld joint.
  • The segregation phenomenon is thickness dependent. The plate thickness and the heat input collectively govern the relative plate thickness, which is a measure of the type of cooling. The relative thickness value of more than 0.9 leads to slower cooling, promoting Cu segregation.

Author Contributions

Conceptualization, A.S., P.M.; methodology, P.M., A.B. and A.S.; formal analysis, P.M., A.B., A.K. and A.S.; investigation, P.M.; resources, P.M., G.M.R.; writing—original draft, P.M.; writing—review and editing, A.B., A.K., G.M.R. and A.S.; visualization, P.M., A.K.; supervision, G.M.R., A.S.; project administration, A.S., G.M.R. All authors have read and agreed to the published version of the manuscript.

Funding

This research received no external funding.

Data Availability Statement

The raw/processed data required to reproduce these findings cannot be shared at this time as the data also form part of an ongoing study.

Acknowledgments

The authors are thankful to Dasharath Ram, Defence Research and Development Laboratory (DRDL), for his continued encouragement and permission to publish this work.

Conflicts of Interest

The authors declare no conflict of interest. The funders had no role in the design of the study; in the collection, analyses, or interpretation of data; in the writing of the manuscript, or in the decision to publish the results.

References

  1. Olson, D.L.; Siewert, T.A.; Liu, S.; Edwards, G.R. Welding, Brazing, and Soldering; ASM International: Almere, The Netherlands, 1993; Volume 6, ISBN 978-0-87170-382-8. [Google Scholar]
  2. Jin, Y.; Jiahao, S.; Chenkai, G.; Yixuan, Z.; Hongbing, L.; Oliveira, J.P.; Caiwang, T.; Zhishui, Y. Effect of heat input on interfacial microstructure, tensile and bending properties of dissimilar Al/steel lap joints by laser Welding-brazing. Opt. Laser Technol. 2021, 142, 107218. [Google Scholar] [CrossRef]
  3. Oladimeji, O.O.; Taban, E. Trend and innovations in laser beam welding of wrought aluminum alloys. Weld. World 2016, 60, 415–457. [Google Scholar] [CrossRef]
  4. Gou, G.; Zhang, M.; Chen, H.; Chen, J.; Li, P.; Yang, Y.P. Effect of humidity on porosity, microstructure, and fatigue strength of A7N01S-T5 aluminum alloy welded joints in high-speed trains. Mater. Des. 2015, 85, 309–317. [Google Scholar] [CrossRef]
  5. Xiao, R.; Zhang, X. Problems and issues in laser beam welding of aluminum–lithium alloys. J. Manuf. Process. 2014, 16, 166–175. [Google Scholar] [CrossRef]
  6. Cam, G.; Ventzke, V.; Dos Santos, J.F.; Kocak, M.; Jennequin, G.; Gonthier-Maurin, P.; Penasa, M.; Rivezla, C.; Boisselier, D. Characterization of laser and electron beam welded Al-alloys. Prakt. Metallogr. 2000, 37, 59–89. [Google Scholar] [CrossRef]
  7. Tan, Z.; Pang, B.; Oliveira, J.P.; Chen, L.; Bu, X.; Wang, Z.; Cong, B.; Zeng, Z. Effect of S-curve laser power for power distribution control on laser oscillating welding of 5A06 aluminum alloy. Opt. Laser Technol. 2022, 149, 107909. [Google Scholar] [CrossRef]
  8. Nair, B.S.; Phanikumar, G.; Prasad Rao, K.; Sinha, P.P. Improvement of mechanical properties of gas tungsten arc and electron beam welded AA 2219 (Al–6 wt-% Cu) alloy. Sci. Technol. Weld. Join. 2007, 12, 579–585. [Google Scholar] [CrossRef]
  9. Brungraber, R.J.; Nelson, F.G. Effect of welding variables on aluminum alloy weldments. Weld. J. 1973, 52, 97s–103s. [Google Scholar]
  10. Arunkumar, S.; Rangarajan, P.; Devakumaran, K.; Sathiya, P. Comparative study on transverse shrinkage, mechanical and metallurgical properties of AA2219 aluminium weld joints prepared by gas tungsten arc and gas metal arc welding processes. Def. Technol. 2015, 11, 262–268. [Google Scholar] [CrossRef] [Green Version]
  11. Huang, C.; Kou, S. Liquation mechanisms in multicomponent aluminum alloys during welding. Weld. J. 2002, 81, 211s–222s. [Google Scholar]
  12. Huang, C.; Kou, S. Partially melted zone in Aluminum welds-liquation mechanism and directional solidification. Weld. J. 2000, 79, 113s–120s. [Google Scholar]
  13. Huang, C.; Kou, S. Partially melted zone in aluminum welds–planar and cellular solidification. Weld. J. 2001, 80, 46–53. [Google Scholar]
  14. Huang, C.; Kou, S. Partially melted zone in aluminum welds: Solute segregation and mechanical behavior. Weld. J. 2001, 80, 9–17. [Google Scholar]
  15. Rao, K.S.; Reddy, G.M.; Rao, K.P. Studies on partially melted zone in aluminium–copper alloy welds—effect of techniques and prior thermal temper. Mater. Sci. Eng. A 2005, 403, 69–76. [Google Scholar] [CrossRef]
  16. Pakdil, M.; Cam, G.; Kocak, M.; Erim, S. Microstructural and mechanical characterization of laser beam welded AA6056 Al-alloy. Mater. Sci. Eng. A 2011, 528, 7350–7356. [Google Scholar] [CrossRef]
  17. Cam, G.; Ventzke, V.; Dos Santos, J.F.; Kocak, M.; Jennequin, G.; Gonthier-Maurin, P. Characterisation of electron beam welded aluminium alloys. Sci. Technol. Weld. Join. 1999, 4, 317–323. [Google Scholar] [CrossRef]
  18. Cam, G.; Kocak, M. Microstructural and mechanical characterization of electron beam welded Al-alloy 7020. J. Mater. Sci. 2007, 42, 7154–7161. [Google Scholar] [CrossRef]
  19. Rao, S.K.; Reddy, G.M.; Rao, K.S.; Kamaraj, M.; Rao, K.P. Reasons for superior mechanical and corrosion properties of 2219 aluminum alloy electron beam welds. Mater. Charact. 2005, 55, 345–354. [Google Scholar]
  20. Seshagiri, P.C.; Reddy, G.M.; Rao, K.S.; Raju, M.G.; Bhattacharya, S.S.; Rao, K.S. Microstructure and mechanical properties of Sc modified Al–Cu alloy (AA 2219) electron beam welds. Sci. Technol. Weld. Join. 2008, 13, 415–421. [Google Scholar] [CrossRef]
  21. Mastanaiah, P.; Sharma, A.; Reddy, G.M. Process parameters-weld bead geometry interactions and their influence on mechanical properties: A case of dissimilar aluminium alloy electron beam welds. Def. Technol. 2018, 14, 137–150. [Google Scholar] [CrossRef]
  22. Chen, Y.B.; Miao, Y.G.; Li, L.Q.; Lin, W.U. Joint performance of laser-TIG double-side welded 5A06 aluminum alloy. Trans. Nonferr. Met. Soc. 2009, 19, 26–31. [Google Scholar] [CrossRef]
  23. Oliveira, J.P.; Shen, J.; Zeng, Z.; Park, J.M.; Choi, Y.T.; Schell, N.; Maawad, E.; Zhou, N.; Kim, H.S. Dissimilar laser welding of a CoCrFeMnNi high entropy alloy to 316 stainless steel. Scr. Mater. 2022, 206, 114219. [Google Scholar] [CrossRef]
  24. Cam, G.; Ipekoglu, G. Recent developments in joining of aluminum alloys. Int. J. Adv. Manuf. Technol. 2017, 91, 1851–1866. [Google Scholar] [CrossRef]
  25. Mastanaiah, P.; Sharma, A.; Reddy, G.M. Dissimilar friction stir welds in AA 2219–AA 5083 aluminium alloys: Effect of process parameters on material inter-mixing, defect formation, and mechanical properties. Trans. Indian Inst. Met. 2016, 69, 1397–1415. [Google Scholar] [CrossRef]
  26. Jenney, C.L.; O’Brien, A. Welding Science and Technology; AWS Welding Handbook; American Welding Society: Miami, FL, USA, 2001; Volume 1. [Google Scholar]
Figure 1. (a) Schematic arrangement of weld coupon; (b) schematic of the subsize tensile specimen (All dimensions are in mm).
Metals 12 00486 g001
Figure 2. Visual appearance of dissimilar weld joint. (a) Top side; (b) X-ray radiograph.
Metals 12 00486 g002
Figure 3. Macrostructure of representative AA 2219-AA 5083 EB weld joint.
Metals 12 00486 g003
Figure 4. Typical optical micrographs of base materials. (a) AA 2219-T6; (b) AA 5083-H116.
Metals 12 00486 g004
Figure 5. Optical microstructures of AA 2219-AA 5083 EB weld joint (a) macrostructure; (b,c) FZ interface at AA 5083 side at high and low magnifications, respectively; (d,e) FZ at high and low magnifications, respectively; (f,g) FZ interface at AA 2219 side at low and high magnifications, respectively; (h,i) fusion interface of AA 2219 side and AA 5083 side, respectively, at high magnification.
Metals 12 00486 g005
Figure 6. EPMA across fusion interface towards AA 5083 side. (a) Backscattered electron image; (b) elemental distribution along path XY.
Metals 12 00486 g006
Figure 7. EPMA across fusion interface towards AA 2219 side. (a) Backscattered electron image; (b) elemental distribution along path XY.
Metals 12 00486 g007
Figure 8. Optical microstructures of (a,b) FZ near penetration at low and high magnifications respectively; (c,d) FZ near reinforcement at low and high magnifications, respectively.
Metals 12 00486 g008
Figure 9. (a) Microstructure of FZ with grain boundary selection in image analysis software; (b) % grain size distribution versus grain size number in the FZ.
Metals 12 00486 g009
Figure 10. EPMA in FZ (a) BSE microstructure; (b) elemental distribution along path X.Y.
Metals 12 00486 g010
Figure 11. (a) Backscattered electron micrograph of FZ; (b,c) backscattered electron micrographs indicating elemental mapping of Cu and Mg in FZ, respectively.
Metals 12 00486 g011
Figure 12. The low- and high-magnification microstructures of different locations of PMZ of AA 2219 side of dissimilar EB weld (a) base material of AA 2219 alloy; (b,c) fusion interface at AA 2219 alloy side of weld at two different locations; (d) liquated prior θ-particles in the location marked in (b,e) liquated GB in the location marked in (c,f) liquated prior θ-particles in the location marked in (c).
Metals 12 00486 g012
Figure 13. EPMA across PMZ towards AA 2219 Al alloy side. (a) BSE microstructure; (b) elemental distribution.
Metals 12 00486 g013
Figure 14. Variation of microhardness across the weld joint at mid-thickness.
Metals 12 00486 g014
Figure 15. Stress-strain plots of AA 2219-T6 base material, AA 5083-H116 base material, and dissimilar AA 2219-AA 5083 EB weld.
Metals 12 00486 g015
Figure 16. (a) Optical macrograph of a fractured tensile-test specimen of dissimilar EB weld; (b,c) microstructures of cracks existing near θ-particle fractured region in PMZ of AA 2219 side; (d) microstructure of crack propagated in FZ from PMZ.
Metals 12 00486 g016
Figure 17. SEM images of a fractured surface of a tensile-test specimen of EB weld. (a) A region of the fracture surface at low magnification; (bd) high-magnification fractography of zones as indicated.
Metals 12 00486 g017
Table 1. Chemical composition of base materials.
Base MaterialChemical Composition (wt.%)
CuSiMnMgVZnTiCrFeAl
AA 2219-T65.830.030.3-0.080.0540.04-0.1balance
AA 5083-H116-0.130.664.2-0.010.010.010.3balance
Table 2. Mechanical properties of base materials.
Base MaterialTensile PropertiesMicrohardness (HV)
0.2% Yield Strength (MPa)Ultimate Tensile Strength (MPa)Elongation (%)
AA 2219-T6337 ± 10443 ± 710 ± 0.3139
AA 5083-H116146 ± 2306 ± 520 ± 0.480
Table 3. Electron-beam welding process parameters.
ParametersValue
Gun-to-work distance (mm)280
Gun vacuum (mbar)1 × 10⁻⁵
Chamber vacuum (mbar)1 × 10⁻⁴
Focus1 mm above surface
Accelerating gun voltage (kV)55
Beam current (mA)88
Travel speed (mm/min)1000
Table 4. Comparison of heat flow in thin and thick welds.
Parameters and PropertiesThin Weld [20]Thick Weld (Present Work)
Plate thickness (mm)513
Accelerating gun voltage (kV)5055
Beam current (mA)5188
Travel speed (mm/min)10001000
Density (g/cc)2.842.84
Specific heat (J/g-°C)0.8640.864
Heat source efficiency0.70.7
Reference temperature (°C)548548
Relative plate thickness0.521.03
Publisher’s Note: MDPI stays neutral with regard to jurisdictional claims in published maps and institutional affiliations.

