Article

Study on the Grinding Kinetics and Magnetic Separation of Low-Grade Vanadiferous Titanomagnetite Concentrate

1
Department of Resource and Environment, School of Metallurgy, Northeastern University, Shenyang 110819, China
2
Liaoning Key Laboratory of Recycling Science for Metallurgical Resources, Shenyang 110819, China
*
Authors to whom correspondence should be addressed.
Metals 2022, 12(4), 575; https://doi.org/10.3390/met12040575
Submission received: 1 March 2022 / Revised: 23 March 2022 / Accepted: 27 March 2022 / Published: 28 March 2022

Abstract

:
In recent years, a low-grade vanadiferous titanomagnetite concentrate (LVTC) produced in the northwest area of Liaoning has attracted more and more attention. However, it is difficult to recover and utilize valuable minerals such as iron, titanium, and vanadium, due to their special physical and chemical properties and complex mineral composition. Grinding and magnetic separation are two important operational units for recovering valuable metal components from vanadiferous titanomagnetite. Therefore, the grinding kinetics of the LVTC in northwestern Liaoning were first studied by means of grinding kinetics equations in this paper. The results show that the grinding process of LVTC is consistent with the grinding kinetics equation, and the sieve residues of particles approached a constant value after grinding for 30 min, resulting from equilibrium between the fragmentation and agglomeration processes. In addition, equivalent particle size (EPS) and specific surface area (SSA) were linearly proportional to the double logarithm of grinding time, and the correlation coefficients for fitted data by the Rosin–Rammler–Bennet (RRB) model were slightly higher than those by the Swebrec model, and could reflect the dispersibility and uniformity of particle size distribution (PSD) quantitatively. Then, the grinding products were separated by magnetic separation, and the influence of grinding conditions on the grade and recovery ratio of Fe and TiO2 in the LVTC was analyzed. As a result, grinding time has a significant impact on the recovery ratio and grade of Fe and TiO2 during the magnetic separation process, and the LVTC grinding duration is not as prolonged as it might be, as the optimal grinding time is 20 min. Titanomagnetite, ilmenite, and titanite are still the predominant phases in all magnetic separation products at optimal grinding time, but the intensity or content of these three minerals varies between magnetic separation products, and 232 kA/m magnetic field intensity has a higher separation efficiency than 134 kA/m magnetic field intensity.

1. Introduction

Vanadiferous titanomagnetite (VTM) ore is a typical polymetallic paragenic mineral, which is composed of a mixture of several of a variety of valuable metal elements—such as iron, titanium, vanadium, calcium, aluminum, etc. [1,2]—and has extremely high strategic and comprehensive utilization value [3,4]. In China, VTM ore is mainly distributed in the Panxi, Chengde, and Chaoyang areas [5]—especially in the northwest region of Liaoning, where the VTM ore reserves are 20 billion tons. The Fe content of the ore is lower than in other regions, and the titanium content (16–20%) is the highest [6,7]. Today, a lot of technological process have been developed for the comprehensive utilization of VTM ore, such as the blast furnace process (BF process) [8,9], direct reduction and smelting separation [10], gas-based and fluidized bed reduction [6,11], and reduction roasting–magnetic separation processes [12,13]. However, due to the interlaced influence of valuable elements—especially iron and titanium—the utilization of low-grade VTM ore is limited, resulting in a waste of resources. Therefore, it is urgent to develop an efficient and eco-friendly process that can simultaneously enrich and recover valuable metals such as iron and titanium from low-grade VTM ores.
In low-grade VTM, valuable metal elements such as iron, vanadium, and titanium are mainly distributed in magnetite, with strong magnetic properties. Thus, magnetic separation is recognized as the most reasonable mineral processing technology for low-grade VTM ore, because of its high efficiency and lack of pollution [14,15]. In addition, the grinding process is an important operating unit for improving the efficiency of magnetic separation—especially in the magnetic separation processing of complex polymetallic co-associated ores such as low-grade VTM [16,17,18,19]. However, grinding is an extremely energy-consuming operation, and is a dangerous process in the case of very fine powders, because of the flammability of the product. Therefore, it is of great significance to study the grinding kinetics of low-grade VTM, and to determine a suitable grinding operation regime to improve magnetic separation recovery efficiency and reduce energy consumption and flammability [20,21]. Thus far, numerous mathematical models—ranging from the normal and log-normal distributions to three- and four-parameter models—have been proposed and widely used to analyze grinding dynamics characteristics [22,23]. Reid et al. proposed a practical approximation to the fundamental integro-differential equation for batch grinding, and obtained the solution to describe continuous grinding systems by the suitable extension of the two basic parameters obtained from the experiment [24]. Ozao et al. reported that thermal analysis can be used to describe the PSD of the mechanically ground powder sample based on the self-similarity law or the fractal nature in the PSD of powder samples, and a fractal specific surface area S V was defined by a power law S V x D 3 , where x is the fractal particle size and D is a fractal dimension with 2 < D < 3 [25]. The Rosin–Rammler and Swebrec function models were proposed and applied because of their concise expression and wider application fields [26,27,28,29]. Furthermore, various related reports tend to explain the parameter setting of grinding kinetics for a particular material and improve the expression [30,31,32,33,34,35,36,37,38]. However, studies on the grinding kinetics of VTM ores with complex mineral phases—such as those in the northwestern area of Liaoning—have been almost non-existent so far.
In this paper, the main research object is LVTC, which is a coarse magnetic separation concentrate of low-grade VTM in the northwest area of Liaoning. The purpose of this paper was to obtain a better knowledge of the mineral phase composition and grinding characteristics of LVTC, to provide a reference for its large-scale grinding, and to improve the recovery and utilization of valuable metals such as Fe and Ti. Therefore, based on the elemental and mineral phase composition analysis, the PSD characteristics of LVTC during fine grinding were investigated. Then, the most suitable grinding kinetics model, the relevant parameters, and the optimal grinding process conditions were determined by fitting and verifying. Finally, the magnetic separation efficiency of LVTC after fine grinding was studied, which highlighted a new direction for the comprehensive utilization of LVTC in the northwest area of Liaoning.

2. Experimental

2.1. Material

The raw materials of LVTC were supplied by a mineral processing plant in Chaoyang, Liaoning Province, China. The chemical compositions of LVTC were determined by X-ray fluorescence (XRF)(XRF-1800, Shimadzu Corporation, Kyoto, Japan) and chemical methods; the grain size of this analyzed powder was less than 200 mesh, and the results are presented in Table 1. The LVTC contained not only a great deal of Fe, Ti, Si, and Ca, but also a lot of Al, V, and Mg, as well as other valuable elements. The total content of Fe was 43.75%—far lower than 57%, which is the accepted minimum feed Fe grade for blast furnace ironmaking. Moreover, the content of TiO2 was as high as 17.33%, which increased the viscosity of molten iron and hindered the smooth running of blast furnace. The XRD patterns of the LVTC are displayed in Figure 1, indicating that the LVTC is mainly composed of titanomagnetite, ilmenite, and titanite, and the peak shapes of these three minerals show a dramatic correlation. As shown in the results of chemical phase analysis of Fe and Ti in Table 2, Fe was mainly distributed in titanomagnetite, reaching 83.09%, while titanium was mainly distributed in titanomagnetite and ilmenite, at 50.79% and 37.68%, respectively. Therefore, it is also clear that efficient recovery of Fe and Ti is overwhelmingly achieved by the separation of titanomagnetite and ilmenite, and that grinding and magnetic separation are indispensable operational units.

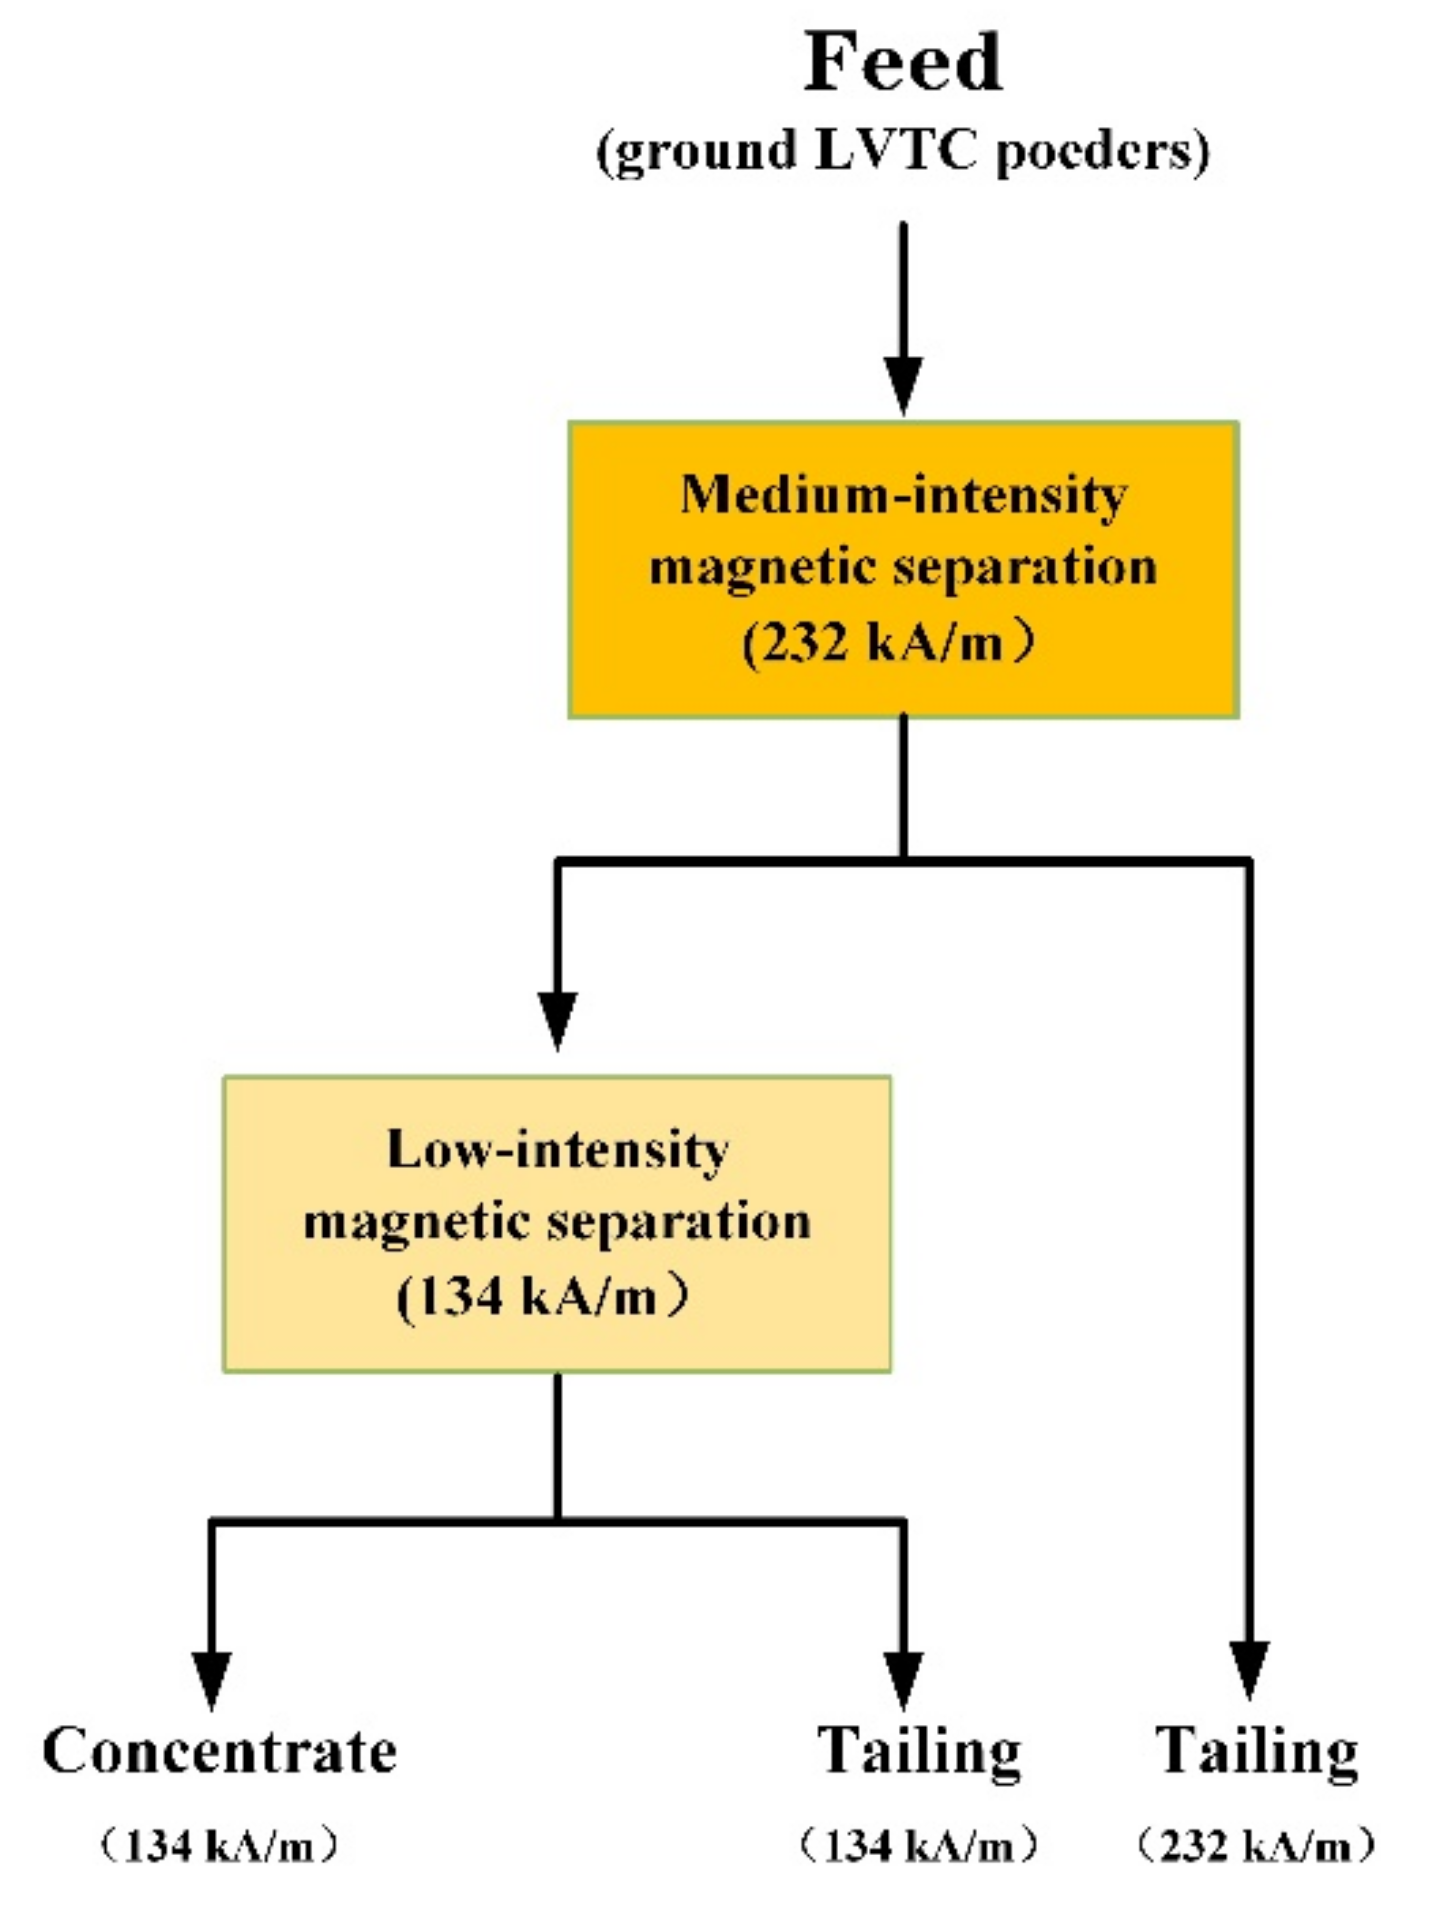
2.2. Experimental Methods

Grinding and magnetic separation processes are shown in Figure 2; the raw material was ground for different times, i.e., 10 (A), 20 (B), 30 (C), 40 (D) and 50 (E) min. The grinding operation was carried out in a laboratory-scale damp mill (XMQ150/50, Zhengchang Mineral Processing Equipment Co., Ganzhou, China) with an internal diameter and an internal volume of 0.5 m and 0.1 m3, respectively, in the grinding chamber, while the numbers of steel balls with diameters of 3.5, 3, 2.5, and 2 cm were 9, 24, 34, and 42, respectively. In all cases, the grinding speed was 48 r/min, the feed mass was 300 g, and 128.5 ml of water was added as a grinding aid at a solid–liquid ratio of 7/3. Then, the ground product was immediately dried at 393 K (120 °C) for 2 h to ensure that it was completely dry, and the PSD was measured by a laser particle size analyzer (Mastersizer 3000, Malvern Panalytical Ltd., Malvern, UK) with an effective measurement range of 0.01 to 3500 µm; the particle size analyzer was calibrated with monodispersed particle size standards, and all PSD data were calibrated with the obtained calibration curves. The EPS and SSA of ground and raw LVTC powder were also calculated using software included with the laser particle size analyzer. A scanning electron microscope (ULTRA PLUS, German Zeiss Microscope Ltd., Oberkochen, Germany) was used to investigate the morphology of the raw and ground LVTC powder.
Then, to obtain a reasonable and representative sample, the ground product was divided into multiple aliquots using the dichotomy method. A dichotomizer (5E-TR 9 × 32, Minsheng Development of Science and Technology Co., Changsha, China) was used to dichotomize the ground product several times to obtain homogeneous magnetic separation feed samples. Subsequently, each time, about 20 g of homogeneous magnetic separation feed sample was separated by magnetic separation in a laboratory-scale magnetic separation tube (XCGQ(S)-50, Zhengchang Mineral Processing Equipment Co., Ganzhou, China) with a diameter of 50 mm and equipped with an excitation power supply that provides a magnetic field intensity from 0 to 240 KA/m. In this study, in order to achieve the effective separation of Fe-containing minerals and Ti-containing minerals, the magnetic separation process was divided into two stages, and the magnetic field intensity of the two sections of magnetic separation was set to 232 kA/m and 134 kA/m, respectively. That is, the ground sample was first separated into one-stage magnetic separation concentrate and tailings at a magnetic field intensity of 232 kA/m, and the one-stage magnetic separation concentrate was then separated into two-stage magnetic separation concentrate and tailings by a magnetic field intensity of 134 kA/m; finally, three magnetic separation products were obtained. The degradation of TFe and Ti in all materials was determined with reference to the Chinese standards GB/T 6730.73-2016 and GB/T 14949.5-1994, respectively. The phase constitution of magnetic separation products was studied using a polycrystalline powder X-ray diffraction analyzer (X’Pert Pro, PANalytical B.V., Almelo, Netherlands) with Cu Kα radiation (wavelength = 1.5406 Å).

3. Results and Discussion

3.1. Grinding Process and Grinding Kinetics

The PSD of raw LVTC and products obtained from various grinding times, as determined by laser particle size analyzer, is shown in Figure 3, which shows that the particle size of LVTC powder decreases and the particle distribution becomes narrower as the grinding time increases. The maximum particle size of all ground products was 163 μm, and the particle size of ground LVTC was less than 86.4 μm after grinding for more than 20 min. In addition, the PSD curve shifted to the left as the grinding time increased, and subpopulations appeared when the grinding time reached 40 min. The subpopulations of material grinding for 40 and 50 min occurred from 86.4 to 144 µm and 310 to 666 µm, respectively. These subpopulations are believed to be caused by particle agglomeration.
In general, the reduction rate of sieve residue (dR/dt) is the main form describing the change in PSD during the grinding process, and the relationship between (dR/dt) and the value of the sieve residue (R) satisfies the first-order equation, as follows [39]:
d R d t = K t R
where K t is the grinding rate constant. In order to describe the entire grinding process of the material more intuitively, Equation (1) can be amended to Equation (2), as follows:
R = R 0 e K t t M
where R 0 is the initial sieve residue of ground particles with a certain particle size, while M is the time index, and is determined by the properties of the ground material and its grinding conditions. It can be seen from Equation (2) that the kinetic equation can be established once K t and M are determined.
According to the specific grinding experiment data in Figure 3, and to verify the reasonableness of the above equation in describing the grinding process of the LVTC, six representative sieve sizes (0.99, 1.88, 5.92, 9.86, 18.7, and 45.6 μm) were selected, and the sieve residues (by mass) of particles with the six representative sieve sizes were calculated, and are listed in Table 3. Furthermore, the sieve residues of particles with the six representative sieve sizes are shown in Figure 4 and fitted as a function of grinding time according to Equation (2). The fitting curves and the parameters are presented in Figure 4 and Table 4, respectively.
As shown in Figure 4, the variation trend of the experimental data is very consistent with that described by Equation (2), which also can be verified by the high R2 values in Table 4. Specifically, the grinding kinetic equation (Equation (2)) can describe the grinding process of the LVTC very well. In addition, a rapid decrease in particle size was observed during the first 10 min of grinding, followed by a slowdown, indicating that the coarse particles were ground more efficiently than the fine particles during the grinding process. After 30 min, the sieve residue of the particles approached a constant value, which may be the result of an equilibrium between the fragmentation and agglomeration processes.

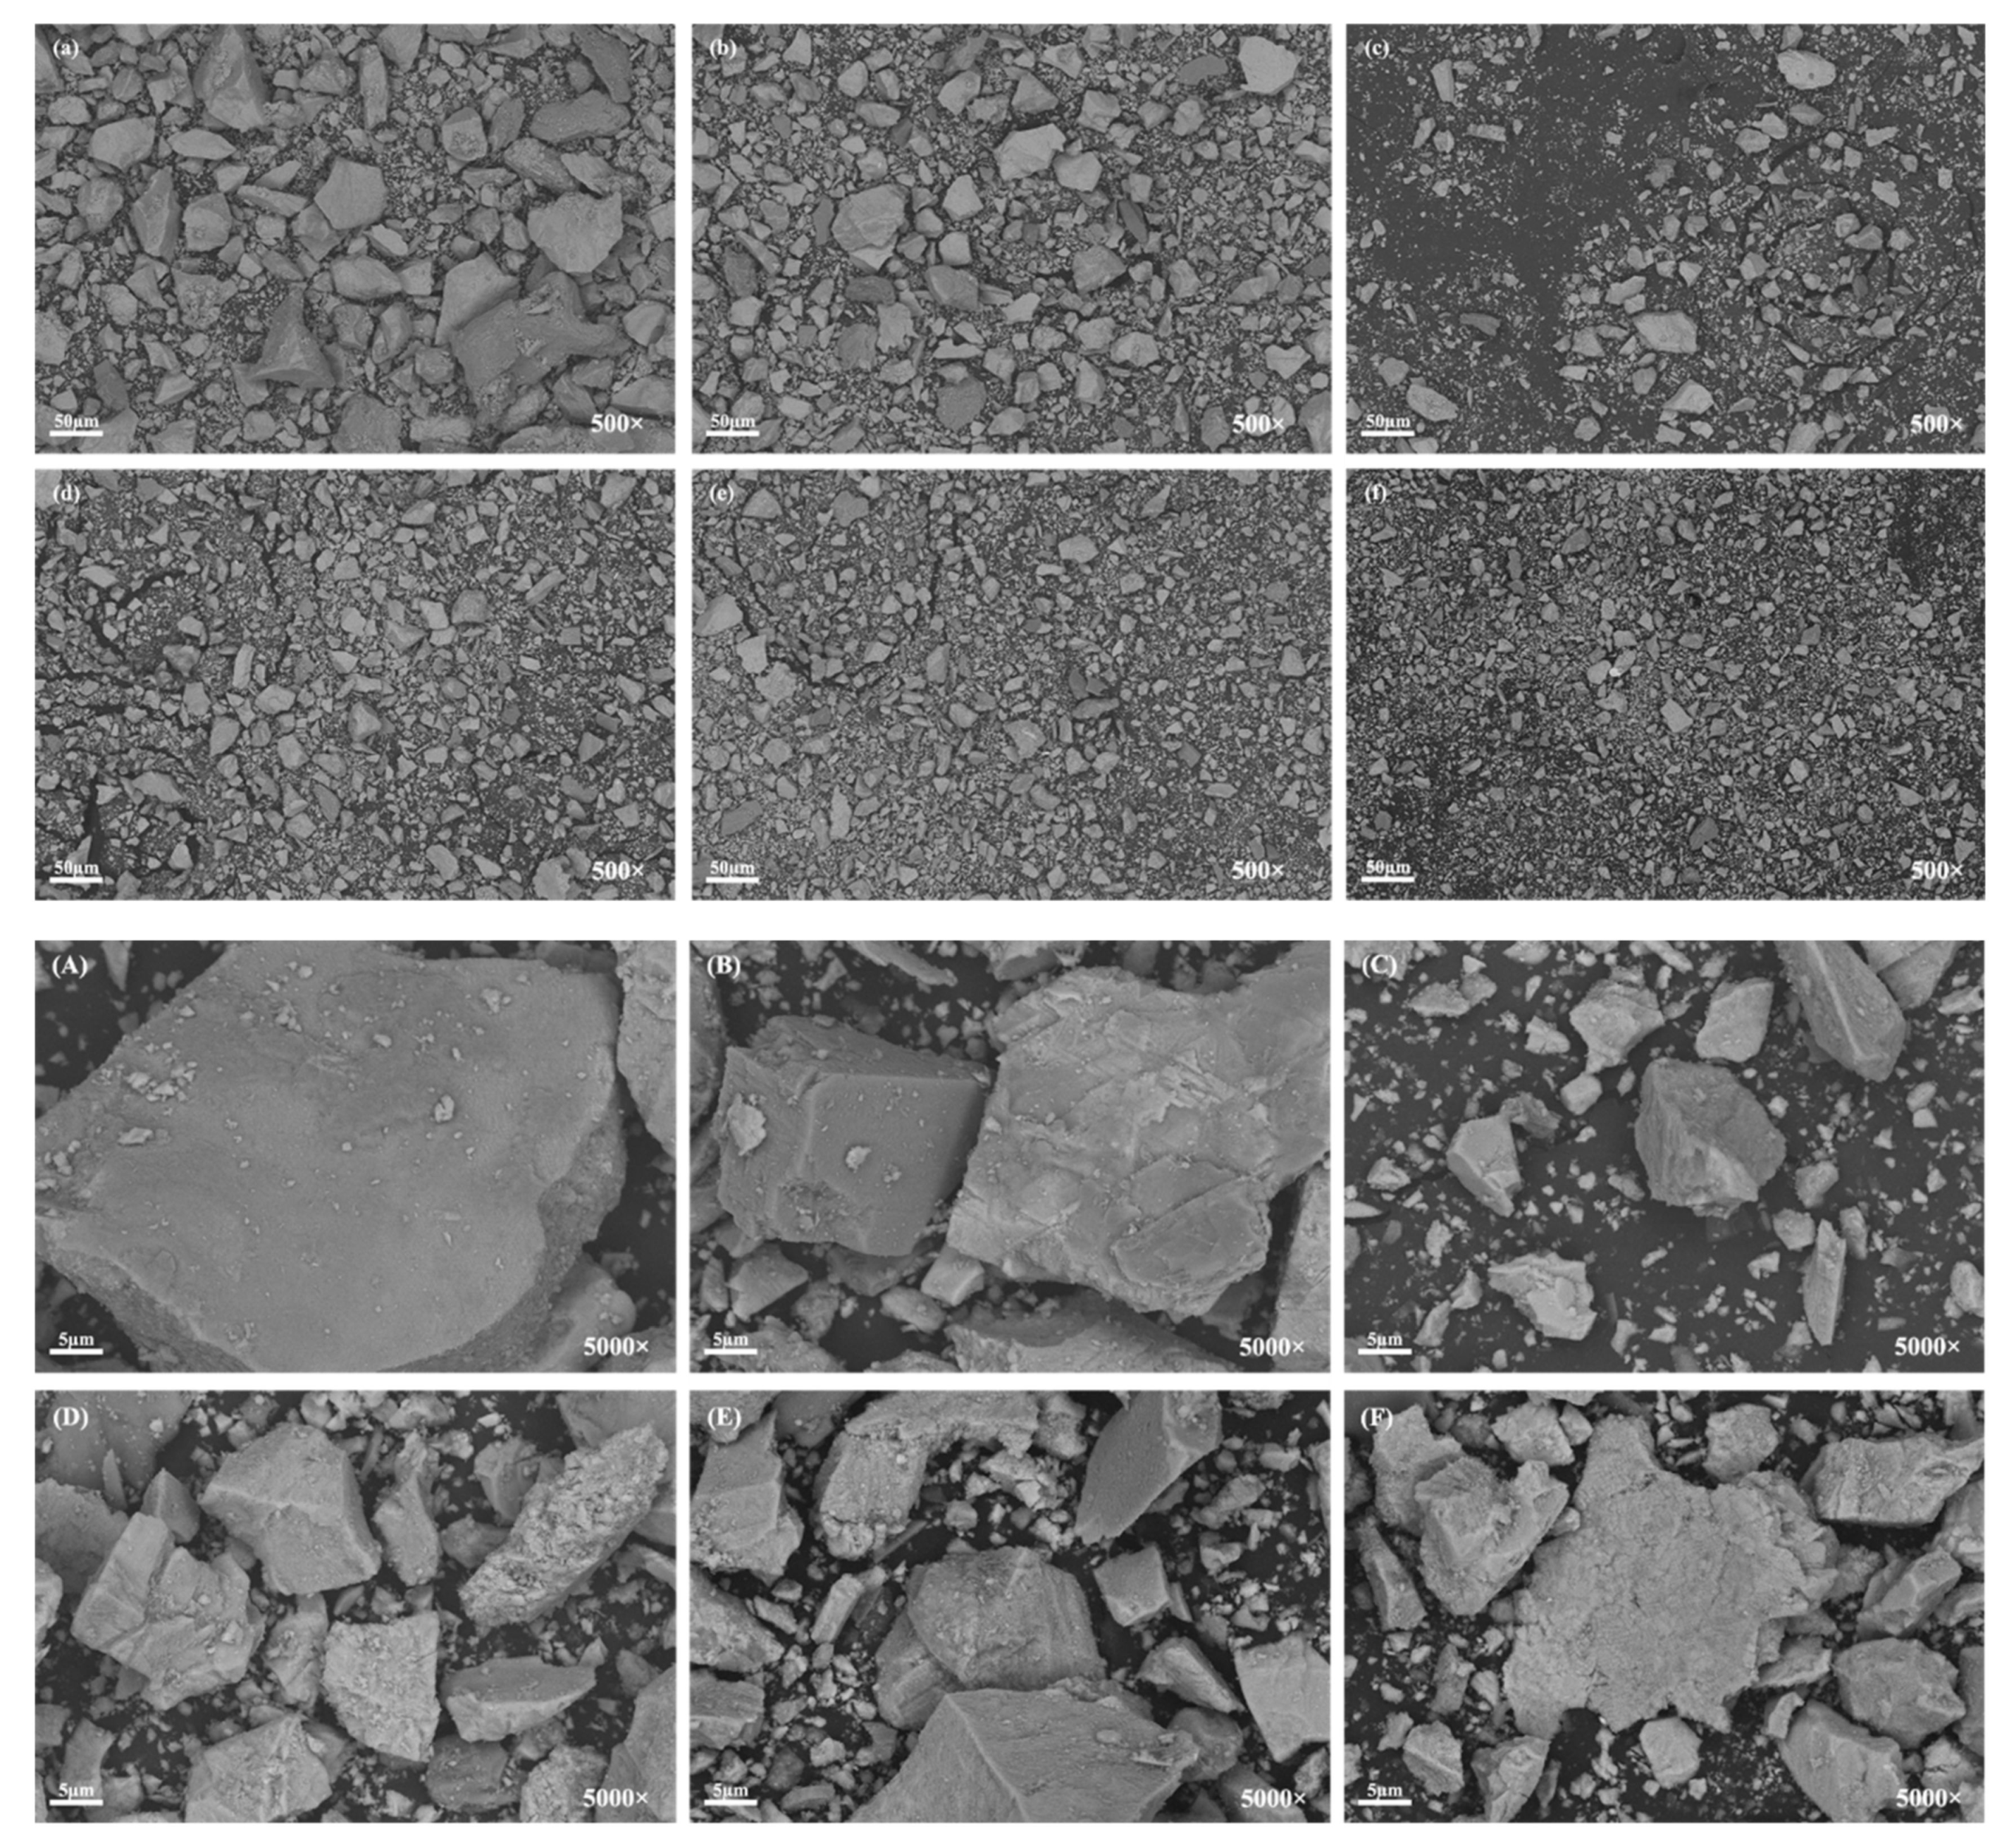
3.2. Particle Morphology

The morphological variation of raw LVTC and ground particles with increasing grinding time is depicted in Figure 5. The particle morphology of the raw LVTC and ground products is shown in the top portions (a–f) and lower portions (A–F) of Figure 5 at 500× and 5000× magnification, respectively. The particle morphology of raw LVTC is mostly irregular block-, clastic-, angular-, and granular-like shapes, and tiny particles with a clastic-like shape are absorbed on the surface of coarse particles with block or angular morphology due to electrostatic interaction (Figure 5a). As the grinding period approaches 10 min, the surface morphology of the particles becomes slightly coarser, and as the grinding time increases, the surface morphology becomes rougher. Furthermore, when the grinding time rises from 0 min to 20 min, the particle size reduces dramatically, while the SSA increases sharply. All of these phenomena mentioned above increase the likelihood of tiny particles coming into contact with one another, promoting aggregation. According to Figure 5c–f, as the grinding time increases, the number of fine particles decreases, then slightly increases, indicating that increasing the grinding time cannot reduce the particle size indefinitely, which could also explain why subpopulations appear in the PSD curve (Figure 3) when the grinding time exceeds 30 min. Furthermore, for the sample ground for 50 min, it is difficult to find particles larger than 100 µm, corroborating the PSD results.

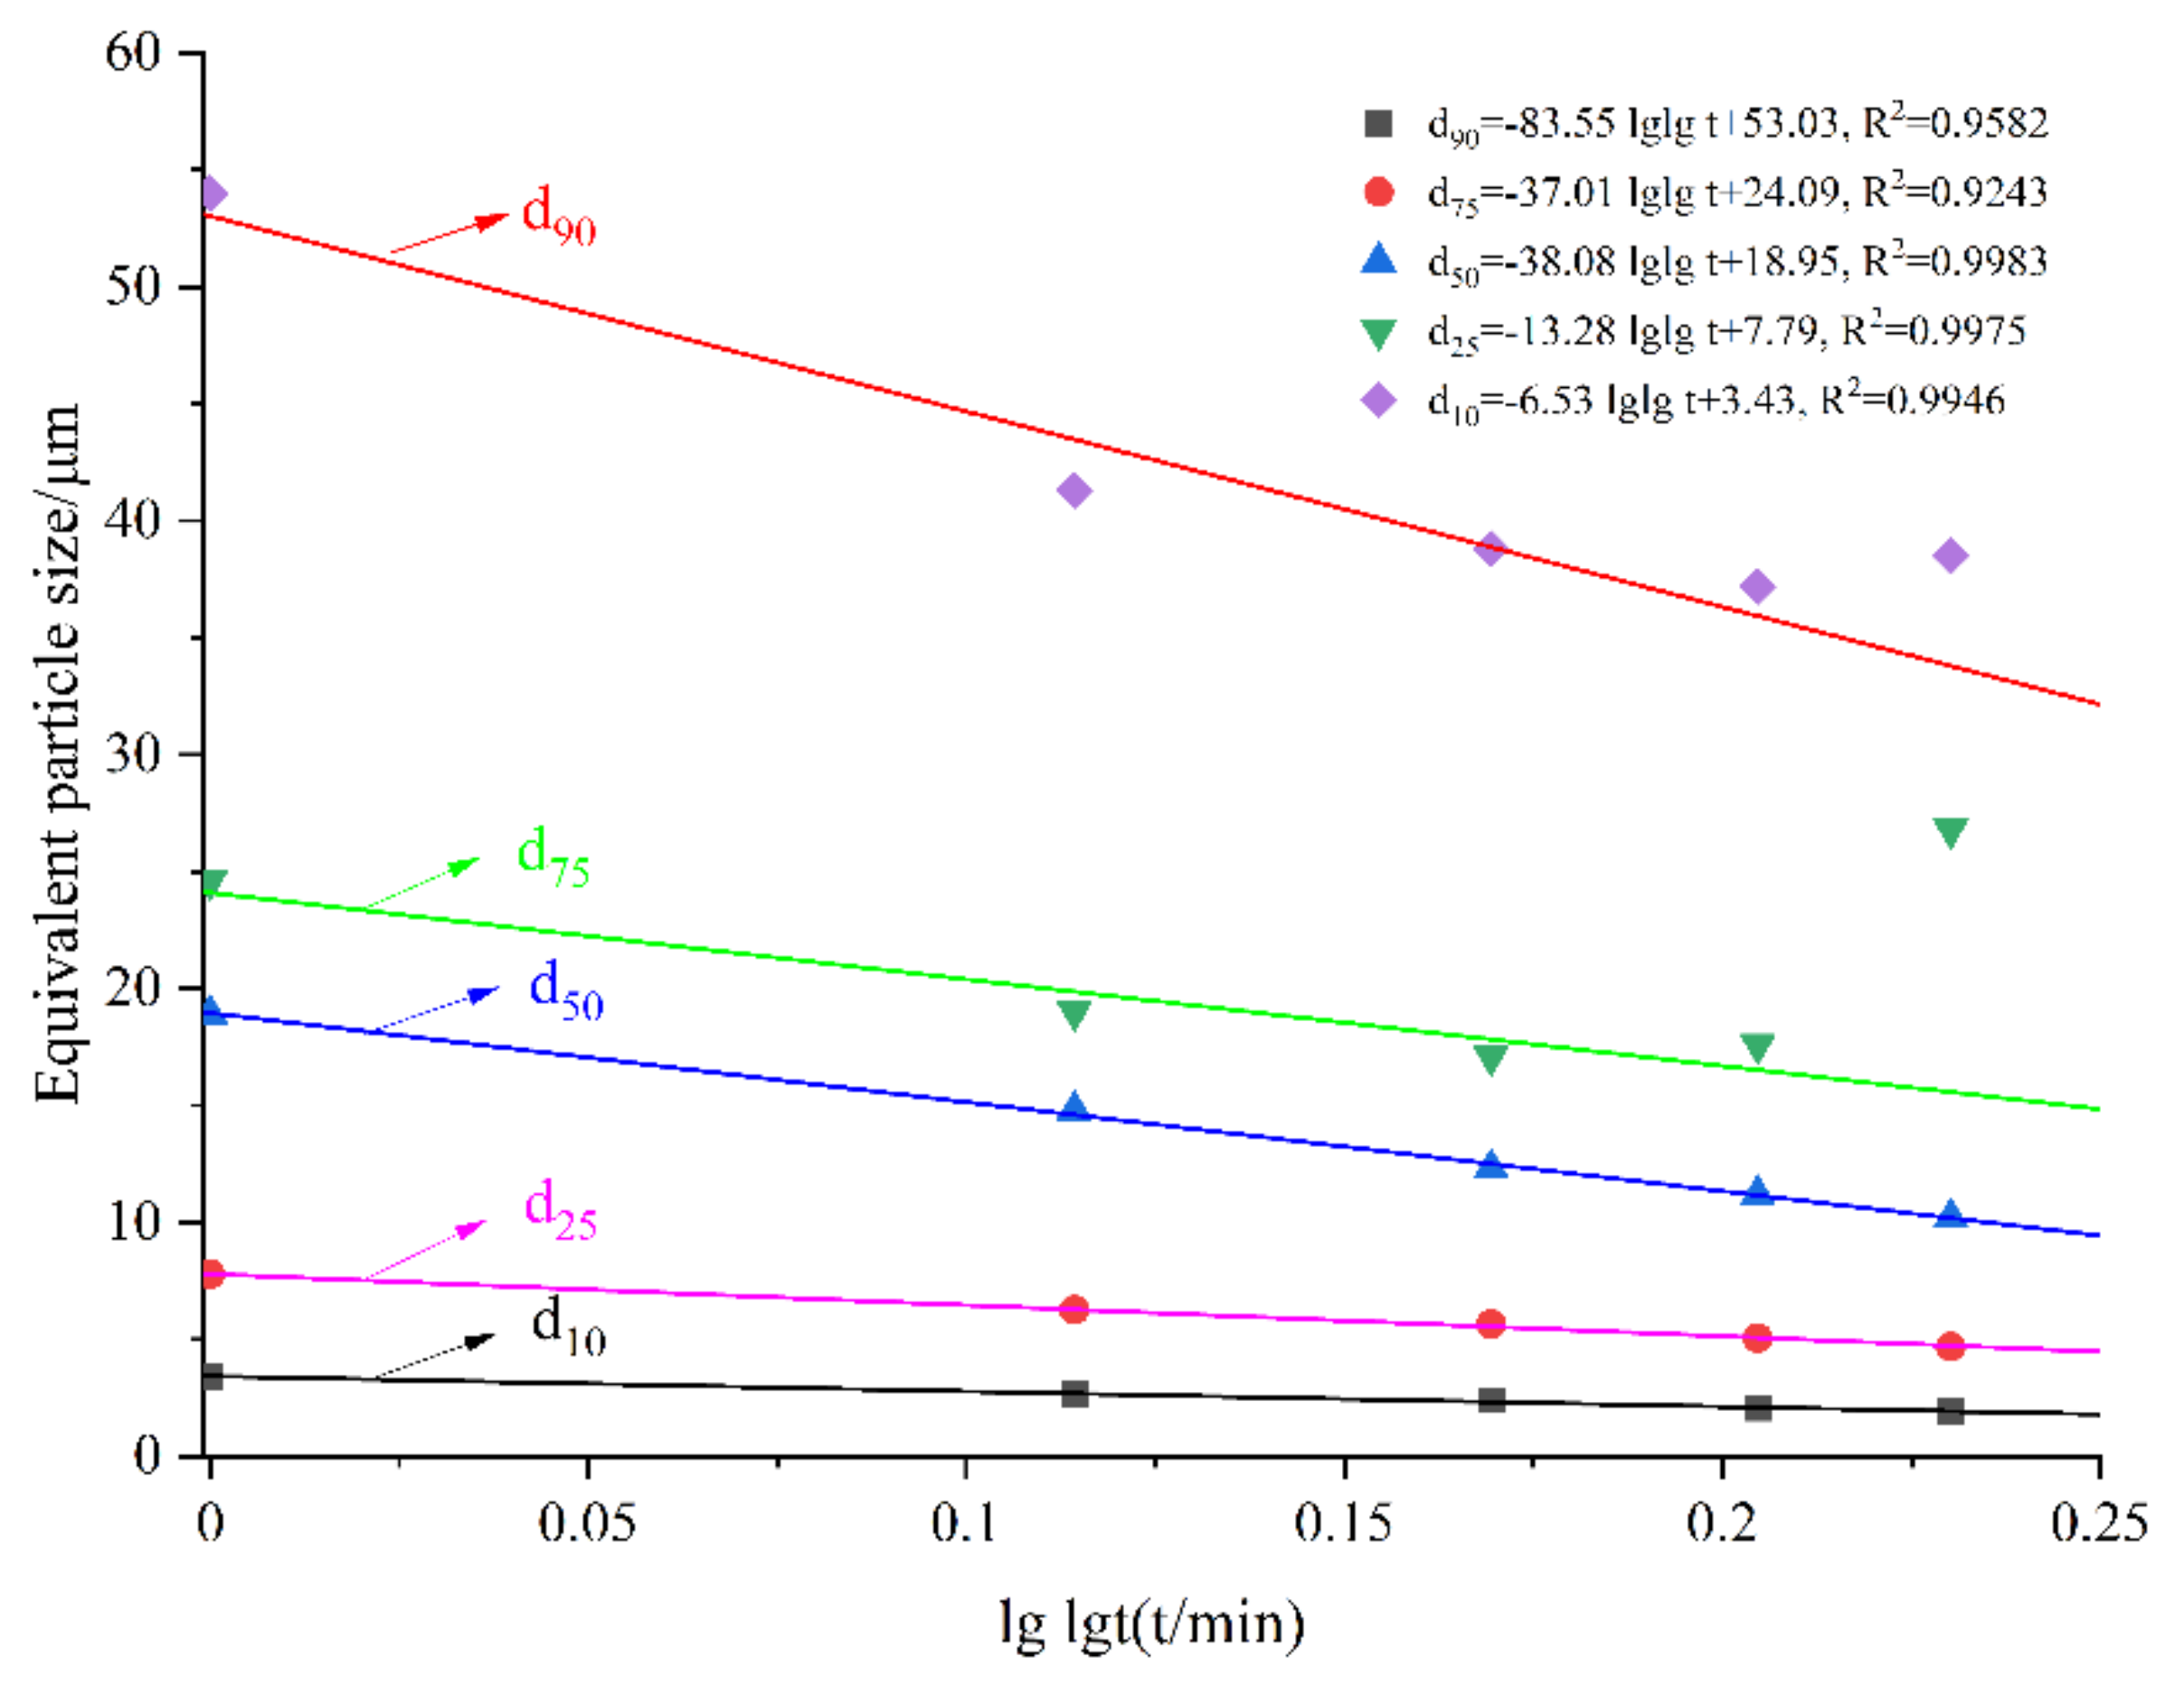
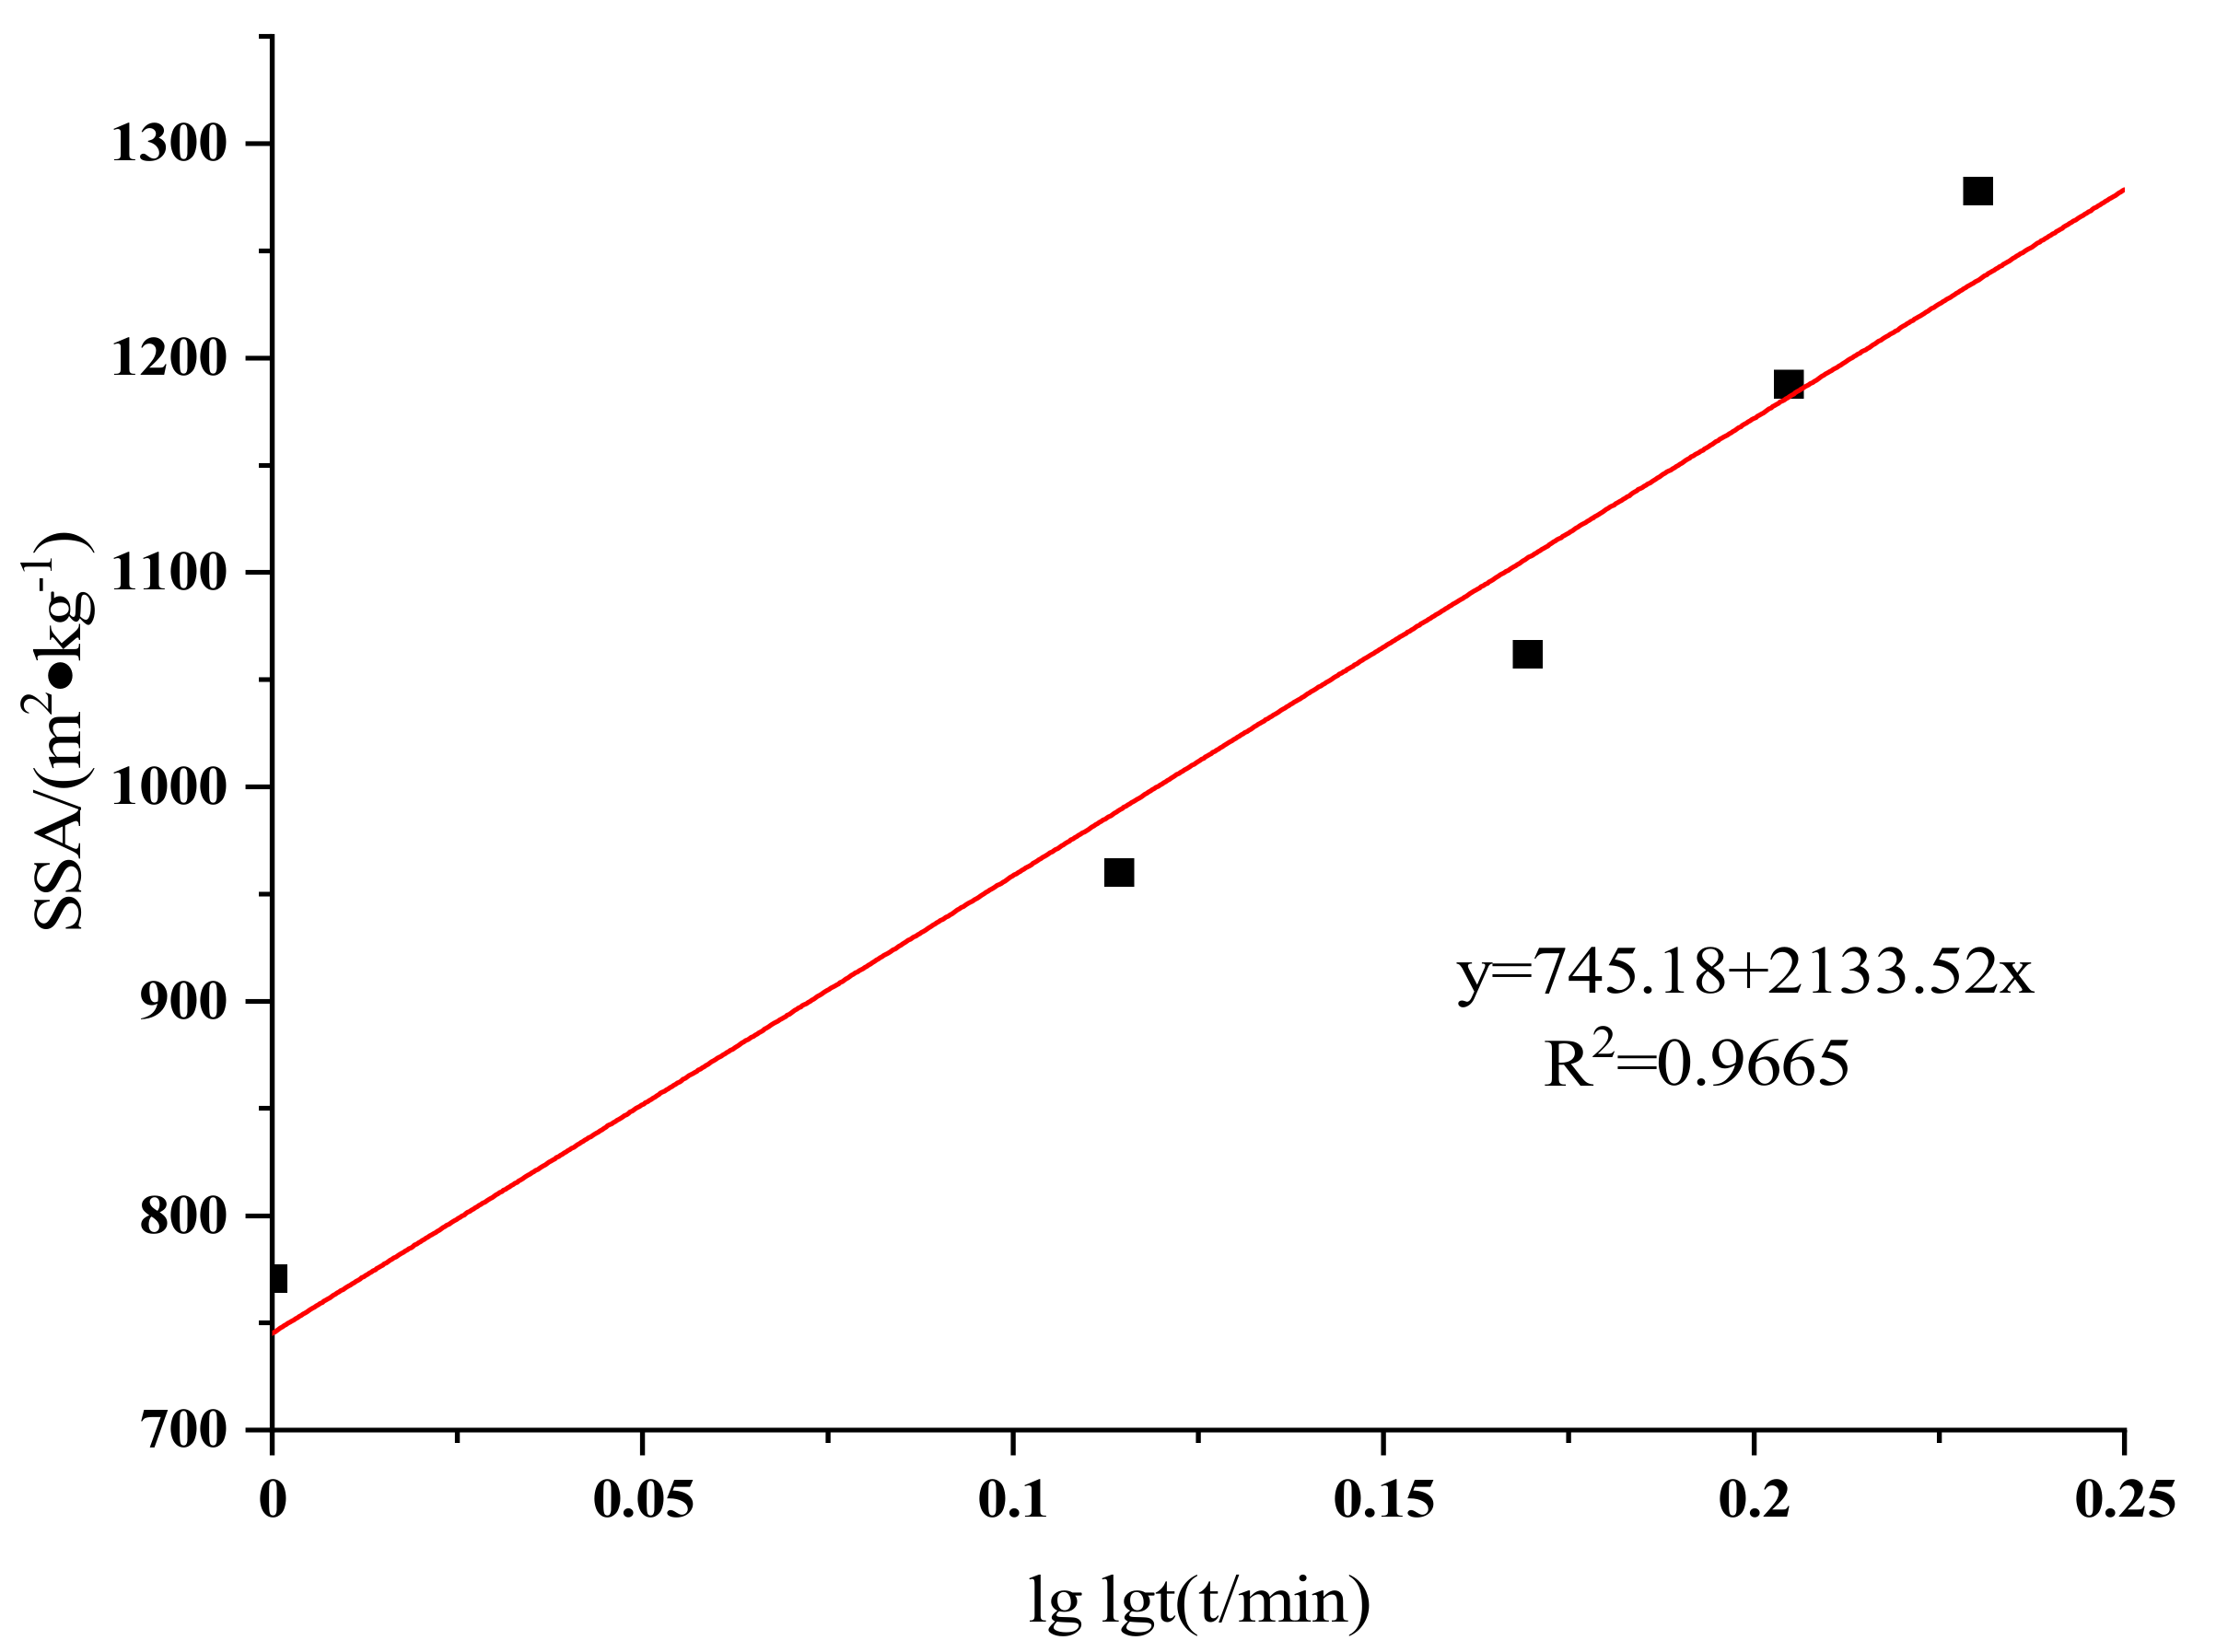
3.3. Equivalent Particle Size and Specific Surface Area

In most cases, EPS is used to evaluate the PSD of samples, as testing all samples with a laser particle size meter during grinding and magnetic separation procedures would be a tremendous waste of time and money. In this study, the EPS is defined as the particle size when the particles’ cumulative passage reaches a particular value. The particle size value D50, for example, refers to the particle size value when the cumulative passing reaches 50% or, rather, it indicates that the amount of particles (by mass) with a size less than D50 accounts for 50%.
The EPS and SSA of LVTC after various grinding times are shown in Table 5, with EPS represented by D10, D25, D50, D75, and D90. The SSA rises with grinding time; after 50 min of grinding, the SSA of the LVTC powder has increased by more than three times. The SSA dropped sharply in the first 20 min, indicating that the LVTC has the best grinding efficiency in the first 20 min. In addition, except for D75 and D90 of the sample ground 40 min and 50 min, EPS gradually decreases with the increase in grinding time, indicating that the particle size of LVTC decreased significantly after continuous grinding, but the agglomeration of fine particles increased when the grinding time exceeded 40 min, correlating with the PSD results (Figure 3a).
In order to vividly describe the grinding kinetic behavior of LVTC powder, the relationship between the double logarithm of grinding time and the EPS and SSA of LVTC powder was investigated by linear regression analysis, from which the fitted curves ware obtained, and the fitted equations and correlation coefficients are shown in Figure 6 and Figure 7, respectively. Both EPS and SSA are linearly correlated with the double logarithm of grinding time, as can be observed. Simultaneously, EPS has a negative connection with the double logarithm of grinding time, whereas SSA is positive. Moreover, except for D75 and D90 of the LVTC for grinding of 50 min (due to particle agglomeration), the smaller the slope of the relationship curve between the large EPS and the double logarithm of the grinding time, the easier the coarse particles are to grind than fine particles, and this is consistent with the result of the grinding kinetics equation (Equation (2)). In addition, within 50 min of grinding, the EPS and double logarithm of grinding time curves in Figure 6 did not intersect near EPS = 0, which could indicate that the LVTC powder grinding for 50 min did not reach the theoretical minimum particle size, or that it is difficult to achieve the ideal grinding fineness because the LVTC’s special surface mineralogical properties aggravate the agglomeration of fine particles. This will need to be confirmed in the lab and further debated.

3.4. Particle Size Distribution Features

Apart from fineness and shape, the PSD characteristics of LVTC influence magnetic separation efficiency, along with the grade and recovery ratio of Fe and TiO2. In general, a mathematical model such as the Gates–Gaudin–Schumann (GGS) distribution model [26], RRB (Rosin–Rammler–Bennet) distribution model [28], or the Swebrec function model can be used to characterize the PSD characteristics of a ground product [29]. The application of various mathematical models varies depending on the grinding and beneficiation processes of different mineral materials. Because it is preferable to other methods in the mineral processing process of coal, the GGS plot is commonly used to depict the features of the PSD of coal. During the grinding, milling, and crushing operations, RRB is still the mathematical model with the longest usage duration and the broadest application range. Furthermore, in recent years, the Swebrec model has been presented as an alternative to the RRB model for fitting the PSD of ground fine particles. Because the Swebrec model avoids the flaw that the RRB model is overly reliant on the examined dataset, it provides superior fitting results over the whole size range. The parameters of the Swebrec function model, on the other hand, are unable to specify the dispersion of particle sizes. As a result, the RRB and Swebrec models were used in this study and compared.
The governing equation for the RRB function is expressed as follows [28]:
R = 100 exp d d * n
where R/% is the cumulative sieve residue of particles, d is the particle size, d represents the particle size in correspondence to 36.78% retained weight—reflecting the particle size of most particles—and n is the distribution index, with a small n value indicating poor uniformity and a wide PSD.
The Swebrec distribution function is as follows [40]:
F x = 1 1 + ln x m a x x ln x m a x x 50 b × 100
where F(x) is the cumulative passing at x size, x m a x is the maximal particle size, x 50 is the size at 50% passing weight, and b is the curve undulation parameter.
The RRB and Swebrec functions were used to fit the PSD data in Figure 8 and Figure 9, respectively. Table 6 shows the derived parameters as well as the R2 correlation coefficients for both functions.
As shown in Figure 8 and Figure 9, it is obvious that both models produced quite acceptable fitting curves as well as high R2-Adj values for the fitted data. As a result, both the RRB and Swebrec functions can accurately represent the PSD of LVTC powder in the full range of particle size. However, except for the sample ground for 30 min, the RRB model’s correlation coefficients for fitted data were slightly higher than those of the Swebrec model. In addition, Table 6 shows that when the grinding time increases, the typical particle size decreases by roughly 10 µm. On the other hand, when the grinding time increases, the distribution index (n) rises, then falls slightly when the duration extends beyond 30 min. Additionally, not only can the grinding process narrow down and homogenize the PSD, it can also levigate LVTC powder, which may not be perfect for the following magnetic separation. All of the above shows that the RRB model is still superior to the Swebrec model for describing the PSD of powder materials generated by ball-mill grinding over the entire particle size range. The RRB model not only has a higher goodness-of-fit than the Swebrec model, but can also quantitatively express PSD dispersibility and homogeneity.

3.5. Magnetic Separation

3.5.1. Effect of Grinding Time on the Grade of Magnetic Separation

Magnetic separation is considered to be the most reasonable technology for the recovery and processing of vanadiferous titanomagnetite [41,42]. In this study, about 21.19% of the gangue minerals in LVTC were single-gangue minerals with large particle sizes, such as quartz, tremolite, and feldspar, as well as fine-grained gangues linked with titanomagnetite, and veinlets and checkerboard ilmenite in titanomagnetite that produce a solid solution [43,44]. Magnetic separation was used in this work to separate titanomagnetite, ilmenite, and other gangue minerals from LVTC in order to isolate Fe and Ti. The flowchart of the magnetic separation process of ground LVTC powder is shown in Figure 10, with magnetic field intensities of 232 kA/m and 134 kA/m for the two-stage magnetic separation.
Figure 11 illustrates the variation of TFe (a) and TiO2 (b) contents in magnetic separation products with different grinding times. As shown in Figure 11a, the grade of TFe in 232 kA/m tailing increases with grinding time, with the steepest rise happening in the first 30 min and then slowly increasing; the grade of TFe in 134 kA/m concentrate and tailing reaches a plateau with increasing grinding time, then swings and falls, with the volatility of the 134 kA/m tailings being more significant than that of the concentrates. The amount of TiO2 (Figure 11b) decreases as the grinding time increases, but in the 232 kA/m tailings the content of TiO2 drops sharply in the first 20 min, then rises, and finally decreases with increasing grinding time. The above results indicate that an appropriate prolongation of the grinding time is beneficial to increasing the grade of TFe in the concentrate, because grinding promotes the dissociation of ferromagnetic minerals and gangue in LVTC; fully liberated and high-grade ferromagnetic mineral particles are first captured by the magnetic force, while non-magnetic minerals such as gangues cannot be captured, and flow into the tailings as a result of the drag force. Minerals in LVTC, on the other hand, were overly dissociated after grinding for more than 30 min, with most particles less than 40 µm in diameter, and because the magnetic force in Equation (5) [45] is proportional to the third power of particle diameter, the magnetic force dropped dramatically as the particle diameter decreased. Few ultrafine particles can be captured in the attraction zone when the magnetic force is inadequate to drive fine particles, whereas the majority of ultrafine particles flow into the tailings due to drag and gravity forces. As a result, at grinding times beyond 30 min, the grade of TFe and TiO2 in the concentrate drops, while that in the tailings rises.
F m = 1 6 π d 3 k μ 0 H g r a d H
where Fm represents the magnetic force of the mineral particles, k is the magnetic susceptibility of the particles, μ 0 is the vacuum susceptibility, and H is the magnetic field intensity.

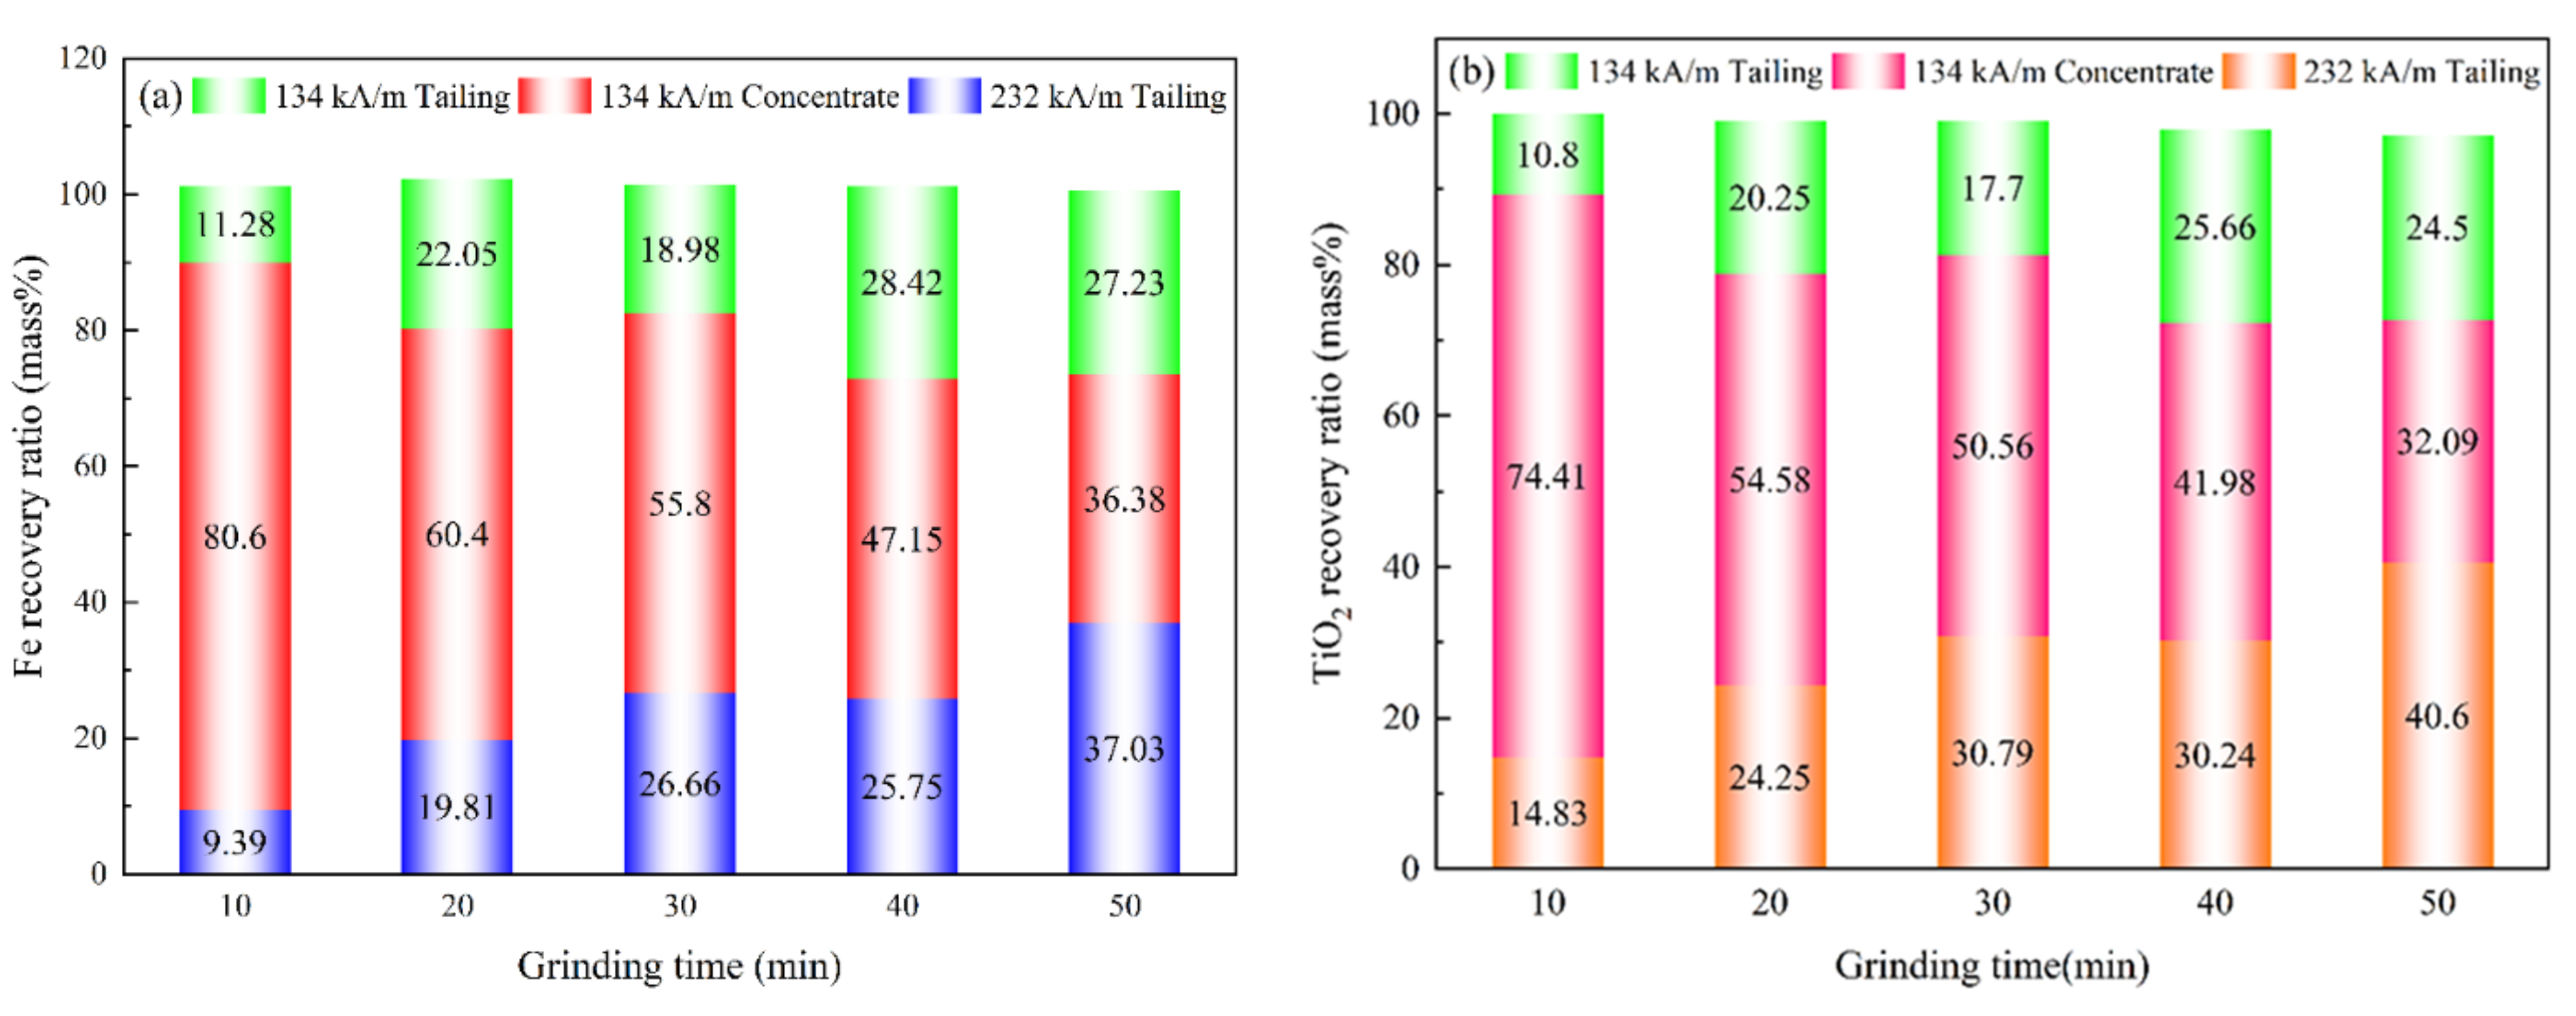
3.5.2. Effect of Grinding Time on the Recovery Ratio of Magnetic Separation

The recovery ratio can be determined easily based on the element’s grade and yield in the magnetic separation products [46]; the results of Fe and TiO2 recovery ratios in this study are shown in Figure 12. Naturally, the grinding time has a significant impact on the Fe and TiO2 recovery ratios; as the grinding time increases, the Fe and TiO2 recovery ratios show similar variations in all magnetic separation products. The recovery ratios of Fe and TiO2 in concentrate drop when the grinding period is prolonged, dropping from 80.6% and 74.41% for 10 min to 36.38% and 32.09% for 50 min, respectively. On the other hand, the recovery ratios of Fe and TiO2 in the tailings are positively correlated with the grinding time. This indicates that despite improved Fe and TiO2 grades, the size of the particles greatly decreases during the grinding process, and the magnetic force on the particles significantly reduces, becoming inadequate to overcome gravity and water flow drag force and become the tailings, resulting in a decrease in yield and recovery ratio. However, when grinding for 30 and 50 min, the variation law states vary. This indicates that fine-particle magnetic minerals and gangue have agglomerated in the ore slurry and been absorbed by the magnetic force to form concentrates, lowering the Fe and TiO2 recovery ratios in the tailings and their grade of in the concentrates. As a result, the LVTC grinding duration is not as prolonged as it might be, and the optimal grinding time is 20 min. Furthermore, in magnetic separation products ground for the same period of time, there is minimal variation in the recovery ratios of Fe and TiO2. This indicates that after fine grinding and magnetic separation, Fe and TiO2 cannot be completely separated, because the majority of ferromagnetic phases and titanium-containing gangue phases are usually in close symbiosis; the above results of the LVTC’s chemical phase analysis ware confirmed.

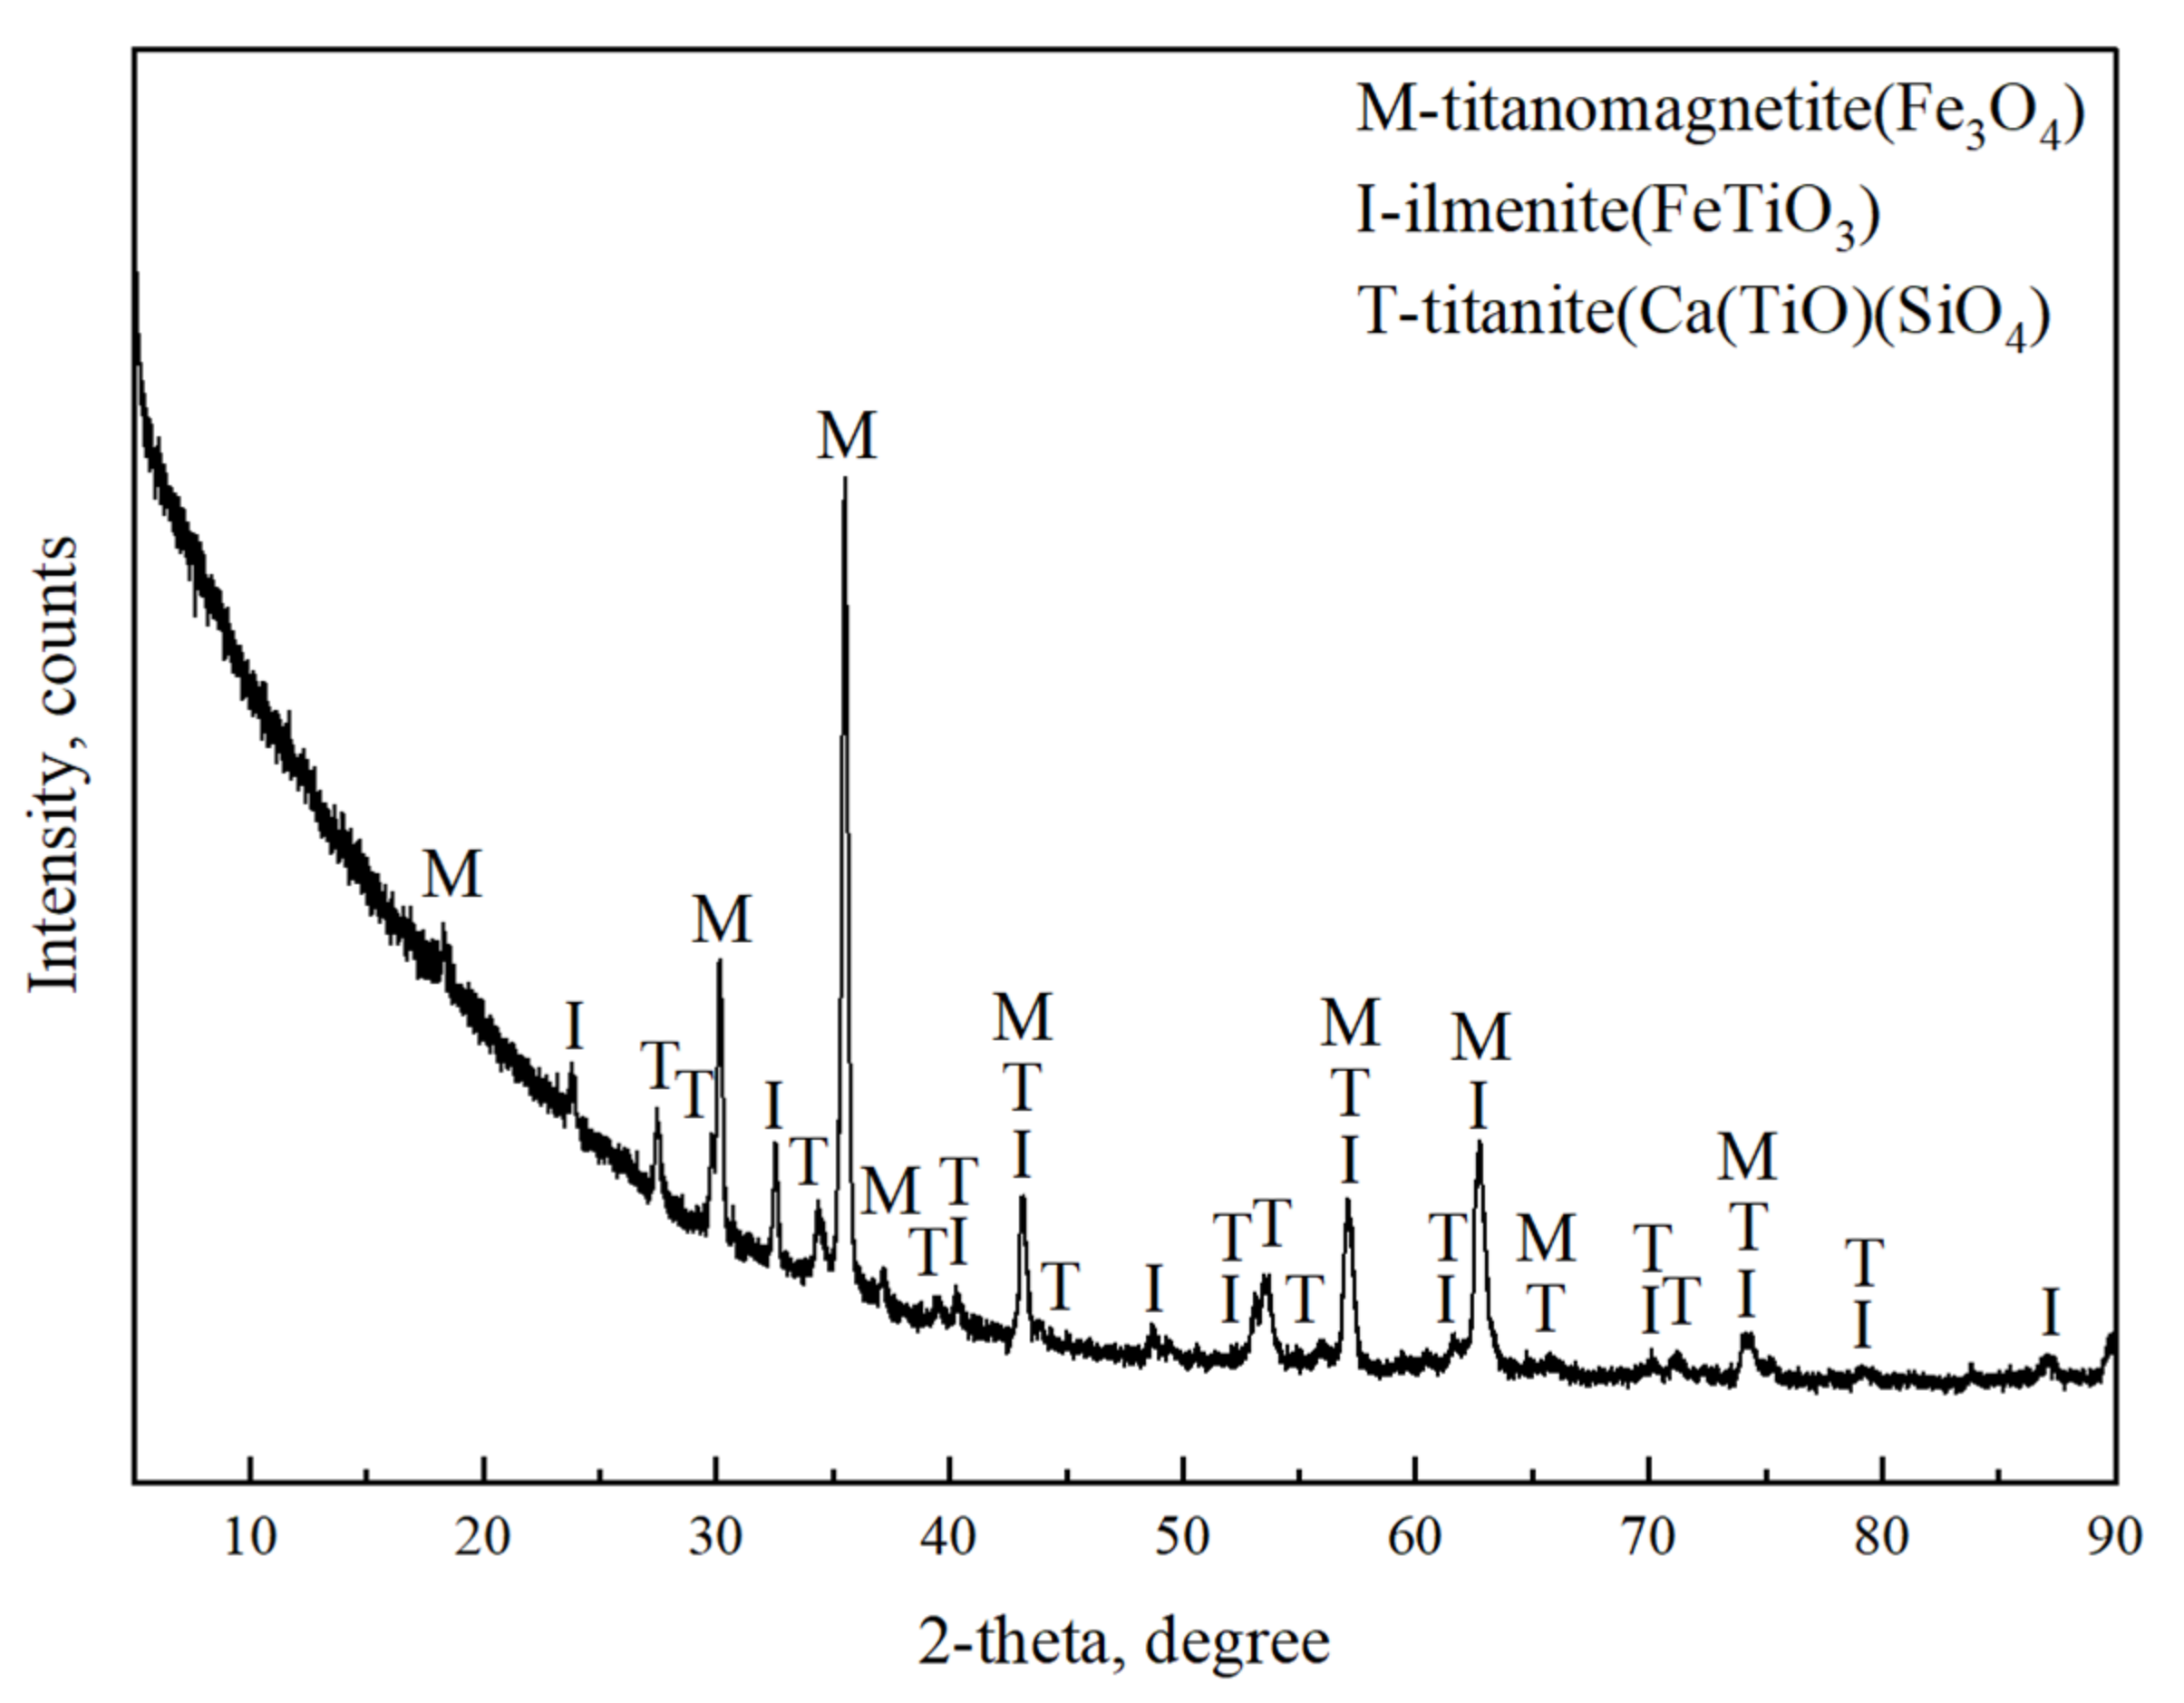
3.5.3. XRD Pattern Analysis of Magnetic Separation Products

The XRD patterns of the products generated by LVTC grinding for 20 min followed by magnetic separation are shown in Figure 13, revealing that titanomagnetite, ilmenite, and titanite are still the predominant phases in all magnetic separation products at an optimal grinding time of 20 min, but the intensity or content of these three minerals varies between magnetic separation products. In the 232 kA/m tailings, the intensity of these three minerals is weaker than in the 134 kA/m magnetic concentrate and tailings, and there are additional peaks of ilmenite and titanite, indicating that several magnetic minerals and gangue can be separated under a magnetic field strength of 232 kA/m. However, there is no difference in peak shapes between 134 kA/m tailings and concentrate, and the common peaks of ilmenite and titanomagnetite continuously appear, indicating that the separation efficiency of LVTC is greatly limited at 134 kA/m magnetic field strength. Therefore, the grade of TFe and TiO2 cannot be significantly improved by ordinary fine grinding and magnetic separation, because of LVTC’s special mineralogical properties. In this study, the optimal grinding time of LVTC was 20 min, and 232 kA/m magnetic field intensity had a higher separation efficiency than 134 kA/m magnetic field intensity.

4. Conclusions

Based on the analysis of special mineralogical properties, the grinding kinetics of the LVTC were investigated using fine grinding, and magnetic separation was used to separate and recover valuable components such as Fe and Ti in this study; the following conclusions were obtained:
As the grinding time increases, the particle size of LVTC powder decreases and the particle distribution becomes narrower, yet there are subpopulations in the PSD curve due to particle agglomeration when the grinding time is beyond 30 min.
The grinding process of LVTC aligns with the grinding kinetics equation perfectly, and after 30 min of grinding, the sieve residues of particles approach a constant value due to equilibrium between the fragmentation and agglomeration processes.
When grinding for 10 min, the surface morphology of the LVTC particles is slightly coarser, and it becomes rougher as the grinding time increases.
EPS and SSA are linearly proportional to the double logarithm of grinding time, and EPS is negatively correlated with the double logarithm of grinding time, while the SSA is positive.
Both RRB and Swebrec functions can aptly describe the PSD of LVTC over a wide range of particle sizes, but the RRB model has slightly higher correlation coefficients for fitted data than the Swebrec model, and it can quantitatively describe the dispersibility and uniformity of PSD.
Grinding time has a significant impact on the recovery ratio and grade of Fe and TiO2 during the magnetic separation process, and the LVTC grinding duration is not as prolonged as it might be; the optimal grinding time is 20 min.
Titanomagnetite, ilmenite, and titanite are still the predominant phases in all magnetic separation products at an optimal grinding time of 20 min, but the intensity or content of these three minerals varies between magnetic separation products. The grade of TFe and TiO2 cannot be significantly improved by ordinary fine grinding and magnetic separation, because of LVTC’s special mineralogical properties, and 232 kA/m magnetic field intensity has a higher separation efficiency than 134 kA/m magnetic field intensity.

Author Contributions

Conceptualization, X.X.; methodology, J.L.; validation, X.X. and X.D.; formal analysis, Z.X. and J.L.; investigation, J.L.; resources, X.X. and G.C.; data curation, J.L.; writing—original draft preparation, J.L.; writing—review and editing, J.L.; supervision, X.X. and X.D.; project administration, X.X. and X.D.; funding acquisition, X.X. and X.D. All authors have read and agreed to the published version of the manuscript.

Funding

This project was supported by the National Natural Science Foundation of China (grant numbers 51674084, 21908020, and U1908226) and the National Key R&D Program of China (No. 2017YFB0603801).

Conflicts of Interest

No conflict of interest exits in the submission of this manuscript, and the manuscript has been approved by all authors for publication.

References

  1. Yang, J.Y.; Tang, Y.; Yang, K.; Rouff, A.A.; Elzinga, E.J.; Huang, J.H. Leaching characteristics of vanadium in mine tailings and soils near a vanadium titanomagnetite mining site. J. Hazard. Mater. 2014, 264, 498–504. [Google Scholar] [CrossRef] [PubMed]
  2. Moskalyk, R.R.; Alfantazi, A.M. Processing of vanadium: A review. Miner. Eng. 2003, 16, 793–805. [Google Scholar] [CrossRef]
  3. Yang, S.T.; Zhou, M.; Jiang, T.; Wang, Y.J.; Xue, X.X. Effect of basicity on sintering behavior of low-titanium vanadium–titanium magnetite. Trans. Nonferrous Met. Soc. China 2015, 25, 2087–2094. [Google Scholar] [CrossRef]
  4. Zheng, F.Q.; Chen, F.; Guo, Y.F.; Jiang, T.; Travyanov, A.Y.; Qiu, G.Z. Kinetics of hydrochloric acid leaching of titanium from titanium-bearing electric furnace slag. JOM 2016, 68, 1476–1484. [Google Scholar] [CrossRef]
  5. Sui, Y.L.; Guo, Y.F.; Jiang, T.; Qiu, G.Z. Reduction kinetics of oxidized vanadium titano-magnetite pellets using carbon monoxide and hydrogen. J. Alloy. Compd. 2017, 706, 546–553. [Google Scholar] [CrossRef]
  6. Yu, J.W.; Hu, N.; Xiao, H.X.; Gao, P.; Sun, Y.S. Reduction behaviors of vanadium-titanium magnetite with H2 via a fluidized bed. Powder Technol. 2021, 385, 83–91. [Google Scholar] [CrossRef]
  7. Xu, C.B.; Zhang, Y.M.; Liu, T.; Huang, J. Characterization and pre-concentration of low-grade vanadium-titanium magnetite ore. Minerals 2017, 7, 137. [Google Scholar] [CrossRef] [Green Version]
  8. Pang, Z.D.; Lv, X.W.; Jiang, Y.Y.; Ling, J.W.; Yan, Z.M. Blast furnace ironmaking process with super-high TiO2 in the slag: Viscosity and melting properties of the slag. Metall. Mater. Trans. B 2019, 51, 722–731. [Google Scholar] [CrossRef]
  9. Chen, S.Y.; Fu, X.J.; Chu, M.S.; Liu, Z.G.; Tang, J. Life cycle assessment of the comprehensive utilisation of vanadium titano-magnetite. J. Clean. Prod. 2015, 101, 122–128. [Google Scholar] [CrossRef] [Green Version]
  10. Qin, J.; Wang, Y.; You, Z.X.; Wen, L.Y.; Lv, X.W. Carbonization and nitridation of vanadium-bearing titanomagnetite during carbothermal reduction with coal. J. Mater. Res. Technol. 2020, 9, 4272–4282. [Google Scholar] [CrossRef]
  11. Sui, Y.L.; Guo, Y.F.; Jiang, T.; Xie, X.L.; Wang, S.; Zheng, F.Q. Gas-based reduction of vanadium titano-magnetite concentrate: Behavior and mechanisms. Int. J. Miner. Metall. Mater. 2017, 24, 10–17. [Google Scholar] [CrossRef]
  12. Yang, H.F.; Jing, L.L.; Zhang, B.G. Recovery of iron from vanadium tailings with coal-based direct reduction followed by magnetic separation. J. Hazard. Mater. 2011, 185, 1405–1411. [Google Scholar] [CrossRef] [PubMed]
  13. Liu, S.S.; Guo, Y.F.; Qiu, G.Z.; Jiang, T.; Chen, F. Solid-state reduction kinetics and mechanism of pre-oxidized vanadium-titanium magnetite concentrate. Trans. Nonferrous Met. Soc. China 2014, 24, 3372–3377. [Google Scholar] [CrossRef]
  14. Han, Y.; Kim, S.; Go, B.; Lee, S.; Park, S.; Jeon, H.S. Optimized magnetic separation for efficient recovery of V and Ti enriched concentrates from vanadium-titanium magnetite ore: Effect of grinding and magnetic intensity. Powder Technol. 2021, 391, 282–291. [Google Scholar] [CrossRef]
  15. Lund, C.; Lamberg, P.; Lindberg, T. Practical way to quantify minerals from chemical assays at Malmberget iron ore operations—An important tool for the geometallurgical program. Miner. Eng. 2013, 49, 7–16. [Google Scholar] [CrossRef]
  16. Sui, Y.L.; Guo, Y.F.; Jiang, T.; Qiu, G.Z. Separation and recovery of iron and titanium from oxidized vanadium titano-magnetite by gas-based reduction roasting and magnetic separation. J. Mater. Res. Technol. 2019, 8, 3036–3043. [Google Scholar] [CrossRef]
  17. Matijašić, G.; Kurajica, S. Grinding kinetics of amorphous powder obtained by sol–gel process. Powder Technol. 2010, 197, 165–169. [Google Scholar] [CrossRef]
  18. Zhao, R.C.; Han, Y.X.; He, M.Z.; Li, Y.J. Grinding kinetics of quartz and chlorite in wet ball milling. Powder Technol. 2017, 305, 418–425. [Google Scholar] [CrossRef]
  19. Long, H.M.; Chun, T.J.; Wang, P.; Meng, Q.M.; Di, Z.X.; Li, J.X. Grinding kinetics of vanadium-titanium magnetite concentrate in a damp mill and its properties. Metall. Mater. Trans. B 2016, 47, 1765–1772. [Google Scholar] [CrossRef]
  20. Choi, W.S.; Chung, H.Y.; Yoon, B.R.; Kim, S.S. Applications of grinding kinetics analysis to fine grinding characteristics of some inorganic materials using a composite grinding media by planetary ball mill. Powder Technol. 2001, 115, 209–214. [Google Scholar] [CrossRef]
  21. Kano, J.; Miyazaki, M.; Saito, F. Ball mill simulation and powder characteristics of ground talc in various types of mill. Adv. Powder Technol. 2000, 11, 333–342. [Google Scholar] [CrossRef]
  22. Djamarani, K.M.; Clark, I.M. Characterization of particle size based on fine and coarse fractions. Powder Technol. 1997, 93, 101–108. [Google Scholar] [CrossRef]
  23. Rosin, P.O.; Rammler, E.J. Laws governing the fineness of powdered coal. J. Inst. Fuel 1933, 7, 29–36. [Google Scholar]
  24. Reid, K.J. A solution to the batch grinding equation. Chem. Eng. Sci. 1965, 20, 953–963. [Google Scholar] [CrossRef]
  25. Ozao, R.; Ochiai, M. Thermal analysis and self-similarity law in particle size distribution of powder samples. Part 3. Thermochim. Acta 1992, 208, 161–167. [Google Scholar] [CrossRef]
  26. Menéndez-Aguado, J.M.; Peña-Carpio, E.; Sierra, C. Particle size distribution fitting of surface detrital sediment using the Swrebec function. J. Soils Sediments 2015, 15, 2004–2011. [Google Scholar] [CrossRef]
  27. Osorio, A.M.; Menéndez-Aguado, J.M.; Bustamante, O.; Restrepo, G.M. Fine grinding size distribution analysis using the Swrebec function. Powder Technol. 2014, 258, 206–208. [Google Scholar] [CrossRef]
  28. González-Tello, P.; Camacho, F.; Vicaria, J.M.; González, P.A. A modified Nukiyama–Tanasawa distribution function and a Rosin–Rammler model for the particle-size-distribution analysis. Powder Technol. 2008, 186, 278–281. [Google Scholar] [CrossRef]
  29. Ouchterlony, F. The Swebrec© function: Linking fragmentation by blasting and crushing. Min. Technol. 2005, 114, 29–44. [Google Scholar] [CrossRef] [Green Version]
  30. Yu, J.W.; Qin, Y.H.; Gao, P.; Han, Y.X.; Li, Y.J. An innovative approach for determining the grinding media system of ball mill based on grinding kinetics and linear superposition principle. Powder Technol. 2021, 378, 172–181. [Google Scholar] [CrossRef]
  31. Rodríguez, B.Á.; García, G.G.; Coello-Velázquez, A.L.; Menéndez-Aguado, J.M. Product size distribution function influence on interpolation calculations in the Bond ball mill grindability test. Int. J. Miner. Process. 2016, 157, 16–20. [Google Scholar] [CrossRef]
  32. Liu, S.H.; Li, Q.L.; Xie, G.S.; Li, L.H.; Xiao, H.L. Effect of grinding time on the particle characteristics of glass powder. Powder Technol. 2016, 295, 133–141. [Google Scholar] [CrossRef]
  33. Ahmadi, R.; Hashemzadehfini, M.; Parian, M.A. Rapid determination of Bond rod-mill work index by modeling the grinding kinetics. Adv. Powder Technol. 2013, 24, 441–445. [Google Scholar] [CrossRef]
  34. Liu, S.X.; Shen, L.L.; Wang, Q.P.; Niu, F.S. Investigation on crushing kinetic equation of ball milling of quartz powder. Adv. Mater. Res. 2010, 156, 812–816. [Google Scholar] [CrossRef]
  35. Tavares, L.M.; Carvalho, R.M. Impact work index prediction from continuum damage model of particle fracture. Miner. Eng. 2007, 20, 1368–1375. [Google Scholar] [CrossRef]
  36. Kotake, N.; Daibo, K.; Yamamoto, T.; Kanda, Y. Experimental investigation on a grinding rate constant of solid materials by a ball mill—effect of ball diameter and feed size. Powder Technol. 2004, 143, 196–203. [Google Scholar] [CrossRef]
  37. Frances, C. On modelling of submicronic wet milling processes in bead mills. Powder Technol. 2004, 143, 253–263. [Google Scholar] [CrossRef]
  38. Delagrammatikas, G.; Delagrammatikas, M.; Tsimas, S. Particle size distributions a new approach. Powder Technol. 2007, 176, 57–65. [Google Scholar] [CrossRef]
  39. Kotake, N.; Suzuki, K.; Asahi, S.; Kanda, Y. Experimental study on the grinding rate constant of solid materials in a ball mill. Powder Technol. 2002, 122, 101–108. [Google Scholar] [CrossRef]
  40. Liu, S.H.; Li, Q.L.; Song, J.W. Study on the grinding kinetics of copper tailing powder. Powder Technol. 2018, 330, 105–113. [Google Scholar] [CrossRef]
  41. Wang, F.W.; Dai, H.X.; Lv, Y.C.; Zhang, L. Dynamic capture behavior of ferromagnetic particles based on fully coupled multiphysics model of particle-fluid interactions. Miner. Eng. 2019, 138, 238–245. [Google Scholar] [CrossRef]
  42. Silin, I.; Hahn, K.; Gürsel, D.; Kremer, D.; Gronen, L.; Stopić, S.; Friedrich, B.; Wotruba, H. Mineral processing and metallurgical treatment of lead vanadate ores. Minerals 2020, 10, 197. [Google Scholar] [CrossRef] [Green Version]
  43. Du, Y.S.; Meng, Q.Y.; Yuan, Z.T.; Xu, Y.K.; Li, L.X. New cognitions into three new classified titanaugite in mineralogical characteristics and fundamental performances. Miner. Eng. 2021, 169, 106962. [Google Scholar] [CrossRef]
  44. Yuan, Z.T.; Zhao, X.; Meng, Q.Y.; Xu, Y.K.; Li, L.X. Effect of selective coating of magnetite on improving magnetic separation of ilmenite from titanaugite. Miner. Eng. 2020, 149, 106267. [Google Scholar] [CrossRef]
  45. Wang, F.W.; Tang, D.D.; Gao, L.K.; Dai, H.X.; Wang, P.R.; Gong, Z.H. Magnetic entrainment mechanism of multi-type intergrowth particles for Low-Intensity magnetic separation based on a multiphysics model. Miner. Eng. 2020, 149, 106264. [Google Scholar] [CrossRef]
  46. Guo, X.F.; Dai, S.J.; Wang, Q.Q. Influence of different comminution flowsheets on the separation of vanadium titano-magnetite. Miner. Eng. 2020, 149, 106268. [Google Scholar] [CrossRef]
Figure 1. XRD patterns of the LVTC.
Metals 12 00575 g001
Figure 2. Flowchart of the grinding and magnetic separation process.
Metals 12 00575 g002
Figure 3. PSD curves of LVTC powder: (a) differential curve, (b) integral curve.
Metals 12 00575 g003
Figure 4. Cumulative residue and fitting curves for six representative sieve sizes.
Metals 12 00575 g004
Figure 5. Particle morphology of LVTC powder ground for different times: (a,A) 0 min; (b,B) 10 min; (c,C) 20 min; (d,D) 30 min; (e,E) 40 min; and (f,F) 50 min.
Metals 12 00575 g005
Figure 6. Relationship between the EPS of LVTC powder and the double logarithm of grinding time.
Metals 12 00575 g006
Figure 7. Relationship between the SSA of LVTC powder and the double logarithm of grinding time.
Metals 12 00575 g007
Figure 8. RRB function fitting of LVTC powder grinding for different times.
Metals 12 00575 g008
Figure 9. Swebrec function fitting of LVTC powder ground for different times.
Metals 12 00575 g009
Figure 10. Flowchart of the magnetic separation process of ground LVTC powder.
Metals 12 00575 g010
Figure 11. Effect of grinding time on the grade of (a) TFe and (b) TiO2.
Metals 12 00575 g011
Figure 12. Effect of grinding time on recovery ratio of (a) Fe and (b) TiO2.
Metals 12 00575 g012
Figure 13. XRD patterns of magnetic separation products at optimal grinding time of 20 min.
Metals 12 00575 g013
Table 1. Chemical compositions of the LVTC/mass (%).
TFeFeOTiO2SiO2CaOAl2O3V2O5MgOMnOZnOSrOK2ONa2OSO3
43.7518.417.3310.985.062.612.340.870.660.080.070.050.040.04
Table 2. Chemical phase analysis of Fe and Ti in the LVTC/mass (%).
Mineral PhaseFe Mass FractionFe DistributionTi Mass FractionTi Distribution
Titanomagnetite35.8383.095.2650.79
Ilmenite5.535.533.9037.68
TitaniteMinorMinor1.1811.37
Gangue1.764.080.020.16
Total43.1299.9910.35100.00
Table 3. Sieve residues of six representative sizes of LVTC powder/mass (%).
Grinding Time/Min0.99 μm1.88 μm5.92 μm9.86 μm18.7 μm45.6 μm
1097.9393.7778.2566.3243.4812.26
2097.6393.2574.9560.9440.74.89
3097.3492.7171.7456.2732.585.09
4096.791.2470.7454.8929.955.44
5096.3290.2367.5951.1727.836.16
Table 4. Parameters of grinding equations for six representative sieve sizes.
Parameter0.99 μm1.88 μm5.92 μm9.86 μm18.7 μm45.6 μm
Kt3.818214.445164.554234.562754.598184.60931
M0.607080.277550.153070.085340.022660.01004
R20.956230.974340.965730.987430.976580.96057
Table 5. SSA and EPS (D10, D25, D50, D75, and D90) of LVTC ground for different times.
SamplesGrinding Time
/min
SSA
(m2/kg)
D10
/μm
D25
/μm
D50
/μm
D75
/μm
D90
/μm
Raw LVTC-393.27.2515.34252112
LVTC powder10770.83.437.7818.924.654
20960.22.656.2514.81941.3
3010622.45.6512.317.138.8
4011882.075.0511.217.637.2
5012781.914.6910.226.838.5
Table 6. Parameters and R2-Adj of the RRB and Swebrec function models.
ModelParametersGrinding Time
1020304050
RRBd* (measured)21.218.714.513.612.7
d* (fitting)22.918.315.614.513.4
n0.901.020.931.000.94
R20.99830.99830.99840.99870.9980
SwebrecX5018.714.511.210.89.86
Xmax14412798.1163186
b4.695.154.824.604.66
R20.99650.99660.99900.99670.9969
Publisher’s Note: MDPI stays neutral with regard to jurisdictional claims in published maps and institutional affiliations.

