Article

Electrochemical Short-Time Testing Method for Simulating the Degradation Behavior of Magnesium-Based Biomaterials

Chair of Materials Test Engineering (WPT), TU Dortmund University, Baroper Str. 303, D-44227 Dortmund, Germany
*
Author to whom correspondence should be addressed.
Metals 2022, 12(4), 591; https://doi.org/10.3390/met12040591
Submission received: 28 February 2022 / Revised: 21 March 2022 / Accepted: 25 March 2022 / Published: 30 March 2022
(This article belongs to the Special Issue Corrosion Behavior of Magnesium Alloys)

Abstract

:
In regenerative medicine, degradable, magnesium-based biomaterials represent a promising material class. The low corrosion resistance typical for magnesium is advantageous for this application since the entire implant degrades in the presence of the aqueous body fluids after fulfilling the intended function, making a second operation for implant removal obsolete. To ensure sufficient stability within the functional phase, the degradation behavior must be known for months. In order to reduce time and costs for these long-time investigations, an electrochemical short-time testing method is developed and validated, accelerating the dissolution process of a magnesium alloy with and without surface modification based on galvanostatic anodic polarization, enabling a simulation of longer immersion times. During anodic polarization, the hydrogen gas formed by the corrosion process increases linearly. Moreover, the gas volume shows a linear relationship to the dissolving mass, enabling a defined dissolution of magnesium. As a starting point, corrosion rates of both variants from three-week immersion tests are used. A simplified relationship between the current density and the dissolution rate, determined experimentally, is used to design the experiments. Ex situ µ-computed tomography scans are performed to compare the degradation morphologies of both test strategies. The results demonstrate that a simulation of the degradation rates and, hence, considerable time saving based on galvanostatic anodic polarization is possible. Since the method is accompanied by a changed degradation morphology, it is suitable for a worst-case estimation allowing the exclusion of new, unsuitable magnesium systems before subsequent preclinical studies.

1. Introduction

In surgical disciplines, magnesium (Mg) alloys and systems are becoming the focus of research due to their mechanical properties comparable to human cortical bone and their inherent biodegradability [1,2]. In addition to the mentioned properties, magnesium has other advantages, making it interesting for applications such as reconstruction plates and screws. The element is involved in biochemical processes such as wound healing, soft and hard tissue regeneration, and protein synthesis [3,4,5]. Due to the biodegradability, the application of Mg implants allows temporary support (functional phase) of the human bone, avoiding the necessity for a second surgery for implant removal after complete degradation [6,7]. Degradation occurs in the presence of water-based body fluids, producing magnesium hydroxide and releasing hydrogen gas. According to Song et al. [7], Mg oxidizes in a first step to the intermediate uni-positive Mg+ ion (Equation (1), anodic partial reaction) before further oxidizing with water to the more stable Mg2+ ion producing hydrogen gas and hydroxide ions (Equation (2), anodic partial reaction). The cathodic partial reaction is given by Equation (3). Combining these partial reactions gives the overall reaction (Equation (4)), according to which magnesium oxidizes in the presence of water to form hydrogen gas and hydroxide ions. The formation of the corrosion products is given by Equation (5) [7].
2Mg → 2Mg+ + 2e
2Mg+ + 2H2O → 2Mg2+ + 2OH + H2
2H2O + 2e → 2OH + H2
2Mg + 4H2O → 2Mg2+ + 4OH + 2H2
Mg2+ + 2OH → Mg(OH)2
Equations (4) and (5) indicate that the corrosion rate can be determined either by removal of remaining corrosion products and subsequent weight measurement or by detection of the hydrogen volume produced. In this context, the corrosion rate and the corrosion morphology have a decisive influence on the mechanical stability and thus on the functional phase of the implant. To design the latter and minimize the risk to patients from premature implant failure, the degradation behavior must be precisely determined [8]. Different methods exist for characterizing degradation behavior, where a distinction is made between in vitro (preclinical) and in vivo (animal) studies. For in vivo experiments, different animal and defect models exist [9,10,11], having a decisive influence on the transferability to the human body. Implantation periods of several months [9] up to one year [11] are common. Degradation characterization is usually performed in vivo via µ-computed tomography (µCT) and after the sacrifice through ex vivo histology [9,10,11]. Resulting from ethical problems, many studies utilize in vitro investigations. The immersion test is a common method to determine the degradation behavior and the resulting degradation rate [12,13,14]. Given the higher in vitro corrosion rates [15], shorter test periods of one to several weeks are usually applied. A distinction can be made between short-time immersion for the qualitative assessment of different material conditions [16,17,18] and long-time immersion for assessing the time-dependent corrosion behavior [19,20]. According to Equation (4), either the hydrogen gas produced and/or the mass loss is used to calculate the degradation rate [13,14,17]. The mass loss allows an immediate calculation of the degradation rate, whereby the removal of the corrosion products is carried out ex situ by the usage of the carcinogenic chromic acid. The hydrogen gas measurement, on the other hand, allows an in situ evaluation of the time-dependent degradation behavior [21]. The evaluability of the time dependence is of central importance since magnesium alloys exhibit a considerable time-dependent corrosion behavior as a result of the formation of a (partially) passivating corrosion layer as well as, depending on the alloying elements and the associated micro-galvanic corrosion, the time-dependent formation of corrosion pits [17,22,23].
As described, in vivo and in vitro tests are associated with high time and cost efforts. To minimize these, the possibility exists to accelerate the degradation in in vitro tests. By applying an anodic current, the formation of uni-positive Mg+ ions (Equation (1)), thus also of Mg2+ (Equation (2)), the release of hydrogen gas, and the dissolution of magnesium (Equation (4)) can be influenced and accelerated. For different electrolytes, it was demonstrated that for constant current densities, the hydrogen evolution increased linearly over time [24,25,26]. Furthermore, Shi et al. [24,25] were able to determine a linear relationship between the hydrogen evolution rate (HER) and the mass loss rate. Thomas et al. [27] established a phenomenological model to describe the processes occurring under anodic polarization. It was found that hydrogen evolution is locally increased by noble impurities or precipitates accompanied by corrosion pitting. Klein et al. [28] used these relationships to obtain different dissolution rates under simultaneous fatigue loading so that a correlation between dissolution behavior and corrosion fatigue strength was determined. An influence of rare earth elements on the dissolution morphology towards corrosion pits and thus to a significant decrease of corrosion fatigue strength was identified.
This study deals with developing and validating a short-time testing method based on anodic polarization for the simulation of long-time immersion. It is based on the known relationship between the HER, mass loss [24], and the influence of these factors on corrosion and corrosion fatigue properties under anodic polarization [28]. The common magnesium alloy WE43 (yttrium, neodymium, zirconium) with and without plasma electrolytic oxidation (PEO)-modified surface serves as example material. For both variants, the suitable property profile of degradation resistance and biocompatibility are known [29,30]. The starting point is an experimentally determined relationship between the dissolution rate and the current density [31] and the time-dependent corrosion rates from three-week immersion tests [30]. The aim is to reproduce the hydrogen evolution and thus the degradation behavior of the immersion tests in three days through a systematic design of the current densities. To make statements about the macroscopic dissolution morphology and consequently to be able to compare both test strategies, ex situ µCT investigations are carried out. The short-time testing method is intended to enable an efficient evaluation of the qualitative and quantitative degradation behavior of long-time immersion, allowing unsuitable magnesium systems, especially concerning degradation morphologies unfavorable for medium-term stability, to be excluded before preclinical testing.

2. Materials and Methods

The specimens (Figure 1) were machined from rod material of chill-casted and extruded Mg-Y-RE-Zr alloy WE43MEO (Meotec GmbH, Aachen, Germany, hereafter referred to as WE43) with an elemental composition of 1.4–4.2% Y, 2.5–3.5% Nd, <1% (Al, Fe, Cu, Ni, Mn, Zn, Zr) and balance Mg (in wt.%). The entire tapered length was polished to 1 µm with water-free diamond suspension. The parallel gauge length had an initial diameter of 4 mm and a length of 9 mm. As a second material variant, the surface of the magnesium specimens was modified by plasma electrolytic oxidation (PEO, Kermasorb®, Meotec GmbH, Aachen, Germany). To enable an area-related evaluation of the degradation behavior, the specimens were coated with a corrosion-resistant acrylic resin lacquer outside the gauge length.
The initial material had an evenly distributed microstructure with precipitates of different sizes, forms, and orientations. The size varied from about 100 nm to several micrometers. The shape varied from circular to rod-shaped to branched precipitates. In the cross-section (Figure 2a), no preferred orientation was recognizable, whereas, in the longitudinal section, the precipitates were elongated parallel to the extrusion direction (Figure 3). Such a microstructure, especially in the longitudinal section, is typical for extruded materials and results from the process temperatures and deformations [32,33]. Yttrium-rich, neodymium-rich, and in some cases, zirconium-rich intermetallic precipitates occurred (Figure 2d–f and Figure 3). Precipitates formed solely by one alloying element were rarely present. According to the literature, aside from the α-Mg matrix, the second phase Mg12(RE), the rod-like β-phase (Mg14Nd2Y), and the mentioned yttrium-rich (MgY, Mg14Y5, Mg24Y5), neodymium-rich (Mg41Nd5, Mg12Nd), and zirconium-rich precipitates are detectable [23,34,35]. The PEO layer had a thickness of 25 ± 4 µm as well as a high porosity (Figure 4). The pores varied in shape (circular and interconnected), size (1 to 10 µm), and position (with or without connection to the substrate material). The high porosity resulted from the surface treatment process, involving plasma discharges at the substrate surface [36].

2.1. Corrosion Investigations

The aim was the simulation of the corrosion rates m ˙ corr of a magnesium alloy with and without surface treatment from three-week immersion tests. The starting point was an experimentally determined mathematical relationship (Equation (6)) between the dissolution rate m ˙ diss and the galvanostatic current density i [31]. This relationship was determined on embedded samples and can be assumed to be a two-dimensional (2D) case. For validation, three-dimensional (3D) cylindrical specimens (Figure 1) were used. The corrosion rates to be simulated within the respective time intervals are listed in Table 1 [30]. Here, t0 indicates the initial time interval to be simulated, and ta indicates the shortened time interval. By applying Equation (7), the required current densities were calculated.
m ˙ diss = 10 3.139 · i 1.094
i = m ˙ corr · ( t 0 / t a ) · 10 3.139 1.094
One experimental setup was used for all corrosion investigations (Figure 5). It consisted of a self-developed acrylic glass corrosion cell with a eudiometer, a temperature control unit, and a potentiostat. The corrosion cell had a medium inlet and outlet, enabling the supply and tempering via a peristaltic pump. A 0.9% NaCl solution with a temperature of 36.5 °C was used as a corrosion medium. Choosing a simple electrolyte was justified by focusing on the corrosion rate, corrosion morphology, and ease of handling. Additional ports allowed the use of a three-electrode system. Here, the specimen served as the working electrode, an Ag/AgCl electrode including a Haber–Luggin capillary as the reference electrode and a graphite rod as the counter electrode. A PCI4300 potentiostat (Gamry Instruments Inc., Warminster, PA, USA) was used to control and monitor the tests. The eudiometer port was located on the corrosion cell top side for measuring the hydrogen gas produced during magnesium dissolution.

2.1.1. Potentiodynamic Polarization

In order to estimate the corrosion current densities icorr of both material variants, potentiodynamic polarization (PDP) measurements were carried out. Relative to the open circuit potential (OCP), potentials E from −250 mV in the cathodic to +700 mV in the anodic range were applied. For this purpose, the potential was increased with a scan rate of 0.8 mV/s after reaching OCP. The analysis was performed using the software Echem Analyst (version 6.21, Gamry Instruments Inc., Warminster, PA, USA) by applying the Tafel extrapolation of the cathodic branch. The resulting corrosion current Icorr was divided by the surface area of the gauge length to obtain the corrosion current density.

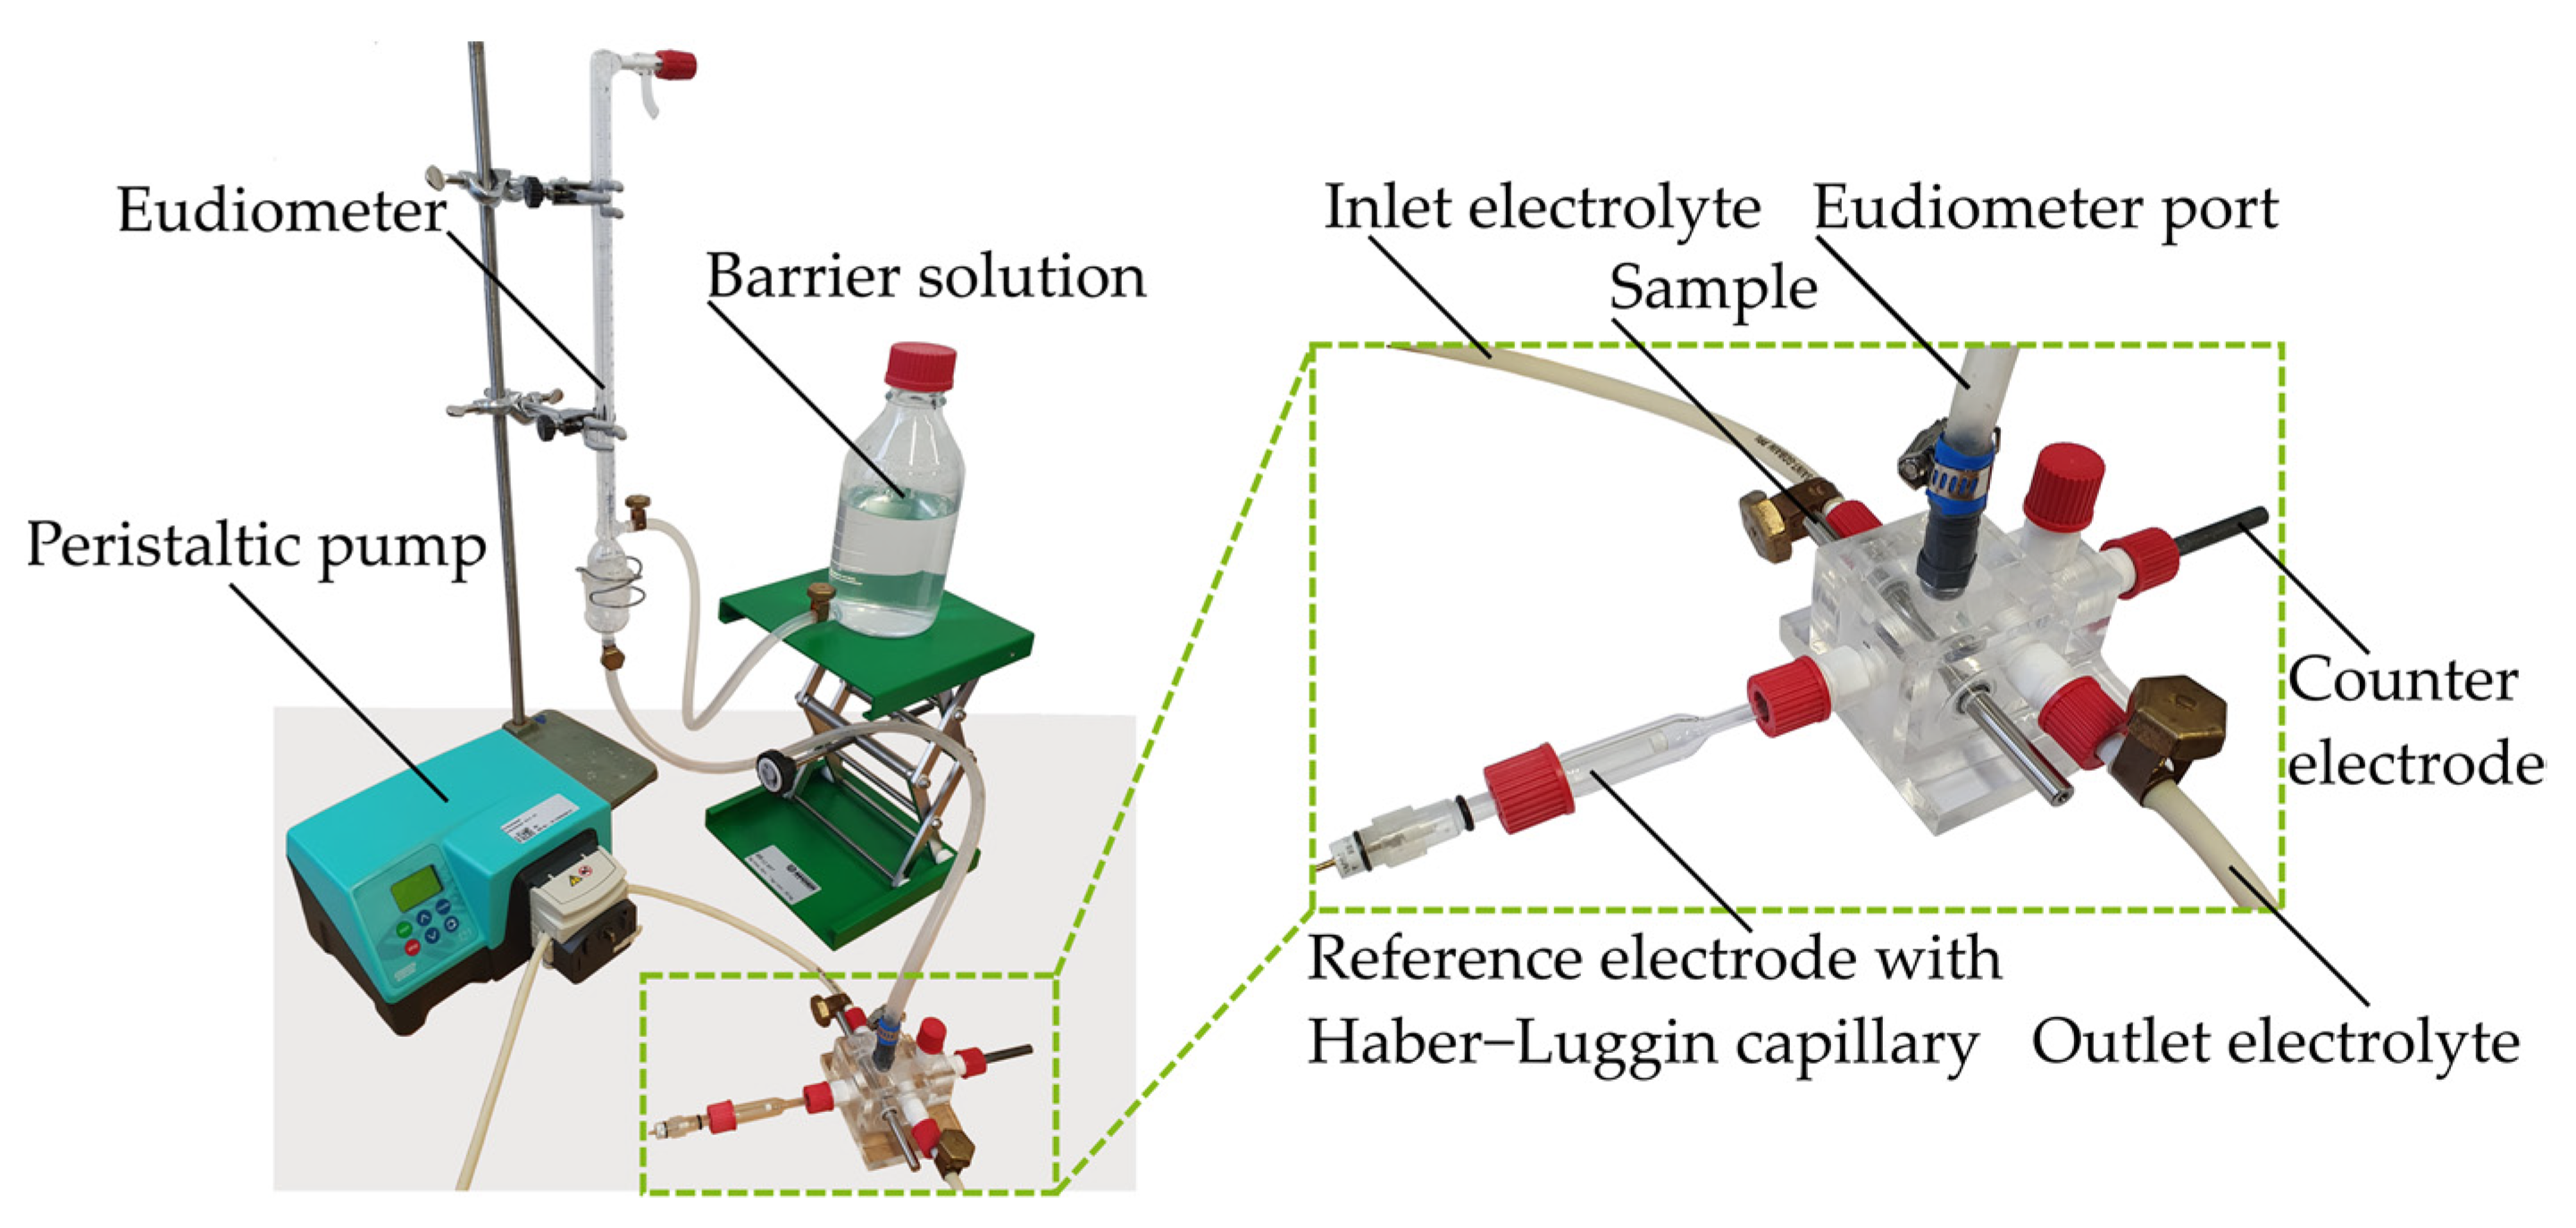
2.1.2. Immersion Tests with Galvanostatic Polarization

In order to accelerate the dissolution rate, immersion tests were performed under the application of galvanostatic polarization. For this purpose, the current densities and time intervals calculated in Table 1 were used. The polarization was applied after the OCP of each specimen was stabilized, preventing overlay effects. During the tests, the current density and the potential were measured against the reference electrode (E vs. Ag/AgCl). The resulting hydrogen gas volume was measured via the changing eudiometer volume. The aim was to simulate the corrosion behavior of one week within one day. The maximum immersion time tmax was three days, corresponding to three weeks without polarization. The tests were carried out intermittently. After each day, the specimen was removed from the setup, cleaned with ethanol, dried, and stored in a desiccator until subsequent testing. The corrosion medium was renewed each time. Figure 6 illustrates the procedure and number of specimens.

2.1.3. µ-Computed Tomography (µCT)

µ-computed tomography (µCT) scans of the gauge length were performed, assessing the dissolution morphology. This non-destructive analysis method has been established for magnesium degradation research [20,37]. For this purpose, an X TH 160 µ-computed tomograph (µCT, maximum acceleration voltage 160 kV, Nikon Inc., Tokyo, Japan) with a beam energy of 105 kV, a beam current of 55 µA, a power of 5.8 W, an exposure time of 354–500 ms, and a resolution of 5 µm pixel size was used. The reconstructed volumes were analyzed using VGStudio Max 2.2 (Volume Graphics GmbH, Heidelberg, Germany). In addition to the qualitative analysis, cross-sections of selected specimens were evaluated using ImageJ software. The gray value difference between the substrate material and the corrosion products was used to determine an effective area Aeff per cross-section after degradation. These values were averaged and used to calculate a mean effective diameter deff,m.

3. Results

3.1. Potentiodynamic Polarization

Figure 7a shows an exemplary result of the potentiodynamic polarization (PDP) of the magnesium alloy WE43 with and without plasma electrolytic oxidation (PEO) modification. The current density |i| is plotted over the potential E versus the reference electrode in semi-logarithmic representation.
The respective corrosion current density icorr is also plotted, determined by Tafel extrapolation of the cathodic branch due to the asymmetry of both branches. The cathodic regions show a comparable course, whereas the anodic branch exhibits differences. For WE43, the curve flattens out near the open circuit potential (OCP) before it changes into a significant increase due to anodic activity. The PEO modified material, on the other hand, flattens out over a wide potential range of about +400 mV (relative to the OCP) until a disproportionate increase occurs. Quantitatively, the PEO variant exhibits a lower OCP (−1.873 V) and corrosion current density (11.4 µA cm−2) compared to the substrate material (−1.711 V; 57.6 µA cm−2).

3.2. Immersion Tests with Galvanostatic Polarization

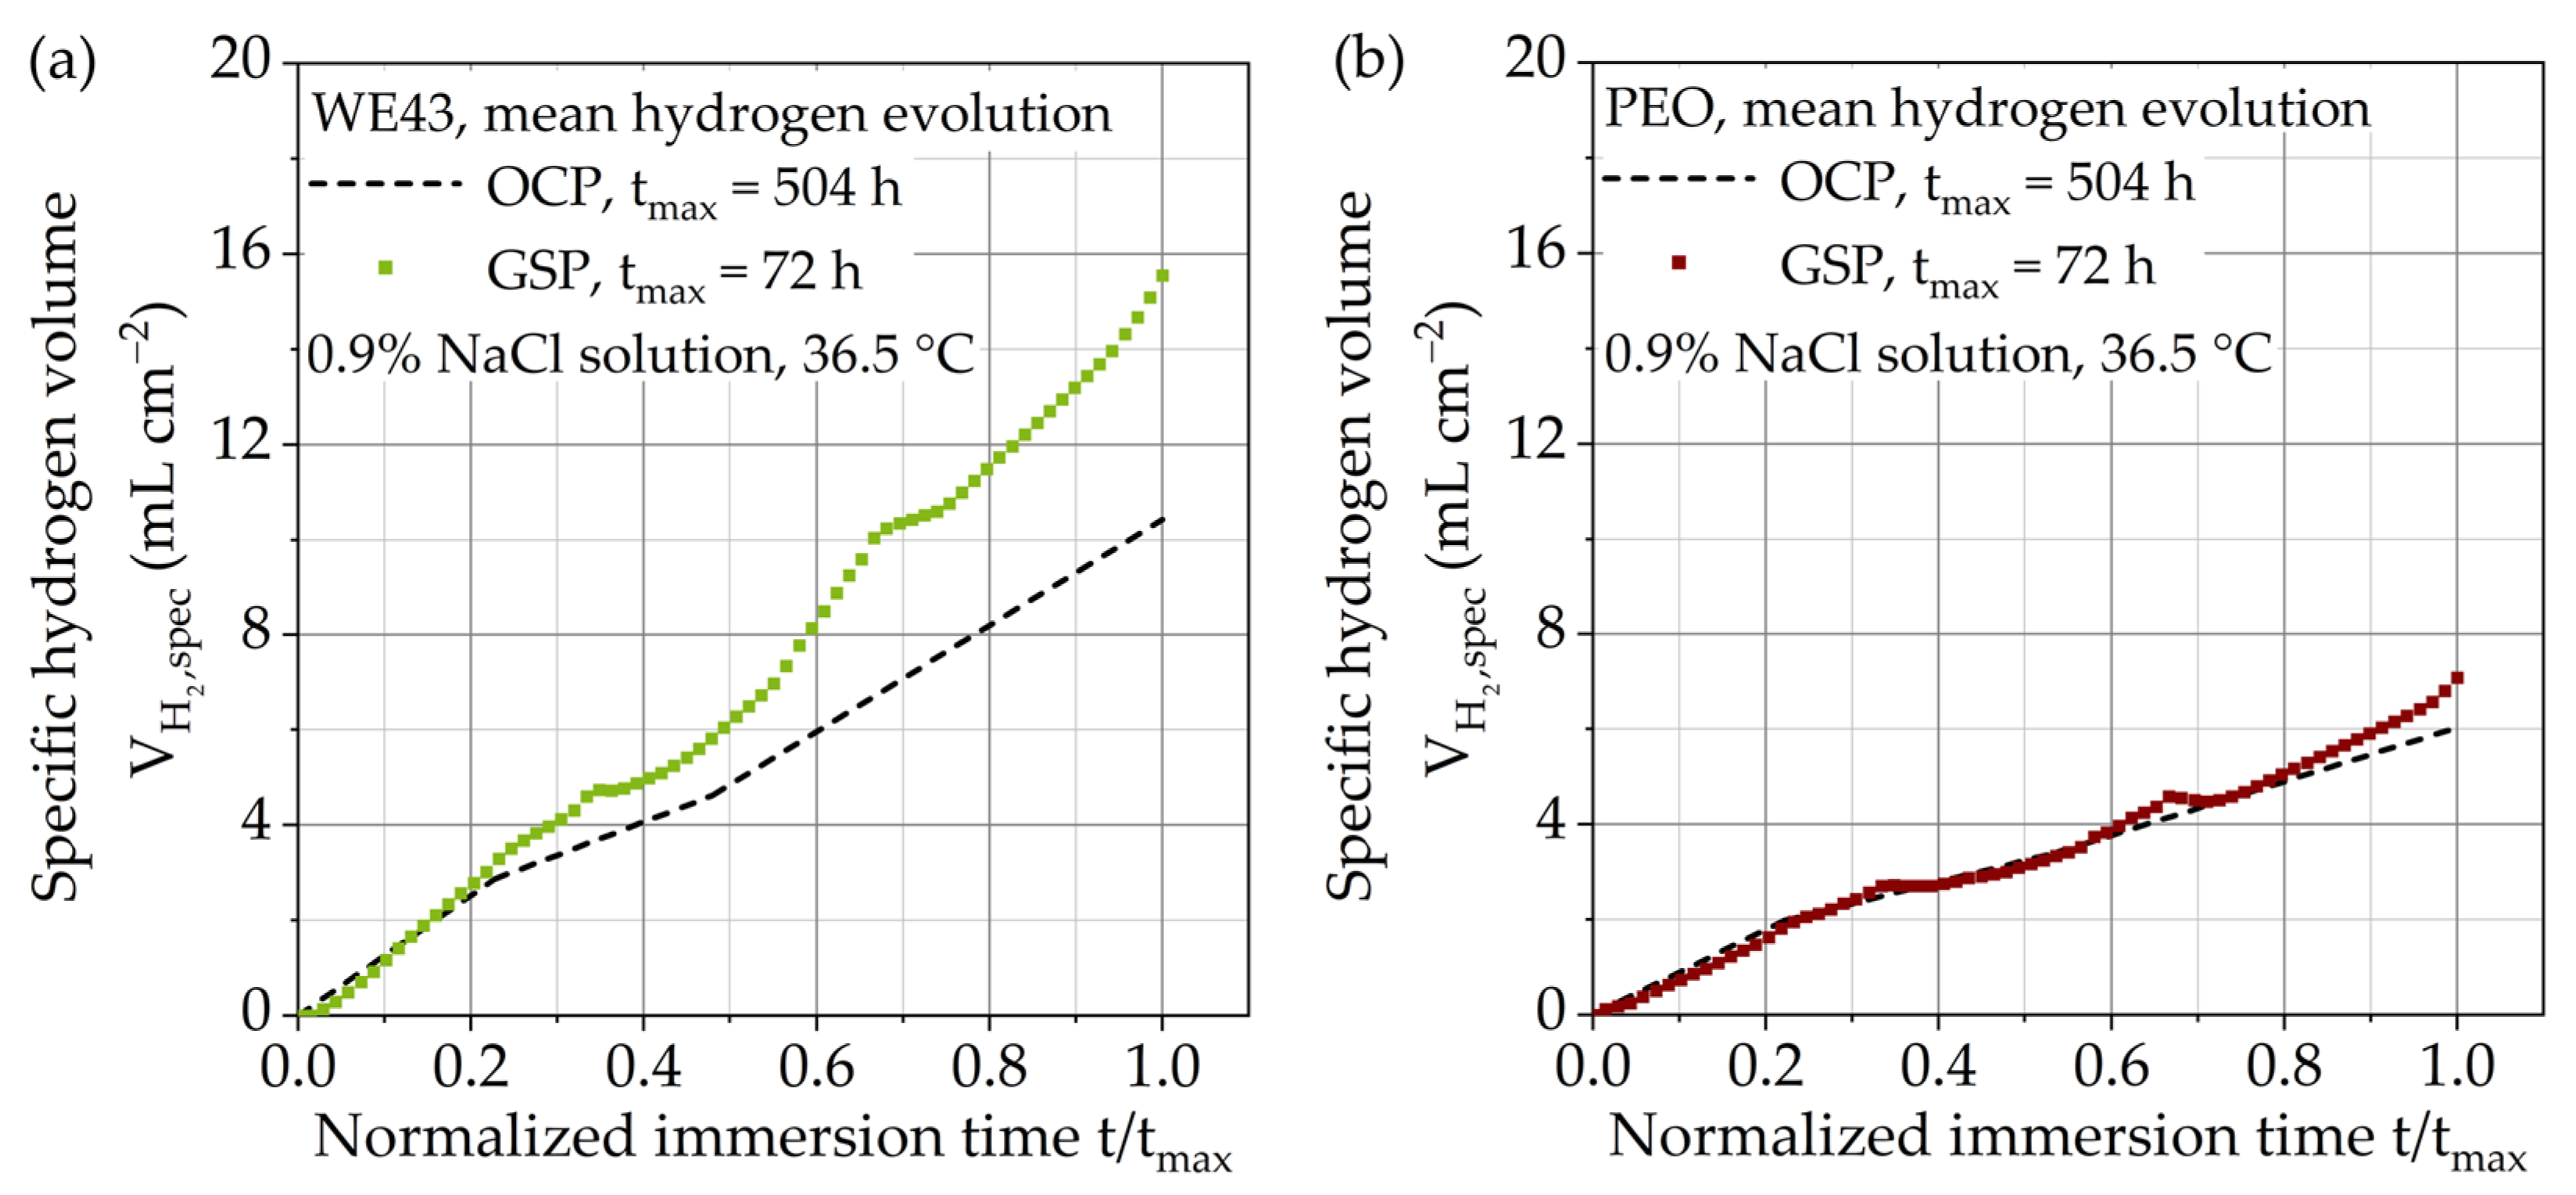
3.2.1. Specific Hydrogen Volume

Figure 7b shows the averaged results of the immersion tests with galvanostatic anodic polarization of both material variants. The specific hydrogen volume V H 2 , spec is plotted over the immersion time t. Since only two specimens were available for the last period (day 3, Figure 6), no standard deviations are given here. For the other periods (days 1 and 2), the standard deviations increased within the respective day. In general, the results of the substrate material show a higher variance. For each day, the hydrogen evolution exhibits a progressive course, afterward changing into a straight line. Qualitatively, the time points marking a change in the applied current density are recognizable for both variants. Compared to the PEO modified material (7.1 mL cm−2), the substrate material (15.6 mL cm−2) achieved a much higher specific hydrogen volume. The curves were approximated using linear regression, determining the dissolution rates m ˙ diss (Table 2) for each time interval via the hydrogen evolution rate (HER, slope of the regression curve). For progressive curves, only the slope of the subsequent linear range was considered.
To allow a comparison to the unpolarized immersion tests (at open circuit potential (OCP)) [30], the specific hydrogen volume is plotted over the normalized immersion time t/tmax in Figure 8. The mean hydrogen evolution rate is shown as a dashed line. For the PEO modified variant, there is a quantitative agreement up to the second day (t/tmax = 0.667). However, only in the third interval do the test strategies diverge from each other. At the end of the third day, the specific hydrogen volume of the non-polarized immersion tests was approximately 17.2% lower. For the substrate material, higher deviations were already noticeable within the first interval. With increasing immersion time, both test strategies deviated significantly from each other so that for t/tmax = 1, the specific hydrogen volume was 49.3% higher for the polarized tests.

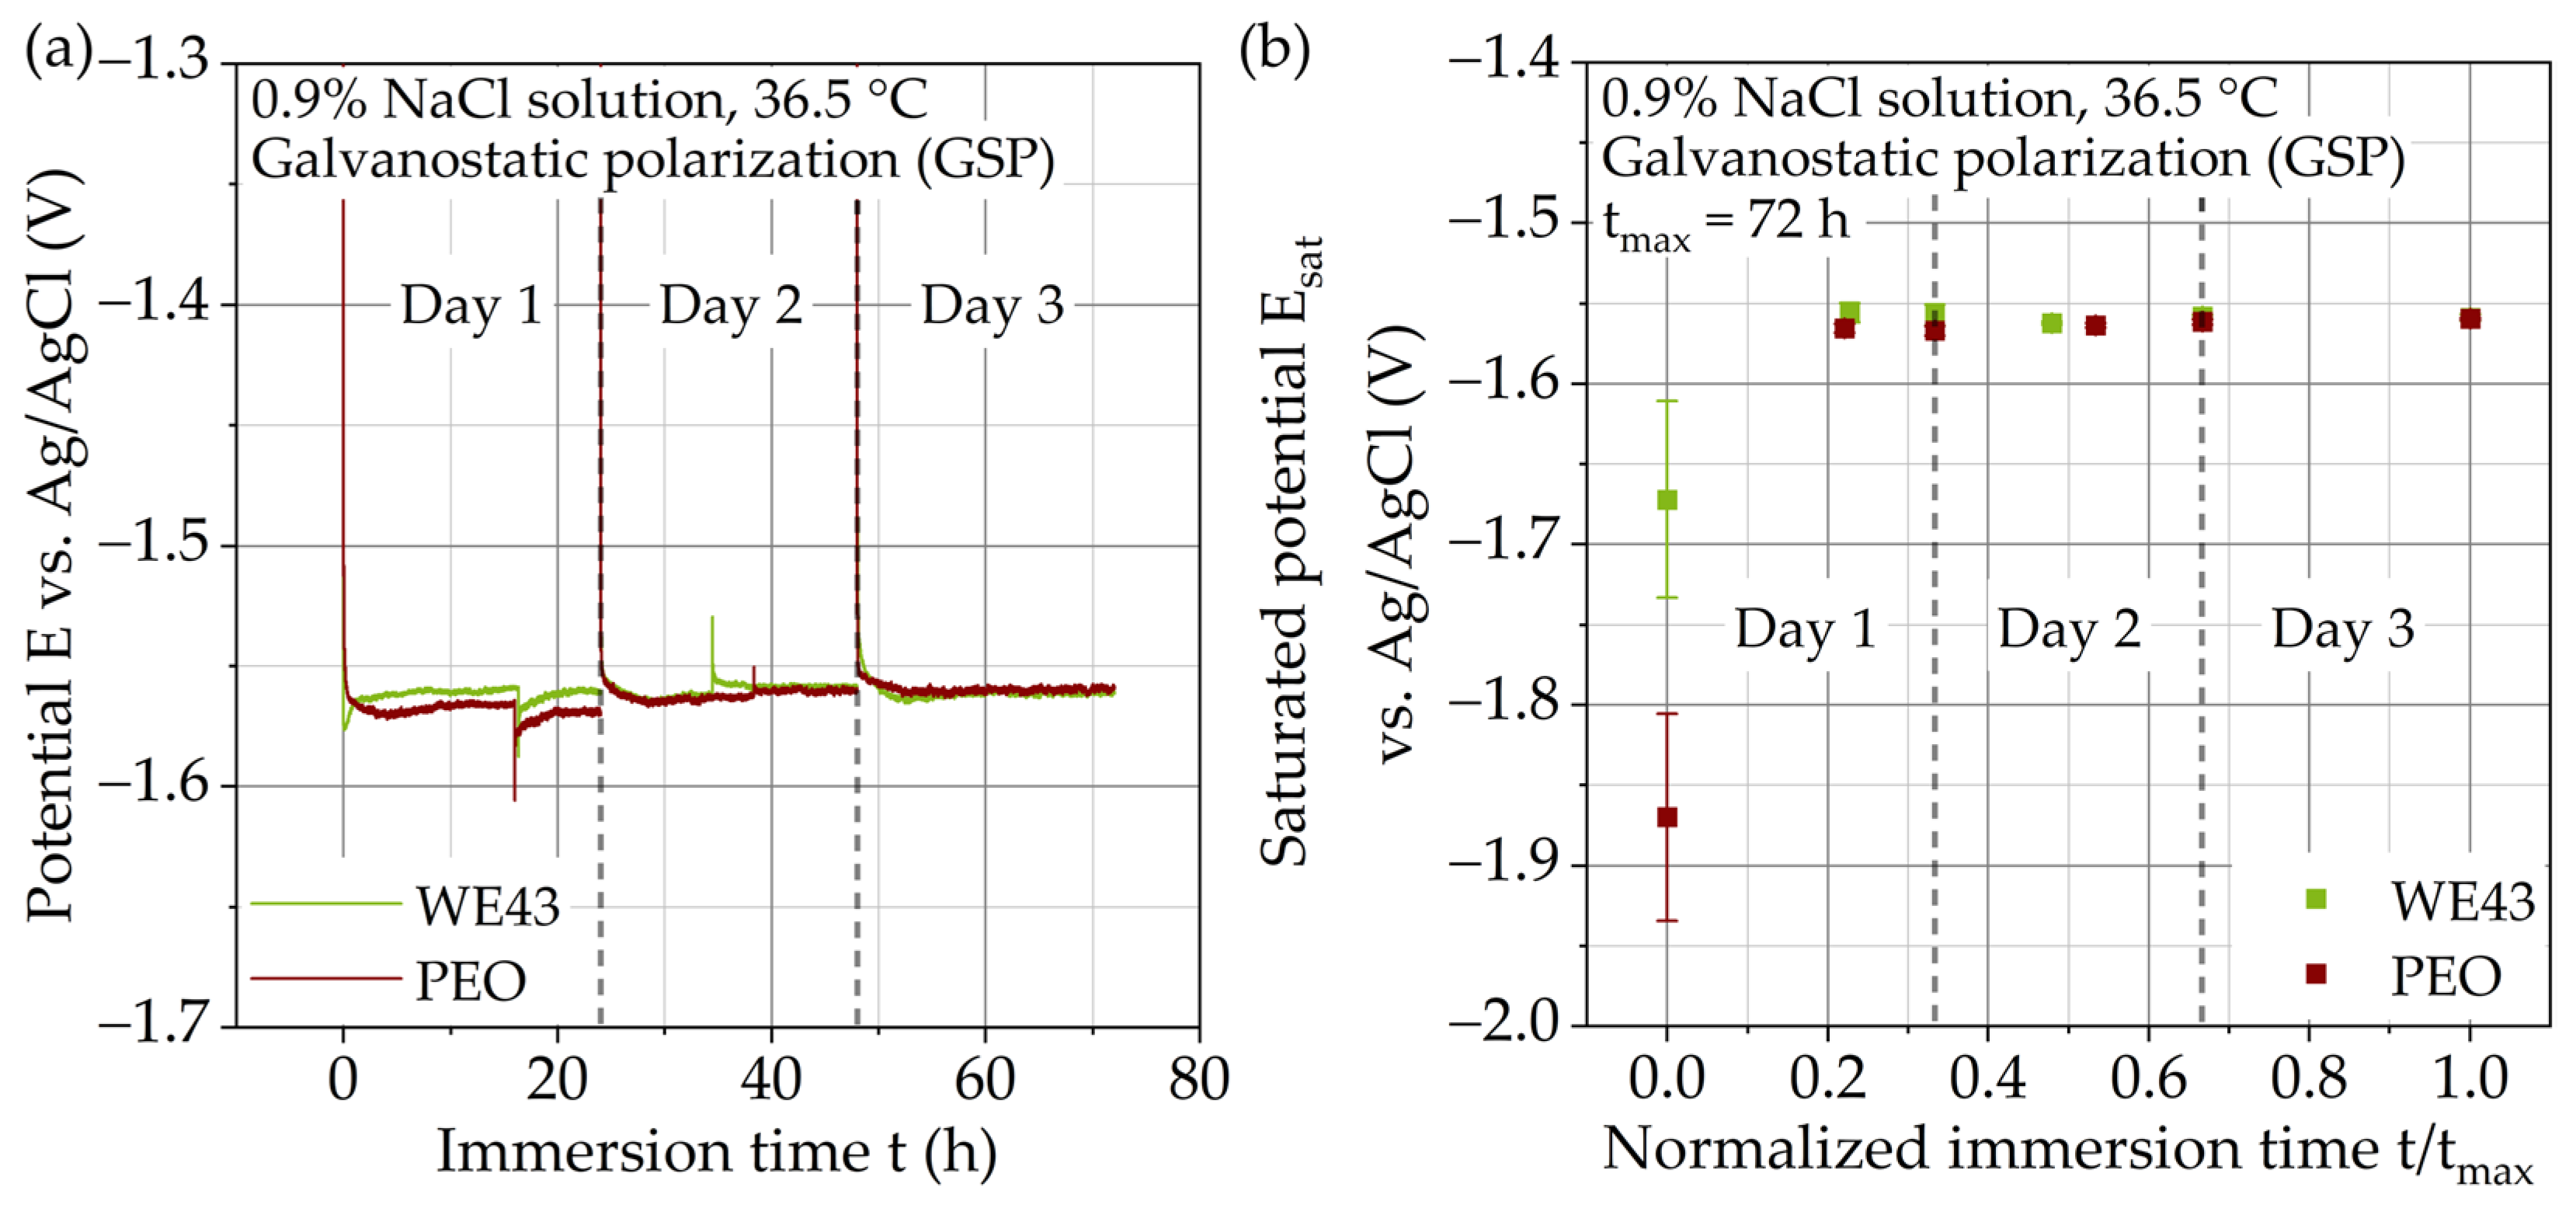
3.2.2. Potential–Time Curves

Figure 9a shows, as an example for both variants, the course of the potential E (vs. Ag/AgCl) during galvanostatic polarization over the immersion time. For each day, the potential decreases vertically, changing into a regressive course afterward. After a respective local minimum, the potential saturates towards higher values. For a changing current density (days 1 and 2), an abrupt potential decrease/increase can be seen. For a lower current density (relative to the previous value), the potential drops and vice versa for higher current densities. In both cases, the potential saturates again afterward. Within the first day, the potential of the PEO modified material exhibits slightly lower values than the substrate material. With increasing immersion time, however, both potentials converge.
To evaluate the saturation behavior, Figure 9b shows the saturated potential Esat plotted over the normalized immersion time t/tmax. Values are averaged with the number of specimens shown in Figure 6. The potential was detected at the end of a period with a constant current density. The time was normalized over the maximum immersion time, making both test series comparable. For t = 0, the values of the open circuit potential (OCP) before applying the polarization were used. Analogous to the potentiodynamic polarization measurements, the PEO modified variant shows a lower OCP. For both material variants, there is a high standard deviation, becoming negligibly small for all subsequent data points (t/tmax > 0). After the first applied current density, the substrate material already exhibits a nearly constant value, which does not change with increasing immersion time. Analogous to the potential–time curves, lower potentials for the PEO variant are evident for the first day before the saturated potential reaches the level of the magnesium alloy.

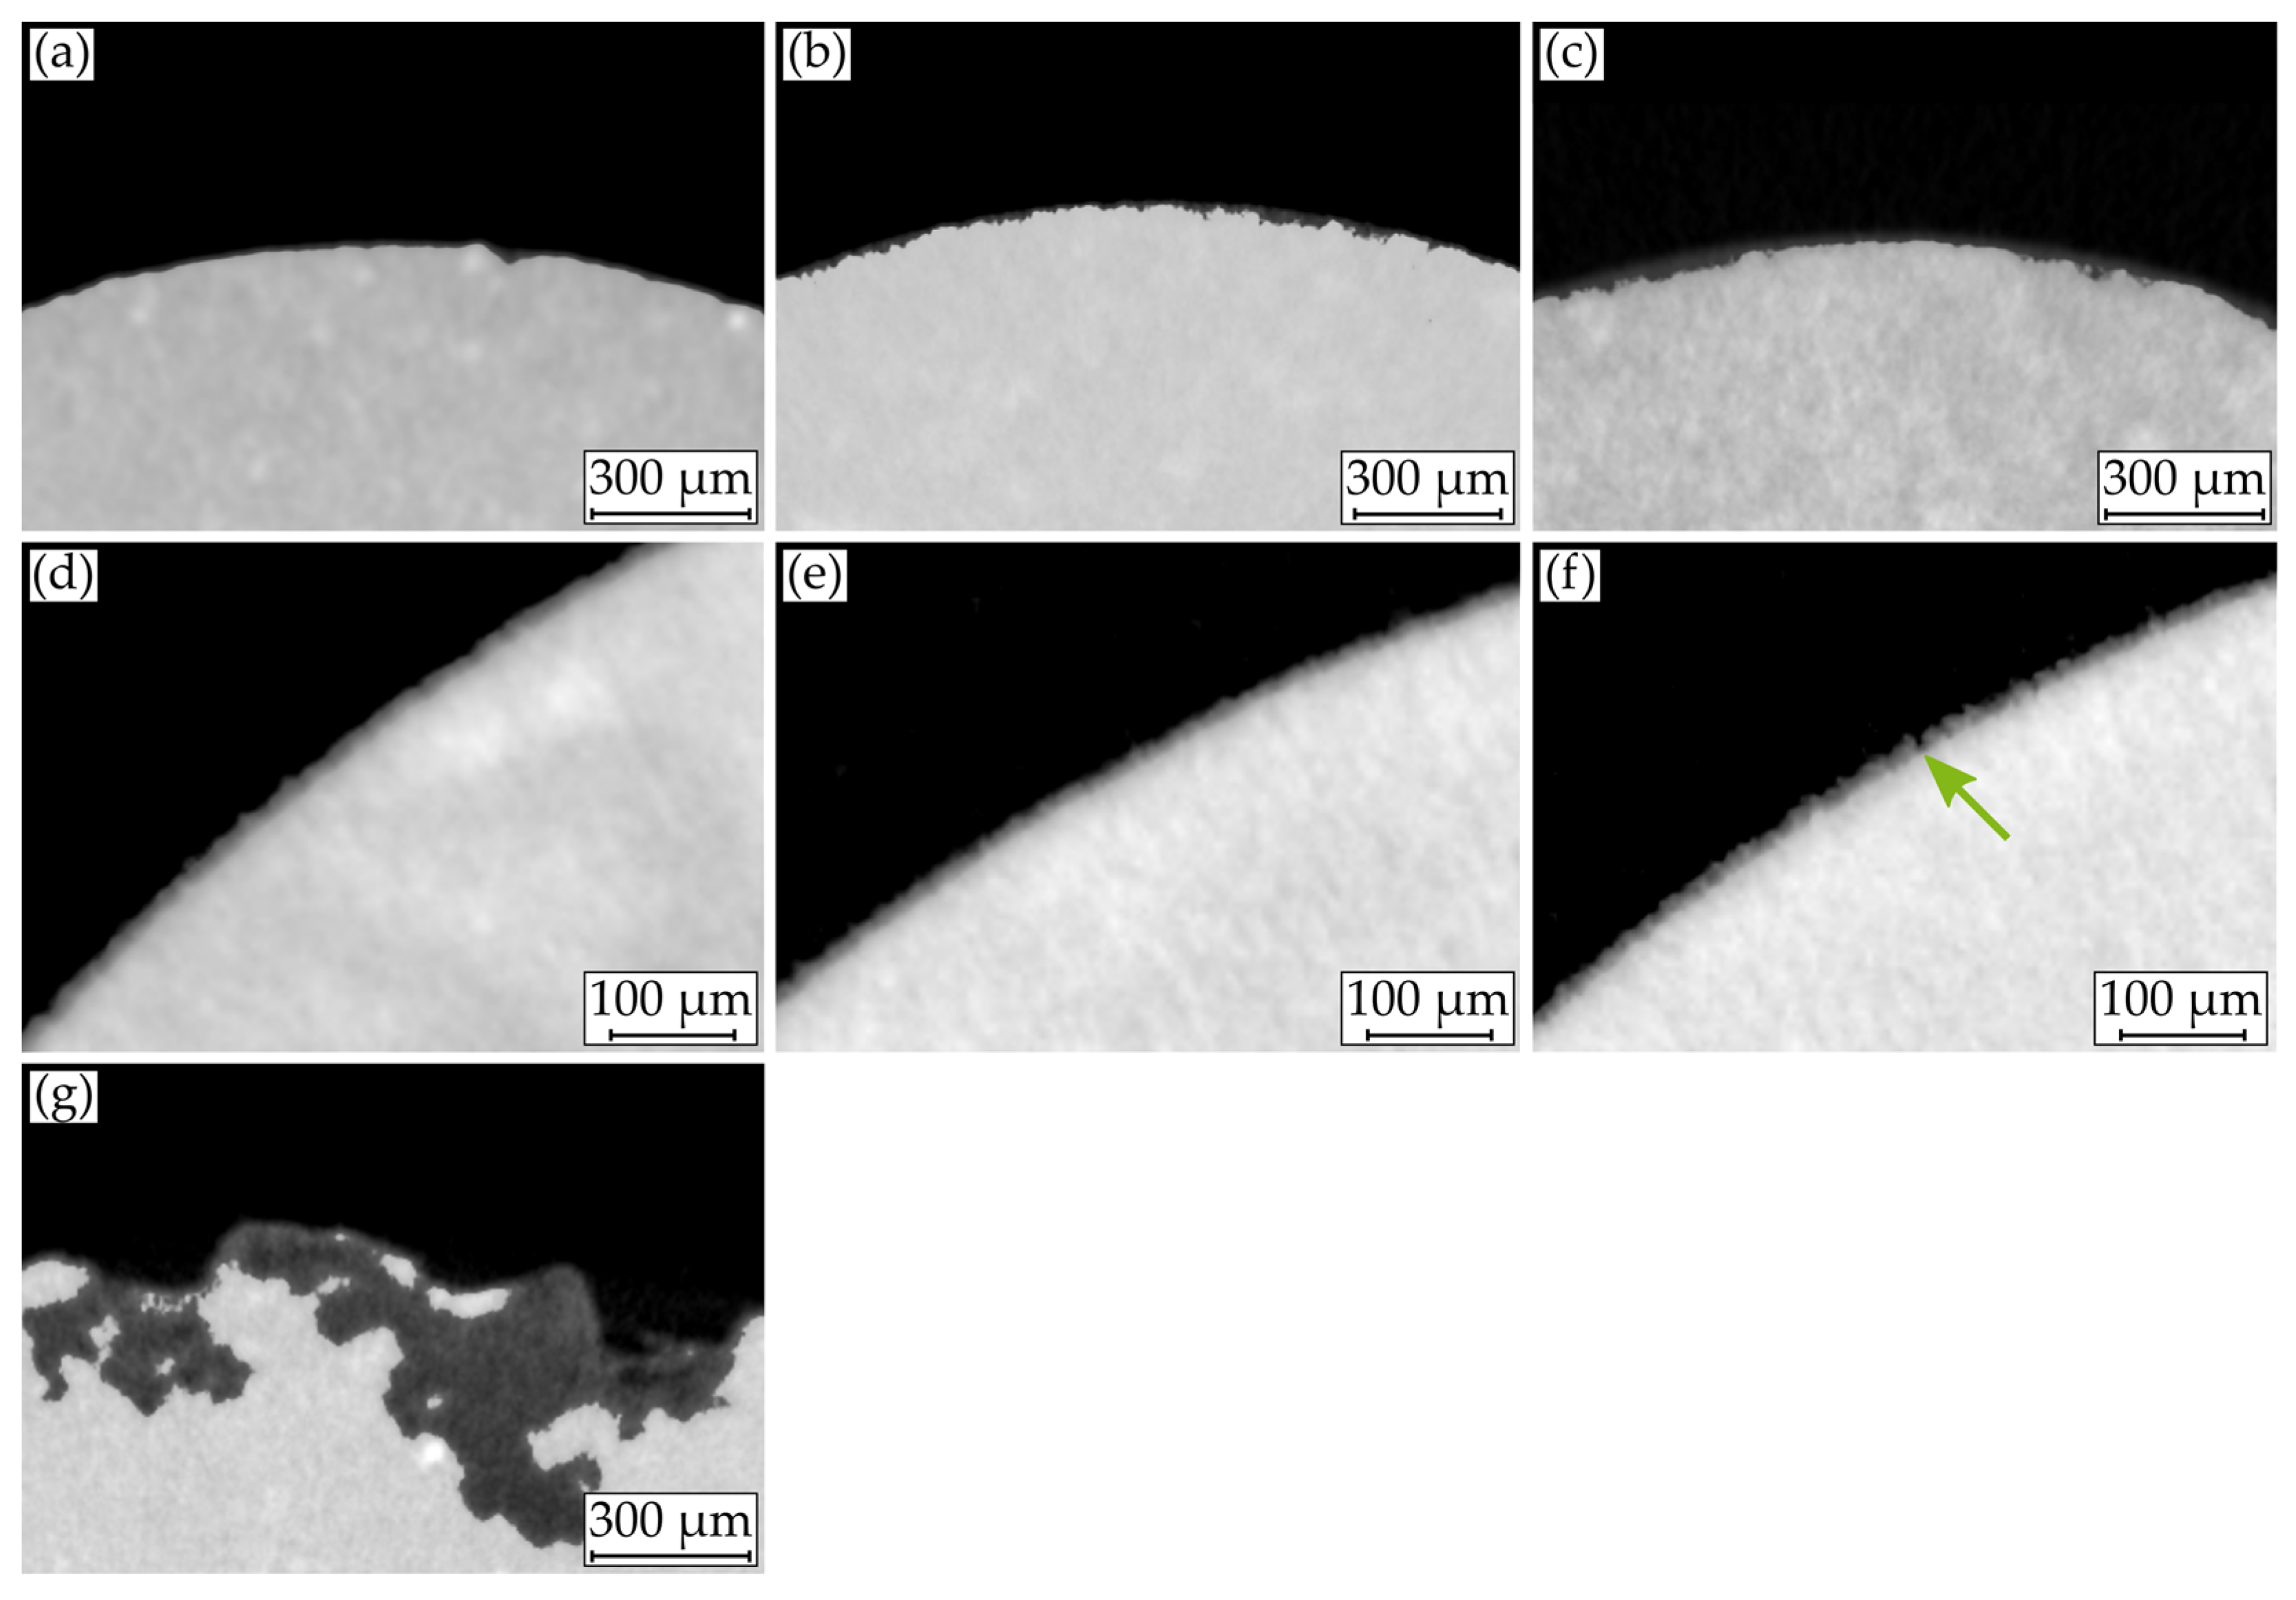
3.3. Macroscopic Corrosion Morphology

Figure 10 and Figure 11 show exemplary cross-sections of the degradation morphologies of both material variants and test strategies. For the unpolarized tests on the substrate material, uniform corrosion is evident (Figure 10a–c). Degradation is homogeneously distributed over the entire circumference, with increasing material degradation and thus small local attacks with increasing immersion time. Individual specimens exhibit pronounced pitting corrosion (Figure 10g) with a branched propagation below the material surface. Due to different densities and thus different gray values, the PEO layer differs from the substrate material (Figure 10d–f). For these specimens, no pronounced corrosion scars are evident. With increasing time, the thickness of the layer seems to decrease slightly. Furthermore, there are local decreases in layer thickness and small penetrations through the layer (Figure 10f). The degradation morphologies of the polarized test strategy deviate from this (Figure 11). Pronounced pitting corrosion occurs over the entire circumference, increasing in severity with immersion time. In the longitudinal section (Figure 10g), it is apparent that the corrosion scars are arranged parallel to the extrusion direction. For cross- and longitudinal sections, the corrosion scars propagate along with the intermetallic precipitates (lighter gray values, see Figure 11a,b). As a result of the degradation, the effective diameters deff decrease by up to 19% (in relation to the nominal initial diameter of 4 mm).

4. Discussion

A first estimation of the degradation behavior and the corrosion current densities using potentiodynamic polarization measurements exhibited differences due to the surface modification (Figure 7a). Both variants showed a tendency towards a passivating behavior at the beginning of the anodic branch, whereby this was maintained over a wide potential range for plasma electrolytic oxidation (PEO) modified specimens. For the substrate material WE43, a region of pronounced anodic dissolution followed immediately after the open circuit potential (OCP). As a result of the PEO modification, a higher degradation resistance was assumed due to the passivation tendency and a better polarizability compared to the substrate material. For both variants, the OCP and the corrosion current densities agreed with those in the literature [23,36,38,39]. The PEO modification reduced the corrosion current density by a factor of 5.
These observations are also reflected in the corrosion rates of the three-week immersion tests (Table 1 [30]). At the beginning of the immersion, higher corrosion rates occurred due to the reactive surface. The corrosion layer formed was porous and allowed the electrolyte access to the surface, fulfilling the assumption according to Song et al. of an accessible surface. With increasing immersion time, a thicker and thus more protective corrosion layer resulted, leading to a decrease in the hydrogen evolution rate (HER) and corrosion rate [22]. This phenomenon is especially observable for Mg-RE alloys [1]. However, for this alloy class, a counteracting effect should also be noted. Due to the formation of intermetallic precipitates and thus micro-galvanic corrosion, the probability of corrosion pitting increases with increasing immersion time (Figure 10g) and consequently an increase in HER [22]. The PEO-modified specimens show a significantly reduced electrochemical and in vitro degradation tendency. A passivating effect was observed, and no pitting corrosion was present. These interrelationships are reflected in the results shown in Table 1 [30] and will be reproduced by applying galvanostatic polarization (GSP) in a shortened time interval. According to Equation (7), the lower corrosion rates result in lower current densities, e.g., for the PEO surface treatment compared to the substrate material. For these immersion tests (Figure 8b)) and according to Shi et al. [24], the cathodic partial reaction and thus the cathodic hydrogen volume was assumed to be negligible, attributing the total hydrogen volume generated to the anodic dissolution. The typical high standard deviations for corrosion tests on magnesium systems were present [20], while the reproducibility of the results was increased by the PEO modification. The results demonstrate that under applied polarization, the generated hydrogen volume took a linear course for a constant current density. The progressive course at the beginning of the respective days is explained by the ongoing formation of gas bubbles on the material surface, since these are released with increasing immersion time and bubble volume [40] and thus can be detected through the eudiometer. This process seemed to be more pronounced for the already degraded and rougher surfaces (days 2 and 3) compared to the polished surface (day 1). For a varying current density, a change in hydrogen evolution rate is visible. Thus, the performed experiments confirmed that it is possible to control the dissolution rate through galvanostatic polarization. The linear relationship between immersion time and hydrogen volume for constant current densities as well as the relationship between increasing current density and increasing HER agree with the literature [24,26] and could also be demonstrated in our own preliminary work on embedded samples [31]. The lower HER for the PEO specimens shows that the qualitative dissolution behavior of this second variant can be controlled by this test strategy.
The potential–time curves (Figure 9a) indicate a passivating behavior under galvanostatic polarization [16]. For a constant current density, the potential saturated with increasing immersion time. This phenomenon was also observed after changing current densities and an accompanying abrupt increase or decrease of the potential. With increasing immersion time and degradation damage, the time required for saturation decreased. Therefore, the saturated potential seems to be independent of the respective current density. Corresponding to the lower OCP (Figure 9b) of the PEO specimens, the saturated potentials initially assumed lower values during polarization. Already on the second day, the potential difference to the substrate material was negligibly small regardless of different current densities. It is assumed that the dissolution behavior of the PEO variant was dominated by the substrate material.
The corrosion morphology of the polarized specimens differs from the unpolarized. As a result of the polarization, pronounced pitting occurred for both material variants (Figure 11). This phenomenon was observed for the immersion tests without polarization only for individual specimens, whereas the majority showed rather uniform corrosion. For the alloy WE43, the tendency to this corrosion mechanism is explained by the inhomogeneous microstructure with zirconium- and yttrium-rich intermetallic precipitates. As a result of local Volta potential differences of about +170 mV (zirconium-rich) and +50 mV (yttrium-rich), micro-galvanic corrosion and thus pitting occurred [41]. This was reflected in the vertical arrangement of the corrosion scars along the extrusion direction leading to an elongated deformation of the precipitates. Micro-galvanic corrosion and thus pitting is subjected to a statistical probability [22] and consequently cannot be observed for every specimen or every time interval. This effect seems to be significantly enhanced by the applied polarization and occurs for every condition. The observations are consistent with the phenomenological model for anodic polarization, according to Thomas et al. [27], describing an increased tendency for localized corrosion due to nobler impurities or precipitates and their cathodic activity. The specimens with PEO modification exhibited a homogeneous degradation behavior in the immersion tests (at OCP). In general, the layer thickness decreased uniformly. In isolated cases, more severe layer damage occurred. Accordingly, lower corrosion rates were present for this variant. The degradation morphology under polarization deviated significantly and was analogous to the polarized magnesium specimens. Only the intensity of the corrosion scars was lower, resulting from the lower applied current densities. Based on these observations, it is assumed that the dissolution behavior is dominated by the substrate material and that the PEO layer has an inferior influence on the hydrogen evolution rate and the degradation morphology with increasing immersion time. This hypothesis is supported by the potential–time curves converging for both variants regardless of the applied current densities to the saturated potential of the magnesium alloy. Due to these dominating material properties and the forced corrosion scar formation, the method is mainly suitable for a worst-case estimation of the substrate material. At this early stage, an estimation of the degradation behavior of the PEO modified specimens is only possible to a limited extent due to the changed morphology.
The measured hydrogen volume (Figure 8) deviated especially for the substrate material from the intended mean hydrogen evolution rate, used to calculate the current densities. This was observed for increasing immersion time such that the difference between the hydrogen volumes at the end of the respective immersion time (t = tmax) was not negligible. Lower deviations were observed for the PEO modification. To allow a quantitative classification of the calculated dissolution rates and thus a comparison with the results of the embedded samples (2D, used to determine Equations (6) and (7), the summarized results are shown in Figure 12.
The dissolution rate m ˙ diss is plotted over the current density i in double-logarithmic representation. The regression line represents Equation (6). In addition to the polarized tests, the results of the immersion tests are also entered; as an approximation, the corrosion current density icorr is used. In general, all data points of the polarized tests coincide with the regression line in a good approximation. The position of the unpolarized test does not seem to have any influence on the polarization results. In this case, the results of WE43 (3D) lie above the regression line, with increasing deviations as the immersion time increases. The PEO (3D) data points show a better overall alignment, but an increased deviation with increasing immersion time is also observed. The deviation is attributed to the decreasing effective cross-section Aff due to progressive anodic dissolution so that the previously calculated current density is applied to an effectively smaller cross-section. Due to this mismatch, the actual test conditions no longer correspond to the mathematically designed target condition. An influence on the hydrogen evolution rate and corrosion scarring cannot be excluded. To simulate not only the qualitative course of the hydrogen evolution and thus the dissolution rate but also the quantitative values, the relationship between current density and dissolution rate will be adjusted in further tests according to the findings generated in this study. An area-related correction factor will be introduced for the deviating dissolution rates with increasing immersion time. The influence of the degradation morphology on the fatigue properties will be characterized so that a statement can be made about the remaining fatigue strength.
Only a few comparable studies exist investigating the influence of galvanostatic polarization on the material behavior of magnesium systems. In their work, Shi et al. [24] determined the relationship between the anodic current density, the hydrogen evolution rate, and the mass loss, but no comparison of the degradation morphologies was performed. Furthermore, polarization was not used to achieve a defined degradation condition or a defined hydrogen volume. The focus has been on the interrelationships and influence of polarization rather than on developing a method to simulate and characterize corrosion behavior. Jafari et al. [42] compared the corrosion fatigue behavior without (at OCP) and with anodic polarization. For the anodic case, a decrease in corrosion fatigue properties was observed independent of the applied stress. This was attributed to the increasing anodic dissolution rate and the resulting corrosion pits. In contrast to the present study, they used a potentiostatic polarization so that the current density, and consequently the dissolution rate, varied during the experimental procedure. A similar approach to adjust the dissolution rate was used by Klein et al. [28]. The determination of the current densities was performed utilizing embedded samples, while the dissolution rates of the subsequent tests on three-dimensional specimens were not compared with those of the two-dimensional samples. It was assumed that the dissolution behavior of both specimen types is consistent and that the dissolution rate is constant over time. The rare earth-containing alloy AE42 was used, observing a strong tendency to corrosion pitting. Analogous to Jafari et al. [42], this led to a significant decrease in corrosion fatigue properties. Here, this phenomenon was interpreted as an inherent material property and not as a consequence of polarization. In contrast to the present study, anodic polarization was used to achieve a constant dissolution rate and not to reproduce the degradation conditions after several weeks of immersion.

5. Conclusions

In this study, the magnesium alloy WE43MEO with and without modification through plasma electrolytic oxidation (PEO) was used to investigate the applicability of a developed short-time testing method to assess long-time immersion behavior. The objective was to reproduce the degradation progress from three-week immersion tests through galvanostatic anodic polarization within three days. The current densities used were designed via an experimentally determined correlation between current density and dissolution rate. As a result of these investigations, the following conclusions can be drawn.
The test method previously developed on simplified (two-dimensional) embedded samples is also applicable to three-dimensional cylindrical specimens. The qualitative course of hydrogen evolution for both material variants can be simulated by anodic polarization. While the substrate material WE43MEO has a dominant influence on the characteristics of both variants, the PEO surface-modified specimens showed significantly decreased electrochemical and in vitro degradation tendencies. This is due to micro-galvanic corrosion and thus the formation of pitting on yttrium- and zirconium-rich precipitates. For the tests without polarization, pronounced pitting occurs only on individual non-modified specimens, whereas after polarization, every specimen is affected. By forcing pitting corrosion, the test method can be considered as a worst-case scenario for the substrate material. At this stage, the electrochemical short-time testing method is not suitable for an accurate simulation of the degradation morphology of PEO modified specimens. By applying anodic polarization, the properties of the substrate material dominated, resulting in pitting. However, this phenomenon was not observed for the three-week immersion tests.

Author Contributions

Conceptualization, methodology, formal analysis, investigation, data curation, writing—original draft preparation, visualization, project administration, N.W.; investigation, J.V.; resources, writing—review and editing, supervision, funding acquisition, F.W. All authors have read and agreed to the published version of the manuscript.

Funding

The authors thank the German Research Foundation (Deutsche Forschungsgemeinschaft, DFG) for its financial support within the research projects “Development and validation of an in vitro short-time testing method for the prediction of the in vivo behavior of absorbable metallic implant materials” (SM 214/4-1, WA 1672/40-1, project no. 394479422) and “Mechanism-based characterization of the texture influence on the corrosion and corrosion fatigue properties of zinc-based wrought magnesium alloys” (LE 1395/13-1, WA 1672/93-1, project no. 461435286).

Institutional Review Board Statement

Not applicable.

Informed Consent Statement

Not applicable.

Data Availability Statement

Not applicable.

Acknowledgments

The authors thank the German Research Foundation (Deutsche Forschungsgemeinschaft, DFG) for the contribution of the “Focused ion beam scanning electron microscope” (INST 212/402-1 FUGG) and Marina Macias Barrientos (WPT) for her support in the preparation of FIB-SEM images.

Conflicts of Interest

The authors declare no conflict of interest.

References

  1. Chen, Y.; Xu, Z.; Smith, C.; Sankar, J. Recent advances on the development of magnesium alloys for biodegradable implants. Acta Biomater. 2014, 10, 4561–4573. [Google Scholar] [CrossRef]
  2. Staiger, M.P.; Pietak, A.M.; Huadmai, J.; Dias, G. Magnesium and its alloys as orthopedic biomaterials: A review. Biomaterials 2006, 27, 1728–1734. [Google Scholar] [CrossRef] [PubMed]
  3. Wolf, F.I.; Cittadini, A. Chemistry and biochemistry of magnesium. Mol. Aspects Med. 2003, 24, 3–9. [Google Scholar] [CrossRef]
  4. Jahnen-Dechent, W.; Ketteler, M. Magnesium basics. Clin. Kidney J. 2012, 5, i3–i14. [Google Scholar] [CrossRef] [Green Version]
  5. Saris, N.E.; Mervaala, E.; Karppanen, H.; Khawaja, J.A.; Lewenstam, A. Magnesium: An updated on physiological, clinical and analytical aspects. Clin. Chim. Acta 2000, 294, 1–26. [Google Scholar] [CrossRef]
  6. Farraro, K.F.; Kim, K.E.; Woo, S.L.; Flowers, J.R.; McCullough, M.B. Revolutionizing orthopaedic biomaterials: The potential of biodegradable and bioresorbable magnesium-based materials for functional tissue engineering. J. Biomech. 2014, 47, 1979–1986. [Google Scholar] [CrossRef] [PubMed] [Green Version]
  7. Song, A.; Atrens, A. Understanding Magnesium corrosion−A framework for improved alloy performance. Adv. Eng. Mater. 2003, 5, 837–858. [Google Scholar] [CrossRef]
  8. Singh Raman, R.K.; Jafari, S.; Harandi, S.E. Corrosion fatigue fracture of magnesium alloys in bioimplant applications: A review. Eng. Fract. Mech. 2015, 137, 97–108. [Google Scholar] [CrossRef]
  9. Byun, S.-H.; Lim, H.-K.; Cheon, K.-H.; Lee, S.-M.; Kim, H.E.; Lee, J.-H. Biodegradable magnesium alloy (WE43) in bone-fixation plate and screw. J. Biomed. Mater. Res. 2020, 108, 2505–2510. [Google Scholar] [CrossRef] [PubMed] [Green Version]
  10. Krüger, D.; Galli, S.; Zeller-Plumhoff, B.; Wieland, F.; Peruzzi, N.; Wiese, B.; Heuser, P.; Moosmann, J.; Wennerberg, A.; Willumeit-Römer, R. High-resolution ex vivo analysis of the degradation and osseointegration of Mg-xGd implant screws in 3D. Bioact. Mater. 2022, 13, 37–52. [Google Scholar] [CrossRef]
  11. Rendenbach, C.; Fischer, H.; Kopp, A.; Schmidt-Bleek, K.; Kreiker, H.; Stumpp, S.; Thiele, M.; Duda, G.; Hanken, H.; Beck-Broichsitter, B.; et al. Improved in vivo osseointegration and degradation behavior of PEO surface-modified WE43 magnesium plates and screws after 6 and 12 months. Mater. Sci. Eng. C 2021, 129, 112380. [Google Scholar] [CrossRef] [PubMed]
  12. Shadanbaz, S.; Walker, J.; Staiger, M.P.; Dias, G.J.; Pietak, A. Growth of calcium phosphates on magnesium substrates for corrosion control in biomedical applications via immersion techniques. J. Biomed. Mater. Res. B. Appl. Biomater. 2013, 101, 162–172. [Google Scholar] [CrossRef] [PubMed]
  13. Yang, G.F.; Kim, Y.C.; Han, H.S.; Lee, G.C.; Seok, H.K.; Lee, J.C. In vitro dynamic degradation behavior of new magnesium alloy for orthopedic applications. J. Biomed. Mater. Res. B Appl. Biomater. 2015, 103, 807–815. [Google Scholar] [CrossRef]
  14. Nidadavolu, E.P.S.; Feyerabend, F.; Ebel, T.; Willumeit-Romer, R.; Dahms, M. On the determination of magnesium degradation rates under physiological conditions. Materials 2016, 9, 627. [Google Scholar] [CrossRef] [Green Version]
  15. Sanchez, A.H.M.; Luthringer, J.C.; Feyerabend, F.; Willumeit, R. Mg and Mg alloys: How comparable are in vitro and in vivo corrosion rates? A review. Acta Biomater. 2015, 13, 16–31. [Google Scholar] [CrossRef] [PubMed] [Green Version]
  16. Zhang, Y.; Huang, Y.; Chen, X.; Luthringer-Feyerabend, B.; Xue, J.; Zander, D.; Willumeit-Römer, R.; Kainer, K.U.; Hort, N. Revisiting the tolerance limit of Fe impurity in biodegradable magnesium. Scripta Mater. 2022, 212, 114509. [Google Scholar] [CrossRef]
  17. Öcal, E.B.; Esen, Z.; Aydinol, K.; Dericioglu, A.F. Comparison of the short and long-term degradation behaviors of as-cast pure Mg, AZ91 and WE43 alloys. Mater. Chem. Phys. 2020, 241, 122350. [Google Scholar] [CrossRef]
  18. Cui, L.-Y.; Cheng, S.-C.; Liang, L.-X.; Zhang, J.-C.; Li, S.-Q.; Wang, Z.-L.; Zeng, R.-C. In vitro corrosion resistance of layer-by-layer assembled polyacrylic acid multilayers induced Ca-P coating on magnesium alloy AZ31. Bioact. Mater. 2020, 5, 153–163. [Google Scholar] [CrossRef] [PubMed]
  19. Hou, R.; Victoria-Hernandez, J.; Jiang, P.; Willumeit-Römer, R.; Luthringer-Feyerabend, B.; Yi, S.; Letzig, D.; Feyerabend, F. In vitro evaluation of the ZX11 magnesium alloy as potential bone plate: Degradability and mechanical integrity. Acta Biomater. 2019, 97, 608–622. [Google Scholar] [CrossRef] [PubMed]
  20. Van Gaalen, K.; Gremse, F.; Benn, F.; McHugh, P.E.; Kopp, A.; Vaughan, T.J. Automated ex-situ detection of pitting corrosion and its effect on the mechanical integrity of rare earth magnesium alloy—WE43. Bioact. Mater. 2022, 8, 545–558. [Google Scholar] [CrossRef] [PubMed]
  21. Zheng, F.; Rassat, S.D.; Helderandt, D.J.; Caldwell, D.D.; Aardahl, C.L.; Autrey, T.; Linehan, J.C.; Rappe, K.G. Automated gas burette system for evolved hydrogen measurements. Rev. Sci. Instrum. 2008, 79, 084103. [Google Scholar] [CrossRef]
  22. Ascencio, M.; Pekguleryuz, M.; Omanovic, S. An investigation of the corrosion mechanisms of WE43 Mg alloy in a modified simulated body fluid solution: The influence of immersion time. Corr. Sci. 2014, 87, 489–503. [Google Scholar] [CrossRef]
  23. Esmaily, M.; Zeng, Z.; Mortazavi, A.N.; Gullino, A.; Choudhary, S.; Derra, T.; Benn, F.; D’Elia, F.; Müther, M.; Thomas, S.; et al. A detailed microstructural and corrosion analysis of magnesium alloy WE43 manufactured by selective laser melting. Addit. Manuf. 2020, 35, 101312. [Google Scholar] [CrossRef]
  24. Shi, Z.; Jia, J.X.; Atrens, A. Galvanostatic anodic polarization of WE43. J. Magnes. Alloy. 2014, 2, 197–202. [Google Scholar] [CrossRef] [Green Version]
  25. Shi, Z.; Jia, J.X.; Atrens, A. Galvanostatic polarization curves and galvanic corrosion of high purity Mg in 3.5% NaCl saturated with Mg(OH)2. Corr. Sci. 2012, 60, 296–308. [Google Scholar] [CrossRef]
  26. Huang, J.; Song, G.-L.; Zhu, Y.; Zheng, D.; Wang, Z. The anodically polarized Mg surface products and accelerated hydrogen evolution. J. Magnes. Alloy. 2022; in press. [Google Scholar] [CrossRef]
  27. Thomas, S.; Medhekar, N.V.; Frankel, G.S.; Birbilis, N. Corrosion mechanism and hydrogen evolution on Mg. Curr. Opin. Solid State Mater. Sci. 2015, 19, 85–94. [Google Scholar] [CrossRef]
  28. Klein, M.; Frieling, G.; Walther, F. Corrosion fatigue assessment of creep-resistant magnesium alloys DieMag422 and AE42. Eng. Fract. Mech. 2017, 185, 33–45. [Google Scholar] [CrossRef]
  29. Jung, O.; Porchetta, D.; Schroeder, M.-L.; Klein, M.; Wegner, N.; Walther, F.; Feyerabend, F.; Barbeck, M.; Kopp, A. In vivo simulation of magnesium degradability using a new fluid dynamic bench testing approach. Int. J. Mol. Sci. 2019, 20, 4859. [Google Scholar] [CrossRef] [PubMed] [Green Version]
  30. Hartjen, P.; Wegner, N.; Ahmadi, P.; Matthies, L.; Nada, O.; Fuest, S.; Yan, M.; Knipfer, C.; Gosau, M.; Walther, F.; et al. Toward tailoring the degradation rate of magnesium-based biomaterials for various medical applications: Assessing corrosion, cytocompatibility and immunological effects. Int. J. Mol. Sci. 2021, 22, 971. [Google Scholar] [CrossRef]
  31. Wegner, N.; Walther, F. Assessment of galvanostatic anodic polarization to accelerate the corrosion of the bioresorbable magnesium alloy WE43. Appl. Sci. 2021, 11, 2128. [Google Scholar] [CrossRef]
  32. Zeng, Z.; Stanford, N.; Davies, C.H.J.; Nie, J.-F.; Birbilis, N. Magnesium extrusion alloys: A review of developments and prospects. Int. Mater. Review 2019, 64, 27–62. [Google Scholar] [CrossRef]
  33. Imandoust, A.; Barrett, C.D.; Al-Samman, T.; Inal, K.A.; El Kadiri, H. A review on the effect of rare-earth elements on texture evolution during processing of magnesium alloys. J. Mater. Sci. 2017, 52, 1–29. [Google Scholar] [CrossRef]
  34. Xiang, C.; Gupta, N.; Coelho, P.; Cho, K. Effect of microstructure on tensile and compressive behavior of WE43 alloy in as cast and heat treated conditions. Mater. Sci. Eng. A 2018, 710, 74–85. [Google Scholar] [CrossRef]
  35. Mraied, H.; Wang, W.; Cai, W. Influence of chemical heterogeneity and microstructure on the corrosion resistance of biodegradable WE43 magnesium alloys. J. Mater. Chem. B 2019, 7, 6399–6411. [Google Scholar] [CrossRef] [PubMed]
  36. Darband, B.; Aliofkhazraei, M.; Hamghalam, P.; Valizade, N. Plasma electrolytic oxidation of magnesium and its alloys: Mechanism, properties and applications. J. Magnes. Alloy. 2017, 5, 74–132. [Google Scholar] [CrossRef]
  37. Krüger, D.; Zeller-Plumhoff, B.; Wiese, B.; Yi, S.; Zuber, M.; Wieland, F.; Moosmann, J.; Willumeit-Römer, R. Assessing the microstructure and in vitro degradation behavior of Mg-xGd srew implants using µCT. J. Magnes. Alloy. 2021, 9, 2207–2222. [Google Scholar] [CrossRef]
  38. Arrabal, R.; Matykina, E.; Viejo, F.; Skeldon, P.; Thompson, G.E. Corrosion resistance of WE43 and AZ91D magnesium alloys with phosphate PEO coating. Corr. Sci. 2008, 50, 1744–1752. [Google Scholar] [CrossRef]
  39. Bahmani, A.; Arthanari, S.; Shin, K.S. Formulation of corrosion rate of magnesium alloys using microstructural parameters. J. Magnes. Alloy. 2020, 8, 134–149. [Google Scholar] [CrossRef]
  40. Yang, Y.; Scenini, F.; Curioni, M. A study on magnesium corrosion by real-time imaging and electrochemical methods: Relationship between local processes and hydrogen evolution. Electrochim. Acta 2016, 198, 174–184. [Google Scholar] [CrossRef]
  41. Coy, A.E.; Viejo, F.; Skeldon, P.; Thompson, G.E. Susceptibility of rare-earth-magnesium alloys to micro-galvanic corrosion. Corr. Sci. 2010, 52, 3896–3906. [Google Scholar] [CrossRef]
  42. Jafari, S.; Singh Raman, R.K.; Davies, C.H.J. Corrosion fatigue of magnesium alloy in modified simulated body fluid. Eng. Fract. Mech. 2015, 137, 2–11. [Google Scholar] [CrossRef]
Figure 1. Specimen geometry for immersion test with galvanostatic polarization (all values in mm).
Metals 12 00591 g001
Figure 2. (a,b) Cross-sectional microstructure of WE43 with EDS mappings of (c) magnesium (Mg), (d) neodymium (Nd), (e) yttrium (Y), and (f) zirconium (Zr). Investigations performed with a focused ion beam scanning electron microscope (FIB-SEM, Crossbeam XB 550L, Carl Zeiss AG, Oberkochen, Germany).
Metals 12 00591 g002
Figure 3. Longitudinal microstructure of WE43 with EDS mappings of magnesium (Mg), neodymium (Nd), and yttrium (Y). Investigations performed with a focused ion beam scanning electron microscope (FIB-SEM, Crossbeam XB 550L, Carl Zeiss AG, Oberkochen, Germany).
Metals 12 00591 g003
Figure 4. Microstructure of the plasma electrolytic oxidation (PEO) layer: (a) SEM image of top view; (b) SEM image of cross-section with marked cracks (1), arbitrarily formed (2), and circular pores (3). Investigations performed with a scanning electron microscope (SEM, Mira 3 XMU, Tescan GmbH, Dortmund, Germany).
Metals 12 00591 g004
Figure 5. General experimental setup for the corrosion investigation. The temperature control unit is not shown for reasons of clarity.
Metals 12 00591 g005
Figure 6. Experimental procedure and number of specimens for each time interval.
Metals 12 00591 g006
Figure 7. WE43 and WE43 PEO in 0.9% NaCl solution at 36.5 °C: (a) potentiodynamic polarization measurements; (b) immersion tests with galvanostatic polarization (GSP).
Metals 12 00591 g007
Figure 8. Mean hydrogen evolution of immersion tests at open circuit potential (OCP) and with galvanostatic polarization (GSP) in 0.9% NaCl solution at 36.5 °C: (a) WE43; (b) WE43 PEO.
Metals 12 00591 g008
Figure 9. Immersion tests with galvanostatic polarization (GSP) on WE43 and WE43 PEO in 0.9% NaCl solution at 36.5 °C: (a) potential–time curves; (b) mean saturated potential.
Metals 12 00591 g009
Figure 10. µ-computed tomography images after immersion tests without galvanostatic anodic polarization of WE43 (ac,g) and WE43 PEO (df): (a,d) 1 week; (b,e) 2 weeks; (c,f,g) 3 weeks.
Metals 12 00591 g010
Figure 11. µ-computed tomography images after immersion tests with galvanostatic anodic polarization of WE43 (ac,g) and WE43 PEO (df): (a,d,g) 1 day; (b,e) 2 days; (c,f) 3 days.
Metals 12 00591 g011
Figure 12. Immersion tests on WE43 and WE43 PEO (cylindrical (3D) and embedded (2D) specimens) in 0.9% NaCl solution at 36.5 °C. Dissolution rates calculated via hydrogen evolution rate (HER) of immersion tests with and without galvanostatic anodic polarization. Results of the embedded samples originate from [31].
Metals 12 00591 g012
Table 1. Data for the design of immersion tests with galvanostatic polarization on WE43 and WE43 PEO in 0.9% NaCl solution at 36.5 °C.
MaterialCorrosion Rate m ˙ corr
(103 mg cm−2 a−1) [30]
Time Interval (h)Current Density i
(mA cm−2)
t0ta
WE430.210–114.40–16.31.05
0.12144.4–241.516.3–34.50.61
0.18241.5–50434.5–720.94
WE43 PEO0.150–111.60–15.90.77
0.07111.6–268.515.9–38.40.41
0.09268.5–50438.4–720.51
Table 2. Immersion tests with galvanostatic polarization on Mg WE43 and WE43 PEO in 0.9% NaCl solution at 36.5 °C.
MaterialTime Interval t (h)Current Density I
(mA cm−2)
Dissolution Rate m ˙ diss (103 mg cm−2 a−1)
WE430–16.71.051.73
16.7–240.611.33
24–34.40.611.24
34.4–480.942.54
48–720.942.09
WE43 PEO0–16.70.771.02
16.7–240.410.83
24–38.80.410.51
38.8–480.511.11
48–720.511.05
Publisher’s Note: MDPI stays neutral with regard to jurisdictional claims in published maps and institutional affiliations.

