Article

Hydrogen Insertion into Complex-Phase High-Strength Steel during Atmospheric Corrosion at Low Relative Humidity

1
CEST Competence Centre for Electrochemistry and Surface Technology, 4020 Linz, Austria
2
Voestalpine Stahl GmbH, 4020 Linz, Austria
3
Technopark Kralupy, University of Chemistry and Technology Prague, 166 28 Prague, Czech Republic
4
Czech Academy of Sciences, 117 20 Prague, Czech Republic
5
Zentrum für Oberflächen- und Nanoanalytik, Johannes Kepler University Linz, 4040 Linz, Austria
6
Institute of Chemical Technology of Inorganic Materials, Johannes Kepler University Linz, 4040 Linz, Austria
7
Institute for Polymer Science, Johannes Kepler University Linz, 4040 Linz, Austria
*
Author to whom correspondence should be addressed.
Metals 2022, 12(4), 624; https://doi.org/10.3390/met12040624
Submission received: 9 March 2022 / Revised: 31 March 2022 / Accepted: 1 April 2022 / Published: 4 April 2022
(This article belongs to the Section Metal Failure Analysis)

Abstract

:
Atmospheric corrosion is one of the major sources of hydrogen in a high-strength-steel product in service. Even low concentrations of absorbed hydrogen can cause a hydrogen embrittlement-related material degradation. The extent of atmospheric corrosion and thus the related hydrogen entry is highly dependent on the environmental parameters, such as the relative humidity. The present work focused on the hydrogen entry at low relative humidity, where atmospheric corrosion rates are expected to be low. Hydrogen insertion and distribution in CP1000 steel induced by corrosion under dried and rewetted single droplets of aqueous NaCl and MgCl2 solution were studied using the Scanning Kelvin Probe (SKP) and the resulting amounts of diffusible hydrogen were analyzed using thermal desorption mass spectrometry (TDMS). Corrosion product analyses were carried out with SEM/EDX, XRD, and Mössbauer spectroscopy. The results revealed the strong impact of salt type and concentration on the hydrogen entry into steel. The hygroscopic effect of MgCl2 and the formed corrosion products were responsible for the prolonged insertion of hydrogen into the steel even at very low levels of relative humidity.

1. Introduction

Advanced high-strength steels (AHSS) are, as lightweight design materials, an essential component of the modern automotive industry, guaranteeing the highest safety standards while contributing to the compliance with CO2 targets by weight reduction of the car bodies. However, it is known that AHSS can be sensitive to hydrogen embrittlement associated with a certain deterioration of mechanical properties, which is difficult to predict [1,2,3,4]. The clarification of hydrogen insertion processes for high-strength steels in service is therefore of great relevance, raising the need for methods with, on the one hand, high sensitivity to hydrogen and, on the other hand, an increased spatial resolution. The Scanning Kelvin Probe (SKP) was repeatedly proven to be an essential tool to visualize hydrogen diffusivity and distribution in Pd [5,6,7,8], as well as iron and steel [9,10,11,12].
Another advantage of SKP is that it is able to monitor hydrogen, which is inserted during corrosive processes, especially during atmospheric corrosion [13,14,15]. This type of corrosion is of special importance as it affects a large share of steel products in service. It is highly dependent on the environmental conditions, involving various accelerating factors such as the relative humidity or concentration of pollutant gases. In recent years, variations in the “Evans droplet” experiment [16] have been applied to include effects of salt type, concentration, droplet size, and hydrodynamics into the description of this basic element of atmospheric corrosion. Soulié et al. documented the differences in corrosive processes for evaporating sessile droplets of 1 M and 1 mM NaCl solutions on an Fe surface and found that pits, resulting from anodic metal dissolution when a critical chloride concentration was exceeded, were located exclusively at the periphery of the droplet at low initial salt concentration, whereas at higher salt concentrations, pitting occurs over the entire droplet area [17]. Risteen et al. observed strong effects of the size of NaCl aerosol droplets on steel with inconsistent corrosion behavior of drop sizes below 100 µm, but reproducible corrosive loss under droplets larger than 150 µm [18]. Advanced methods developed in recent years were the driving force for further insights into atmospheric corrosion processes [19,20,21,22] and wetting behavior of salt solution droplets on metal surfaces [23,24]. The processes occurring on a metal surface during atmospheric corrosion are greatly affected by the relative humidity. Maxima in corrosion rates were observed during drying of the metal surface until the corrosion rates approached very low levels for the finally dry surface [25,26]. Schindelholz et al. studied the effect of relative humidity on corrosion of steel, contaminated with NaCl [27], as well as MgCl2 and sea water [28]. It was shown that corrosion processes continue even far below the deliquescence relative humidity of the applied salt solutions found in the literature [29]. The findings underline the necessity of studying corrosion processes even at low relative humidity levels where the corrosive degradation of materials is often declared as negligible. The same applies for the hydrogen insertion as a side reaction of atmospheric corrosion [30,31,32,33,34] as it is known that also low concentrations of hydrogen can lead to a deterioration of mechanical properties in the case of the application of tensile stress for materials that are susceptible to hydrogen embrittlement.
As mentioned above, susceptibility to a hydrogen-related deterioration of mechanical properties is known for the group of AHSS [3], which includes, amongst others, complex-phase (CP) steel, which is investigated in this study, dual-phase (DP), as well as transformation-induced-plasticity (TRIP) steels. These grades of steels have a multi-phase microstructure in common, consisting of ferrite and martensite in the case of DP steel and ferrite, and martensite plus bainite in the case of CP steel [35]. Additionally, retained austenite is present, with low contents in the case of CP and DP steel, and increased contents for TRIP steel. Comparing DP and CP steels with the same ultimate tensile strength, similarities could be shown in terms of chemical composition as well as hydrogen diffusion [36]. It is therefore assumed that the results from this study can at least be extrapolated to DP steel grades.
In this study, SKP was used to monitor the hydrogen distribution resulting from local salt-induced corrosion at low relative humidity. In this manner, the influence of the type of salt and concentration effects were determined, including quantitative hydrogen determination by thermal desorption mass spectrometry (TDMS) and analysis of the resulting corrosion products by means of scanning electrochemical microscopy (SEM), X-ray diffraction (XRD), and Mössbauer spectroscopy.

2. Materials and Methods

The material investigated in this study was a complex phase (CP) steel with a tensile strength of 980 MPa (CP1000) with dimensions of 100 mm × 30 mm × 0.79 mm. The chemical composition of the steel is described in Table 1. All samples were degreased with isopropanol (per analysis, Carl Roth, Karlsruhe, Germany) for 5 min in an ultrasonic bath. A microstructural analysis of the steel and description of the hydrogen diffusion coefficient of the investigated CP1000 steel are presented elsewhere [35,36].

2.1. Scanning Kelvin Probe

For the in situ monitoring of hydrogen inserted during salt-induced atmospheric corrosion with SKP (Wicinski-Wicinski GbR, Erkrath, Germany), droplets of 5 µL of aqueous salt solutions of either NaCl or MgCl2 (per analysis, Carl Roth, Karlsruhe, Germany) in three different concentrations (0.001, 0.01, and 0.1 molar (M)) were positioned vertically aligned at a distance of 5 mm from one side of the steel sheet with a microliter pipette (Eppendorf, Hamburg, Germany). This sample side acted as the hydrogen entry side. The samples were placed with the reverse side of the sample (hydrogen exit side) upwards on two stainless-steel sample holders on the SKP sample stage, supporting the sample at the left and right edges and therefore preventing the direct contact between the SKP stage and the corroding side of the sample. The hydrogen exit side of the sample was repeatedly scanned with the SKP tip (Cr-Ni, 300 µm diameter) on an area of 20 mm × 20 mm, exactly opposite to the area with the applied salt droplets on the hydrogen entry side, automatically maintaining a mean distance of 15 µm between the tip and sample surface. The tip was calibrated against Cu/CuSO4,aq.sat. beforehand for correlation of the measured contact potential difference (CPD) with the electrochemical potential scale. The experiments were carried out at 25 °C in laboratory air. The relative humidity (RH) within the SKP sample chamber was kept below 20% and, thus, well below the deliquescence relative humidity (DRH) of both salts found in the literature (see Table 2). After 96 h, the SKP scans were interrupted and the samples were exposed to 85% RH for 3 h, before the SKP experiments were continued at RH below 20%.

2.2. Hydrogen Content

For evaluation of the CPD changes observed during the SKP scans in terms of hydrogen amount in the samples, measurements with a TDMS were performed. A hydrogen analyzer (Galileo G8, Bruker, Billerica, MA, USA) coupled to a customized quadrupole mass spectrometer (GAM200, InProcess Instruments, Bremen, Germany), equipped with an IR furnace for heat treatment of the samples, was used for this purpose. To obtain a detectable amount of hydrogen, samples were cut into 20 mm × 100 mm sized pieces and 10 × 5 µL droplets of the same salt solution were applied onto one sample side, again vertically aligned at a distance of 5 mm to each other. The samples were kept at the same conditions as in the SKP measurements. Prior to the isothermal TDMS measurement at 350 °C, the corrosion products were removed by pickling in hydrochloric acid solution (1:1 dilution of concentrated HCl, 37%, Carl Roth, Karlsruhe, Germany) with the addition of 4.5 g L−1 of hexamethylenetetramine (per analysis, Carl Roth, Karlsruhe, Germany) for 60 s. Reference samples were prepared and measured in the same way, but without the application of salt solution.

2.3. Corrosion Product Analysis

Scanning electron microscopy was performed on corroded SKP samples using a Zeiss Sigma HD VP (Field Emission) with an EDAX Octane Plus detector for energy-dispersive X-ray spectroscopy (EDX) for all three salt concentrations.
For X-ray Diffraction (XRD) measurements, samples were prepared by applying 200 µL of salt solutions (0.1 M/0.1 M NaCl or MgCl2), resulting in a circular corrosion spot with 20 mm diameter on CP1000 pieces with 30 mm × 30 mm size. A Pananalytical XPert Pro instrument with a cobalt tube at a voltage of 35 kV and a current of 45 mA was used. During the measurement, the samples were either kept at low relative humidity (5% RH, silica gel) or in laboratory air (40% RH).
57Fe Mössbauer measurements were carried out on 12 mm × 12 mm sized samples corroded on one side with 150 µL of 0.01 M NaCl or MgCl2 solution, which resulted in a circular corrosion spot with 10 mm diameter using detection of conversion electrons (CEMS) at room temperature (293 K).

3. Results

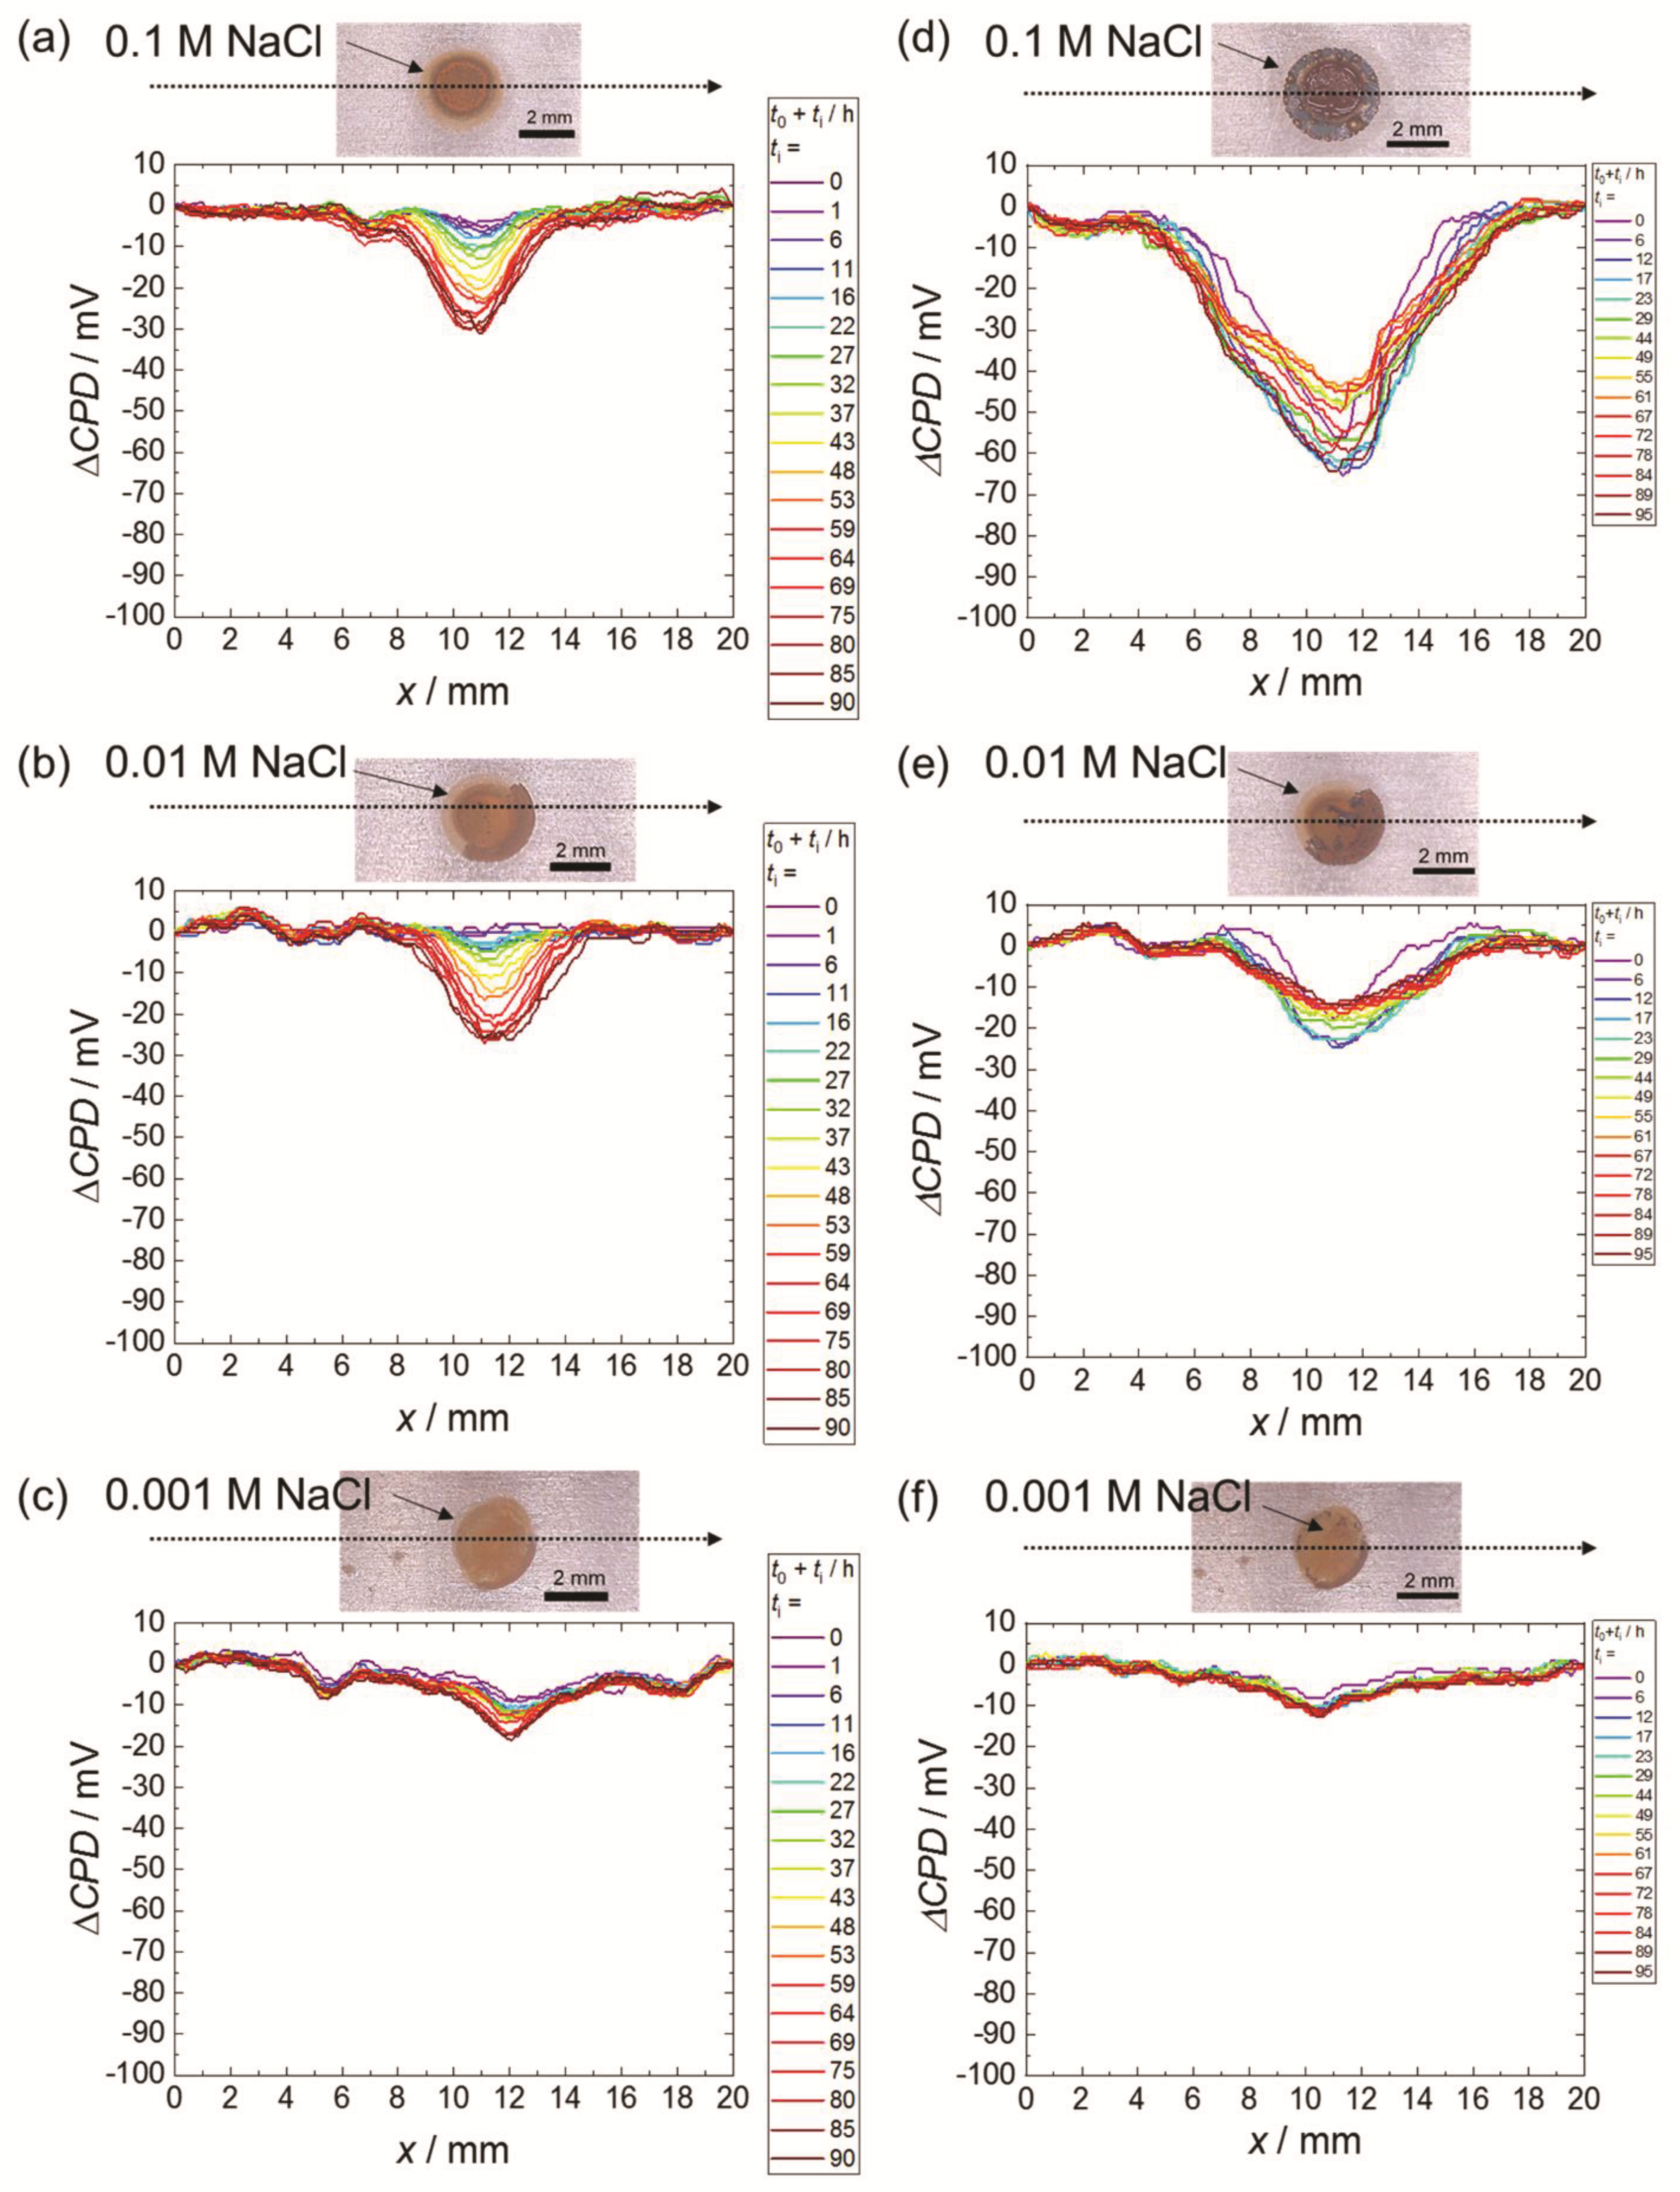
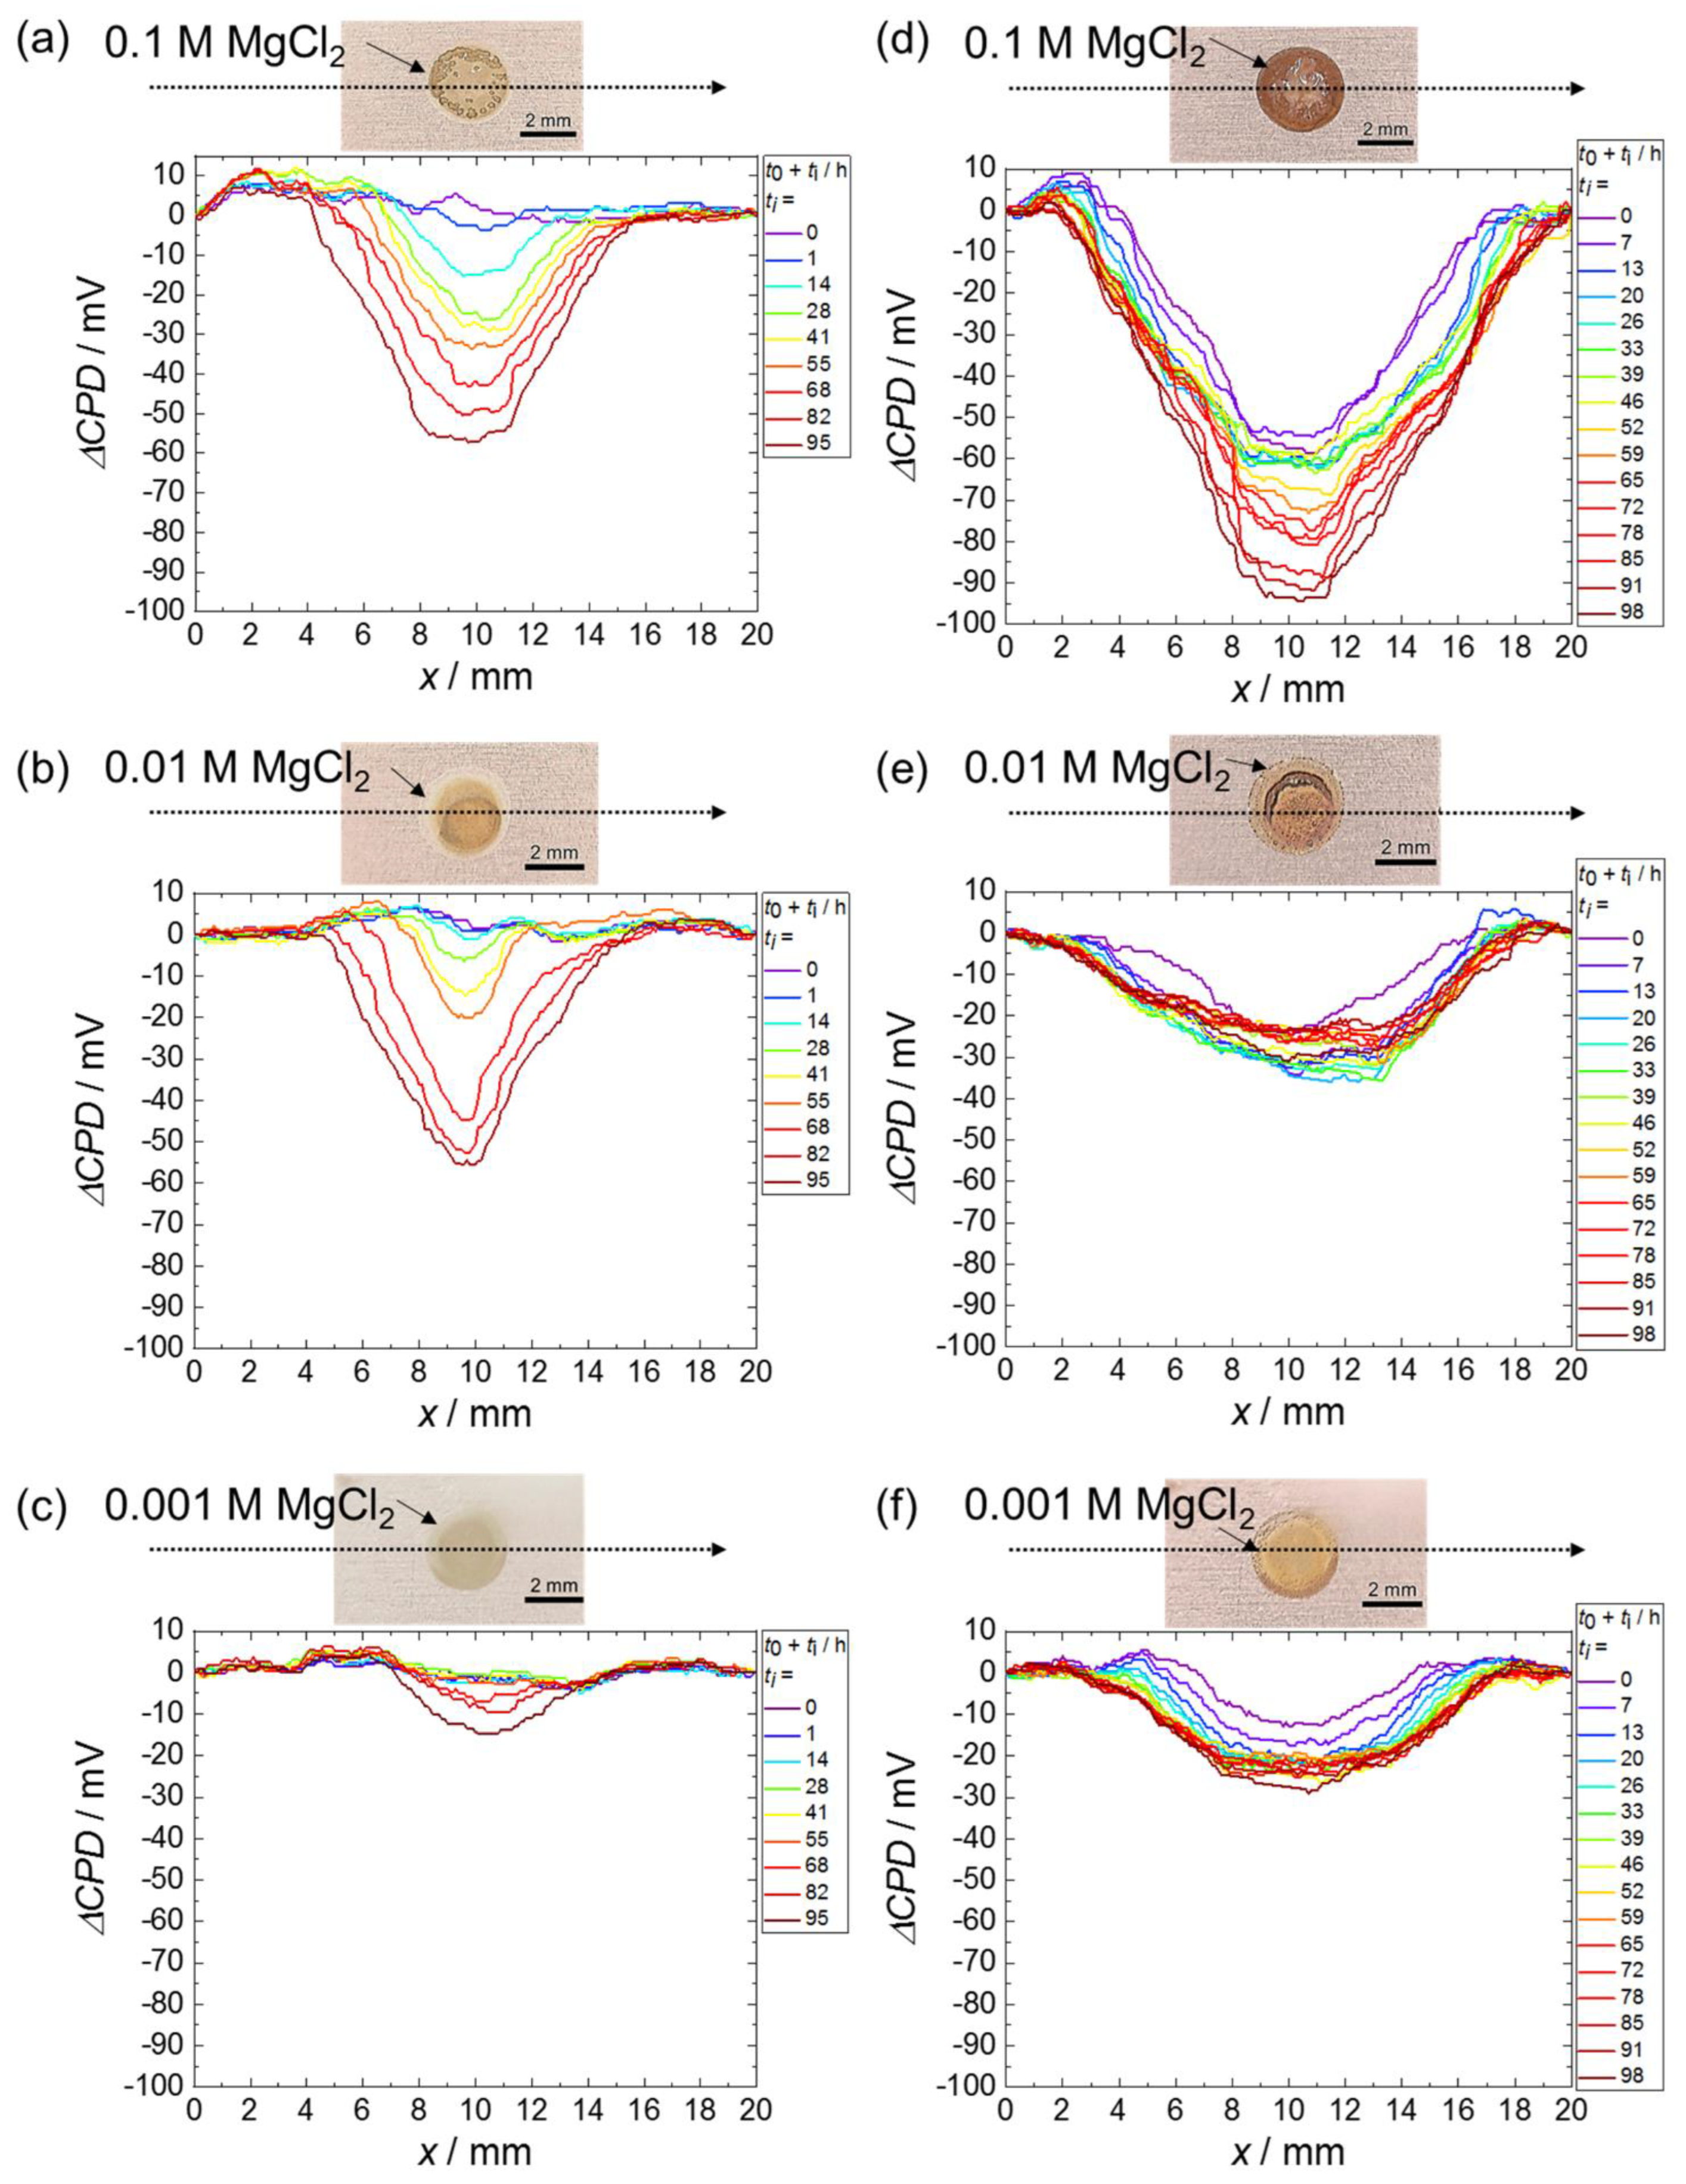
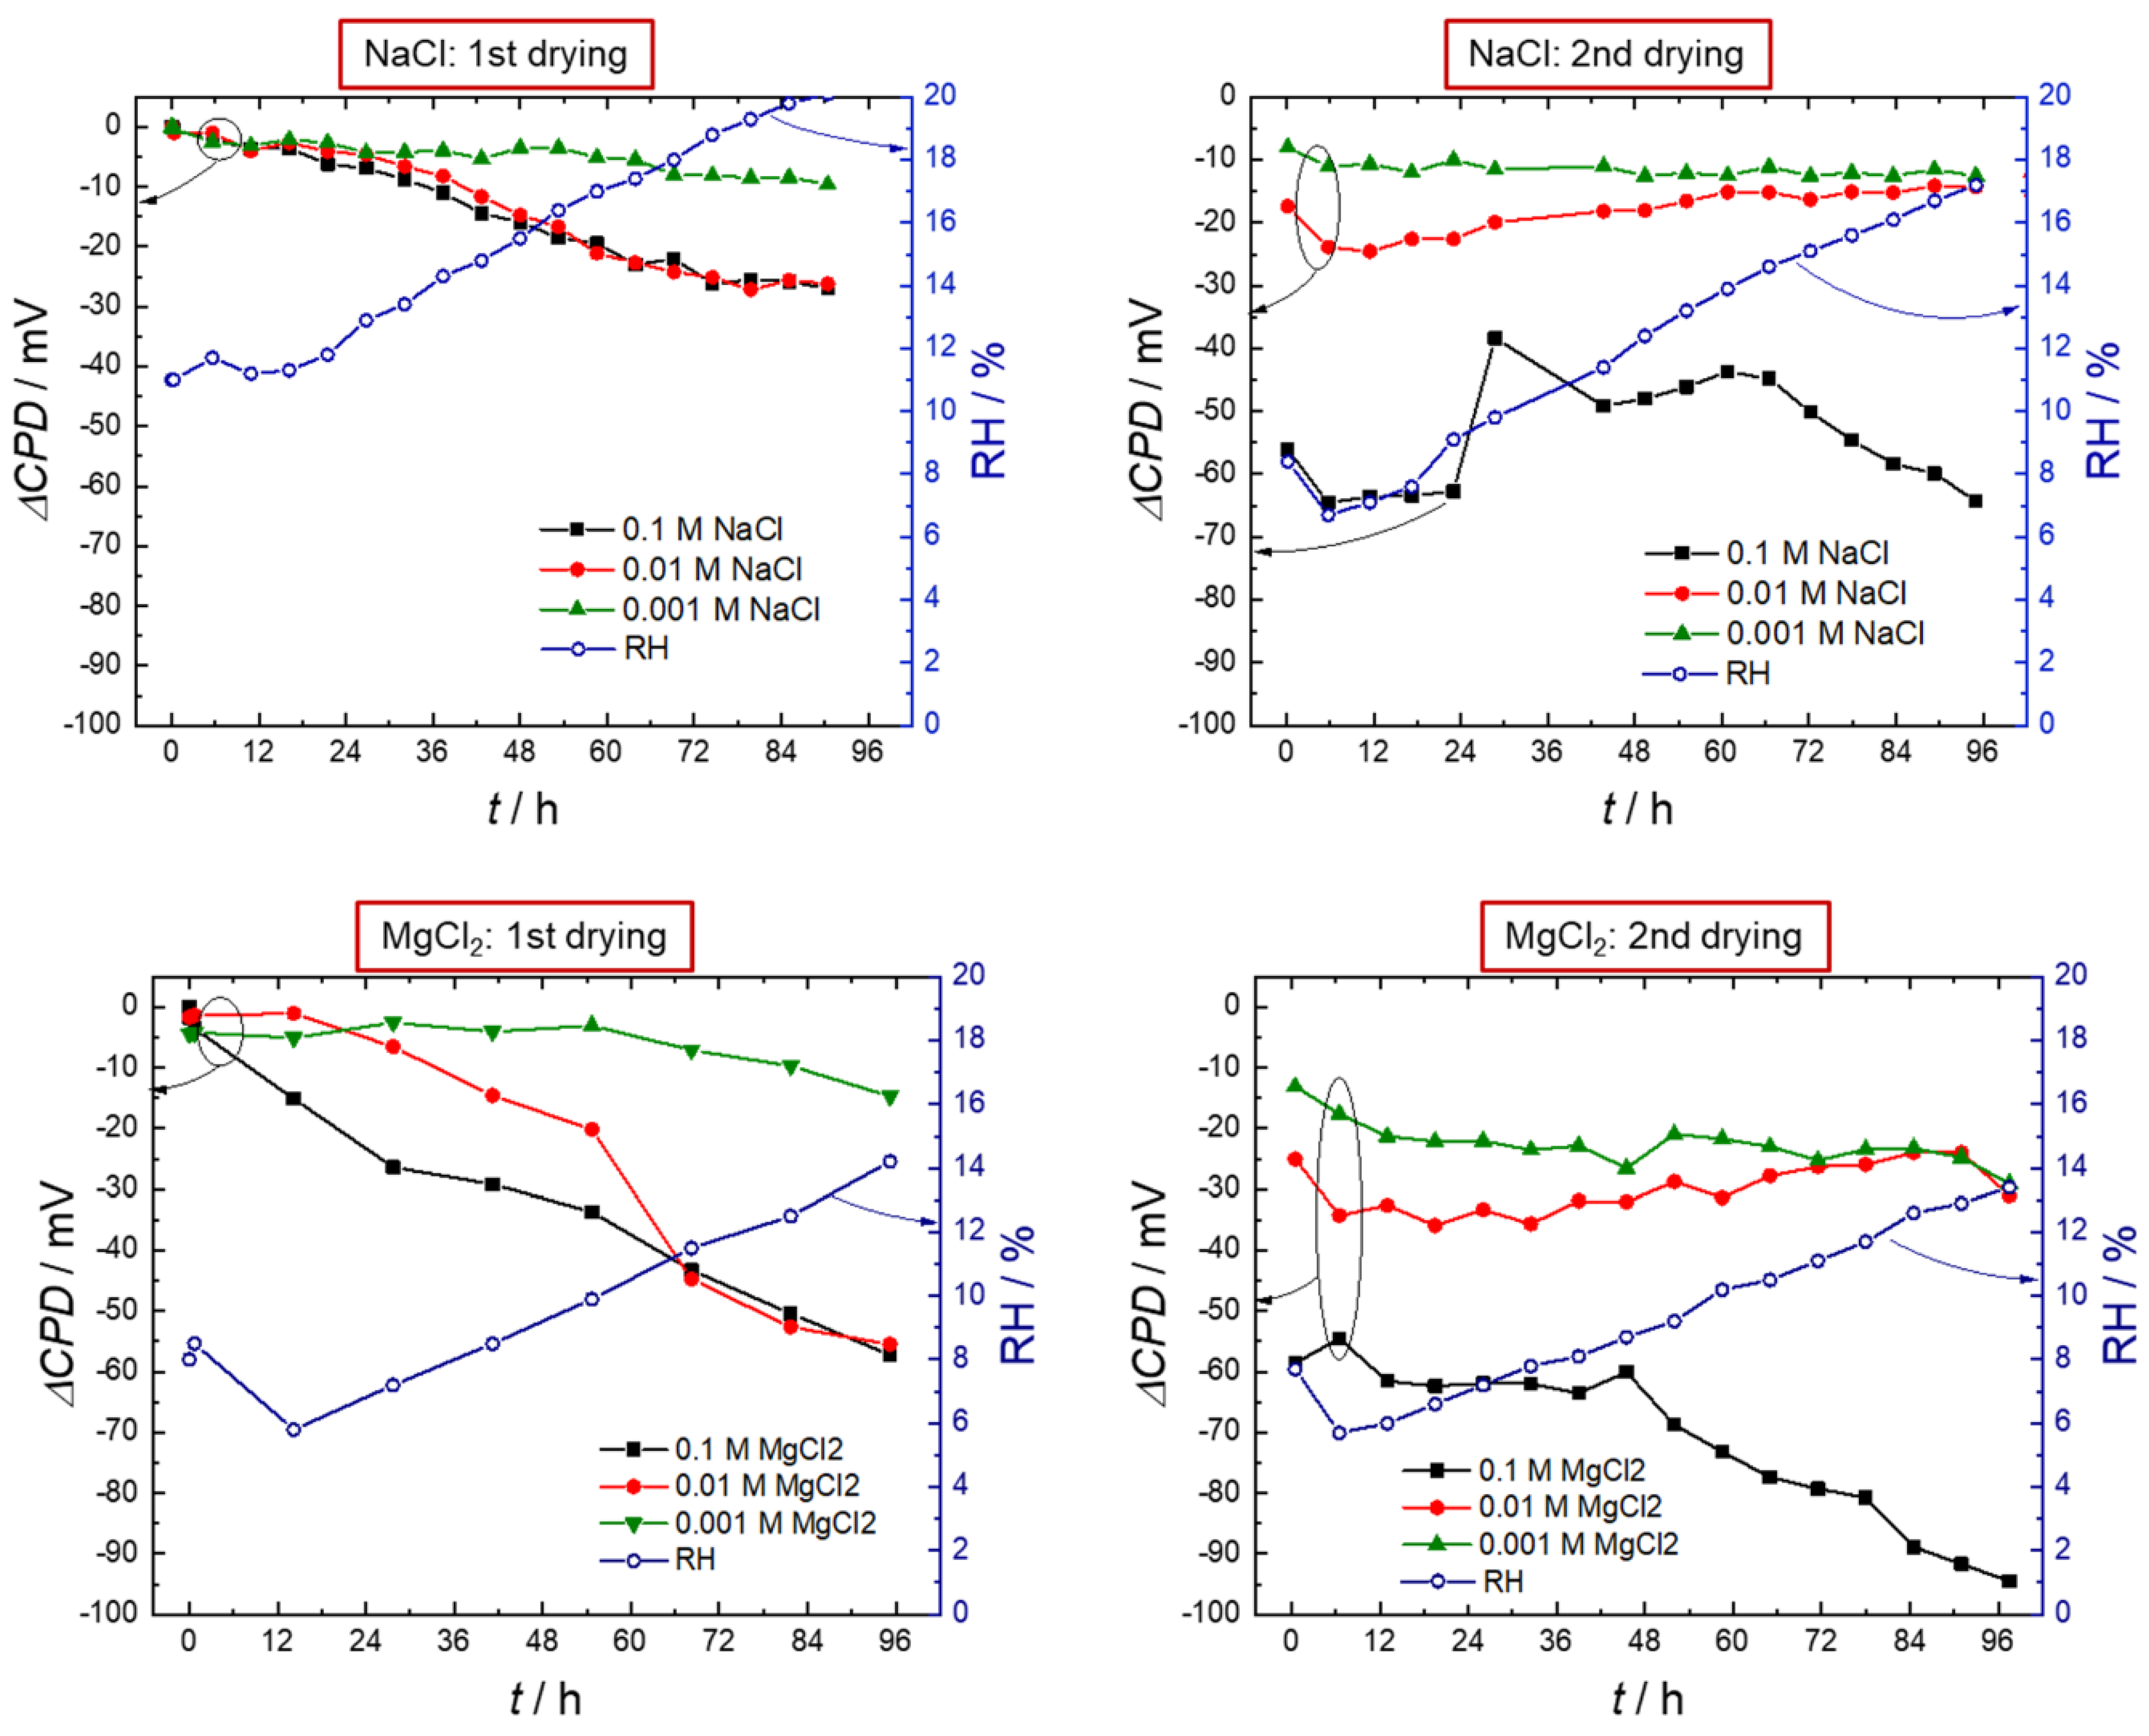
3.1. Scanning Kelvin Probe

Consecutive SKP scans of the hydrogen exit side of CP1000 steel samples were performed in order to detect the hydrogen insertion after application and drying of single salt solution droplets of NaCl and MgCl2. As the RH in the SKP chamber was kept at levels below 20%, the salt droplets were drying within the first hours of the experiment. As determined in a separate experiment, the CP1000 steel surface maintained a stable CPD under the experimental conditions for the duration of the entire experiment (not shown). Therefore, CPD changes observed on the top, clean, and uncorroded side of the sample can be attributed to hydrogen, which was inserted at the corroding lower sample side, permeating the sample and finally interfering with iron oxides present at the surface. As repeatedly shown in other studies [10,13,14], the reduction in Fe3+ leads to a drop in potential or CPD. Regions with a stronger decrease in potential can be interpreted as regions with increased concentrations of hydrogen resulting from stronger hydrogen insertion rates at the corroding sample side. From repeated surface scans, the localized hydrogen insertion during corrosion over time can be extracted, as exemplarily shown in Figure 1. The overlay with the optical image of the corroded sample side confirms the good correlation between the position of the dried salt solution droplets and the regions of decreased CPD observed in the SKP scans.
For further data interpretation, CPD line profiles in the x-direction were extracted from the consecutive CPD surface maps. For each of the three salt solution droplets with concentrations of 0.001 M, 0.01 M, and 0.1 M, one x-line profile was extracted from each SKP scan. In order to facilitate the observation and comparison of CPD changes over time, the background, which is represented by the average potential of the initial surface scan before the salt solutions were applied, was subtracted. The resulting graphs for NaCl and MgCl2 are presented in Figure 2 and Figure 3. Each of the extracted line profiles was dominated by one CPD minimum, which was located in close distance to the center of each corrosion spot. For both NaCl and MgCl2, a clear effect of the salt concentration can be observed, with stronger hydrogen insertion for higher salt concentrations. In addition to the concentration, results for MgCl2 showed a stronger decrease in CPD than for NaCl. Concerning the shape of the peaks, a broadening over time was noticeable resulting from the outward diffusion of inserted hydrogen. For a clear localization of hydrogen entry intensity within the droplets, much larger droplets are necessary. This localization of hydrogen entry positions in detail is beyond the scope of the present work, but the subject of current research [39]. However, for some samples, an effect of localized hydrogen entry could be monitored. For 0.01 M and 0.001 M MgCl2 after rewetting, the tendency toward a peak separation, resulting from stronger hydrogen entry at the droplet edges, was visible. This effect can be due to stronger localization of anodic activity and pitting at the droplet edges for lower salt concentrations, as reported in the literature [17]. In contrast, pitting was documented for higher salt concentrations (0.1 M NaCl) to occur over the entire droplet area. This is in accordance with the hydrogen entry activity over the entire droplet region for the highest salt concentrations observed in the SKP measurements.
Based on the observation of negative peaks in CPD changes for each salt and salt concentration, the CPD minima were plotted against exposure time, indicating the RH in the SKP sample chamber for each SKP measurement. Throughout the first 96 h of the experiment, the RH was constantly rising in the SKP chamber, up to 20% RH. After this period, the samples were exposed to humid air (85% RH), leading to a rewetting of the droplets as the DRH of the salt solution was exceeded, followed by a second drying interval of 96 h in the SKP chamber. CPD minima versus time of both drying intervals are depicted in Figure 4.
As a general trend, a steady decrease in the CPD could be observed in the first drying interval of the experiment, which indicates a rising hydrogen concentration in the sample. This trend was observed for all salt deposits. However, the intensity of this CPD decrease, reflecting the rise in hydrogen concentration in the sample, was strongly dependent on the type of salt and the salt concentration. The change in CPD detected for MgCl2 deposits was about twice as strong as for NaCl deposits. For both salt types, a similar evolution of CPD minima was measured for 0.1 and 0.01 M salt solutions, which was much stronger compared to the hydrogen entry at the corrosion spot with 0.001 M salt solutions.
The second drying interval revealed again strong differences in hydrogen uptake depending on salt type and concentration: For salt solutions of 0.01 and 0.001 M, the intensity of hydrogen insertion was unaffected or even decreasing, as observed for 0.01 M solutions. For the highest concentration of 0.1 M, a low effect was recorded for MgCl2, showing a similar trend as for the first drying period. In the case of 0.1 M NaCl, rewetting led to a strong enhancement of hydrogen insertion, reflected by a large drop in CPD compared to the values observed at the end of the first drying interval. The evolution of CPD minima versus time for 0.1 M NaCl during the second drying period showed first a tendency toward lower H-insertion rates, but subsequently, with a slowly increasing RH in the SKP chamber, the hydrogen insertion rate started to increase again after 60 h when a relative humidity of about 14% was exceeded. In addition, for the 0.1 M MgCl2 solution, a rise in hydrogen insertion could be observed toward the end of the experiment when 10% RH was exceeded.

3.2. Hydrogen Content

For a better estimation of hydrogen quantity inserted during these drying and corrosion processes at low RH, samples were prepared in the same manner as for SKP measurements and were stored under dry conditions for 96 h before their hydrogen content was determined in an isothermal desorption measurement at 350 °C using a TDMS system. The temperature in the experiment was sufficient to remove diffusible hydrogen from the samples [32]. Figure 5 shows the results for the uncorroded reference samples and samples corroding with different salt loads of NaCl and MgCl2, applied as droplets onto the surface. When comparing the semi-quantitative information of hydrogen content from SKP measurements with the quantitative measurement with TDMS, it has to be kept in mind that the SKP gives local information, whereas the TDMS delivers an average value over the entire sample, also including regions with negligible hydrogen content. The values for hydrogen content after corrosion under droplets of NaCl and MgCl2 determined by TDMS were generally very low and exceeded only slightly the reference values. However, the tendency of increasing hydrogen content with increasing salt load for both type of salts was clearly visible. Additionally, the values for MgCl2-corroded samples were slightly higher compared to NaCl-corroded samples, which was in accordance with the observations of SKP measurements.

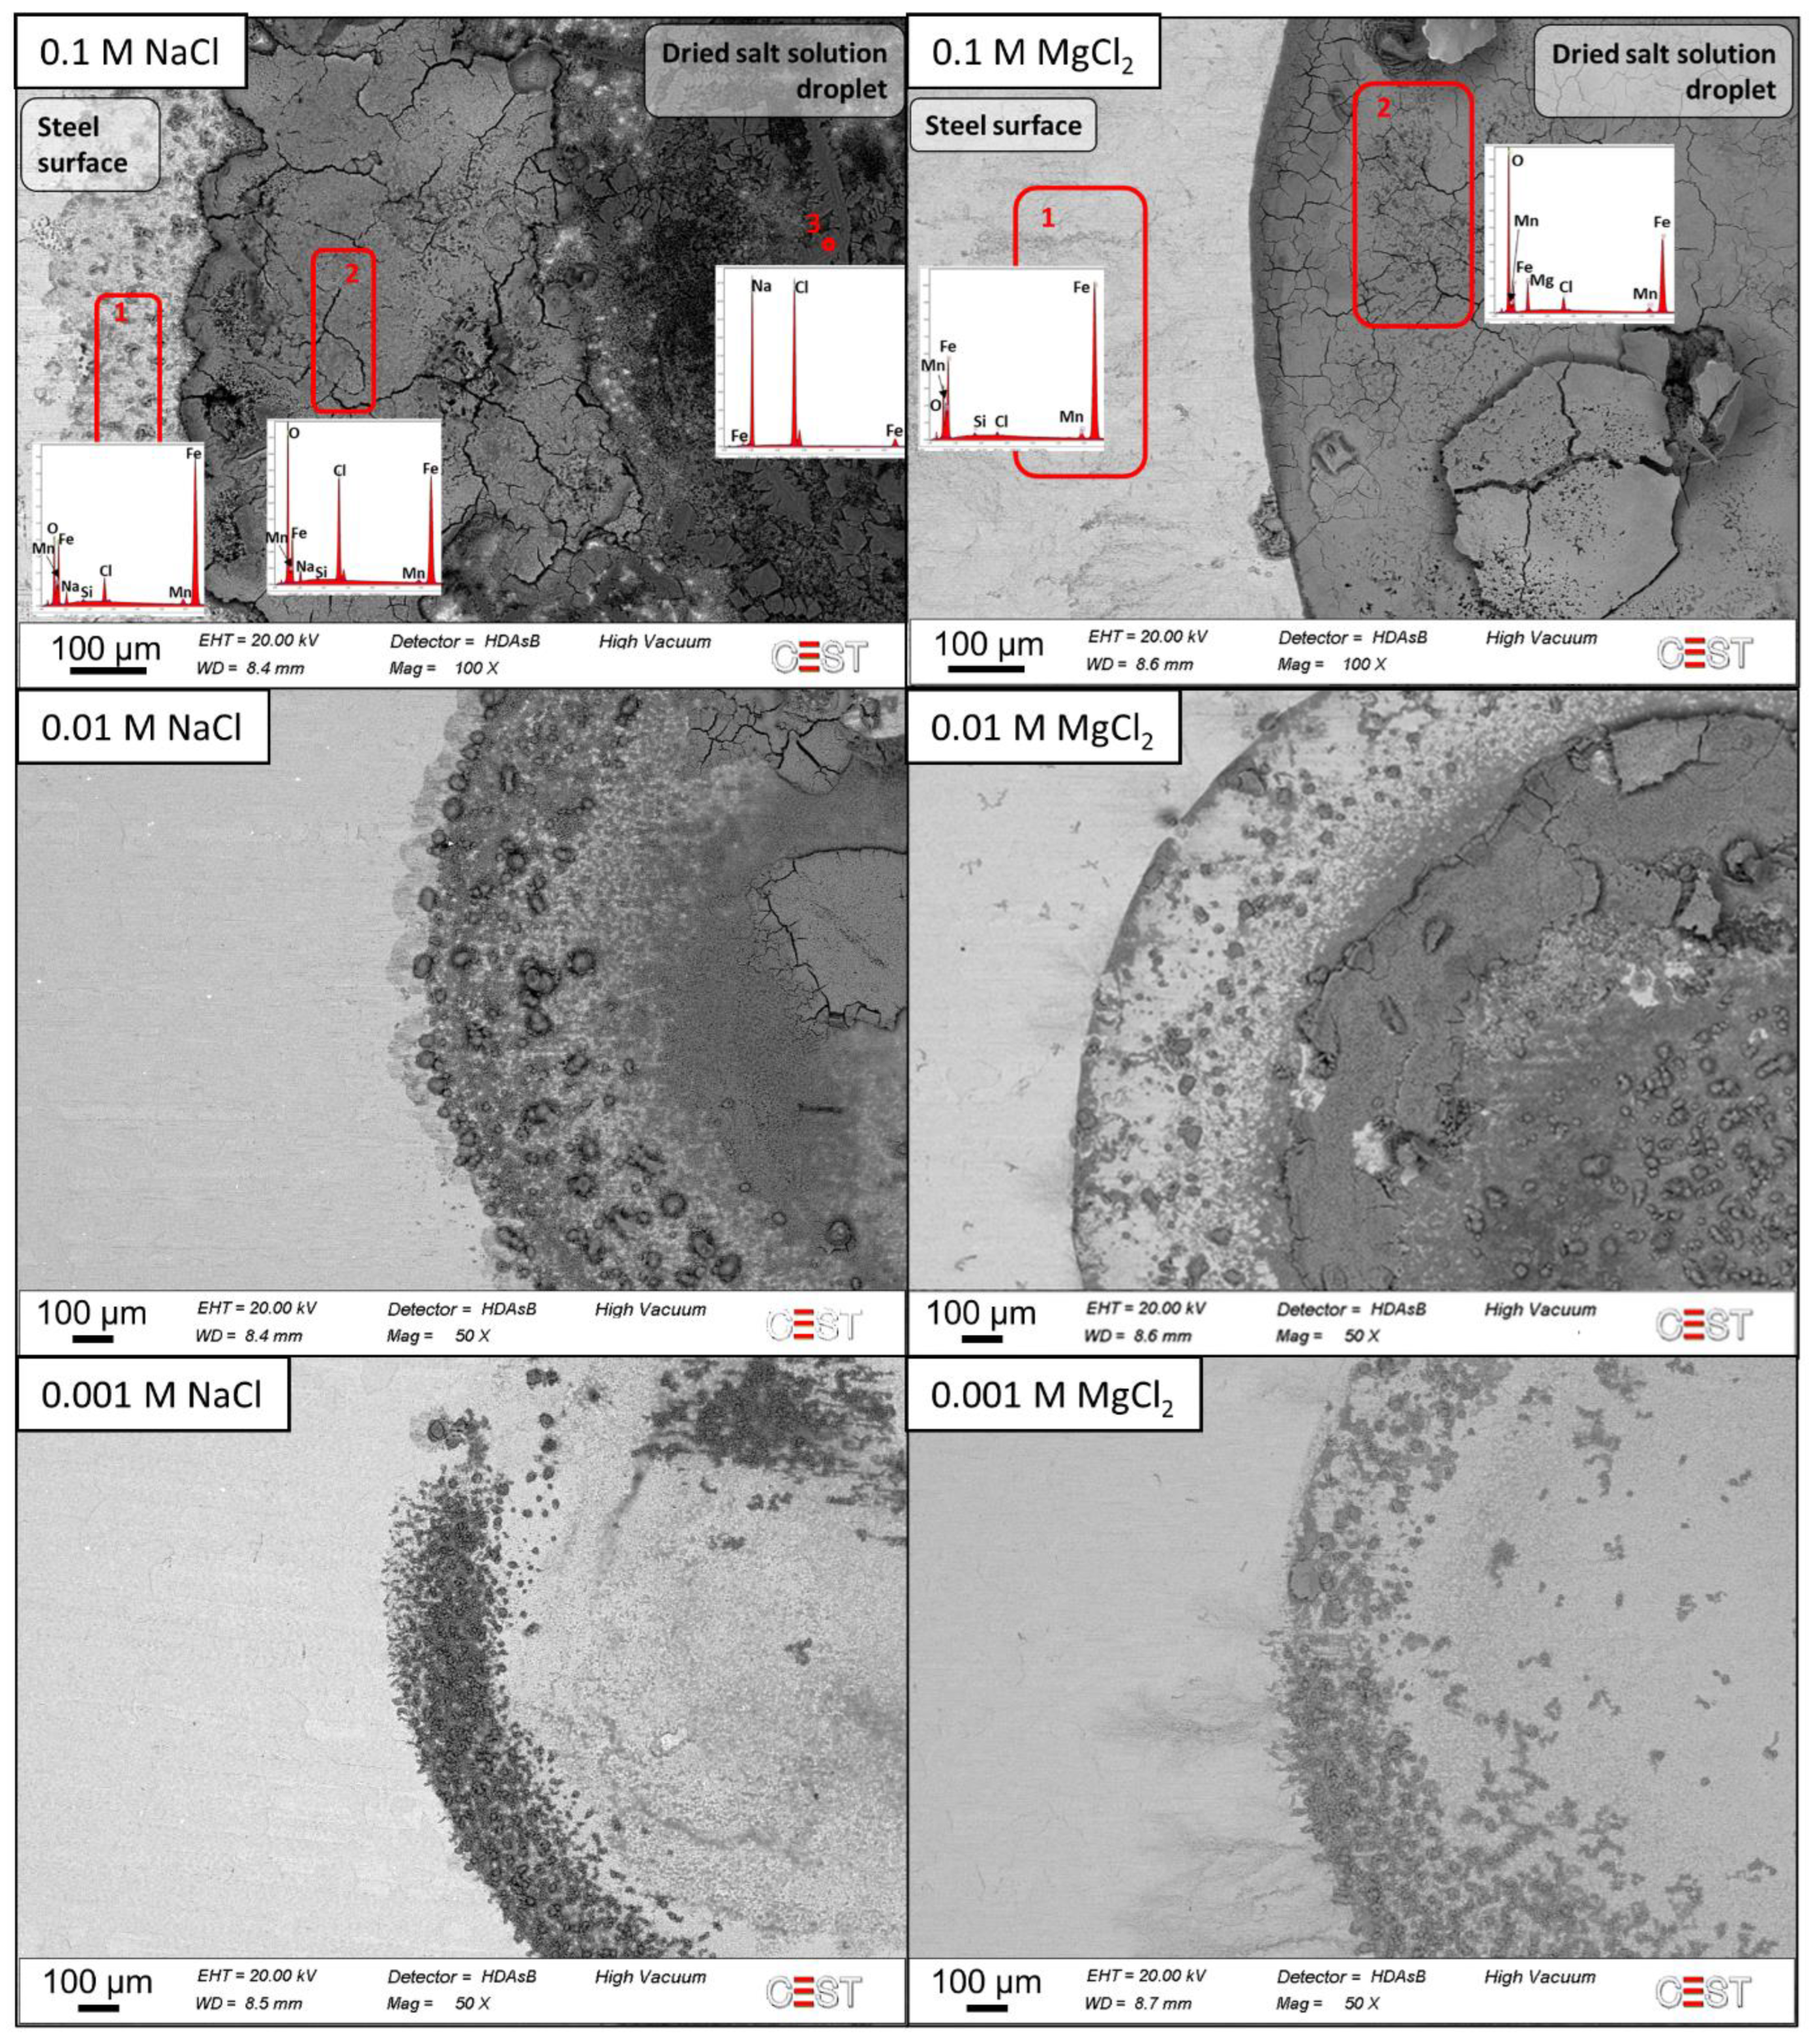
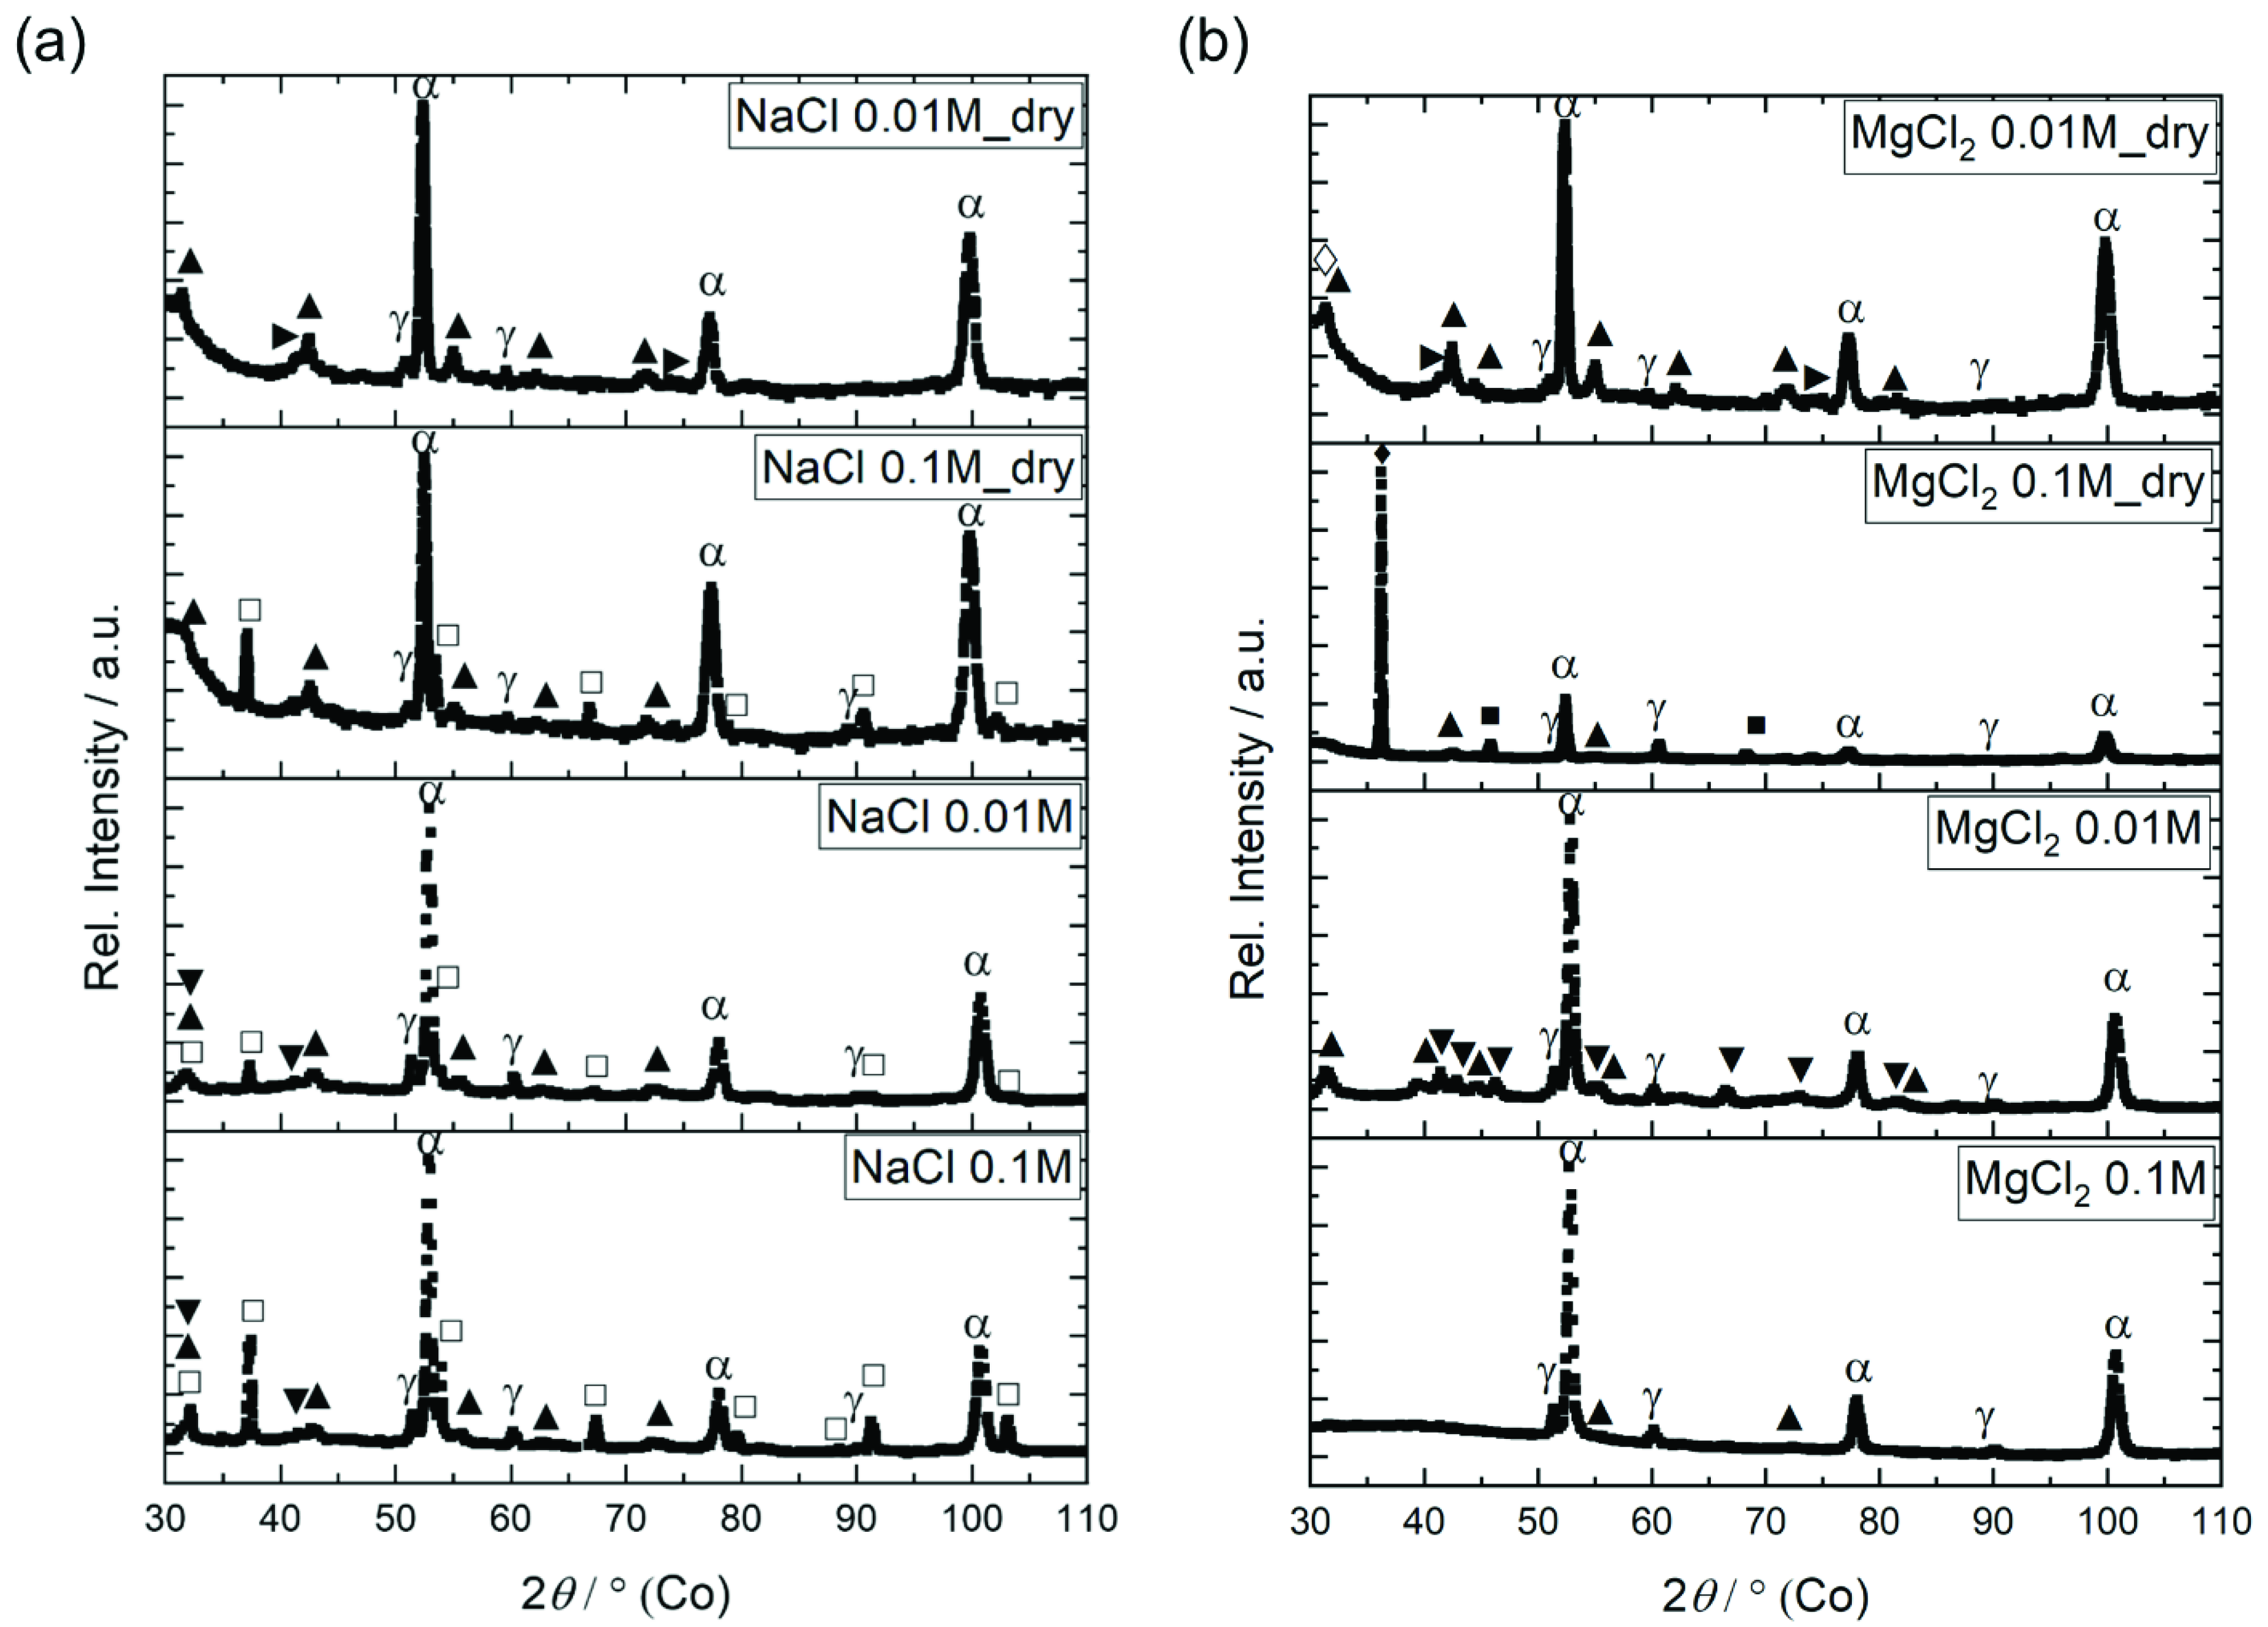
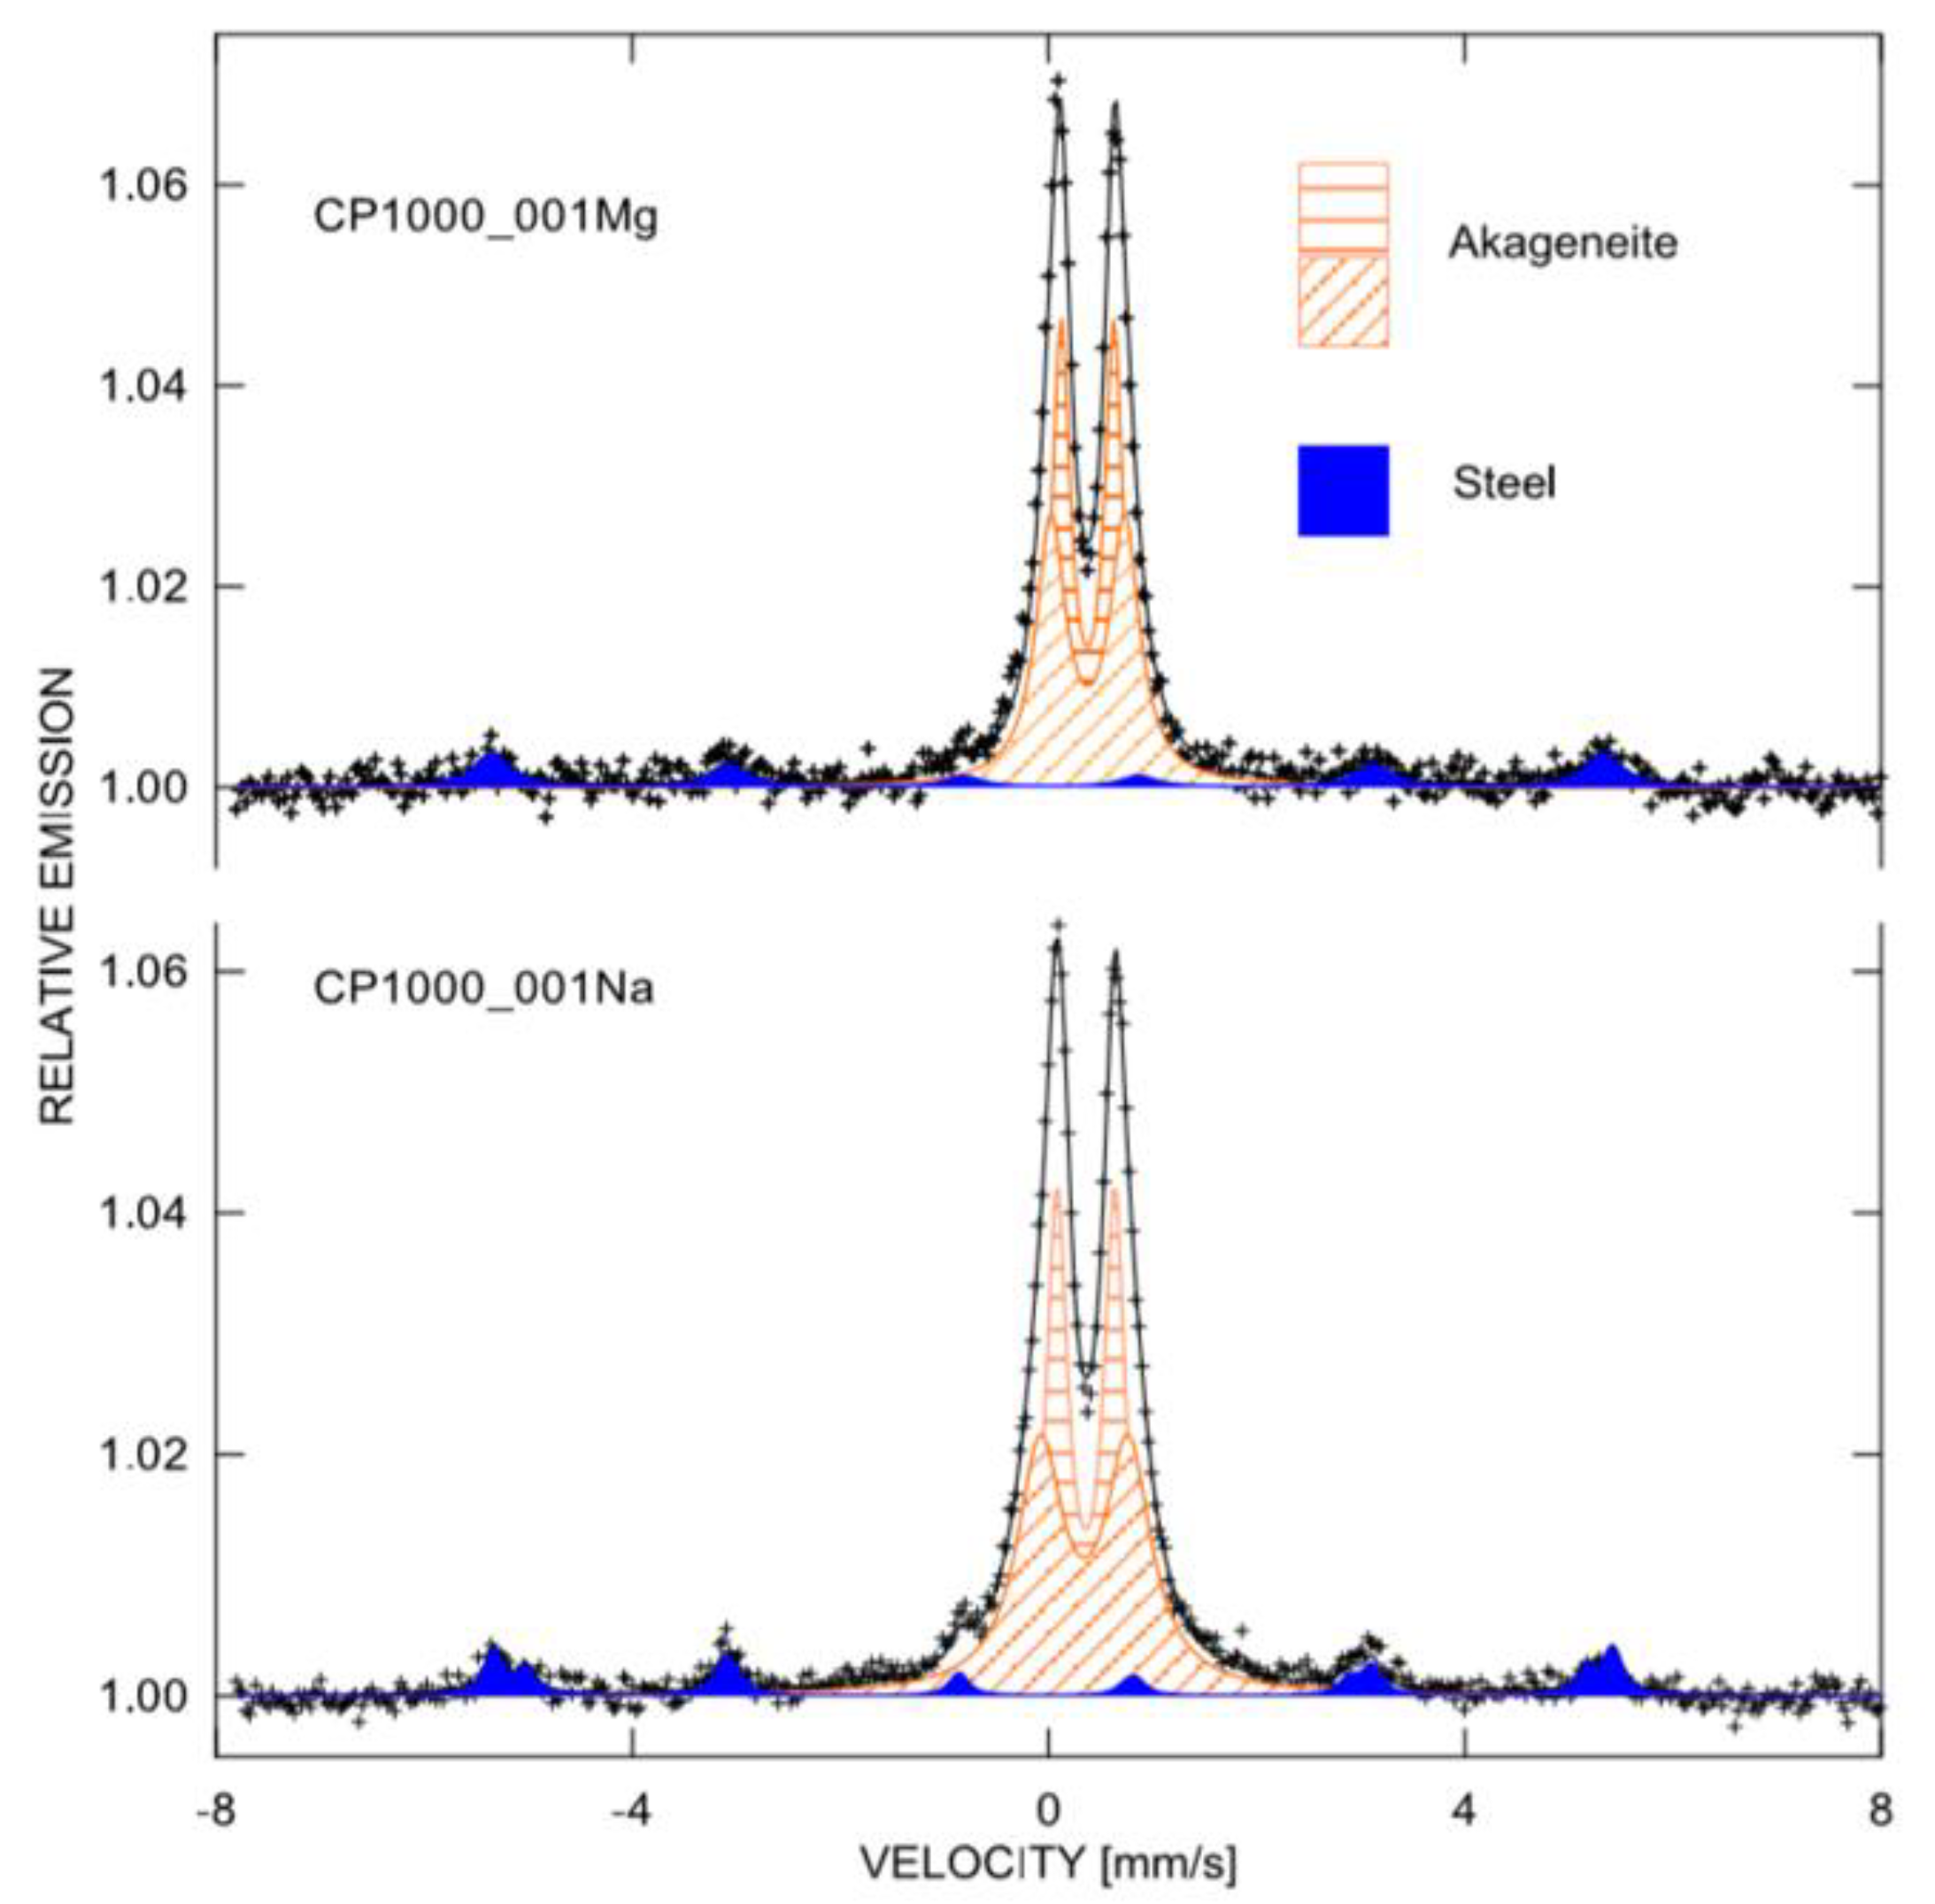
3.3. Corrosion Product Analyses

The corroded samples were analyzed after SKP experiments with SEM and EDX (Figure 6). For almost all samples, a ring-shaped deposition of Fe corrosion products, rich in O and Cl, in the outer regions of the droplets could be observed, which formed during corrosion and evaporation of the salt solution. In the central part of the droplets, salt crystals of NaCl and MgCl2, respectively, were found, in larger quantity and size for the higher-concentration salt solutions. For 0.1 M MgCl2, the central droplet area seemed to be covered with a thick and dense crust of corrosion products and MgCl2, without the visible formation of a corrosion product ring. The appearance of the corroded surfaces matches previous findings for NaCl solutions where a stronger focus of anodic metal dissolution at the droplet edges was reported for 1 mM salt solutions [17].
The corrosion products formed on the steel surfaces were studied more in detail with XRD, focusing on the two higher salt loading densities. For these experiments, a new set of samples was prepared with corrosion spots large enough for XRD analysis. The results are summarized in Figure 7. The XRD spectra were first recorded at low RH (5%) and then again at higher RH (40%) to detect transformations of corrosion products. Lepidocrocite could be found on all samples, whereas akaganeite was only detected at increased relative humidity and was, therefore, likely to be formed during rewetting of the dried salt solution droplets. In addition, magnetite was detected on certain samples as well as chloride-containing corrosion products. The detection of magnesium hydroxide indicates that anodic and cathodic areas were strongly separated on the corroding surface. Cathodic sites are supposed to be alkali under atmospheric exposure conditions [40].
Finally, Mössbauer spectroscopy was performed on corroded samples with single droplets (150 µL) of 0.01 M NaCl solution and 0.01 M MgCl2 (Figure 8). The technique scans the sample at a depth of about 200 nm. The spectra were calibrated against pure alpha iron. Fitting of the experimental data was performed with a function consisting of sextets, which can be ascribed to the substrate steel, and two doublets, exhibiting isomer shifts of 0.367 mm/s and 0.352 mm/s and quadrupole splitting of 0.56 and 0.84 mm/s. According to these parameters, the doublets can be attributed to akageneite (β-FeOOH) with a high probability. The spectra obtained for both salt solutions showed large similarities, with slight differences between the relative intensities of the doublets, which can be explained by the variation in stoichiometry, differences in Fe-O distances, and presence of Cl [41]. The observation of akaganeite by Mössbauer spectroscopy confirmed the results of the XRD analysis, where akaganeite was detected next to other corrosion products. The exclusive determination of akaganeite in the Mössbauer measurements can be a result of the scan depth of the method.

4. Discussion

The general pathway of hydrogen insertion during atmospheric corrosion was described in detail in the literature [25,26]. The overall corrosion reaction for Fe and steel, which can be formulated as follows,
4 Fe + 2 H2O + 3 O2 → 4 FeOOH
can be divided into an anodic metal dissolution, which results in severe pitting formation on the steel surface [17,42],
Fe → Fe2+ + 2 e
and a cathodic oxygen reduction reaction (ORR), which is predominant in many atmospheric corrosion processes:
½ O2 + H+ + 2 e →OH
However, it was described that other cathodic reactions might gain importance when the rate of oxygen reduction is low due to slow diffusion through rust or electrolyte layers, or when the local pH is low:
Fe3+ + e → Fe2+
H+ + e → ½ H2 or H+ + e → Had
The reduction of Fe3+ can be accompanied by a partial transformation of lepidocrocite into magnetite [43], which was also found on samples under dry conditions in this study, whereas the formation of adsorbed hydrogen as a side reaction of the hydrogen evolution reaction (HER) is an important step toward a further absorption of hydrogen into the metal. A locally low pH can be caused by several possible hydrolysis reactions [13,30,44]:
Fe2+ + 2 H2O → Fe(OH)2 + 2 H+
Fe(OH)2 → FeOOH + H+ + e
4 Fe2+ + O2 + 6 H2O → 4 FeOOH + 8 H+
FeCl2 + H2O → FeOH+ + H+ + 2 Cl
Huang et al. reported that with the addition of NaCl, the pH beneath the water and rust layer on Fe was 3 or below [30]. Similarly low pH values can be expected for the presence of MgCl2, establishing the basis for the hydrogen entry in the presented experiments. The decrease in pH can lead to a hydrogen entry rate diverging from the overall corrosion rate, as reported by Akiyama et al. [32] and is strongly affected by the water layer thickness and therefore by the relative humidity [33]. Wang et al. observed hydrogen entry from dried MgCl2 deposits on an iron surface starting at RH of 15%, reaching a maximum at about 30% RH [45]. This early start of the hydrogen insertion at 15% RH might be linked to the presence of iron chlorides, which are frequently found as precipitates of anolyte solution on steel under chloride deposits [27,46]. The DRH of FeCl2·4H2O was reported to be in the range of 55 to 59% [27,47]. However, FeCl2·2H2O was shown to convert to the four hydrates at ca. 15% RH [47]. Even though at a slow rate, active corrosion of iron in contact with FeCl2.2H2O was reported by Watkinson [48] and Turgoose [47] down to 20% RH. Iron chlorides were also detected by XRD for the MgCl2-contaminated samples in this study. A presence of iron chlorides on the NaCl-contaminated samples was not observed, but cannot be excluded, as the concentration might be below the detection limit.
Regarding the two types of salt investigated in this study and their effect on hydrogen entry into steel, three important differences can be listed: the chloride concentration, the pH value before and during the experiment, and the hygroscopic behavior, which is especially critical for atmospheric corrosion. The impact of the difference in hygroscopic behavior, which is also connected to the specific corrosion products formed, was clearly observed in the SKP measurements. The lower DRH of MgCl2 compared to NaCl promotes a faster wetting of the dried droplets. Even small increases in relative humidity have larger effects on MgCl2-induced corrosion, which results in higher corrosion rates and stronger hydrogen insertion. The stronger the effect, the higher the salt concentration.
Schindelholz et al. postulated the formation of metastable hydrates plus fluid trapping under a solid salt crust for MgCl2 deposits as one important factor for the prolonged corrosion even down to 11% RH [28]. This postulation can be underlined by the results of this work. In the case of NaCl deposits, a sustained corrosion was also observed down to 33% RH [27] even though studies on pure salt particles documented the beginning of water uptake of NaCl particles at 70% RH, which is only slightly below the bulk DRH of 75% [49,50]. Thus, it is important to regard the hygroscopic behavior of salt deposits on metal surfaces as a complex interplay of salt and corrosion products.
In a separate experiment, this interplay of the steel surface and salt deposits at varied relative humidities was studied by monitoring both the CPD and the changes in height signal, resulting from the automatic height control of the SKP system, over the clean steel surface (Figure 9a), as well as on the steel surface contaminated with droplets of NaCl and MgCl2 solution (Figure 9b,c). The measurements were started at a minimum RH close to 5–6% and were increased similarly as in the SKP experiments described above. The height signal of the SKP reflected the topographical changes in the surface, including uptake and growth of water layers on the (salt-contaminated) steel surface. Even though the system was not able to monitor the water layer formation on the blank steel surface—there are more suitable and sensitive methods for this purpose—a change in height signal was observed for the salt solution-contaminated steel surface. This water adsorption was visible immediately after RH was rising and was more prolonged for NaCl compared to MgCl2 deposits. Simultaneously to the topographical change, the CPD of the surface was reacting to the changing conditions. For the blank steel surface, the CPD deviated only slightly and was finally about 10 mV below the initial value, even though the experiment was extended for this sample and the humidity was increased up to almost 80%. The CPD over the NaCl-contaminated surface was rising and, in contrast, the CPD over the MgCl2 deposit was decreased, both by 30 mV. In both cases, the average potential of the salt-contaminated surfaces was lowered and was 300–400 mV, in the case of 0.1 M NaCl, and 700–750 mV in the case of 0.1 M MgCl2, below the CPD of the original surface. The stronger shift in CPD in the negative direction indicates a more actively corroding surface in the case of MgCl2, promoting hydrogen entry.
Another aspect, which could have effects on the hydrogen entry rate, is the fluid trapping of MgCl2 below a salt crust that might change the oxygen diffusion toward the metal surface. If oxygen diffusion is hindered, the predominant cathodic reaction could be, on the one hand, the reduction of Fe3+ or, if the local pH is low enough, the reduction of H+ to partly form adsorbed and absorbed hydrogen, respectively. Additionally, in a recent study on stainless steel, it was found that the oxygen reduction reaction is suppressed in MgCl2 solutions, with a buffering effect of Mg-precipitate formation lowering the overpotential of the hydrogen evolution reaction, which is becoming the primary cathodic reaction [51]. Suppression of the ORR and promotion of the HER have to be considered to explain the enhanced hydrogen absorption in the case of corrosion with MgCl2 observed in this study.
In general, MgCl2 was reported to be more corrosive than NaCl, which can be linked to the lower pH [52]. In order to clarify the impact of the cation and pH value of the applied salt solutions on the hydrogen insertion into the steel, another experiment was performed. For this purpose, CP1000 samples were immersed in 0.1 M NaCl and 0.05 M MgCl2 solution. Additionally, one set of samples was immersed into a 0.05 M MgCl2 solution, where the pH was increased by addition of Mg(OH)2 to match the pH of a 0.1 M NaCl solution (see Table 2). The resulting hydrogen content was measured with TDMS after 48 h immersion and is depicted in Figure 10. The hydrogen contents after immersion were generally higher compared to the values observed after atmospheric corrosion, keeping in mind that for this experiment, the entire sample was corroding. Based on the obtained results, the chloride concentration had a minor influence compared to the impact of pH: The average hydrogen content of the sample corroded in 0.05 M MgCl2 solution was still higher in average values compared to the sample, which was immersed in 0.1 M NaCl. For the samples immersed in 0.1 M NaCl, a larger spread in results was obtained as for those immersed in MgCl2 solution. Levelling the pH value led to a noticeable reduction in hydrogen content in the sample. However, it has to be considered that the parameters for this experiment were derived from the ones showed before, where single droplets were applied instead of immersion. This derivation in exposure conditions is, on the one hand, necessary to increase hydrogen contents, facilitating the study of the impact of single parameters such as chloride concentration and pH value. On the other hand, it is a strong simplification of the droplet experiment and will not reflect all features contributing to the (local) hydrogen entry. Regarding the overall results of this experiment, the differences in initial pH and chloride concentration of the salt solutions, together with the difference in ionic strength of the salt solutions, given by nature, seemed to have a minor impact compared to the difference in drying/wetting behavior that was partly caused by the different nature of corrosion products formed.

5. Conclusions

SKP was used to monitor hydrogen insertion from corrosion under NaCl and MgCl2 deposits on a CP1000 steel surface at low relative humidity in two drying intervals interrupted by a rewetting phase. A higher salt concentration led to increased hydrogen entry, even though there was no linear relationship between salt concentration and hydrogen entry. MgCl2 deposits induced stronger hydrogen insertion compared to NaCl droplets, which was caused by several factors:
(1)
The hygroscopic behavior of MgCl2 prolonged hydrogen entry during drying down to low levels of relative humidity (>20% RH), which is well below the deliquescence humidity of the salt.
(2)
The surface pH below a salt crust of MgCl2 was lower. The crust also slowed down water evaporation and oxygen diffusion.
(3)
Iron chlorides detected on MgCl2-contaminated samples enhanced active corrosion under the deposits.
The formation of FeCl2.2H2O, preferentially on samples with MgCl2 deposits, and its conversion to FeCl2.4H2O at around 15% RH could be linked to an increased hydrogen insertion rate.
It could be shown that even at very low relative humidity, corrosion-induced hydrogen ingress was observed, even though at a low extent.

Author Contributions

Conceptualization, G.S.-A., I.T., A.M., G.L., H.D., K.-H.S., J.F., T.P., D.S., A.W.H. and S.H.; methodology, G.S.-A., I.T., D.R., C.C. and O.S.; validation, I.T., A.M., T.P. and D.R.; formal analysis, A.M., J.F., T.P., D.S., A.W.H. and S.H.; investigation, G.S.-A., I.T., D.R., C.C. and O.S.; resources, A.M., K.-H.S., T.P., D.S., A.W.H. and S.H.; data curation, G.S.-A.; writing—original draft preparation, G.S.-A.; writing—review and editing, G.S.-A., I.T., A.M., D.R., O.S., H.D., T.P., D.S., A.W.H. and S.H.; visualization, G.S.-A., C.C. and O.S.; supervision, T.P., D.S., A.W.H. and S.H.; project administration, G.S.-A. and A.M. All authors have read and agreed to the published version of the manuscript.

Funding

The Comet Centre CEST is funded within the framework of COMET—Competence Centers for Excellent Technologies by BMVIT, BMDW, as well as the Province of Lower Austria and Upper Austria. The COMET program is run by FFG. This work originates from research in H-Hunt I (FFG 844596 CEST-K1, 2016–2018) and H-Hunt II (FFG 865864 CEST-K1, since 2019) project.

Institutional Review Board Statement

Not applicable.

Informed Consent Statement

Not applicable.

Data Availability Statement

Not applicable.

Acknowledgments

The authors thank the voestalpine Stahl GmbH for the support.

Conflicts of Interest

The authors declare no conflict of interest. The funders had no role in the design of the study; in the collection, analyses, or interpretation of data; in the writing of the manuscript, or in the decision to publish the results.

References

  1. Rudomilova, D.; Prošek, T.; Traxler, I.; Faderl, J.; Luckeneder, G.; Schimo-Aichhorn, G.; Muhr, A. Critical Assessment of the Effect of Atmospheric Corrosion Induced Hydrogen on Mechanical Properties of Advanced High Strength Steel. Metals 2020, 11, 44. [Google Scholar] [CrossRef]
  2. Barrera, O. Understanding and Mitigating Hydrogen Embrittlement of Steels: A Review of Experimental, Modelling and Design Progress from Atomistic to Continuum. J. Mater. Sci. 2018, 53, 6251–6290. [Google Scholar] [CrossRef] [PubMed] [Green Version]
  3. Rehrl, J.; Mraczek, K.; Pichler, A.; Werner, E. Mechanical Properties and Fracture Behavior of Hydrogen Charged AHSS/UHSS Grades at High- and Low Strain Rate Tests. Mater. Sci. Eng. A 2014, 590, 360–367. [Google Scholar] [CrossRef]
  4. Scharf, R.; Muhr, A.; Luckeneder, G.; Larour, P.; Mraczek, K.; Rehrl, J.; Leomann, F.; Stellnberger, K.-H.; Faderl, J.; Mori, G. Hydrogen Embrittlement of DP-1000 Flat Steel Sheet: Influence of Mechanical Properties, Specimen Geometry, Pre-Damaging and Electrolytically Zinc Galvanizing: Hydrogen Embrittlement of DP-1000 Flat Steel Sheet. Mater. Corros. 2016, 67, 239–250. [Google Scholar] [CrossRef]
  5. Evers, S.; Senoz, C.; Rohwerder, M. Hydrogen Detection in Metals: A Review and Introduction of a Kelvin Probe Approach. Sci. Technol. Adv. Mater. 2013, 14, 014201. [Google Scholar] [CrossRef]
  6. Evers, S. The Hydrogen Electrode in the “Dry”: A Kelvin Probe Approach to Measuring Hydrogen in Metals. Electrochem. Commun. 2012, 24, 85–88. [Google Scholar] [CrossRef] [Green Version]
  7. Schimo, G.; Burgstaller, W.; Hassel, A.W. Potentiodynamic Hydrogen Permeation on Palladium-Kelvin Probe Compared to 3D Printed Microelectrochemical Cell. Electrochem. Commun. 2015, 60, 208–211. [Google Scholar] [CrossRef]
  8. Schimo, G.; Burgstaller, W.; Hassel, A.W. Influence of Atmospheric Oxygen on Hydrogen Detection on Pd Using Kelvin Probe Technique. J. Solid State Electrochem. 2018, 22, 495–504. [Google Scholar] [CrossRef] [Green Version]
  9. Wu, C.-H.; Krieger, W.; Rohwerder, M. On the Robustness of the Kelvin Probe Based Potentiometric Hydrogen Electrode Method and Its Application in Characterizing Effective Hydrogen Activity in Metal: 5 wt. % Ni Cold-Rolled Ferritic Steel as an Example. Sci. Technol. Adv. Mater. 2019, 20, 1073–1089. [Google Scholar] [CrossRef] [Green Version]
  10. Williams, G.; McMurray, H.N.; Newman, R.C. Surface Oxide Reduction by Hydrogen Permeation through Iron Foil Detected Using a Scanning Kelvin Probe. Electrochem. Commun. 2013, 27, 144–147. [Google Scholar] [CrossRef]
  11. Schaller, R.F.; Scully, J.R. Measurement of Effective Hydrogen Diffusivity Using the Scanning Kelvin Probe. Electrochem. Commun. 2014, 40, 42–44. [Google Scholar] [CrossRef]
  12. Schimo, G.; Burgstaller, W.; Hassel, A.W. Rolling Direction Dependent Diffusion Coefficients of Hydrogen in Ferritic Steel by SDCM Charging and SKP Probing. ISIJ Int. 2016, 56, 487–491. [Google Scholar] [CrossRef] [Green Version]
  13. Nazarov, A.P.; Marshakov, A.I.; Rybkina, A.A. Iron Hydrogenation under Atmospheric Corrosion. Studies Using a Scanning Vibrating Microscope. Prot. Met. Phys. Chem. Surf. 2015, 51, 347–359. [Google Scholar] [CrossRef]
  14. Nazarov, A.; Vucko, F.; Thierry, D. Scanning Kelvin Probe for Detection of the Hydrogen Induced by Atmospheric Corrosion of Ultra-High Strength Steel. Electrochim. Acta 2016, 216, 130–139. [Google Scholar] [CrossRef]
  15. Nazarov, A.; Vucko, F.; Thierry, D. Scanning Kelvin Probe Investigation of High-Strength Steel Surface after Impact of Hydrogen and Tensile Strain. CMD 2020, 1, 187–197. [Google Scholar] [CrossRef]
  16. Evans, U.R. The Ferroxyl Indicator in Corrosion Research, With Special Reference to the Controversy Regarding the Cause of Pitting. Met. Ind. 1926, 11, 481–508. [Google Scholar]
  17. Soulié, V.; Lequien, F.; Ferreira-Gomes, F.; Moine, G.; Feron, D.; Prene, P.; Moehwald, H.; Zemb, T.; Riegler, H. Salt-Induced Iron Corrosion under Evaporating Sessile Droplets of Aqueous Sodium Chloride Solutions. Mater. Corros. 2017, 68, 927–934. [Google Scholar] [CrossRef]
  18. Risteen, B.E.; Schindelholz, E.; Kelly, R.G. Marine Aerosol Drop Size Effects on the Corrosion Behavior of Plain Carbon Steel. ECS Trans. 2014, 58, 1–12. [Google Scholar] [CrossRef]
  19. Katona, R.M.; Tokuda, S.; Perry, J.; Kelly, R.G. Design, Construction, and Validation for in-Situ Water Layer Thickness Determination during Accelerated Corrosion Testing. Corros. Sci. 2020, 175, 108849. [Google Scholar] [CrossRef]
  20. Katona, R.M.; Kelly, R.G.; Bryan, C.R.; Schaller, R.F.; Knight, A.W. Use of in Situ Raman Spectroelectrochemical Technique to Explore Atmospheric Corrosion in Marine-Relevant Environments. Electrochem. Commun. 2020, 118, 106768. [Google Scholar] [CrossRef]
  21. Strebl, M.; Bruns, M.; Virtanen, S. Editors’ Choice—Respirometric in Situ Methods for Real-Time Monitoring of Corrosion Rates: Part, I. Atmospheric Corrosion. J. Electrochem. Soc. 2020, 167, 021510. [Google Scholar] [CrossRef]
  22. Rudomilova, D.; Prošek, T.; Luckeneder, G. Techniques for Investigation of Hydrogen Embrittlement of Advanced High Strength Steels. Corros. Rev. 2018, 36, 413–434. [Google Scholar] [CrossRef]
  23. Schindelholz, E.; Kelly, R.G.; Cole, I.S.; Ganther, W.D.; Muster, T.H. Comparability and Accuracy of Time of Wetness Sensing Methods Relevant for Atmospheric Corrosion. Corros. Sci. 2013, 67, 233–241. [Google Scholar] [CrossRef]
  24. Schindelholz, E.; Tsui, L.; Kelly, R.G. Hygroscopic Particle Behavior Studied by Interdigitated Array Microelectrode Impedance Sensors. J. Phys. Chem. A 2014, 118, 167–177. [Google Scholar] [CrossRef]
  25. Stratmann, M.; Streckel, H. On the Atmospheric Corrosion of Metals Which Are Covered with Thin Electrolyte Layers—I. Verification of the Experimental Technique. Corros. Sci. 1990, 30, 681–696. [Google Scholar] [CrossRef]
  26. Stratmann, M.; Streckel, H. On the Atmospheric Corrosion of Metals Which Are Covered with Thin Electrolyte Layers—II. Experimental Results. Corros. Sci. 1990, 30, 697–714. [Google Scholar] [CrossRef]
  27. Schindelholz, E.; Risteen, B.E.; Kelly, R.G. Effect of Relative Humidity on Corrosion of Steel under Sea Salt Aerosol Proxies: I. NaCl. J. Electrochem. Soc. 2014, 161, C450–C459. [Google Scholar] [CrossRef]
  28. Schindelholz, E.; Risteen, B.E.; Kelly, R.G. Effect of Relative Humidity on Corrosion of Steel under Sea Salt Aerosol Proxies II. MgCl2, Artificial Seawater. J. Electrochem. Soc. 2014, 161, C460–C470. [Google Scholar] [CrossRef]
  29. Greenspan, L. Humidity Fixed Points of Binary Saturated Aqueous Solutions. J. Res. Natl. Bur. Stand 1977, 81A, 89–96. [Google Scholar] [CrossRef]
  30. Huang, L.; Li, Z.; Lou, Y.; Cao, F.; Zhang, D.; Li, X. Recent Advances in Scanning Electrochemical Microscopy for Biological Applications. Materials 2018, 11, 1389. [Google Scholar] [CrossRef] [PubMed] [Green Version]
  31. Akiyama, E.; Matsukado, K.; Wang, M.; Tsuzaki, K. Evaluation of Hydrogen Entry into High Strength Steel under Atmospheric Corrosion. Corros. Sci. 2010, 52, 2758–2765. [Google Scholar] [CrossRef]
  32. Akiyama, E. Hydrogen Entry into Fe and High Strength Steels under Simulated Atmospheric Corrosion. Electrochim. Acta 2011, 56, 1799–1805. [Google Scholar] [CrossRef]
  33. Omura, T.; Kudo, T.; Fujimoto, S. Environmental Factors Affecting Hydrogen Entry into High Strength Steel Due to Atmospheric Corrosion. Mater. Trans. 2006, 12, 2956–2962. [Google Scholar] [CrossRef] [Green Version]
  34. Ootsuka, S.; Fujita, S.; Tada, E.; Nishikata, A.; Tsuru, T. Evaluation of Hydrogen Absorption into Steel in Automobile Moving Environments. Corros. Sci. 2015, 98, 430–437. [Google Scholar] [CrossRef]
  35. Traxler, I.; Schimo-Aichhorn, G.; Muhr, A.; Commenda, C.; Jerrar, A.; Sagl, R.; Mraczek, K.; Rudomilova, D.; Luckeneder, G.; Duchaczek, H.; et al. Optimization of Metallographic Sample Preparation for AFM/SKPFM Based Phase Distinction of Complex and Dual Phase High Strength Steels. Pract. Metallogr. 2021, 58, 308–331. [Google Scholar] [CrossRef]
  36. Rudomilova, D.; Prošek, T.; Salvetr, P.; Knaislová, A.; Novák, P.; Kodým, R.; Schimo-Aichhorn, G.; Muhr, A.; Duchaczek, H.; Luckeneder, G. The Effect of Microstructure on Hydrogen Permeability of High Strength Steels. Mater. Corros. 2019, maco.201911357. [Google Scholar] [CrossRef]
  37. Schuttlefield, J.D.; Cox, D.; Grassian, V.H. An Investigation of Water Uptake on Clays Minerals Using ATR-FTIR Spectroscopy Coupled with Quartz Crystal Microbalance Measurements. J. Geophys. Res. Atmos. 2007, 112. [Google Scholar] [CrossRef] [Green Version]
  38. Prosek, T.; Iversen, A.; Taxén, C.; Thierry, D. Low-Temperature Stress Corrosion Cracking of Stainless Steels in the Atmosphere in the Presence of Chloride Deposits. Corrosion 2009, 65, 105–117. [Google Scholar] [CrossRef]
  39. Rudomilova, D.; Prošek, T.; Ström, M. Hydrogen Entry into Steel Under Corrosion Products. Corrosion 2021, 77, 427–432. [Google Scholar] [CrossRef]
  40. Stratmann, M.; Müller, J. The Mechanism of the Oxygen Reduction on Rust-Covered Metal Substrates. Corros. Sci. 1994, 36, 327–359. [Google Scholar] [CrossRef]
  41. Schwertmann, U.; Cornell, R.M. Iron Oxides in the Laboratory: Preparation and Characterization; Wiley: Hoboken, NJ, USA, 2000; ISBN 978-3-527-29669-9. [Google Scholar]
  42. Katona, R.M.; Knight, A.W.; Schindelholz, E.J.; Bryan, C.R.; Schaller, R.F.; Kelly, R.G. Quantitative Assessment of Environmental Phenomena on Maximum Pit Size Predictions in Marine Environments. Electrochim. Acta 2021, 370, 137696. [Google Scholar] [CrossRef]
  43. Leygraf, C.; Odnevall Wallinder, I.; Tidblad, J.; Graedel, T.E. Atmospheric Corrosion, 2nd ed.; The Electrochemical Society Series; Wiley: Hoboken, NJ, USA, 2016; ISBN 978-1-118-76227-1. [Google Scholar]
  44. Tsuru, T.; Huang, Y.; Ali, R.; Nishikata, A. Hydrogen Entry into Steel during Atmospheric Corrosion Process. Corros. Sci. 2005, 47, 1431–2440. [Google Scholar] [CrossRef]
  45. Wang, Y.; Yamanishi, J.; Haruna, T. Effect of Humidity of Air on Hydrogen Absorption into Fe with Rust Layer Containing MgCl2 during Atmospheric Corrosion. ISIJ Int. 2021, 61, 1143–1150. [Google Scholar] [CrossRef]
  46. Li, S.; Hihara, L.H. Atmospheric-Corrosion Electrochemistry of NaCl Droplets on Carbon Steel. J. Electrochem. Soc. 2012, 159, C461–C469. [Google Scholar] [CrossRef]
  47. Turgoose, S. Post-Excavation Changes in Iron Antiquities. Stud. Conserv. 1982, 27, 97–101. [Google Scholar] [CrossRef]
  48. Watkinson, D.; Lewis, M.T. Desiccated Storage of Chloride-Contaminated Archaeological Iron Objects. Stud. Conserv. 2005, 50, 241–252. [Google Scholar] [CrossRef]
  49. Wise, M.E.; Martin, S.T.; Russell, L.M.; Buseck, P.R. Water Uptake by NaCl Particles Prior to Deliquescence and the Phase Rule. Aerosol Sci. Technol. 2008, 42, 281–294. [Google Scholar] [CrossRef] [Green Version]
  50. Bruzewicz, D.A.; Checco, A.; Ocko, B.M.; Lewis, E.R.; McGraw, R.L.; Schwartz, S.E. Reversible Uptake of Water on NaCl Nanoparticles at Relative Humidity below Deliquescence Point Observed by Noncontact Environmental Atomic Force Microscopy. J. Chem. Phys. 2011, 134, 044702. [Google Scholar] [CrossRef] [PubMed]
  51. Katona, R.M.; Carpenter, J.C.; Knight, A.W.; Bryan, C.R.; Schaller, R.F.; Kelly, R.G.; Schindelholz, E.J. Importance of the Hydrogen Evolution Reaction in Magnesium Chloride Solutions on Stainless Steel. Corros. Sci. 2020, 177, 108935. [Google Scholar] [CrossRef]
  52. Prosek, T.; Thierry, D.; Taxén, C.; Maixner, J. Effect of Cations on Corrosion of Zinc and Carbon Steel Covered with Chloride Deposits under Atmospheric Conditions. Corros. Sci. 2007, 49, 2676–2693. [Google Scholar] [CrossRef]
Figure 1. CPD surface maps determined with SKP on the non-corroded sample side of CP1000 approx. 2 and 4 days after application of salt solution droplets and after rewetting, respectively. Positions of dried/rewetted droplets are indicated on the SKP scans, as well as on the optical images of the corroded side of the samples (right). Time t0 represents the start of droplet drying.
Metals 12 00624 g001
Figure 2. CPD line profiles in x-direction at y-position of CPDmin after background subtraction (ΔCPD values) measured up to 90 h after application of (a) 0.1 M, (b) 0.01 M, and (c) 0.001 M NaClaq in comparison with corresponding results after rewetting of the droplets (df).
Metals 12 00624 g002
Figure 3. CPD line profiles in x-direction at y-position of CPDmin after background subtraction (ΔCPD values) measured up to 90 h after application of (a) 0.1 M, (b) 0.01 M, and (c) 0.001 M MgCl2.aq in comparison with corresponding results after rewetting of the droplets (df).
Metals 12 00624 g003
Figure 4. CPD changes at position of maximum hydrogen concentration (CPD minimum) over time during first and second drying interval and RH values recorded in the SKP chamber.
Metals 12 00624 g004
Figure 5. Hydrogen content after first drying interval determined with TDMS.
Metals 12 00624 g005
Figure 6. SEM images and EDX results from CP1000 surface and dried droplets of NaCl and MgCl2 aqueous solutions.
Metals 12 00624 g006
Figure 7. XRD results of corroded sample areas after application of (a) NaCl and (b) MgCl2 solution measured at low (5% RH = _dry) relative humidity over silica gel and at higher relative humidity (40% RH) in laboratory air (α = iron-bcc, γ = iron-fcc, □ = sodium chloride NaCl, ■ = brucite Mg(OH)2, ▲ = lepidocrocite γ-FeOOH, ▼ = akageneite (β-FeOOH), ◇ = ferric chloride FeCl3 ◆ = rokuehnite FeCl2·2H2O, ▶ = magnetite Fe3O4).
Metals 12 00624 g007
Figure 8. Mössbauer measurements of CP1000 with 0.01 M MgCl2 solution and 0.01 M NaCl solution.
Metals 12 00624 g008
Figure 9. Evolution of CPD and change in height signal measured by SKP during increase in RH on (a) clean CP1000 surface, as well as CP1000 with addition of (b) 0.1 M NaCl and (c) 0.1 M MgCl2 solution.
Metals 12 00624 g009
Figure 10. Hydrogen content determined with TDMS after immersion of CP1000 (70 mm × 20 mm) for 48 h in different electrolytes (50 mL) in comparison to non-corroded reference samples.
Metals 12 00624 g010
Table 1. Chemical composition of CP1000 steel samples.
CmaxSimaxMnmaxPmaxSmaxAltotalCr + MomaxTi + NbmaxVmaxBmax
0.231.002.700.080.0150.015–2.01.000.150.220.005
Table 2. Measured pH values of MgCl2 and NaCl aqueous solutions applied onto the CP1000 surface and literature data on deliquescence relative humidity (DRH) of saturated salt solutions at 25 °C.
Salt Type and
Concentration/mol L−1
0.001pH Value (22 °C)
0.01
0.1DRH/%
NaCl6.86.76.674–76 [23,29,37]
MgCl26.56.25.933–36 [29,38]
Publisher’s Note: MDPI stays neutral with regard to jurisdictional claims in published maps and institutional affiliations.

