Article

Comparative Microstructural, Mechanical and Corrosion Study between Dissimilar ATIG and Conventional TIG Weldments of 316L Stainless Steel and Mild Steel

by
Kamel Touileb
1,*,
Rachid Djoudjou
1,
Abdeljlil Chihaoui Hedhibi
1,2,
Abousoufiane Ouis
1,
Abdallah Benselama
3,
Albaijan Ibrahim
1,
Hany S. Abdo
4,5 and
Ubair Abdus Samad
4
1
Department of Mechanical Engineering, College of Engineering in Al-Kharj, Prince Sattam Bin Abdulaziz University, P.O. Box 655, Al-Kharj 16273, Saudi Arabia
2
Department of Mechanical Engineering, National Engineering School of Tunis (ENIT), El-Manar University, P.O. Box 37, Tunis 1002, Tunisia
3
Department of Electrical Engineering, College of Engineering in Al-Kharj, Prince Sattam Bin Abdulaziz University, P.O. Box 655, Al-Kharj 16273, Saudi Arabia
4
Center of Excellence for Research in Engineering Materials (CEREM), King Saud University, P.O. Box 800, Al-Riyadh 11421, Saudi Arabia
5
Mechanical Design and Materials Department, Faculty of Energy Engineering, Aswan University, Aswan 81521, Egypt
*
Author to whom correspondence should be addressed.
Metals 2022, 12(4), 635; https://doi.org/10.3390/met12040635
Submission received: 5 March 2022 / Revised: 30 March 2022 / Accepted: 3 April 2022 / Published: 7 April 2022
(This article belongs to the Special Issue Advances in Dissimilar Welding and Joining)

Abstract

:
Stainless steels and mild steels are widespread materials in several industries. The dissimilar welding of materials is a technique used to meet the needs of various industries. Mild steel and 316L austenitic stainless steel have different chemical compositions and thermal and mechanical properties. Therefore, it would be interesting to develop a flux paste that would ensure the reliability and sustainability of welded structures made of dissimilar materials. In this work, pseudo-component fluxes were analyzed regarding the resulting weld aspects, microstructures, mechanical properties and corrosion resistance of dissimilar 316L austenitic stainless steel and mild steel welded joints. Using a mixing design available in Minitab 17 software, the obtained optimal pseudo-component flux was composed of 74% SiO2, 3% Fe2O3, 13% Cr2O3 and 10% NaF. During this investigation, the weld carried out using the optimal flux combination with the activated tungsten inert gas (ATIG) technique was evaluated and compared to another weld executed using the conventional tungsten inert gas (TIG) process. In conclusion, we observed that the optimal flux combination used in the ATIG weld had beneficial effects on the mechanical properties without degrading corrosion resistance when compared to the conventional TIG weld. Moreover, in the ATIG process, the weld depth was achieved in a single pass, while edge preparation or the addition of a filler metal was not required.

1. Introduction

Nowadays, joining dissimilar materials is a requirement in many fields, such as in power plants and in petrochemical and chemical industries. Dissimilar joining is used to achieve a desired combination of mechanical properties and corrosion resistance [1,2]. When joining dissimilar metals, it is challenging to achieve the same weld quality as with similar metals due to the differences in physical and chemical properties of the materials to be joined under same welding conditions. Tungsten inert gas (TIG) welding is a widespread process used for joining dissimilar metals [3,4]. The TIG technique is characterized by its high flexibility in the welding of different metals. Its major disadvantage is the low weld joint thickness obtained at each pass, meaning the welding cannot be carried out in a single pass. Additionally, problems related to weld penetration associated with cast-to-cast material variations can be observed [5,6]. Therefore, the productivity of the process is impacted. The activated tungsten inert gas (ATIG) technique is an alternative solution to overcome the limitations of conventional TIG welding. In ATIG welding, a thin layer of flux is deposited on the edge to be joined prior to the welding process. Compared to TIG, ATIG has many advantages [7,8]. Among the latter, the activating flux of ATIG eliminates the need for edge preparation, increases the penetration depth, reduces the number of weld passes, and reduces distortion, meaning heat-to-heat variations in the base metal compositions can be avoided [9,10,11]. Hence, two main mechanisms have been proposed to increase the weld penetration. The first mechanism involves the reversal of Marangoni convection. With the presence of surfactant elements such as oxygen, sulfur, selenium and tellurium, the surface tension of the liquid just under the arc weld will be greater than that at the edges. Consequently, the molten metal will move from the edges to the center of the weld pool, resulting in a deep weld bead [12,13,14]. The second mechanism is the arc constriction proposed by Howse et al. In this case, elements such as fluorine contained in the flux migrate to the arc and react with outer arc weld electrons. The arc is constricted, resulting in the density of the energy provided to the weld pool being enhanced [15,16,17].
The present study investigated dissimilar metal welding between 316L stainless steel and mild steel using the TIG and ATIG processes. Mild steel and stainless steel are two of the popularly used metals due of their properties. Mild steel is cheaper, which why most designers consider joining it with stainless steel instead of the whole fabrication being performed with stainless steel. Dissimilar metal joints of stainless steel and mild steel are widely used in pressure vessels, boilers, and heat exchangers in power plant stations, as well as in oil and gas industries. It is very important to avoid accidents and environmental pollution related to hazardous leakages in oil and gas storage and transportation. It is obvious that the final properties of dissimilar joints depend on the base materials, welding technique, and parameters, as well as the resulting microstructure in the weld bead [18,19]. Multiple problems arise in dissimilar welding, such as the production of large residual weld stresses. Additionally, the migration and diffusion of carbon in the heat-affected zone (HAZ) of mild steel induces the formation of detrimental phases, with grain growth in HAZ affecting the mechanical properties and corrosion resistance of joints. Moreover, during the welding process, compressive and tensile thermal stresses due to the differences in the materials’ thermal properties can be generated in the weld metal, which must be taken into consideration [20,21,22].
Several studies have been dedicated to TIG welding to join carbon steel and austenitic stainless steel in order to assess the effects of the filler metal or the welding parameters on the microstructure and mechanical properties. For instance, Arivarasua et al. investigated AISI 4340 aeronautical steel and AISI 304L austenitic stainless steel joined by direct-current and pulsed-current gas tungsten arc welding (GTAW) techniques, using ER309L and ERNiCr-3 as fillers [23]. They concluded that pulsed-current welding using ERNiCr-3 filler was recommended to reduce the migration of elements. In another study, Osoba et al. analyzed the effect of heat treatment on the dissimilar metal welding of AISI 304L austenitic stainless steel and AISI 1005 low-carbon ferritic steel using ER309L filler metal in the TIG welding process [24]. They focused on minimizing the inhomogeneous hardness distribution by heating the welds at a normalizing temperature of 750 °C with a holding time of 30 min. Gaffar et al. studied the effects of filler materials on mechanical weld properties when stainless steel and mild steel were used in dissimilar TIG welding processes [25]. They observed that high strength in the welded joint could be achieved with TIG welding process using an ER304L filler rod. Similarly, Priyadarsani et al. investigated dissimilar TIG welding to join stainless steel (SS) and mild steel (MS) using ER70S6 and ER309L fillers [26]. Their main objective was the study of the welding parameters in terms of the transverse shrinkage, angular distortion, deposition efficiency, hardness and tensile strength of the weld joint. They found that SS filler wire was more efficient than MS filler wire. Comparably, Shamsul et al. analyzed the effects of mild steel filler and stainless steel filler metal on the ultimate strength during the dissimilar joining of 304 stainless steel to mild steel [27]. They concluded that the yield strength and tensile strength of the welded samples using mild steel filler metal were slightly lower than welded samples when using stainless steel filler metal. For a slightly different purpose, Kuo et al. studied the effects of single-oxide fluxes on the surface weld morphology and angular distortion [28]. Oxides such as CaO, Fe2O3, Cr2O3 and SiO2 were tested. They observed that SiO2 had beneficial effects in terms of increasing the weld depth and reducing the angular distortion of the dissimilar weldment between mild steel and 316L stainless steel. Nayee et al. investigated dissimilar welding between carbon steel and stainless steel [29]. Their work focused on the effects of the mono-oxides TiO2, ZnO and MnO2 on the mechanical properties and weld aspects of dissimilar ATIG welds. The obtained results were compared with those for conventional dissimilar TIG welds. Under TiO2 and ZnO fluxes, a higher depth/width (D/W) ratio was reported in an ATIG weld compared to conventional TIG welds. The lowest angular distortion was observed under TiO2 flux compared to conventional TIG welds. There is a rising need for dissimilar welding of steel owing to the advantages of this process, such as the production of less expensive engineering components with acceptable corrosion resistance and high strength during power generation, which can be used in the chemical, petrochemical and automotive industries [30,31]. Austenitic stainless steel piping is often used to contain high-temperature steam in power generation plants. Under a certain temperature and pressure, nevertheless, carbon steels performs effectively, and a transition from stainless to other steels is regularly used for economic purposes because carbon steel is much less expensive than stainless steel [32]. Joining 316L stainless steel to mild steel is very challenging owing to the differences in the chemical, physical and metallurgical properties of these materials. The novelty of this work is that we elaborate the optimal flux to obtain a sound joint.
There are no comparative studies in the published literature devoted to the optimization of multicomponent flux in ATIG welding of a dissimilar square butt joining 316L stainless steel to mild steel. Hence, this study aims to improve the process of dissimilar welding of 316L stainless steel to mild steel using the ATIG technique for a 6-mm-thick material in a single pass, without altering the mechanical properties and corrosion resistance. In addition, these joints will be welded without edge preparation or the utilization of filler metals. These achievements will meet the requirements of many industries.

2. Materials and Methods

2.1. Materials

The material used in this study were grade 316L austenitic stainless steel and mild steel. The chemical compositions are shown in Table 1 and Table 2.

2.2. Welding Procedure

The experiments consisted of welding 20 cm lines on a rectangular plate measuring 6 mm in thickness, 200 mm in length and 100 mm in width. Before welding, the plates were cleaned with acetone. The used powders were heated separately in a furnace at 100 °C during 1 h to eliminate humidity. The flux in the form of a paste consisted of a mixture of powders and acetone at a ratio of 1:1. A brush was used to apply the past on plain edges to be joined as shown in Figure 1a. The mean coating density of the flux was about 4–5 mg/cm2. The joints were executed using a motorized carriage TIG welding machine with a square butt weld design without edge preparation, as shown in Figure 1b. Both plates were clamped with a zero gap distance.
The used welding parameters are reported in Table 3.
After the welding process, the samples were cut far from the welding starting point to be sure that the arc welding was stabilized, as shown in Figure 2.

2.3. Design of Experiments Methodology

Design of experiments (DOE) is one of the most important statistical tools for designing high-quality systems at reduced cost. Here, the mixing method was used. The Minitab 17 software (version 17, Minitab, Pennsylvania State University, State College, PA, USA) was the appropriate tool for this study. In the first step, eight kinds of oxides were tested, namely SiO2, TiO2, Fe2O3, Cr2O3, Mn2O3, V2O5, MoO3 and Co2O3. Single oxides were deposited on both materials and a welding operation was carried out. Among these eight oxides, three oxides candidates SiO2, Fe2O3 and Cr2O3, which gave the best penetration depth and a high ration, were selected to be used in the mixing design method. In the second step, based on the simplex lattice degree, four designs were prepared with nineteen combinations from the selected oxides. For each combination, the three selected oxides SiO2, Fe2O3 and Cr2O3 varied and 10% of NaF was added and kept fixed to obtain a pseudo-ternary combination. Finally, the optimal combination obtained comprised 74% SiO2, 3% Fe2O3, 13% Cr2O3 and 10% NaF. Finally, a conventional TIG weld line and another weld line using the ATIG technique were carried out.
The fluorine gases that escape from the weld pool interact with outer arc electrons, leading to a constricted arc [33]. The presence of fluorine in the arc welding reduces the anode spot and tends to increase the energy density of the heat source and electromagnetic force in the weld pool. As a result, a relatively narrow and deep weld morphology is formed [34,35]. The Optimizer module available in Minitab 17 software was used to obtain an optimal composition. In the last step, the optimal combination of the flux was tested, then the ATIG weld was carried out and compared to the conventional TIG weld bead.

2.4. Weld Bead Aspect

Weld aspects were checked using Motic software (version 2, Motic Images 3.0, Xiamen, China) integrated with an optical microscope for both ATIG and conventional TIG welds. The measurements of the ratio were performed on the partial penetration weld as shown in Figure 3a and for the full penetration weld, measurements were carried out according to Figure 3b. The optimal flux that would give the maximum depth and ratio, which resulted from the weld bead aspect study, was used to investigate the mechanical properties and corrosion resistance.

2.5. Microstructure Assessment

Microstructural characterization of the fusion zones of both TIG and ATIG welding was performed. Micrographs were taken on a JEOL JSM-7600F scanning electronic microscope (SEM) (JEOL, Tokyo, Japan). The mild steel side was etched using a 4% Nital solution, while the 316L SS side and weld zone were etched using a Glyceregia solution (15 mL HCl + 5 mL HNO3 + 10 mL glycerol).

2.6. Tensile Test

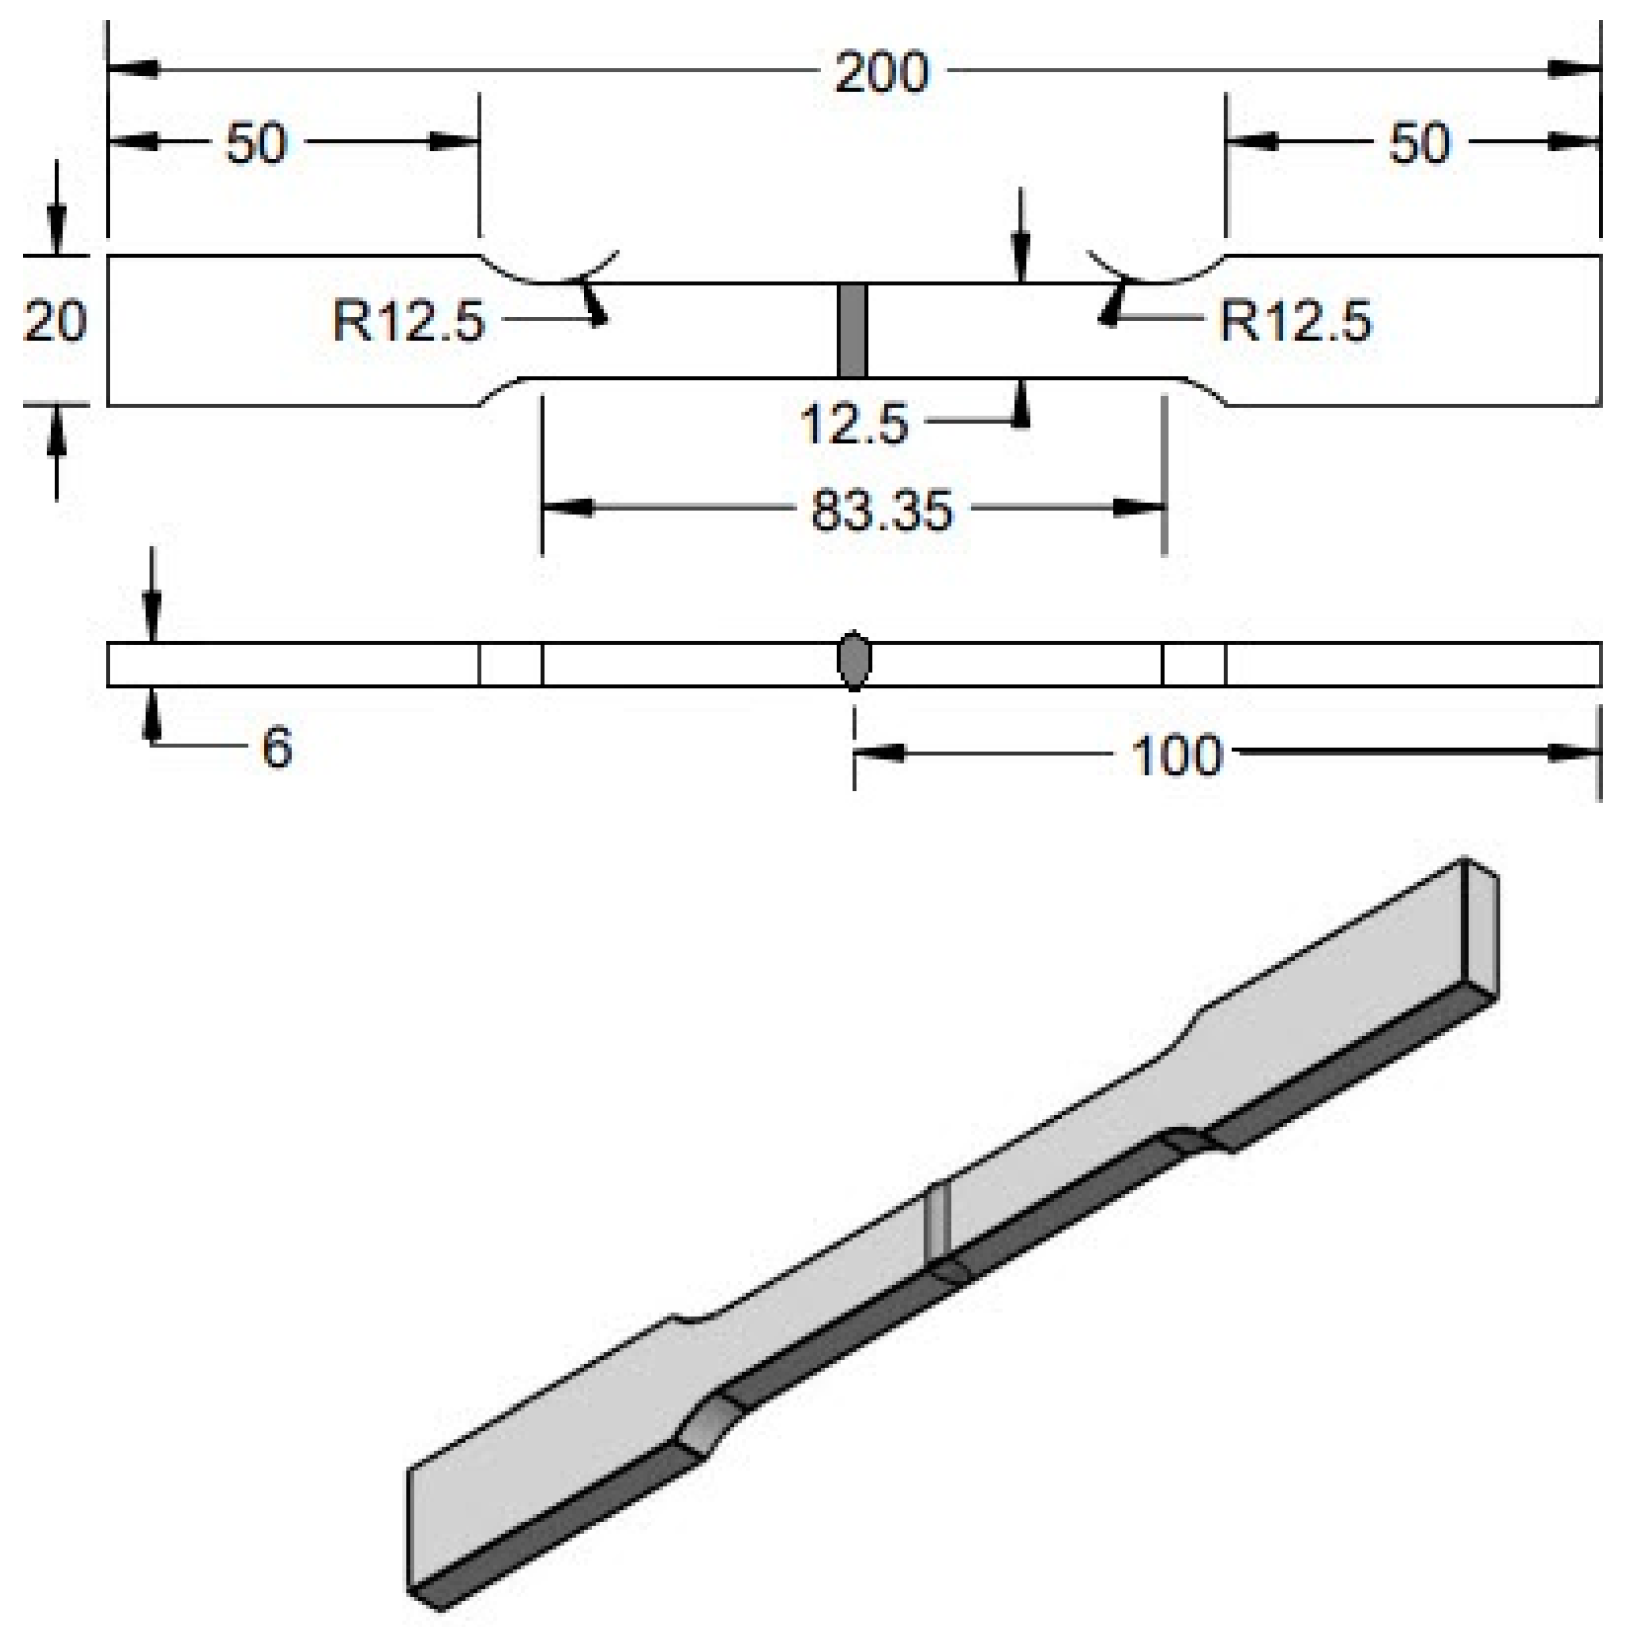
The tensile tests were performed with a model WAW-300E computer-controlled electrohydraulic servo universal testing machine ((Jinan testing equipment IE, Jinan, China) at a test rate of 0.5 mm/min, with a 0.5 kN/s load rate and 1.6 × 10⁻⁴ s−1 low-strain rate at room temperature. The tensile tests were performed with butt joints on 3 samples for each category, which were a TIG MS/316L SS dissimilar weld, optimal ATIG MS/316L SS dissimilar weld, TIG MS/MS weld and TIG 316L SS/316L SS weld. All samples were fabricated according to the requirements of ASTM E8M-04, as shown in Figure 4.

2.7. Hardness Test

Micro-Vickers hardness tests were performed using a model HVS-50 digital hardness tester (SCTMC, Shanghai, China) with a standard load of 100 gf and a dwell time of 10 s. The test was conducted according to ASTM E-384-99. The hardness line and track indentation are displayed in Figure 5. The measurements were performed on each sample with about 0.5 mm between two indentations. The hardness measurement line was 2 mm from the top surface.

2.8. Impact Test

Impact tests were performed on 3 TIG and 3 ATIG dissimilar weld samples. Specimens were prepared according to ASTM E23, as shown in Figure 6. The test was conducted at room temperature using a Charpy “V” notch impact testing machine model JBS-500 (Jinan testing equipment IE, Jinan, China).

2.9. Corrosion Behaviour

To investigate the corrosion behavior of TIG and ATIG welds, potentiodynamic polarization tests were performed using an AUTOLAB-PGSTAT302N potentiostat system (Metrohm, Utrecht, The Netherlands). The samples were cut to the dimensions of 20 × 10 mm2 and finely polished up to 1200 grit with SiC Emery paper. The tests were conducted on ASS and CS base metals and TIG and ATIG dissimilar welded materials. The data were collected after 1 h of immersion in 3.5% NaCl solution at room temperature. Potentiodynamic polarization curves were obtained by scanning the potential from −1.200 V in the forward direction to 0.0 mV vs. Ag/AgCl at a scan rate of 1.0 mV/s. Silver chloride (Ag/AgCl) was used as the reference electrode, platinum (Pt) as the auxiliary electrode and the sample as the working electrode.

3. Results and Discussions

3.1. Weld Bead Aspects

3.1.1. Selection of Candidate Oxides

Eight oxides were tested. The weld line was executed using the butt join design. It can be clearly seen in Table 4 that the highest depth and ratio values were 5.96 mm and 0.49, respectively, which were obtained for sample welded with SiO2 flux, followed by the sample welded with Fe2O3 flux with 5.59 mm and 0.40, respectively, then by the sample welded with Cr2O3 flux with 4.33 mm and 0.39, respectively. Therefore, the selected oxides were SiO2, Fe2O3 and Cr2O3.

3.1.2. Mixture Contour Plot

DOE is one of the most important statistical tools for designing high-quality systems at reduced cost. It is a rigorous approach to solving engineering problems. DOE is used to obtain the maximum amount of useful information with the least amount of experimentation, which is advantageous as experiments cost money. The mixture method was the most recommended tool for our experiments. Based on a simplex lattice degree of four, nineteen compositions suggested by Minitab 17 software were prepared with different proportions of the selected oxides. For each combination, the three selected oxides SiO2, Fe2O3 and Cr2O3 varied and 10% NaF was added and kept fixed to obtain a pseudo-ternary combination. Table 5 shows the chemical compositions and results of the weld depths and ratios of the nineteen flux combinations. Figure 7 shows the location of each combination in the mixture design space.
The input data were the flux compositions and the output responses were the depth D and ratio R. Triangular coordinate systems allow the relationships between the components to be visualized in a three-component mixture.
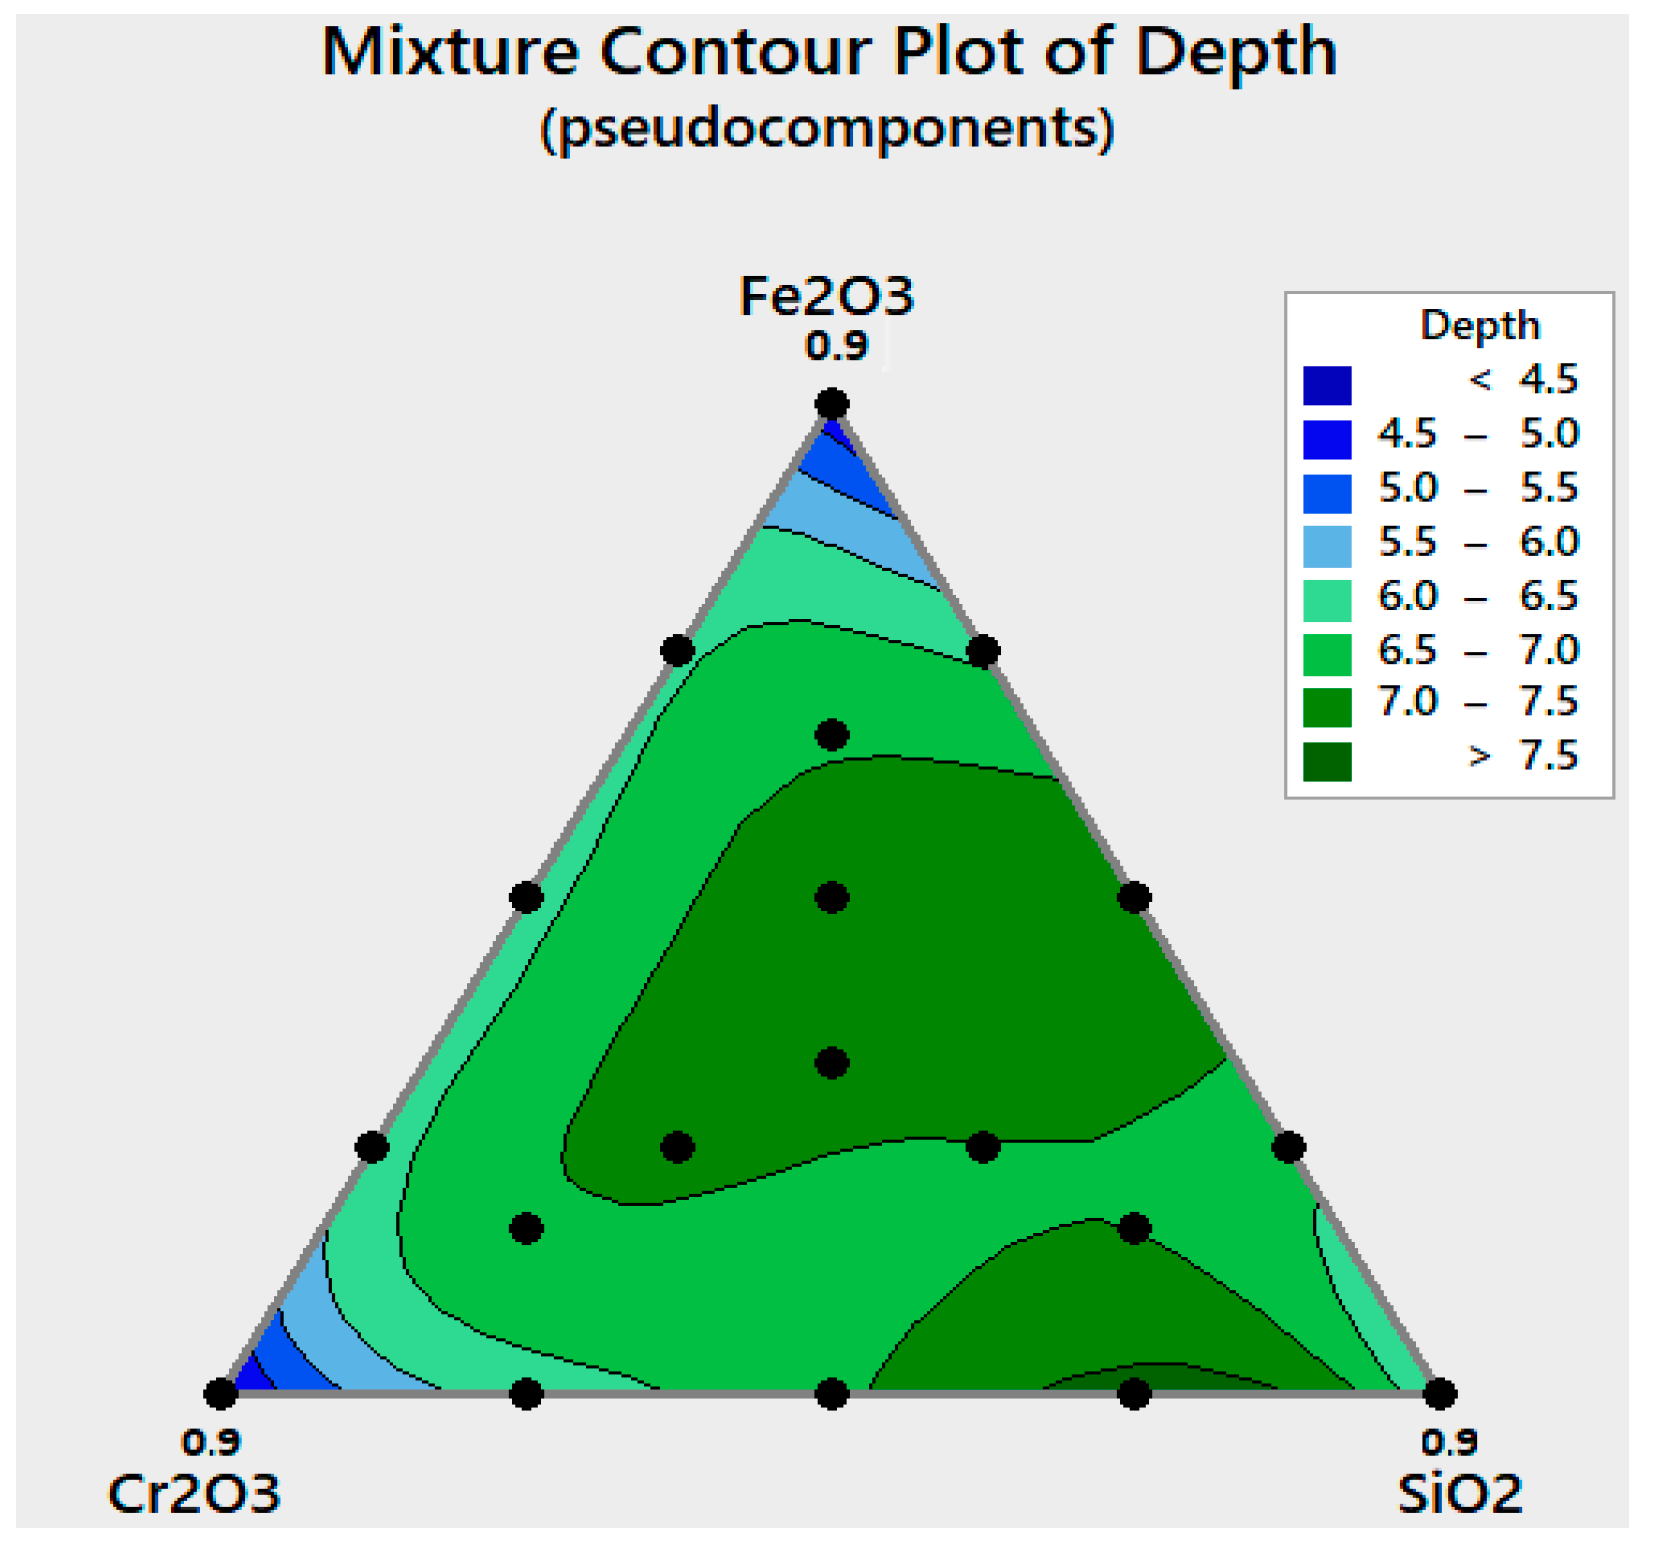
The mixture contour plot for depth shows the expected main region where the maximum depth can be attained close to silicon dioxide, as shown in Figure 8.
The mixture contour plot for the ratio shows green dark regions where the maximum depth can be attained, as shown in Figure 9. The Optimizer module available in Minitab 17 software was used to obtain the optimal composition. The optimization plot in Figure 10 shows how the input data for Fe2O3, Cr2O3 and SiO2 affect the predicted responses in terms of the depth D and ratio R. Numbers at the tops of the columns show the current variable settings and the high and low variable settings in the data. The two points for each cell represent the two levels of the categorical variable, with 0.9 as the high level and level 0 as the low level. The in-between level represents the best mixing flux composition, which is 74% SiO2 + 13% Cr2O3 + 3% Fe2O3 + 10% NaF. The first column in Figure 10 contains, for the current variable settings, the predicted response “y” and the individual desirability score “d”. Therefore, the predicted response for the depth is y = 7.36 mm and the corresponding desirability is 0.99. The predicted response for the ratio is y = 1.29 and the corresponding desirability is 0.99. The overall composite desirability is 0.98. This indicates that the variables achieve favorable results for all responses, which means that both responses are within acceptable limits.

3.1.3. Confirmation Test

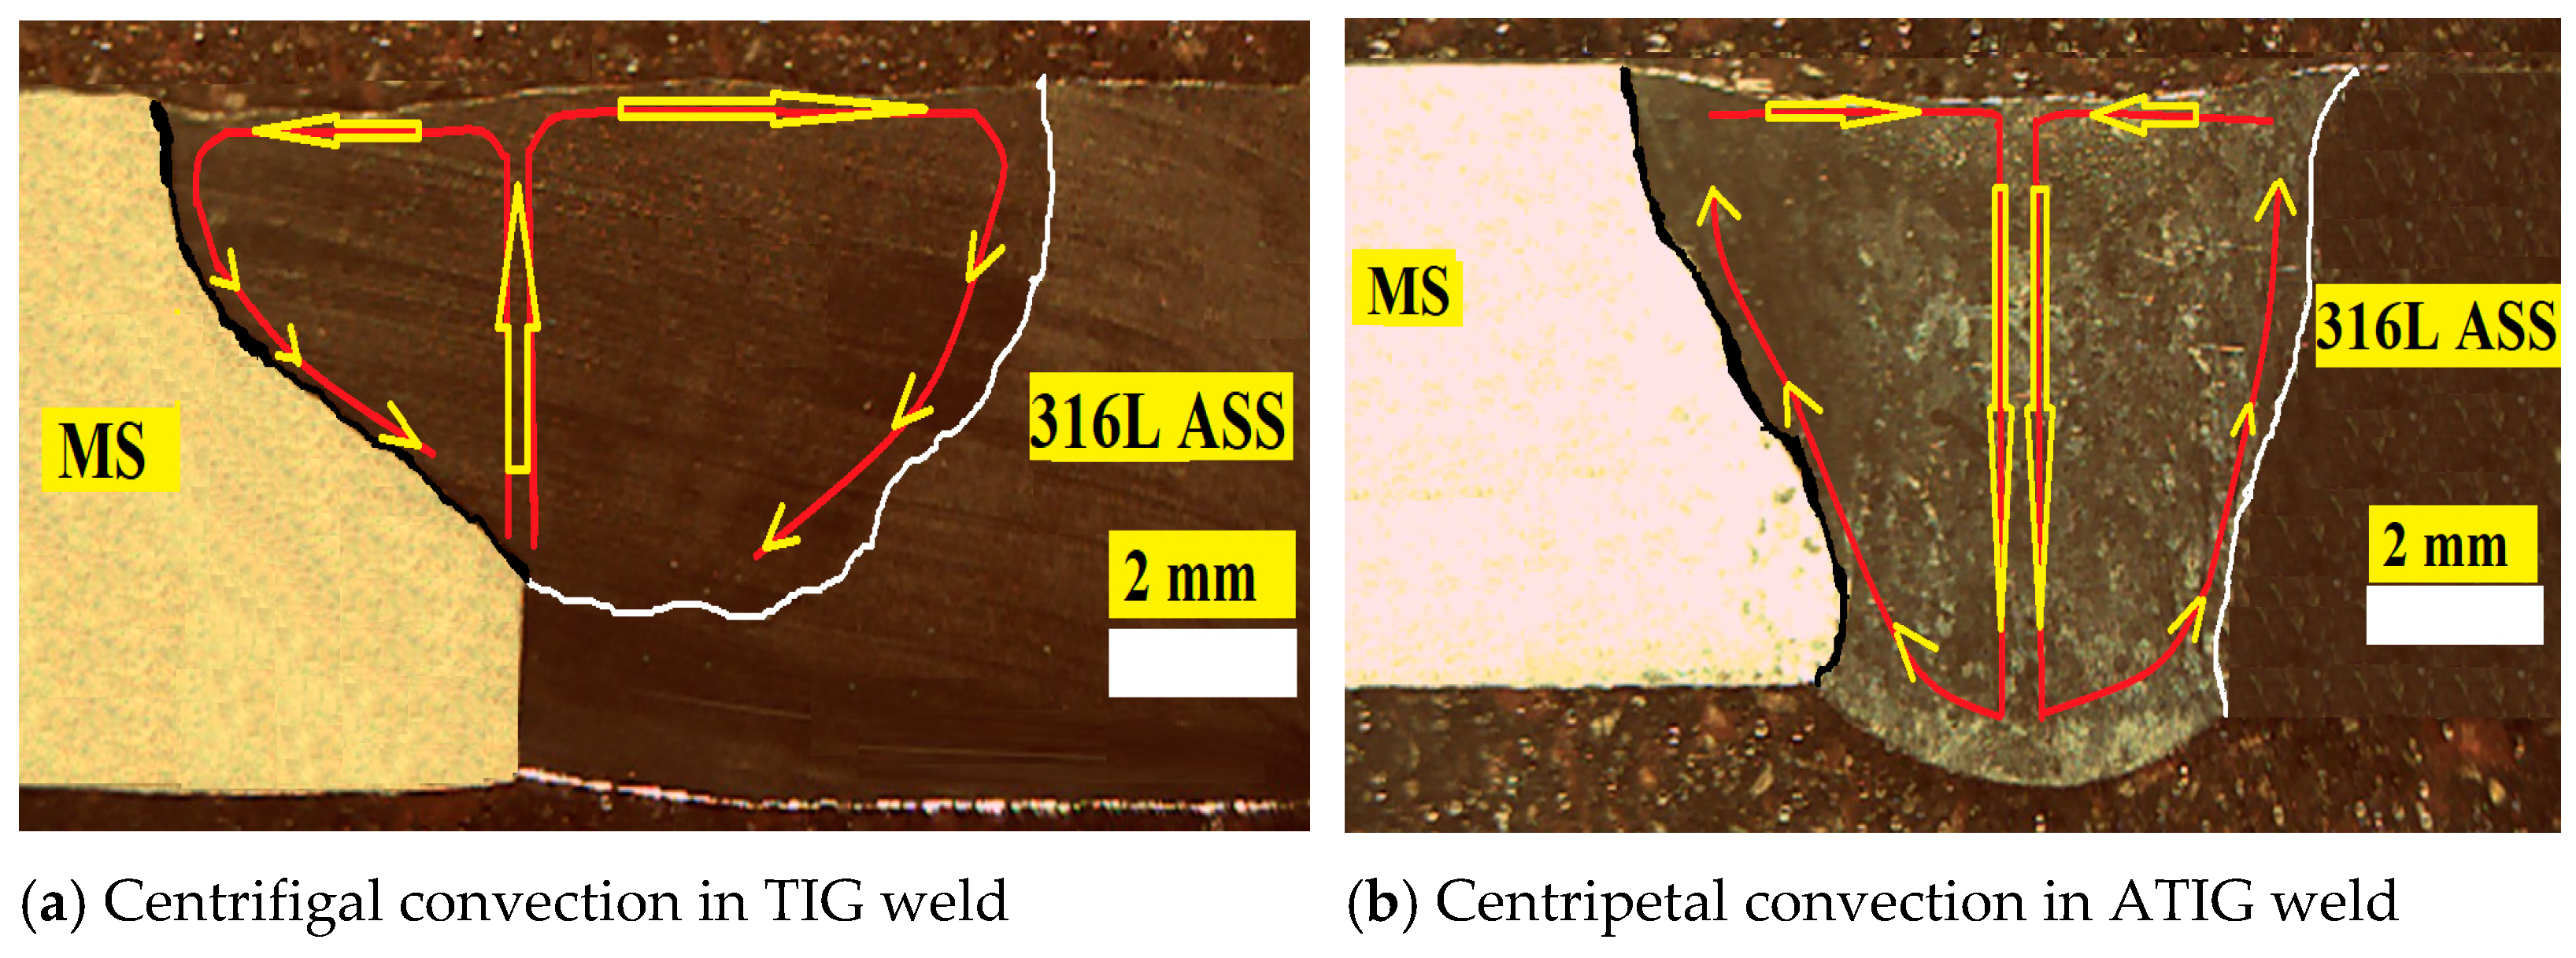
In the next step where the optimal flux was tested, ATIG welding was carried out and compared to conventional TIG weld beads. The cross-sections of the weld beads were photographed using a CAROLINA optical microscope (CAROLINA, Burlington, VT, USA). The obtained penetration depth D was 6.9 mm and the bead face width W was 8.8 mm, leading to a (D + WB)/WF aspect ratio of 1.35. Hence, the depth was increased by about 1.86 times comparatively to conventional TIG welding and the ratio was enhanced by about 4.3 times; better yet, the measured depth weld bead was higher than the predicted value of 7.79 mm. The depth bead profile data for the ATIG weldments with the optimal flux and for the conventional TIG weldments are listed in Table 6. Figure 11 presents macrographs showing the cross-sections of TIG weld beads and ATIG beads welded with optimal flux. It is clearly shown that the ATIG bead has full penetration.
We note that the ATIG weld bead has a symmetrical shape; however, the TIG weld bead is shifted to the 316L SS material side, as shown in Figure 11a. In TIG welding, the sulfur content in mild steel is higher than in 316L stainless steel by 8.56 times; therefore, sulfur as the surfactant element contributes to reducing the surface tension of liquid on mild steel. The surface tension of molten metal is higher for 316L SS in comparison to that for MS. The molten metal and heat are mostly directed from the weld pool center to the 316L SS side in a centrifugal pattern represented by arrows yielding in an asymmetric weld bead, as reported by Brahima et al. [36]. In ATIG welding, oxygen released during the welding operation is homogenously distributed on both sides of the two edges to be welded. In this case, the effect of the difference in the proportions of sulfur contained in the materials to be joined is almost eliminated. Oxygen dissociated from the flux would change the temperature coefficient of the surface tension to a positive value. Hence, the molten metal moves from the edges to the center of the weld pool in a centripetal path represented by arrows, that results in a fully penetrated symmetrical bead, as shown in Figure 11b. In addition, fluorine contained in the flux migrates to the arc weld and contributes to increasing the energy density according to the constriction arc mechanism explained before. We note that the areas of the melted zones of both materials are almost the same as in the ATIG dissimilar weld. However, the area of the melted zone of 316L SS is double than that of MS in the joint carried out with conventional TIG dissimilar welding, as shown in Table 7.
We remark that the TIG weld is dissymmetric and the area of 316L SS side is almost double than that of MS side. However, the ATIG weld exhibits a symmetric geometry with almost the same weld bead areas of 22.1 mm2 and 24.5 mm2 for the MS side and 316L SS side, respectively.
In the conventional TIG welding process, it is not possible to achieve full penetration for a 6-mm-thick dissimilar weld. A conventional TIG specimen was welded on both sides to achieve a full-penetration weld, an operation which is often carried out in industrial practice. By doing so, TIG specimens could be compared to ATIG welds in subsequent investigations.

3.2. Microstructure Assessment

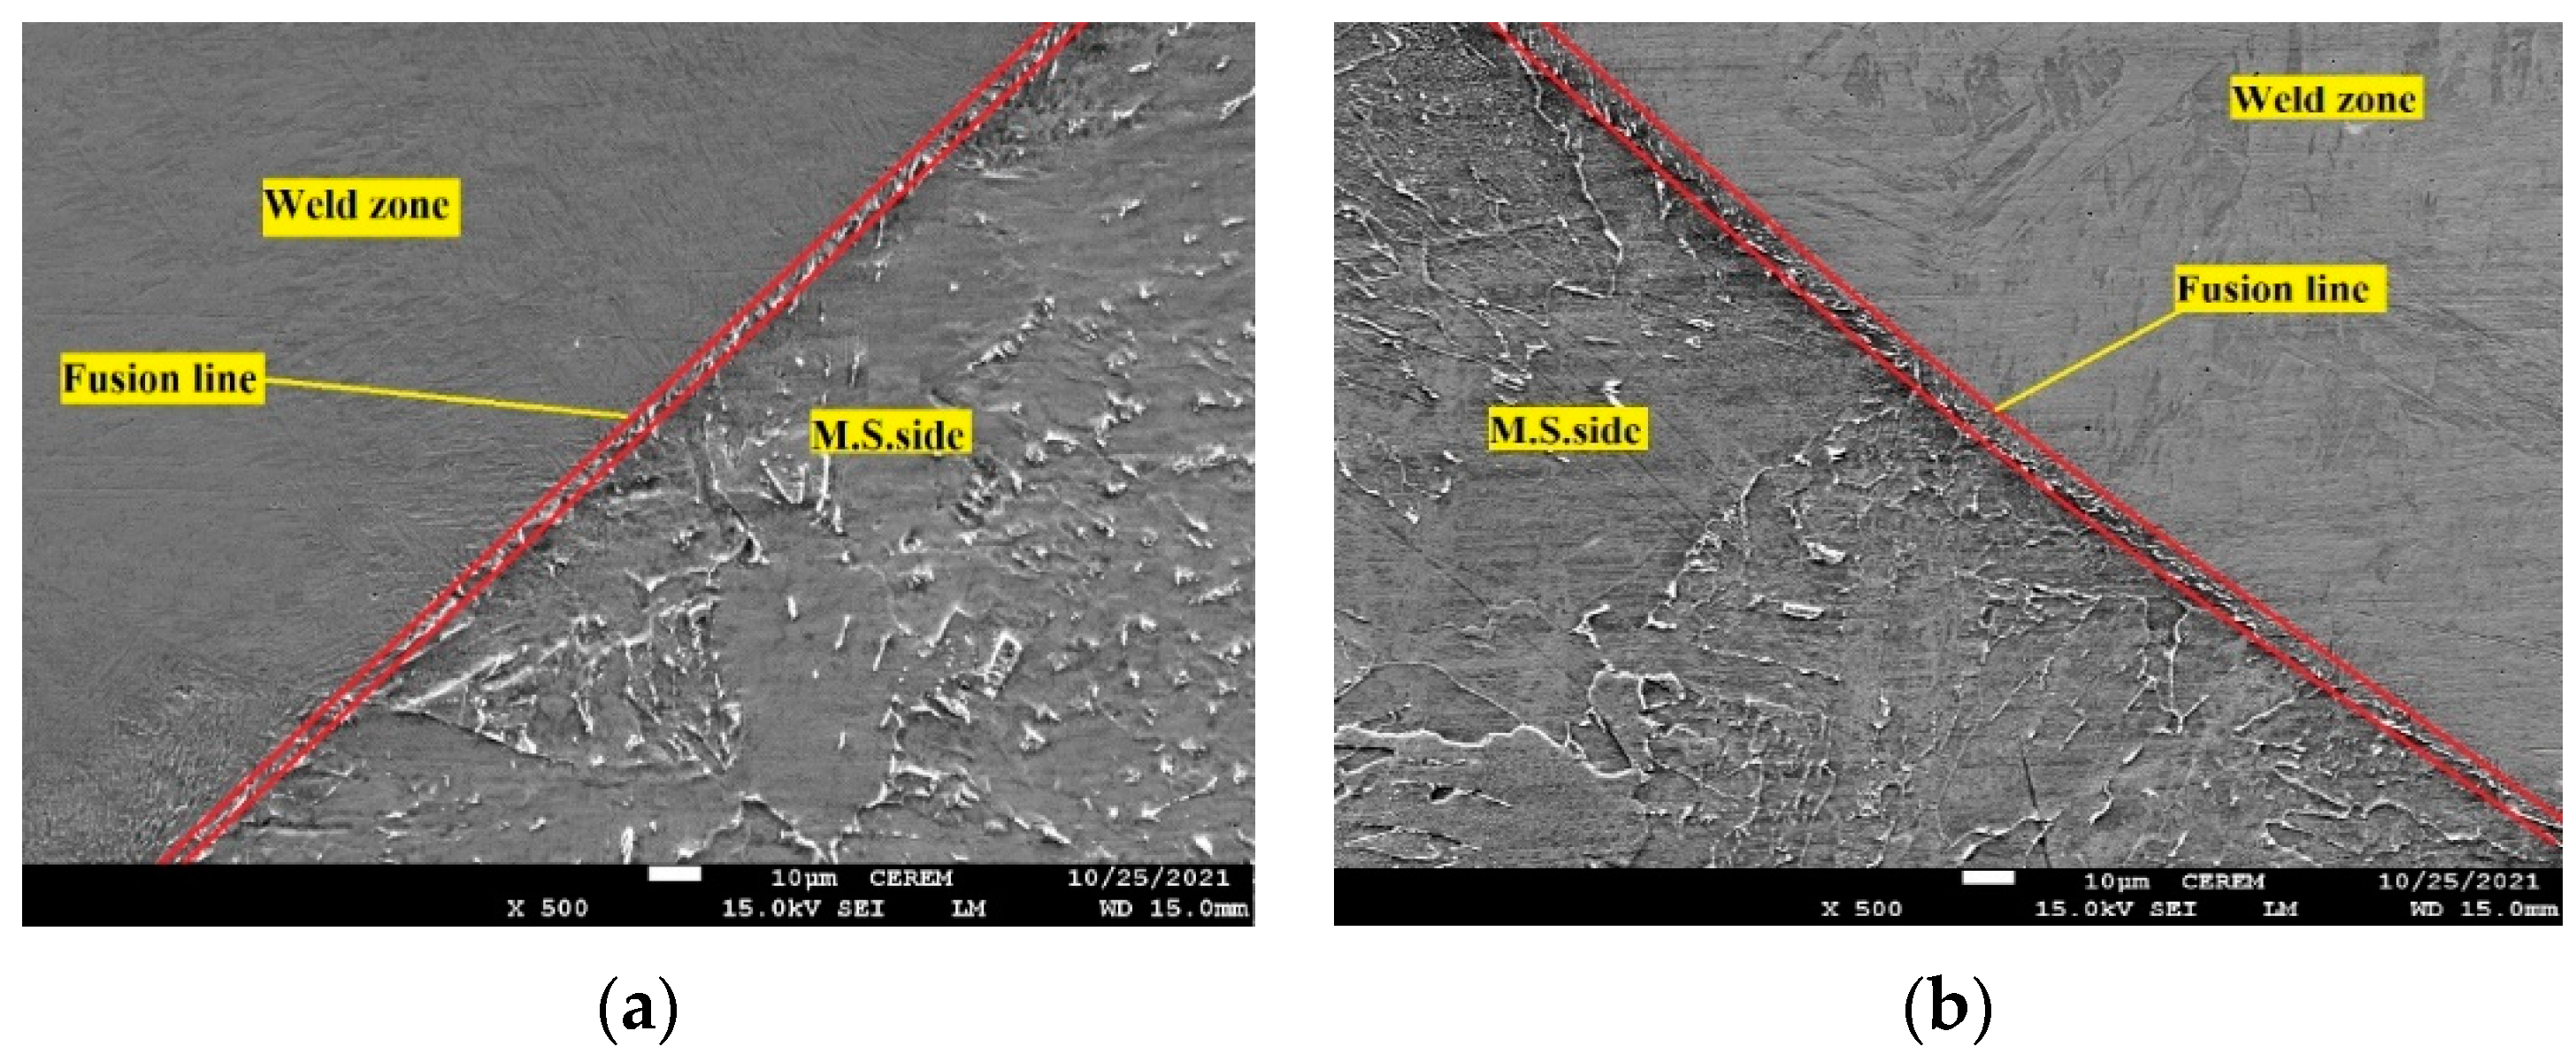
While joining 316L SS and MS, the mixing of the molten materials causes a change in the chemical composition of the fusion zone of the elements from the parent materials. Small amounts of δ-ferrite were observed in the HAZs in both TIG and ATIG dissimilar welds on the 316L SS side. The HAZ width 316L side of the ATIG specimen was slightly narrower (20 μm) than that of the TIG specimen (30 μm). This aspect, in the case of ATIG welding, can be ascribed to the provided low heat leading to a rapid cooling rate. Moreover, in ATIG welding, an irregularity of 3 µm wide was observed at the mild steel border and 5 µm band was also revealed in mild steel neighboring the fusion line of the weld zone, as shown in Figure 12 and Figure 13. On the other hand, the HAZ width in the 316L SS side was wider than that on the MS side owing to the higher thermal conductivity of MS (49 W/m°K at 200 °C) in comparison to that of 316L SS (15 W/m°K at 200 °C) [37].
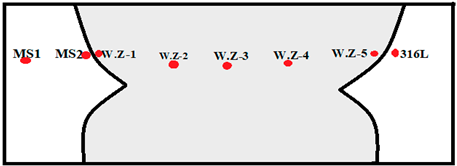
A weld chemistry composition assessment was carried out using an EDS point scan from the MS side to the 316L side for an MS–316L SS dissimilar TIG weld. Table 8 summarizes the chemical composition of obtained dissimilar TIG specimen joined along the horizontal line from the MS side to the 316L SS side throughout the TIG weld region. The obtained analysis revealed decreases in chromium and nickel contents from the 316L SS side to the MS side throughout the weld zone. In contrast, an increase in iron content in the same direction was noticed.
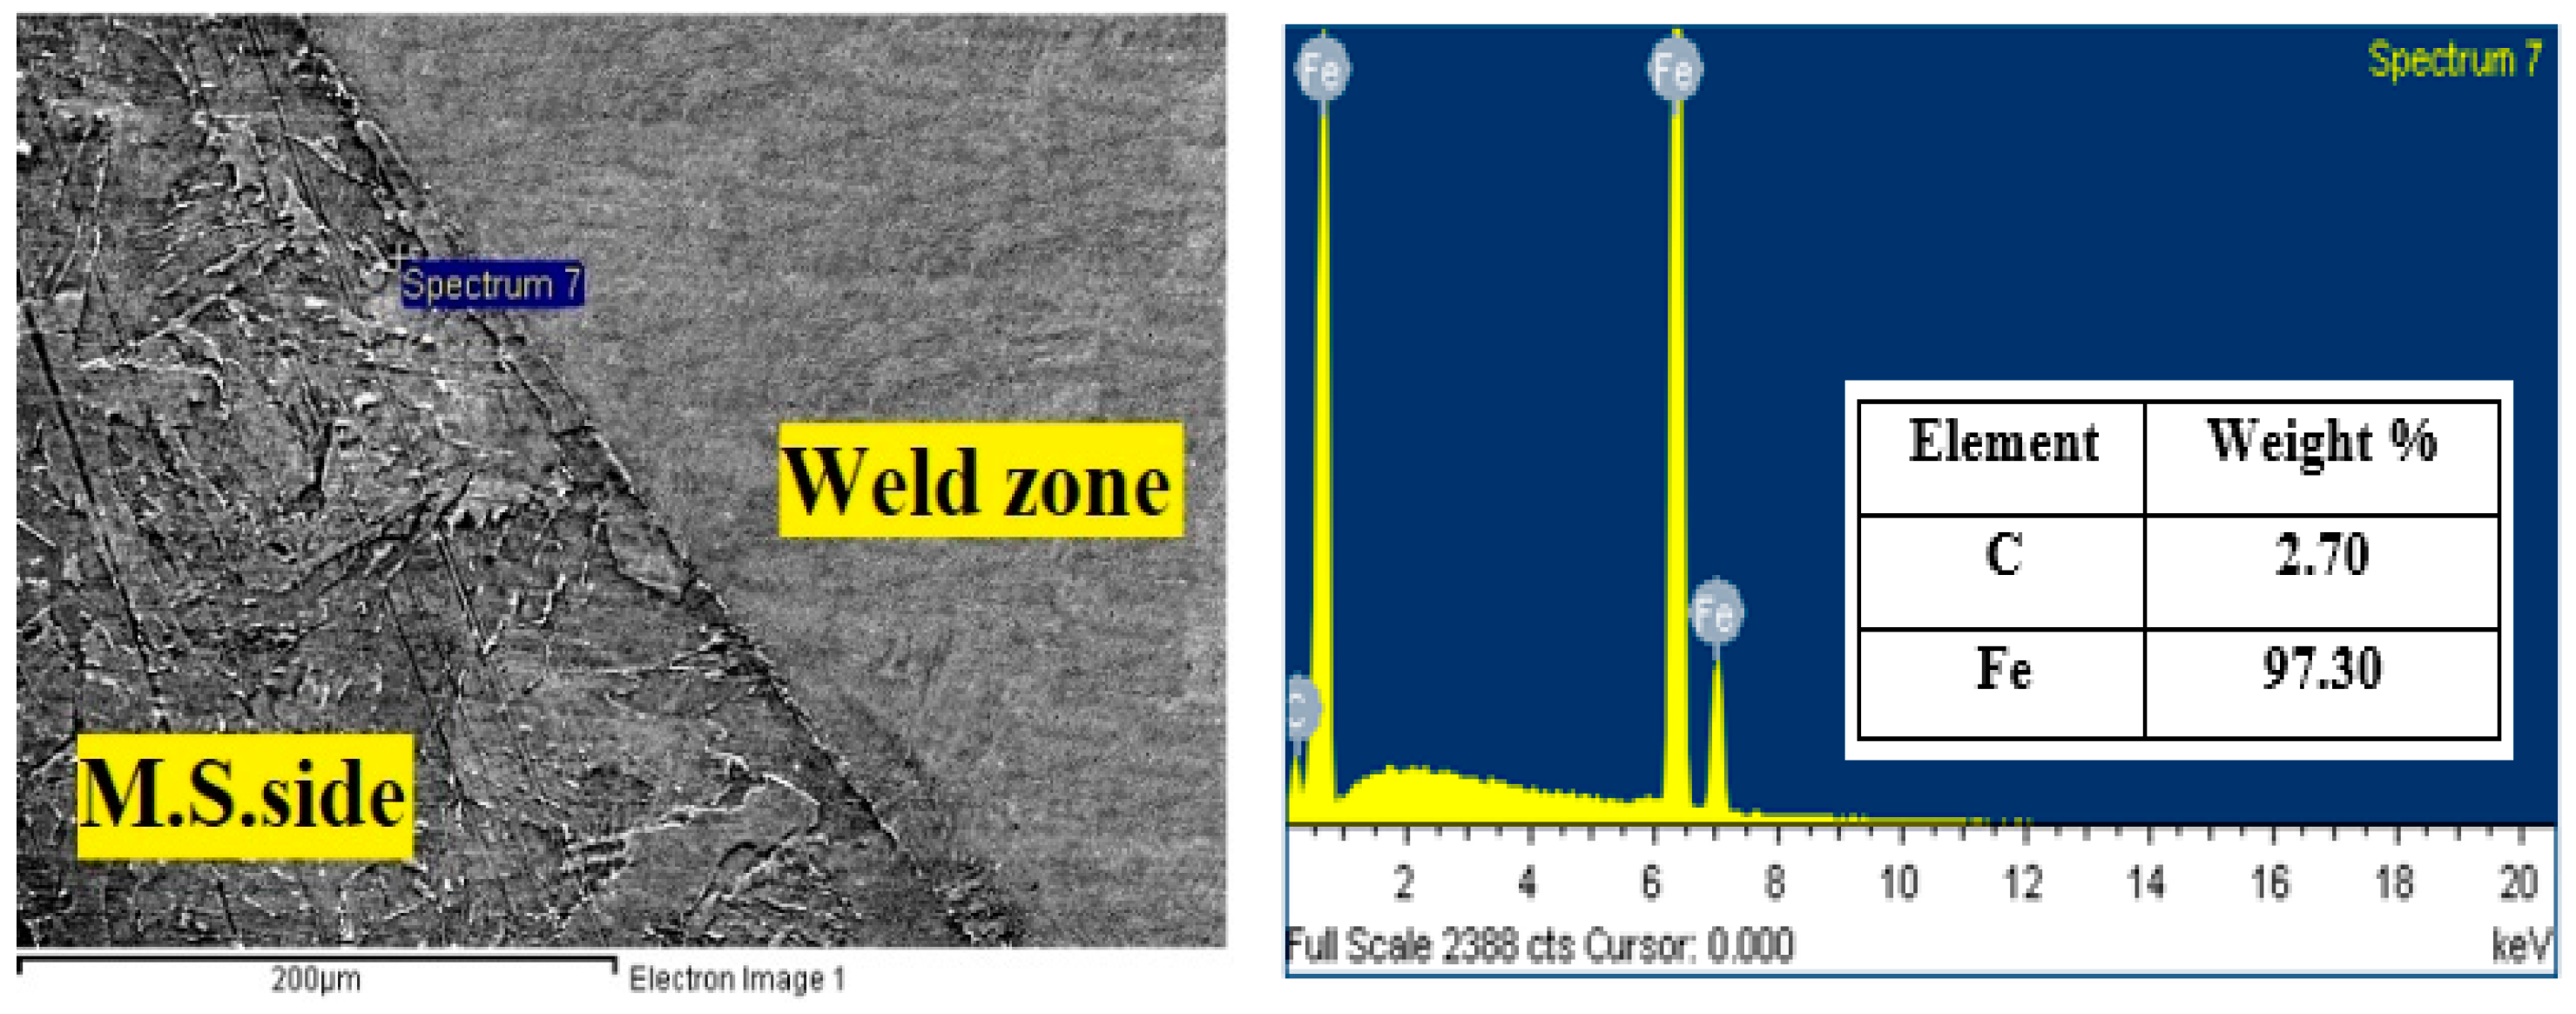
Figure 14 shows carbon depletion at the MS side close to the fusion zone and carbon migration to the weld zone, as displayed in Figure 15.
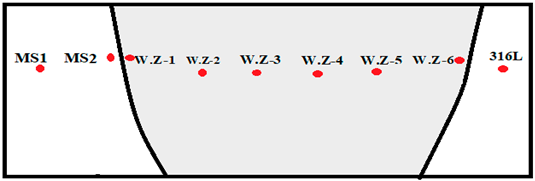
Energy-dispersive spectroscopy (EDS) using a point scan was also performed from the MS side to the 316L SS side for an MS–316L SS dissimilar ATIG weld. The results are shown in Table 9 for the iron and chromium distribution in the cross-section of the weld. The chromium, nickel and iron have a linear distribution, with decreases in chromium and nickel from the 316L SS side to the MS side throughout the ATIG weld zone. On the other hand, iron decreases from BM on the MS side to the 316L SS side throughout the ATIG weld zone.
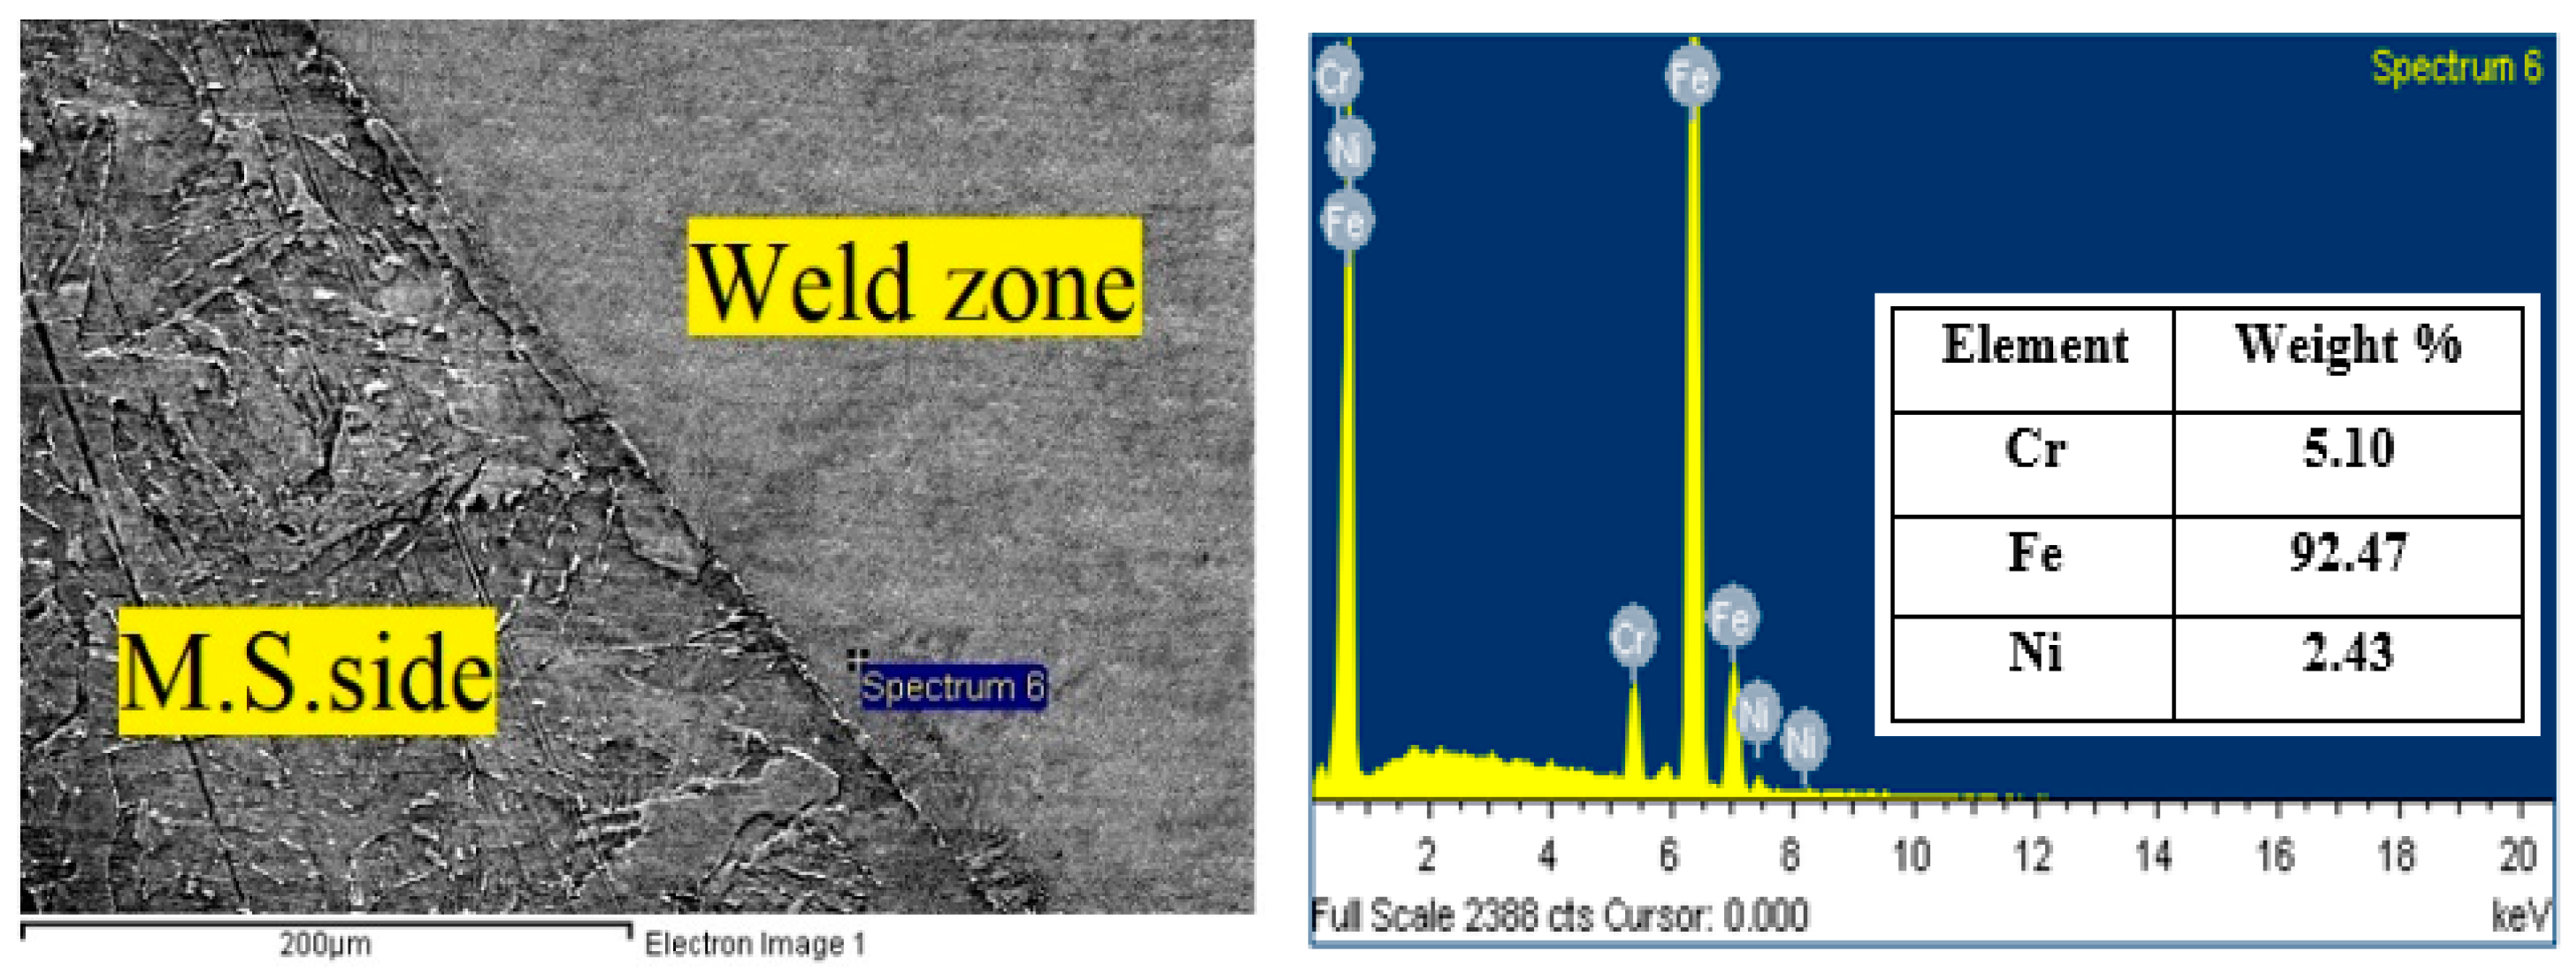
We noticed that the border zone between the MS and weld zone was not subjected to carbon migration owing to the rapid cooling rate of the ATIG weld, as shown in Figure 16 and Figure 17.

3.3. Tensile Test

The average UTS value for the ATIG dissimilar weld was 378 MPa, which was slightly greater than that of the conventional TIG weld (376 MPa), as shown in Table 10.
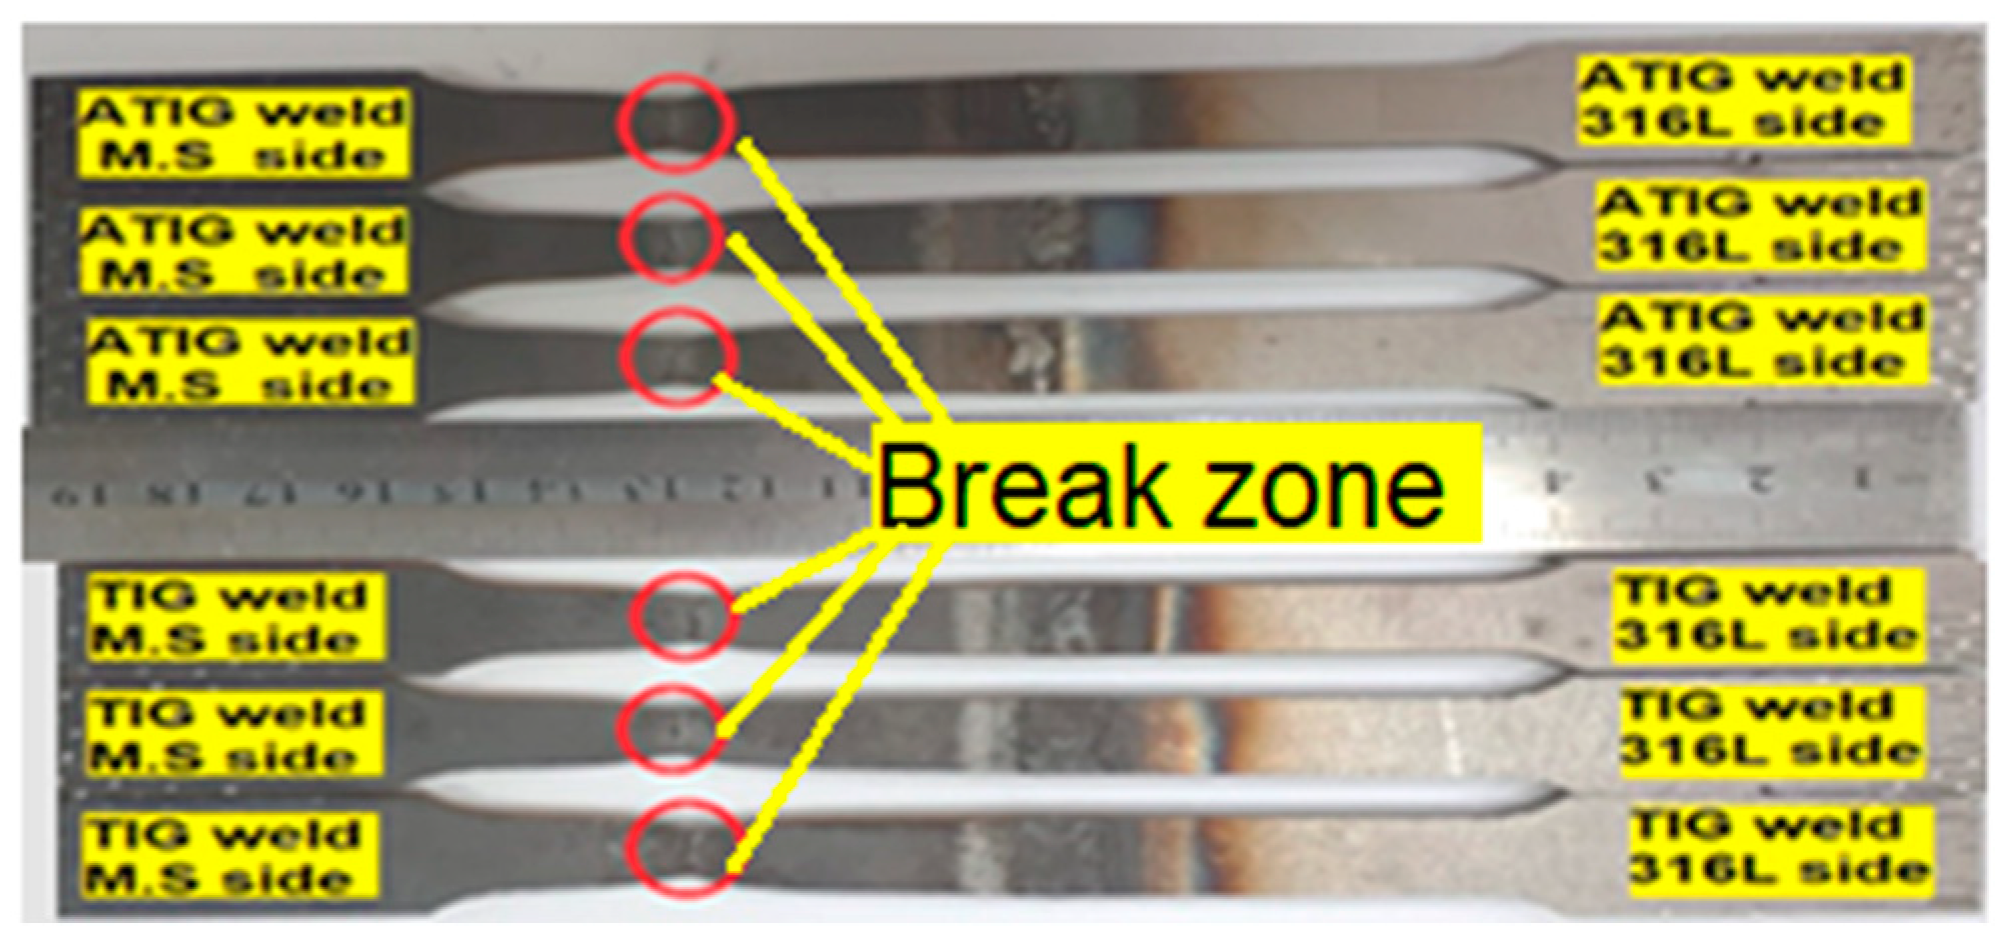
The standard deviation values (σ), which were 4 MPa or less, attest to the accuracy and reliability of the obtained results. Figure 18 clearly shows that the fractures in the tensile tests for both ATIG and TIG dissimilar welds occurred on the mild steel side, confirming the weakness of this location relative to the entire test specimen. The same result was reported by Huang et al. [38]. This indicates that the weld metal was stronger than the MS base metal and that the integrity of the weld joint was good. Thus, the strength of the weld joint was obviously higher than that the value obtained in the tensile test.
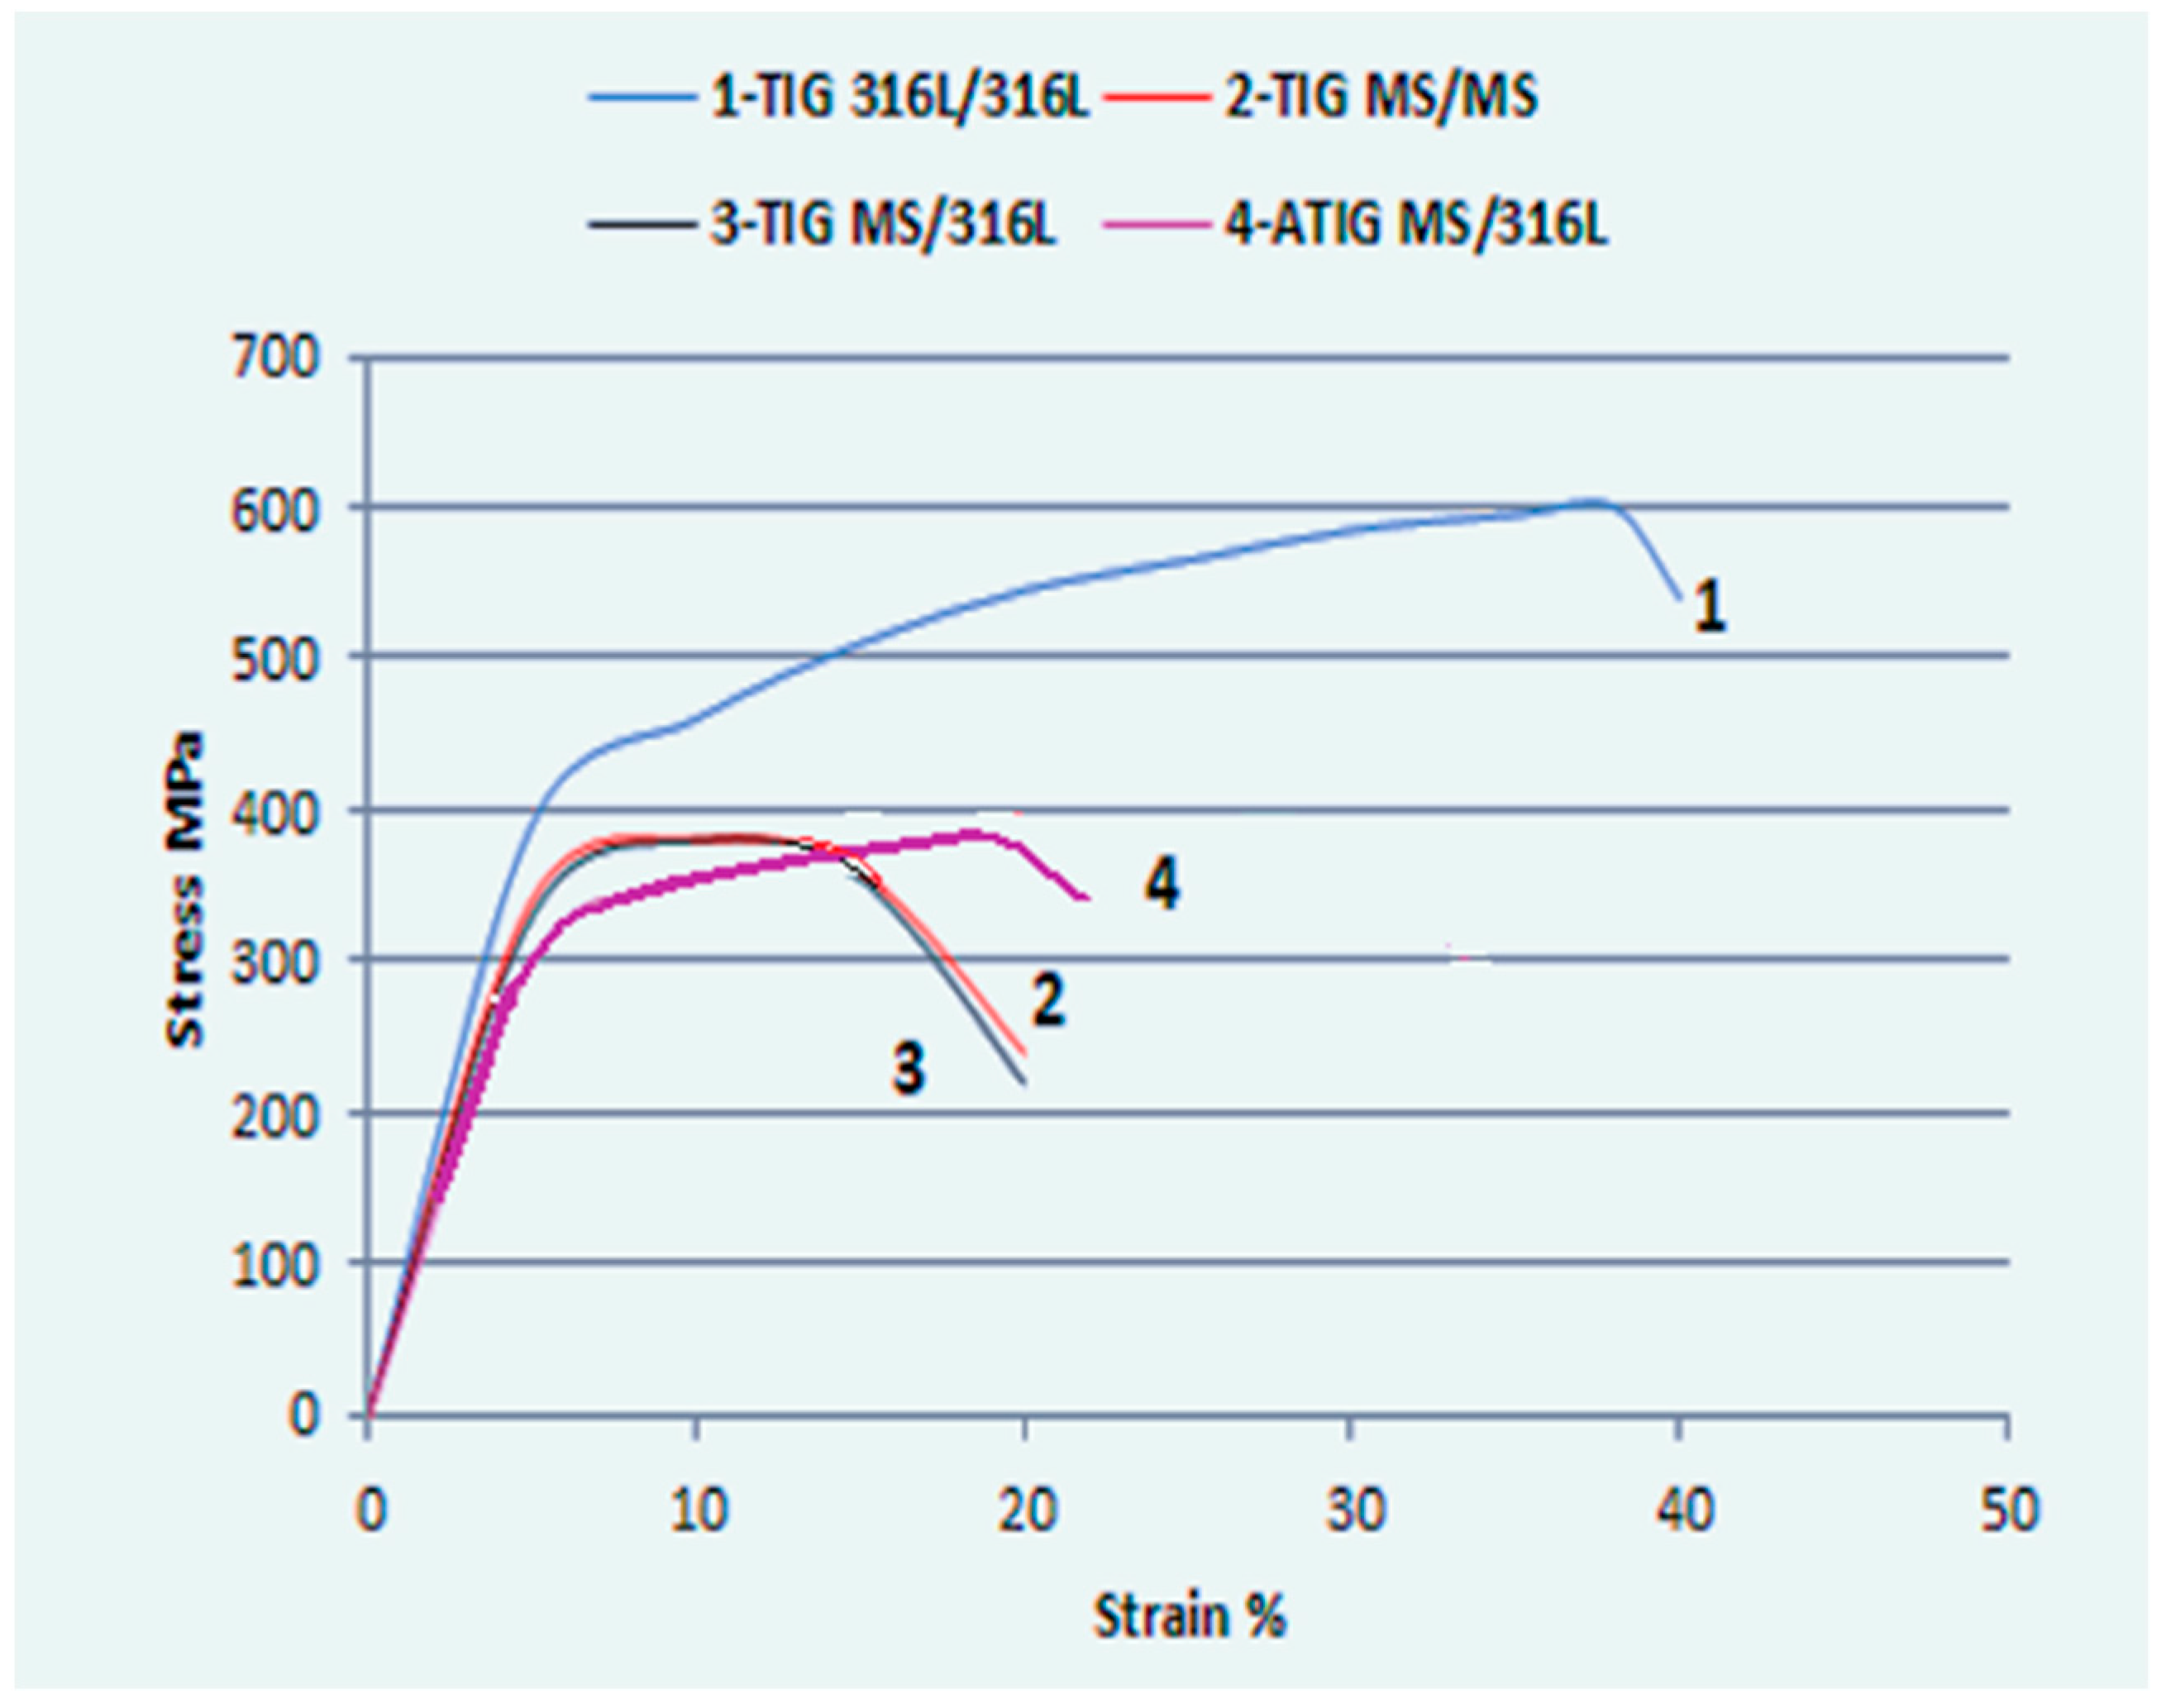
Figure 19 displays the behavior in the tensile test of the different types of specimens, which were TIG 316L/316L, TIG MS/MS, dissimilar TIG MS/316L and optimal dissimilar ATIG MS/316L. Referring to Figure 19, for #3 and #4, the dissimilar ATIG weld exhibits greater elongation than the dissimilar TIG weld, resulting in greater ductility of the ATIG weld than the TIG weld. However, the yield point of the dissimilar ATIG weld is slightly lower than that of conventional dissimilar TIG. Regardless, the dissimilar ATIG and TIG welds show almost the same strength.

3.4. Hardness Test

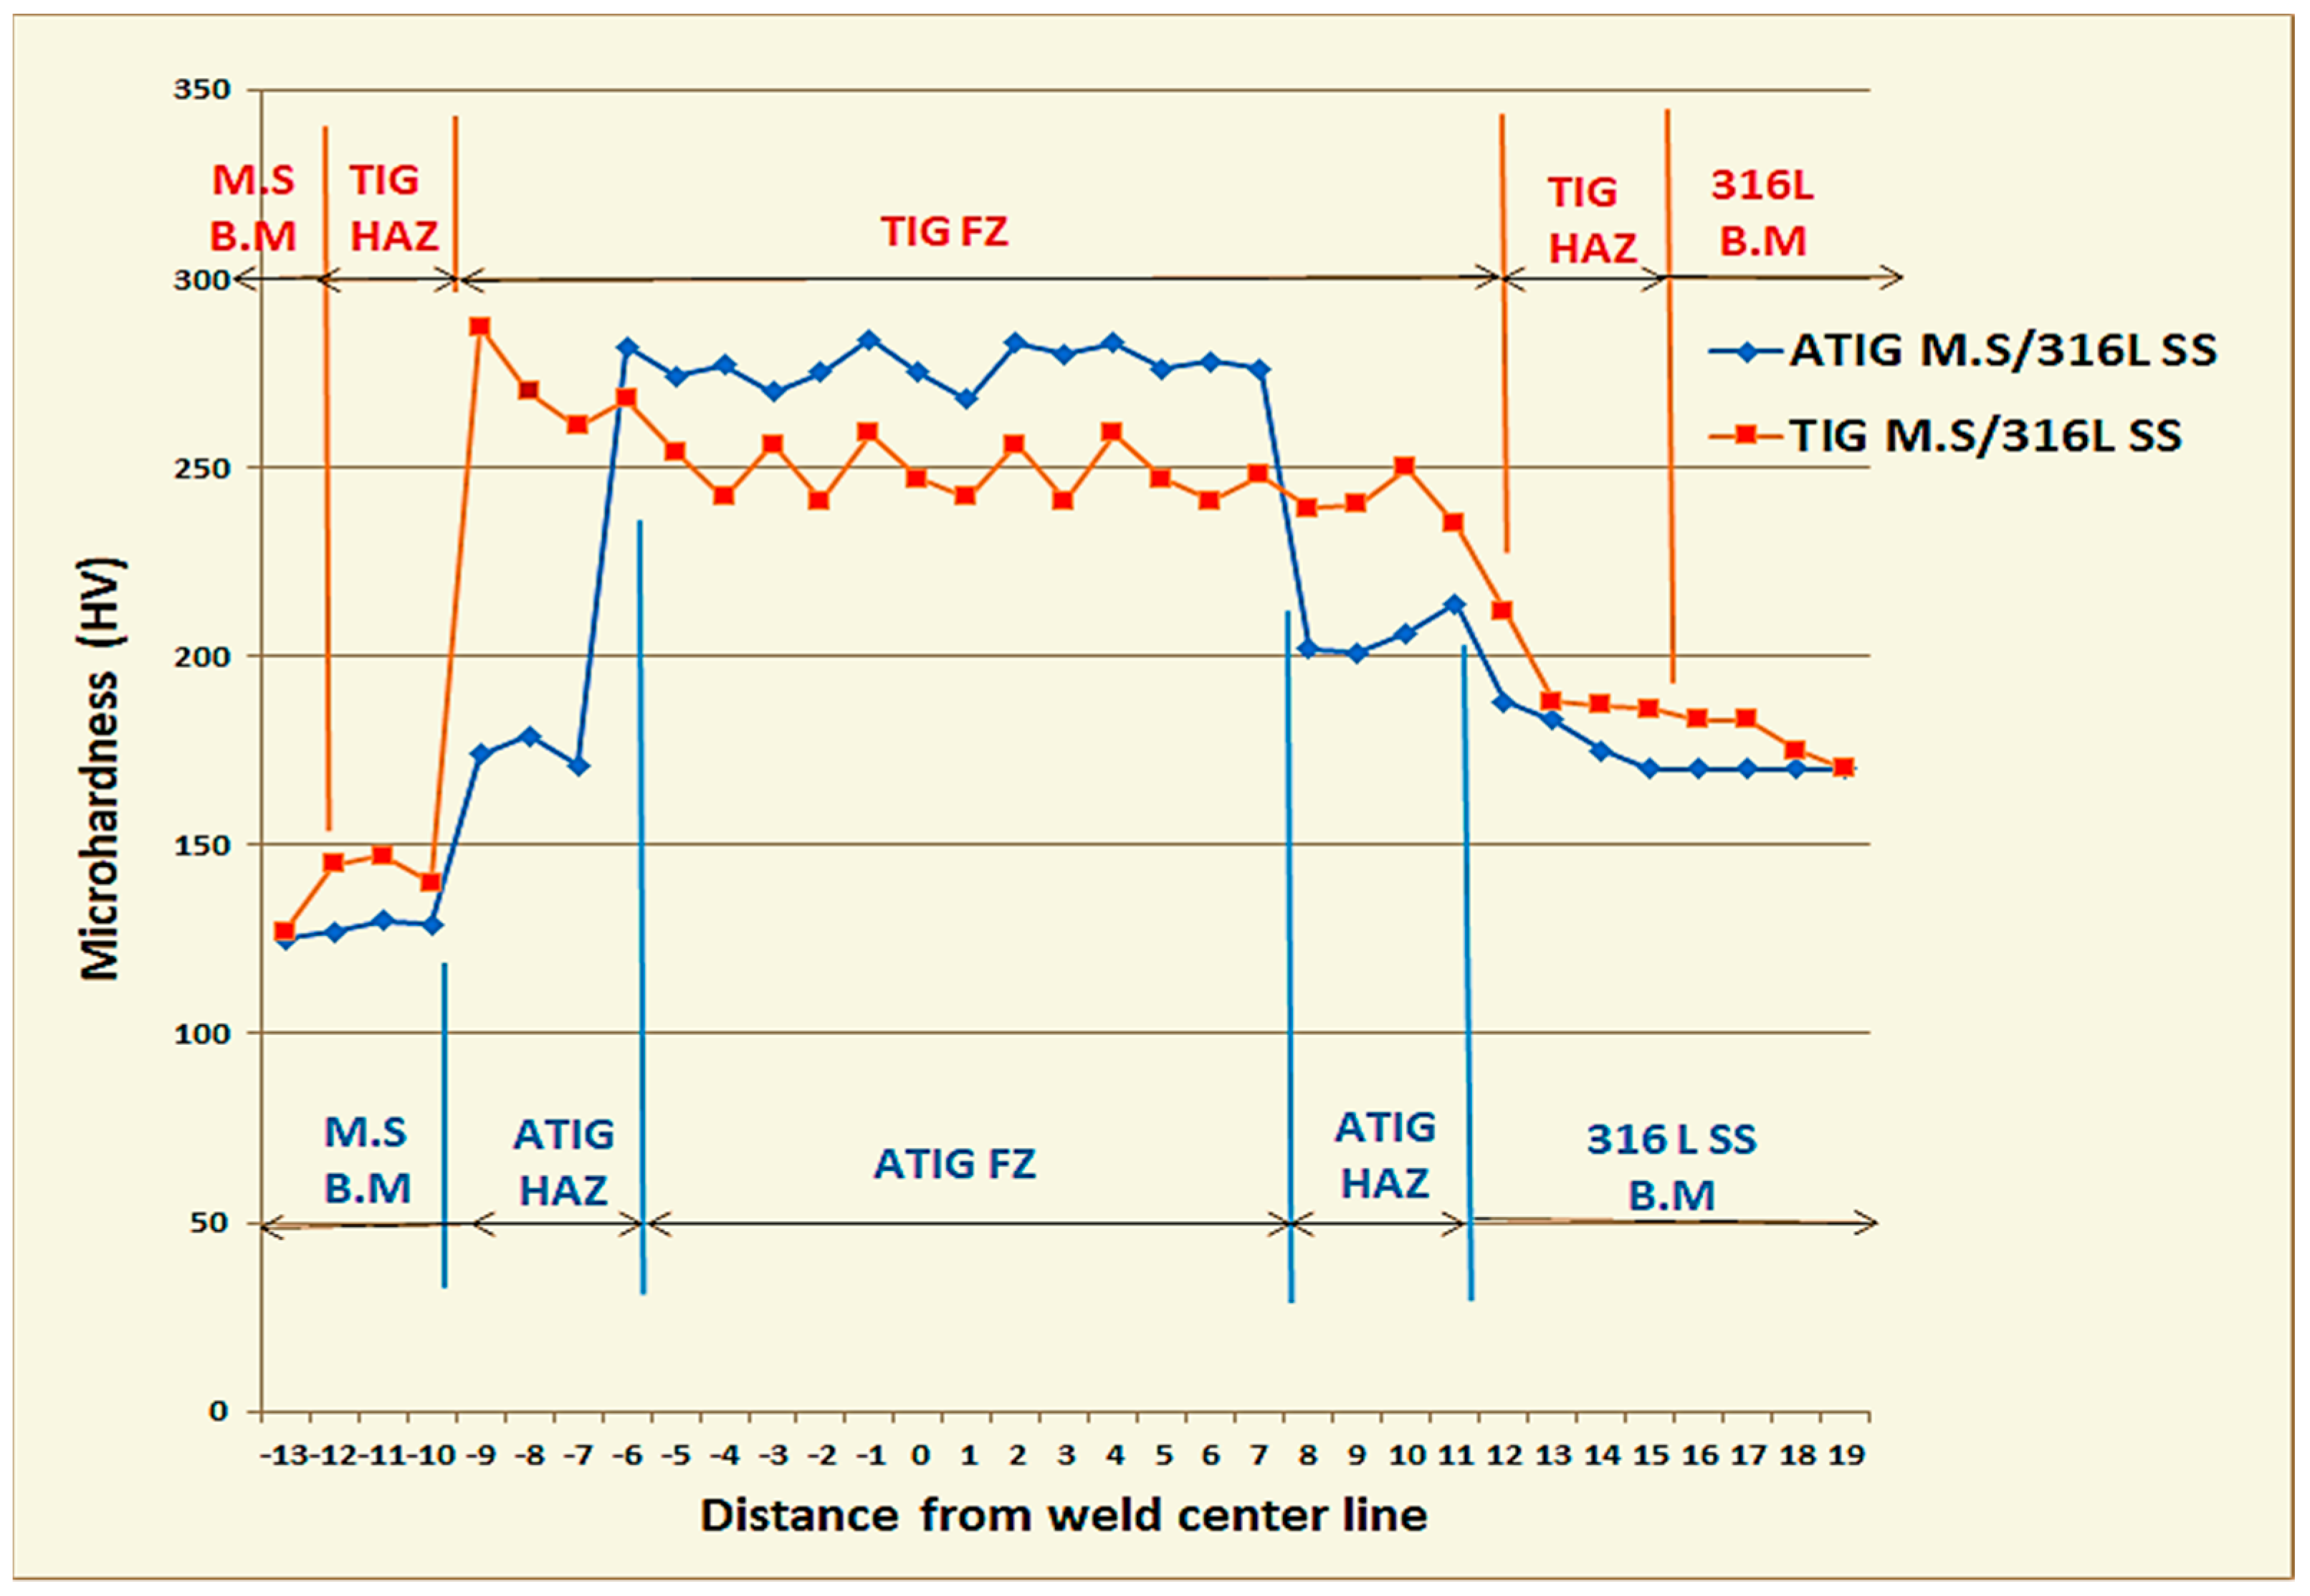
The variations in Vickers microhardness values as a function of the distance from the mild steel to the 316L SS in the sample are shown in Figure 20. It is evident that the hardness values of all ATIG and TIG weld regions are higher than in the 316L SS and mild steel base metals. In the TIG specimen, the highest hardness is located in the weld near the fusion boundary on the mild steel side This can be explained by the formation of harder micro-constituents in this region, induced by the carbon migration from the mild steel side into the weld metal, as revealed in the SEM-EDS results mentioned above, named the decarbonized zone. However, in the ATIG specimen, the migration of carbon is not revealed, leading to homogenous hardness values throughout the weld. The presence in the weld zone of elements such as chromium associated with the high cooling rate characteristic of ATIG welds decreases the tendency for the diffusion of carbon from the MS side to the weld zone.
In Figure 20, the average hardness value in the ATIG fusion zone (277 HV) is higher than in the TIG fusion zone (252 HV) owing to the rapid cooling rate in the ATIG weld. The highest hardness value (287 HV) is located in the TIG weld zone at the nearest point to the MS/WZ HAZ owing to carbon migration leading to hardening of precipitates. Slight hardening in weld region close to the MS HAZ and uniform values were obtained in ATIG weld zone. The standard deviation shown above is less than 13 HV. Therefore, this result indicates good hardness homogeneities in the joints, as shown in Table 11.
Hardness values in the HAZs of both mild steel and 316L SS sides were increased compared to the hardness values of the base metals. Hardness values in the HAZs of both mild steel and 316L SS in ATIG welds (175 HV and 206 HV, respectfully) were greater than in conventional dissimilar TIG welds (144 HV and 193 HV, respectfully), as displayed in Table 12. On the other hand, the standard deviation was less than 13 HV, which shows to small disparities in the obtained hardness values between the maximum and the minimum. We also note that the hardness in the HAZ of mild steel on the weld zone side (144 HV) in the TIG specimen was less than that of the HAZ of mild steel on the weld zone side in the ATIG specimen (175 HV), owing to depletion of carbon in the region close to the fusion line in the TIG weld.

3.5. Impact Test

The impact tests were carried out in the fusion zones in ATIG and TIG welds. The obtained experimental results are shown in Table 13. The average energy absorbed in the fusion zone in the case of the ATIG MS/316L SS dissimilar weld (245 j/cm2) was higher than that of the TIG dissimilar weld (216 j/cm2) by 29 j/cm2. The dissimilar ATIG weld withstood sudden loads better than the dissimilar TIG weld. The standard deviation was less than 16 J/cm2, showing small disparities in the obtained results between the maximum and the minimum.
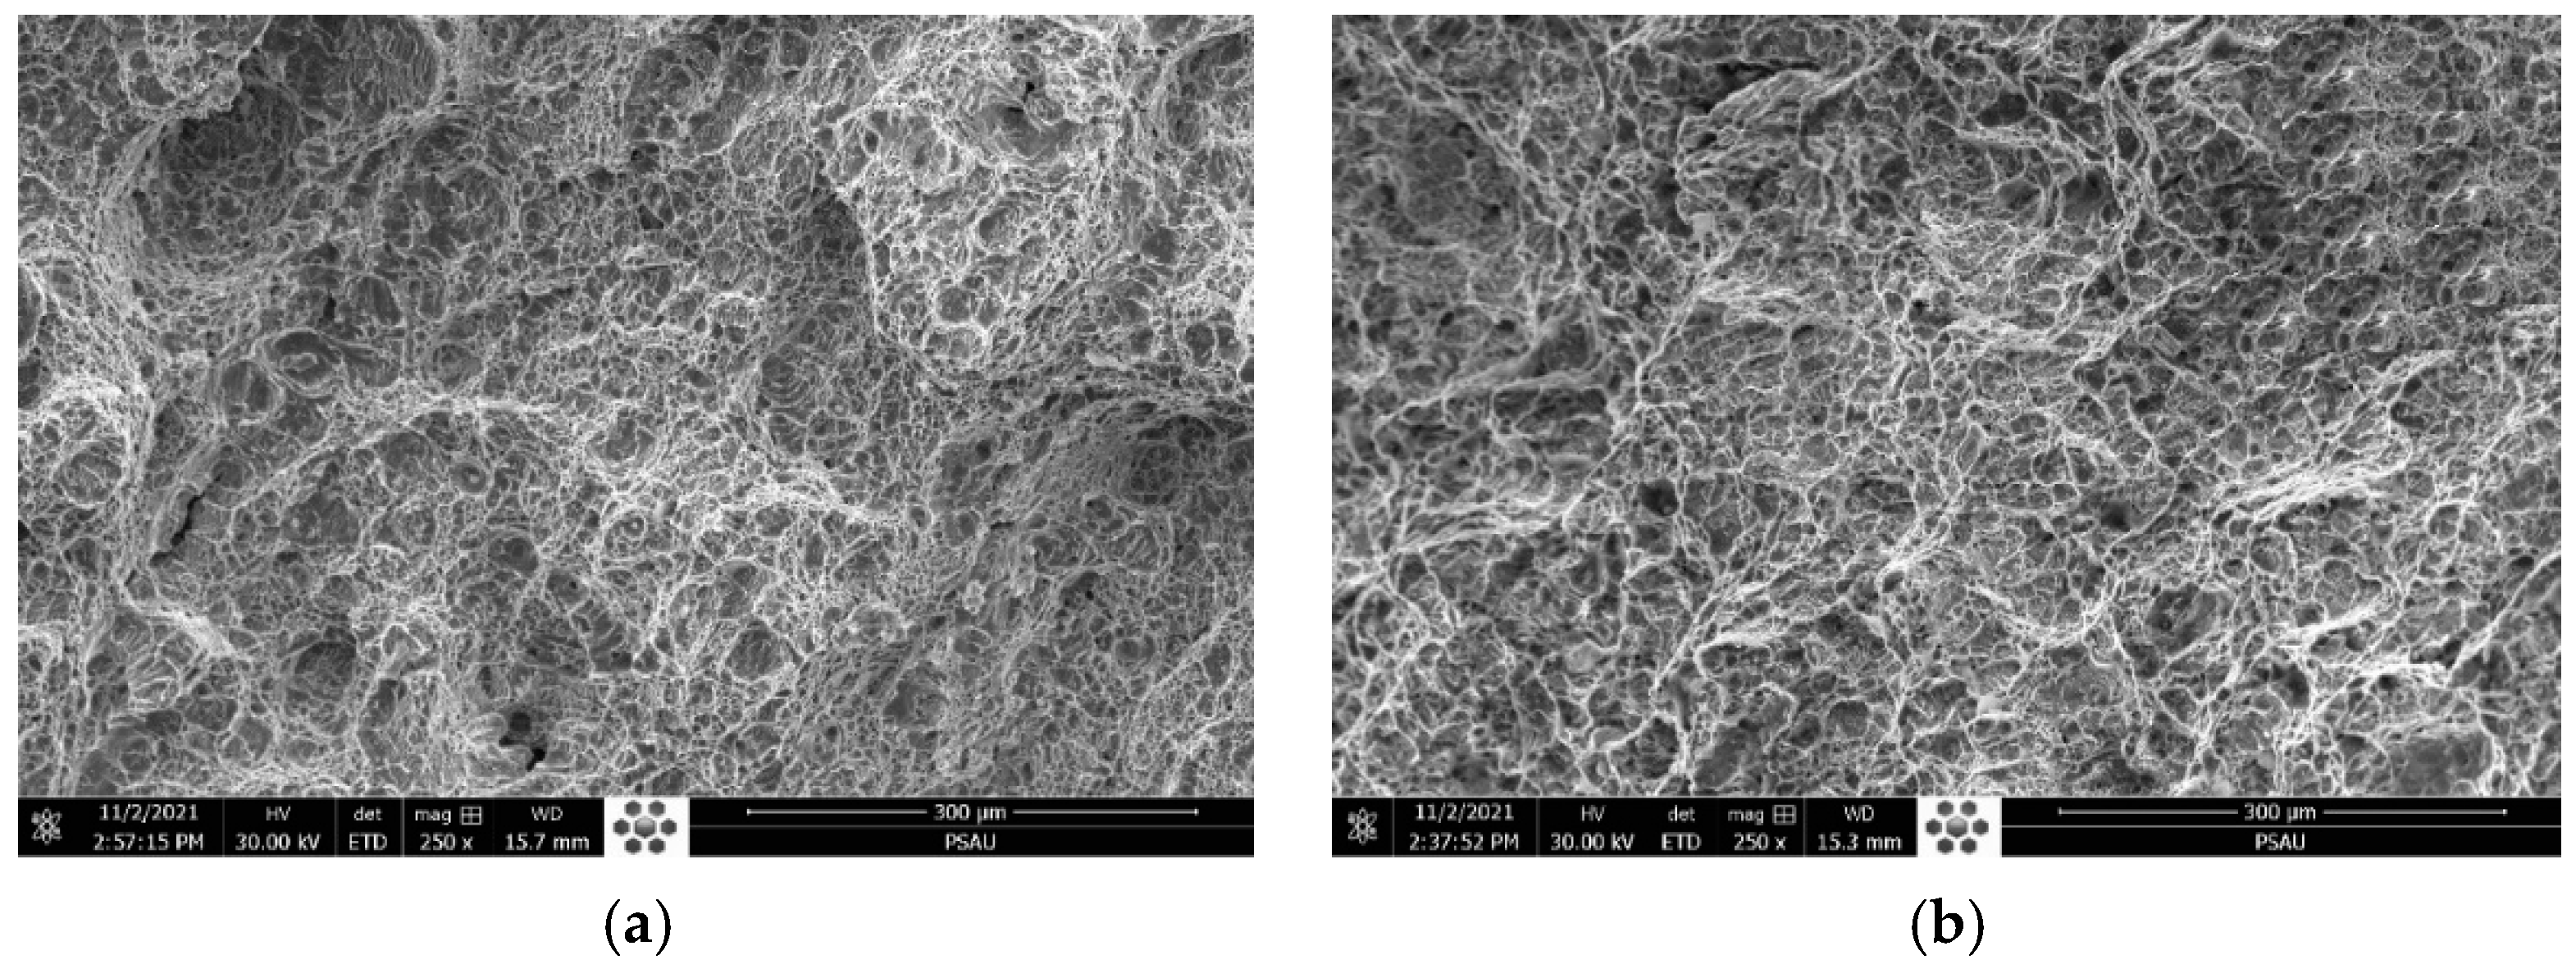
The fractography results of the ATIG impact test shown in Figure 21b reveal multiple small dimples indicative of ductile fractures. However, the fractography results for the TIG weld shown in Figure 21a show a large number of fine dimples associated with the cleavage region, which prove the lower resistance to sudden impact loads.

3.6. Corrosion Behavior Investigation

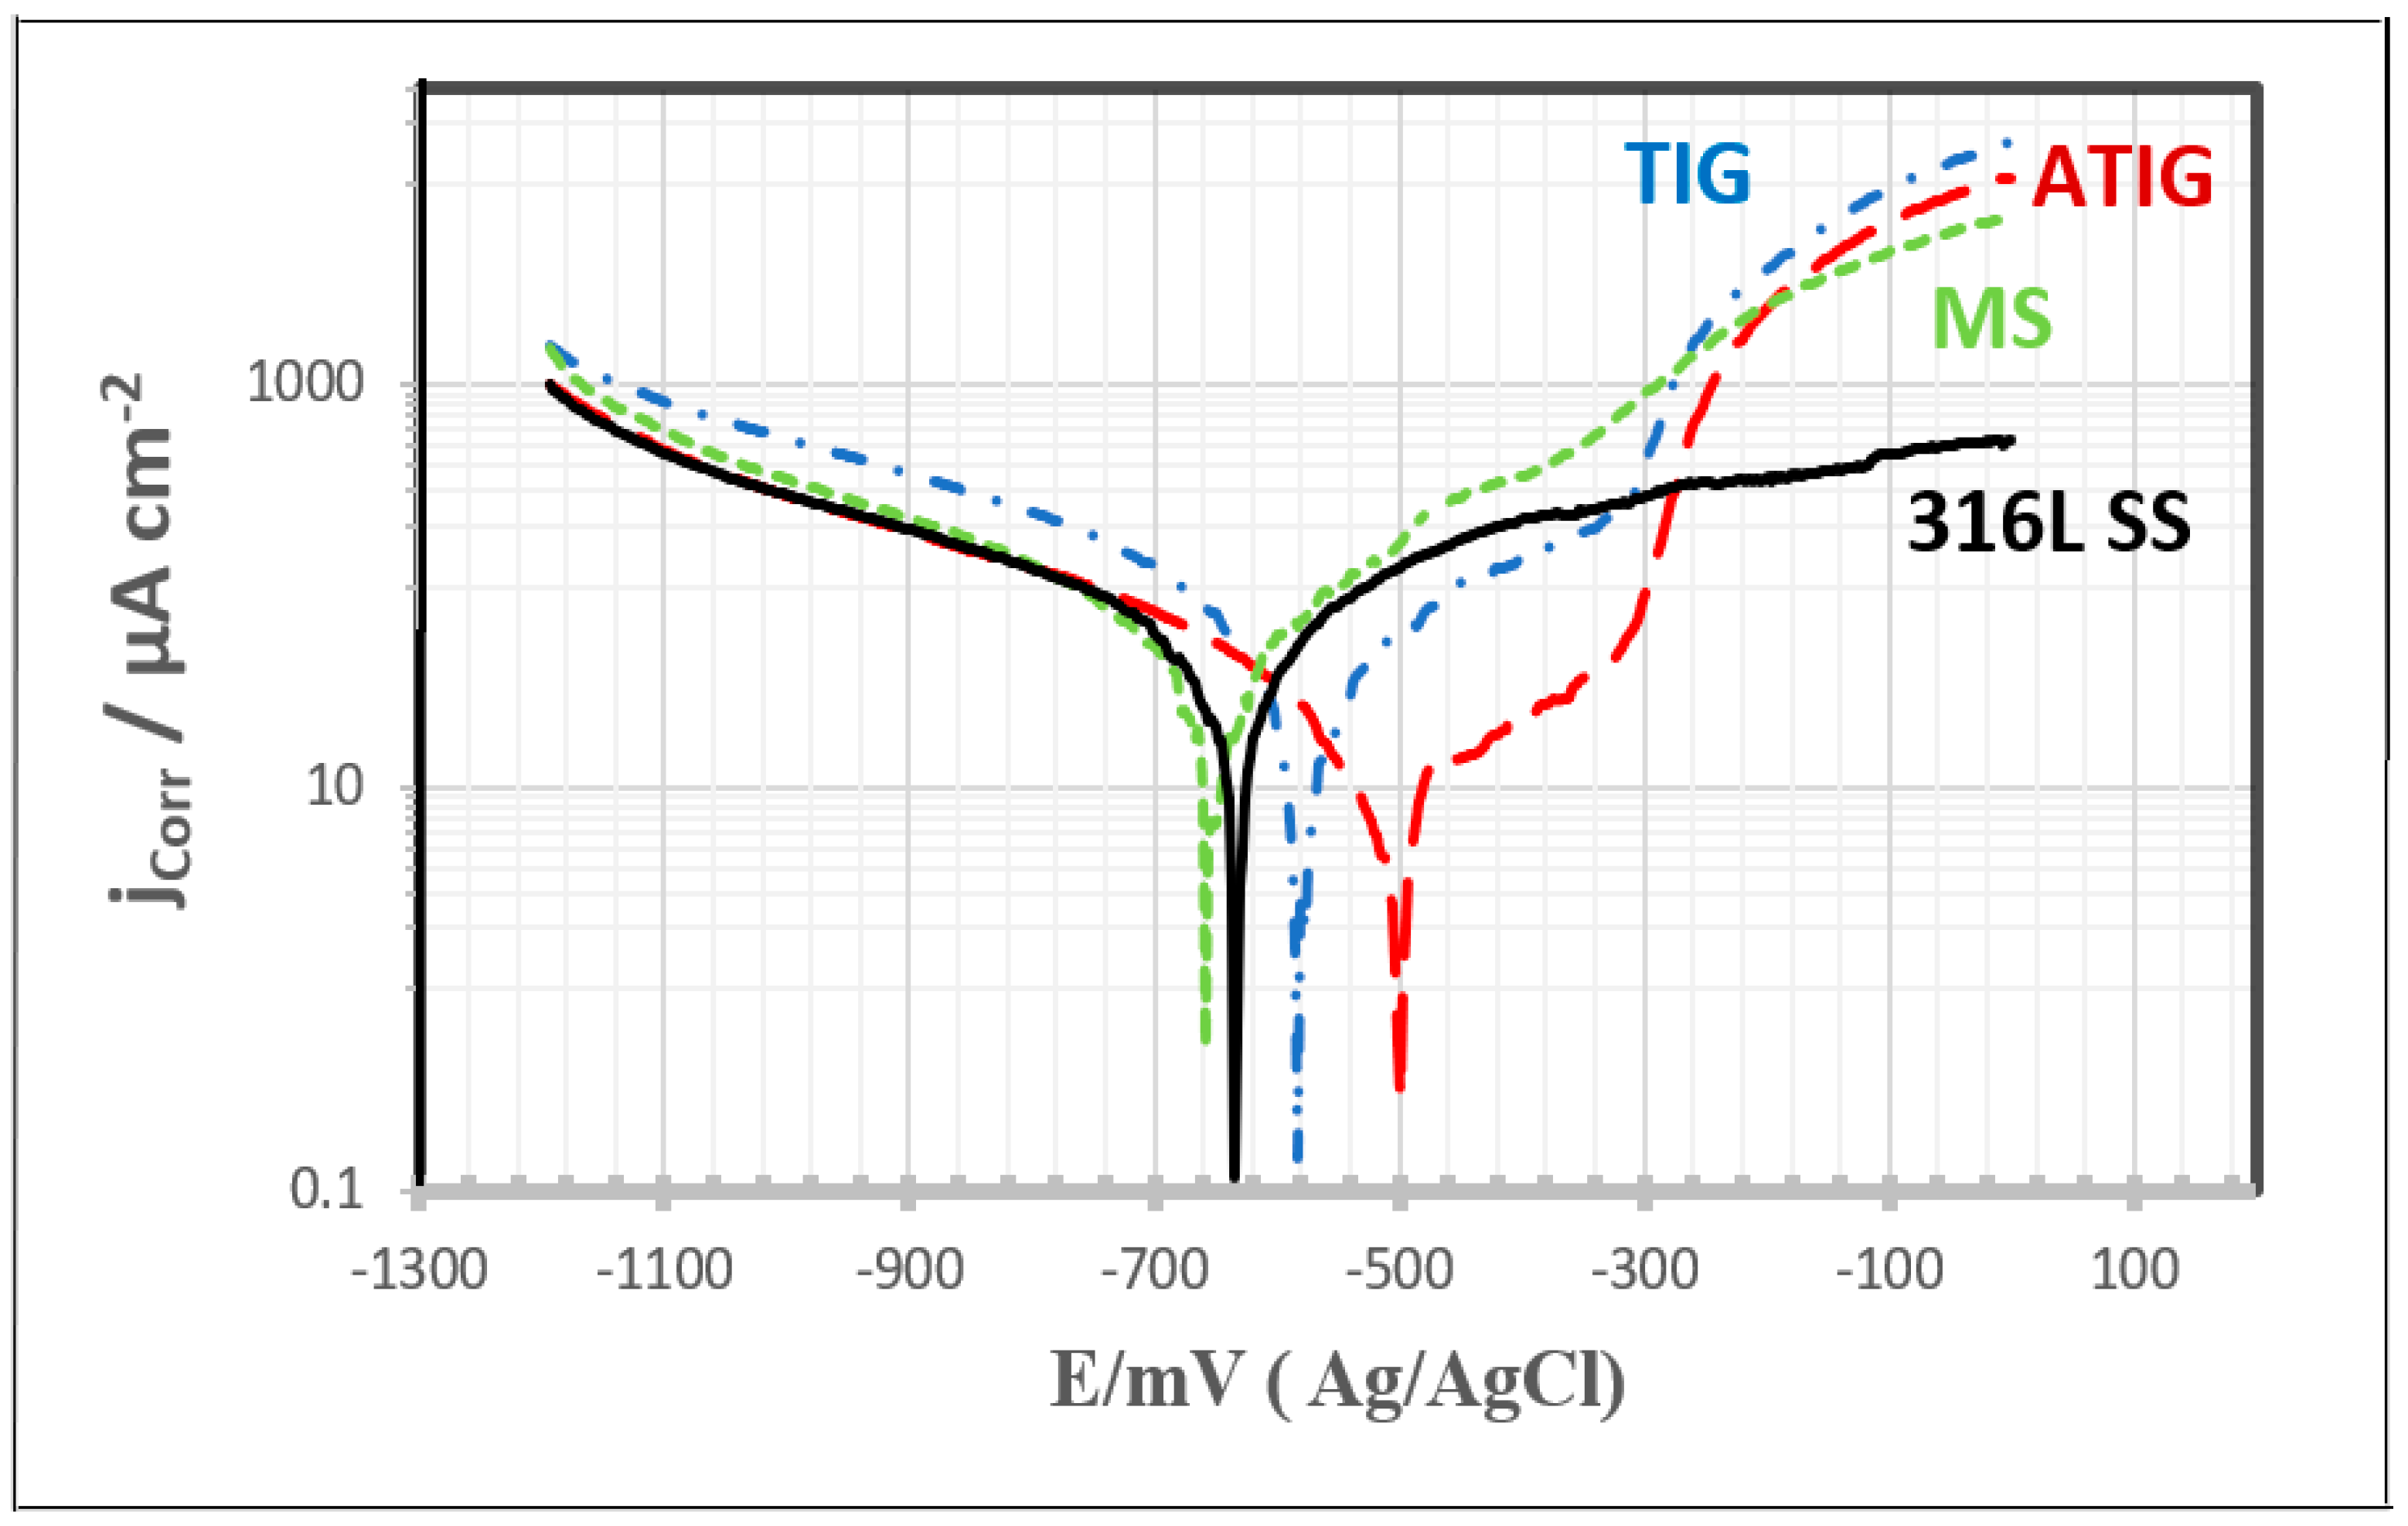
The electrochemical corrosion test results for 316L SS and MS base metals and for the TIG-welded and ATIG-welded materials are shown in Figure 22 and Table 14, respectively. As can be seen from the plot, the ATIG weld specimen has the best corrosion potential of −515 mV versus the saturated calomel electrode (SCE) and lowest corrosion current density of 10 µA·cm−2 as compared to the TIG specimen and ASS and MS base metals. Contrary to the ATIG specimen, the MS base metal shows the lowest corrosion potential of −655 mV and highest corrosion current density of 26 µA·cm−2.
It is interesting to note that the ATIG weld exhibited a nobler potential than the other specimens. This means that the presence of the flux composed of 74% SiO2 + 13% Cr2O3 + 3% Fe2O3 + 10% NaF had a significant influence on the corrosion potential, shifting it towards the nobler side. The presence of this optimal flux also has a beneficial influence on the corrosion current density. The lowest corrosion current density value was found for the ATIG weld as compared to the other samples.

4. Conclusions

In this work, a comparative study of dissimilar ATIG and TIG welds of grade 316L austenitic stainless steel and mild steel was carried out. The mixing method design allowed us to obtain the optimal flux combination for use in the ATIG (activated flux TIG) welding process in order to achieve a fully penetrated weld bead in a single pass. The obtained optimal flux was the key point in the investigation of the mechanical properties and corrosion resistance of the ATIG weld. The following main conclusions can be drawn:
(i)
The 316L stainless steel could be joined to mild steel using the optimal flux consisting of 74% SiO2 + 13% Cr2O3 + 3% Fe2O3 + 10% NaF;
(ii)
In dissimilar ATIG welding, a fully penetrated weld bead was achieved in a single pass and without edge preparation. The obtained penetration depth (D) was 6.9 mm, the bead face width (WF) was 8.82 mm and the back face width (WB) was 5.0 mm, leading to a (D + WB)/WF aspect ratio of 1.35. The depth was increased by about 1.86 times compared to the conventional dissimilar TIG weld and the ratio was enhanced by more than 4.3 times. Hence, ATIG welding achieved significant improvements in penetration compared to conventional TIG welding. Flux was used in the constricted-arc ATIG weld owing to the presence of fluorine. Consequently, the weld bead width was reduced compared to that of the conventional TIG welding, increasing the weld penetration. Moreover, the surfactant elements such as oxygen contributed to reversal of the Marangoni convection, leading to a fully penetrated weld;
(iii)
Carbon migration from the MS to the weld zone occurred in the TIG weldment; however, SEM-EDS analysis did not show this phenomenon in the ATIG weld. The HAZ width of the ATIG weld was slightly narrower than that of the TIG weldment owing to its high cooling rate;
(iv)
The ATIG weld made a positive contribution to the mechanical properties, such as the hardness, tensile strength and resistance to sudden loads, as compared to the TIG weld. During the tensile test, both ATIG and TIG welded samples fractured at similar levels to the mild steel base metal, indicating that certain regions in the 316L base metal, namely the fusion zone and heat-affected zones, are stronger than in mild steel. The ATIG hardness values were homogenous and higher than those for the TIG weld;
(v)
The presence of optimal flux composed of 74% SiO2 + 13% Cr2O3 + 3% Fe2O3 + 10% NaF had a beneficial influence on the corrosion resistance of the ATIG weld.

Author Contributions

Conceptualization, K.T. and A.C.H.; methodology, K.T. and R.D.; software, K.T. and A.B.; validation, K.T., R.D., A.O. and A.C.H.; formal analysis, K.T.; investigation, K.T., R.D., A.O. and A.C.H.; resources, A.I.; data curation, K.T., H.S.A. and U.A.S.; writing—original draft preparation, K.T.; writing—review and editing, K.T., R.D. and A.O.; visualization, K.T.; supervision, K.T. All authors have read and agreed to the published version of the manuscript.

Funding

This research received no external funding.

Institutional Review Board Statement

Not applicable.

Informed Consent Statement

Not applicable.

Data Availability Statement

The data used to support the findings of this study are included within the article.

Conflicts of Interest

The authors declare no conflict of interest.

References

  1. Wang, S.; Ma, Q.; Li, Y. Characterization of Microstructure, Mechanical Properties and Corrosion Resistance of Dissimilar Welded Joint Between 2205 Duplex Stainless Steel and 16MnR. Mater. Des. 2011, 32, 831–837. [Google Scholar] [CrossRef]
  2. Kurtulmus, M. Activated flux TIG welding of austenitic stainless steels. Emerg. Mater. Res. 2020, 9, 1041–1055. [Google Scholar] [CrossRef]
  3. Albaijan, I.; Hedhibi, A.C.; Touileb, K.; Djoudjou, R.; Ouis, A.; Alrobei, H. Effect of Binary Oxide Flux on Weld Shape, Mechanical Properties and Corrosion Resistance of 2205 Duplex Stainless Steel Welds. Adv. Mater. Sci. Eng. 2020, 2020, 5842741. [Google Scholar] [CrossRef]
  4. Jayakrishnan, S.; Chakravarthy, P.; Muhammed Rijas, A. Effect of Flux Gap and Particle Size on the Depth of Penetration in FBTIG Welding of Aluminium. Trans. Indian Inst. Met. 2017, 70, 1329–1335. [Google Scholar] [CrossRef]
  5. Kulkarni, A.; Dwivedi, D.K.; Vasudevan, M. Materials science & engineering a study of mechanism, microstructure and mechanical properties of activated flux TIG welded P91 steel-P22 steel dissimilar metal joint. Mater. Sci. Eng. A 2018, 731, 309–323. [Google Scholar]
  6. Tathgir, S.; Bhattacharya, A. Activated-TIG Welding of Different Steels: Influence of Various Flux and Shielding Gas. Mater. Manuf. Process 2016, 31, 235–342. [Google Scholar] [CrossRef]
  7. Klobčar, D.; Tušek, J.; Bizjak, M.; Simončič, S.; Lešer, V. Active flux tungsten inert gas welding of austenitic stainless steel aisi 304. Metalurgija 2016, 55, 617–620. [Google Scholar]
  8. Hedhibi, A.; Touileb, K.; Djoudjou, R.; Ouis, A.; Bouazizi, M.L.; Chakhari, J. Effect of single oxide fluxes on morphology and mechanical properties of ATIG on 316L austenitic stainless steel welds. ETASR 2018, 8, 3064–3072. [Google Scholar]
  9. Touileb, K.; Hdhibi, A.; Djoudjou, R.; Ouis, A.; Bouazizi, M.L. Mixing Design for ATIG Morphology and Microstructure Study of 316L Stainless Steel. ETASR 2019, 9, 3990–3997. [Google Scholar] [CrossRef]
  10. Modenesi, P.J.; Neto, C.P.; Apolinario, E.R.; Dias, B.K. Effect of flux density and the presence of additives in ATIG welding of austenitic stainless steel. Weld. Int. 2015, 29, 425–432. [Google Scholar] [CrossRef]
  11. Magudeeswaran, G.; Sreehari, R.N.; Sundar, L.; Harikannan, N. Optimization of process parameters of the activated tungsten inert gas welding for aspect ratio of UNS S32205 duplex stainless steel welds. Def. Technol. 2014, 10, 251–260. [Google Scholar] [CrossRef] [Green Version]
  12. Vasantharaja, P.; Vasudevan, M. Studies on A-TIG welding of Low Activation Ferritic/Martensitic (LAFM) steel. J. Nucl. Mater. 2012, 421, 117–123. [Google Scholar] [CrossRef]
  13. Tseng, K.H.; Hsu, C.Y. Performance of activated TIG process in austenitic stainless steel welds. J. Mater. Process. Technol. 2011, 211, 503–512. [Google Scholar] [CrossRef]
  14. Yang, C.L.; Lin, S.B.; Liu, F.Y.; Lin, W.; Zhang, Q.T. Research on the mechanism of penetration increase by flux in ATIG welding. J. Mater. Sci. Technol. 2003, 19, 225–227. [Google Scholar]
  15. Howse, D.S.; Lucas, W. An investigation in to arc construction by active flux for TIG welding. Sci. Technol. Weld. Join. 2000, 5, 189–193. [Google Scholar] [CrossRef]
  16. Lucas, W.; Howse, D.S. Activating flux—Increasing the performance and productivity of the TIG and plasma processes. Weld. Metal Fabr. 1996, 64, 11–17. [Google Scholar]
  17. Aniekan, E.I.; Ikechukwu, O.; Ikpe, E.E. Effects of arc voltage and welding current on the arc length of tungsten inert gas welding (TIG). Int. J. Eng. Technol. 2017, 3, 213–221. [Google Scholar]
  18. Zhang, J.; Huang, Y.; Fan, D.; Zhao, J.; Huang, J.; Yu, X.; Liu, S. Microstructure and performances of dissimilar joints between 12Cr2Mo1R steel and 06Cr18Ni11Ti austenitic stainless steel joined by AA-TIG welding. J. Manuf. Process. 2020, 60, 96–106. [Google Scholar]
  19. Hesam, P.; Mohsen, H.; Amir, H.K.; Ali, N. Designing of CK45 Carbon Steel and AISI 304 Stainless Steel Dissimilar Welds. Mater. Res. 2014, 17, 106–114. [Google Scholar]
  20. Radha, R.M.; Visnu, K.T.; Rajesha, S. A Study of Tensile Strength of MIG and TIG Welded Dissimilar Joints of Mild Steel and Stainless Steel. Int. J. Adv. Mater. Sci. Eng. 2014, 3, 23–32. [Google Scholar]
  21. Dixit, P.; Suketu, J. Techniques to weld similar and dissimilar materials by ATIG welding—An overview. Mater. Manuf. Process. 2021, 36, 1–16. [Google Scholar]
  22. Tayyab, I. Analysis of Dissimilar Metal Welding of 1020 Mild Steel and 304 Stainless Steel. Master’s Thesis, Department of Mechanical Engineering, National Institute of Technology, Rourkela, India, 2014. [Google Scholar]
  23. Arivarasua, M.; Kasinatha, D.R.; Natarajana, A. Effect of Continuous and Pulsed Current on the Metallurgical and Mechanical Properties of Gas Tungsten Arc Welded AISI 4340 Aeronautical and AISI 304 L Austenitic Stainless Steel Dissimilar Joints. Mater. Res. 2015, 18, 59–77. [Google Scholar] [CrossRef] [Green Version]
  24. Osoba, L.O.; Ekpe, I.C.; Elemuren, R.A. Analysis of dissimilar welding of austenitic stainless steel to low carbon steel by TIG welding process. Int. J. Metall. Mater. Eng. 2015, 5, 1–12. [Google Scholar]
  25. Gaffar, M.; Shankar, M.; Kumar, P.S.; Satyanarayana, V.V. Experimental Investigation on Welded Joints of Dissimilar Steels. Int. J. Cur. Eng. Technol. 2017, 7, 800–807. [Google Scholar]
  26. Priyadarsani, S.; Anand, K.; Kumar, R. Experimental Investigation on the Welding of Stainless Steel and Mild Steel using GMAW. J. Mater. Sci. Mech. Eng. 2016, 3, 152–157. [Google Scholar]
  27. Shamsul, B.J.; Mazlee, M.N.; Shahzan, K.A.K.; Khairel, R.A. Mechanical Properties of Dissimilar Welds Between Stainless Steel and Mild Steel. Adv. Mat. Res. 2013, 795, 74–77. [Google Scholar]
  28. Kuo, C.-H.; Tseng, K.-H.; Chou, C.-P. Effect of activated TIG flux on performance of dissimilar welds between mild steel and stainless steel. Key Eng. Mater. 2011, 479, 74–80. [Google Scholar] [CrossRef]
  29. Nayee, S.G.; Badheka, V.J. Effect of oxide-based fluxes on mechanical and metallurgical properties of Dissimilar Activating Flux Assisted-Tungsten Inert Gas Welds. J. Manuf. Process 2014, 16, 137–143. [Google Scholar] [CrossRef]
  30. Wang, C.; Yu, Y.; Yu, J.; Zhang, Y.; Zhao, Y.; Yuan, Q. Microstructure evolution and corrosion behavior of dissimilar 304/430 stainless steel welded joints. J. Manuf. Process 2020, 50, 183–191. [Google Scholar] [CrossRef]
  31. Dak, G.; Pandey, C. A critical review on dissimilar welds joint between martensitic and austenitic steel for power plant application. J. Manuf. Process 2020, 58, 377–406. [Google Scholar] [CrossRef]
  32. Sirohi, S.; Kumar, S.; Bhanu, V.; Pandey, C.; Gupta, A. Study on the Variation in Mechanical Properties along the Dissimilar Weldments of P22 and P91 Steel. J. Mater. Eng. Perform. 2021, 31, 2281–2296. [Google Scholar] [CrossRef]
  33. Leconte, S.; Paillard, P.; Chapelle, P.; Henrion, G.; Saindrenan, J. Effects of flux containing fluorides on TIG welding process. Sci. Technol. Weld. Join. 2013, 12, 120–126. [Google Scholar] [CrossRef]
  34. Simonik, A.G. The effect of contraction of the arc discharge upon the introduction of electro-negative elements. Weld. Prod. 1976, 3, 49–51. [Google Scholar]
  35. Ming, L.Q.; Hong, W.X.; Da, Z.Z.; Jun, W. Effect of activating flux on arc shape and arc voltage in tungsten inert gas welding. Trans. Nonferrous Met. Soc. 2007, 17, 486–490. [Google Scholar]
  36. Bahrami, W.J.; Aidun, D.K. Modeling of Carbon Steel Duplex Stainless Steel GTA Weld Pool. Weld. J. 2014, 93, 262–270. [Google Scholar]
  37. Danielewski, H.; Skrzypczyk, A.; Tofil, S.; Witkowski, G.; Rutkowski, S. Numerical Simulation of Laser Welding Dissimilar Low Carbon and Austenitic Steel Joint. De Gruyter 2020, 10, 491–498. [Google Scholar] [CrossRef]
  38. Huang, B.-S.; Yang, J.; Lu, D.-H.; Bin, W.-J. Study on the microstructure, mechanical properties and corrosion behaviour of S355JR/316L dissimilar welded joint prepared by gas tungsten arc welding multi-pass welding process. Sci. Technol. Weld. Join. 2016, 21, 381–388. [Google Scholar] [CrossRef]
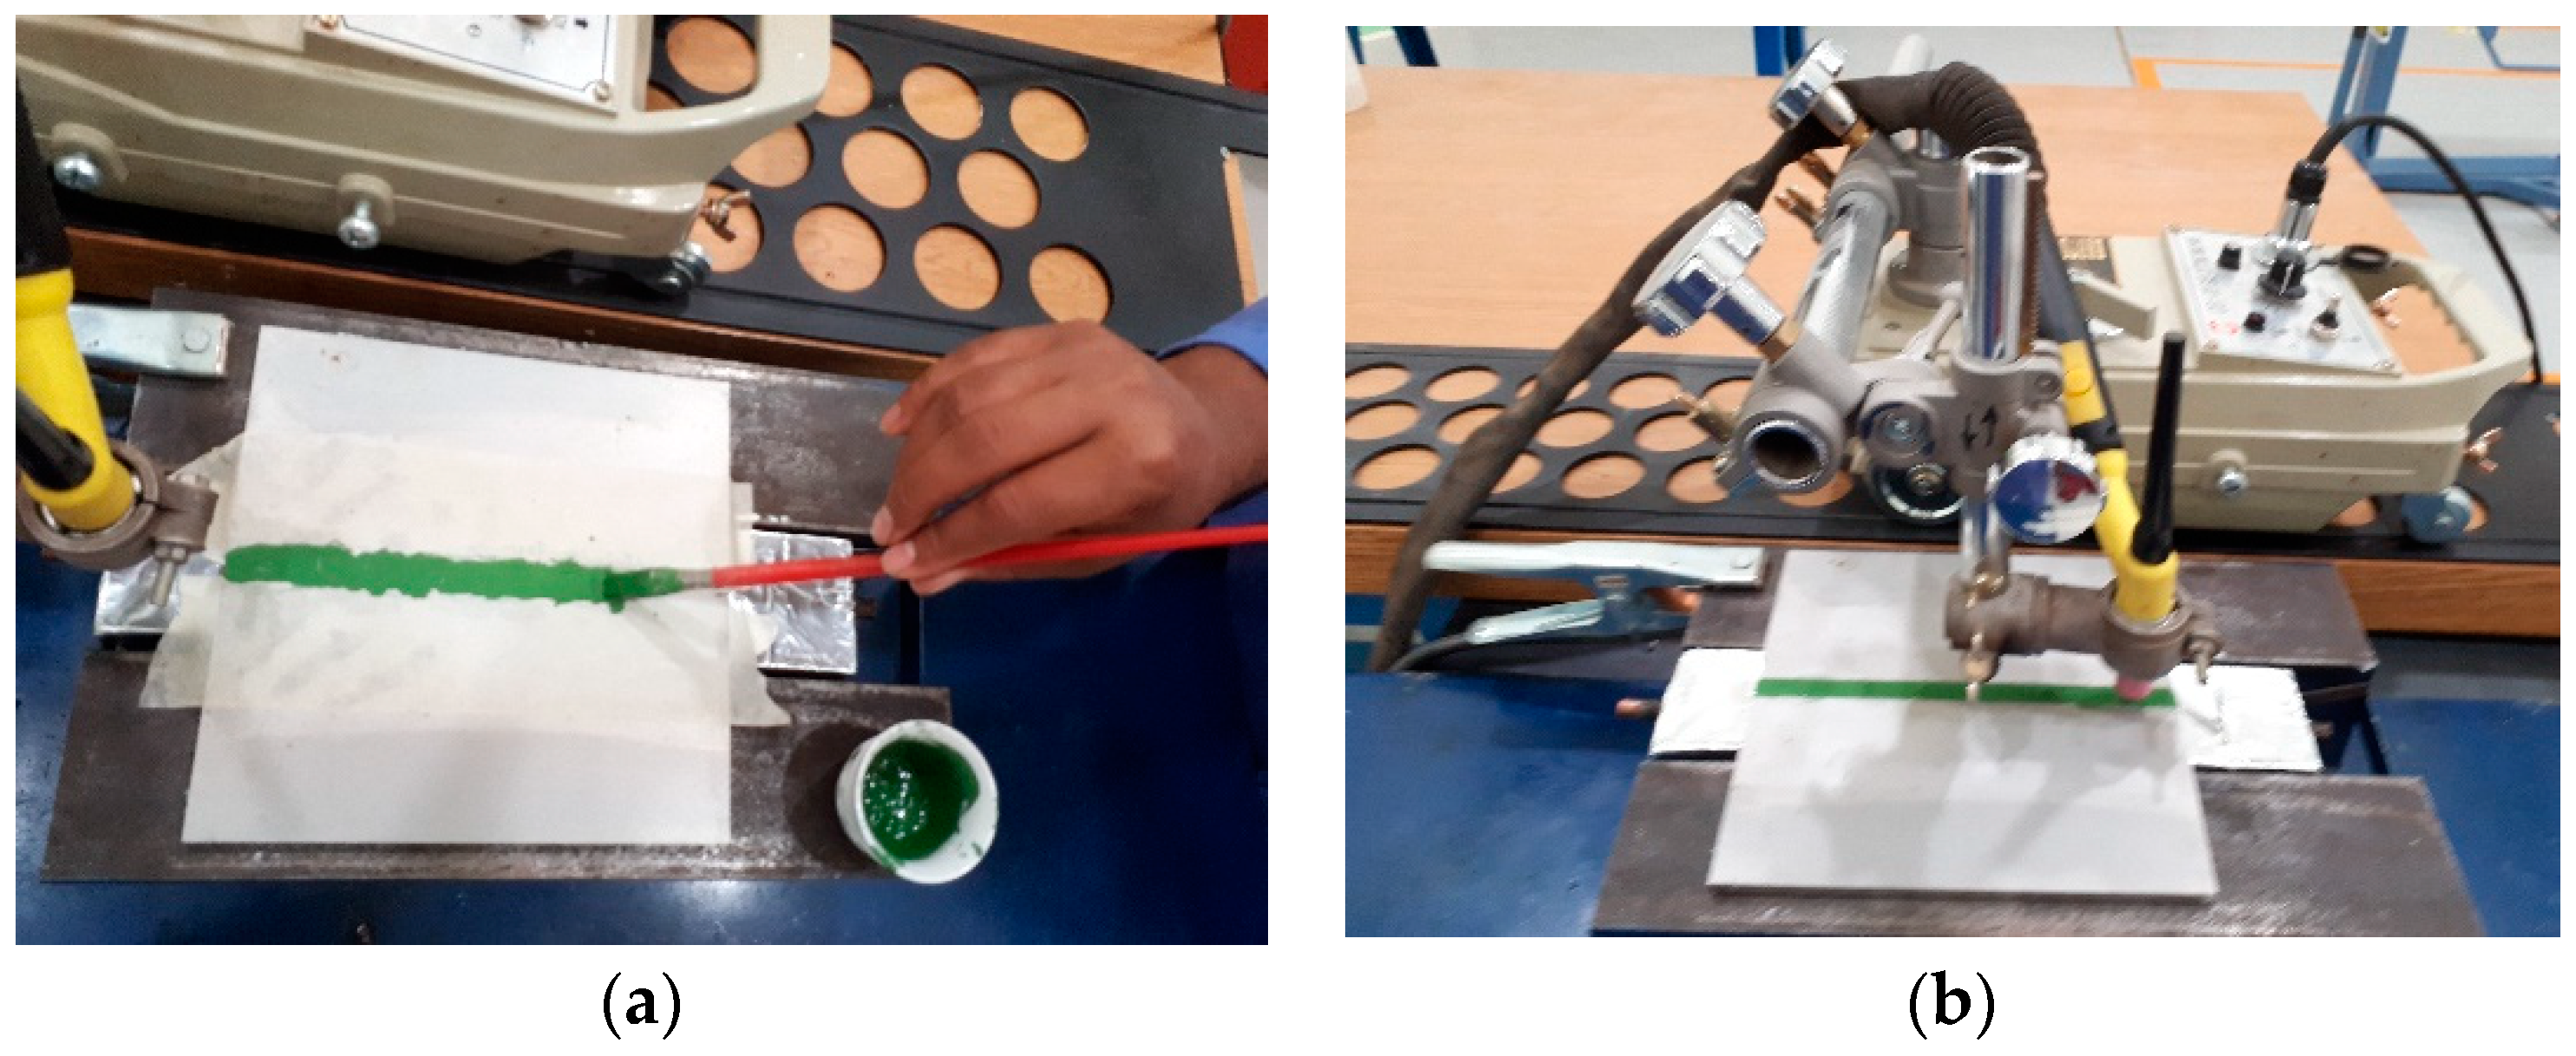
Figure 1. Deposition of flux on the workpiece (a) and the motorized carriage of the welding machine (b).
Metals 12 00635 g001
Figure 2. Test specimens for mechanical testing and weld morphology.
Metals 12 00635 g002
Figure 3. Ratio expressions for a partial-penetration weld bead (a) and full-penetration weld bead (b).
Metals 12 00635 g003
Figure 4. Tensile test specimen (units in mm).
Metals 12 00635 g004
Figure 5. Hardness test sample.
Metals 12 00635 g005
Figure 6. Impact test specimen (units in mm).
Metals 12 00635 g006
Figure 7. Simplex design plot in the mixture design space.
Metals 12 00635 g007
Figure 8. Mixture contour plot for depth D.
Metals 12 00635 g008
Figure 9. Mixture contour plot for ratio R.
Metals 12 00635 g009
Figure 10. Optimization plot for the depth D and ratio R.
Metals 12 00635 g010
Figure 11. Morphology of dissimilar welded beads using TIG (a) and ATIG (b) welding.
Metals 12 00635 g011
Figure 12. 316L SS—W.Z side for ATIG (a) and TIG (b) specimens.
Metals 12 00635 g012
Figure 13. MS—W.Z side for ATIG (a) and TIG (b) specimens.
Metals 12 00635 g013
Figure 14. EDS point scan of the MS side close to the TIG weld zone line.
Metals 12 00635 g014
Figure 15. EDS point scan of the TIG weld zone side close to the fusion line.
Metals 12 00635 g015
Figure 16. EDS point scan of the MS side close to the ATIG weld zone line.
Metals 12 00635 g016
Figure 17. EDS point scan of the weld zone side close to the ATIG fusion line.
Metals 12 00635 g017
Figure 18. Fracture zones for TIG and ATIG dissimilar welds in the tensile test.
Metals 12 00635 g018
Figure 19. Stress–strain curves obtained at slow strain rate tests for MS–316L SS dissimilar welded joints.
Metals 12 00635 g019
Figure 20. Microhardness profiles across the centerline of dissimilar ATIG and TIG welds.
Metals 12 00635 g020
Figure 21. Fractography results of TIG (a) and ATIG (b) impact tests for dissimilar 316L/MS weld.
Metals 12 00635 g021
Figure 22. Potentiodynamic polarization of 316L ASS and MS base metal and TIG and ATIG welds.
Metals 12 00635 g022
Table 1. Chemical composition of 316L stainless steel.
ElementsCMnSiPSCrNiMoNCuFe
Weight %0.0261.470.420.0340.001616.6010.082.140.0440.50Balance
Table 2. Chemical composition of mild steel.
ElementsCMnSiPSCrNiMoNCuAlFe
Weight %0.05210.1650.0090.00980.01370.02340.02770.006470.00530.09850.0245Balance
Table 3. Welding parameters.
ParametersRange
Welding speed13 cm/min
Welding current150 Amp
Arc Length2 mm
Electrode tip angle45°
Shielding gas on the workpieceArgon with flow rate 10 L/min
Shielding gas on the backsideArgon with flow rate 5 L/min
Welding modeNegative direct current electrode
Table 4. Weld aspects of single-oxide fluxes in dissimilar ATIG welds.
ElementsSiO2TiO2Fe2O3Cr2O3Mn2O3V2O5MoO3Co2O3
Depth (mm)5.963.284.594.333.013.263.953.29
Width (mm)12.2211.2811.4011.0810.611.5411.1611.12
Ratio0.490.290.400.390.280.280.350.29
Table 5. Flux combinations and weld aspects.
Input DataOutput
CombinationsFe2O3
%
Cr2O3
%
SiO2
%
NaF
%
Depth D
(mm)
Ratio R:
(D + Wb)/Wf
167.522.50106.461.09
267.5022.5106.461.13
3067.522.5106.290.96
422.567.50106.241.01
522.5067.5106.771.21
6022.567.5107.181.42
704545106.791.21
845045106.821.30
945450106.130.89
104522.522.5106.651.25
1122.54522.5106.461.31
1222.522.545107.141.52
13303030106.411.14
14601515106.701.14
15156015106.661.27
16151560106.691.09
179000104.590.40
180900104.330.39
190090105.961.11
Table 6. Dissimilar weldment bead profile data for TIG (conventional) and ATIG (optimal flux).
TIGATIG
DWFWB(D + WB)/WFDWFWB(D + WB)/WF
3.711.7800.316.98.85.01.35
Table 7. Area measurements of dissimilar welded beads using TIG and ATIG welding.
SampleZonesArea (mm2)
TIG M.S/316LM.S Side12.02
316L SS Side25.38
ATIG M.S/316LM.S Side22.1
316L SS Side24.5
Table 8. Chemical compositions in different horizontal regions from the MS side to 316L SS side for MS—316L SS dissimilar TIG weld.
Horizontal Point Scan from MS Side to 316L SS Side
Metals 12 00635 i001
Elements
Weight %
M.S-1M.S-2
Carbon
Depletion Zone
W.Z-1W.Z-2W.Z-3W.Z-4W.Z-5316L
C5.0303.582.452.342.230.580
Cr004.8611.2511.1712.5115.8618.82
Fe94.9710084.2081.8280.8580.3375.0370.82
Ni002.064.484.764.826.758.29
Table 9. Chemical compositions in different horizontal regions from the MS side to the 316L SS side for an MS–316L SS dissimilar ATIG weld.
Horizontal Point Scan from MS Side to 316L Side
Metals 12 00635 i002
Elements
Weight %
M.S-1M.S-2W.Z-1W.Z-2W.Z-3W.Z-4W.Z-5W.Z-6316L
C2.952.700000000
Cr005.105.919.6710.4210.5614.9818.75
Fe97.0597.3092.4792.0285.8183.7783.476.7771.54
Ni002.432.073.484.584.924.007.47
Table 10. Tensile strength values and standard deviations for both TIG and ATIG (optimal flux) dissimilar welding.
SampleNumber of TestsUTS
Max.
(MPa)
UTS
Min.
(MPa)
UTS
Average
(MPa)
Standard Deviation
σ
TIG MS/M.S33793703753.36
TIG 316L/316L35985945962.08
TIG MS/316L33803723764.00
ATIG MS/316L33793763781.53
Table 11. Hardness values and standard deviations for TIG and ATIG (optimal flux) specimens in the FZ.
SampleZone of TestsHV
Max.
HV
Min.
HV
Average
Standard Deviation σ
TIGFZ28723525212.75
ATIGFZ2842702774.84
Table 12. Hardness values and standard deviations for TIG and ATIG (optimal flux) specimens in the HAZ.
SampleZone of TestsHV
Max.
HV
Min.
HV
Average
Standard Deviation σ
TIGHAZ FZ/MS1471401443.61
HAZ FZ/316L SS21218619312.53
ATIGHAZ FZ/MS1791711754.04
HAZ FZ/316L SS2142012065.09
Table 13. Measurements of absorbed energy and standard deviations for TIG and ATIG (optimal flux) specimens in the fusion zone for the dissimilar 316L/M.S weld.
SampleNumber of TestsAbsorbed
Energy
(J/cm2)
Min
Absorbed
Energy
(J/cm2)
Max
Absorbed
Energy (J/cm2) Average
Standard
Deviation σ
TIG—316L SS/MS321523821615.56
ATIG—316L SS/MS32392522459.25
Table 14. Electrochemical data for 316L SS and MS base metals and TIG and ATIG welds obtained from potentiodynamic polarization studies in 3.5 M NaCl solution.
Sampleβc/mV·dec−1ECorr/mVβa/mV·dec−1jCorr/µA·cm−2RP/Ω·cm2
MS152–6559526978
316 SS146–640115191472
TIG163–57090171483
ATIG130–515125102771
Publisher’s Note: MDPI stays neutral with regard to jurisdictional claims in published maps and institutional affiliations.