Article

Effect of Transverse Restraint on Welding Residual Stress in V-Groove Butt Welding

1
Department of Civil Engineering, Chosun University, Gwangju 6145, Korea
2
Department of Naval Architecture and Ocean Engineering, Chosun University, Gwangju 6145, Korea
3
Joining and Welding Research Institute, Osaka University, Osaka 567-0047, Japan
4
Department of Industrial Engineering, Chosun University, Gwangju 6145, Korea
*
Authors to whom correspondence should be addressed.
Metals 2022, 12(4), 654; https://doi.org/10.3390/met12040654
Submission received: 3 March 2022 / Revised: 7 April 2022 / Accepted: 8 April 2022 / Published: 11 April 2022

Abstract

:
When evaluating the safety of steel structures, welding residual stress is used as the secondary load and if there is any restraint, the yield stress of the base material is used for secondary load, regardless of the size of the restraint. Of late, as the yield stress of members is increasing with the increase in the use of high-strength steels, the proportion of the residual welding stress in the total load during the evaluation of the safety of structures is increasing. Therefore, it is necessary to investigate the effect of the size of the restraint on the residual welding stress, determine reasonable residual stress according to the size of the restraint, and apply the residual stress as a secondary load. To investigate the effect of constraint conditions on residual welding stress, thermoelastic–plastic analysis was performed for different member thicknesses, yield stresses, and constraint sizes. The restraint did not affect the residual stress in the direction of the weld line but did affect the residual stress in the direction perpendicular to the weld line. The restraint moved the tensile stress to the compression stress in the direction perpendicular to the weld line at the first layer of the weld and moved the compression stress to the tensile stress at the middle and final layers of the weld. The change in residual stress was the largest in the middle of the weld.

1. Introduction

Residual welding stress is caused by plastic deformation occurring because of the restraint of the thermal stress generated during rapid heating and cooling by the welding heat source. The magnitude and distribution of welding residual stress are strongly dependent on welding conditions, welding sequence, and joint geometry [1]. This welding residual stress affects not only the buckling strength but also the fatigue and fracture strength growth [2,3]. Specifically, when evaluating the safety of steel structures, welding residual stress is used as the secondary load [4] and if there is any restraint, the yield stress of the base material is used for secondary load regardless of the size of the restraint. Recently, as the yield stress of members is increasing with the increase in the use of high-strength steel, the proportion of the residual welding stress in the total load is increasing when evaluating the safety of structures. Therefore, it is necessary to investigate the effect of the size of the restraint on the residual welding stress, determine a reasonable residual stress according to the size of the restraint, and apply it as a secondary load.
Therefore, research on the prediction of welding residual stress through finite-element (FE) analysis and experimental measurements was conducted. In the early period, thermal elastic–plastic analysis [5] was performed on real structures, but despite advances in computers, analysis took considerable time and required a large amount of computer memory [6]. Therefore, there is a limit to performing thermoelastic analysis on residual stresses of real structures. Simple analysis methods, such as the inherent strain method (ISM) [7,8] and the accelerated explicit method [9,10,11], have been developed to enable various FE analyses of real structures. Most residual stress measurement methods focus on the residual stresses on a surface. However, the distribution and magnitude of the internal residual stress have become important factors for evaluating structural safety, which can be measured using neutron diffraction [12,13] and the ISM [8,14,15].
Various attempts have been made to suggest guidelines for these numerical analysis results and to apply residual stress to the design. The International Institute of Welding gathered a working group [16,17] to examine the reliability of the numerical analysis and measurement methods for residual stress. Consequently, guidelines regarding the important factors in the thermal elastic–plastic analysis were presented. Furthermore, the inner residual stress in the weld was measured using the neutron and deep-hold drilling methods and the reliability of measurement methods was compared. The Pressure Vessel Research Council [10,18,19] researched a welding residual stress analysis procedure in terms of fitness-for-service, and the effects of the residual stress relaxation degree, the width of the heating band, and the insulation material on the welding residual stress relaxation during local post-heat treatment were evaluated.
Previous studies have focused on welding residual stresses in the unrestrained state. However, in actual structures, restraints occur naturally because of the stiffness of the welded structure, the restraint fixture, and the welding sequence. Further, as restraint affects not only welding residual stress but also cracking and welding deformation, many studies have focused on it. Watanabe [20,21] proposed a method to estimate restraint from the displacement of a weld by applying an external force to an H-shaped restraint test specimen. The relationship between restraint and transverse shrinkage was investigated and applied to an actual steel structure for ships. Measurements and analysis of the restraint degree for various ship structures show that the restraint degree of approximately 60% of the ship structures is 10 MPa/mm and never exceeds 100 MPa/mm. Park [22,23] derived a restraint coefficient diagram based on experiments and FE analysis pertaining to the relationship between welding deformation and restraint. The welding deformation of a large ship structure was predicted based on the assembly sequence. Satoh [24,25] proposed a method for predicting restraints in slit-type welding joints and actual structures with cracks using the correlation between restraints and cracking during welding. Shin [26] obtained a restraint (Ks) of 100–200 MPa/mm on the hatch coaming and deck top of a recently built 22,000 TEU class container ship via FE analysis. However, existing studies have hitherto focused on welding deformation or cracking and the effect of the restraint, whereas the relationship between the restraint and the residual stress has not been investigated.
In this study, thermal elastic–plastic analysis was performed for different structure thicknesses, yield stresses, and restraint conditions, and the relationship between the residual stress and the restraint was investigated. In addition, a predictive formula for the residual stresses in the welding center and the toes was derived through statistical analysis.

2. Comparison of Two-Dimensional (2D) to Three-Dimensional (3D) Thermal Elastic–Plastic Analyses and Experiment

For the flux cored arc (FCA) welding of a 70-mm-thick member, multilayer welding of approximately 60 passes is required [23]. Considering the number of welding passes and welding length, it is impossible to perform 3D thermal elastic–plastic analysis despite recent improvements in computer memory and computational power. Therefore, the effect of restraint on residual stress was investigated in this study using 2D thermal elastic analysis. However, the reliability of the 2D analysis results needs to be verified to adequately consider the constraining effect in the longitudinal direction when performing 3D thermal elastic–plastic analysis. Therefore, the residual stresses obtained from the 2D and 3D thermal elastic–plastic analyses were compared with the residual stresses measured using ISM.

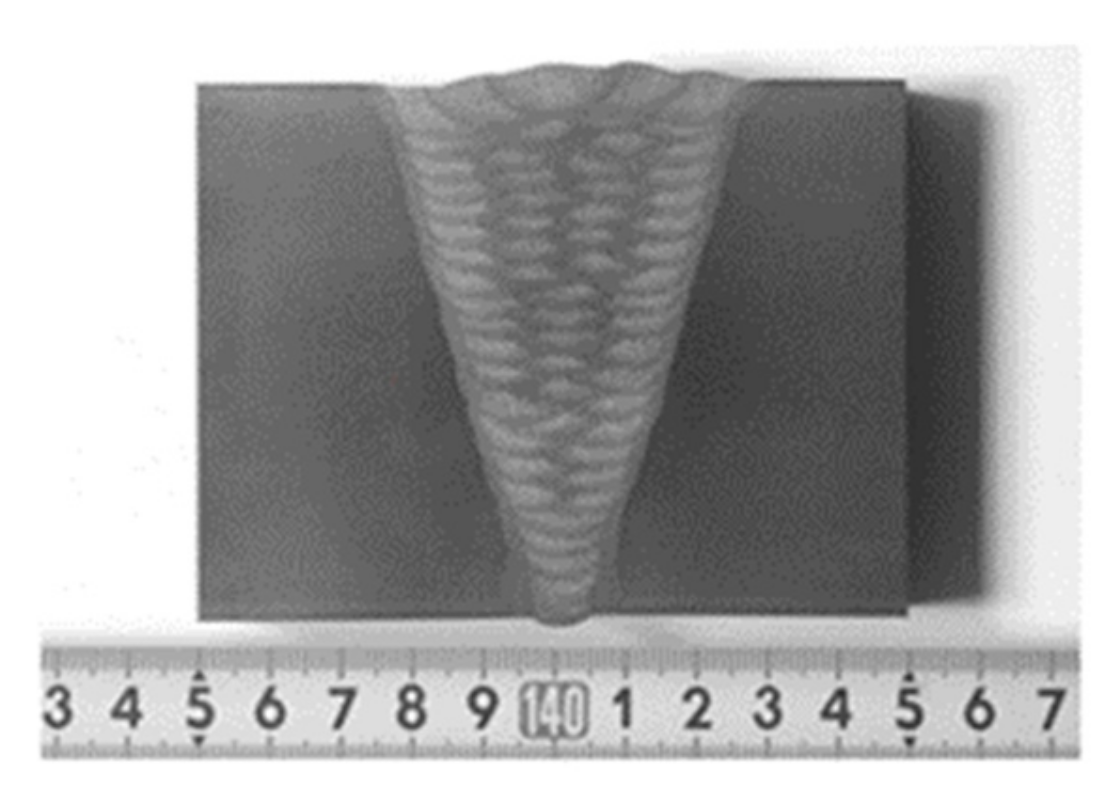
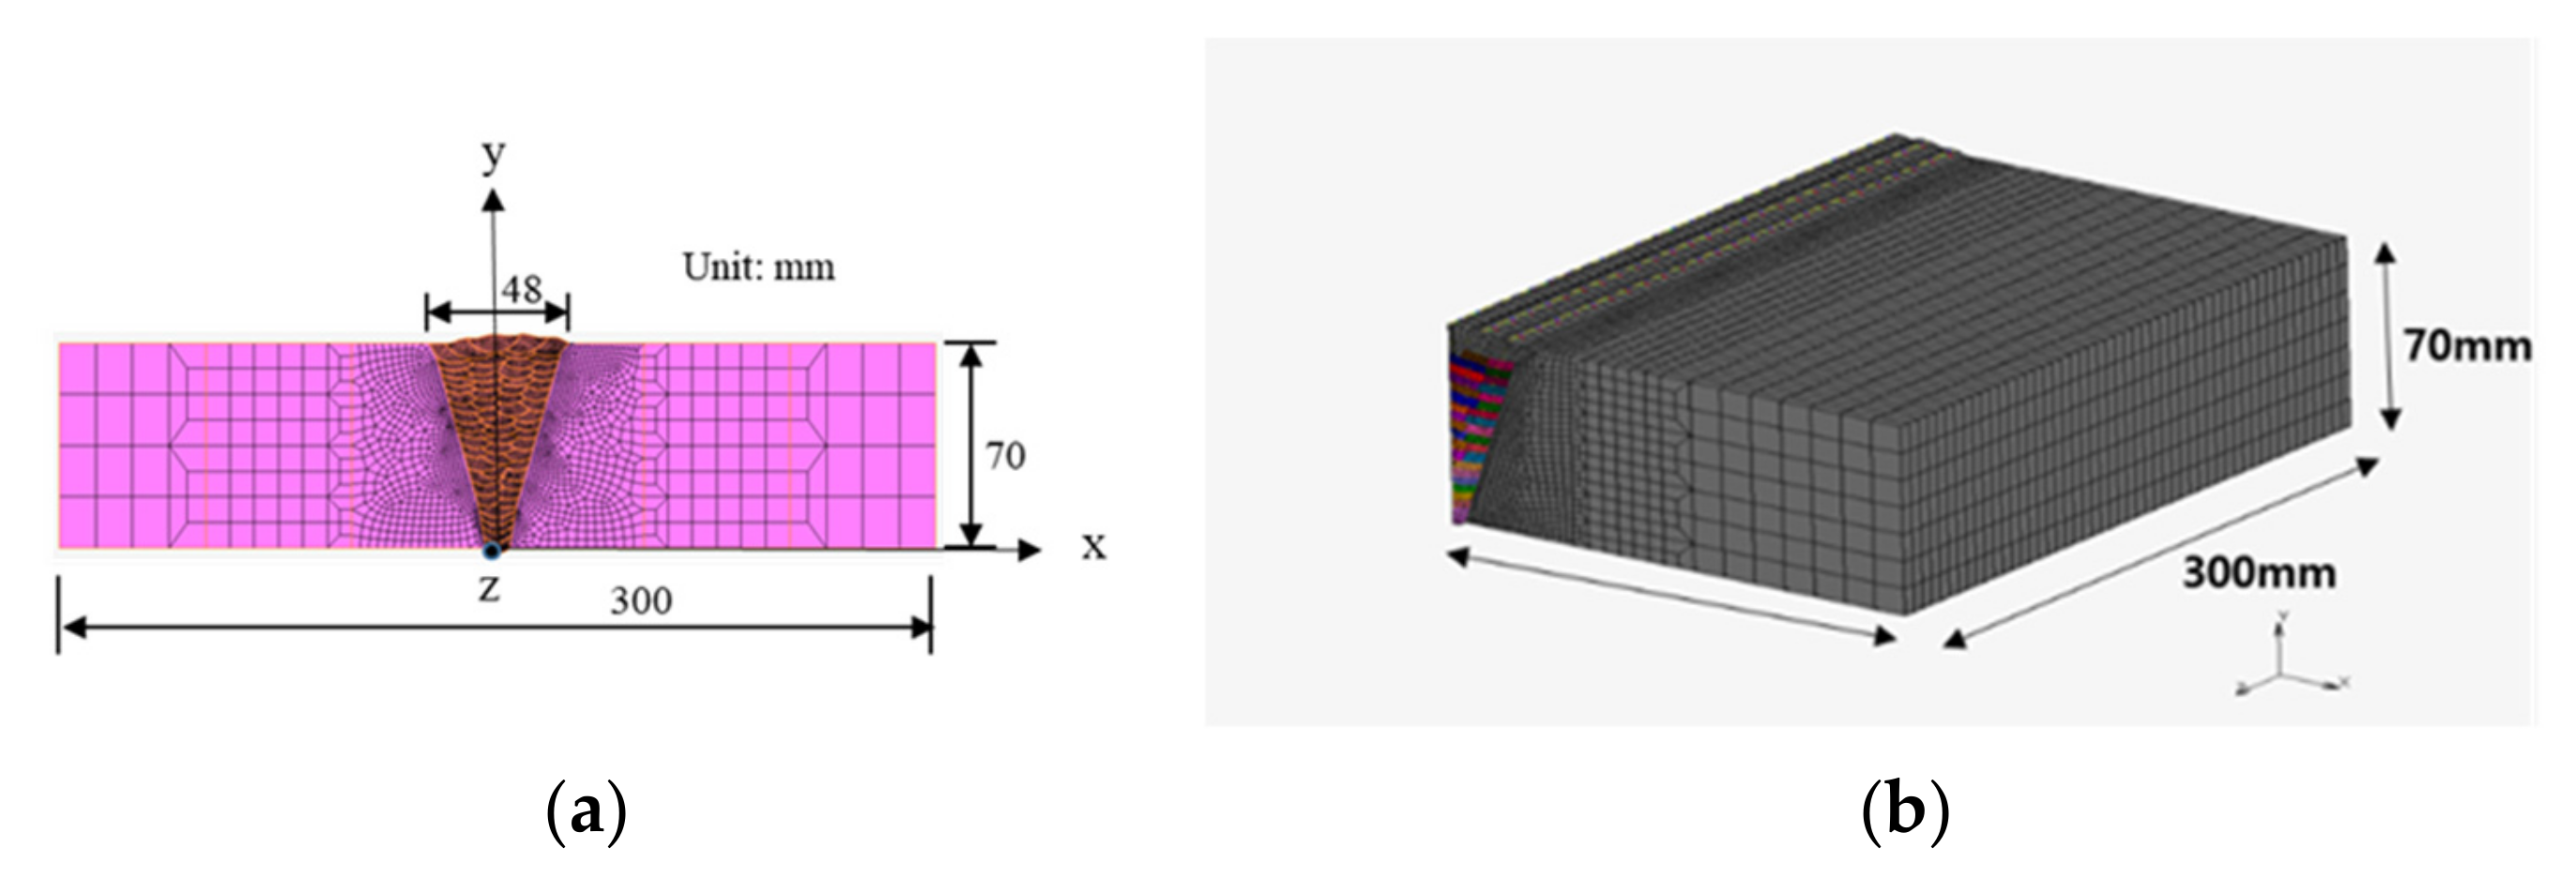
2.1. Experiment and Analysis Model

Figure 1 shows a cross-sectional macrograph of the test specimen used for the experiment and analysis. The test specimen was a piece of steel measuring 300 mm (length) × 300 mm (width) × 70 mm (thickness) with a yield stress of 500 MPa. Table 1 lists the properties of the steel and welding wire used. FCA welding was performed, and the welding conditions and wires used are listed in Table 2. The preheating and interlayer temperatures during welding were set to approximately 120 °C.
Figure 2 shows the 2D and 3D models used for FE analysis. The 3D FE analysis model used only half of the actual structure, considering the symmetry around the welding line. Through various FE analyses, it was confirmed that the use of only half of the actual model did not significantly affect the results of FE analysis [27,28]. Figure 3 shows the temperature dependence of the mechanical properties of the steel with a yield stress of 500 MPa used for the thermal elastic–plastic analysis. The constitutive model is based on the thermal elastic–plastic model for large strains where isotropic hardening is included. Figure 4 shows the contact support used to realize the longitudinal bending restraint effect in the 2D FE analysis.
For modeling the welding heat source, the Weld Flux, Weld Filler, and Weld Path options in MSC Marc/Mentat were used. The model used was a 2D 3/4-node generalized plane strain element. The welding heat source [29] was modeled as a heat source having a volume, as shown in Figure 5, and the heat source equation shown in Equation (1a,b) was used. Welding width and depth were selected based on a welding cross-macro section of the welding experiment specimen. The welding line was set with the Weld Path option, and the welding wire was modeled as the welding heat source moved with the Weld Filler option.
q f x , y , z , t = 6 3 f f Q a b c f π π exp 3 x 2 a 2 + y 2 b 2 + z γ t 2 c f 2
q r x , y , z , t = 6 3 f r Q a b c r π π exp 3 x 2 a 2 + y 2 b 2 + z γ t 2 c r 2
Here,
q f   : Heat input per unit volume of the front molten pool;
q r   : Heat input per unit volume of the rear molten pool;
Q: Total heat input;
a: x-direction weld width;
b: y-direction welding depth;
cf: Length of the front molten pool in the z-direction;
cr: Length of the rear molten pool in the z-direction;
ff and ff: Dimensionless numbers;
η: Efficiency.
f f = 2 1 + c r / c f   ,   f r = 2 1 + c f / c r
The contact support was a boundary condition for considering the constraining effect on the deformation in the longitudinal direction during the 3D analysis, and a contact boundary condition was set to prevent the member from deformation in the downward direction during welding. The boundary conditions of the 3D analysis model were set to simple support conditions to prevent rigid-body deformations. The initial residual stress of a part distant from the weld was implemented in the thermal elastic–plastic analysis. In this case, the initial residual stress generated during forced manufacturing was considered in the form shown in Figure 6, and subsequent calculations were performed [15].

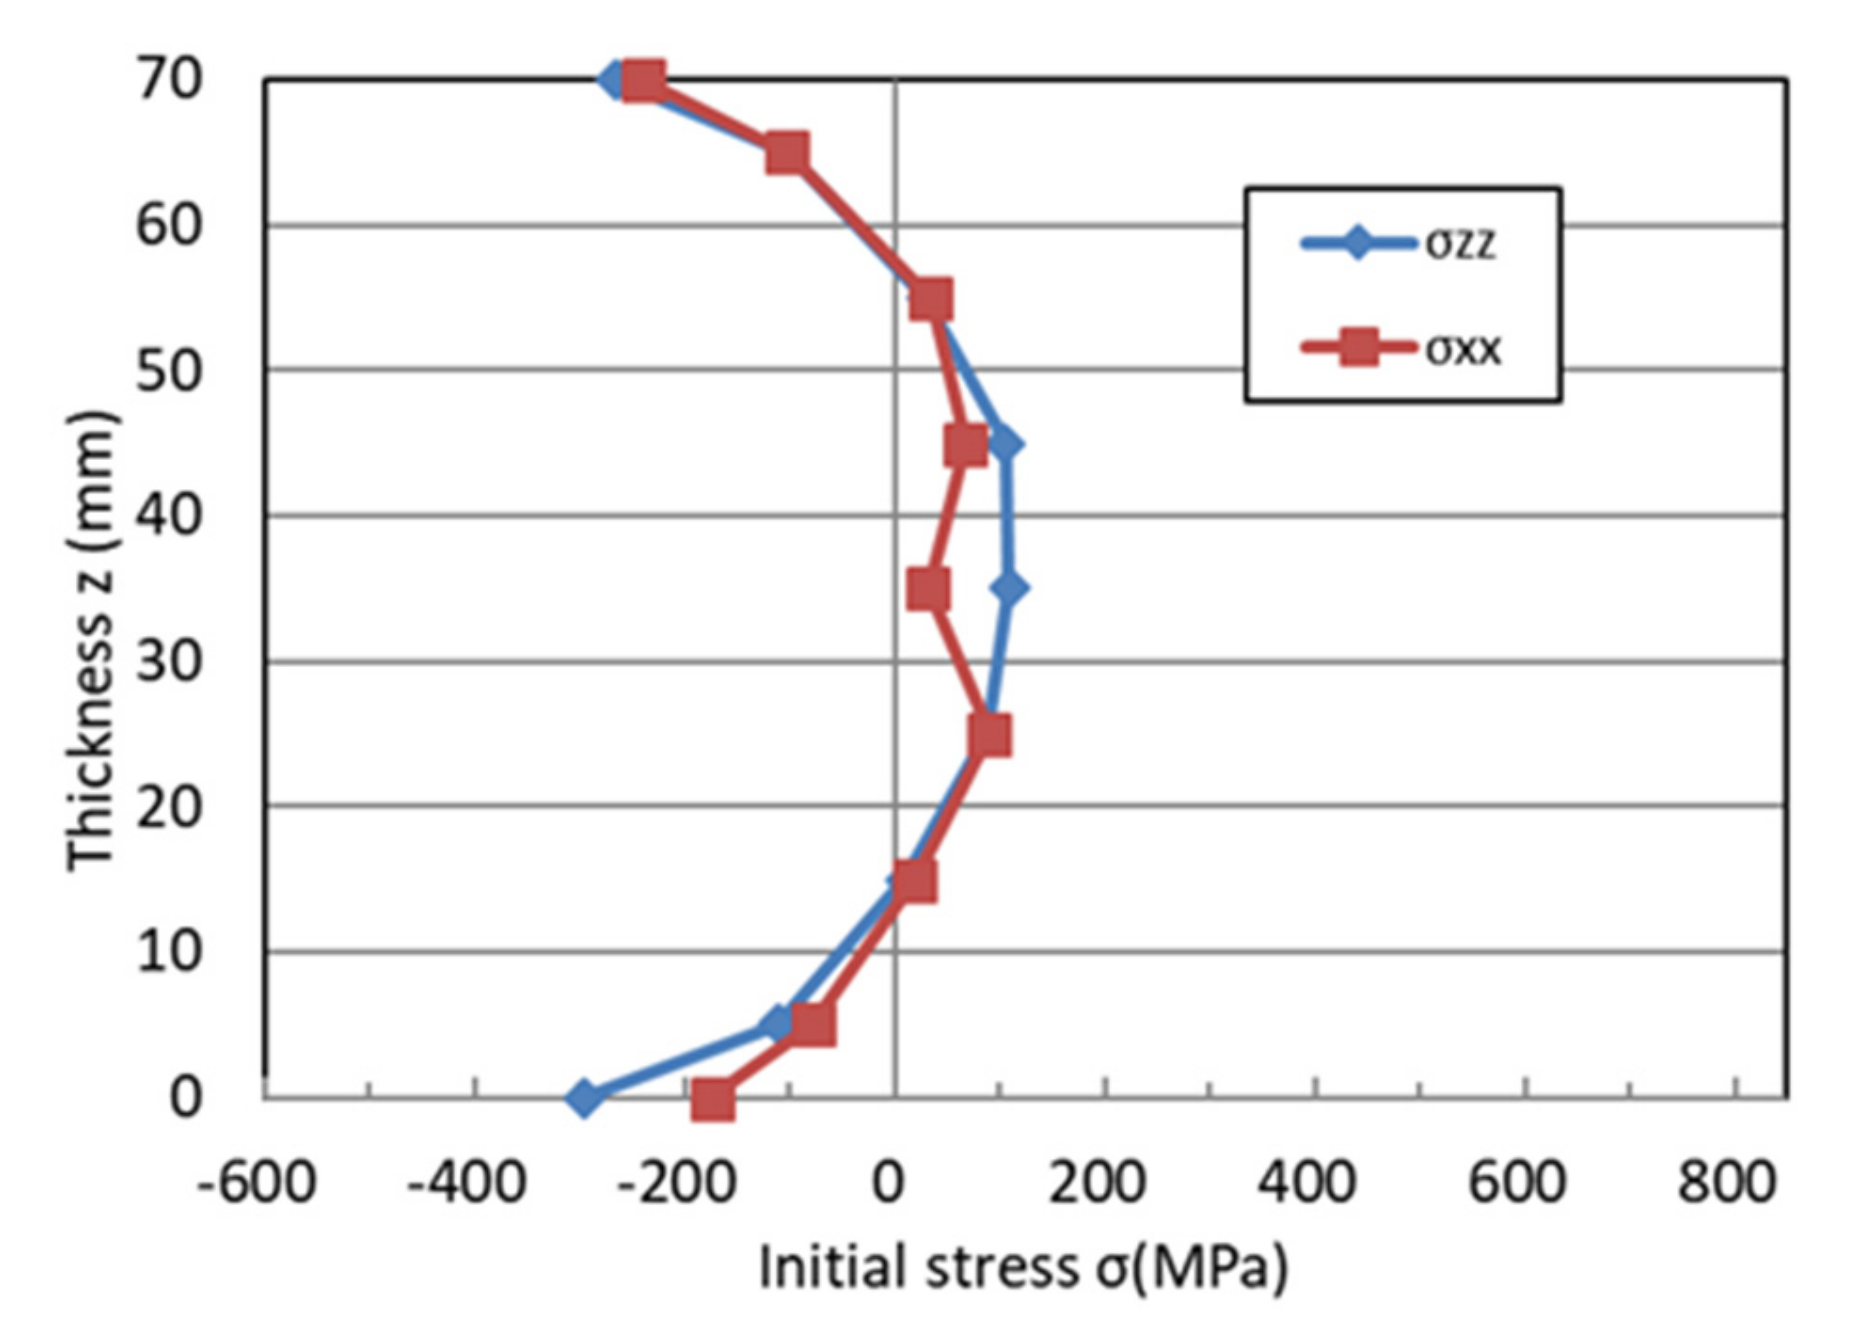
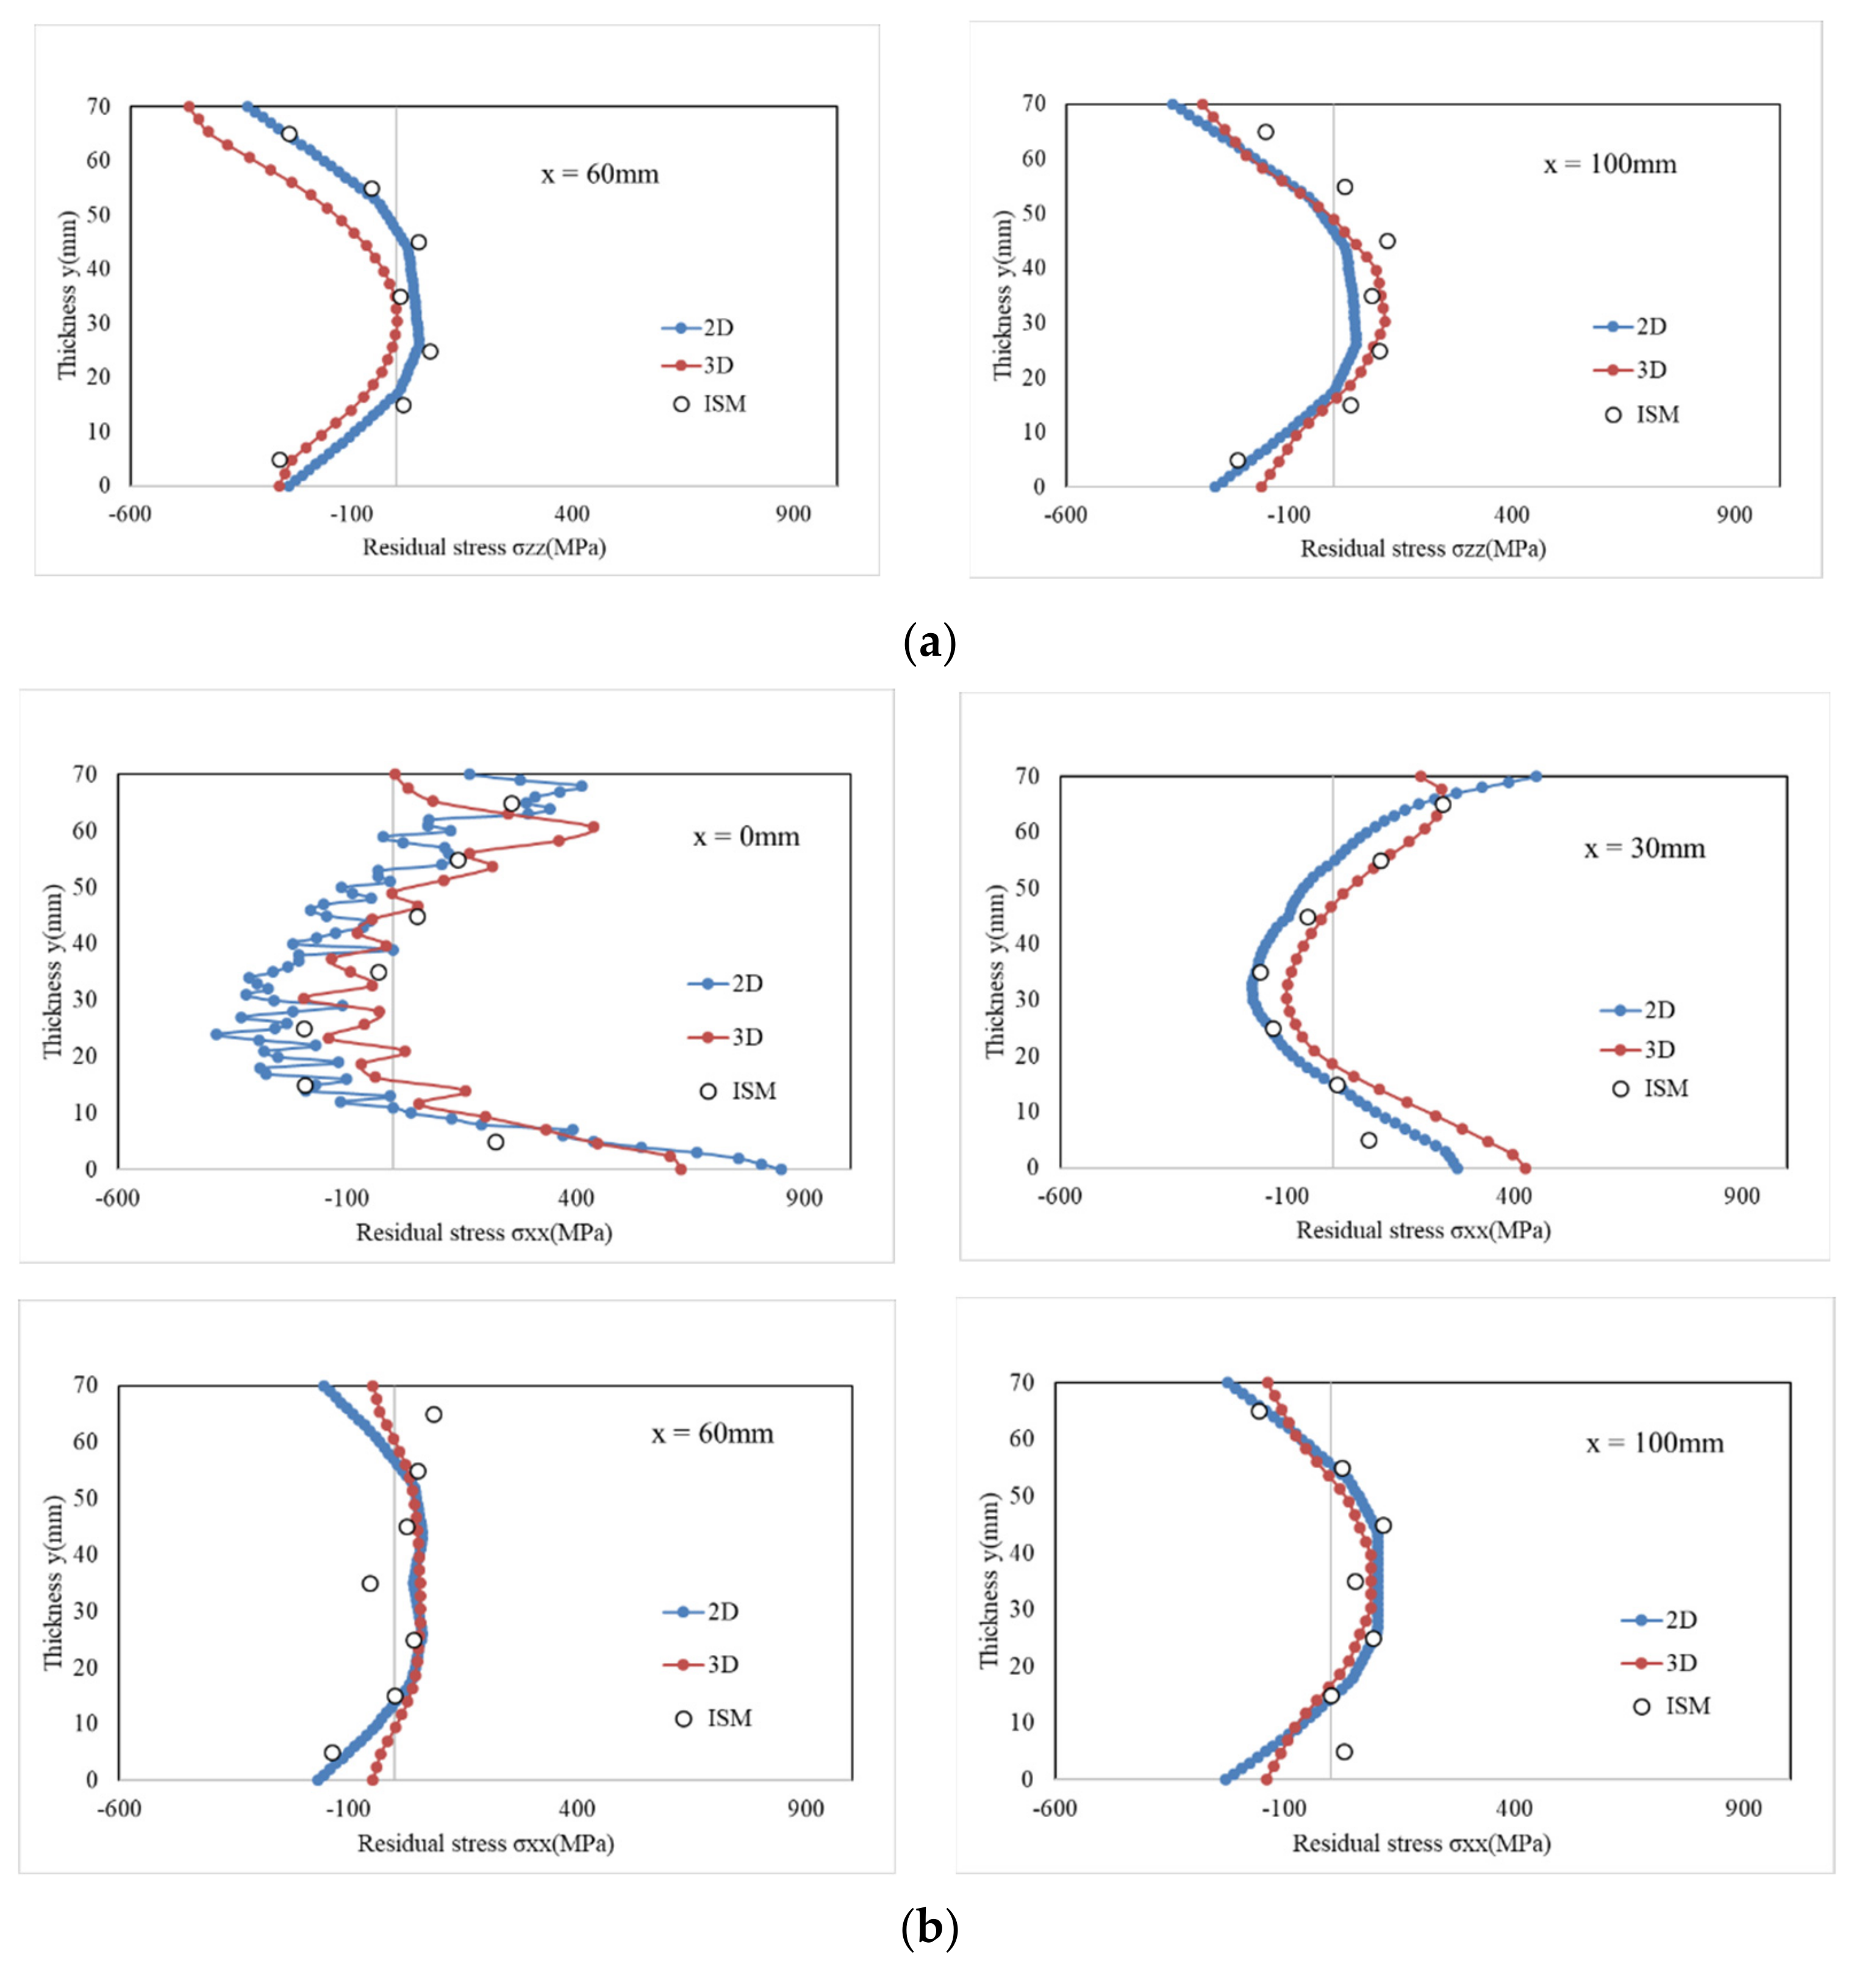
2.2. Comparison of Welding Residual Stress Obtained Using FE Analysis and ISM

Figure 7 shows the FE analysis and measurement results at a distance of 0, 30, 60, and 100 mm from the weld center. The internal residual stress of the specimen was measured using ISM. Subsequently, the results were compared with those obtained using the 2D and 3D thermal elastic–plastic analyses. Figure 7a,b show the residual stresses in directions parallel and perpendicular to the welding line, respectively. As shown in Figure 7a, at the center of the weld (x = 0 mm), the 2D analysis result is 200 MPa higher than the other results. At 30 mm from the center of the welding section, the 2D analysis results differ slightly from those of the 3D analysis but are consistent with the measurement results. At 60 mm and 100 mm, the analysis and measurement results agree well. The location distant from the welded part is not affected by welding; hence, the shape of the initial residual stress is maintained.
It can be observed that the residual stress in the direction perpendicular to the welding line in Figure 7b agrees well with the FE analysis results and the measurement results across the entire area. Therefore, it was confirmed that 2D FE analysis can be used instead of 3D FE analysis, which requires a significant amount of time. Moreover, the residual stress distant from the welding joint was demonstrated to agree well with the FE analysis and experimental results.

3. Effect of Restraint on Residual Stress

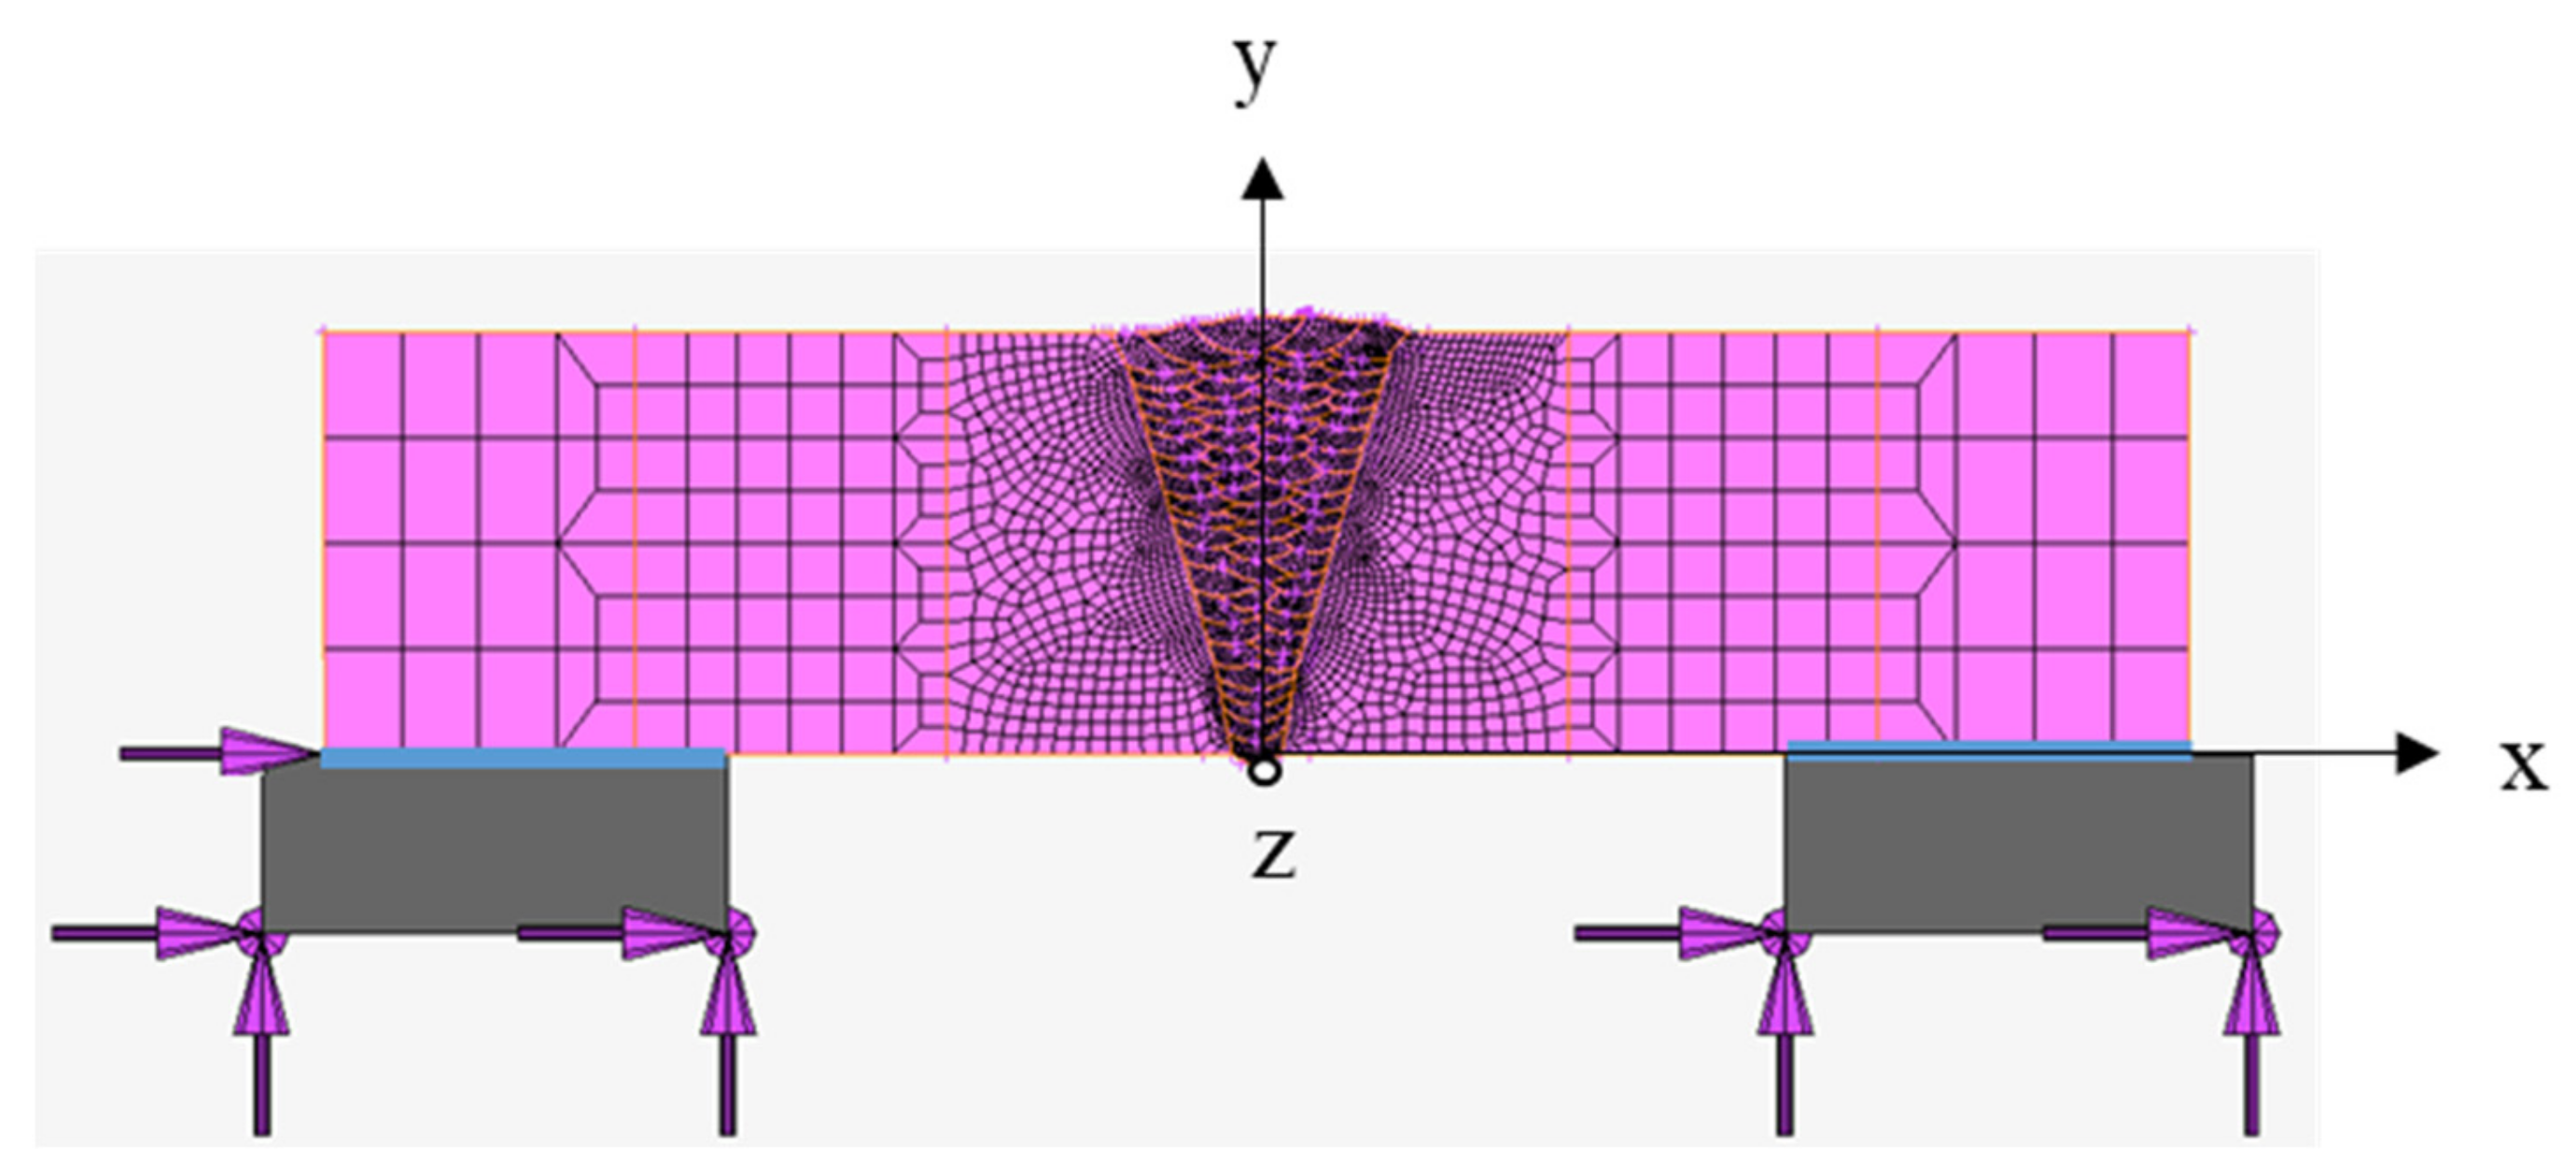
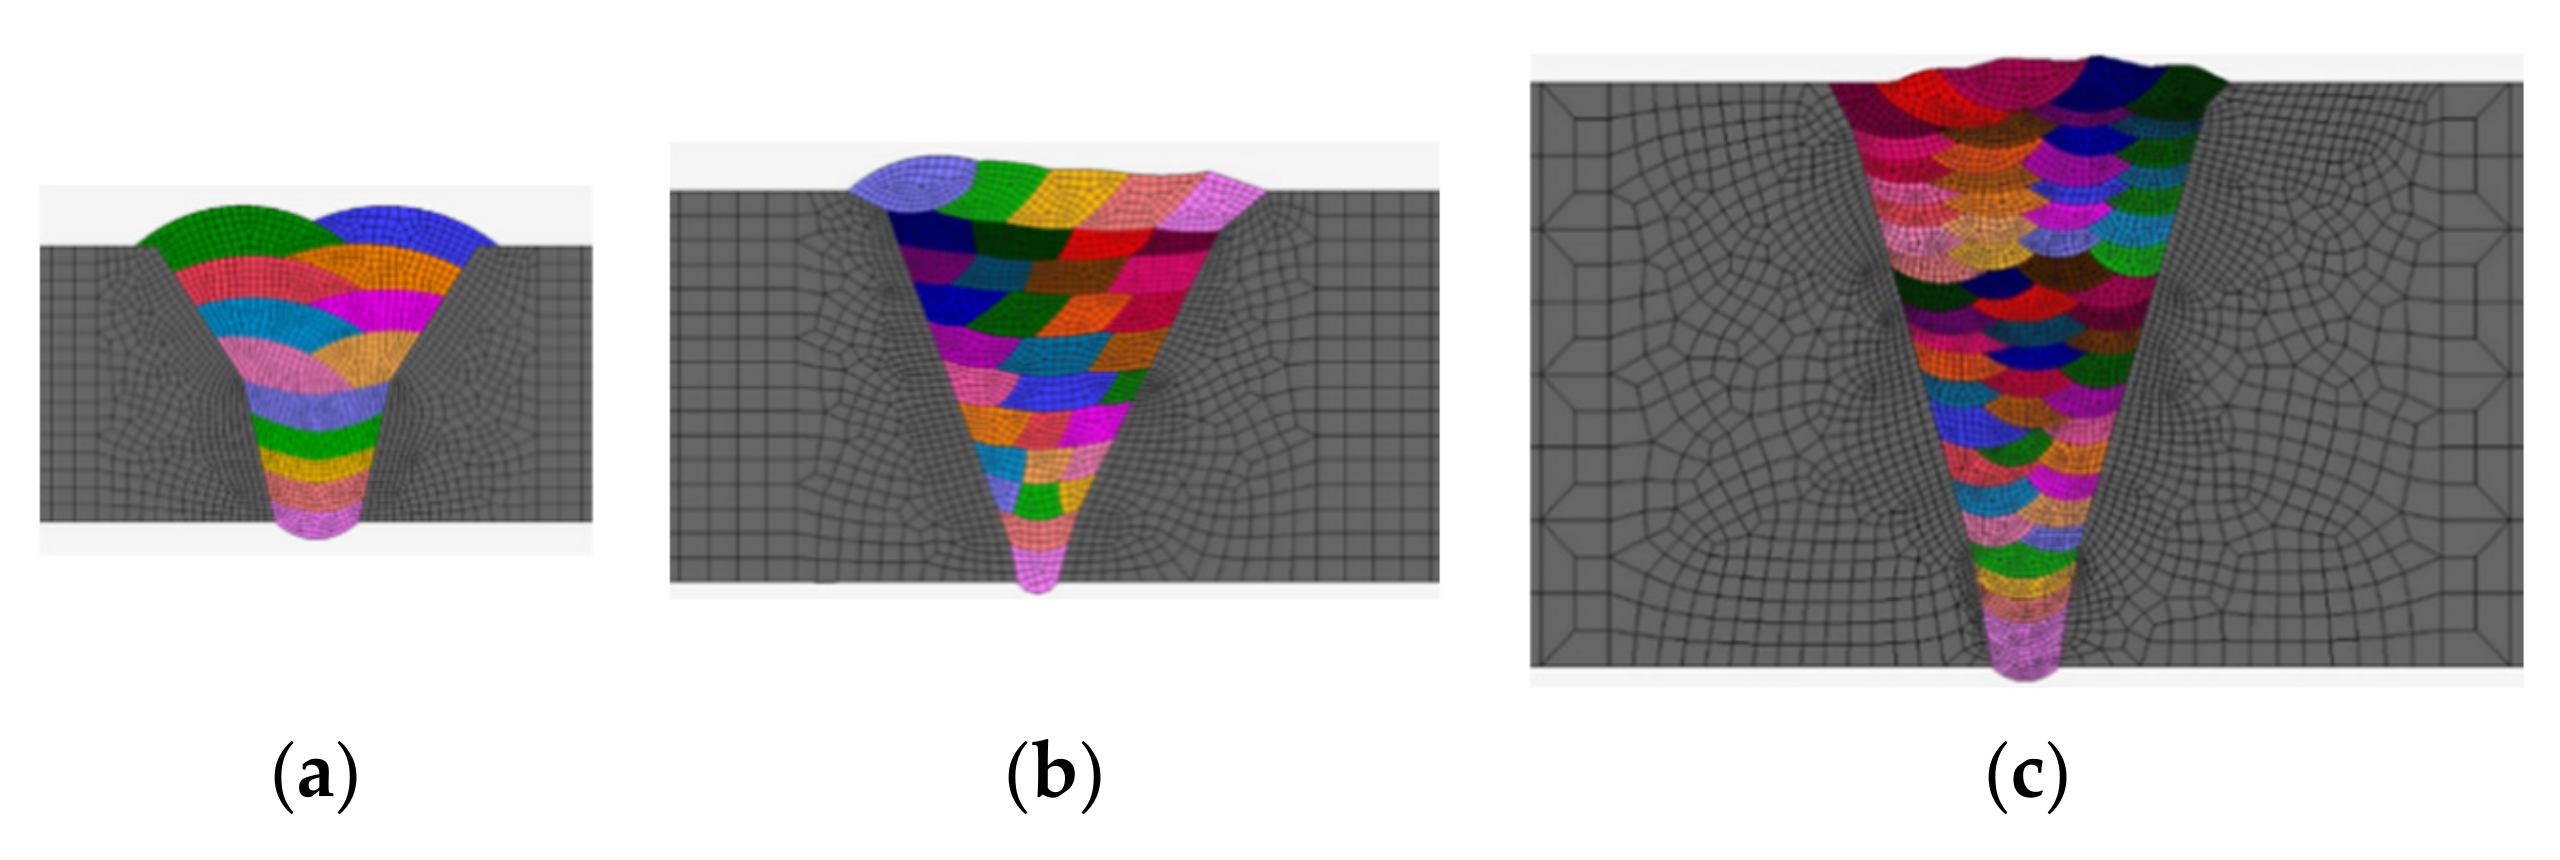
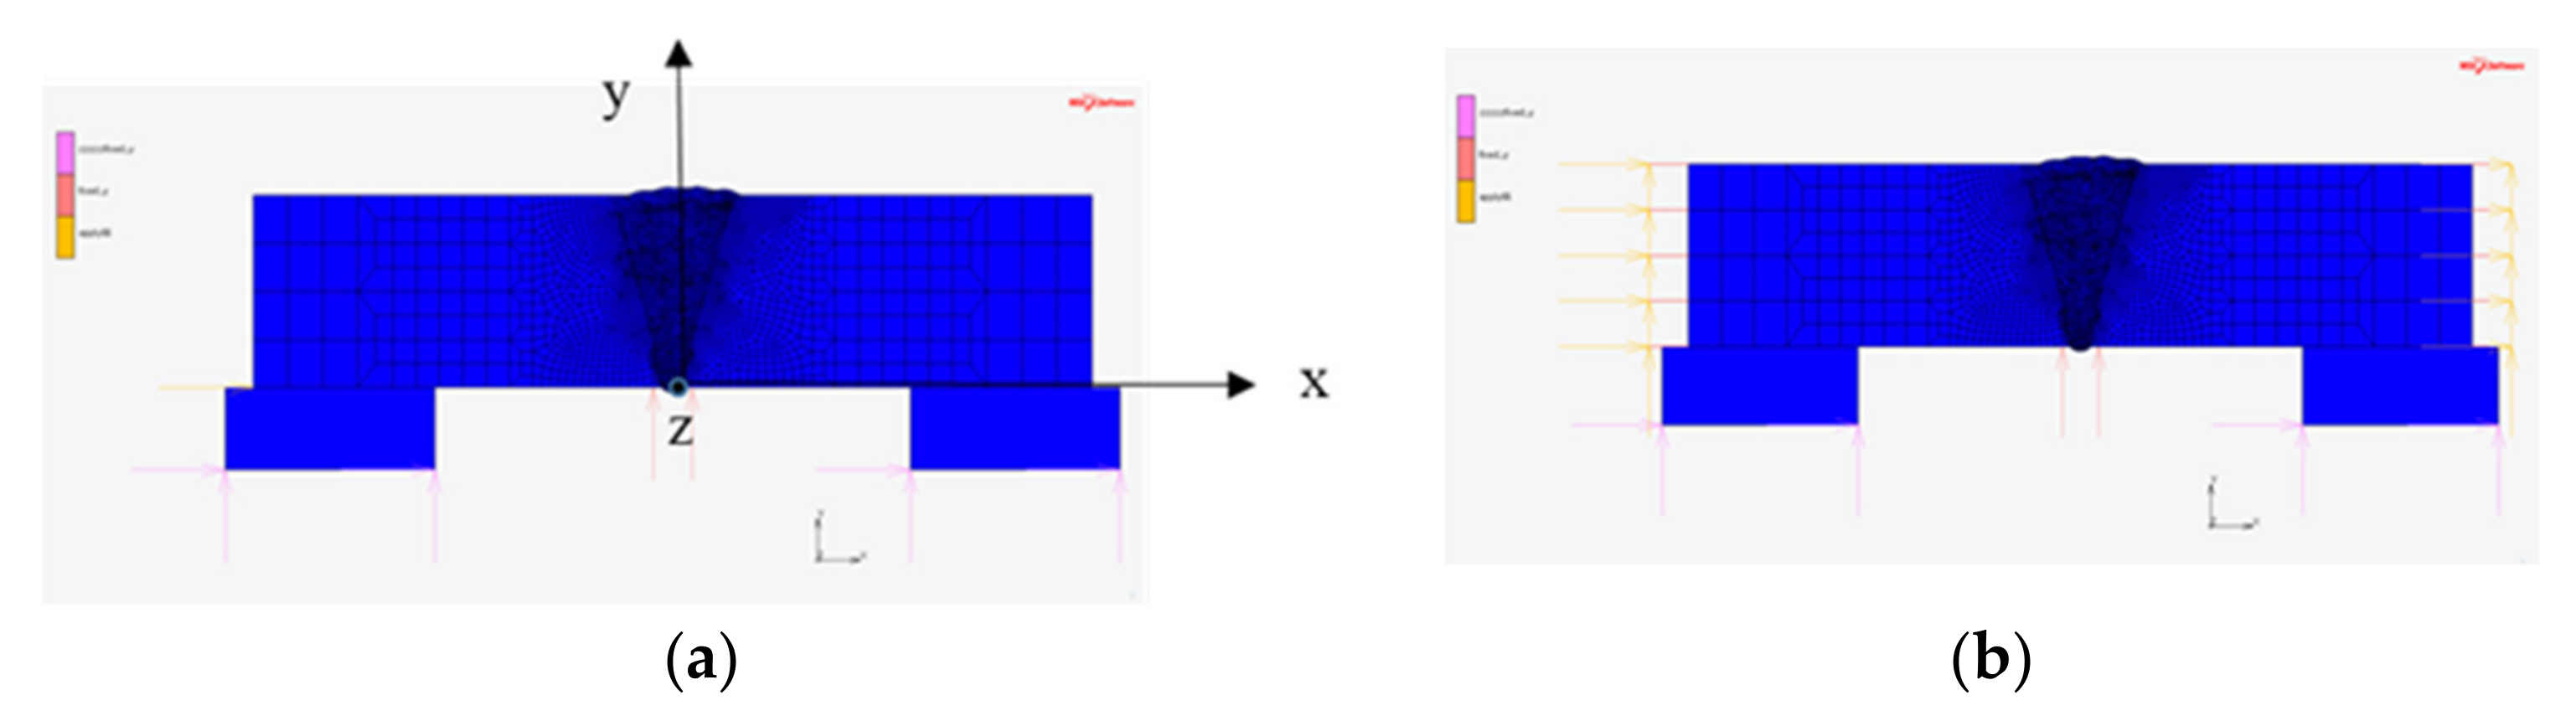
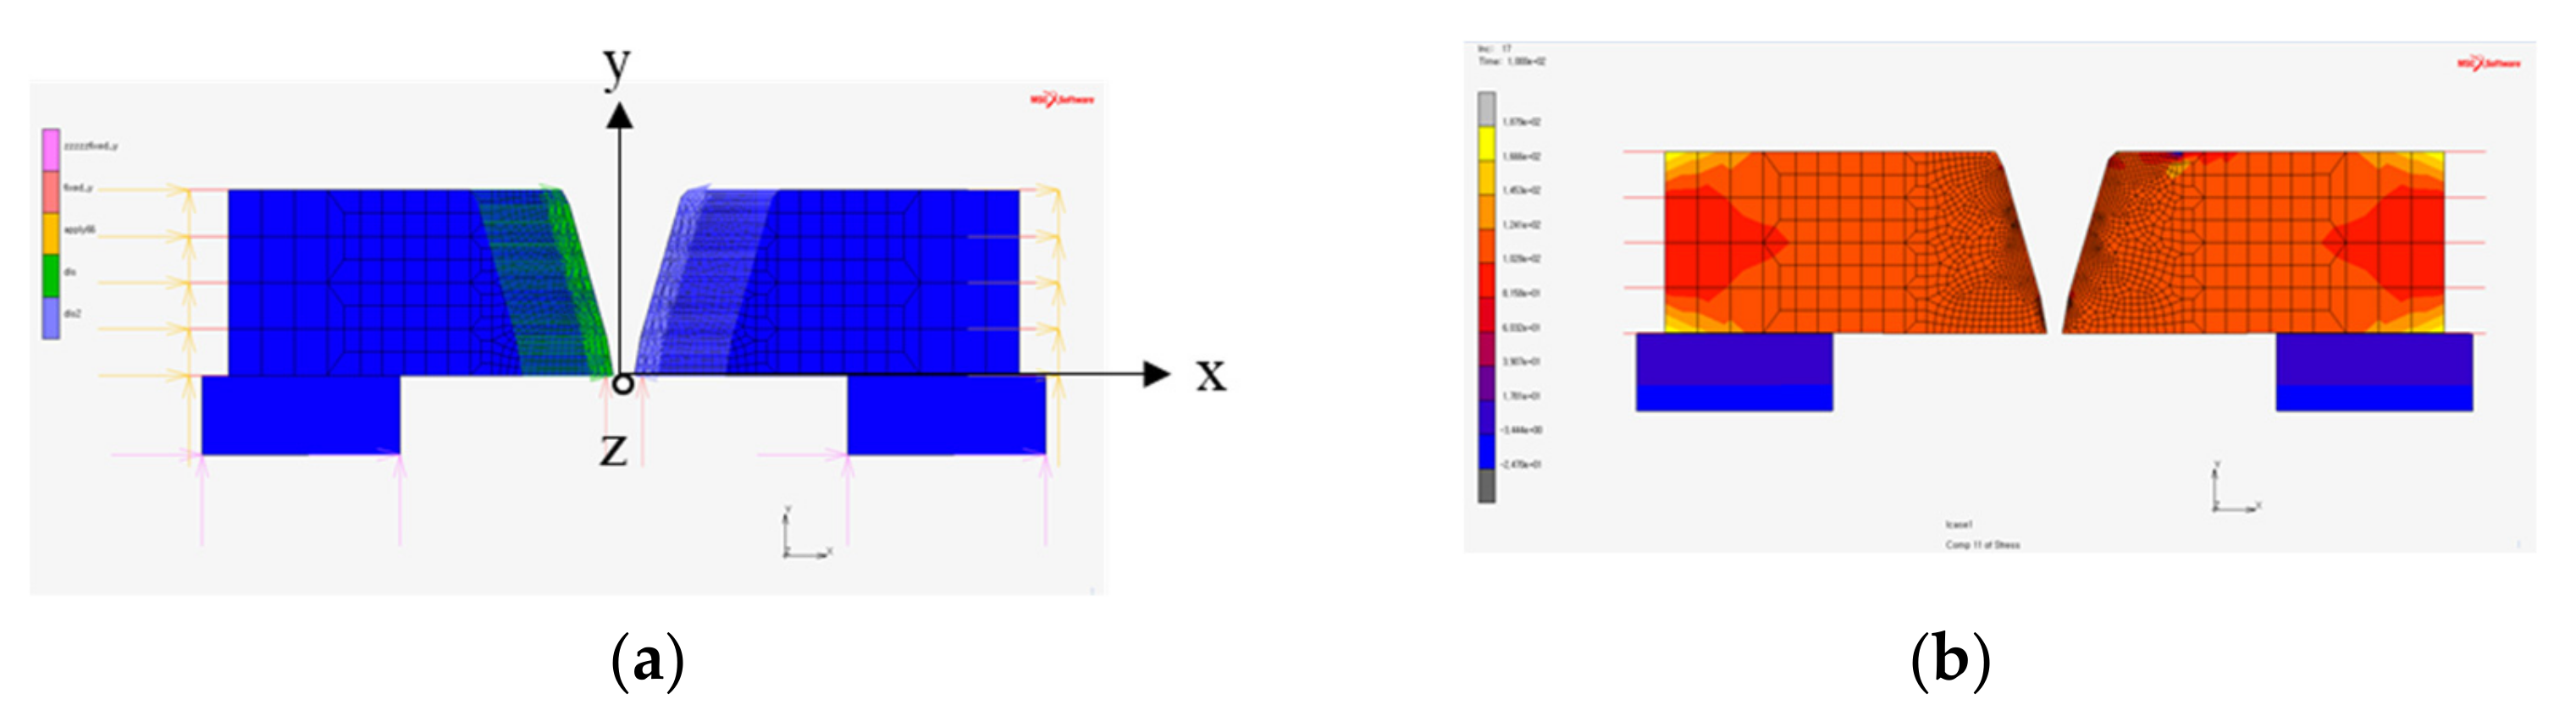
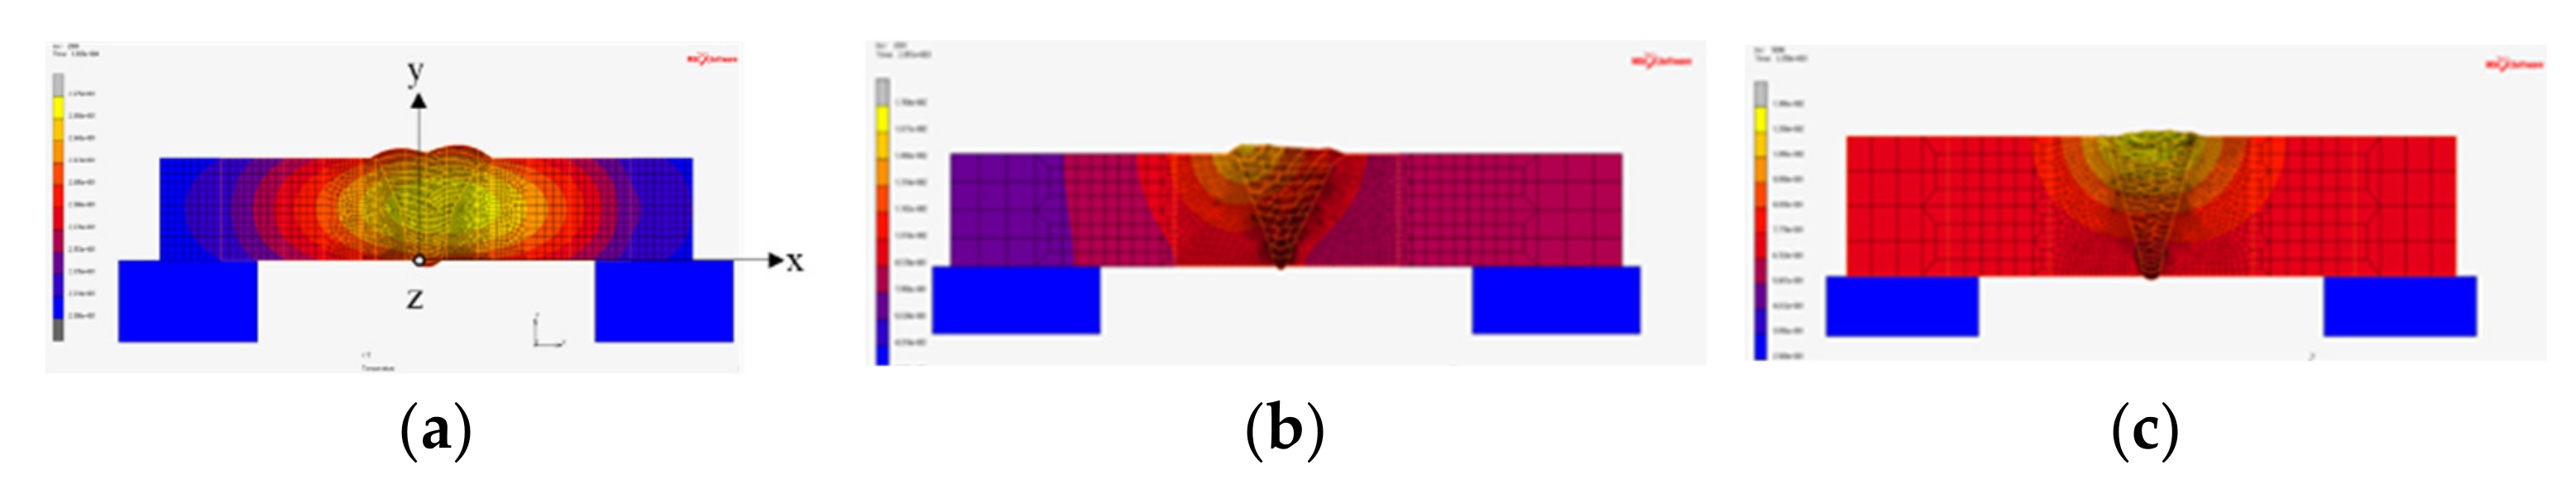
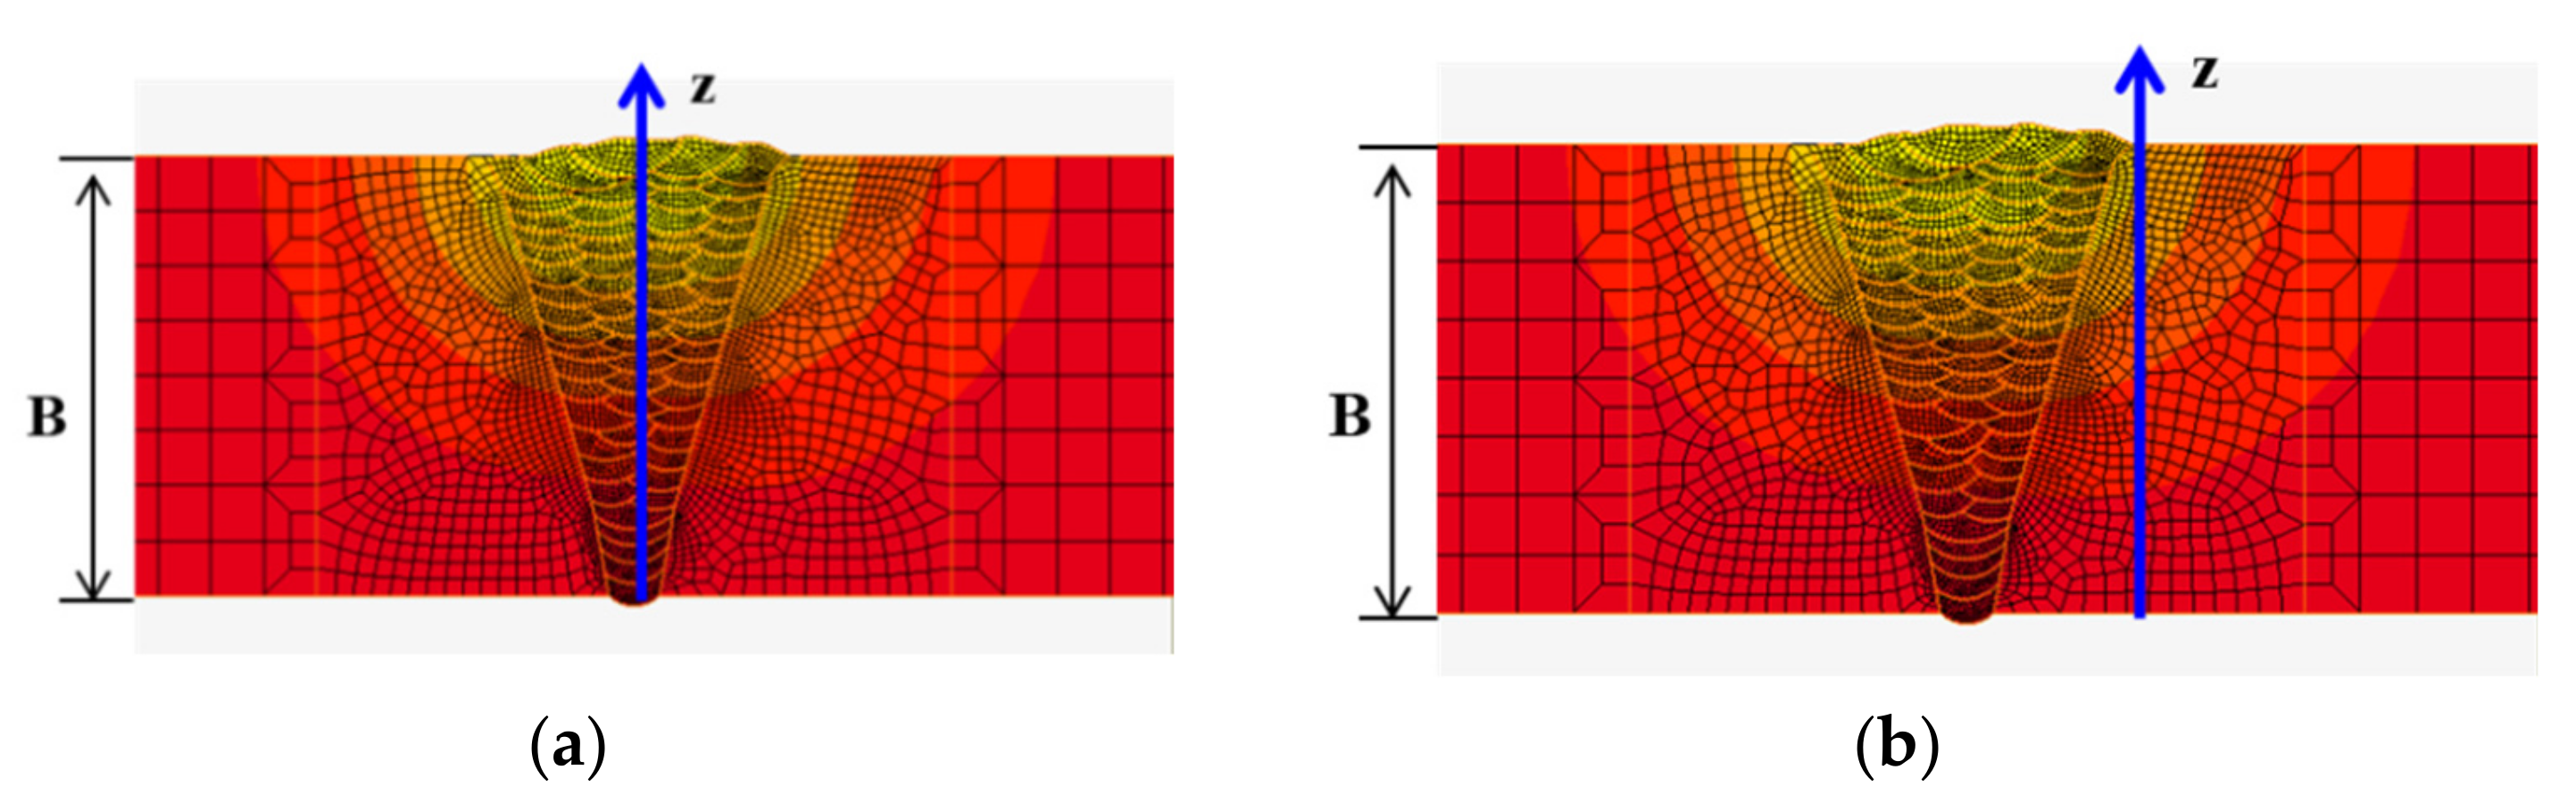
3.1. Model for Restraint Calculation

To investigate the relationship between restraint and residual stress, 36 analysis conditions were set, as shown in Table 3. The thicknesses of the analytical models were 25, 50, and 70 mm; the yield strength of the steel was set to 330, 405, and 590 MPa; and the sizes of the restraints were 0, 100, 200, 300, and fixed MPa/mm. A fixed value means that the end is completely constrained, and the degree of restraint appears differently depending on the yield stress and thickness of the member. A zero value (0) signifies a state without restraint. Table 4 shows welding conditions for thicknesses of 25 and 50 mm.
Figure 8 shows the number of welding passes for each thickness. Figure 9 shows the model with a thickness of 70 mm. The restraint magnitude was obtained by adjusting the stiffness of the spring element (Figure 9b) on the side of the model. At this time, the spring element resisted contraction and expansion. In the thermal elastic–plastic analysis, the boundary conditions were minimally constrained to prevent rigid-body motions and a rigid contact structure was installed below to realize the effect of the 3D analysis. Figure 10 shows the process used to calculate restraint. Figure 10a shows that a forced displacement of 1 mm was generated in the direction perpendicular to the weld line, and Figure 10b shows the stress distribution at that instance. The degree of restraint is the stress generated at that time, that is, the stress (MPa) that occurs when a 1 mm displacement is applied to the welding joint with forced displacement, and the units are MPa/mm.

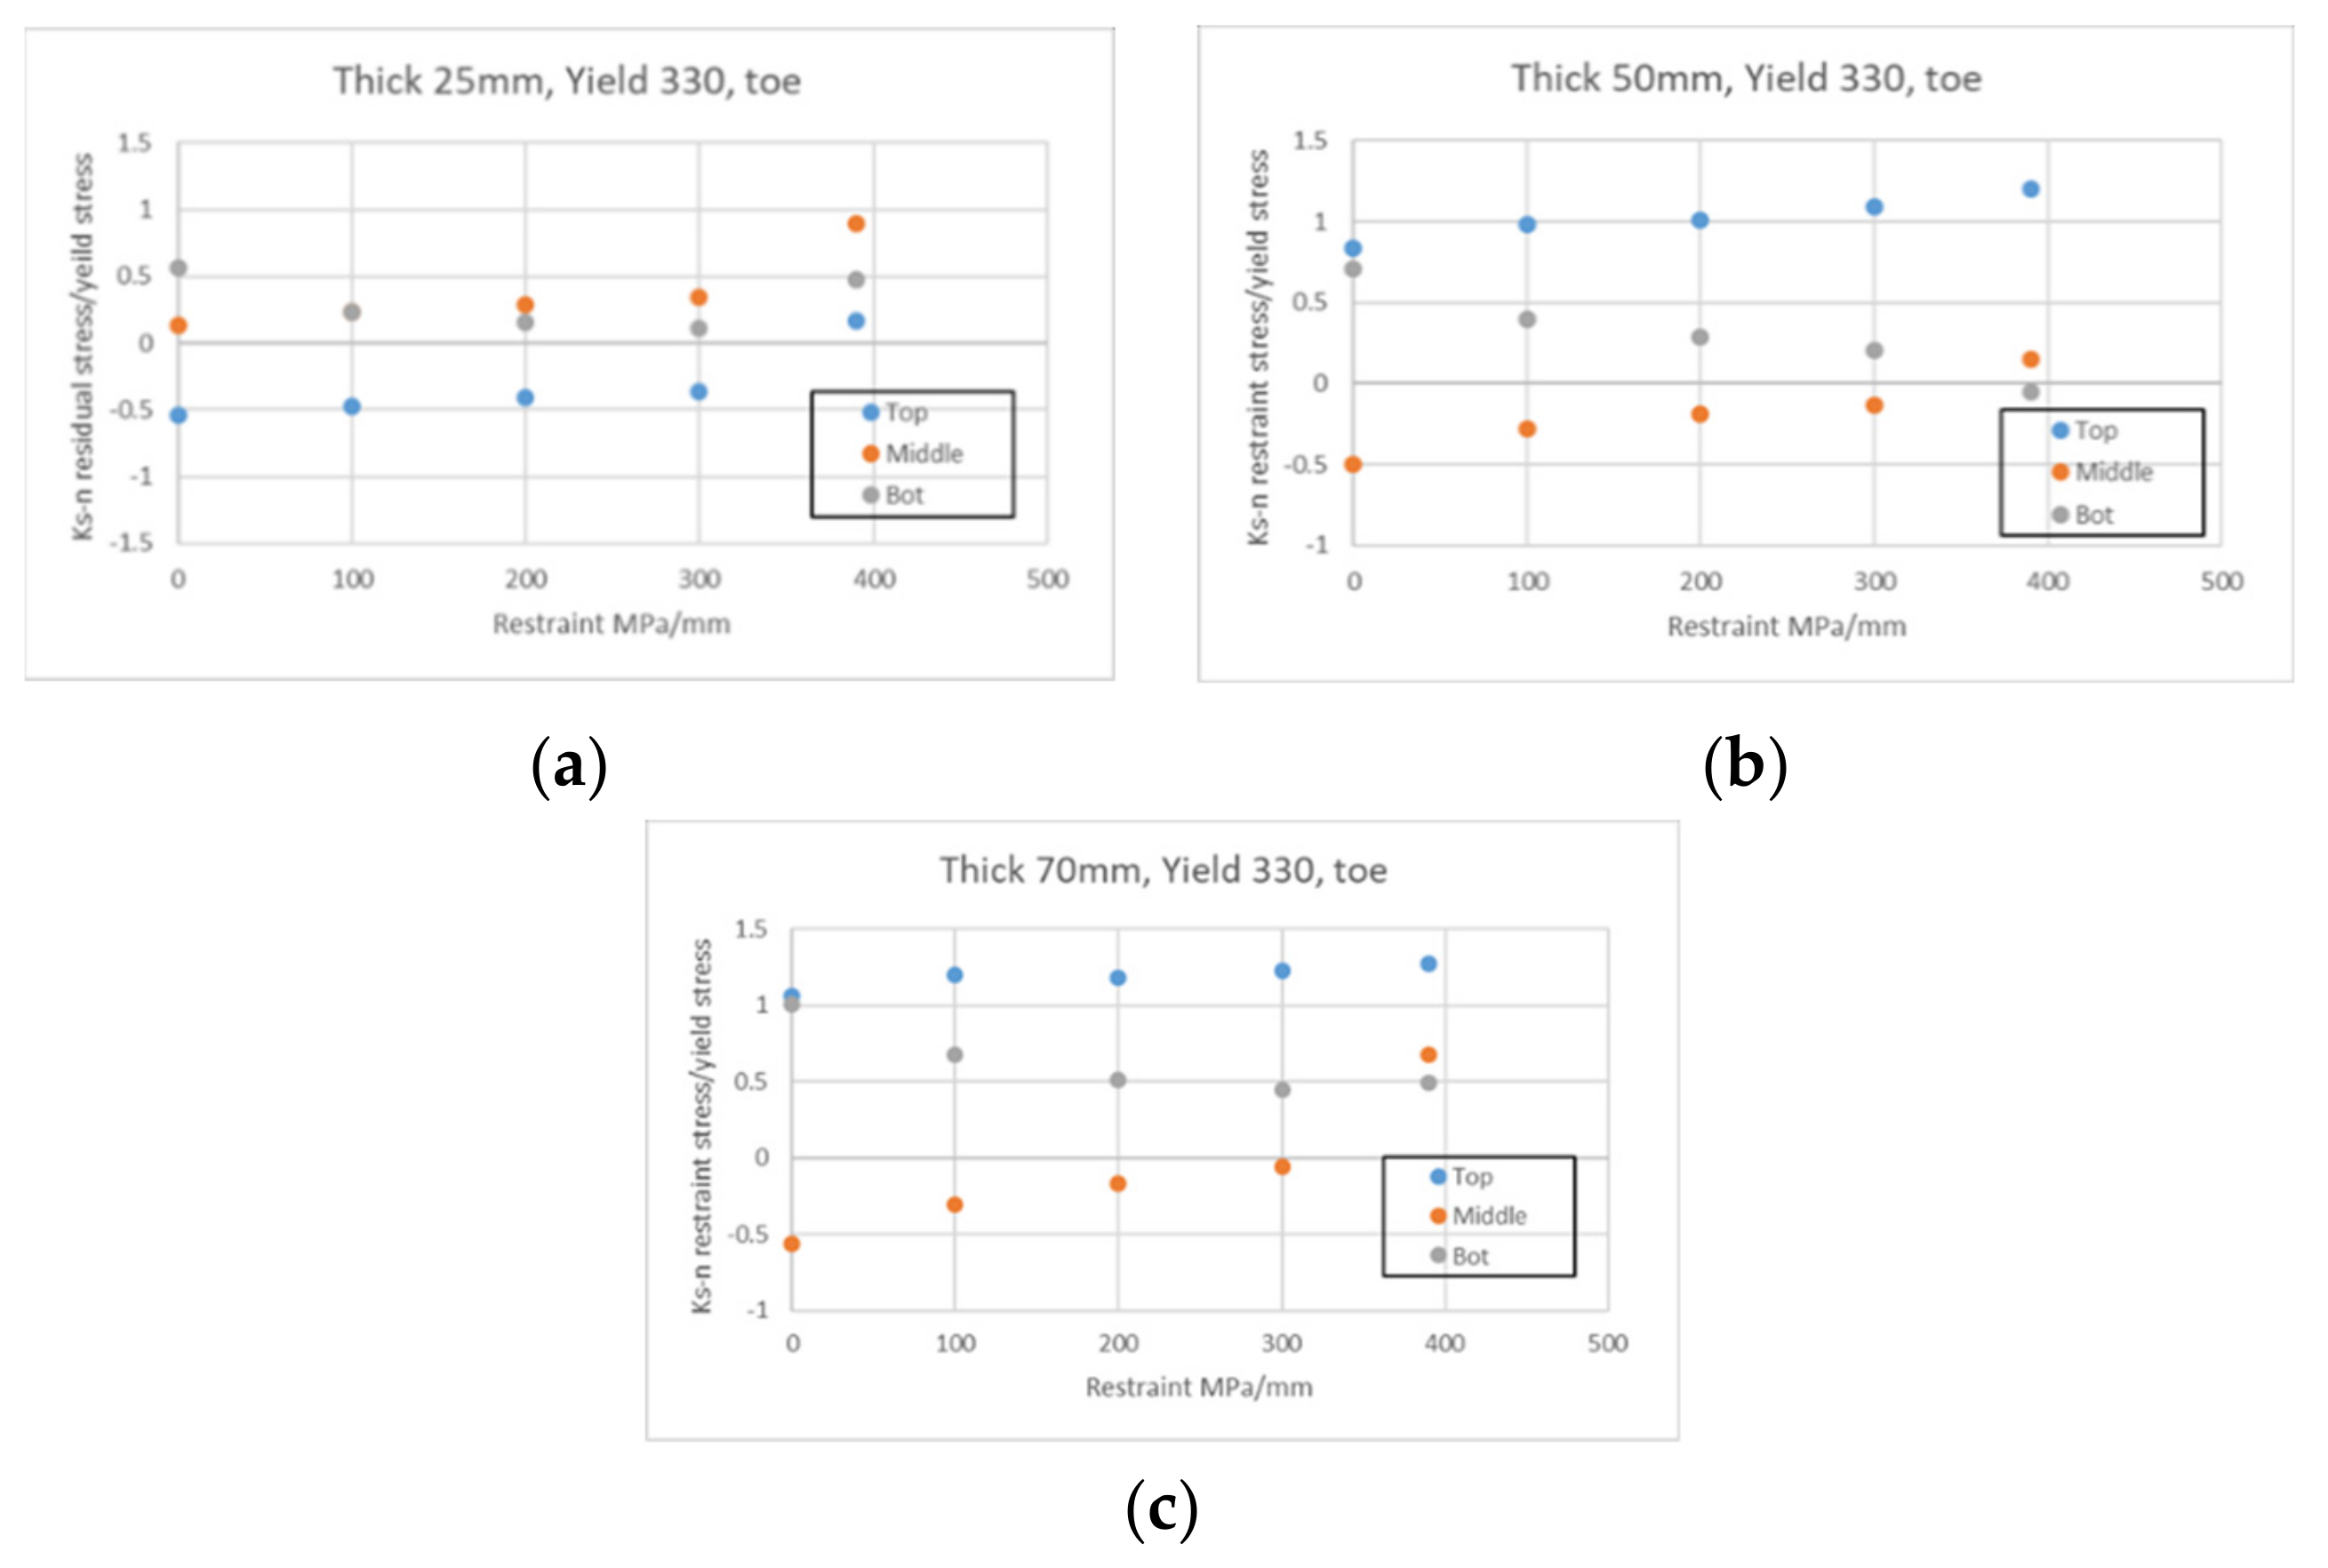
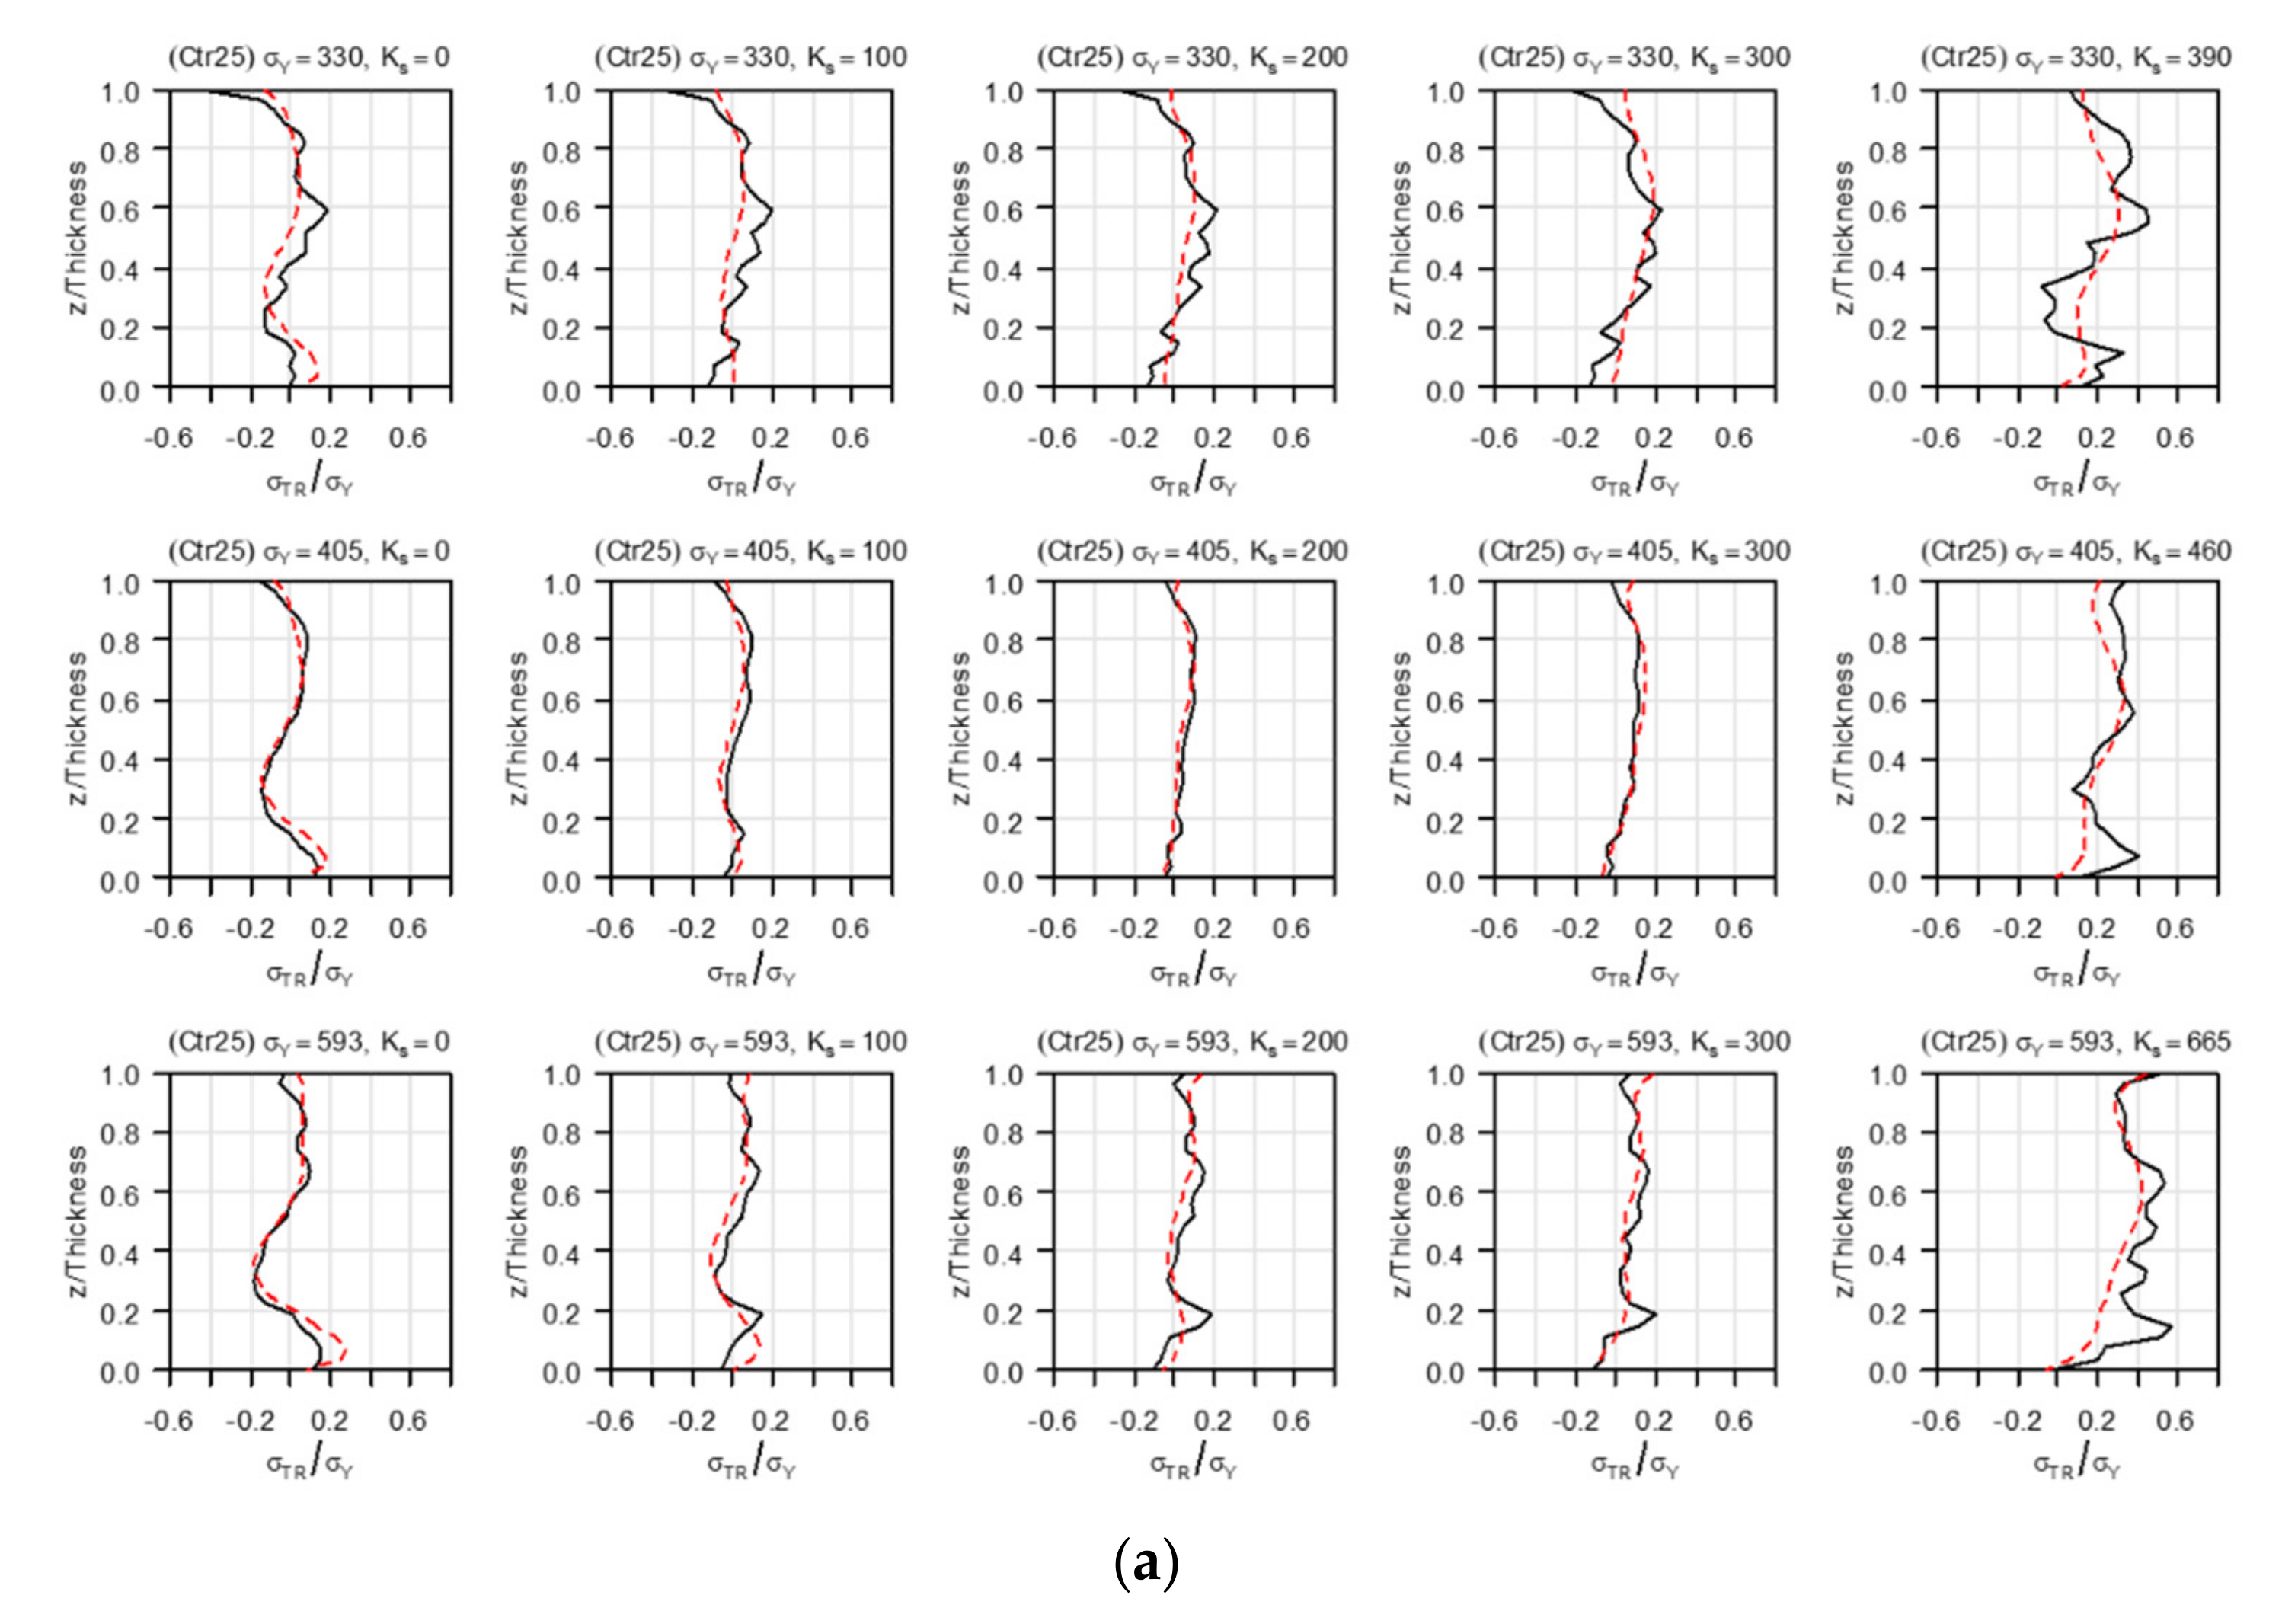
3.2. Effect of Restraint on Residual Welding Stress

Figure 11 shows the temperature distribution during the last welding pass based on the thickness. The physical properties and mechanical properties considering temperature dependence in Figure 3 were considered in the FE analysis of temperature. Figure 12 shows the residual stress for the restraint of 300 MPa/mm, the thickness of 70 mm, and the yield stress of 330 MPa. Here, the x-direction and the z-direction are perpendicular and parallel to the welding line, respectively. The residual stress in the direction of the welding line is the highest.
Figure 13 and Figure 14 show the residual stresses in the welding center and the toe from the analysis results shown in Figure 12. Figure 15 shows the welding center and the toe parts. Here, B is the thickness and z is the coordinate in the thickness direction from the bottom of the member. As shown in Figure 13a, the residual stress (σz) in the direction parallel to the welding line is almost unaffected by the change in restraint. However, the residual stress (σx) in the direction perpendicular to the welding line is affected by the restraint. No changes can be observed in the direction parallel to the welding line because the restraint in the welding line direction is sufficiently restrained by its rigidity. However, in the direction perpendicular to the welding line, when no transverse restraint occurs, the shrinkage and expansion in the transverse direction move relatively freely.
When the residual stress in the direction perpendicular to the weld line is restrained through the spring element, the shrinkage and expansion of the weld are restrained in the direction perpendicular to the weld line, thereby affecting the magnitude and distribution of the residual stress in the weld. Transverse restraints affect the welding residual stress from the first-layer weld to 2/3 of the thickness and have a weaker effect on the final weld layer. This is because the restraint is concentrated in the first-layer weld. At the same time, in the top part of the weld, the already welded lower part cools and recovers rigidity, the welded part gradually expands, and the self-rigidity also increases; thus, it is less affected by the restraint. Specifically, the tensile stress generated when there is no restraint in the first layer of the welded portion slowly changes to compressive residual stress as the restraint increases. The compressive stress generated in the middle and top parts of the thickness increases in the tensile direction as the degree of restraint increases. The compressive residual stress in the middle part moves to the tensile side as the restraint increases.
Figure 16 shows the effect of the residual stress when the restraint increases at a yield stress of 330 MPa at the toe. The horizontal axis represents the restraint, and the vertical axis represents the value obtained by dividing the residual stress by the yield stress at the top, the center, and the bottom. At a thickness of 25 mm, the restraint increases and the residual stress is less than half of the yield stress. However, at the restraint of 390 MPa/mm, the residual stress is close to the yield stress. At thicknesses of 50 and 70 mm, as the restraint increases, the residual stress gradually decreases in the middle and bottom parts and is approximately 1.3 times the yield stress in the upper part. Therefore, except for the top part of the thickness, the residual stress tends to decrease as the restraint increases. When the restraint is 300–350 MPa, it cannot be regarded as the constraint of a general structure because of the restraint generated by the slit-type welding joint specimen used in the welding crack sensitivity test.

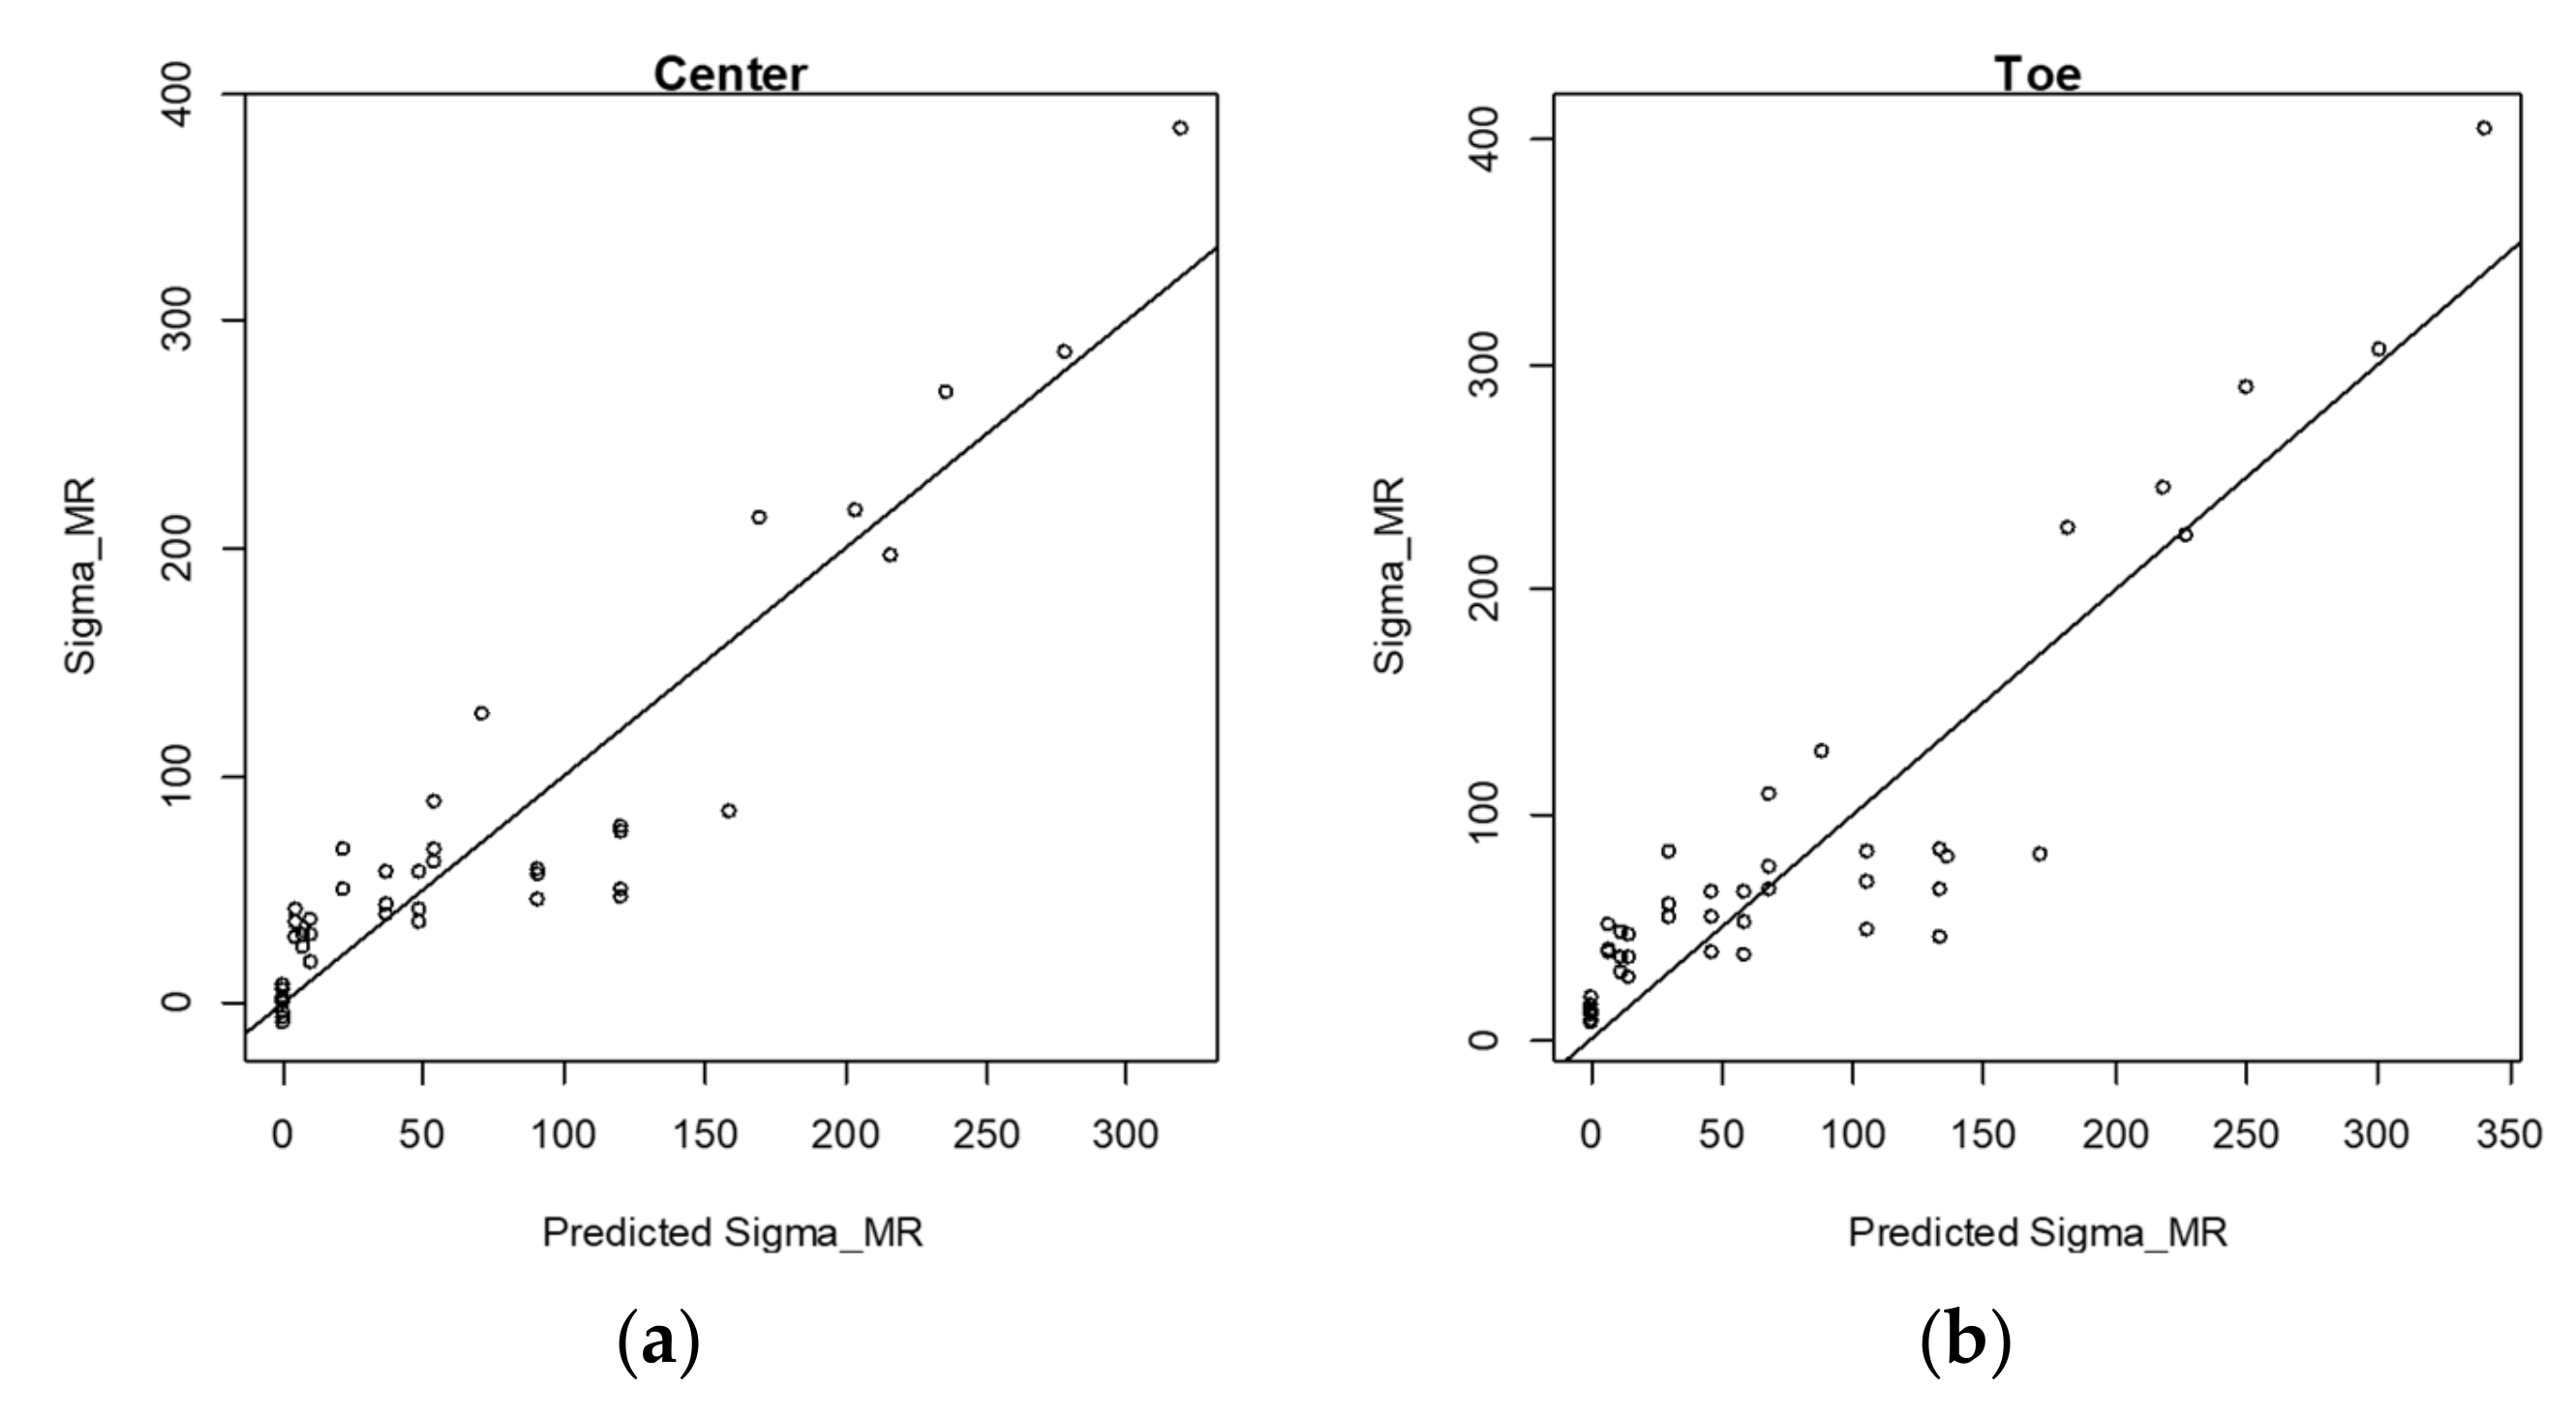
3.3. Prediction Equation and Discussion

In this study, to develop a prediction model of the residual stress (σTR) in the welding center and the toe parts in the direction perpendicular to the welding, the yield stress (σY), constraint (Ks), the position from the bottom of the member in the thickness direction (z), the thickness of the member (B), and the mean residual stress (σMR) were set as predictors. In this case, the residual welding stress (σTR) was calculated by performing thermal elastic analysis by changing the predictive variable. R language, widely used in statistical analysis, was used to establish the predictive model in this study, and the coefficients of the predictive model were estimated using the least squares estimation method. First, the mean residual stress (σMR) according to the magnitude of the yield stress and the restraint was used as a predictive variable for the welding residual stress; therefore, a predictive model for the mean residual stress was established, as shown in Equation (2).
σ M R = σ Y θ 1 · K s θ 2
In this study, R2 and the root mean squared error (RMSE) were used to evaluate the accuracy of the model and were calculated as follows:
R 2 = i = 1 n y ^ i y ¯ 2 i = 1 n y i y ¯ 2 ,
R M S E = 1 n i = 1 n y i y ^ i 2    
Here, y ^ i and yi represent predicted values and values calculated using FE, respectively; y is the average of the FE-calculated values, and n is the number of data points. As this study includes the FE analysis results where the residual stress passes through 0 (zero), the mean absolute percentage error, which is used to express the relative error ratio, was not adopted as an index because it tends to exaggerate the error compared to the actual point. Table 5 shows the parameter estimation results and performance of the mean residual stress prediction model for the center and the toe parts of the weld. The RMSEs of the average residual stress for the yield stress and restraint conditions were 32.8728 and 36.8211, respectively, and the corresponding R2 values were 85.49 and 83.89%, respectively, which are excellent results. R2 is an indicator of the correlation between the predicted value and the actual value of the mean residual stress. The closer R2 is to 100%, the higher is the accuracy of the prediction model. The results obtained in the present case are shown in Figure 17. The more the data match the straight line, the smaller is the prediction error.
The prediction model for the welding residual stress (σTR) is given in Equation (3). First, the predictor variable is expressed as a linear combination of bi in Equation (4). A predictive model was established by combining this with Equation (3), expressed as a polynomial for the thickness variable ( z B ) of the member normalized to a value between 0 and 1.
σ T R σ Y = b 0 + b 1 z B 1 + b 2 z B 2 + b 3 z B 3 + b 4 z B 4 + b 5 z B 5 + b 6 z B 6
where
b i = c i 0 + c i 1 σ Y + c i 2 K s + c i 3 σ M R + c i 4 B ,     i = 0 , 1 , 6 .
Here, σTR is transverse residual stress (MPa), σY is yield stress (MPa), σMR is residual stress (MPa), Ks is restraint (MPa/mm), z is location in the thickness direction (mm), and B is thickness (mm).
The results of the estimation model for the welding residual stress are presented in Table 6 and Table 7. A total of 35 prediction model coefficients were obtained for the center and the toe parts. The RMSEs for the welding center and the toe parts were 101.6 and 55.93, respectively, and the R2 values were 72.12 and 86.19%, respectively. Figure 18 exhibits a high correlation between the FE-computed and predicted values. Additionally, the prediction accuracy for the toe is higher than that for the welding center. This is because, as shown in the FE analysis results, the deviation is small and the pattern is constant.
Figure 19 and Figure 20 show the FE-calculated and predicted values of the residual stress with respect to the position (z) of the residual stress, the thickness (B) of the member, the yield stress (σY), and the constraint (Ks) for the welding center and the toe, respectively. In Figure 18 and Figure 19, the X- and Y-axes denote σTR/σY and z/B, respectively. The values in parentheses denote the position, the thickness, the yield stress (σY), and the degree of constraint (Ks). The residual stress values obtained using the predictive model and thermal elastic–plastic analysis agree well. It is noteworthy that the residual stress at a 25 mm thickness shows a different trend from those for 50 and 70 mm thicknesses. Thus, the prediction model expresses all the different residual stress characteristics well.

4. Conclusions

To analyze the effect of restraint on welding residual stress and derive a predictive equation for residual stress according to restraint, thermal elastic–plastic analysis was performed for different thicknesses, yield stresses, and restraint degrees of the member, and regression analysis of the results was performed. A residual stress prediction equation was proposed. The reliability of the FE analysis results was verified by comparing them with the results obtained using the ISM. Thus, the following conclusions were drawn:
  • In this study, a 2D thermal elastic–plastic analysis that could minimize the analysis time was performed instead of a 3D thermal elastic–plastic analysis. The results of the 2D thermal elastic–plastic analysis were verified by comparing them with the results measured by the intrinsic strain diagram method and 3D thermal elastic–plastic analysis.
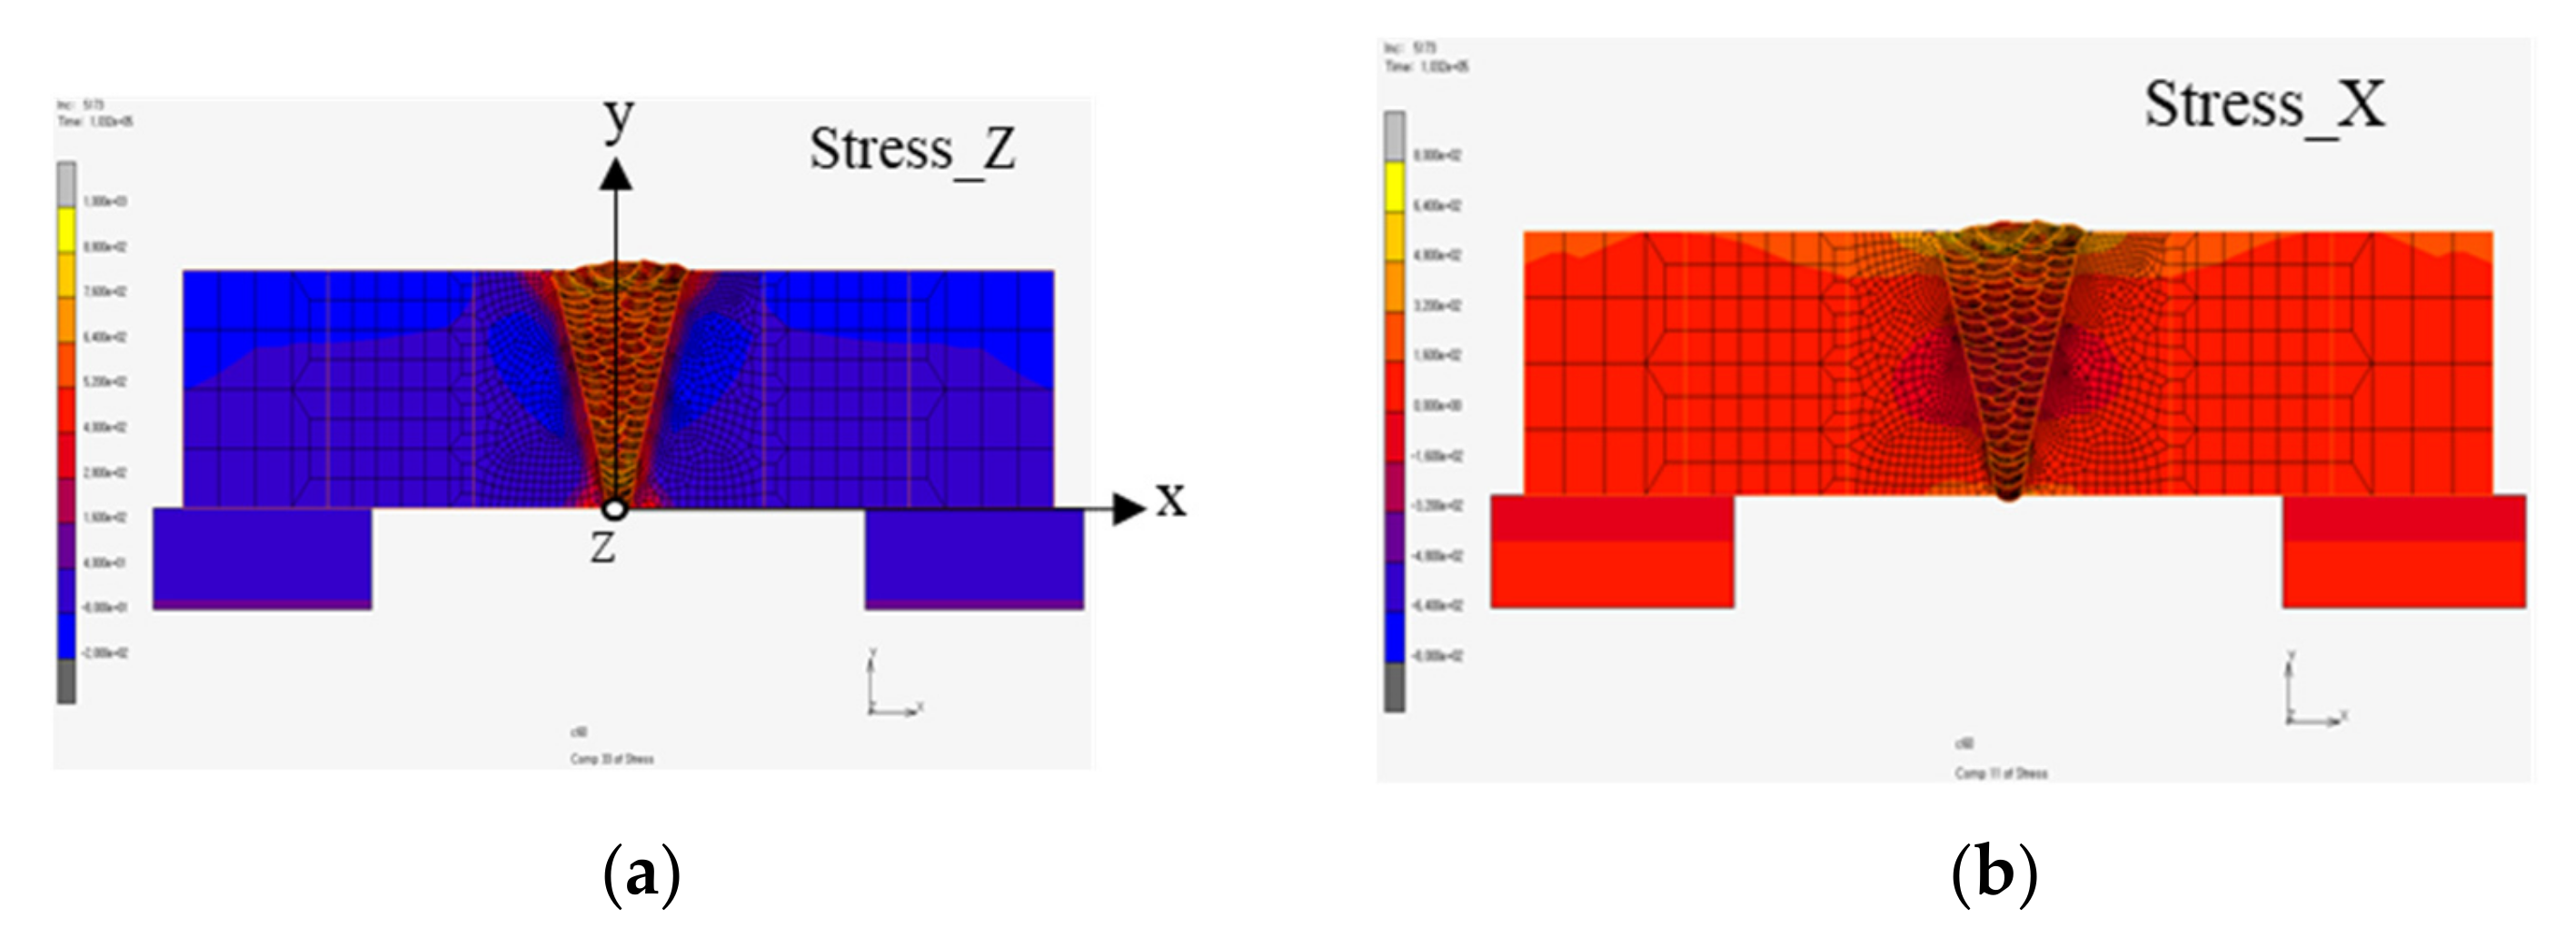
  • The transverse restraint did not affect the magnitude and distribution of the residual stress in the weld line direction. However, the restraint conditions affected the size and distribution of the residual stress in the direction perpendicular to the weld line.
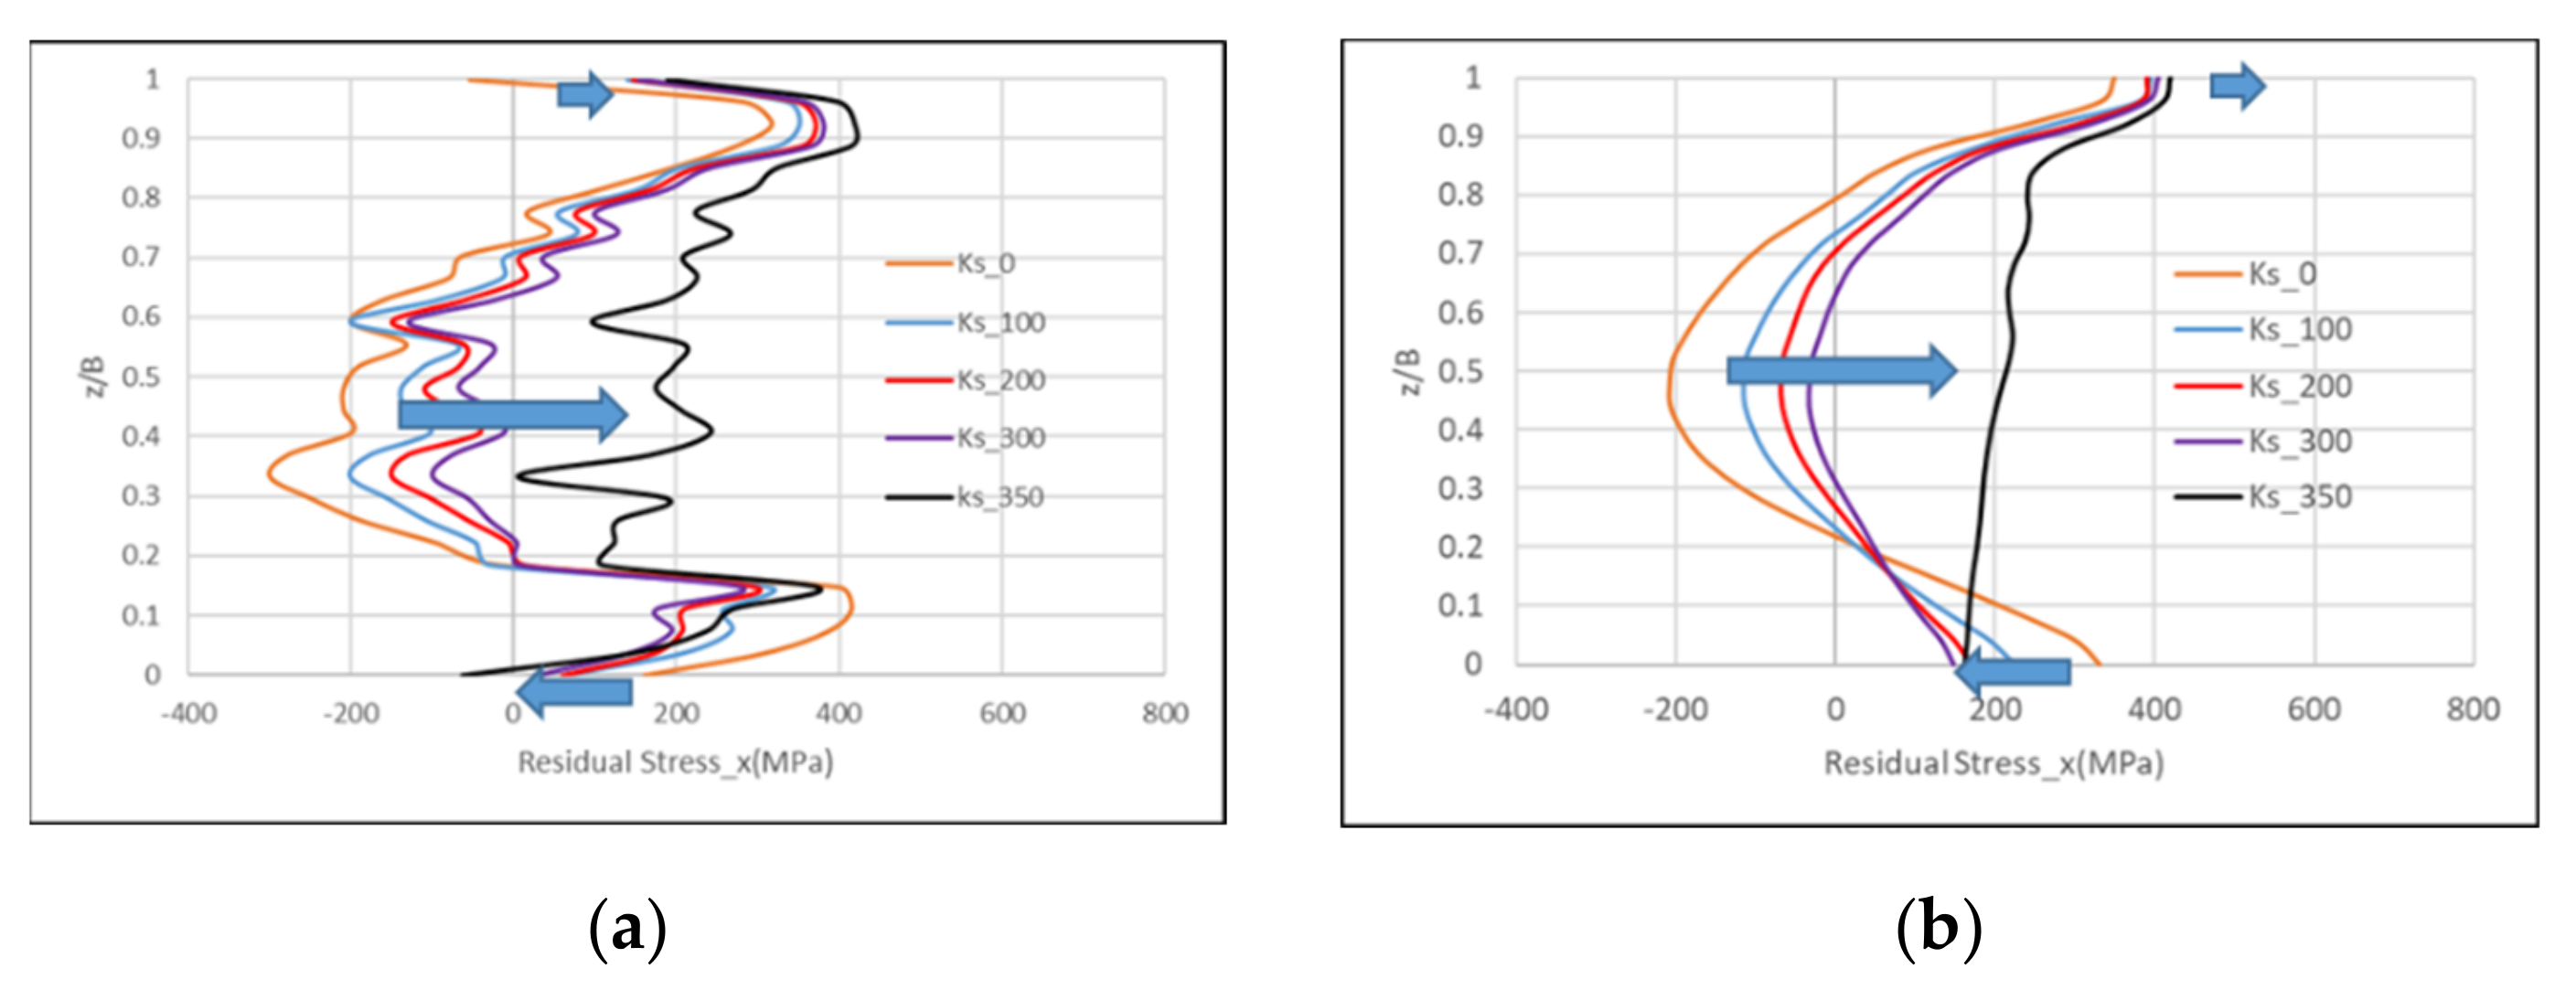
  • Owing to the transversal restraint, the residual stress in the direction perpendicular to the weld line moved from the tensile to the compression direction in the first layer of the weld and moved in the tensile direction in the middle and final layers of the weld owing to the restraint. The change in residual stress was the largest in the middle of the weld.
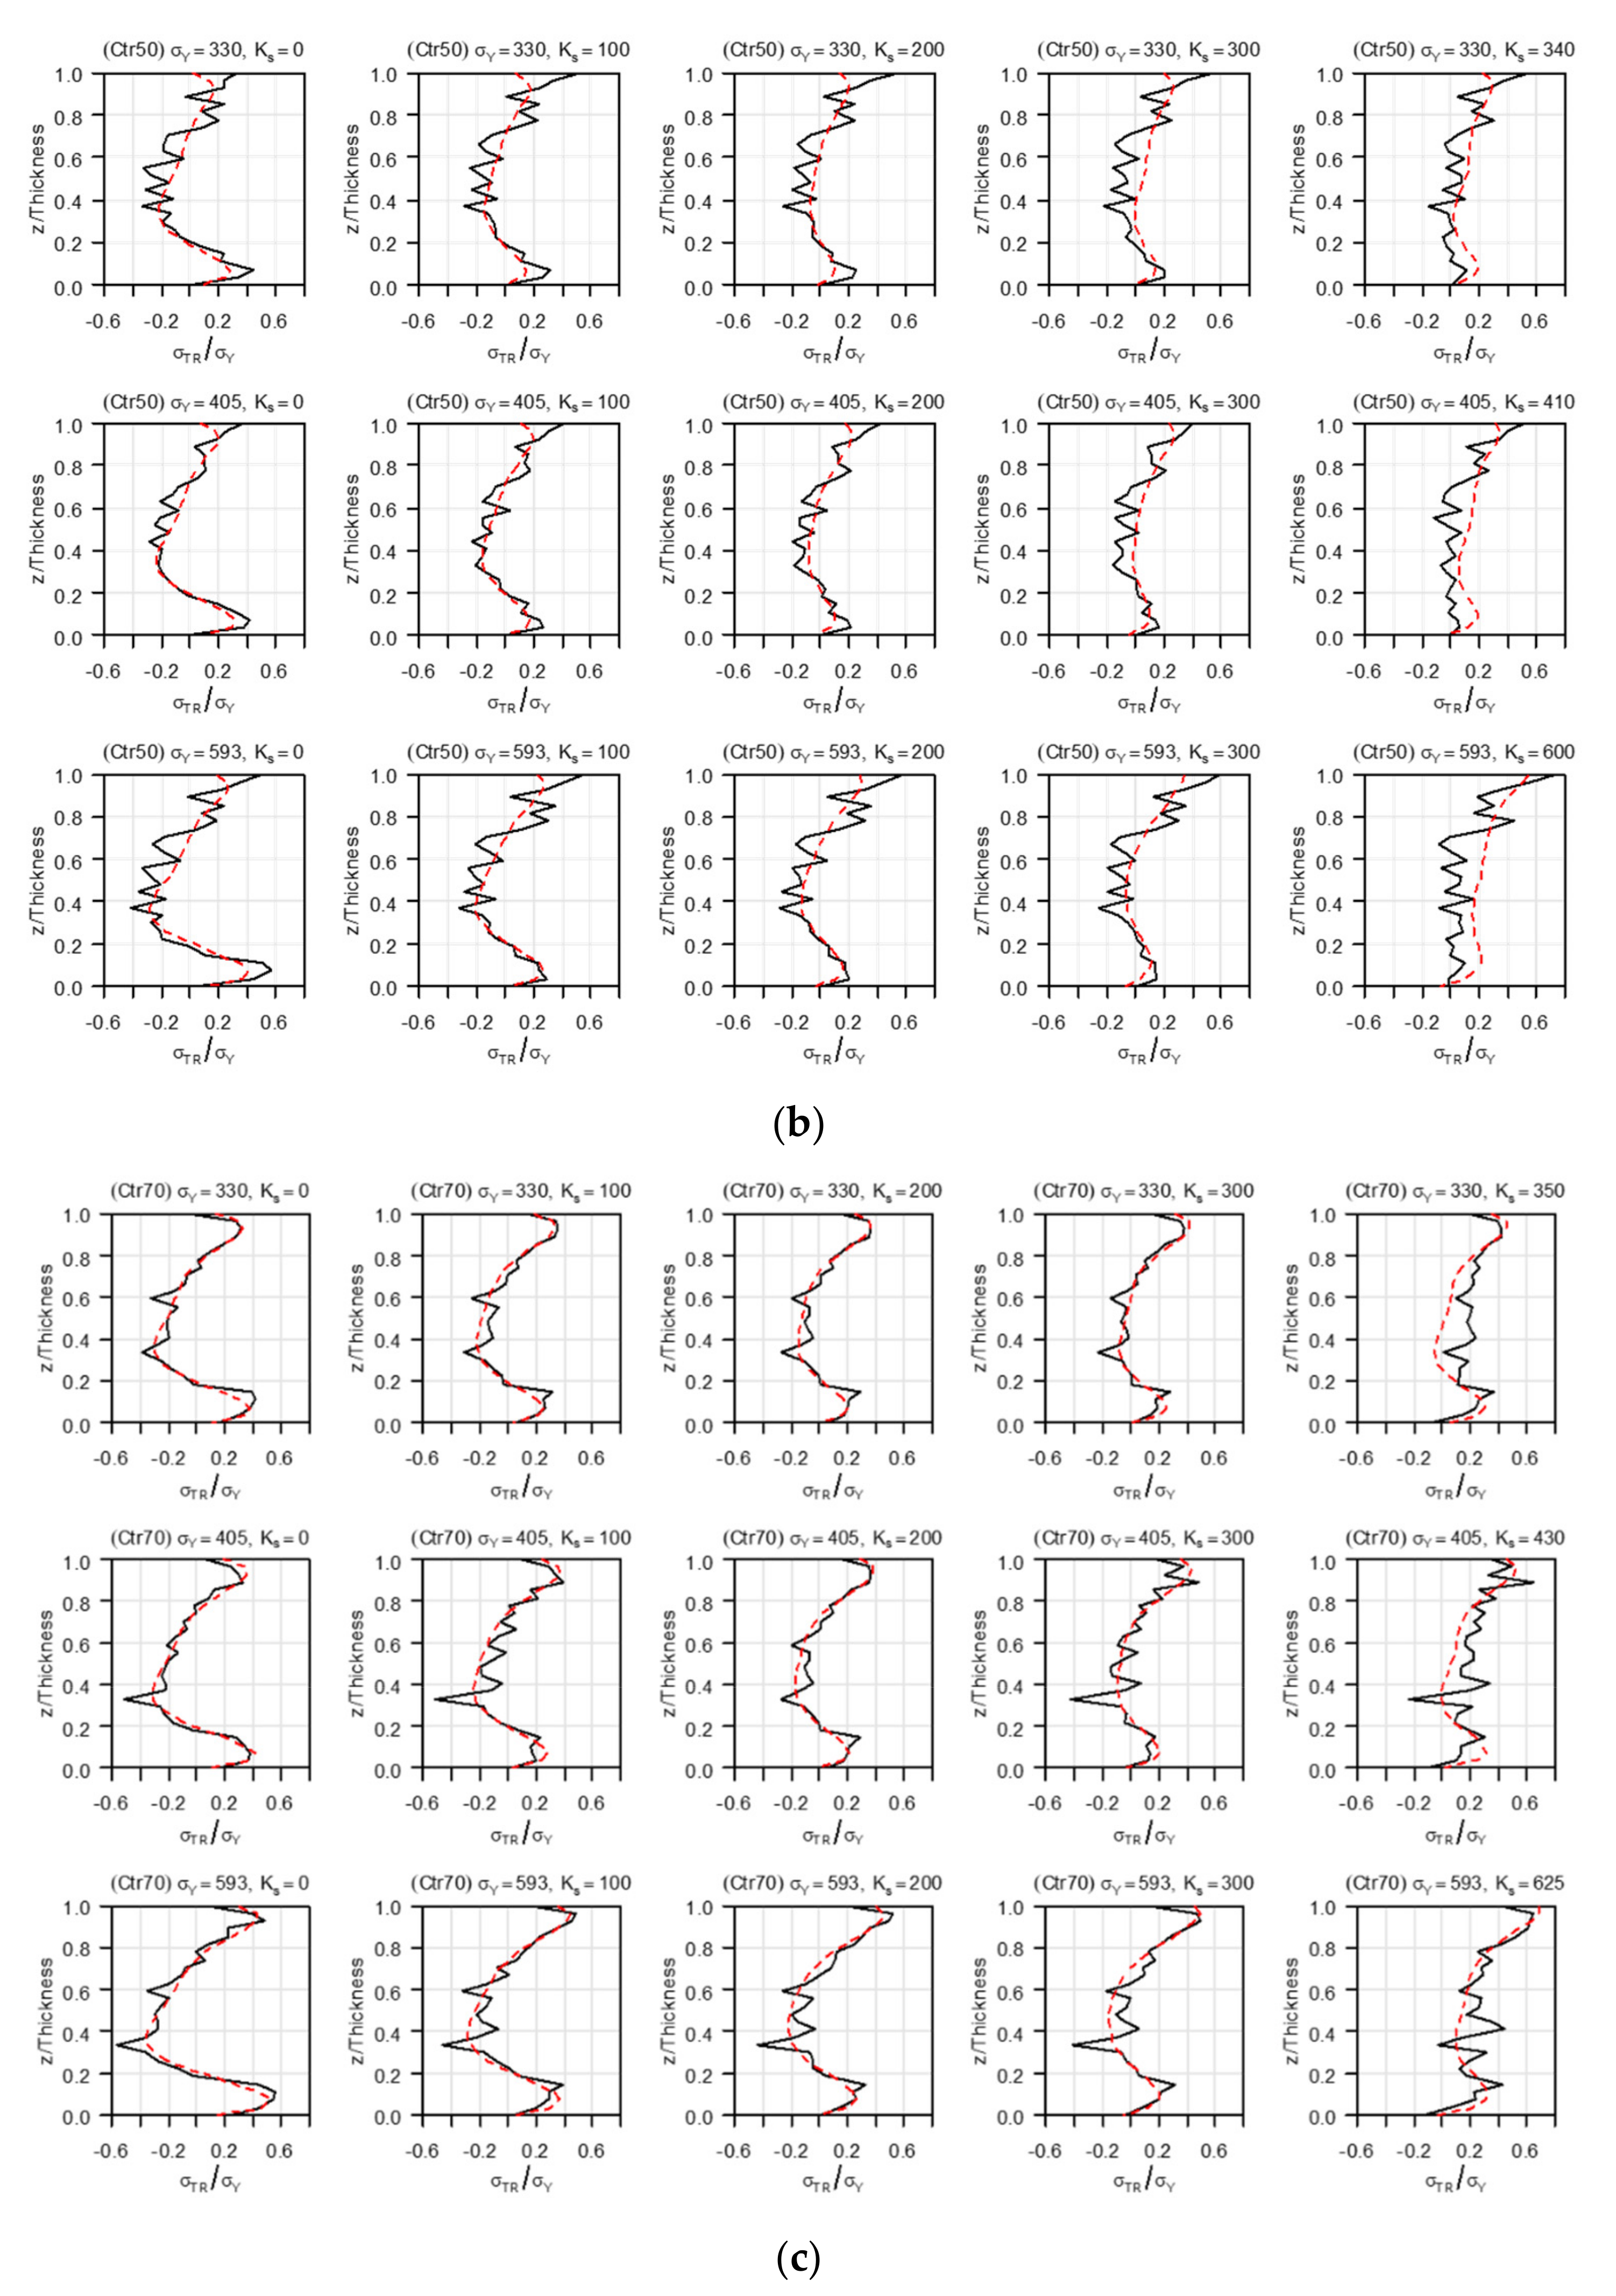
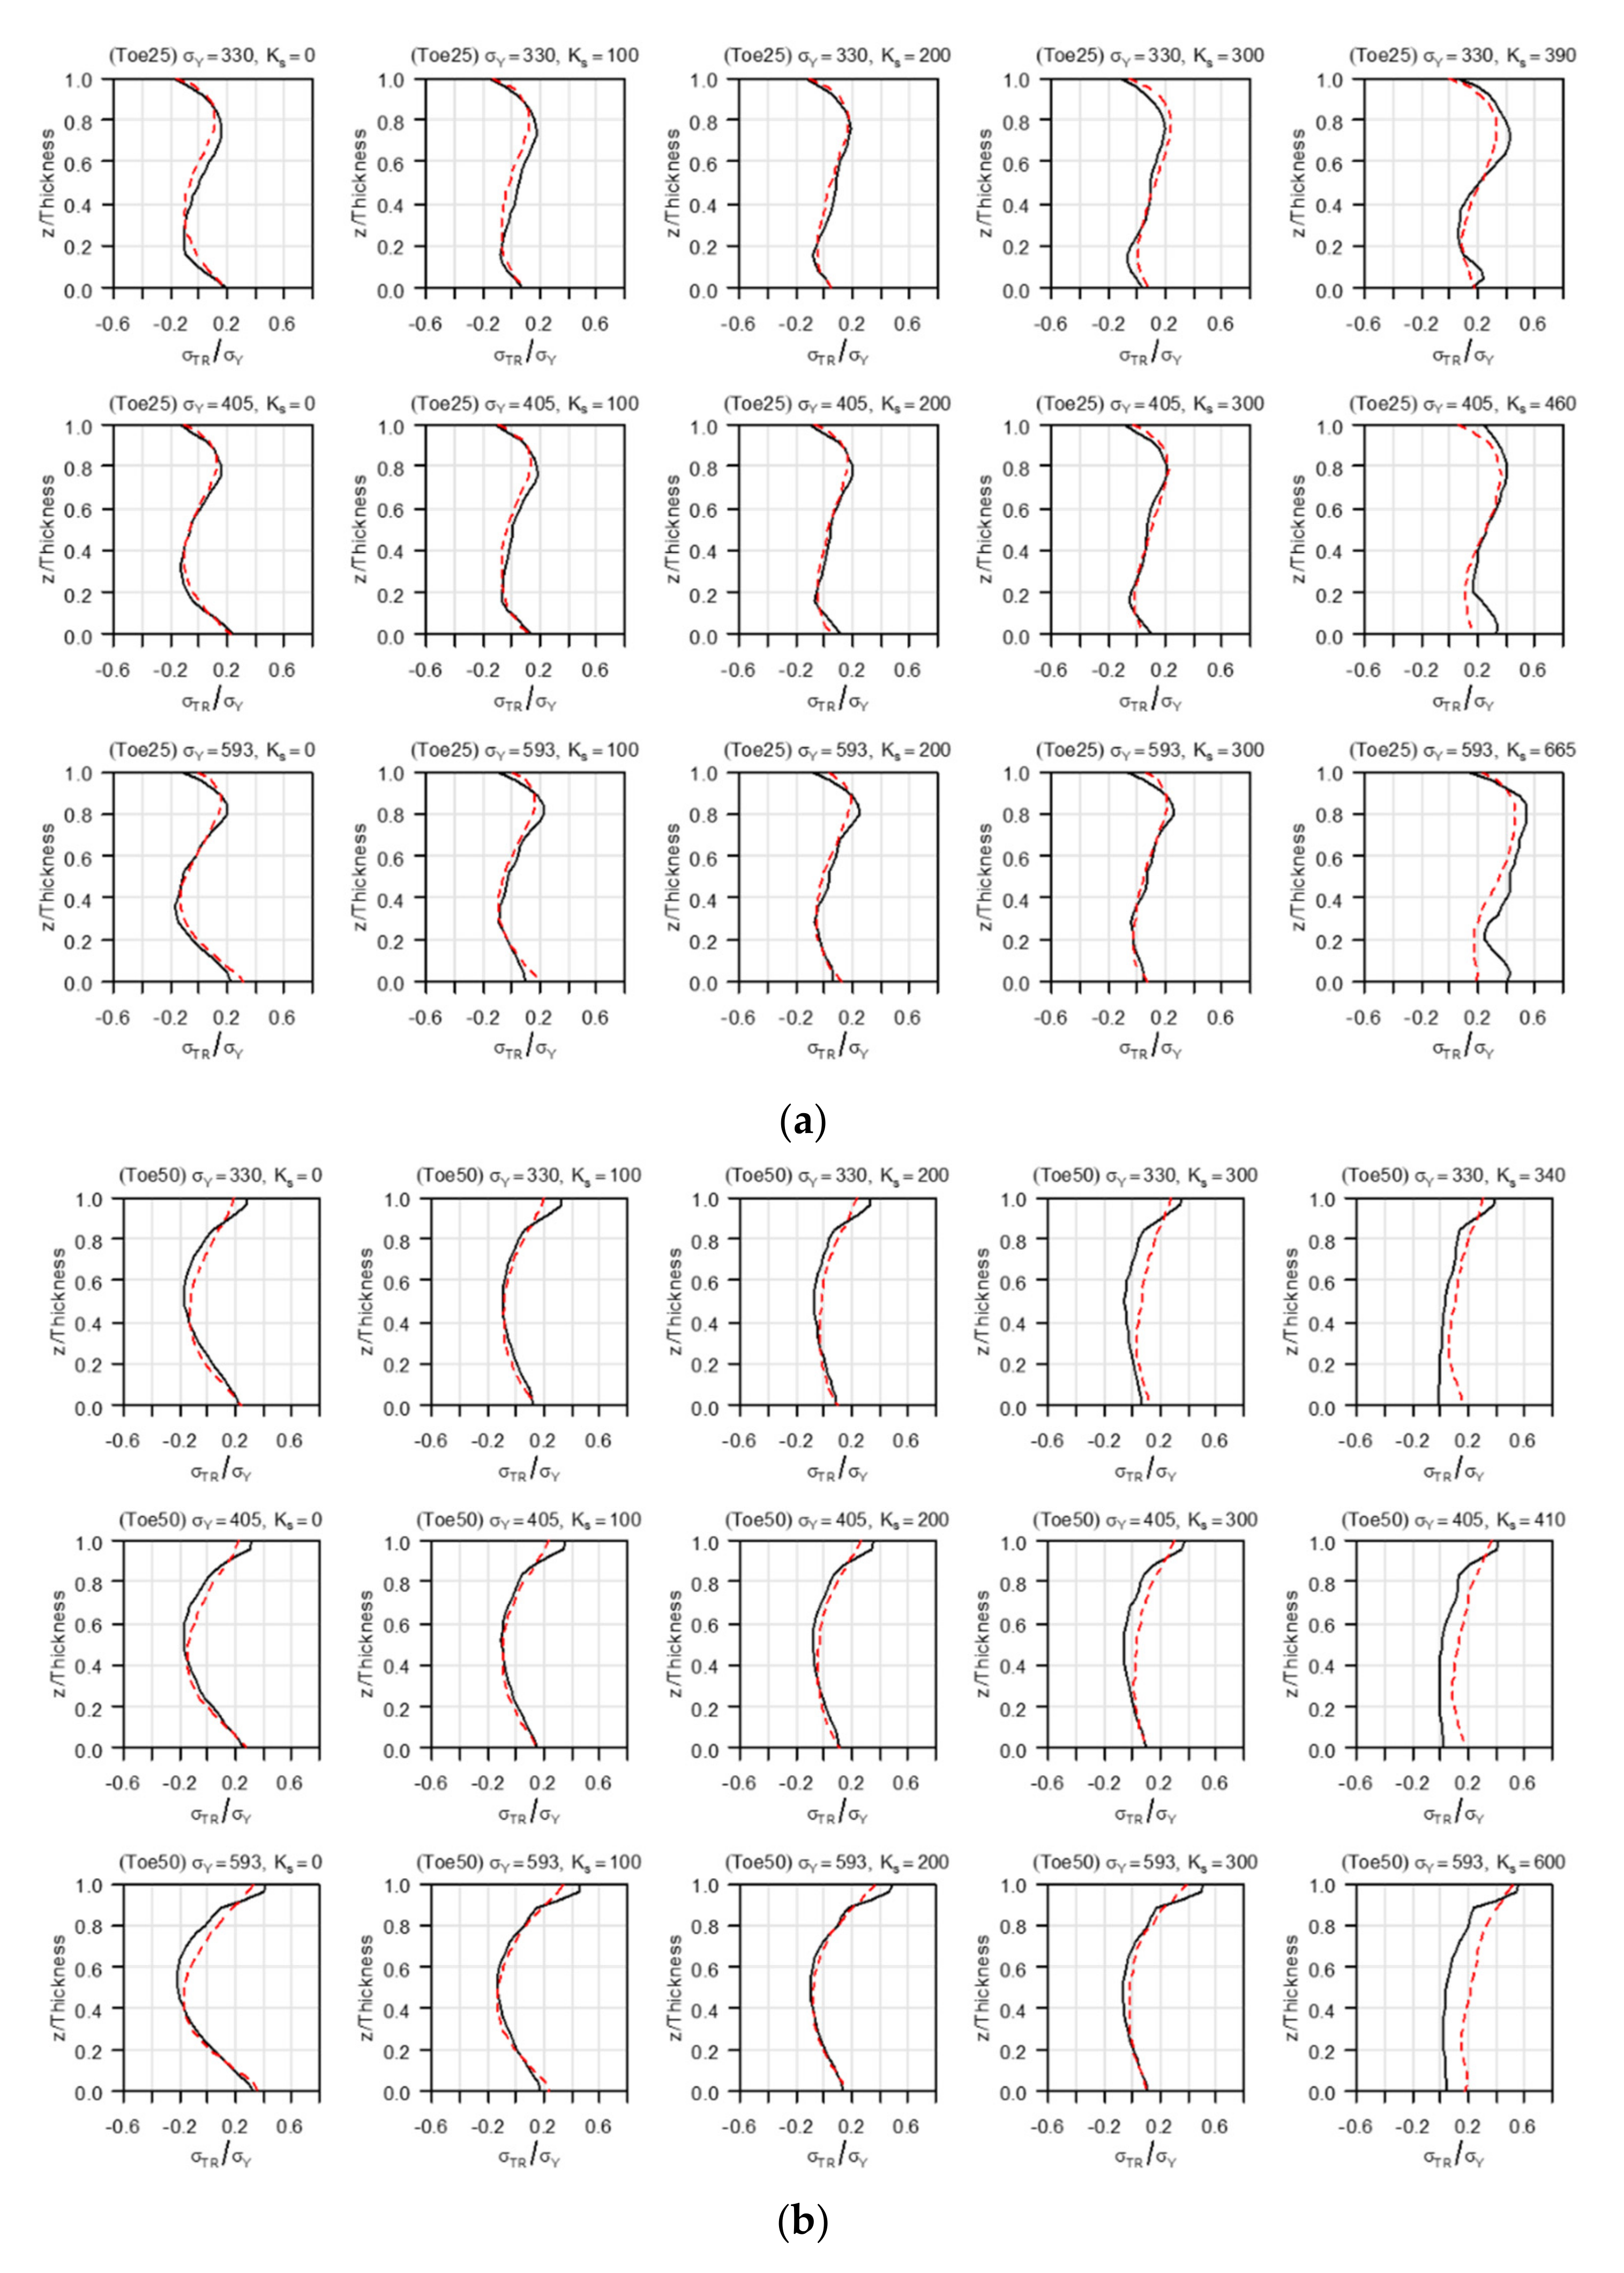
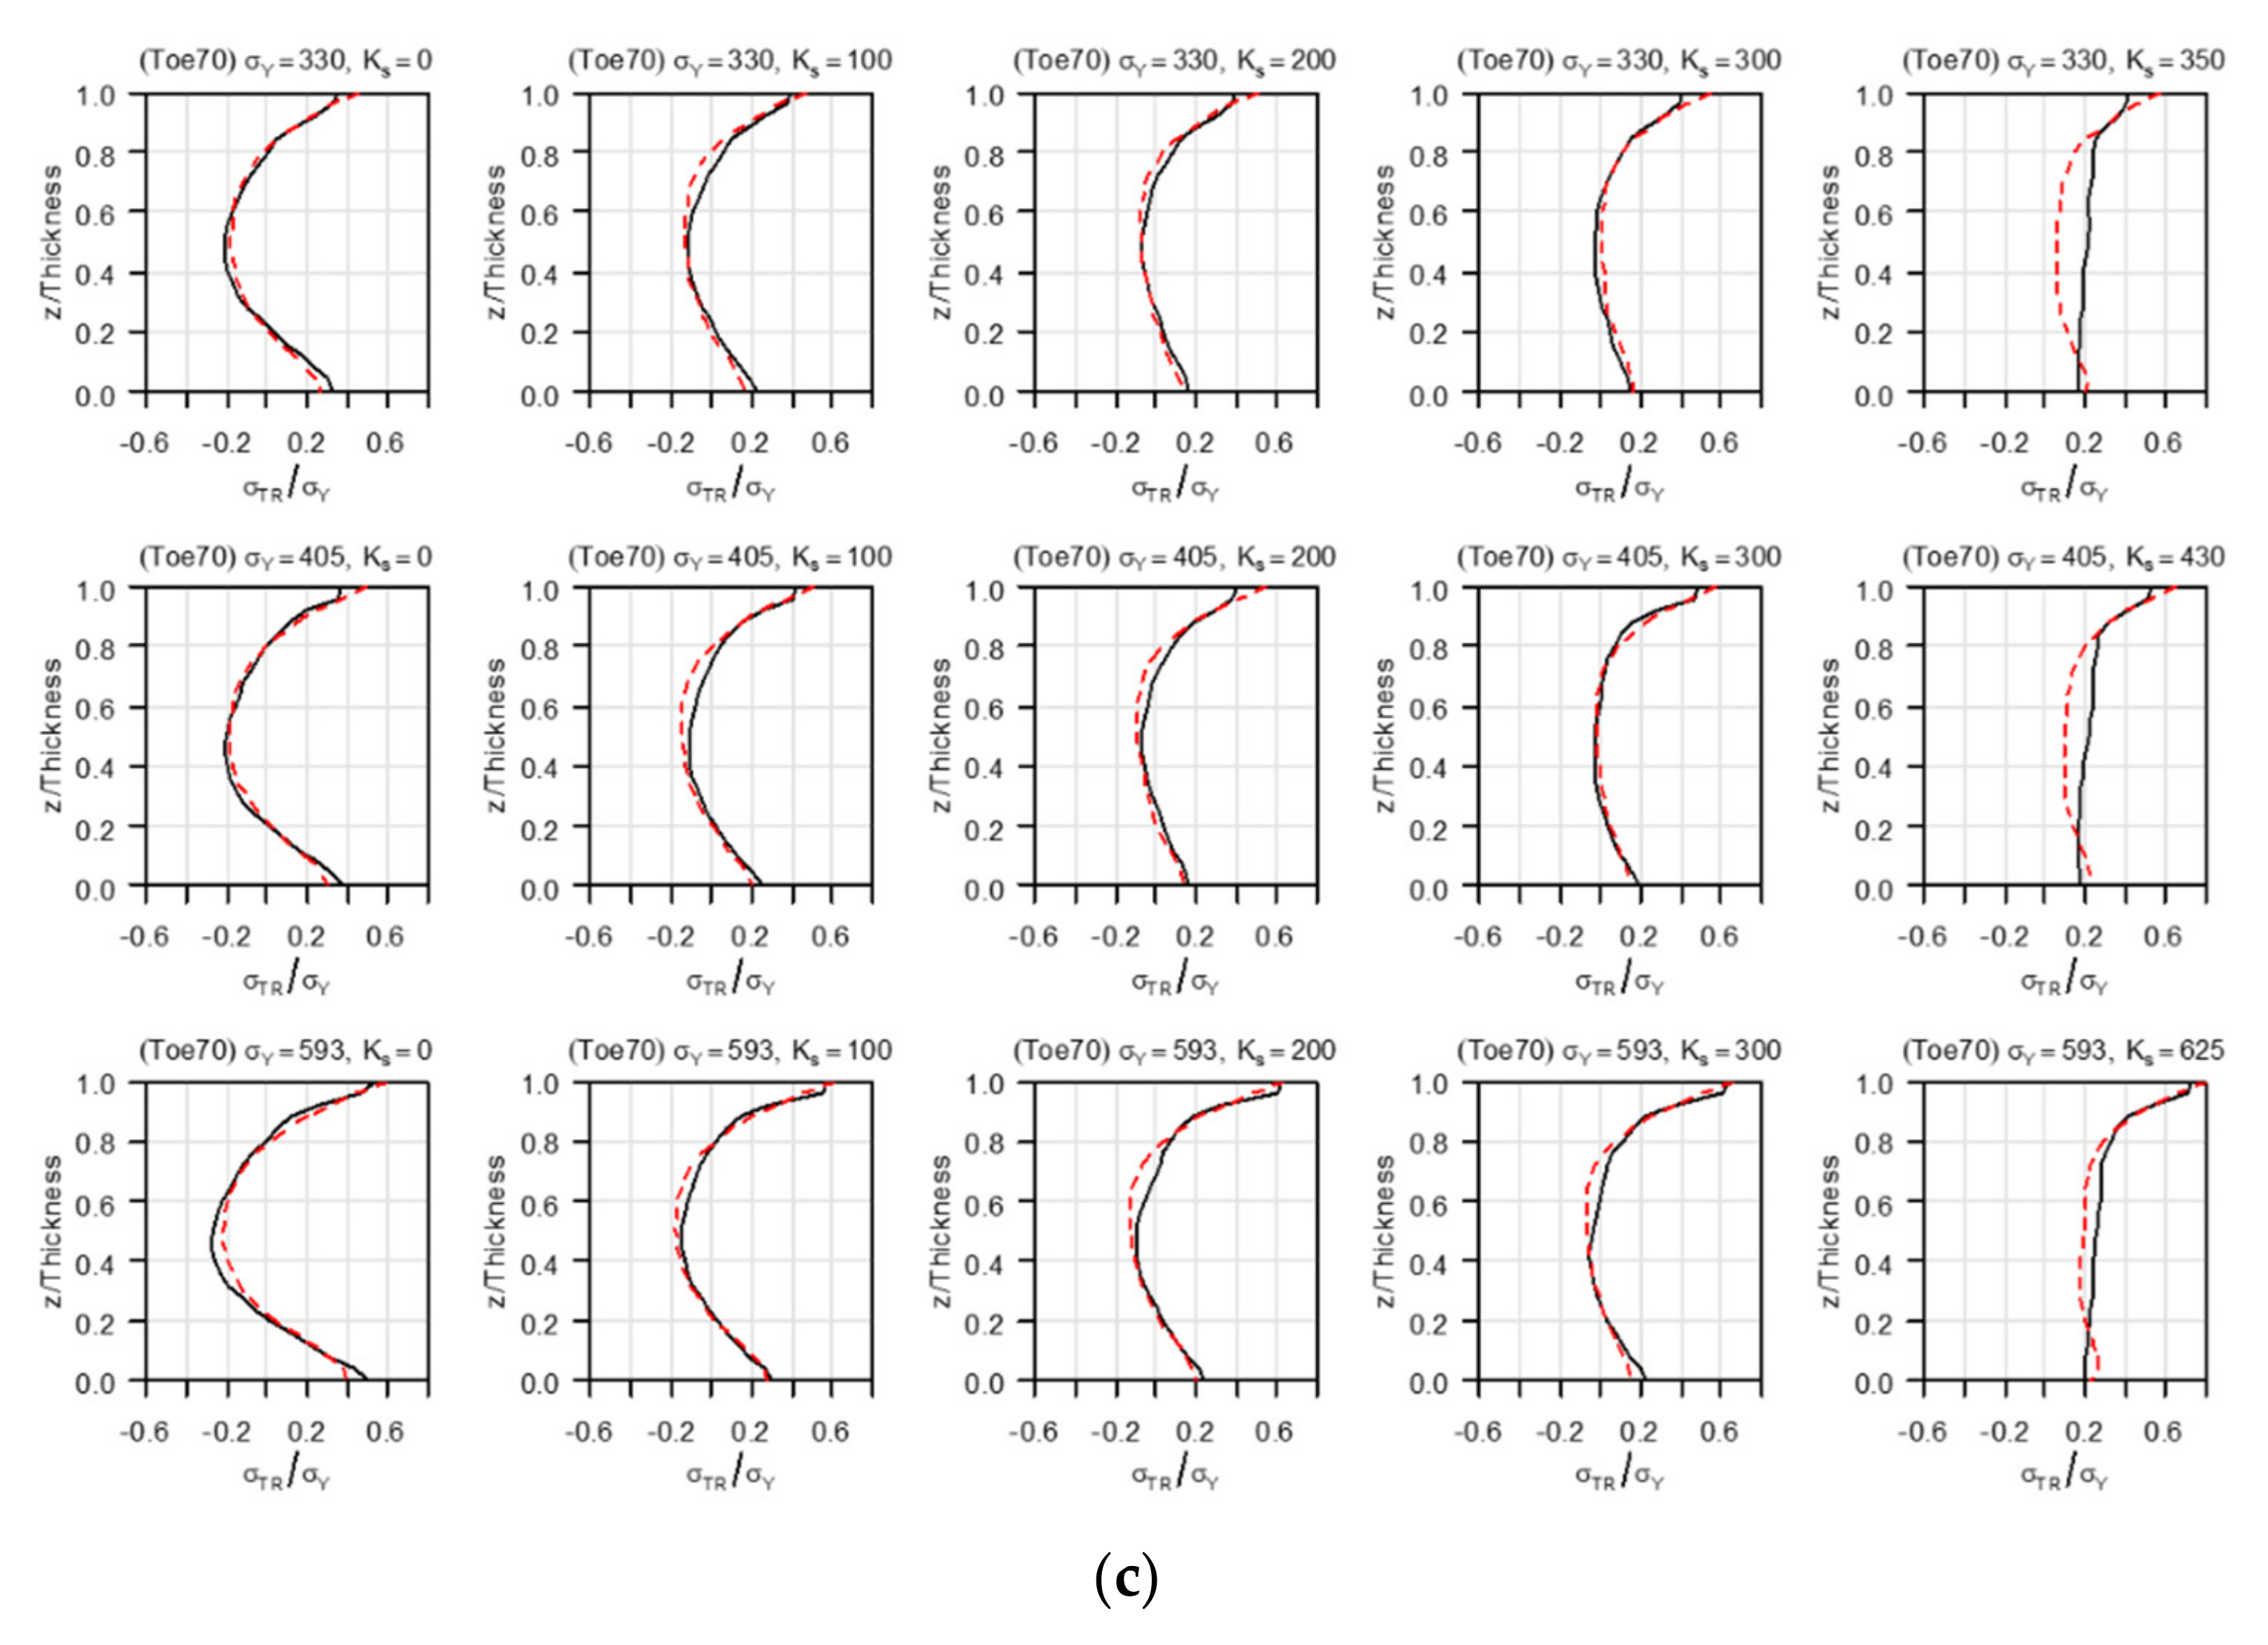
  • The magnitude of the yield stress of the member and the degree of restraint did not affect the overall shape of the residual stress distribution in the direction perpendicular to the weld line. Except for the final weld layer, most of the residual stress was less than half of the yield stress. However, under extreme constraint conditions (>300 MPa/mm), the residual stress exhibited an overall increase.
  • The residual stress prediction formula according to the restraint was derived through regression analysis to predict the residual stress in the thickness direction at the center of the weld and the weld toe. The reliability analysis of the prediction results yielded the RMSEs of 101.6 and 55.93 for the welding center and the toe, respectively, and R2 of 72.12 and 86.19%, respectively. Moreover, high correlation between the thermal elastic–plastic analysis value and the predicted value was confirmed.

Author Contributions

G.A. and J.P. jointly conceived and designed the experiment, performed the experiment, and conducted the data analysis. G.A. and J.P. analyzed the data, plotted the figures, and wrote this paper. N.M. and S.K. provided scientific guidance. All authors have read and agreed to the published version of the manuscript.

Funding

This study was funded by Chosun University (grant number 2020).

Data Availability Statement

Not applicable.

Acknowledgments

This study was supported by a research grant awarded by Chosun University (Gwangju, Korea) in 2020. I would like to thank Fumiyoshi Minami of Commission-X, Osaka University (Osaka, Japan); Pingsha Dong of University of Michigan (Michigan, USA); Igor Varfolomeev of Fraunhofer Institute for Mechanics of Materials (Freiburg, Germany); Jiangchao Wang of Huazhong University (Wuhan, China); Kazuki Ikushima and Masakazu Shibahara of Osaka Prefecture University (Osaka, Japan); and Sang-Beom Shin of Hyundai Heavy Industries Co., Ltd. (Ulsan, Korea), for helpful discussion and encouragement during the development of this work.

Conflicts of Interest

The authors declare no known conflict of interest.

References

  1. Masubuchi, K. Analysis of Welded Structures: Residual Stresses, Distortion, and Their Consequences; Elsevier: New York, NY, USA, 2013; Volume 33. [Google Scholar]
  2. Kihara, H.; Kusuda, T.; Iida, K.; Maeda, T.; Matsuoka, T. Effect of residual stresses on the behavior of brittle fracture propagation. J. Zosen Kiokai 1960, 108, 385–393. [Google Scholar] [CrossRef] [Green Version]
  3. An, G.B.; Woo, W.; Park, J.U.; Em, V. Comparison of crack-arrest fracture toughness between low and high heat-input thick weld specimens. Int. J. Fract. 2015, 194, 197–203. [Google Scholar] [CrossRef]
  4. Hadley, I.; Smith, S. Effects of Mechanical Loading on Residual Stress and Fracture: Part II—Validation of the BS 7910:2013 Rules. In Proceedings of the ASME 2014 Pressure Vessels and Piping Conference, Anaheim, CA, USA, 20–24 July 2014; Volume 1. Codes and Standards. [Google Scholar]
  5. Ueda, Y.; Yamakawa, T. Analysis of thermal elastic-plastic stress and strain during welding by finite element method. Jpn. Weld. Soc. Trans. 1971, 2, 90–100. [Google Scholar]
  6. Shibahara, M.; Ikushima, K. Development of analytical method for welding mechanics using idealized explicit FEM. Trans. JWRI 2010, 39, 384–386. [Google Scholar]
  7. Ueda, Y.; Kim, Y.C.; Yuan, M.G. A predicting method of welding residual stress using source of residual stress (report I): Characteristics of inherent strain (source of residual stress)(mechanics, strength & structural design). Trans. JWRI 1989, 18, 135–141. [Google Scholar]
  8. Luo, Y.; Murakawa, H.; Ueda, Y. Prediction of welding deformation and residual stress by elastic FEM based on inherent strain (report I): Mechanism of inherent strain production (mechanics, strength & structure design). Trans. JWRI 1997, 26, 49–57. [Google Scholar]
  9. Ma, N. An accelerated explicit method with a two-stage computation scheme for transient thermal stress and welding deformation. Trans. JWRI 2015, 44, 31–40. [Google Scholar]
  10. Dong, P.; Brust, F. Welding residual stresses and effects on fracture in pressure vessel and piping components: A millennium review and beyond. J. Press. Vessel. Technol. 2000, 122, 329–338. [Google Scholar] [CrossRef]
  11. Ha, Y.S.; Cho, S.H.; Jang, T.W. Development of welding distortion analysis method using residual strain as boundary condition. Mater. Sci. Forum 2008, 580–582, 649–654. [Google Scholar] [CrossRef]
  12. Mahmoudi, A.; Hossain, S.; Truman, C.E.; Smith, D.J.; Pavier, M.J. A new procedure to measure near yield residual stresses using the deep hole drilling technique. Exp. Mech. 2009, 49, 595–604. [Google Scholar] [CrossRef]
  13. Woo, W.; An, G.; Kingston, E.; De Wald, A.; Smith, D.; Hill, M.R. Through-thickness distributions of residual stresses in two extreme heat-input thick welds: A neutron diffraction, contour method and deep hole drilling study. Acta Mater. 2013, 61, 3564–3574. [Google Scholar] [CrossRef]
  14. Ueda, Y.; Yuan, M. Prediction of residual stresses in butt welded plates using inherent strains. J. Eng. Mater. Technol. 1993, 115, 417–423. [Google Scholar] [CrossRef]
  15. Park, J.-U.; An, G.; Woo, W.; Choi, J.-H.; Ma, N. Residual stress measurement in an extra thick multi-pass weld using initial stress integrated inherent strain method. Mar. Struct. 2014, 39, 424–437. [Google Scholar] [CrossRef]
  16. Dong, P.; Hong, J.K. Analysis of IIW X/XV RSDP Phase I Round-Robin Residual Stress Results. Weld World 2002, 46, 24–31. [Google Scholar] [CrossRef]
  17. Janosch, J.J. IIW “Round Robin” Protocol for 3-Dimensional Welding Residual Stress and Distortion Prediction, IIW Doc. X/XIII/XV-RSDP-75-03; International Institude of Welding’s Report; International Institude: Paris, France, 2003. [Google Scholar]
  18. BMI. Investigation of Weld Residual Stresses and Local Post-Weld Heat Treatment; PVRC: Hong Kong, 2002. [Google Scholar]
  19. Wiesner, C.; Maddox, S.; Xu, W.; Webster, G.; Burdekin, F.; Andrews, R.; Harrison, J. Engineering critical analyses to BS 7910—the UK guide on methods for assessing the acceptability of flaws in metallic structures. Int. J. Press. Vessel. Pip. 2000, 77, 883–893. [Google Scholar] [CrossRef]
  20. Watanabe, M.; Satoh, K. Research on Intensity of Restraint and Reaction Stress in Welded Joints. J. Zosen Kiokai 1961, 1961, 349–358. [Google Scholar] [CrossRef]
  21. Watanabe, M.; Takagi, O.; Satoh, K.; Aso, F. External constraint and shrinkage of butt-welded joints in the erection of assemblies on building way. J. Zosen Kiokai 1958, 1958, 191–200. [Google Scholar] [CrossRef]
  22. Park, J.U.; An, G.; Woo, W. The effect of initial stress induced during the steel manufacturing process on the welding residual stress in multi-pass butt welding. Int. J. Nav. Archit. Ocean Eng. 2018, 10, 129–140. [Google Scholar] [CrossRef]
  23. Park, J.; An, G.; Kim, S. The Effect of Welding-Pass Grouping on the Prediction Accuracy of Residual Stress in Multipass Butt Welding. Math. Probl. Eng. 2017, 2017, 7474020. [Google Scholar] [CrossRef]
  24. Satoh, K.; Ueda, Y.; Kihara, H. Recent trend of researches on restraint stresses and strains for weld cracking. Trans. JWRI 1972, 1, 53–68. [Google Scholar]
  25. Satoh, K. An analytical approach to the problem of restraint intensity in slit weld. Trans. JWRI 1972, 1, 69–76. [Google Scholar]
  26. Shin, S.-B.; Lee, D.-J.; Park, D.-H. A study on the evaluation of transverse residual stress at the multi-pass FCA butt weldment using FEA. J. Weld. Join. 2010, 28, 26–32. [Google Scholar] [CrossRef] [Green Version]
  27. Commission of design, analyses and structural strength of welded structures. Standardization for Temperature Distribution Prediction of the Arc Weld using FEA. Int. J. Korean Weld. Soc. 2005, 23, 497–503.
  28. Ikushima, K.; Shibahara, M. Large-scale non-linear analysis of residual stresses in multi-pass pipe welds by idealized explicit FEM. Weld. World 2015, 59, 839–850. [Google Scholar] [CrossRef]
  29. Goldak, J.; Chakravarti, A.; Bibby, M. A new finite element model for welding heat sources. Metall. Trans. B 1984, 15, 299–305. [Google Scholar] [CrossRef]
Figure 1. Macro section of thickness 70 mm.
Metals 12 00654 g001
Figure 2. Analysis model: (a) a 2D model and (b) a 3D model.
Metals 12 00654 g002
Figure 3. Material properties according to temperature: (a) physical properties and (b) mechanical properties.
Metals 12 00654 g003
Figure 4. Boundary conditions for 2D analysis.
Metals 12 00654 g004
Figure 5. Volumetric weld flux.
Metals 12 00654 g005
Figure 6. Initial stress by production manufacturing.
Metals 12 00654 g006
Figure 7. Comparison of residual stress obtained using analysis and experiment: (a) longitudinal stress and (b) transverse stress.
Metals 12 00654 g007aMetals 12 00654 g007b
Figure 8. Welding passes for each thickness: (a) 25 mm, (b) 50 mm, and (c) 70 mm.
Metals 12 00654 g008
Figure 9. Restraint analysis model for a thickness of 70 mm: (a) free, spring stiffness Ks = 0 MPa/mm and (b) spring stiffness Ks = 100, 200, and 300 MPa/mm.
Metals 12 00654 g009
Figure 10. Analysis of restraint degree for the thickness of 70 mm: (a) forced displacement, 1 mm, and (b) stress distribution by forced displacement.
Metals 12 00654 g010
Figure 11. Temperature distributions for different thicknesses: (a) 25 mm, (b) 50 mm, and (c) 70 mm.
Metals 12 00654 g011
Figure 12. Welding residual stress at the restraint of 300 MPa/mm, a thickness of 70 mm, and a yield stress of 330 MPa: (a) welding direction stress and (b) width direction stress.
Metals 12 00654 g012
Figure 13. Welding residual stress in the welding direction at the thickness of 70 mm and a yield stress of 330 MPa: (a) welding center and (b) welding toe.
Metals 12 00654 g013
Figure 14. Welding residual stress in the width direction at the thickness of 70 mm and a yield stress of 330 MPa: (a) welding center and (b) welding toe.
Metals 12 00654 g014
Figure 15. Prediction position at the center and the toe parts of the weld: (a) welding center and (b) welding toe.
Metals 12 00654 g015
Figure 16. Ratio of Ks–n residual stress/yield stress according to the thickness at a yield stress of 330 MPa: (a) thickness of 25 mm; (b) thickness of 50 mm; and (c) thickness of 70 mm.
Metals 12 00654 g016
Figure 17. Comparison between the predicted value of the mean residual stress σ M R and that calculated by thermal elastic–plastic analysis: (a) The predicted (X-axis) and calculated (Y-axis) σ M R for the welding center and (b) the predicted (X-axis) and calculated (Y-axis) σ M R for the welding toe.
Metals 12 00654 g017
Figure 18. Comparison between the predicted value of the mean residual stress σ M R and that calculated by thermal elastoplastic analysis: (a) The predicted (X-axis) and calculated (Y-axis) σ M R for the welding center and (b) the predicted (X-axis) and calculated (Y-axis) σ M R for the welding toe.
Metals 12 00654 g018
Figure 19. Comparison of analysis and prediction results at the welding center (black solid line: analysis results; red dotted line: prediction results). (a) B = 25 mm; (b) B = 50 mm; and (c) B = 70 mm.
Metals 12 00654 g019aMetals 12 00654 g019b
Figure 20. Comparison of analysis and prediction results at the welding toe (black solid line: analysis results; red dotted line: prediction results). (a) B = 25 mm; (b) B = 50 mm; and (c) B = 70 mm.
Metals 12 00654 g020aMetals 12 00654 g020b
Table 1. Mechanical properties at 70 mm thickness.
ItemsBase MaterialsWelding Consumables
EH40 TMCPSF-36E
Yield strength (MPa)500570
Tensile strength (MPa)604610
Young’s modulus (GPa)206206
Elongation (%)2129
Poisson’s ratio(0.28)(0.28)
Table 2. Welding conditions at 70 mm thickness.
Welding
Process
Heat InputConsumablesShield GasCurrentVoltageSpeedPass/Layer
FCAW15–17
kJ/cm
SF-36E (NSSW)100%
CO2
255 A32 V30 CPM60/21
Table 3. Constraint analysis conditions.
Thickness (mm)Yield Stress (MPa)Constraint Change (MPa/mm)
253300, 100, 200, 300, 390
4050, 100, 200, 300, 460
5900, 100, 200, 300, 665
503300, 100, 200, 300, 340
4050, 100, 200, 300, 410
5900, 100, 200, 300, 600
703300, 100, 200, 300, 350
4050, 100, 200, 300, 430
5900, 100, 200, 300, 625
Total number of analysis cases: 45
Table 4. Welding conditions for thicknesses of 25 and 50 mm.
ThicknessWelding
Process
Heat InputConsumablesShield GasCurrentVoltageSpeedPass/Layer
25FCAW
( 1.4   mm )
15–17
kJ/cm
SF-36E (NSSW)100%
CO2
255 A32 V30 CPM13/9
5034/11
Table 5. Estimation results of σ M R prediction model and model performance measures.
PositionCenterToe
θ 1 −1.3675 (sd = 0.2370)−1.1396 (sd = 0.2168)
θ 2 2.2306 (sd = 0.2366)2.0167 (sd = 0.2170)
RMSE32.872836.8211
Predicted R 2 85.49%83.89%
Table 6. Estimated coefficients of the prediction model for σ T R   and performance measures (center).
c i j j Estimation Models
i 12345
022.080.07−0.871.380.90
1−4598.9512.97−31.5656.16147.73
235,584.71−117.31396.62−662.19−1570.34
3−109,133.50371.10−1527.092564.275836.57
4175,217.08−545.762640.39−4468.19−10,392.73
5−144,638.02381.81−2137.073626.758957.90
647,074.16−102.27660.05−1117.86−2974.11
RMSE101.6Predicted R 2 72.12%
Table 7. Estimated coefficients of the prediction model for σ T R   and performance measures (toe).
c i j j Estimation Models
i 12345
0−13.470.49−1.352.241.74
1−2876.101.77−1.898.7327.15
220,692.62−37.2174.52−149.30−270.15
3−62,617.81135.84−264.05536.06852.59
498,247.37−218.60386.07−822.92−1353.47
5−72,824.16167.78−261.56584.721012.13
618,725.59−49.5368.39−159.07−256.52
RMSE55.93Predicted R 2 86.19%
Publisher’s Note: MDPI stays neutral with regard to jurisdictional claims in published maps and institutional affiliations.

