Article

Effects of Process Parameters on the Relative Density and Properties of CuCrZr Alloy Produced by Selective Laser Melting

1
School of Materials Science and Engineering, North University of China, Taiyuan 030051, China
2
School of Mechanical Engineering, North University of China, Taiyuan 030051, China
3
State Key Laboratory of Mechanical Transmission, Chongqing University, Chongqing 400044, China
*
Authors to whom correspondence should be addressed.
These authors contributed equally to this work.
Metals 2022, 12(5), 701; https://doi.org/10.3390/met12050701
Submission received: 15 March 2022 / Revised: 14 April 2022 / Accepted: 14 April 2022 / Published: 19 April 2022
(This article belongs to the Special Issue 3D Printing of Metal)

Abstract

:
CuCrZr alloy has the advantages of good electrical conductivity, thermal conductivity, high hardness, crack resistance and high softening temperature. It is extensively used in important fields such as rail transit, aerospace, thermonuclear fusion and electronic information. Due to its high melting point, reflectivity, thermal conductivity, etc., it is more difficult to manufacture by selective laser melting (SLM). In this work, the effect of SLM process parameters on the characteristics of CuCrZr samples, such as relative density, hardness and tensile properties, has been investigated using orthogonal experiment method. The experimental results show that laser power is the main factor affecting the properties of the alloy. The tensile strength of the alloy increases with an increase in laser power; it first increases and then decreases with an increase in scanning speed. The optimal combination of process parameters in this paper is as follows: laser power is 240 W, scanning speed is 750 mm/s and scanning spacing is 0.07 mm. The relative density, ultimate tensile strength and hardness of the alloy fabricated by best SLM process parameters was 98.79%, 347 MPa, 133.9 HV, respectively.

1. Introduction

Copper and its alloys have excellent electrical conductivity, thermal conductivity and corrosion resistance. They are widely used in electrical, metallurgy, machinery manufacturing, aerospace, defence industry and other fields, where they are made into lead frames for integrated circuits, overhead contact lines for electrified railways, radiators, aviation thrust chambers, etc. [1,2,3]. Copper alloys are mostly prepared by traditional casting processes. However, it is difficult to fabricate parts with complex structures and internal runners, so that greatly limit the application of copper alloys. Three-dimensional printed copper alloy parts have good mechanical properties, excellent microstructure and surface quality that make them easier to polish. They are widely used in jewellery and cultural education and can also be used to manufacture micro radiators and aerospace engine combustion chamber components.
Selective laser melting (SLM) is an additive manufacturing process. According to the Computer Aided Design (CAD) 3D model, the laser melts the powder layer by layer along the path planned by the path planning software. Due to its high thermal conductivity and electrical conductivity, the laser powder bed melting of copper and copper alloys has become an increasingly popular topic. However, copper alloys have excellent thermal conductivity and higher reflectivity. This makes it difficult for lasers to continuously melt the powder, which leads to difficulties in melting copper alloys and controlling the quality of powder metallurgy. Concurrently, higher laser power will cause certain damage to the laser device. Huang et al. [4] prepared pure copper parts using SLM technology and studied the influence of the process on the microstructure evolution and mechanical properties of pure copper parts. Lodes et al. [5] used electron beam melting (EBM) technology to manufacture pure copper parts with a relative density of up to 99.5%. Tian et al. [6] fabricated Cu-13.5Al-4Ni-0.5Ti copper-based shape memory alloy using SLM technology. By optimising the parameters, an almost completely dense copper-based sample was obtained, and its phase and microstructure were characterised.
With the development of the electronics industry, the need for high-strength and high-thermal-conductivity copper alloys is increasing, and copper–chromium alloys are increasingly favoured as typical precipitation-strengthened copper alloys. CuCrZr has excellent mechanical properties and electrical conductivity, alongside thermal conductivity, so it has broad development and application prospects [7,8,9]. The study of CuCrZr alloys prepared using SLM technology has become a research hotspot. Ma [10] established a statistical model of the influence of processing parameters on relative density using the responding surface method and analysis of variance, obtained the optimal SLM process parameters of CuCrZr alloy and prepared nearly fully dense samples. The microstructure and mechanical properties of the sample were studied. Compared with deformed copper alloys, SLMed CuCrZr has a considerable tensile strength (~321 MPa), but its elongation at break (25%) is much higher than that of forged samples (15%). Sun et al. [11] used an ANSYS simulation to determine the approximate process range of the CuCrZr alloy produced by SLM. Then, the effects of laser power, scanning speed and hatching distance on the mechanical properties of CuCrZr alloy in the range of SLM process parameters were investigated by experiments. When the laser power was 460 W, the scanning speed was 700 mm/s and the hatching distance was 0.06 mm, the optimal performance of the alloy was obtained. The tensile strength was 153.5 MPa, the hardness was 119 HV, and the roughness was 31.384 μm. Guan et al. [12] studied the effect of heat treatment on CuCrZr alloy manufactured by SLM. As the ageing temperature increased, the strength of the alloy gradually decreased, and the electrical conductivity gradually increased. After ageing at 500 °C, the strength and electrical conductivity of the alloy reached 490 MPa and 73% IACS, respectively. Wallis et al. [13] studied CuCrZr samples fabricated using SLM and discussed the influence of heat treatment on the microstructure and properties of the samples. Compared with conventional heat treatment, direct age-hardening improved the mechanical properties, and clusters of Cr and CuxZry particles were detected in the sample. Hu et al. [14] studied the changes in the microstructure and mechanical properties of Cu-Cr-Zr alloys prepared by selective laser melting (SLM) with different scanning parameters. By optimising the scanning parameters, a CuCrZr specimen with a relatively high relative density ( 99.5   ±   0.3 % ) was obtained, with a strength of ( 280   ±   6 MPa) and a plasticity of ( 23.4   ±   0.4 % ). However, the mechanical properties of CuCrZr alloy prepared by SLM in these studies are lower than forging. Therefore, it is necessary to improve the mechanical properties and processing efficiency of SLMed CuCrZr alloy by adjusting laser power, scanning speed, hatching distance, scanning strategy, etc.
In the study, the CuCrZr alloy samples were fabricated through SLM to determine which of the process parameters were optimised by orthogonal experiments. The effects of scanning power, scanning speed and hatching distance on the properties of SLM CuCrZr alloy samples were analysed.

2. Materials and Methods

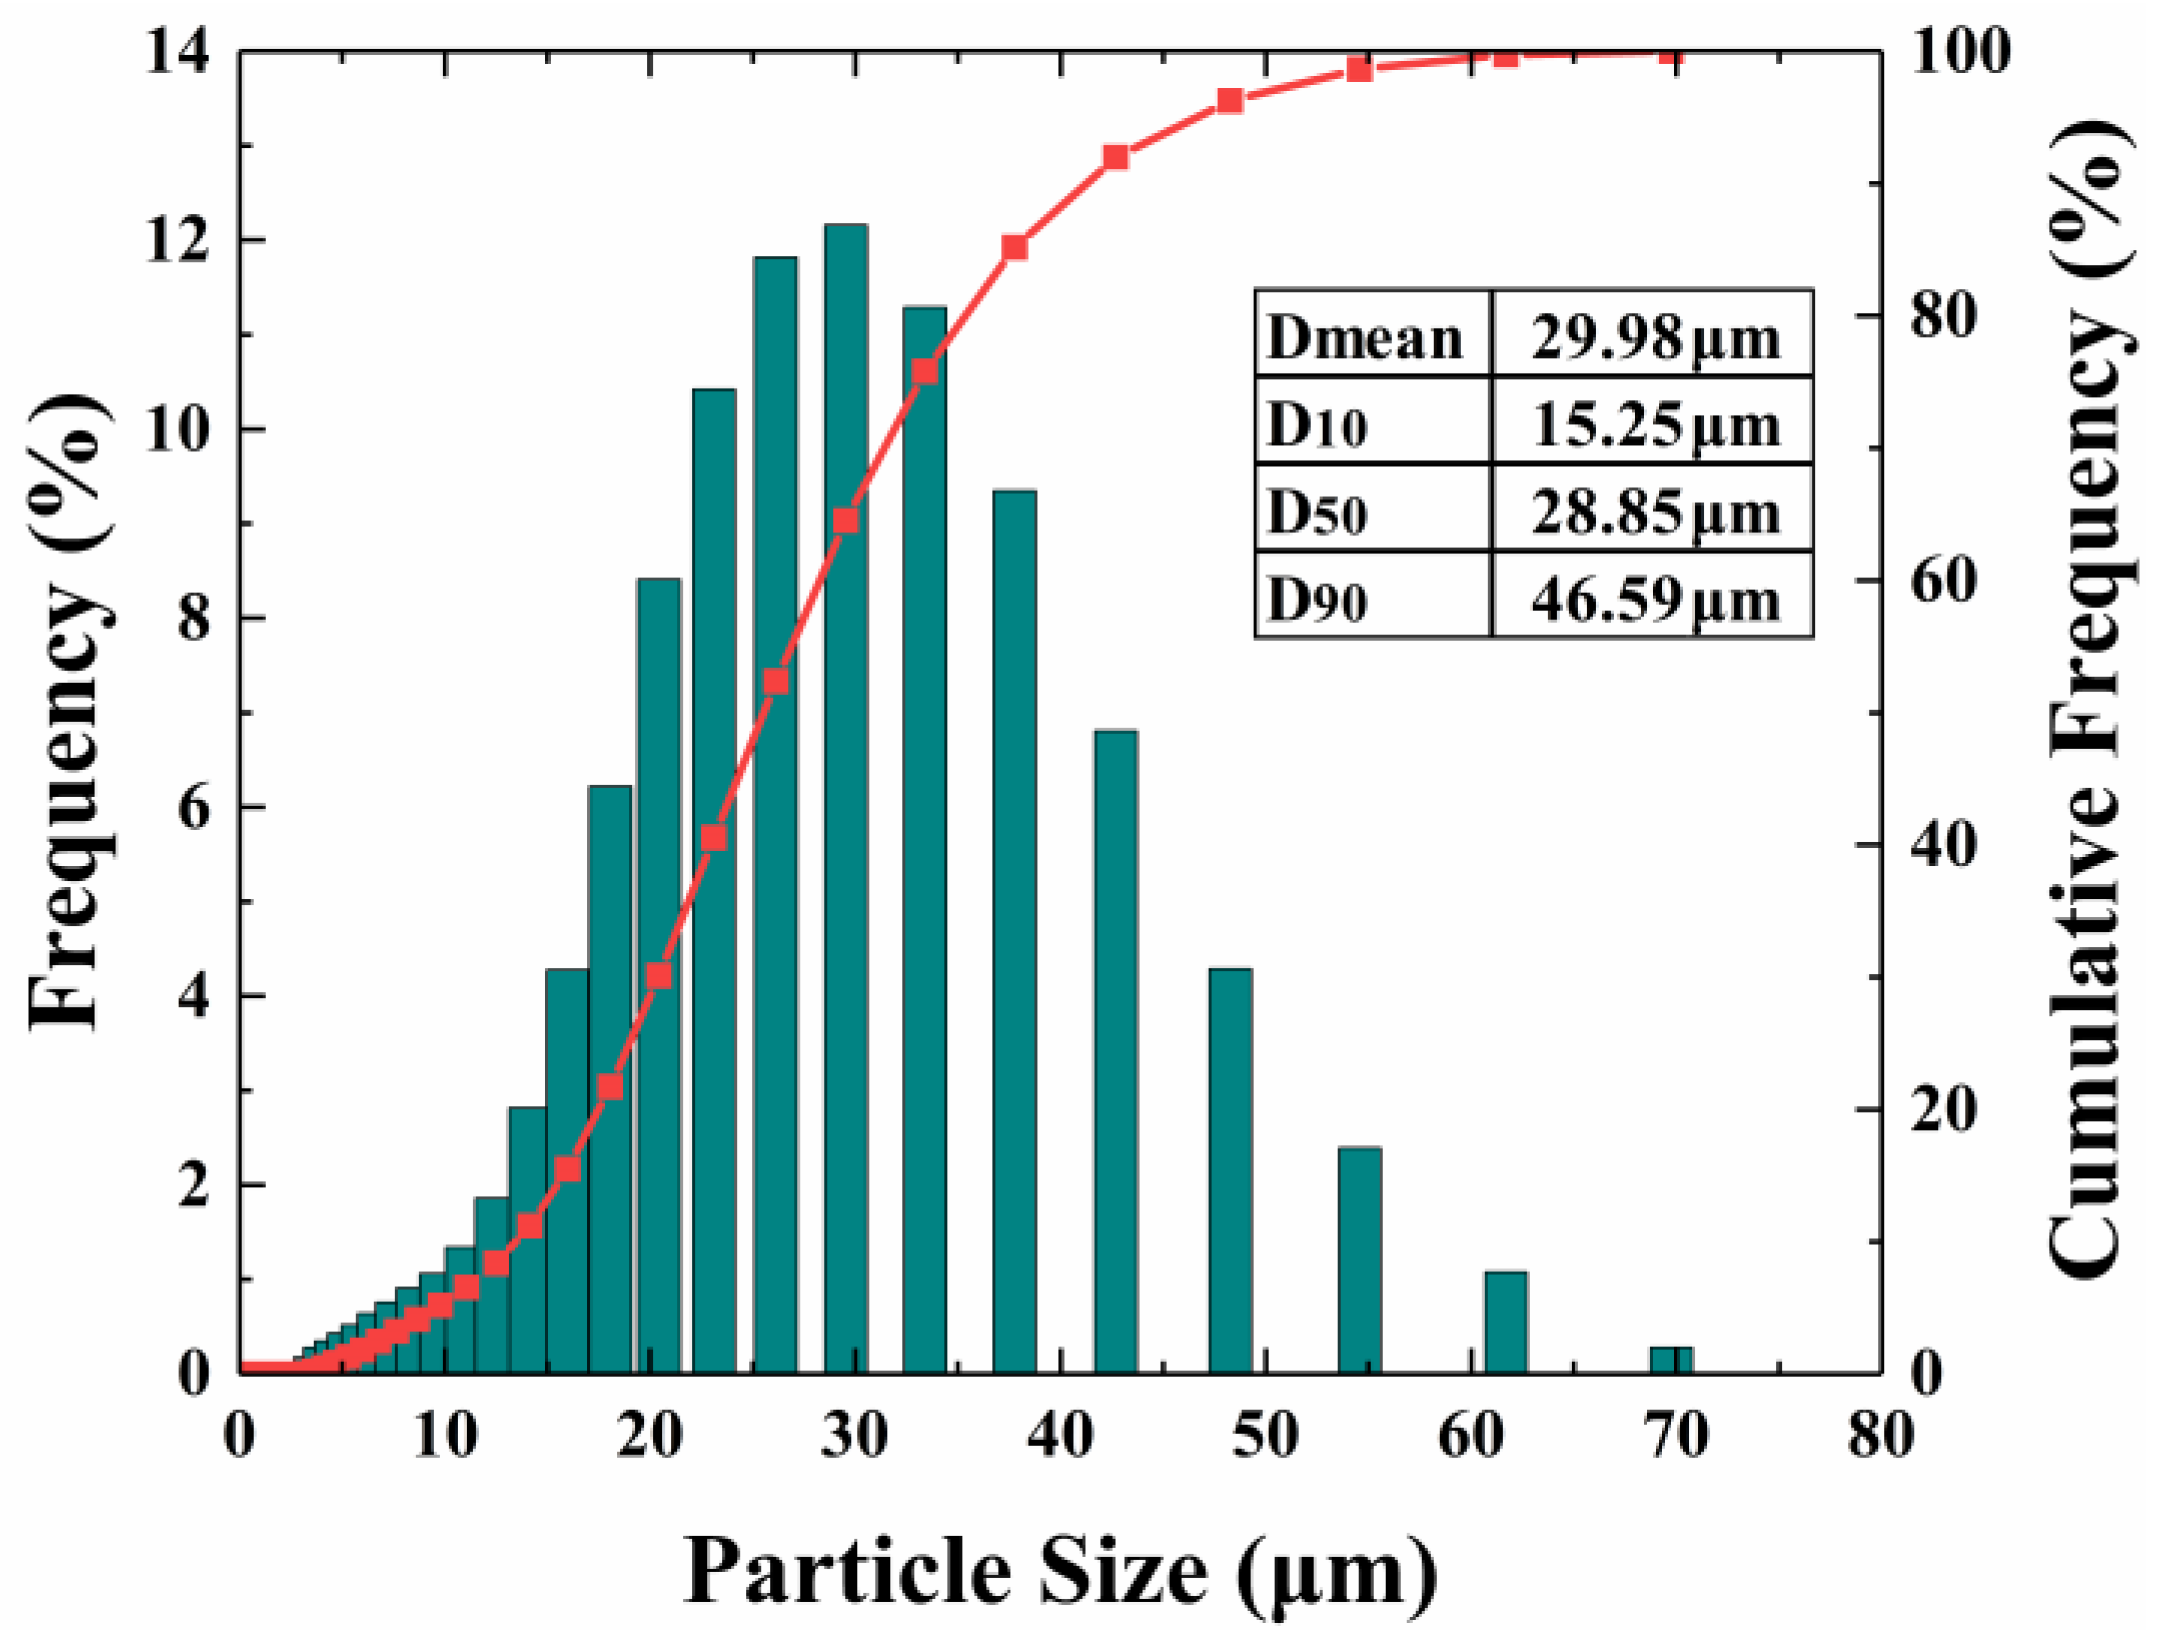
2.1. Experimental Materials and Equipment

The CuCrZr powder produced by gas atomisation was used in the SLM manufacturing process, and the chemical composition is shown in Table 1. The size distribution of CuCrZr powder was measured by Mastersizer (S3500, Microtrac, Osaka, Japan), its particle size distribution ranged from 15.25 µm (D10) to 46.59 µm (D90), with an average particle size of 29.98 µm, as shown in Figure 1. A SU5000 (Hitachi, Tokyo, Japan) SEM was used to characterise the microstructure of the CuCrZr powder and observe the fracture morphology of tensile parts. Figure 2 shows the microstructure of the CuCrZr powder. Most of the powder particles are spherical or nearly spherical, with a smooth surface and good fluidity that is beneficial to the flatness of the powder layer to ensure the formation of SLM. A small part of the powder particles presents irregular shapes, and the small powder particles are adsorbed around the large powder particles. EP-M150 (E-PLUS 3D, Beijing, China) equipment was used to process CuCrZr alloy samples. It is equipped with a 500 W Yb: YAG laser with a wavelength of 1064 nm and a spot size of 70 μm with a Gaussian distribution. To reduce the temperature gradient, the substrate preheating temperature was 100 °C, the powder layer thickness was 30 μm, and a scanning strategy of 67° rotation per layer was adopted. During the printing process, the oxygen content of the moulding chamber was less than 0.02% and protected by argon gas.

2.2. Experimental Design

Since there are many factors affecting the forming quality of SLM, it will be a heavy workload to carry out research in full factor mode. Therefore, this experiment adopts a 3-factor 4-level orthogonal test method [15]. The three factors selected in this paper are laser power, scanning speed and hatching distance, mainly because these three factors have great influence on forming quality when the same SLM equipment prepares parts. In order to avoid large workload and more reliable test results, Taguchi L16 was used to generate general results which have four levels for each factor. The process parameters used are shown in Table 2. In this experiment, an orthogonal test was used to prepare the CuCrZr sample with a size of 10 mm × 10 mm × 10 mm, as shown in Figure 3.

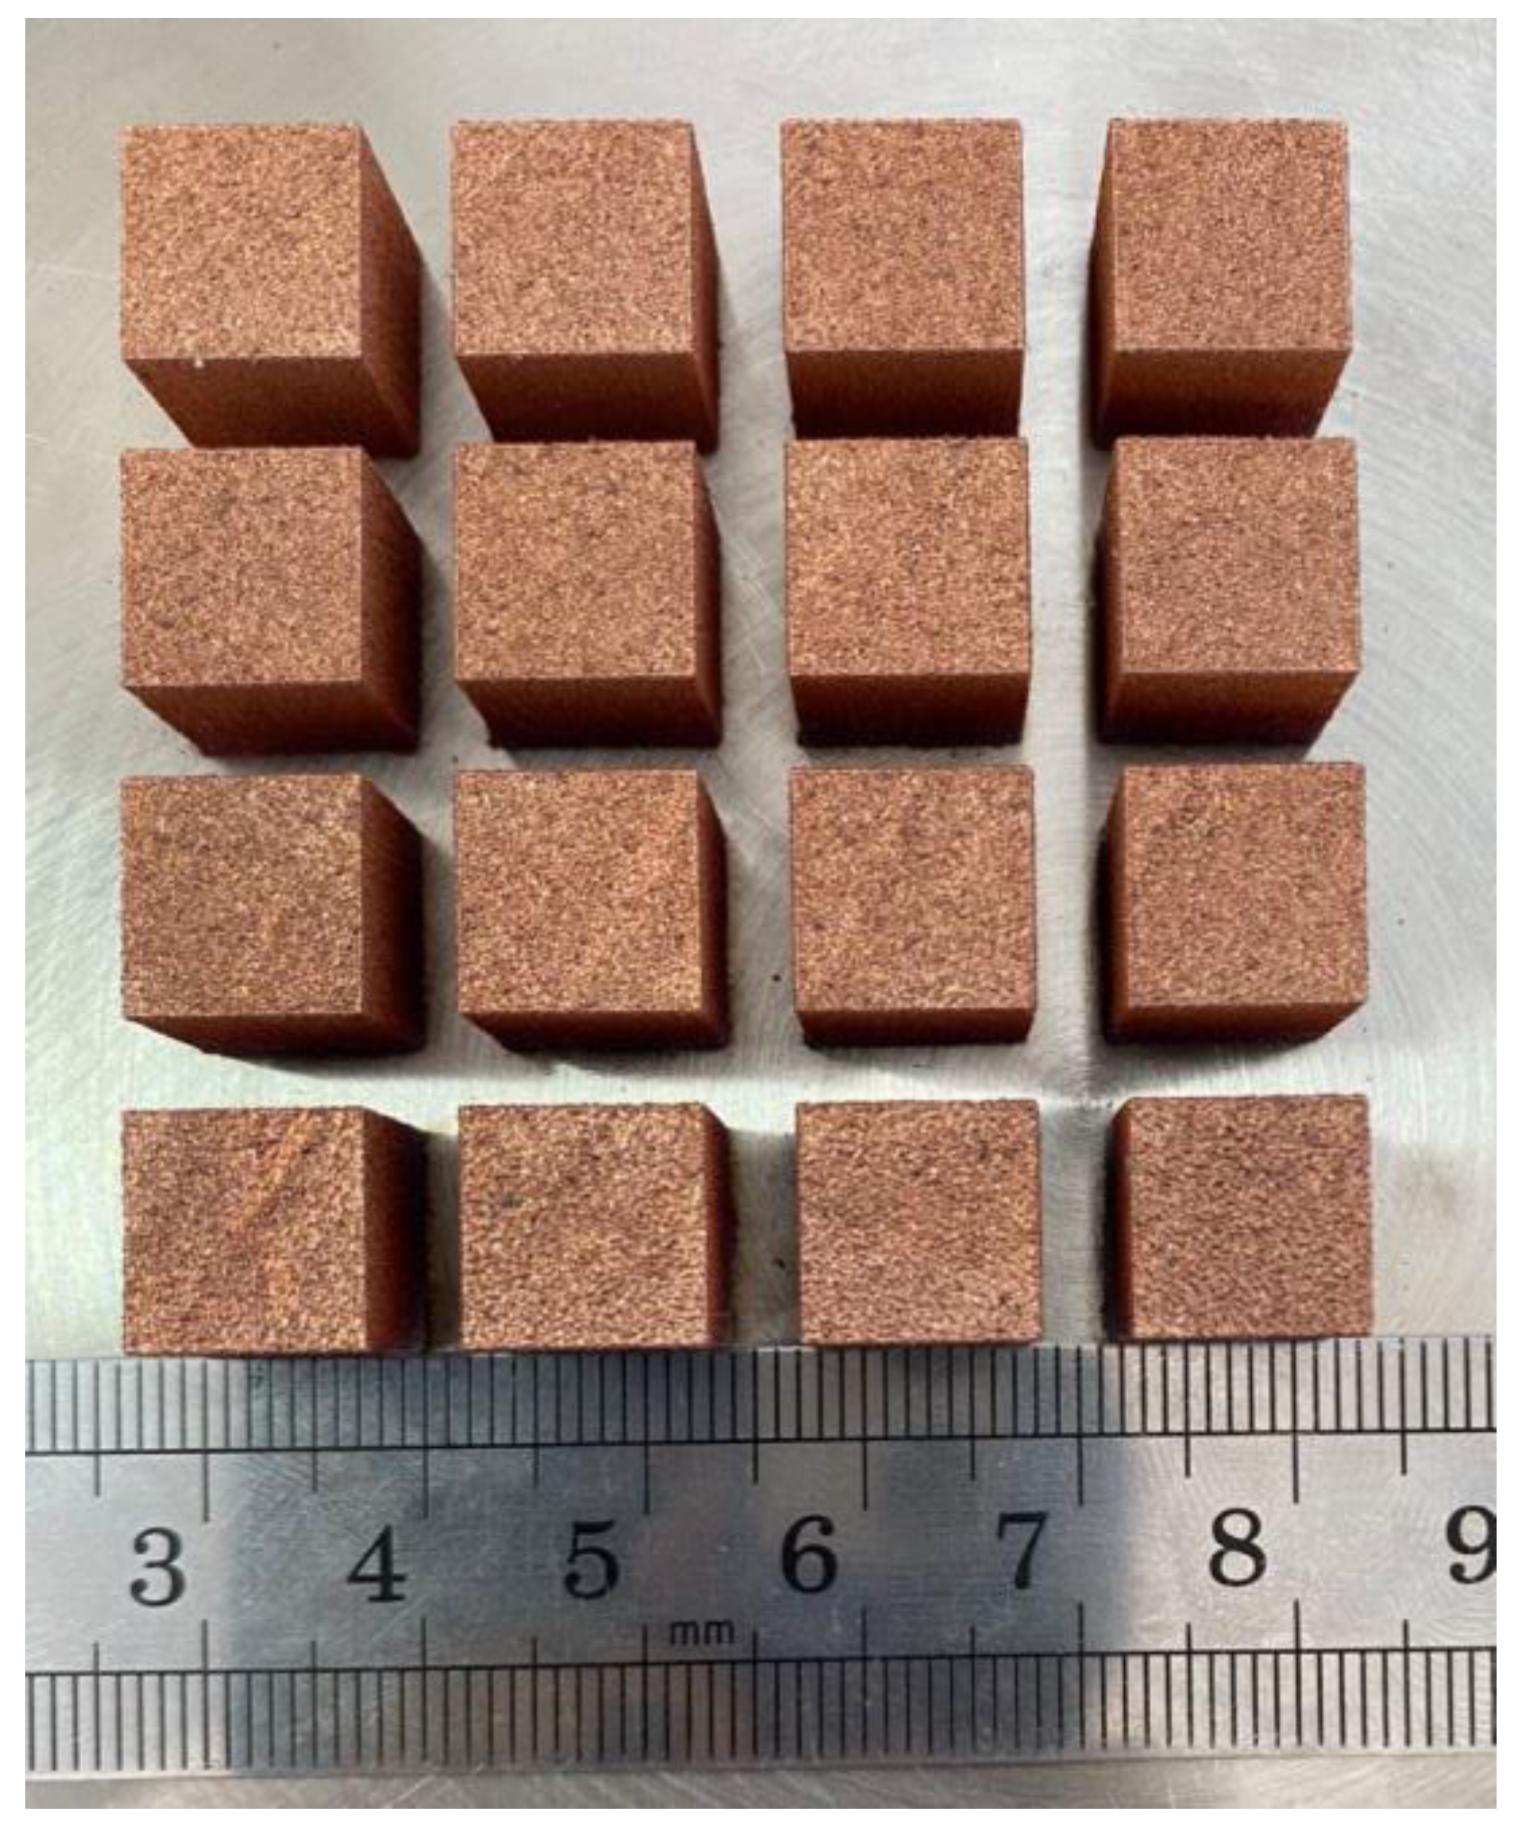
2.3. Experimental Feature

Completed samples were removed from the 304 stainless steel base plate via wire electrical discharge machining (Wire-EDM). The separated samples were polished with sandpaper until the surface was bright and without scratches. A Zeiss optical microscope (Axio Scope A1, Carl Zeiss AG, Oberkochen, Germany) was used to shoot the pores of the cross-section. Image J—an image-processing software (V 1.8.0, National Institutes of Health, Bethesda, MD, USA)—was used for relative density measurement. At least 20 pictures were measured for each sample, and the average value was taken. The Vickers hardness tester (JMHVS-1000AT, Shanghai Material testing Machine Factory, Shanghai, China) was used to test the Vickers hardness of the samples: we pressed it into the surface of the samples with a test force of 200 g and kept it there for 10 s. Then we measured 10 indentations for each sample and took the average value as the final result. The electronic universal testing machine (AG—X PLUS, Shimadzu Corporation, Kyoto, Japan) was used to complete the test of the tensile sample; the tensile speed was 1 mm/min, and the stress–strain data were collected before the sample was broken. The same kinds of tensile specimens were tested three times, and the results were averaged.

3. Results and Discuss

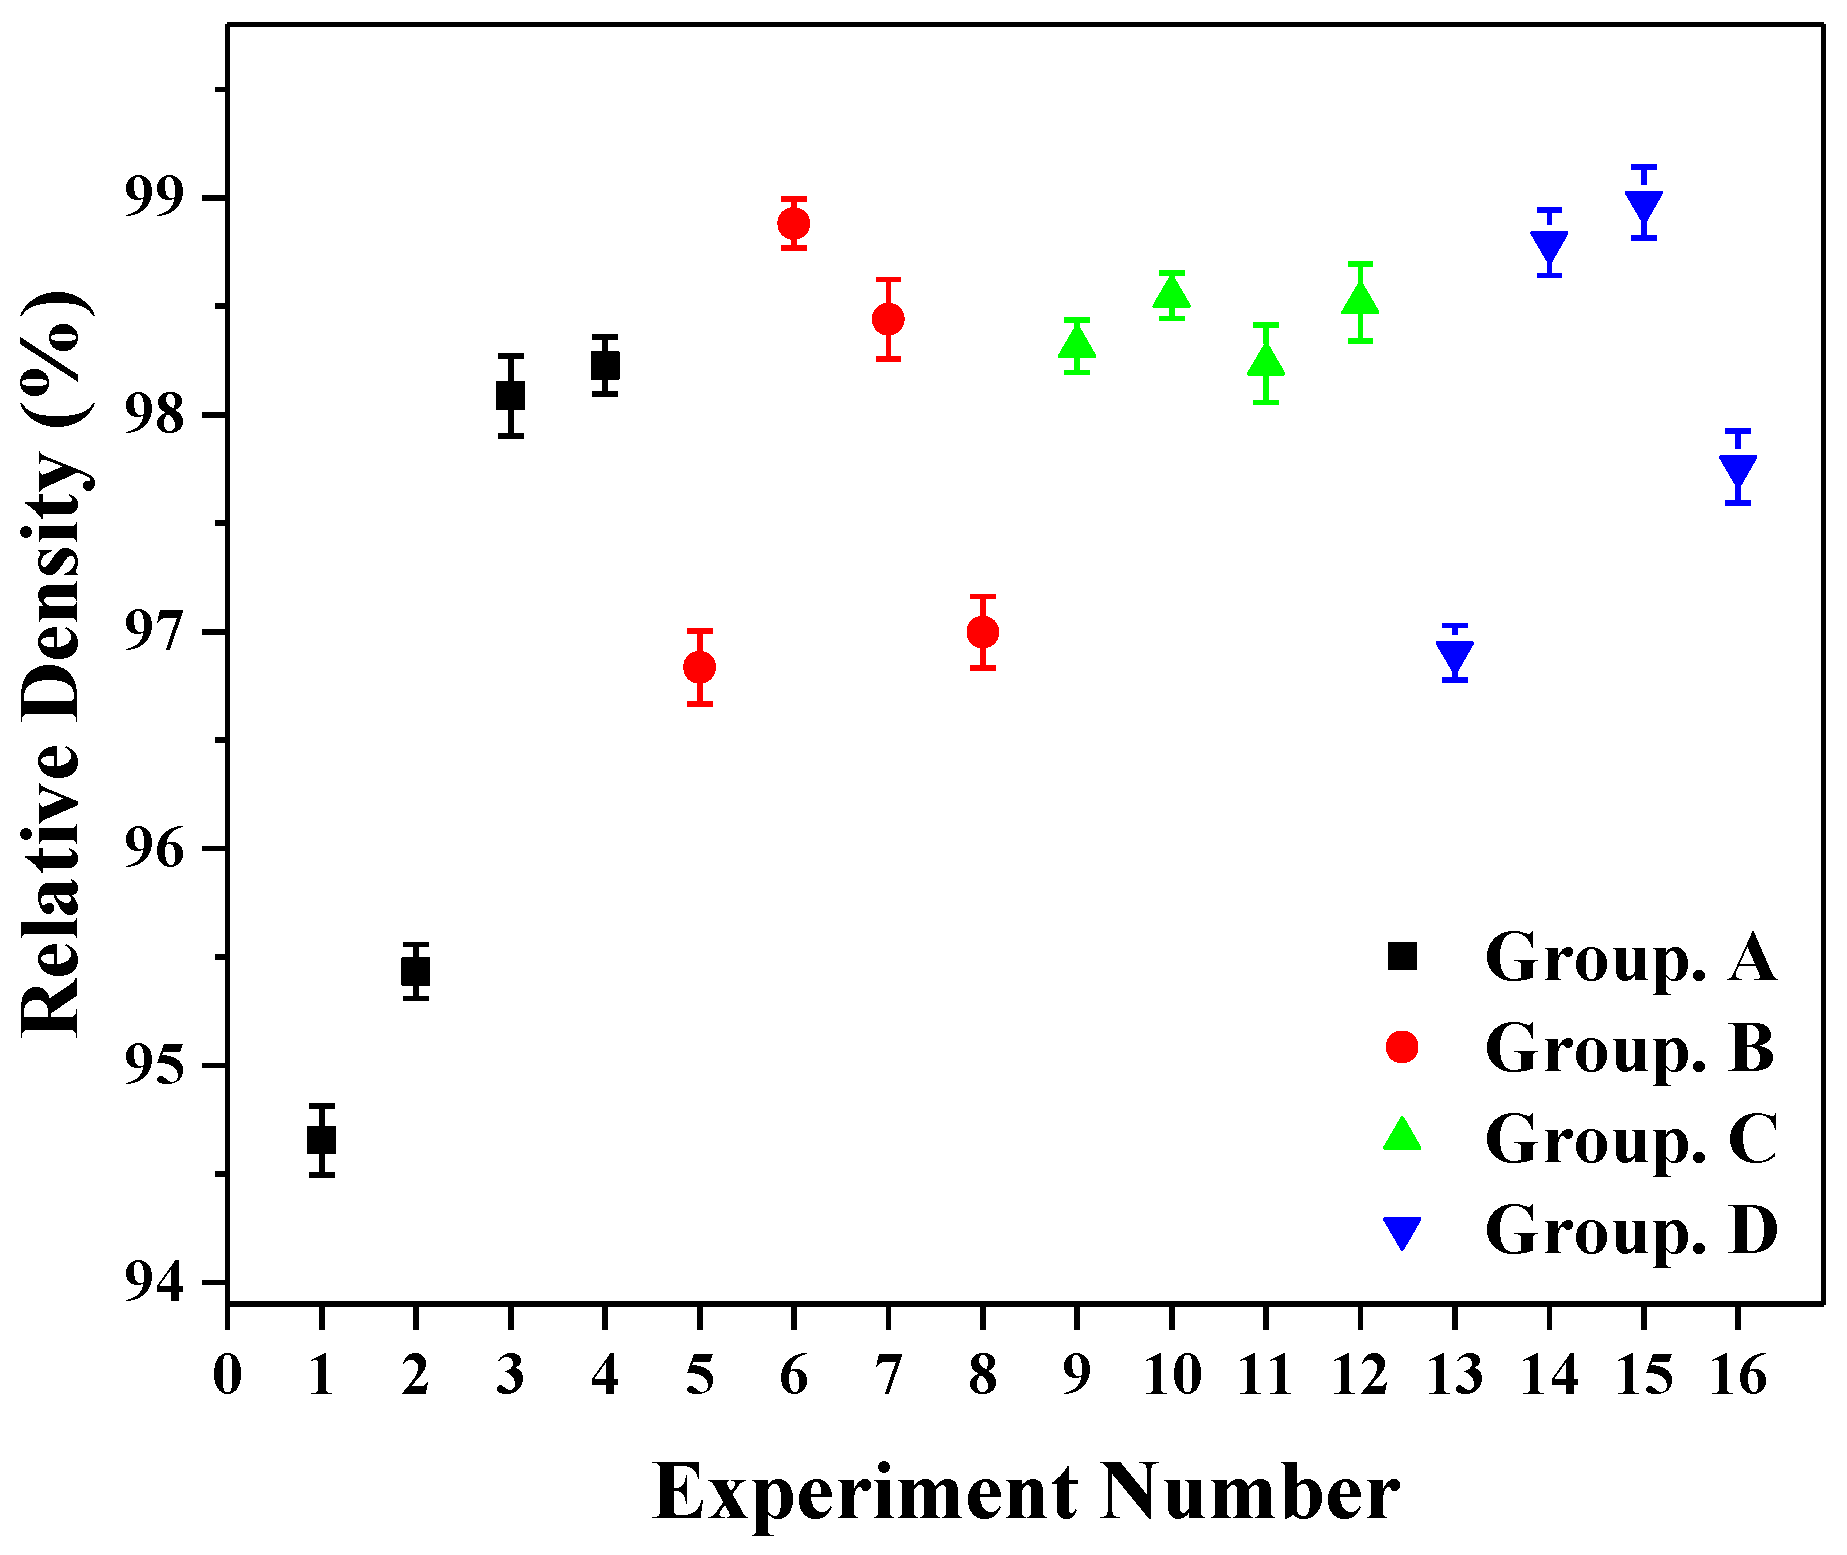
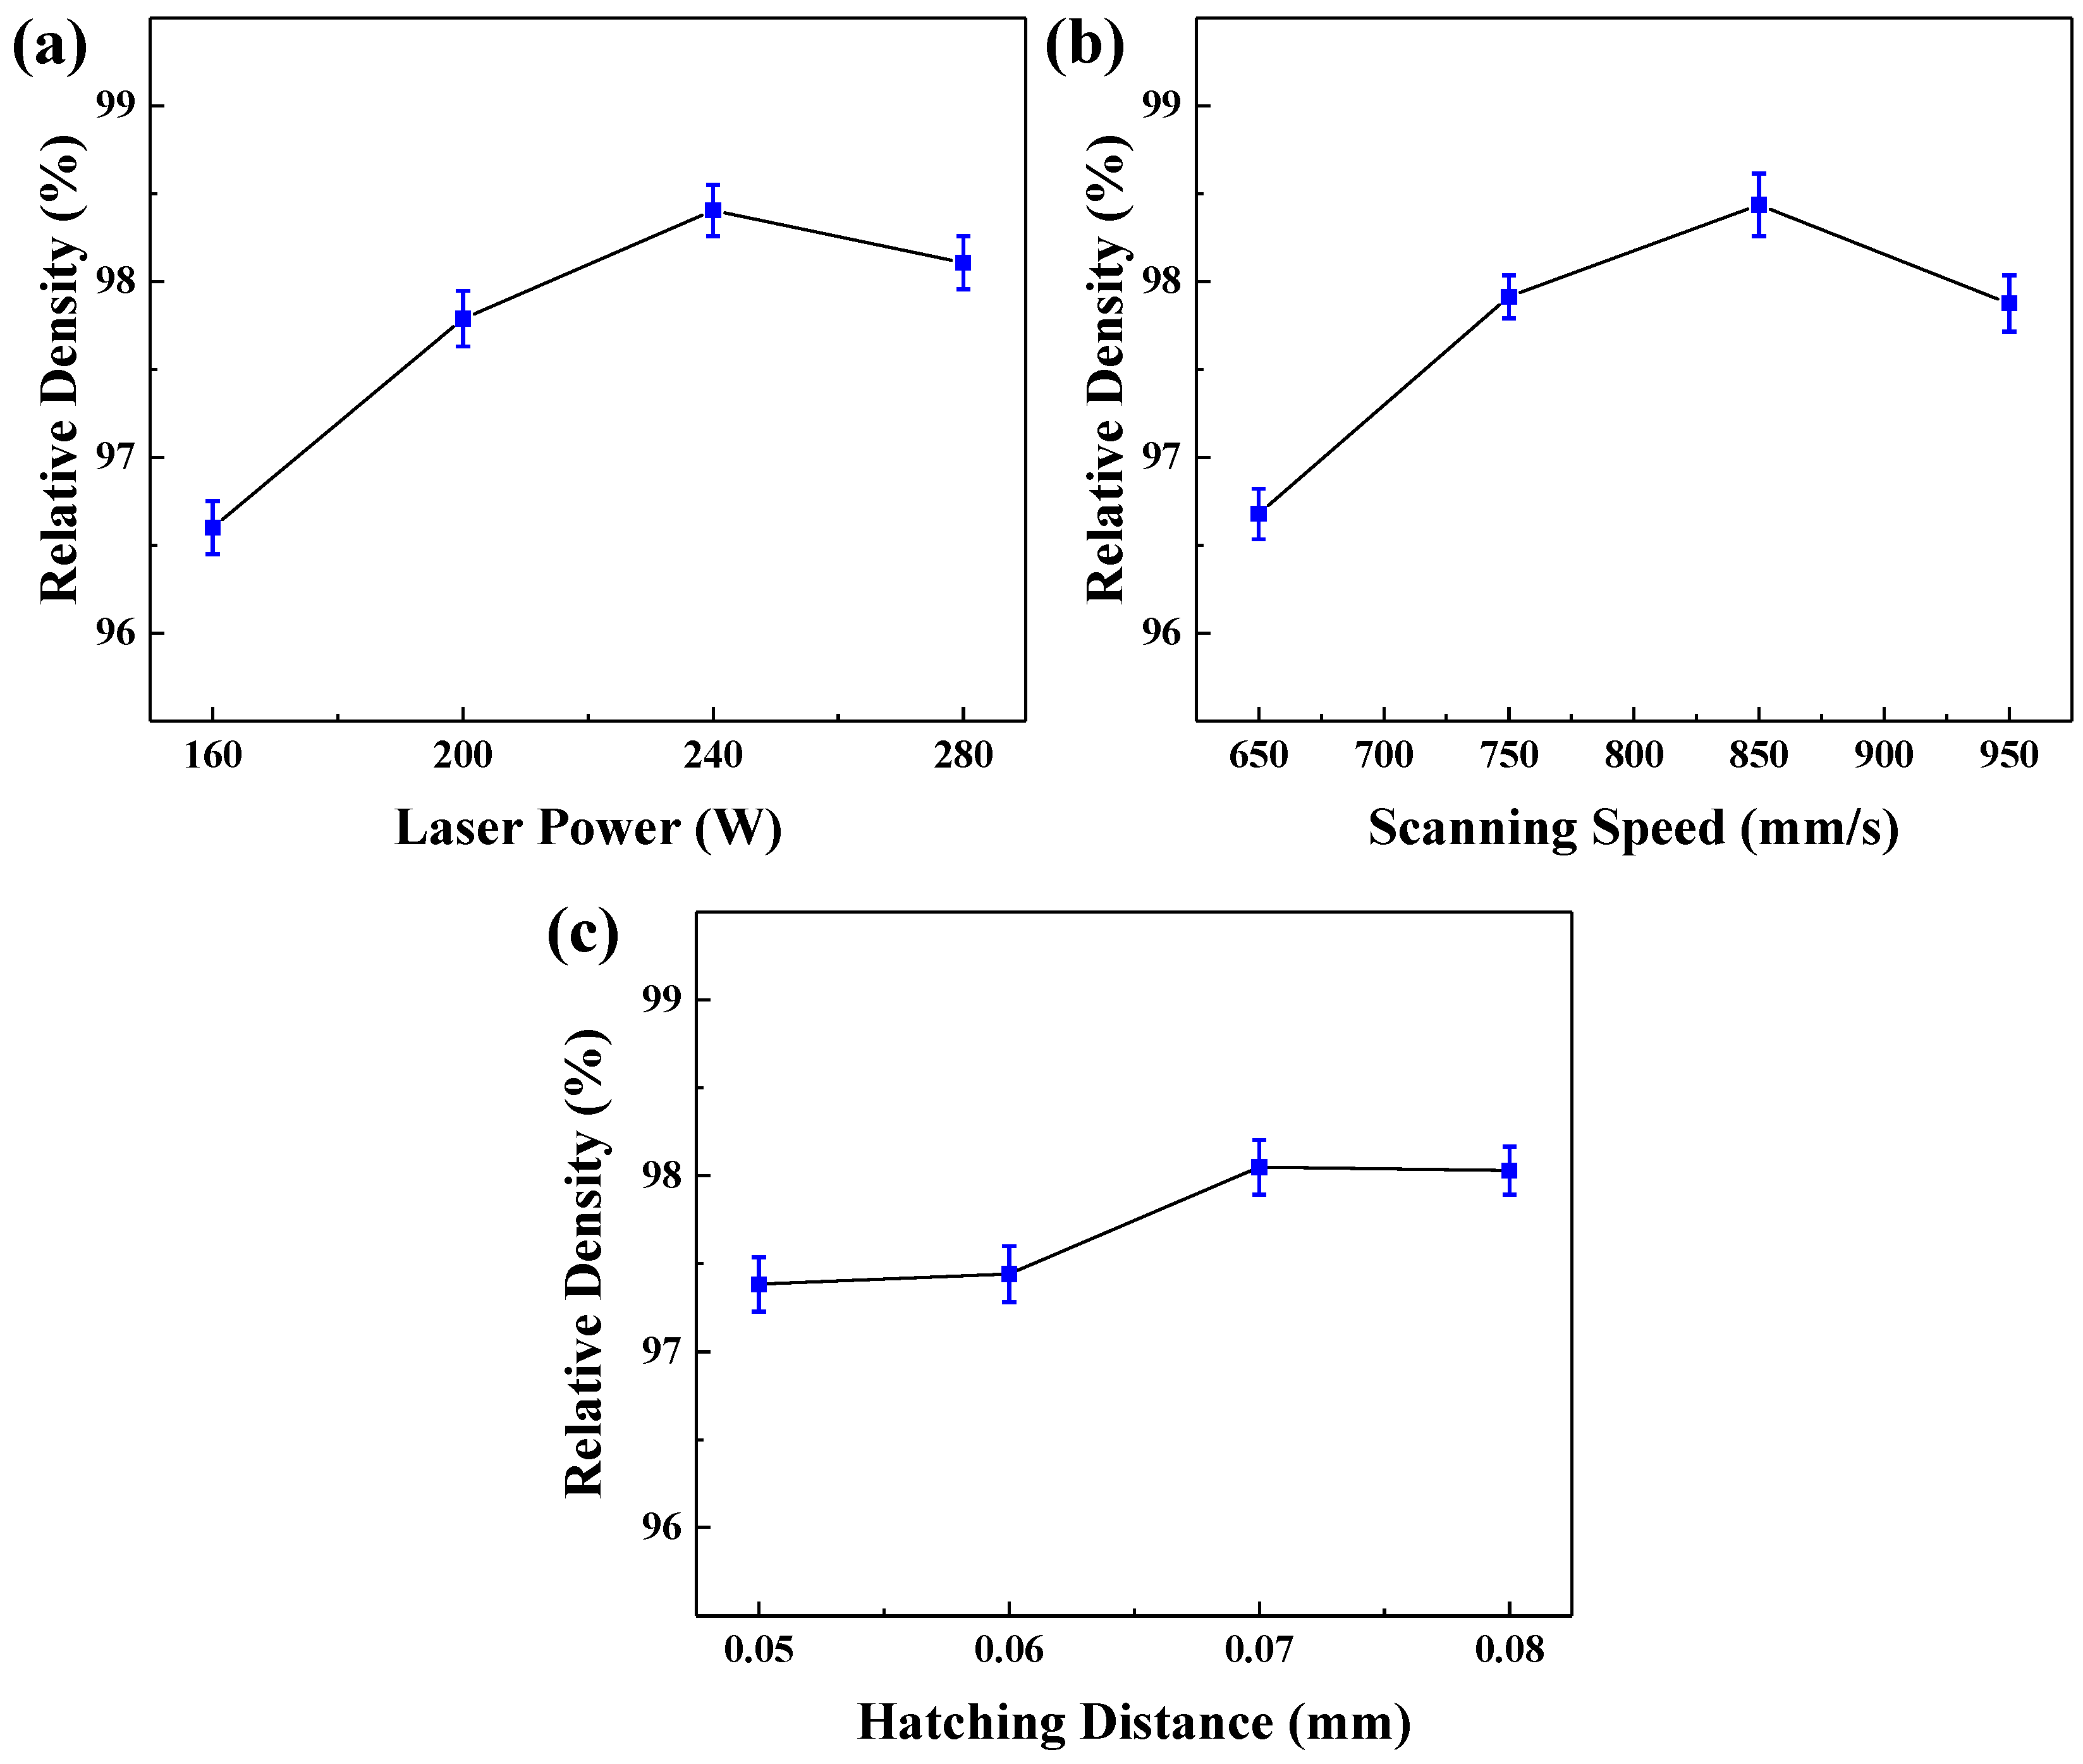
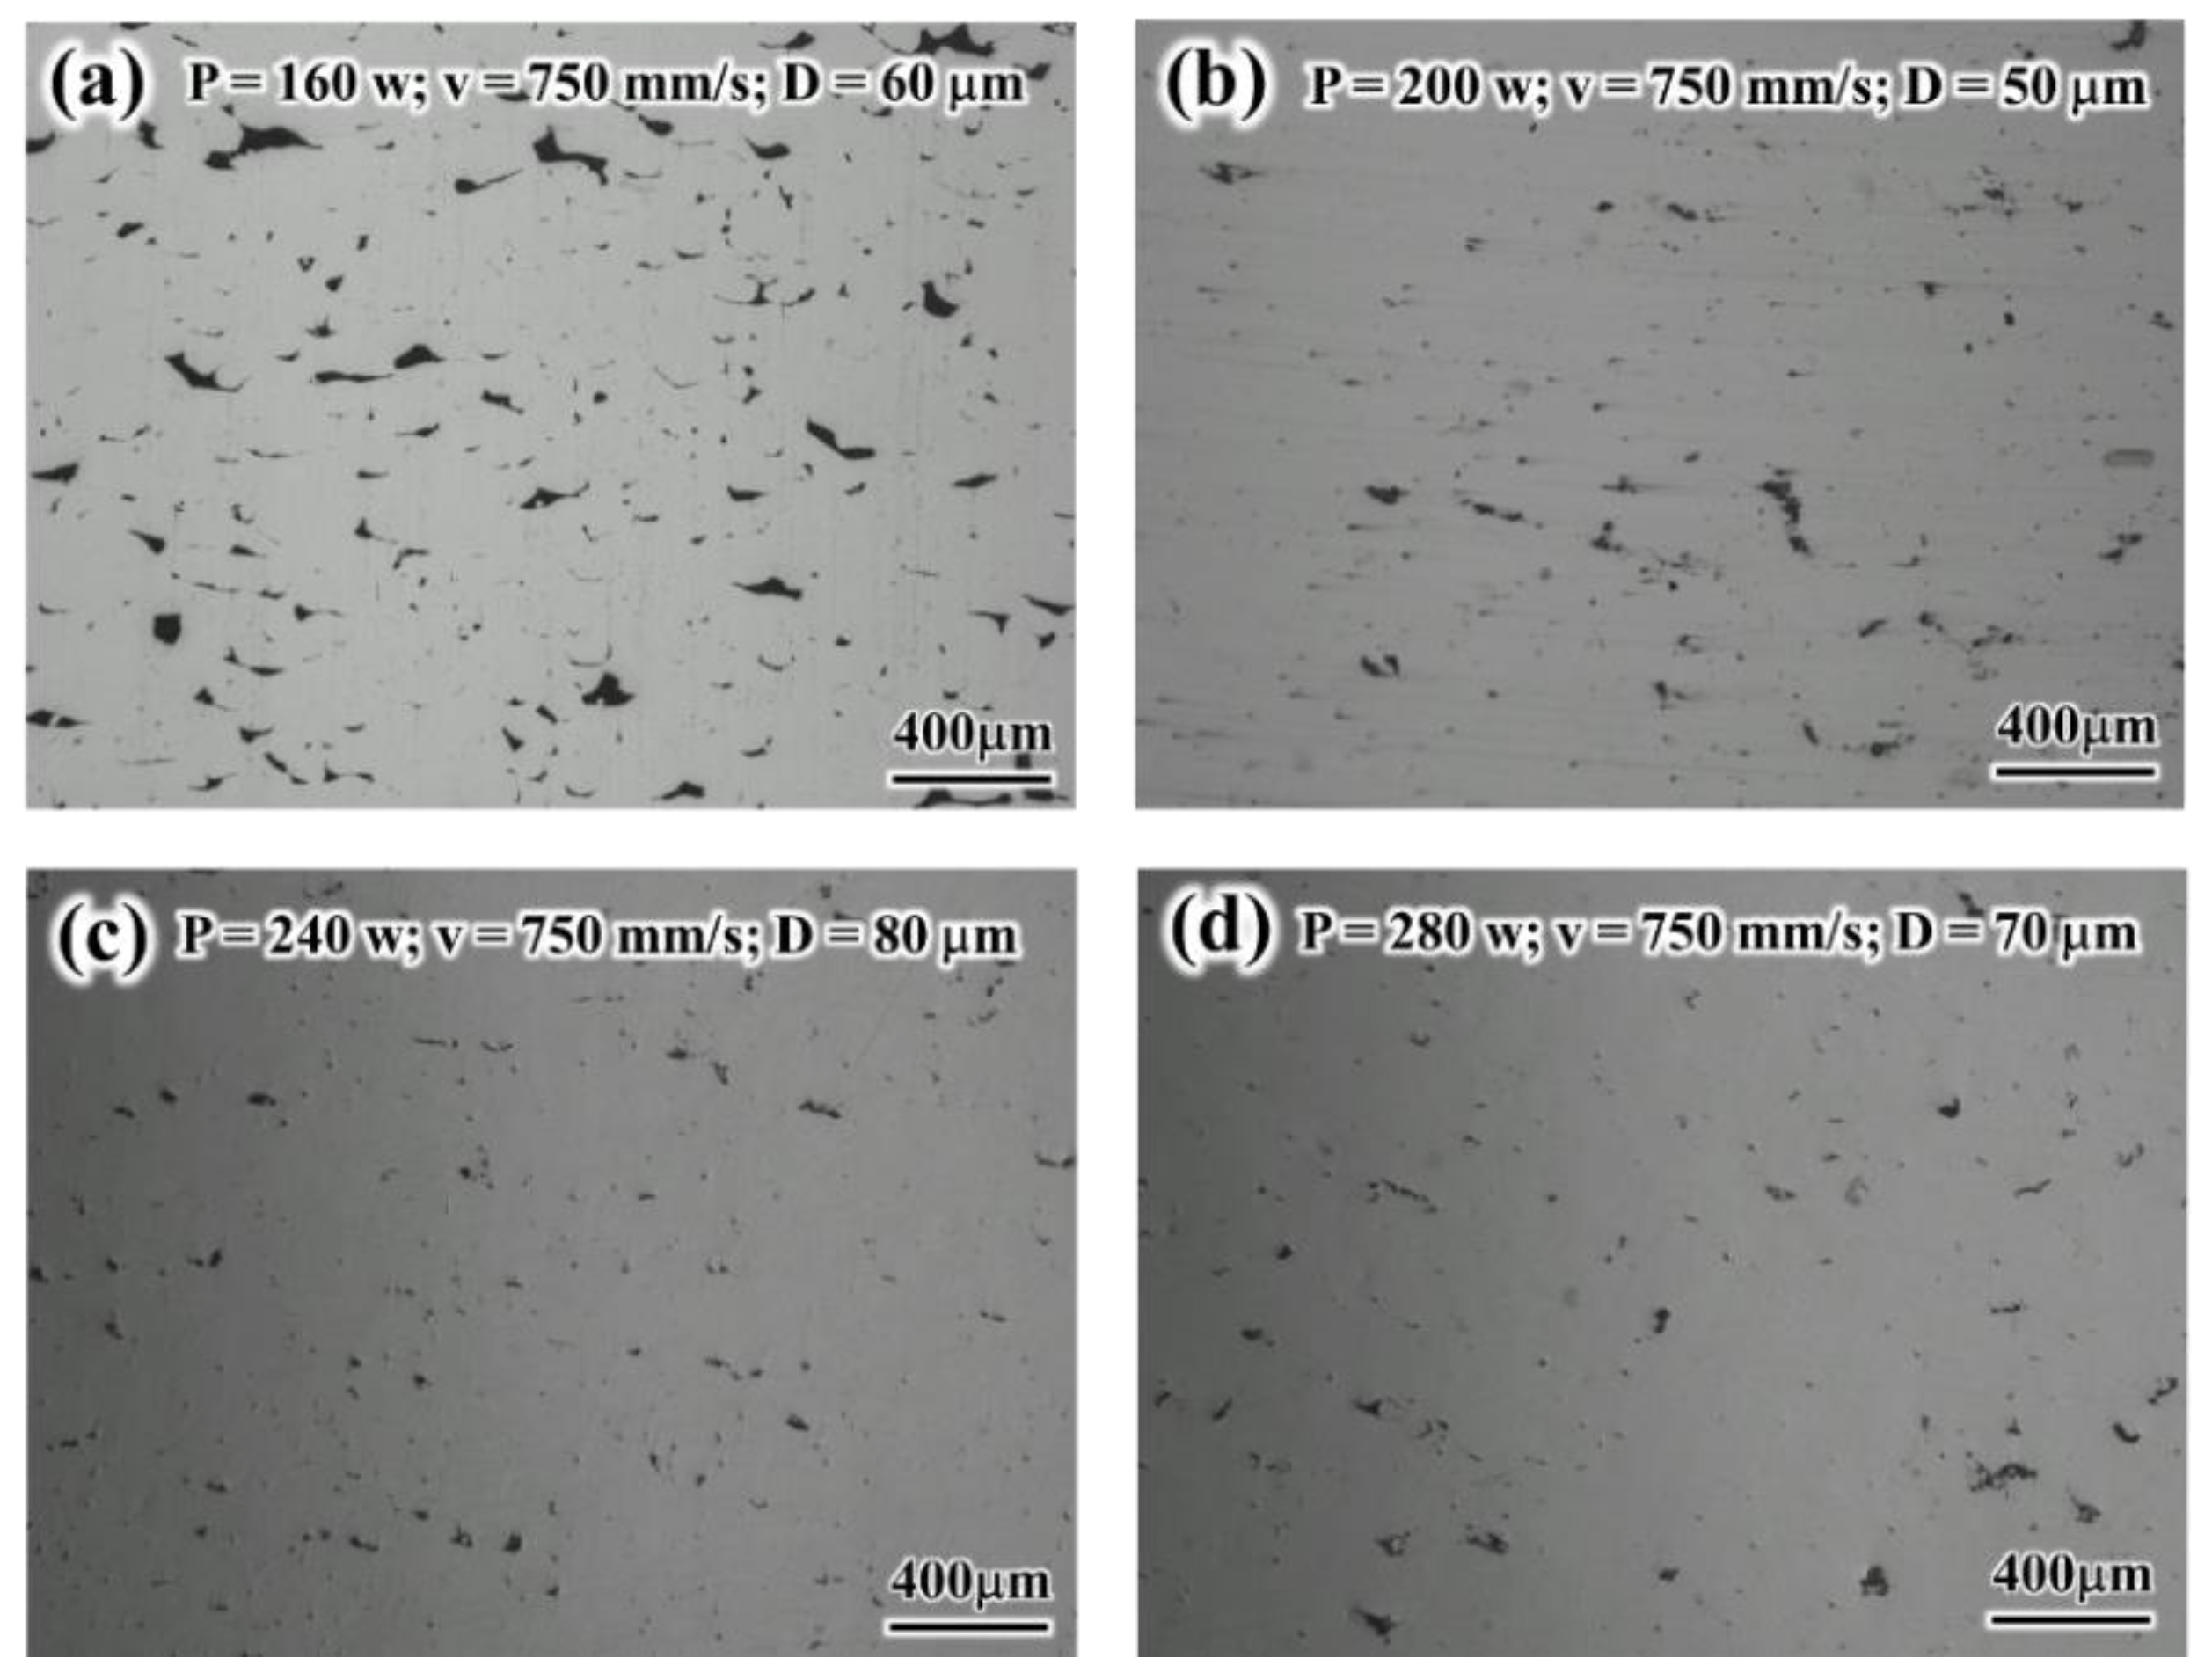
3.1. Relative Density

In order to ensure the accuracy of relative density calculation, no less than 20 optical images were collected for each sample. After removing the highest and lowest values, the average value was taken as the final result. Figure 4 shows the relative density measurement results and statistical errors of volume fraction of the pores driven from the image analysis of 16 samples manufactured by SLM. It is obvious from Figure 4 that when laser power is 240 W, scanning speed and hatching distance have little influence on relative density. The relative density of sample No. 15 is the highest, reaching 98.98%. This is mainly because at this process parameter, there is enough energy to completely melt the powder and enough time for the gas inside the powder bed to escape, etc.
Figure 5 is the main effect diagram of alloy relative density under various process parameters obtained through orthogonal analysis. Figure 5a shows that when the laser power is increased from 160 W to 280 W, the compactness of the samples first shows a trend of increasing, then decreasing. When the laser power is too low, the energy absorbed by the powder becomes too low to be completely melted, the viscosity of the melt becomes higher and the fluidity becomes poor, resulting in poor lap quality between the melt channels and poor continuity of the melt channels. In addition, there are more irregular pores in the sample where the powder is not completely fused, resulting in a low relative density of the sample. When the laser power is 200 W, the sample relative density is significantly improved, as shown in Figure 6a,b. When the laser power rises to 280 W, the powder absorbs so much energy that the melt begins to evaporate. Fast expansion of vapor leads to explosions in the boiling melt [16]. The splashed particles adhere to the surface of the sample and cause a poor weld lap. Excessive laser power can cause spheroidisation and even burn. In addition, a large amount of molten metal evaporates, resulting in many circular pores on the surface of the sample, thereby reducing the relative density of the sample. When the laser power is high, the solidification time of the molten pool is prolonged, the hydrogen in the molten pool reaches the local solubility limit and nucleation generates bubbles. The bubbles diffuse from the bottom of the molten pool and the heat-affected zone to the top and eventually form many hydrogen holes, so the hole defects are obvious [17,18], as shown in Figure 6c,d.
As the scanning speed increases, the relative density of the sample slowly increases and then decreases, as shown in Figure 5b. When the scanning speed is too low, it is easy to make the local liquid phase too much, resulting in nodules and decreased relative density [17,18]. Concurrently, when V is too small, due to the strong Marangoni effect, defects such as spheroidisation and pores are easily formed in the molten pool, so the overall relative density value is not high. When the scanning speed is 950 mm/s, the high scanning speed makes the cooling rate of the molten pool faster, the width and depth of the molten pool are reduced and the melting channel is prone to discontinuity, which leads to a decrease in relative density.
Figure 5c shows that as the hatching distance increases, the relative density of the alloy first increases and then decreases. The smaller the hatching distance, the greater the internal stress and the greater the temperature gradient, which is likely to cause spheroidisation and even lead to warpage deformation of the samples. Since the melting channel is elliptical during the forming process, the two melting channels are distributed in a wave shape. When the hatching distance is too large, the overlap area between adjacent melting channels is reduced, resulting in a large amount of unmelted powder in the trough area and forming many pores of very large size. A reasonable hatching distance can make the powder in the overlapping area between adjacent melting channels fully melt, and the molten metal can be completely spread, reducing the generation of pores. The body energy density formula can be used to express the influence on density. The formula is as follows:
E = P v d h  
where E is the energy density of the laser body, P is the laser power, υ is the scanning speed, d is the hatching distance and h is the thickness of the powder layer.
Table 3 shows the results of the analysis of the influence of process parameters on relative density. The p-value of the laser power is the smallest, indicating that the laser power is the main factor affecting the relative density, followed by the scanning speed, and the hatching distance has the least influence.

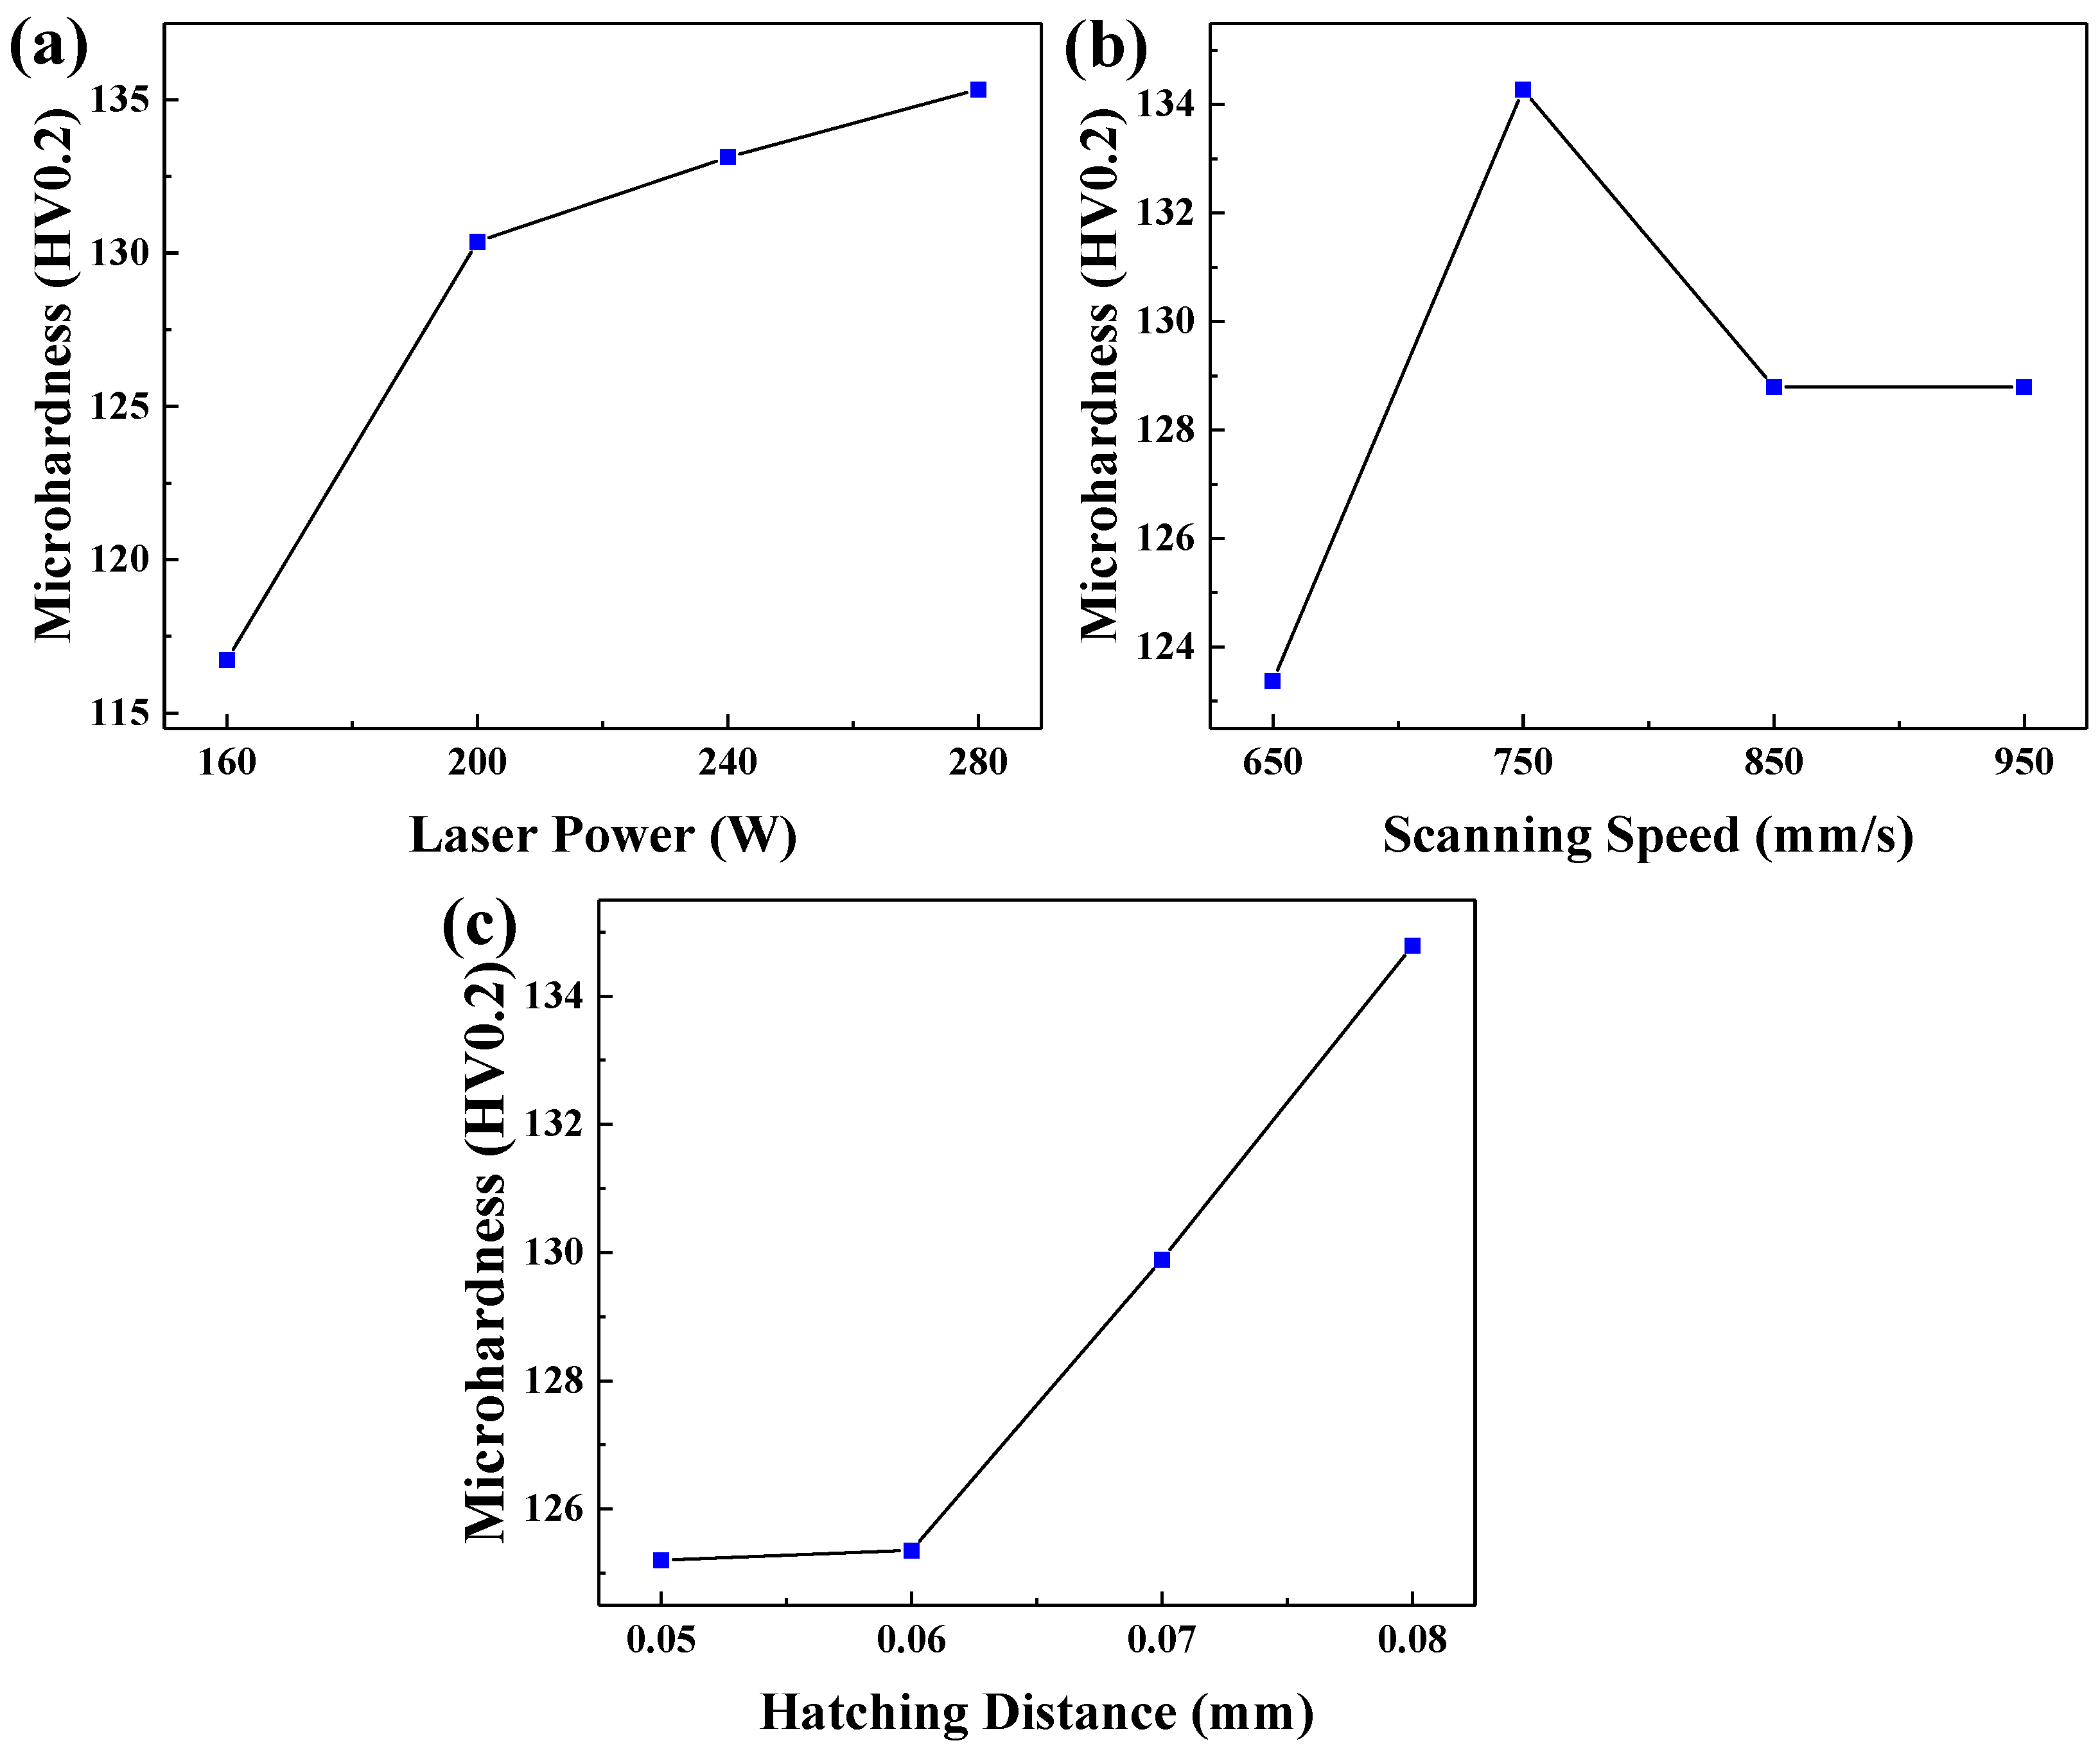
3.2. Effect of Process Parameters on the Microhardness of SLM Alloy

The main effects plot showing the variation of the hardness of SLM alloy with laser power, scanning speed and hatching distance is plotted in Figure 7. When the laser power is 280 W, the average hardness of the sample reaches 135.3 HV0.2. The laser energy density increased with the increased of laser power, which resulted in strong metallurgical bonding between powder particles [19]. When the laser power is 160 W, the average hardness of the sample becomes the lowest because when the sample gets less energy, the powder cannot be fully melted, and the fluidity of the metal solution becomes poor, resulting in the sample having more pores and lower relative density. When the scanning speed is 750 mm/s, the hardness of the sample becomes higher. CuCrZr is a precipitated hardened copper alloy [20,21]. Under the action of pressure, precipitated Cr atoms hinder the sliding between grains, thus improving the hardness of the alloy [11]. However, with the increase in scanning speed, the hardness of samples decreased, which was mainly caused by Cr atoms in solid solution.
Table 4 shows the average hardness value of the upper surface of the sample. From the table, the hardness of the Group A samples is lower. As the laser power increases, the hardness value of the alloy increases, and rate of increase decreases.

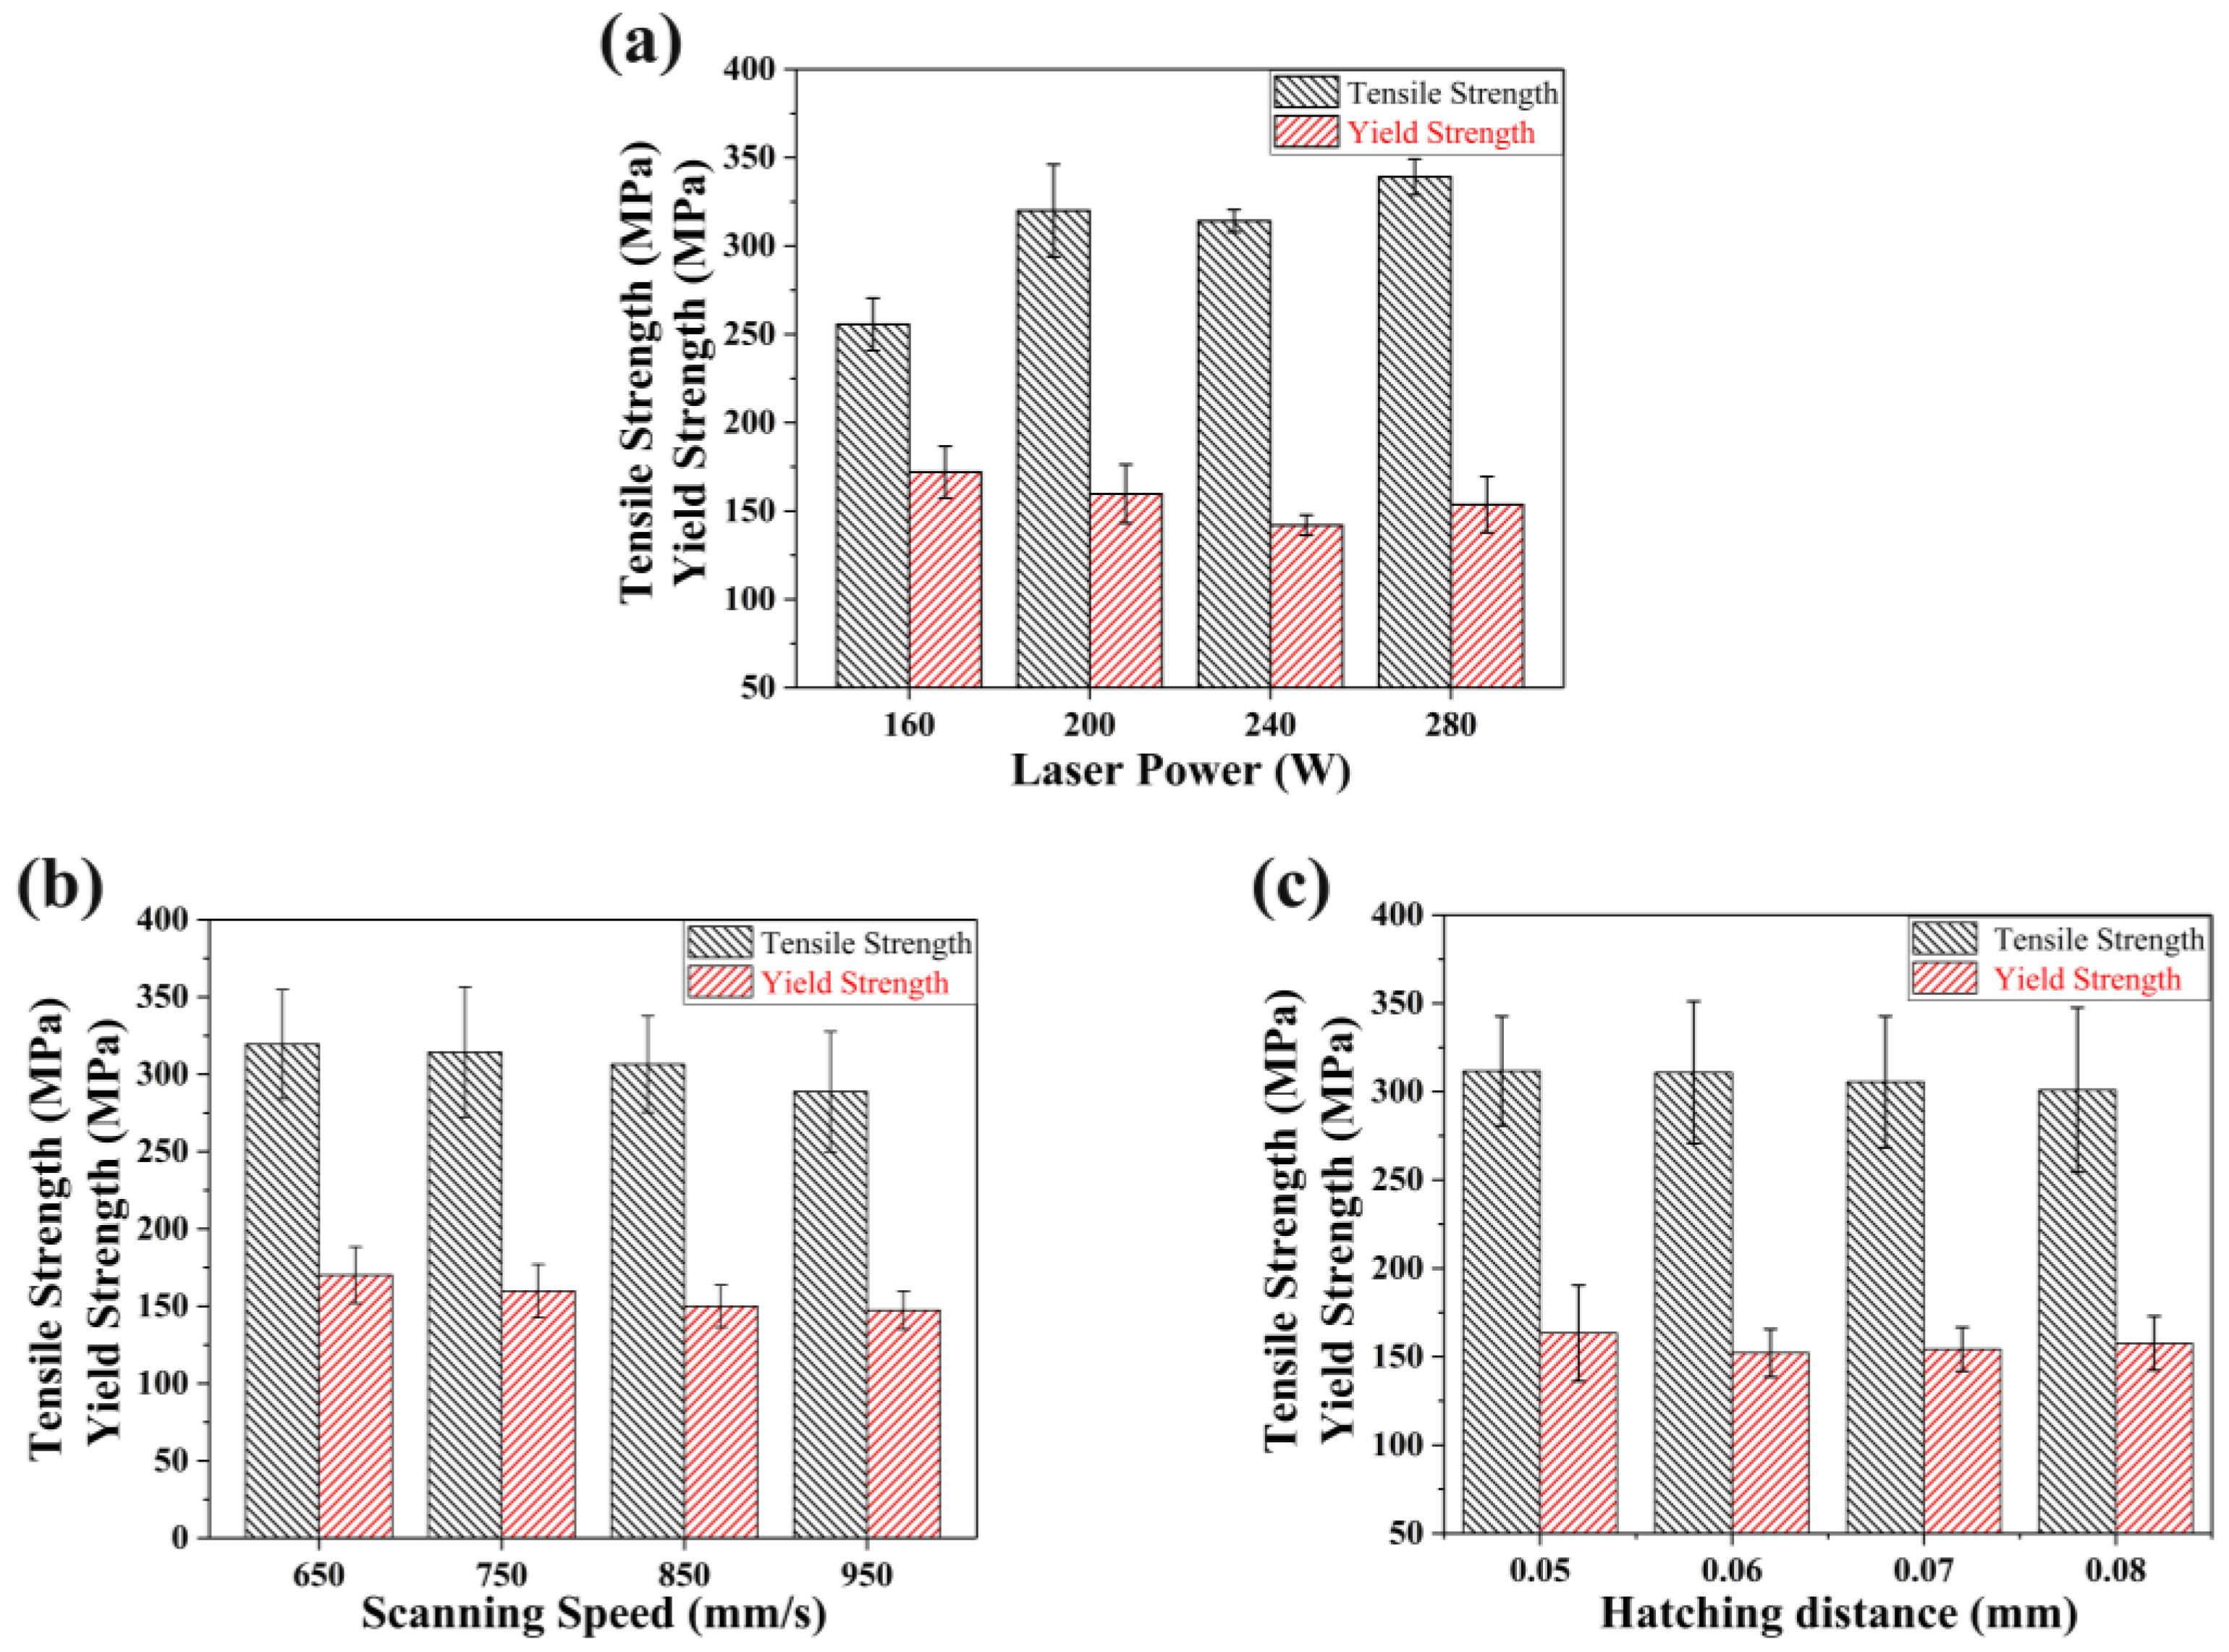
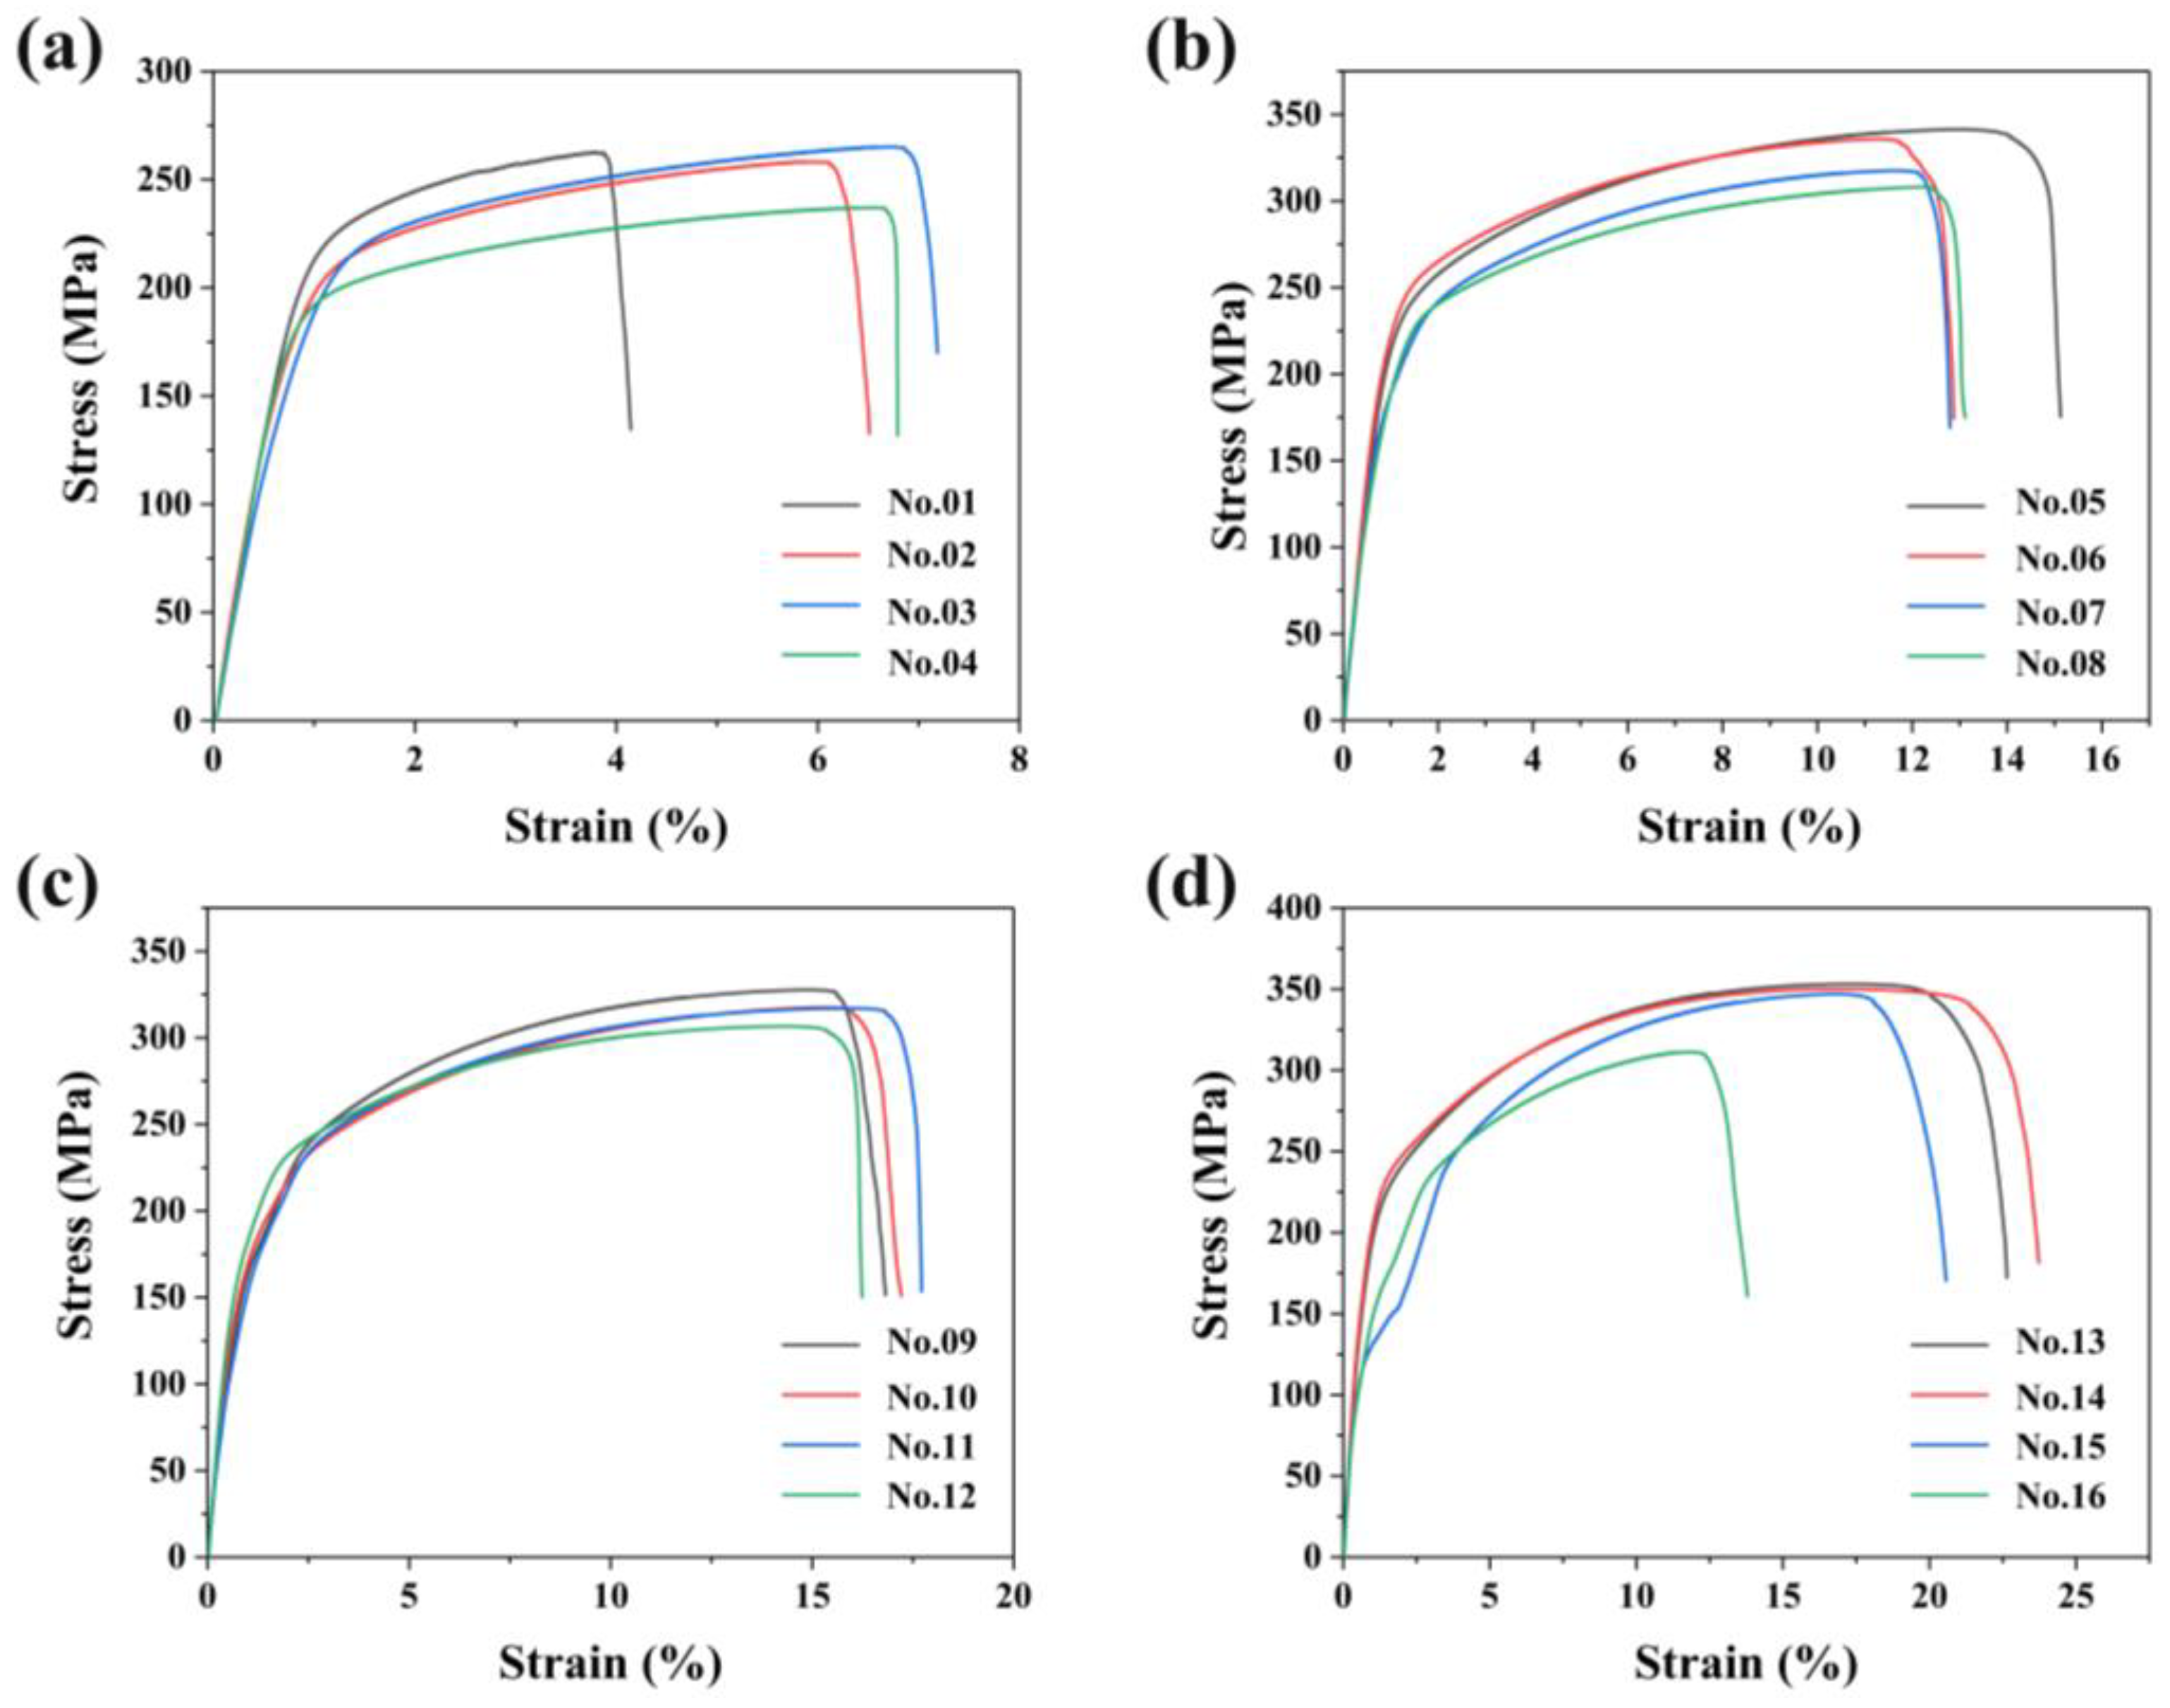
3.3. Strength of the SLMed Alloy

Figure 8 shows the main effect diagram of the influence of the process parameters on the tensile properties of the samples. When the laser power is 280 W, the tensile and yield strengths of the sample become the largest at 339 MPa and 153 MPa, respectively. With a laser power of 160 W, the tensile and yield strengths of the sample are the smallest. This is due to the increase in void defects at higher scanning speeds, which intensifies the initiation and propagation of cracks. Figure 8b shows that as the scanning speed increases, the alloy’s tensile and yield strengths show a slow downwards trend. This is because the increase in scanning speed leads to instability of liquid relative flow, imbalance of the interface and crystal failure. Figure 8c shows that as the hatching distance increases, the alloy’s tensile and yield strengths decrease, but the decrease is smaller. Thus, the hatching distance has little effect on the alloy’s tensile and yield strengths. In summary, there are differences in the properties of CuCrZr alloys prepared with different process parameters.
Figure 9 shows the stress–strain curves of CuCrZr alloys prepared by SLM under different process parameters. It can be seen from the figure that the CuCrZr alloy has no obvious yield stage. When the load reaches the maximum, the sample breaks immediately. Sample No. 4 has the lowest energy density and the lowest tensile strength, with a tensile strength of 235 MPa and an elongation of 6.91%. Sample No. 14 has the highest tensile strength, with a tensile strength of 347 MPa and an elongation of 17.26%. It can be seen from Figure 9a that when the laser power is 160 W, the tensile strength of the SLM formed sample is low, and the elongation is small. As the laser power increases, the tensile strength and elongation of the pattern generally increase. Sample No. 16 has the highest energy density, and compared with other samples in group D, the tensile strength and elongation are significantly reduced. The ultimate tensile strength and elongation generally show a positive growth trend, that is, the greater the ultimate tensile strength, the greater the elongation.
Figure 10 shows a typical SEM image of the fracture of the CuCrZr alloy tensile sample. Figure 10a–c show the fracture morphologies of sample No. 4 at low-magnification and high-magnification, respectively. Figure 10a shows the poor metallurgical bonding of sample No. 4 with many large irregular sizes defects on the surface of the tensile fracture. There are many unmelted spherical powder particles in the interior and peripheral areas of the pores, as shown in Figure 10b. Figure 10d–f are the low-magnification and high-magnification fracture morphologies of Sample No. 14, respectively. The tensile fracture shows an obvious necking phenomenon, and many micron-scale dimples appear, showing the characteristics of ductile fracture. The structure shows that an increase in laser power can significantly increase the tensile strength of the sample and significantly increase ductility.

4. Conclusions

In this paper, the effects of process parameters (laser power, scanning speed and hatching distance) on the relative density, hardness and tensile strength of SLM alloys were studied through orthogonal experiments, and CuCrZr alloys with good comprehensive properties were prepared. The main conclusions are as follows:
When the energy density is low, there are many irregular pores on the surface of the tensile fracture, and a large number of unmelted spherical powder particles exist in and around the pores. With the increase in energy density, the overall trend of sample relative density is to increase first, remain stable, and then slowly decrease. The laser power is the main factor that affects relative density, followed by scanning speed, and hatching distance has the least influence.
The hardness of the alloy keeps rising, and the rate of increase decreases with the increase in laser power. With the increase in scanning speed, the hardness of alloy increases, and the increase rate decreases. The tensile strength and elongation of the alloy increase with the laser power. When the laser power is 280 W, the scanning speed is 750 mm/s, and the hatching distance is 0.07 mm; the alloy has the greatest ultimate tensile strength and the highest elongation. The tensile fracture shows an obvious necking phenomenon, and many micron-scale dimples appear, showing the characteristics of ductile fracture.
The optimal combination of process parameters in this paper is as follows: laser energy is 240 W, scanning speed is 750 mm/s and hatching distance is 0.07 mm. Under these parameters, the ultimate tensile strength and elongation of CuCrZr alloy are the highest, reaching 347 MPa and 17.26%, respectively. However, its relative density is still lower than that of Ti6Al4V and 316L prepared by SLM technology. Therefore, future work will focus on improving the relative density and mechanical properties of CuCrZr alloy through post-treatment.

Author Contributions

Writing—original draft, investigation, formal analysis, J.L.; writing—review and editing and supervision, Z.K.; methodology, supervision and resource, Z.L.; methodology and resource, B.L.; conceptualization and methodology, Y.C.; methodology, S.L.; investigation, writing—review and editing, Y.N.; writing—review and methodology, Z.Y. All authors have read and agreed to the published version of the manuscript.

Funding

This research was funded by the NSFC (Grant No. 51905497, No. 52075502), the Major Science and Technology Projects of Shanxi Province, China (Grant No. 20181102012) and the Support Program for Young Academic Leaders of North University of China (Grant No. QX201902). The APC was funded by the NSFC (Grant No. 52075502).

Institutional Review Board Statement

Not applicable.

Informed Consent Statement

Not applicable.

Data Availability Statement

Additional supporting data can be provided upon request.

Conflicts of Interest

The authors declare no conflict of interest.

References

  1. Wang, W.; Zhu, J.; Qin, N.; Zhang, Y.; Li, S.; Xiao, Z.; Lei, Q.; Li, Z. Effects of minor rare earths on the microstructure and properties of Cu-Cr-Zr alloy. J. Alloy. Compd. 2020, 847, 155762. [Google Scholar] [CrossRef]
  2. Junfeng, W.; Jinshui, C.; Chengjun, G.; Jianbo, Z.; Xiangpeng, X.; Bin, Y. Effect of heat treatment on low cycle fatigue properties of Cu–Cr–Zr alloy. Mater. Charact. 2019, 158, 109940. [Google Scholar] [CrossRef]
  3. Huang, A.H.; Wang, Y.F.; Wang, M.S.; Song, L.Y.; Li, Y.S.; Gao, L.; Huang, C.X.; Zhu, Y.T. Optimizing the strength, ductility and electrical conductivity of a Cu-Cr-Zr alloy by rotary swaging and aging treatment. Mater. Sci. Eng. A 2019, 746, 211–216. [Google Scholar] [CrossRef]
  4. Huang, J.; Yan, X.; Chang, C.; Xie, Y.; Ma, W.; Huang, R.; Zhao, R.; Li, S.; Liu, M.; Liao, H. Pure copper components fabricated by cold spray (CS) and selective laser melting (SLM) technology. Surf. Coatings Technol. 2020, 395, 125936. [Google Scholar] [CrossRef]
  5. Lodes, M.A.; Guschlbauer, R.; Körner, C. Process development for the manufacturing of 99.94% pure copper via selective electron beam melting. Mater. Lett. 2015, 143, 298–301. [Google Scholar] [CrossRef]
  6. Tian, J.; Zhu, W.; Wei, Q.; Wen, S.; Li, S.; Song, B.; Shi, Y. Process optimization, microstructures and mechanical properties of a Cu-based shape memory alloy fabricated by selective laser melting. J. Alloy. Compd. 2019, 785, 754–764. [Google Scholar] [CrossRef]
  7. Kalinin, G.M.; Ivanov, A.D.; Obushev, A.N.; Rodchenkov, B.S.; Rodin, M.E.; Strebkov, Y.S. Ageing effect on the properties of CuCrZr alloy used for the ITER HHF components. J. Nucl. Mater. 2007, 367–370, 920–924. [Google Scholar] [CrossRef]
  8. Wang, W.; Li, R.; Zou, C.; Chen, Z.; Wen, W.; Wang, T.; Yin, G. Effect of direct current pulses on mechanical and electrical properties of aged Cu–Cr–Zr alloys. Mater. Des. 2016, 92, 135–142. [Google Scholar] [CrossRef]
  9. Zhang, B.; Zhang, Z.-G.; Li, W. Mechanical properties, electrical conductivity and microstructure of CuCrZr alloys treated with thermal stretch process. Trans. Nonferrous Met. Soc. China 2015, 25, 2285–2292. [Google Scholar] [CrossRef]
  10. Ma, Z.; Zhang, K.; Ren, Z.; Zhang, D.Z.; Tao, G.; Xu, H. Selective laser melting of Cu–Cr–Zr copper alloy: Parameter optimization, microstructure and mechanical properties. J. Alloys Compd. 2020, 828, 154350. [Google Scholar] [CrossRef]
  11. Sun, F.; Liu, P.; Chen, X.; Zhou, H.; Guan, P.; Zhu, B. Mechanical Properties of High-Strength Cu–Cr–Zr Alloy Fabricated by Selective Laser Melting. Materials 2020, 13, 5028. [Google Scholar] [CrossRef] [PubMed]
  12. Guan, P.; Chen, X.; Liu, P.; Sun, F.; Zhu, C.; Zhou, H.; Fu, S.; Wu, Z.; Zhu, Y. Effect of selective laser melting process parameters and aging heat treatment on properties of CuCrZr alloy. Mater. Res. Exp. 2019, 6, 1165c1. [Google Scholar] [CrossRef]
  13. Wallis, C.; Buchmayr, B. Effect of heat treatments on microstructure and properties of CuCrZr produced by laser-powder bed fusion. Mater. Sci. Eng. A 2018, 744, 215–223. [Google Scholar] [CrossRef]
  14. Hu, Z.; Du, Z.; Yang, Z.; Yu, L.; Ma, Z. Preparation of Cu–Cr–Zr alloy by selective laser melting: Role of scanning parameters on densification, microstructure and mechanical properties. Mater. Sci. Eng. A 2022, 836, 142740. [Google Scholar] [CrossRef]
  15. Khorasani, A.M.; Gibson, I.; Awan, U.S.; Ghaderi, A. The effect of SLM process parameters on density, hardness, tensile strength and surface quality of Ti-6Al-4V. Addit. Manuf. 2019, 25, 176–186. [Google Scholar] [CrossRef]
  16. Wen, P.; Jauer, L.; Voshage, M.; Chen, Y.; Poprawe, R.; Schleifenbaum, J.H. Densification behavior of pure Zn metal parts produced by selective laser melting for manufacturing biodegradable implants. J. Mater. Processing Technol. 2018, 258, 128–137. [Google Scholar] [CrossRef]
  17. Weingarten, C.; Buchbinder, D.; Pirch, N.; Meiners, W.; Wissenbach, K.; Poprawe, R. Formation and reduction of hydrogen porosity during selective laser melting of AlSi10Mg. J. Mater. Processing Technol. 2015, 221, 112–120. [Google Scholar] [CrossRef]
  18. Pal, S.; Lojen, G.; Kokol, V.; Drstvensek, I. Evolution of metallurgical properties of Ti-6Al-4V alloy fabricated in different energy densities in the Selective Laser Melting technique. J. Manuf. Processes 2018, 35, 538–546. [Google Scholar] [CrossRef]
  19. Chen, J.; Yang, Y.; Song, C.; Wang, D.; Wu, S.; Zhang, M. Influence mechanism of process parameters on the interfacial characterization of selective laser melting 316L/CuSn10. Mater. Sci. Eng. A 2020, 792, 139316. [Google Scholar] [CrossRef]
  20. Singh, R.; Singh, S.; Kanigalpula, P.; Saini, J. Electron beam welding of precipitation hardened CuCrZr alloy: Modeling and experimentation. Trans. Nonferrous Met. Soc. China 2020, 30, 2156–2169. [Google Scholar] [CrossRef]
  21. Feng, H.; Jiang, H.; Yan, D.; Rong, L. Microstructure and Mechanical Properties of a CuCrZr Welding Joint After Continuous Extrusion. J. Mater. Sci. Technol. 2015, 31, 210–216. [Google Scholar] [CrossRef]
Figure 1. Particle size distribution of CuCrZr powder.
Metals 12 00701 g001
Figure 2. SEM image of CuCrZr powder.
Metals 12 00701 g002
Figure 3. CuCrZr samples fabricated by SLM.
Metals 12 00701 g003
Figure 4. Relative density of samples fabricated by SLM with different process parameters.
Metals 12 00701 g004
Figure 5. The influence of process parameters on the relative density of samples: (a) Laser Power, (b) Scanning Speed, (c) Hatching Distance.
Metals 12 00701 g005
Figure 6. Optical micrograph of sample: (a) No. 2, (b) No. 6, (c) No. 10, (d) No. 14.
Metals 12 00701 g006
Figure 7. The influence of process parameters on the hardness of samples: (a) Laser Power, (b) Scanning Speed, (c) Hatching Distance.
Metals 12 00701 g007
Figure 8. The influence of process parameters on the tensile properties of samples: (a) Laser Power, (b) Scanning Speed, (c) Hatching Distance.
Metals 12 00701 g008
Figure 9. Stress–strain curve of CuCrZr alloy fabricated by SLM under different process parameters. (a) Group A, (b) Group B, (c) Group C, (d) Group D.
Metals 12 00701 g009
Figure 10. SEM images of the fracture morphologies of the tensile parts from (ac) No.4 and (df) No.14.
Metals 12 00701 g010
Table 1. Chemical compositions of CuCrZr alloy powders.
ElementCrZrCu
Content (wt. %)0.750.077Bal.
Table 2. Process parameters of alloys fabricated by SLM.
GroupTest NumberLaser Power
P (W)
Scanning Speed
V (mm/s)
Hatching Distance
D (μm)
ANo. 0116065050
No. 0216075060
No. 0316085070
No. 0416095080
BNo. 0520065060
No. 0620075050
No. 0720085080
No. 0820095070
CNo. 0924065070
No. 1024075080
No. 1124085060
No. 1224095050
DNo. 1328065080
No. 1428075070
No. 1528085060
No. 1628095050
Table 3. Results from the regression analysis of the data.
SourceDFAdj SSAdj MSF-Valuep-Value
Laser power39.9643.3212.940.052
Scanning speed15.2785.2784.670.109
Hatching distance13.3873.3873.000.305
Error1213.5651.130--
Total1523.529---
Table 4. The average hardness value of the upper surface of the sample.
Experiment No.Microhardness (HV0.2)Experiment No.Microhardness (HV0.2)
197.4 ± 1.569139.9 ± 2.39
2125.7 ± 0.8510138.4 ± 1.91
3120.9 ± 1.0611125.5 ± 0.14
4122.9 ± 0.3512128.7 ± 1.48
5117.3 ± 0.3813138.9 ± 2.12
6139.1 ± 0.5714133.8 ± 1.77
7138.9 ± 2.9715129.8 ± 1.27
8124.8 ± 0.6416138.8 ± 0.99
Publisher’s Note: MDPI stays neutral with regard to jurisdictional claims in published maps and institutional affiliations.

