Article

A Smart Digital Twin to Stabilize Return Sand Temperature without Using Coolers

1
Smart Manufacturing Technologies, Azterlan BRTA, 48200 Durango, Spain
2
R&D of Metallurgical Processes, Azterlan BRTA, 48200 Durango, Spain
*
Author to whom correspondence should be addressed.
Metals 2022, 12(5), 730; https://doi.org/10.3390/met12050730
Submission received: 30 March 2022 / Revised: 22 April 2022 / Accepted: 23 April 2022 / Published: 25 April 2022
(This article belongs to the Special Issue Optimizing Techniques and Understanding in Casting Processes)

Abstract

:
In order to ensure the optimal state of recovered molding sand inside a foundry, it is necessary to avoid temperature peaks and to ensure optimal humidity conditions prior to reusing the sand. Sand that is too hot or without optimal moisture can cause production delays due to a long mixing process, excessive consumption of raw materials, or poor agglutination. To ensure a stable and optimal sand temperature, many foundries choose to incorporate coolers into their process, however, it is a solution that is not always viable, either due to their high cost or a lack of space within the facility. Another solution is to incorporate water sprinklers into the cooling drum which contribute by reducing the temperature of the castings and the sand, but these systems do not prevent temperature peaks from occurring. Therefore, here, we present a control methodology, based on a digital architecture that, governed by an intelligent digital twin allows us to know the real situation and the current rate of production, providing suggestions for water addition. The obtained system reduces the average temperature and its variation, as well as eliminates temperature peaks, giving a more controlled manufacturing process.

1. Introduction

Manufacturing processes are an important part of today’s society. More specifically, thanks to them, consumers can have different products and services. Within the manufacturing processes, foundries are one of the central axes of the economy. Thousands of parts are created in foundries around the world with the aim of producing more complex systems, for example, brake calipers to help the braking systems of motorized vehicles, the screw that allow boats to move, the mechanisms that grant the movement of the flaps of an airplane, or the trigger of a firearm.
Despite being one of the fundamental axes of society, foundries are still at a lower level of development in terms of digitization and application of intelligent systems than other industries of similar importance. In addition, current trends encourage the production of even smaller and more precise components. Thus, any small aspect or characteristic of the process can influence the result of the parts produced.
A foundry is the place where the process of transforming metals into parts takes place. In summary, operators introduce the already molten metal into a mold. Once the cooling process is complete, the final piece is obtained. In [1], we found information on the production processes developed on metals. Specifically, Pattnaik et al. [1] detailed the process which this research work is focused on, i.e., the process in which molten metals are poured into molds where there are other related tasks such as the preparation of molds or cores and the finishing tasks of manufactured parts. Given that the two most influential elements are principally the metal and the mold, improvements on either element should positively affect the final result.
The casting method on which this research has focused is driven by the creation of green sand molds. In this process, and since there is a constant reuse of the generated sand, it is important to ensure the optimal state of the recovered sand. For this reason, it is necessary to avoid temperature peaks and to consolidate optimal humidity conditions before being stored in silos and reused [2]. A sand that is too hot or without the optimal humidity can cause production delays due to a mixing process that is too long, excessive consumption of raw materials, or poor agglutination, which, in the worst-case scenario, can produce failures in the pieces because of inclusions or molding defects.
To ensure a stable and optimal temperature of the sand, many foundries incorporate coolers into their process. However, this is a solution that is not always viable, either due to the high cost of the equipment or due to a lack of space, because the coolers are considerably large [3]. When it is not possible to include coolers, foundries usually incorporate water sprinklers into the cooling drum, which lower the temperature of the parts and the sand. Nevertheless, automatic sprinkler systems do not prevent temperature spikes in the sand, a requirement that more and more customers demand. Moreover, if the addition of water by spraying it in the cooling drum is not adequate, it may produce episodes in which the sand comes out with the produced parts or, additionally, the sand comes out of the cooling drum with uneven humidity levels that affect its storability and its subsequent mixing.
The reason why it is difficult to achieve a stable quality (temperature and humidity) of the sand by means of automatic water addition systems, as widespread installed mechanism, is that the manufacturing process is not constant, i.e., the same types of pieces are not always produced or the sizes of molds or batches are not always the same. Therefore, the load of the cooling drum (a sum of sand and casting pieces) is variable, and the same quantity of water can be excessive or too little to achieve the desired objective.
Against this background, the new industrial revolution based on information and the possibilities offered by intelligent systems may be the tool that solves this challenge [4,5]. Thus, Sertucha et al. [6] discussed the opportunities of using simulation tools in the process. In the same way, perhaps, with information retrieval, representation of reality, and simulation of the current state of the manufacturing process, a system capable of handling it could be obtained. Hence, based on publications such as [7], our approach is to create a digital twin as a solution to determine which is the appropriate water addition, adjusted to the real conditions that occur in a plant. In other words, our approach is to determine, in real time, several features such as the type of casting, metal, and sand weights that are being produced, and adjusting water addition calculations with all this data (something that is not taken into consideration by ancient systems that only apply a simplification of the manufacturing process). Previous research has contributed to other foundries by creating digital twins that monitor metallurgical treatments and molding systems [8].
Specifically, we propose a control methodology, based on a digital architecture [9] that, governed by an algorithm [10,11], allows us to always know the real situation and the production rate. On the basis of this, we are able to predict the real status of the cooling drum load, the conditions in which the sand leaves it, and its temperature and humidity level when sand is flowing to the storage. The digital twin [8] developed reproduces and controls the molding, filling, and demolding processes, as well as the conditioning of the sand during the transportation to the silos. This software is fed data extracted from the equipment involved in the process as well as data from a minimal network of strategically located sensors.
The remainder of this paper is organized as follows: in Section 2, we describe the work and the steps carried out to achieve the creation of the digital twin. Likewise, we describe the necessary sensors, their operation, and the formulas that govern the digital twin. In Section 3, we describe the results that have been achieved by our proposed approach. Finally, in Section 4, we discuss the presented solution, show the future work and the improvements that can be made to our proposal. In addition, we conclude the article and the research presented here.

2. Materials and Methods

As previously described, the solution adopted in this research work was the creation of a digital twin [10] that accurately represents what happens in the final part of the molding and casting line. In this way, to achieve this complex objective, and according to Boscher et al. [12], we define the following fundamental purposes:
  • To digitize the process, which is essential in order to digitally represent the manufacturing process that we want to optimize.
  • To expand the amount of digitalized information, and therefore, to achieve a representative set for understanding and managing the process to be optimized.
  • To generate a robust IIoT (Industrial Internet of Things) system that creates the axes that can be used to correctly define the digital twin.
  • To provide a solution that, in addition to describing the current behavior, is capable of providing digitally calculated solutions that improve the real system.
The best way to achieve all these purposes is through a simplification of the general problem using the well-known “divide and conquer” (divide et impera) methodology. This methodology simplifies the initial problem into smaller and more affordable challenges that, by solving and combining them, will provide a global solution to the initial problem. This methodology is widely used to deal with legal issues [13], mathematical calculations [14], and computer science problems (specifically in parallel processing) [15]. Considering this idea, the steps defined in the research and the development of our solution are detailed below:
  • Identification of the problem and the challenges to be overcome. The purpose of this first step is to extract the background and context of the problem to be solved. In other words, we work to become aware of what we are trying to solve.
  • Acquisition of knowledge. The second step is the acquisition of knowledge at a high level, providing the general vision necessary to start the investigation. Later, when we are working on a much more specific topic about the challenge to be faced, we will study that topic in a more specific way.
  • Division in challenges. Based on the idea of divisions already mentioned, in this step, we define the challenges to be faced with their specific steps for each of them. In the case of our work, the following challenges have been identified: (i) sensorization and required data, (ii) representation of the digital twin, (iii) uncertainty management and adjustments, (iv) prediction or regression function, (v) management of special cases and (vi) system integration. For each of these challenges, the following subphases are carried out:
    • In the acquisition of specific knowledge subphase, once the topic is defined, during this stage, we increase the knowledge to solve this problem. Many times, this acquisition has been directly related to the exploration and learning of the production process that we are optimizing.
    • In the definition of the experiment and the techniques to be used subphase, the specific research and experiments are defined for each of the challenges to be faced.
    • In the evaluation subphase, we carry out the defined experiment and obtain results of the approximation that has been defined.
    • In the analysis subphase, once the previous stage is finished, an analysis process is carried out on the data collected during the specific experimentation designed.
  • Interpretation of the results. When each solution for all identified challenges has been created, we combine all of them, and develop a final interpretation based on all the results.
Given the length that such a detailed explanation of each and every step of the methodology would take for all of the identified challenges, here, we provide a more concise explanation, but clear and extensive enough to understand the problem and facilitate the reproducibility of the system we present. Therefore, the aspects associated with each of these challenges is detailed below.

2.1. Sensorizing and Required Data

Taking into consideration the abovementioned details, the proposed system is based on the fundamental requirement of strong digitization in a foundry. If it did not exist, we would not be able to digitally represent the reality of the manufacturing process. Therefore, through the inclusion of new sensors, together with the existing MES (manufacturing execution system) and other installed sensors and small software already deployed, it is possible to extract information about the produced molds that has not been possible until now. Thus, after the knowledge extracted from publications such as [16,17,18], we begin with the work associated with this first challenge.
Firstly, to identify the most important aspects of the process, we developed a cause–effect analysis of the variables involved in the molding, casting, and cooling processes of a green sand foundry. Specifically, an analysis of variables was performed through an Ishikawa diagram [19]. This type of diagram has been widely used to determine or identify the causes of sinking defects [20], rough surfaces in sand production [21], or defective bearings [22], among others.
In this way, by developing an exhaustive analysis of influencing factors, we created the diagram shown in Figure 1. Specifically, basic categories of specific variables were detected after the analysis of the process and taking into consideration references such as that of Beeley’s publication [23], as shown in Figure 1.
Based on the previous analysis, we determined that the critical variables to be used in the digital representation process were the following:
  • Time Shake Out. The data obtained from the database of the molding machine. These data are extracted directly from the manufacturer’s CIM through a monitoring and capture development that had already been carried out. Note that there were certain bugs that had to be handled in the software.
  • Pouring time or instant in which each mold is filled. Additional information extracted in the same way as the previous variable. Pouring is sometimes not reported correctly in the manufacturer’s database and, again, some adjustments were needed to ensure the time was set.
  • Thickness. This information, similar to the previous variables, is stored in the manufacturer’s database and is extracted by the abovementioned application for monitoring. This value means the thickness of the mold that can vary in each production.
  • Compressibility. This is the value that indicates whether the machine is working with or without load. If the value is 0, the machine has work without creating any mold and this translates to a hole created into AMC. If the value is positive, the machine has molded a new mold that it places at the beginning of the molding line and will move with each movement it makes. The compressibility value is also provided by the molding machine database.
  • Gross weight of bunches of all references. This information is provided by the engineering department of the foundry; this design data is exported every night and recorded in a database table that the intelligent system can query when needed.
  • Mold temperature. This temperature is a reference to determine if the mold is full or empty. According to this measurement, the molds are processed in different ways within the intelligent system.
  • Temperature of the sand at the exit of the cooling drum. Temperature information is used to extract the variations that are being reached when the method of adding water is modified. Through this measurement, the algorithm behind the digital twin can be adjusted.
  • Operating signals from different equipment. Several situations can occur in the production and demolding process. The digital twin must always know the real state to work on solving the problems detected. Therefore, it is necessary to have the signals that show how the line is working. Some of the most important signals are those that communicate the activation of a by-pass, vibrating device, and cooling drum.
Part of this information is extracted by the new sensors that are detailed below and shown in Figure 2 and Figure 3.
  • Temperature sensor at the end of the production line (T0). This sensor is in charge of determining the temperature of the mold cup. Specifically, this sensor provides information about the filling of the mold. If the mold is full, it detects the temperature of the metal. However, if the mold is empty, it detects the temperature of the sand (a much lower temperature).
  • Temperature sensor at the entrance of the cooling drum (T1). This installed sensor is proposed to improve the temperature values at the entrance to the cooling drum. Thus, together with the value of the sensor marked as T0, the reality can be better adjusted.
  • Temperature sensor at the cooling drum outlet (T2). This sensor captures the temperature of the sand that has been separated and leaves the cooling drum. This sensor can detect the empty belt before the cooling drum stops, therefore, the system must be able to identify this special situation.
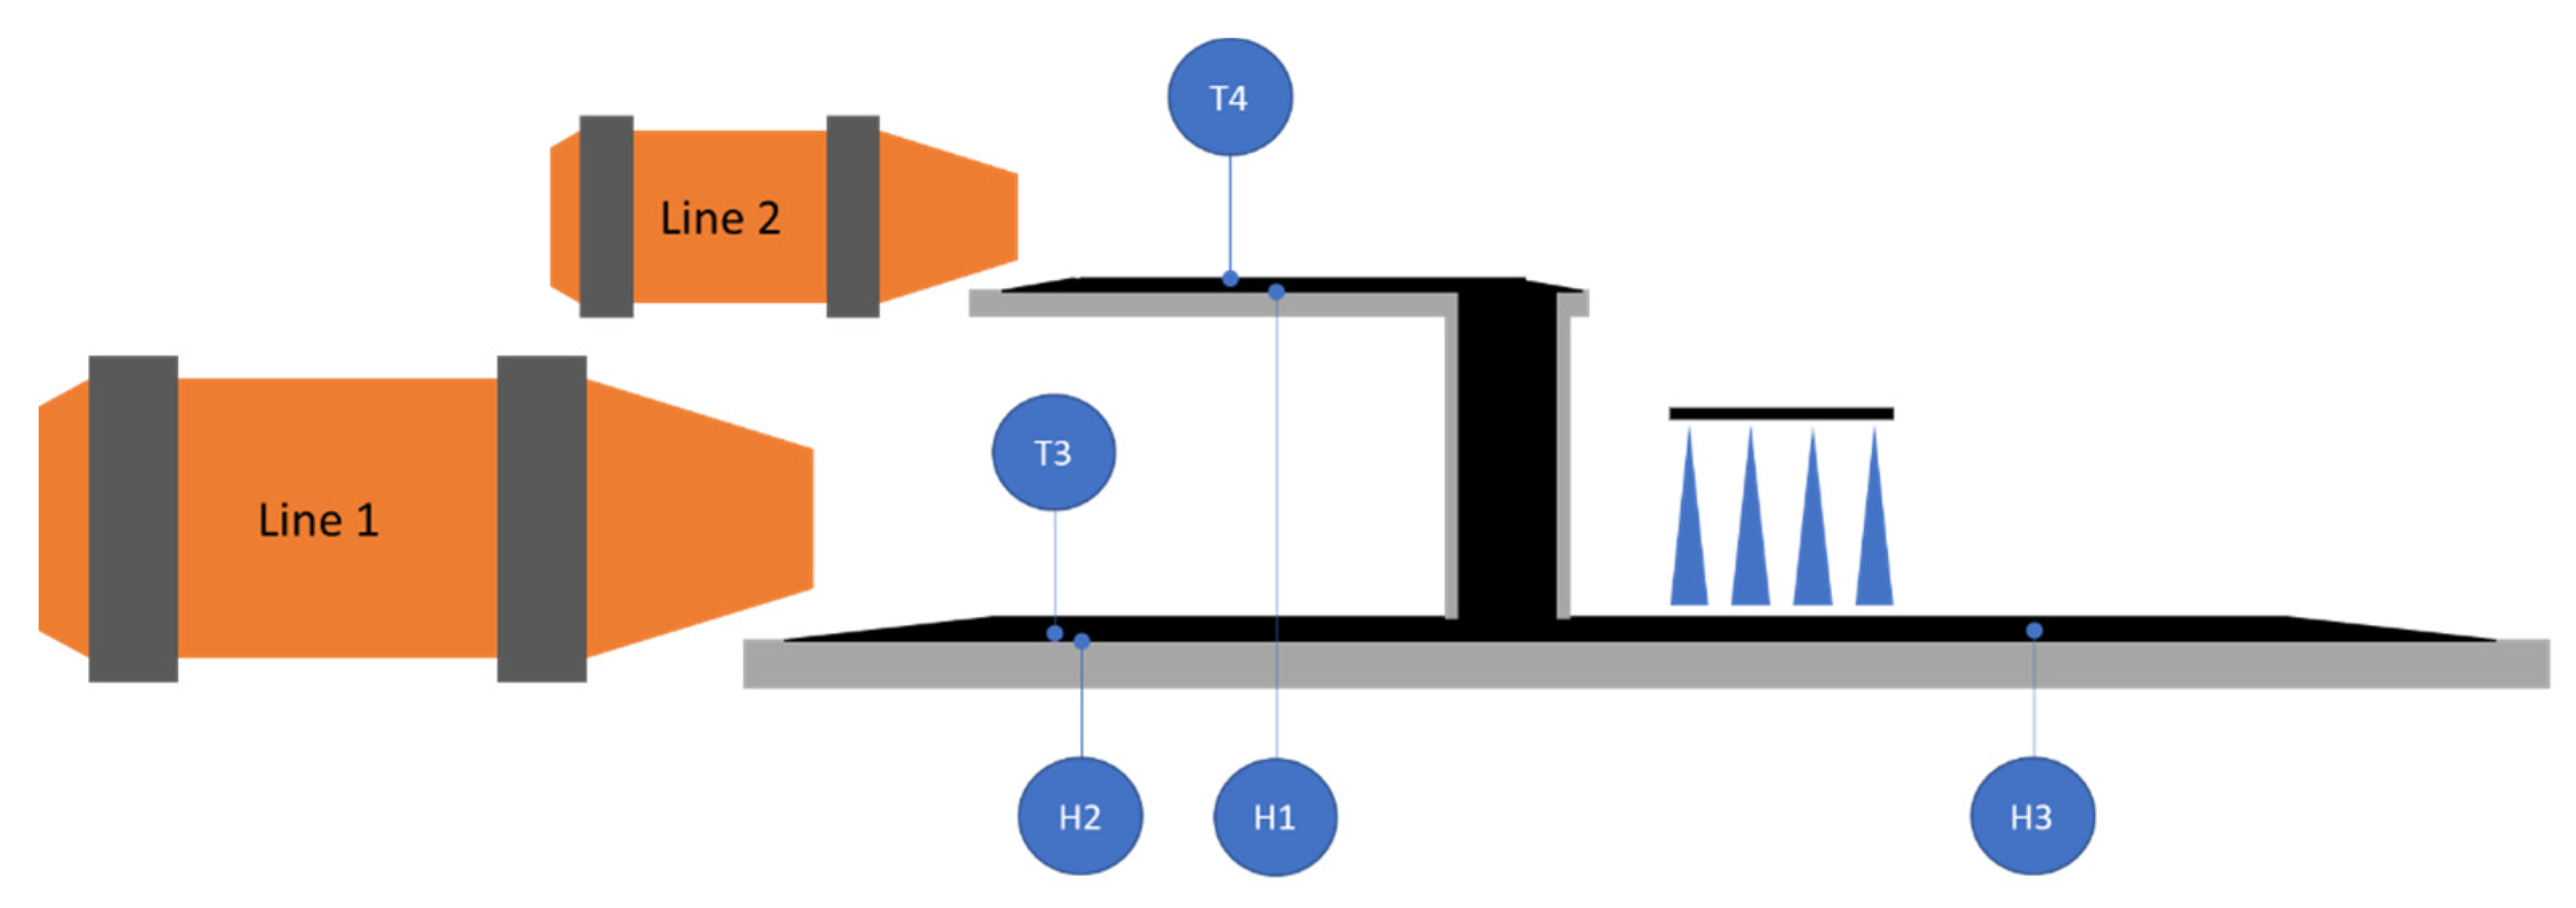
  • Temperature and humidity sensors on the conveyor tapes. Temperature sensors (T3 and T4 in Figure 3) and humidity sensors (H1 and H2 in Figure 3) are installed after the sand exits each cooling drum before the unification of the tapes. These sensors stop/restrict the addition of water in the drum if the humidity is too high. Finally, an extra humidity sensor (H3 in Figure 3) is added after some water showers before the sand is transported to the silos.
All the information from sensors was retrieved and stored in time series databases that allowed us to manage and graph the information in a line graph that helped to extract patterns and parameters to be managed by the digital twin.
For information purposes, we must make an important reflection related to timing, durations, and other aspects associated with the date and time variables. There are many servers, entities, databases, and software that must maintain temporary synchronism to avoid problems in subsequent measurements and evaluations.

2.2. Representation of the Digital Twin

In order to generate a tool capable of determining the amount of water that must be added, it is necessary to know the flow of sand and metal that is traveling in the line, the vibrating device, and the cooling drum. To do this, based on the data that we are capable of collecting and managing in real time (described in the previous subsection) a digital twin is generated. Specifically, our approach was to digitally reproduce the situation of molds in the area between the end of the line (marked by the mold cup sensor, T0 in Figure 2), the vibrating transport belt, and the first part of the cooling drum (part or section where the smart software can act).
Hence, our digital twin was formally defined with S B C being the set of z discrete molds after sensor T0, where x i has v i variables ( v i 1 ,   v 2 , , v z ) representing the mold, and V is the set of n + m molds ( n for vibrating device and m for cooling drum), of v i variables that bind the output of S B C { x n , , x 2 , x 1 }     V { x n , , x 2 , x 1 , y n , , y 2 , y 1 } for displacements n > | S B C | and provides the shake out time variable. Specifically in this use case, n > | S B C | = 4 and | V | = 50     n = m = 25 .
In order to reproduce the current situation of the manufacturing process, the digital twin must be able to model the movements of the molds. In this way, it performs event-based management. The digital twin acts under the following events:
  • The first event is the shake out or mold drop. The digital twin has subscribed to the storage (database) of the molds extracted with the sensorics previously mentioned. Once a mold falls from the SBC, it passes from the cooling line to the vibrating device that transports it to the cooling drum. In that moment, the digital twin receives that event from the database and triggers a series of tasks to represent the current state and do the associated calculations. Then, upon this event, the digital twin retrieves the new mold that is under the temperature sensor and advances all the stored molds in its FIFO type queue that represents the end of the SBC.
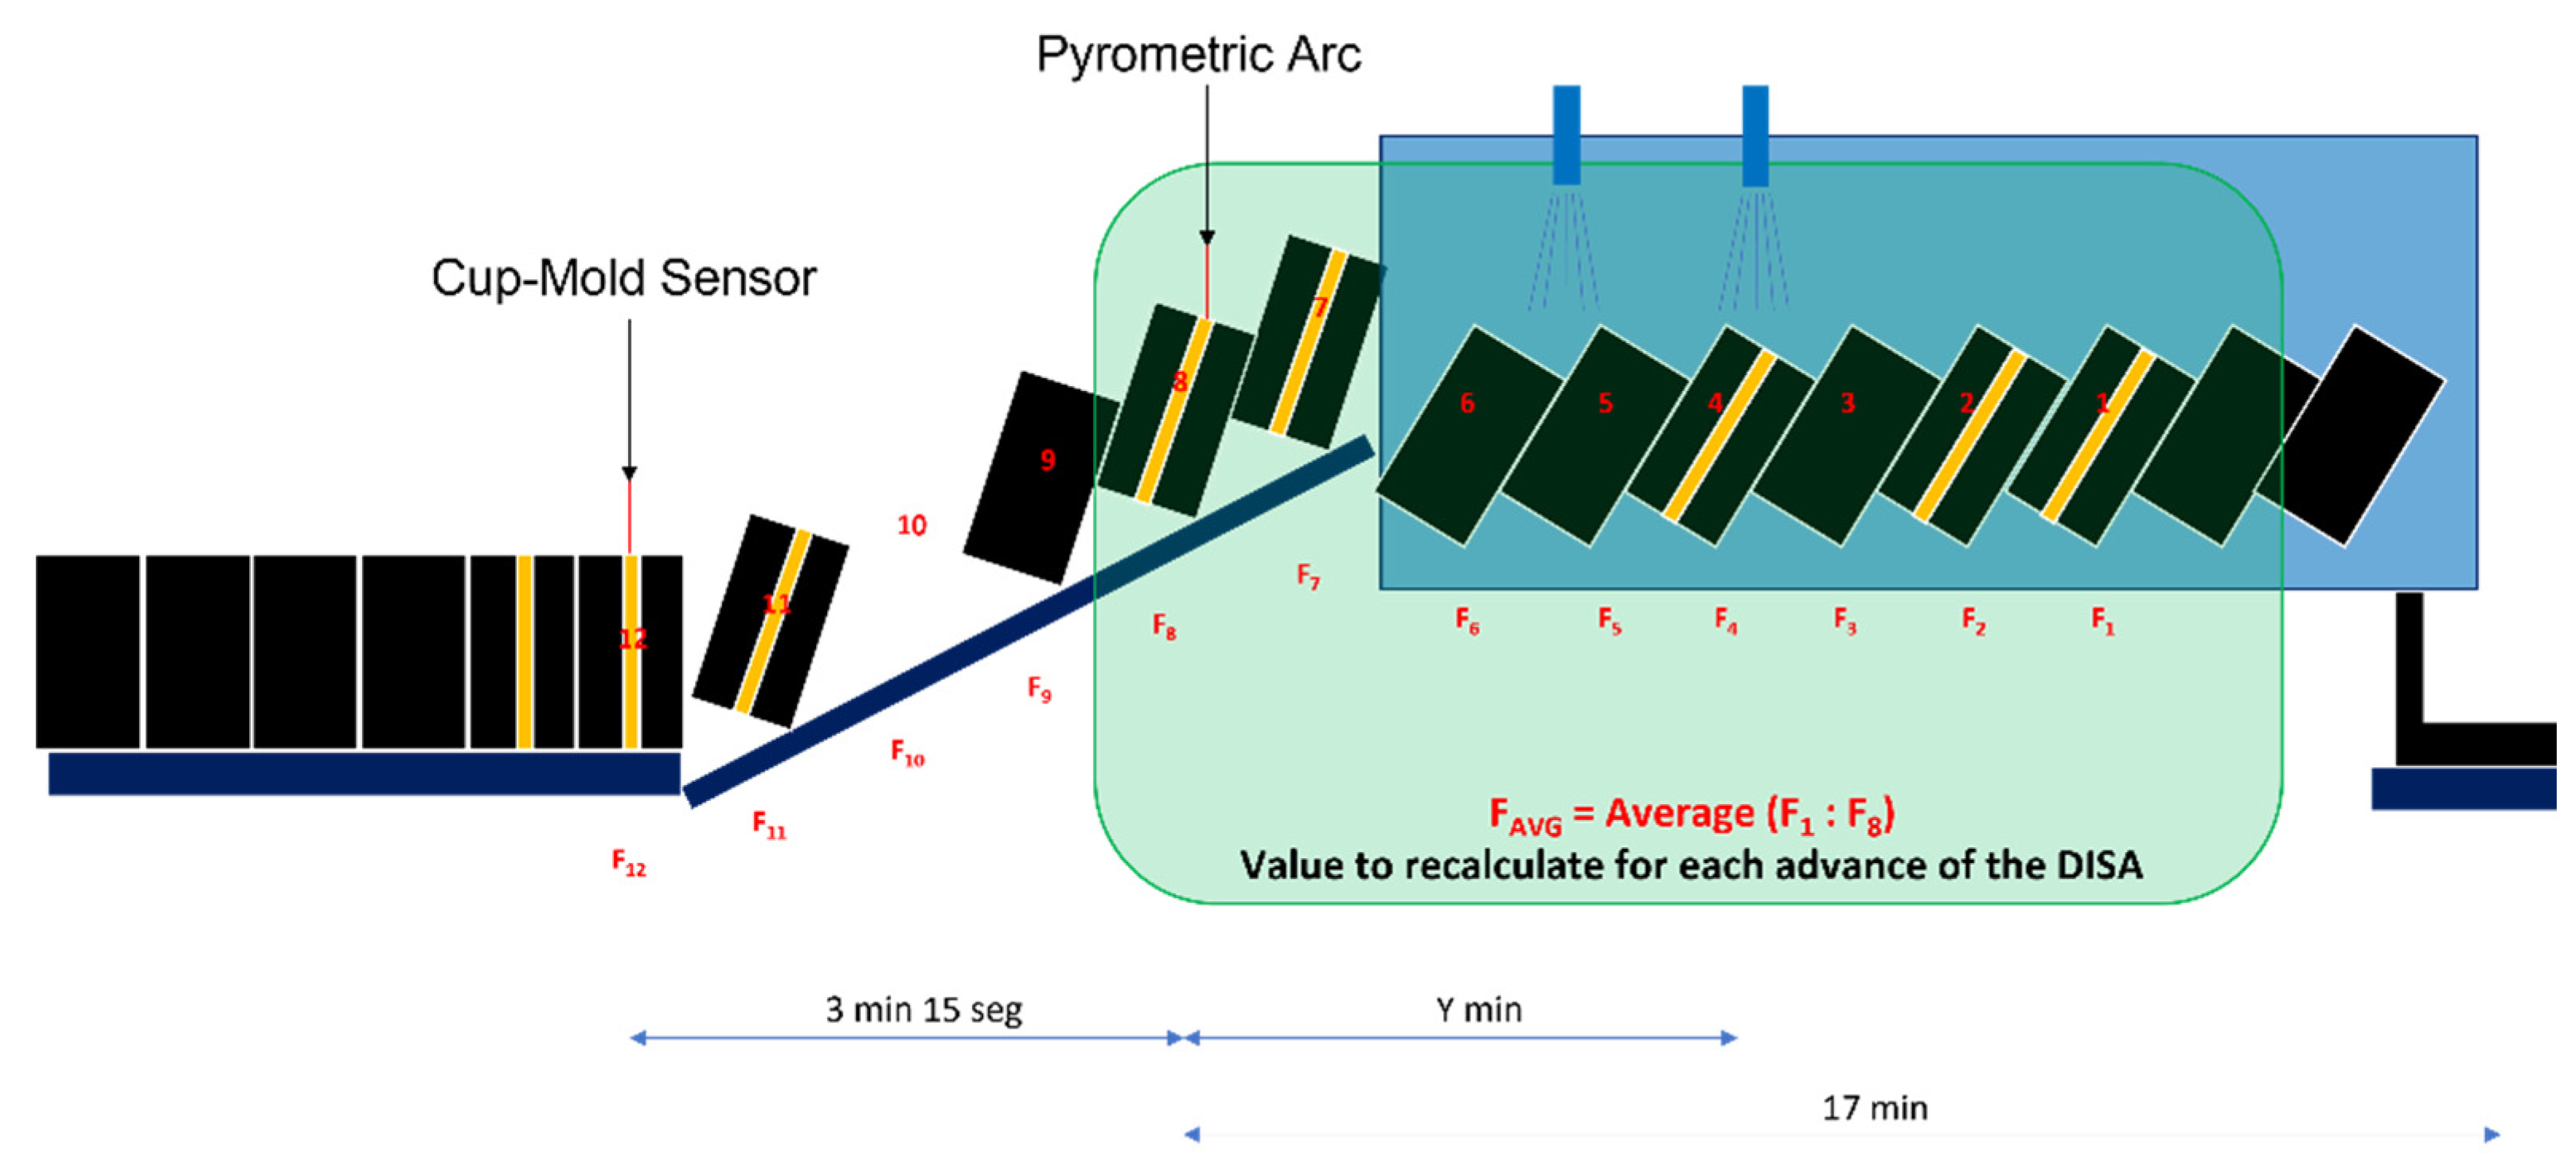
  • Before an advance, if the SBC is full, one of its molds will fall into the vibrating device. Therefore, the digital twin deques a mold from its SBC FIFO queue to enqueue it into its vibrant FIFO queue, moving forward all the molds stored there. To model the advancement of the molds in the cooling drum, real measurements were made on this vibrating device and the time that a mold needs to travel through it. Our measurements indicate that it takes approximately 3 min and 15 s to travel through the entire device. In addition, in the case that concerns this research work, a digital representation of 25 molds was applied to approximate it. These values were prepared to be parameterized and to make it easier to extrapolate the solution to the second line of the plant or to other plants.
  • The time elapsed without falling molds is another event. Given all the possible situations during the day-to-day production line, it can be found that the SBC is stopped but the vibrating device and the cooling drum continue working. This situation translates into advances in the content of the vibrating device without being real molds. In other words, it is a creation of empty slots that move the content of the device. Therefore, concurrently with the shake out events, verification processes to manage these movements are maintained. Thus, if a pre-established time passes (in the use case that concerns us, they have been defined as 14 s), the digital twin advances all molds located in the vibrating tape, introducing a blank gap that simulates the real advance.
Under this movement management, there is another special situation related to the activation of the by-pass. In this case, despite the fact that the SBC advances and creates new molds, these new molds do not fall into V . Thus, they will disappear as long as the signal is not deactivated. Intrinsically, the non-existence of the fall of those molds will generate new holes in the vibrating device to compensate for the advances that have been made.
Once the digital twin has been able to represent the reality of the molds, it is necessary to characterize each of them to provide information to the digital twin, that is, it is necessary to define the v i variables ( v 1 , v 2 , , v z ) that define them. To do this, we worked on the different aspects that are explained below.

2.2.1. Dwell Time

Within the set of v i variables of each mold, we find two time-related variables assigned by the molding machine [23]. These variables are the time in which the mold was poured (more accurately, the pouring time) and the time of falling from the SBC to the vibrating device (specifically, the shake out time). As previously explained, when the shake out time variable is informed, the digital twin starts the calculation process associated with (i) updating the digital mold queues and (ii) calculating the water adjustment. Based on these data, a new variable is created that represents the time passed since the mold was poured. This is what we call “dwell time” and is calculated by subtracting the time of the advance instant from the pouring time. In each of the advances that occur in the line, this time is recalculated and updated. In this way, both digital mold sequences are updated and adjusted to what is happening in the real world. This method allows us to consider the dwell time of all those molds that are in the vibrating-cooling drum ensemble.
This variable is used to be able to adjust the temperature of both the sand and the metal. In other words, the longer the mold is in the cooling line, the lower the temperature of both the sand mold and the metal. To take into consideration of this effect, a factor F [ 0 1 ] is created (the longer the mold is on the line, the lower that value). F is calculated as shown in Equation (1):
F = [ 0.355   ·   ln ( D w e l l   T i m e ( min ) ) ] + 2.4713 ,
However, and as a special case, if the dwell time is less than 60 min, the formula is not used, and the highest possible value is directly assigned.
Equation (1) is extracted through a logarithmic regression process on real data obtained from the production process (more information on data extraction and its use in Section 2.1).
The digital twin can manage two modes of operation. In the first mode, it calculates the permanence from the casting until the moment in which it falls to the vibrating device. In the second mode, the dwell time does not end until the mold leaves the cooling drum. The difference between both is that, while the first mode is static (as soon as the mold starts in the vibrating device, the F factor is set and it does not receive any update), the second mode is dynamic, and it adjusts better to production stops. For example, in case there is a stop in the vibrating device or in the cooling drum, if the calculation is made using the first of the mode options, its F factor will not change. However, by using the second mode, the factor continues to be updated over time. Hence, the temperature approximation is more accurate. This second mode is the method that has been activated by default in our system.

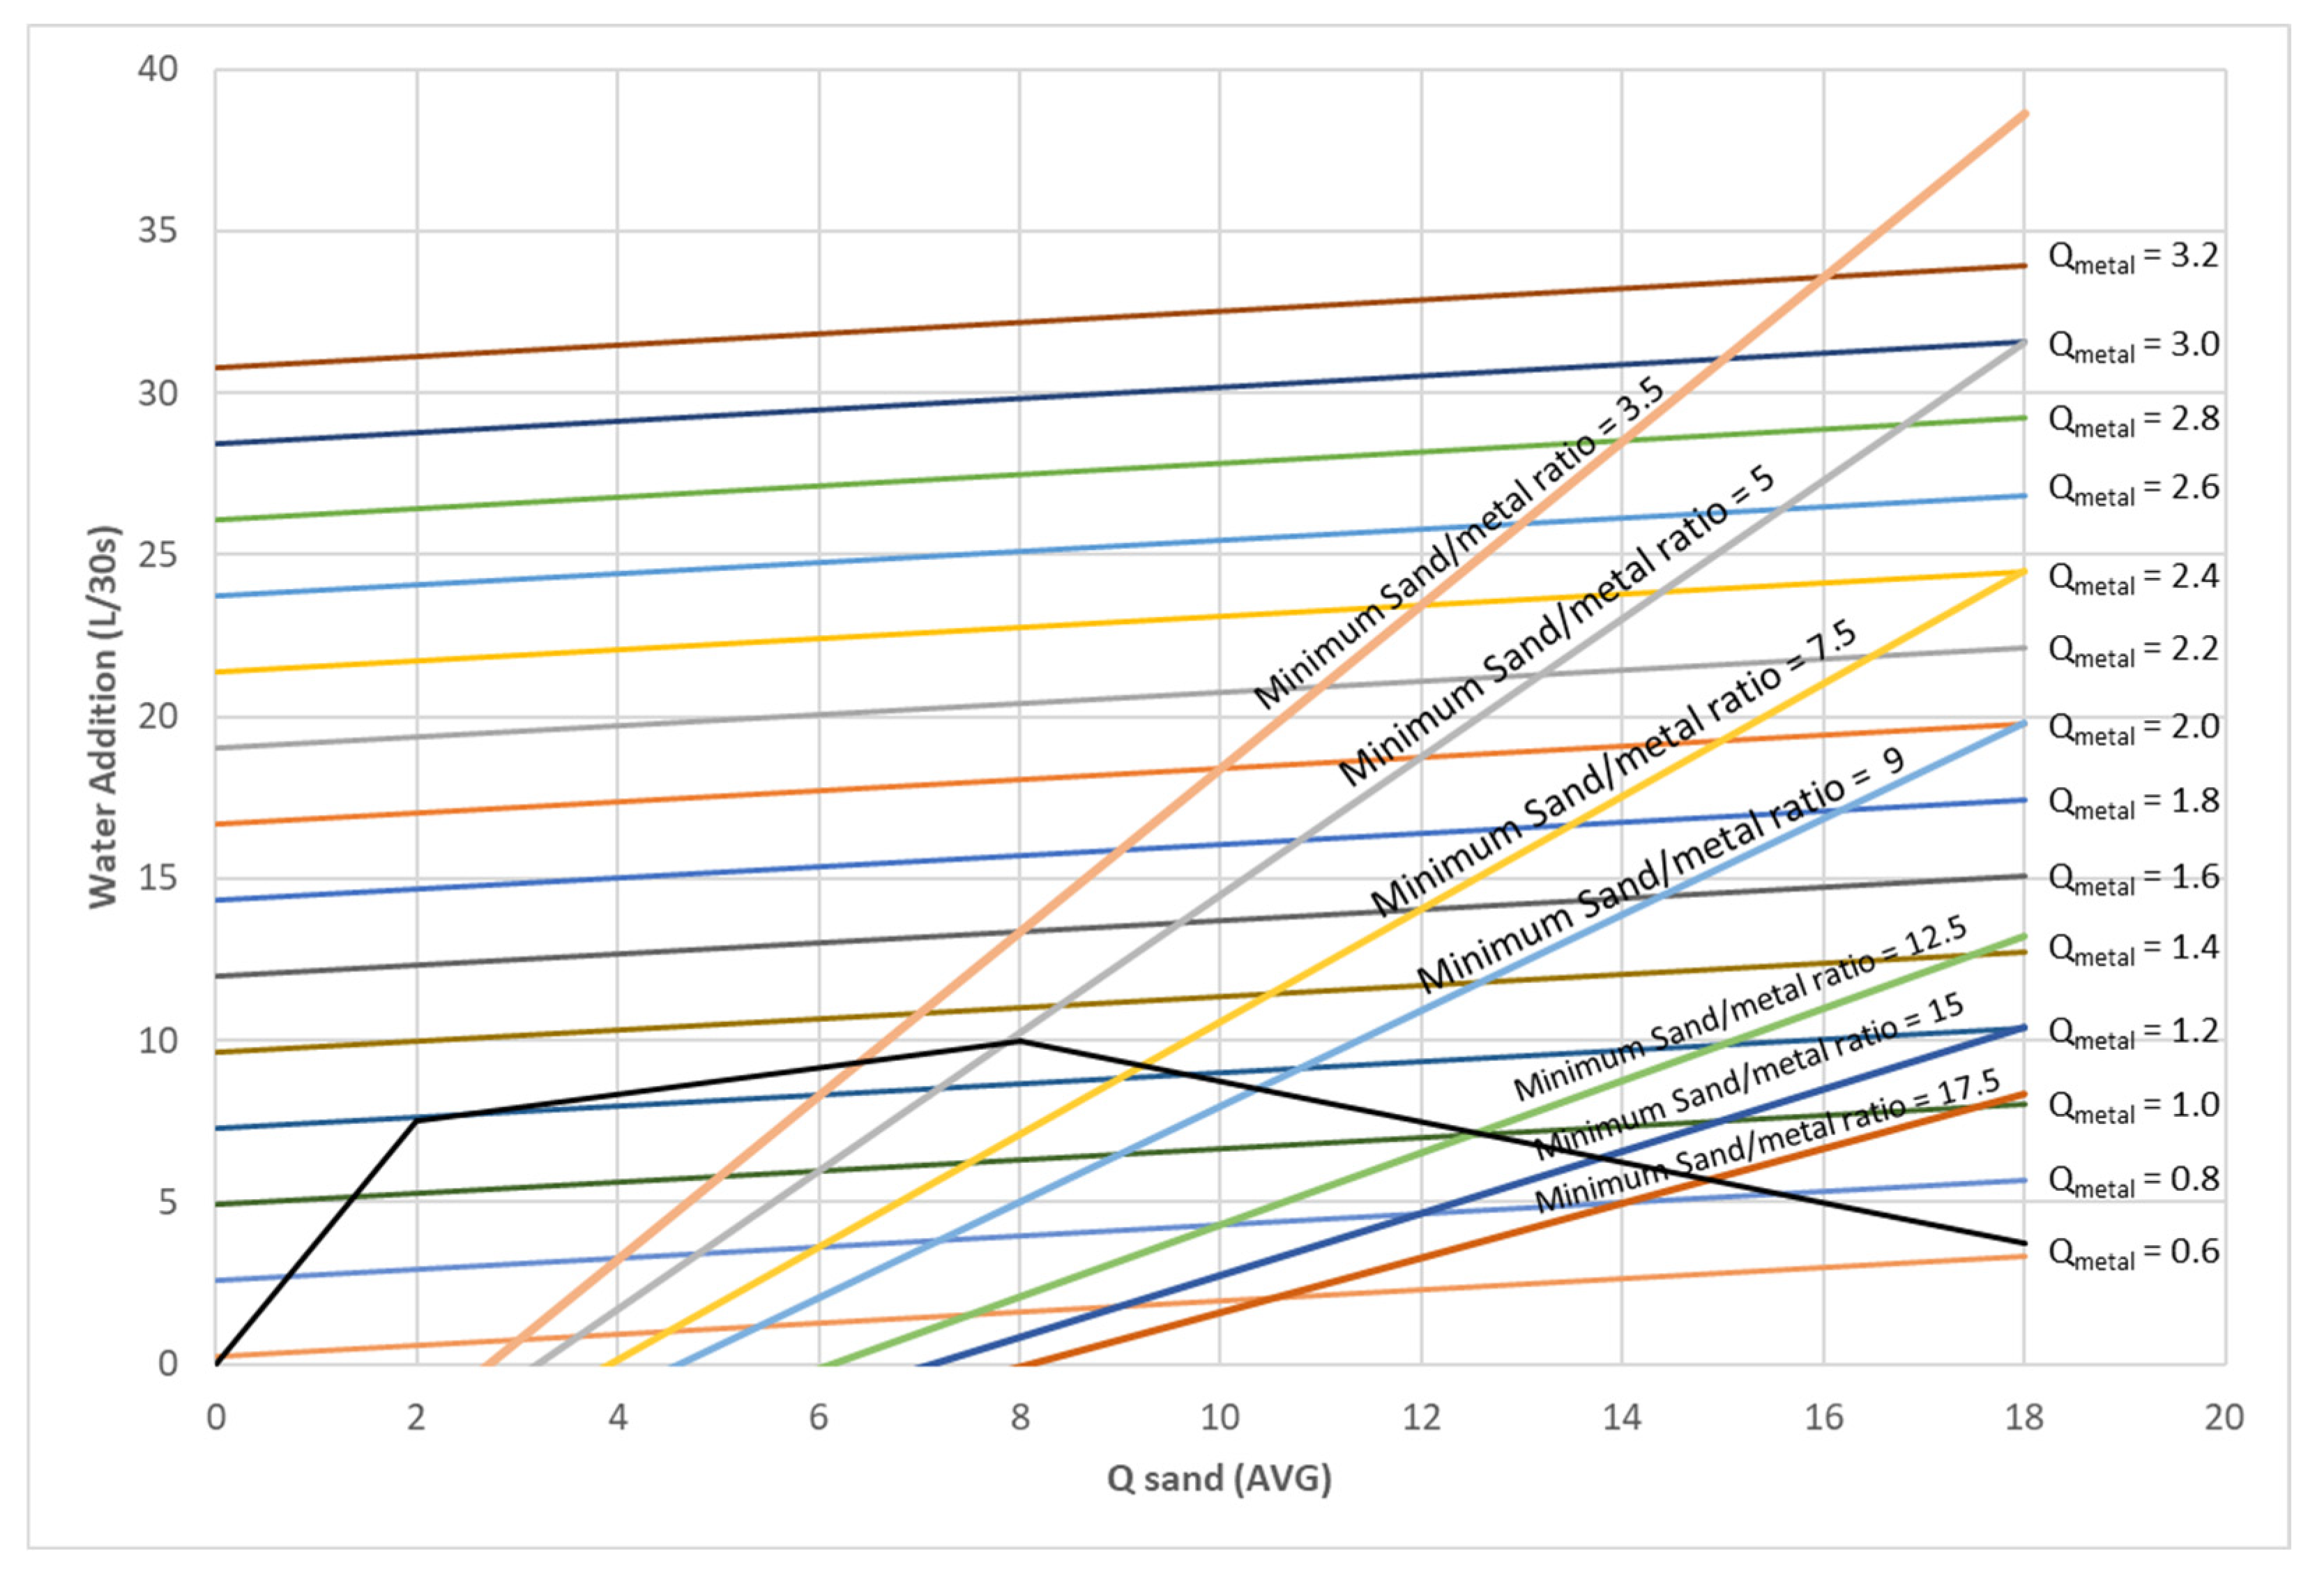
2.2.2. Sand and Metal Flows

All the adjustment calculations that the digital twin has to perform are directly affected by the flows of sand and metal that end up entering into the cooling drum.
To calculate the weight of the sand in each mold, we start from the dimensions of the molding chamber (specifically, its width and height) and the thickness of the mold generated (data obtained and captured by the molding machine itself). In this way, starting from the premise that compacted sand has a density of 1.6 gr./cm3, the amount of sand in each mold is calculated as follows [24]:
S a n d w e i g t h ( kg . ) = [ x · y   · d e n s i t y   · ( t h i c k n e s s / 10 )   ] 1000 ,
where x and y are the width and height of the chamber, respectively; d e n s i t y is the data indicated above, and t h i c k n e s s is the value that characterizes the specific mold and has been given by the molding machine. Moreover, the formula is completed with some adjustments to transform the mm and gr to kg .
The weight of the metal is determined using the weight of the casting bunch (i.e., weight of all the castings, the feeding system, and the filling system) and the premise “full/empty” mold. While the weight of the plate has been generated by the foundry’s engineering department and has been recorded in a database that the digital twin is able to look up, the way to establish whether a mold is full or not is through the employment of the sensor T0, as shown in Figure 2. Specifically, depending on the time the mold remains in the molding line (factor F detailed in the previous section) and the temperature recorded by the aforementioned sensor, we apply Equation (3), obtained experimentally, to define the limit temperature that we have to use to determine the mold situation. This function is created as a function of the dwell time:
T e m p l i m i t = [ 5.617   ·   ln ( D w e l l   t i m e ( min ) ) ] + 69.709 ,
On the one hand, if the temperature recorded by the sensor is higher than the limit temperature obtained through Equation (3), the mold is considered to be full, and the weight of metal recovered from the storage systems will be applied. On the other hand, if the temperature is lower than the limit temperature, it is defined as an empty mold, indicating that the weight of metal is zero.
From that moment, each of the molds is assigned a specific and concrete weight of sand and metal. Knowing these weights, the production flow can be calculated, considering the time elapsed between the fall of the previous mold and the current mold to the vibrating device. In this manner, we have the theoretical amount of sand and metal that passes per second in the vibrating device and that, in a short period of time, will end up entering the cooling drum.

2.3. Uncertainty Management and Adjustments

The biggest problem that these types of systems have to face is the accuracy in the representation of reality. The system can be highly tuned, but there is always an entropy that ends up making it untuned. In order to deal with this fact, we detected the following situations during our system definition and testing:
  • Lag in the time shake out parameter. During the analysis of how the molding machine works, its behavior, and the information generated, we have detected a lag in the shake out time. Specifically, it is about 9–12 spots. In other words, when a mold falls to the vibrating device, the system indicates that fall between 9 and 12 advances later.
  • Error generated by the molding machine due to dimensional variations in the cooling line. This is corrected through a configurable factor in the digital twin itself where, specifically, the fall is made 10 molds later than the molding machine indicates.
  • Average of the weights. Although molds come into the cooling drum in sequence, there is uncertainty about the progress of the molds inside the cooling drum. In addition to this unknown, the addition of water is carried out on a series of molds, and not only on one mold. Therefore, researchers have decided to average the flows of a series of molds, which are located in the initial area of the cooling drum. In this way, it is possible to avoid or minimize the possible error that is generated in the assumption of the positioning of molds in the vibrating device and cooling drum.
In our particular research work, we created an average of 25 consecutive molds. Figure 4 graphically summarizes the calculation of the average sand and metal flows.
Every time the molding machine makes a delivery, a movement is generated in the whole line, therefore, a new mold falls on the vibrating device. In this way, in the digital twin, the molds advance in the sequence, that is, a new mold enters inside, all existing molds also advance one position, and the last mold leaves the sequence. The length of this sequence is parameterizable, facilitating the extrapolation of the solution to different sizes of vibrating devices and cooling drums.

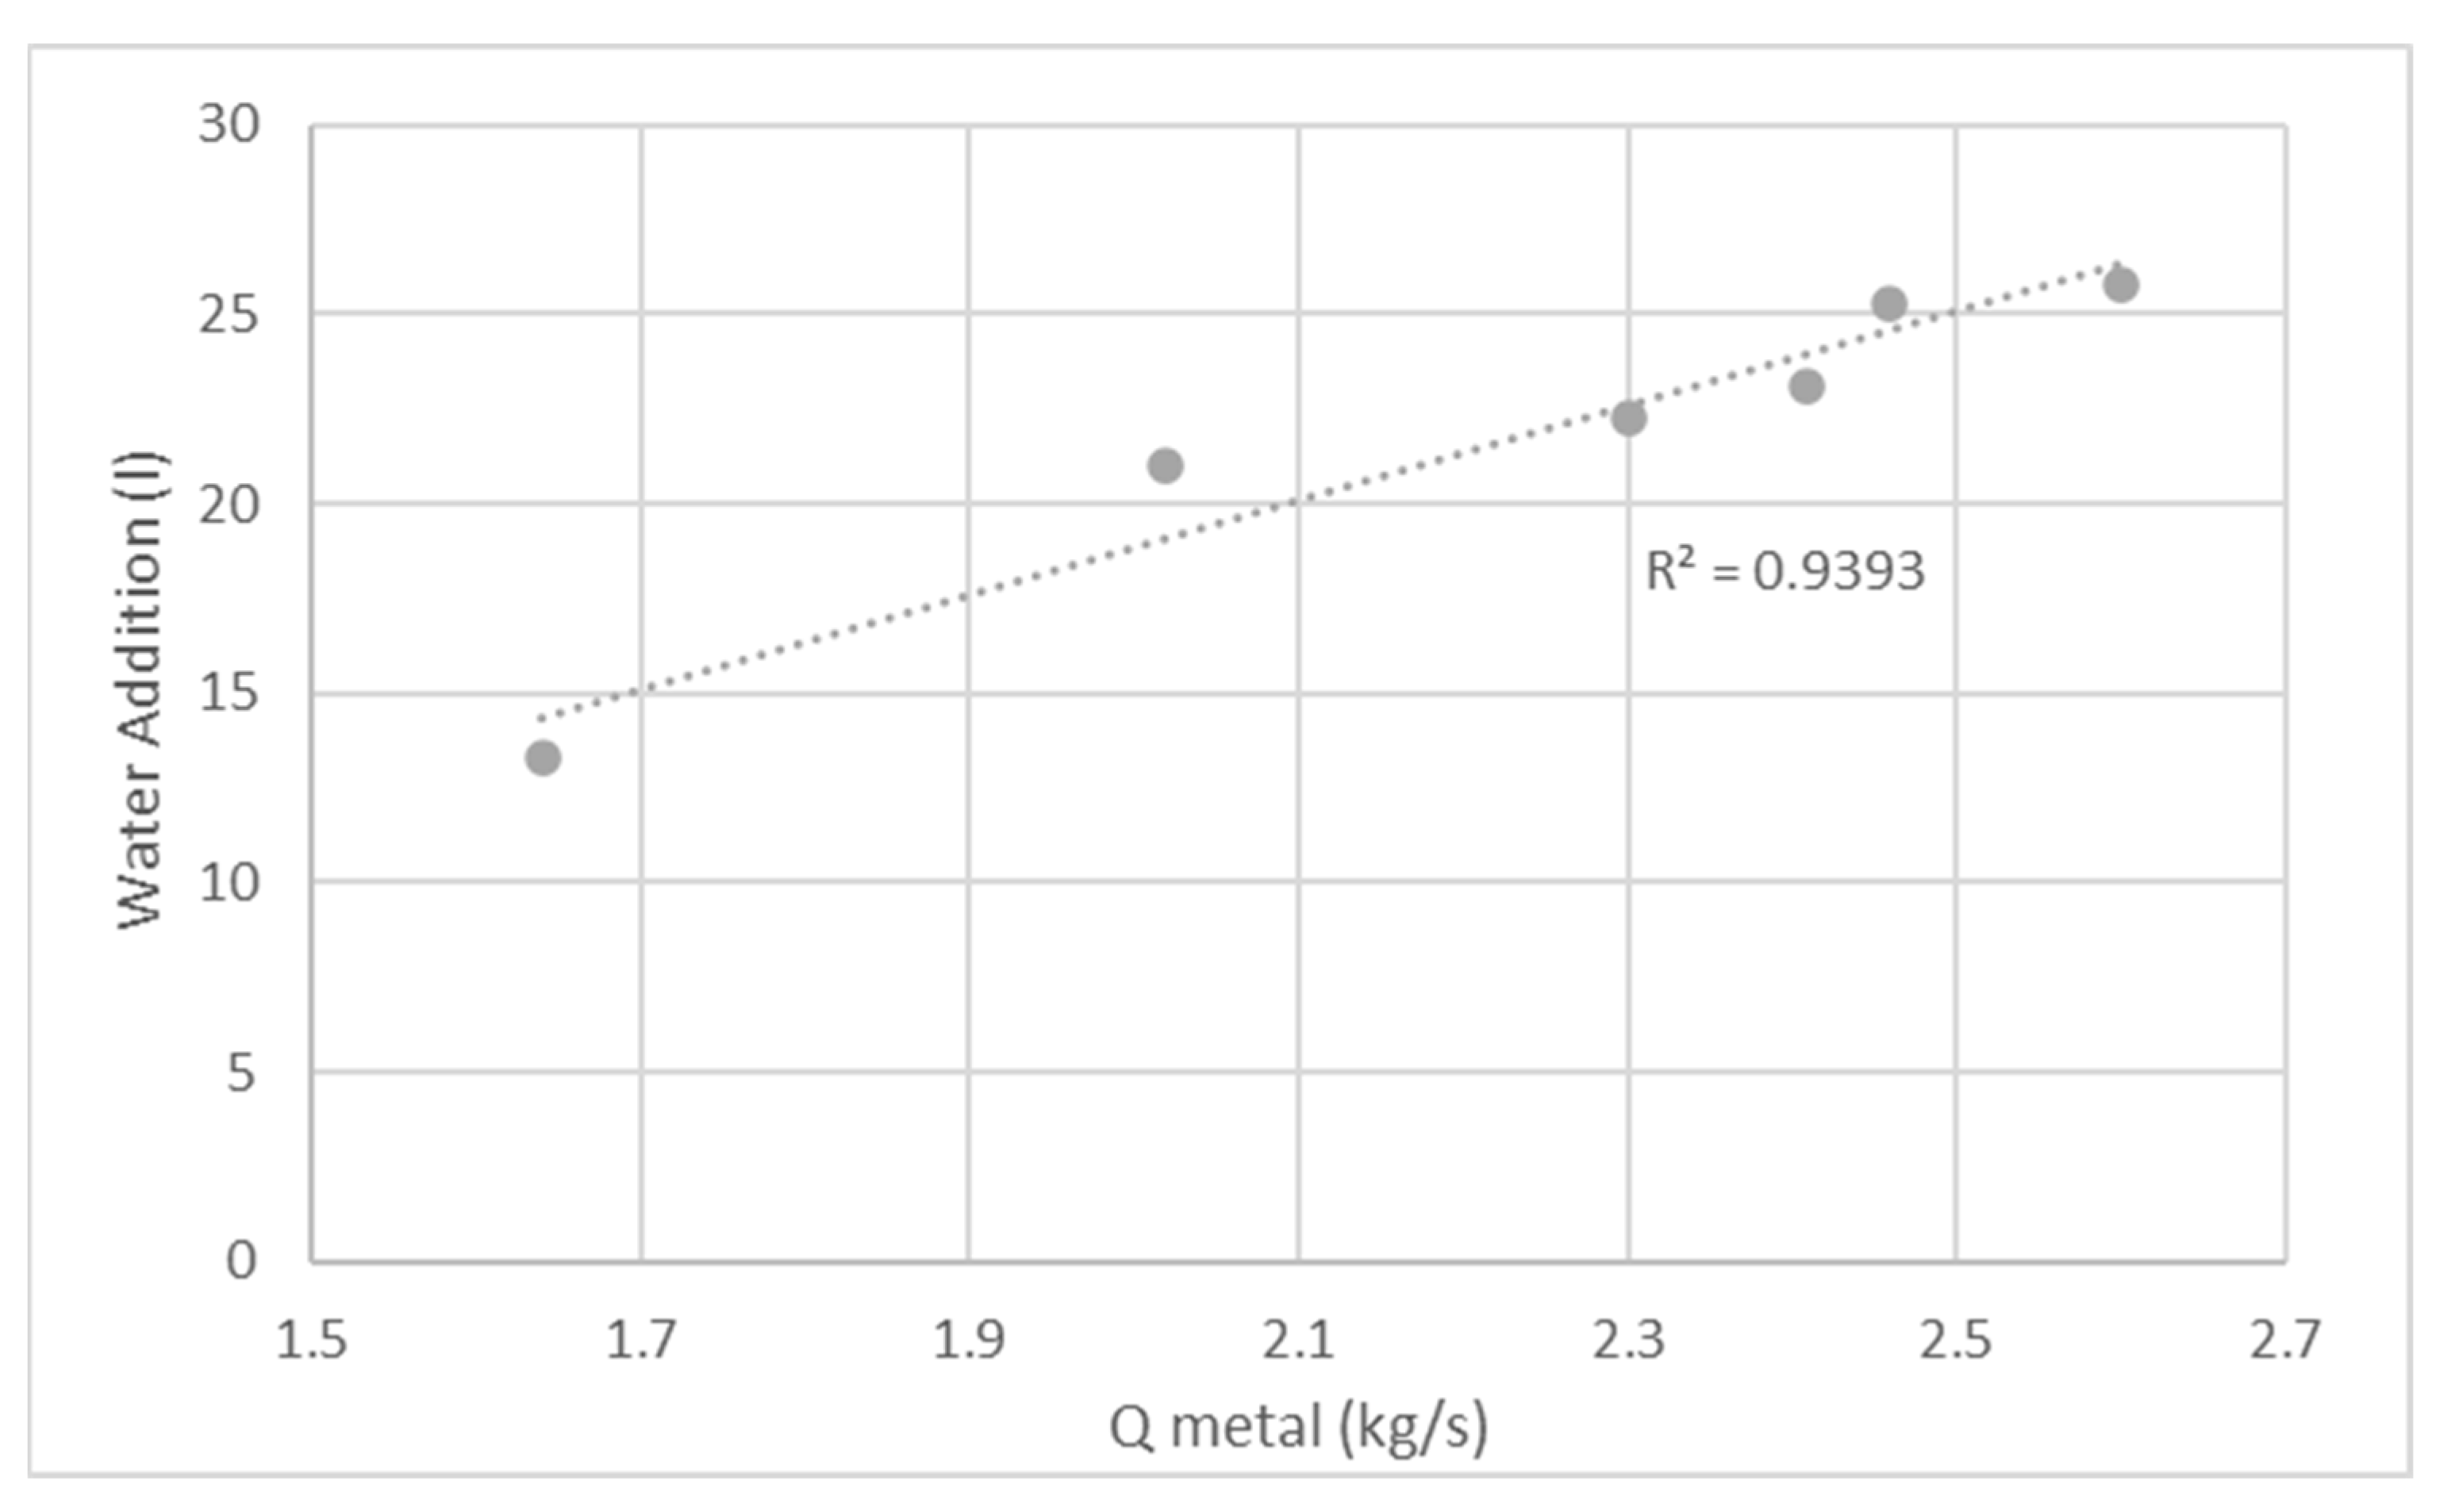
2.4. Prediction or Regression Function

As was detailed at the beginning of this section, the digital twin must be able to derive a solution that improves the real environment of the production process. Until now, all the detailed work has been oriented towards the identification of the state of the process and the characterization of the elements or entities to take into consideration the optimization task. Notwithstanding, this section tries to complete the job by detailing the calculation algorithm that will provide the number of liters that must be added in the cooling drum in order to keep the return sand temperature controlled.
Thereby, once the average sand and metal flows of the n molds of the initial part of the cooling drum have been determined, we execute the main equation of the algorithm that will indicate the value to add. To achieve this equation, different situations of stability of the machine were studied in which the outlet temperature of the sand was 60 °C. In these situations, the average flows of sand and metal that occurred 15 min earlier in the cooling drum (estimated time necessary for the pieces to pass through the device) were calculated, a posteriori, and the amount of water that was added to achieve that temperature. The following graphs show the direct relationship that each flow rate has with the addition of water. Specifically, Figure 5 and Figure 6 show the correlation between Sand and Metal. Both graphs are using calculated flows by the digital representation.
Starting from these data, a mathematical equation is obtained that relates the flows and the addition of water (Table 1) where:
  • Coef indicates the estimation of the numbers that accompany the regression;
  • Error indicates the variation that the estimation of the coefficient has, which is important when determining the significance;
  • r2 indicates how well the model fits; its value range between 0 and 1, and the closer it is to 1, the independent variables explain a greater amount of the variation of the dependent variable;
  • Sresidual is also known as the standard error and corresponds to how much the variables deviate from the prediction made by the regression;
  • F indicates if all the coefficients of the regression, jointly, are different from zero;
  • d.f. is the degree of freedom which is the number of degrees associated with the sources of variance;
  • SCReg/SCRef is the relationship between the regression sum of squares and the residual, the lower this ratio, the better the data fit.
Figure 7 shows the above equation (explained in Table 1); the black lines indicate the minimum addition that must be made at each moment, as long as the addition is less than that proposed by the equation. These minimum water additions are defined from the situations analyzed during the validation tests of the water addition equation.
For those molds with a prolonged dwell time in the molding line, and therefore, lower sand and metal temperatures, a factor ranging from zero to one is developed through an equation. This factor multiplies the result of the equation of the addition of water (Figure 8). For times less than 60 min, the factor remains at one.
Consequently, as a summary, the equation of water additions ( W A ) is as follows:
W A = F · ( 6.844 + 11.7585 · Q m e t a l + 0.1734 · Q s a n d ) ,
As was previously explained, the system calculates the addition of water each time a new event occurs, that is, each time a mold falls into the vibrating device or despite not falling, the vibrating device is activated and a “hole” is generated. It is at this moment when the formula is launched, and the digital twin provides the solution that has to be carried out in the real world to keep the process and return sand temperature adjusted.

2.5. Management of Special Cases

During the production process, special situations may occur, and some work must be carried out to avoid the occurrence of high temperatures or episodes of mud. Below, we detail those situations and how the digital twin handles them.
  • Vibrating device activated when SBC is stopped. When the vibrating device is activated and the line (the SBC) is stopped, there is a situation in which there is no shake out of molds that fills the queue of the vibrating device. Thus, after determining the status of the line, that is, if the vibrating device is working (capturing the digital signal from the hardware device) and the SBC is stopped (we do not detect shake out events of the molds), a temporary evaluation is carried out (18 s from the last drop of a mold) that determines if we should represent the progress of the vibrating device with a “hole” or “ghost mold” where we do not have sand or metal. Each of these generated holes occupies a segment of the sequence with a sand and metal flow rate of zero.
  • By-pass and vibrating device activated. This case is similar to the previous one. When the by-pass is activated, molds are recovered before falling to the vibrating device. Thus, in this case, “holes” are also generated. As in the previous case, these “holes” or “ghost molds” are generated with a flow rate of metal and sand equal to zero.
  • Empty molds. The molds considered to be empty at the end of the line do not contain metal, however, they produce a flow of sand. Since this sand is not heated by the pouring of the metal, the mold does not suffer a loss of moisture, therefore, it is not necessary to add more water to it. For this reason, the sand flow of the empty molds is considered to be zero.
  • Starting after stops. After a prolonged stop of the molding line (more than 15 min), a situation of excessive drop in temperature in the molds may occur. For this reason, the system determines a restart process making a staggered supply of water. In this way, the digital twin avoids making excessive additions of water. This approach tries to take into consideration the cooling of the equipment and of the sand inside it. This method tries to avoid high humidity and viscosity, letting the sand be filtered through the corresponding holes.
    The stepwise additions of water were extracted through an empirical process of trial and error. Specifically, Table 2 shows the configuration values.
    With a stop of 15 to 60 min, the additions of water that are made during the first six molds created, start with a multiplying factor of 0.25. The following additions of the next six molds, start with a factor of 0.50, and finally, the additions of water made during the last six molds, start with a factor of 1.
    In the case of a long stop (between 60 min and 5 h), the first additions have a starting factor of 0.25 during the first 12 molds, the next 12 molds with 0.50, and finally, the last 12 molds have a starting factor of 1.
    In cases where the stop is greater than 5 h, the sequence is restarted, and the system must generate the entire sequence of 50 molds again before it begins to provide a value of water to add.
    Again, all these configuration values were extracted from the digital twin itself in order to be able to be modified, adapted, and adjusted, allowing new deployments of the system that we are presenting in this research paper.
  • Molding machine without using sand. When the molding machine works empty, it does not generate any mold, since it executes the cycle without delivering any molds. In these cases, the line advances as if a new mold had been delivered, creating a gap in the molding line. Therefore, the more cycles that are empty, the greater the gap generated in the line. This situation is identified by analyzing the compressibility value provided by the molding machine. When this parameter offers a value of zero, the machine works without load, while a positive value indicates that the machine has pressed the sand during the corresponding cycle. These generated voids are subsequently undone on the line with real machine cycles (compressibility > 0) without the SBC molds advancing. Although these registered gaps appear in the database, the system does not consider this information, since the gaps generated never reach the end of the line. For this reason, the software is designed to avoid this kind of molds. Note that the molding machine usually marks the shake out time of all these molds with compressibility at zero, practically at the same time or does not mark them. This fact facilitates their processing.

2.6. Feedback to the Plant

The proposed approach described in this research is capable of generating a series of information (i.e., water addition liters) that must be transferred to the real systems that govern the plant. In this way, the digital twin has been connected to the SCADA deployed in the plant as follows:
  • Data Storage. Every time there are advances in mold sequences (both in the cooling line and in the vibrating device or cooling drum), the digital twin triggers the calculation process and logs everything into a database. Specifically, there is a table in which the input information used as raw data is recorded (in other words, the information that represents the current state of the process, which has been used for the calculations) in addition to the proposal made by the developed digital system.
  • SCADA modifications. The existing SCADA system has been modified. Specifically, it includes a new functionality that allows users to use our new suggestions or those already made by the old system. When the use of the digital twin is activated, the SCADA system accesses the database where the suggestions have been registered and employs them to generate the water additions. Otherwise, it uses its less accurate algorithm to add water.
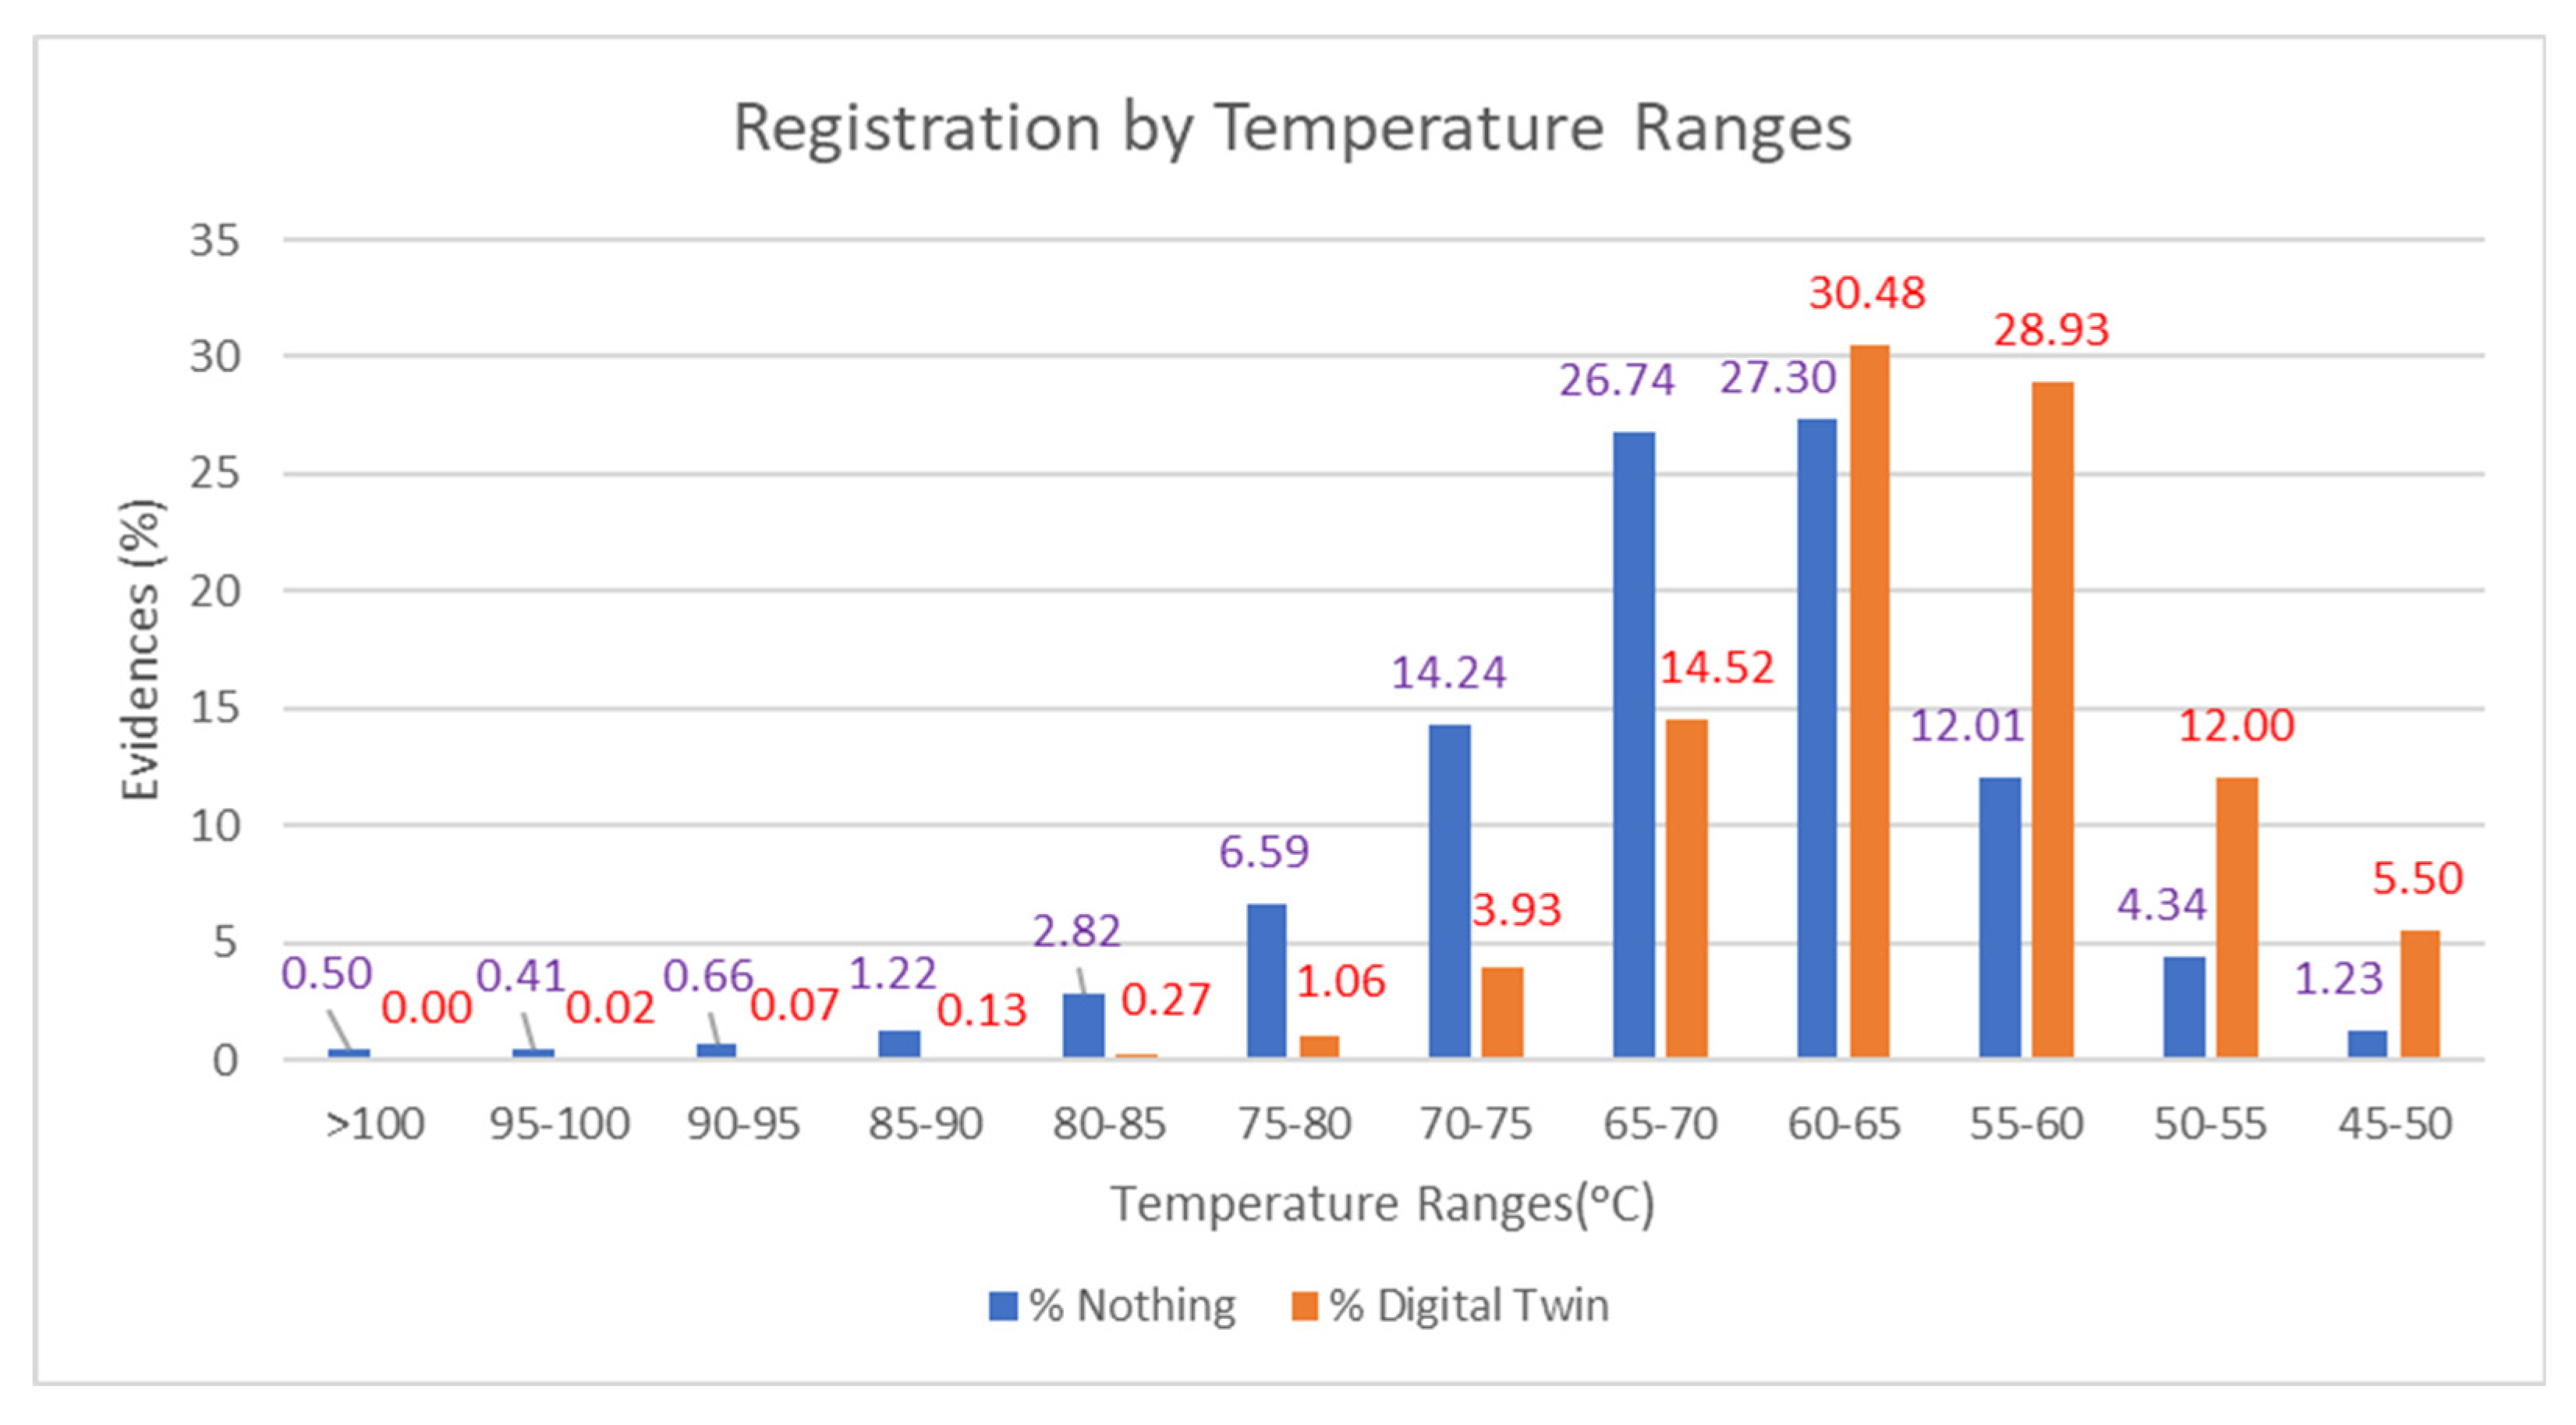
3. Results

Once the digital twin that monitors and supports the cooling process was managed and created, we carried out tests to confirm that its theoretical design really affected the process and achieved a significant improvement. Likewise, the new management method was progressively used and we recovered data to observe what happened.
First, we recovered the data for a specific month, and obtained the following statistical measures to be used to analyze the average functioning and its dispersion.
Table 3 shows a comparison, over a month, in which the digital twin has been up and running; a reduction in the average temperature can be observed. Specifically, this reduction is close to 4 °C. Nevertheless, although it seems like a small reduction, when we look at the standard deviation, we can see that the process is, now, much more controlled and focused. Now, the fluctuations that occur are much lower and the process almost always remains in the same temperature range. Likewise, the high temperature values that exceed 100 °C have been reduced and eliminated. From more than 9000 register counts of this type of temperature generated with the foundry old system, the digital twin has been able to eliminate them. These results indicate that the digital twin produces a high control effect, allowing an adjusted and controlled production process.
Additional observations were obtained from the analysis as follows: By using the digital twin, the probabilistic distribution of sand return temperature was shifted. Specifically, Figure 9 shows how applying the digital twin calculations produced more registers of low temperatures. Specifically, the highest temperatures that occur are in the range of 80 to 85 °C. However, by comparing the number of registers generated in this range when the digital twin was not used, we verify that the reduction is notable. In addition, there are no registers at higher values, therefore, high temperatures were fully controlled.
With respect to the lowest temperature ranges, the graph shows that the number of registers increases, indicating that the general temperature trend is between 55 and 65 °C. Previously, when the digital twin was not used, the predominant temperature range was between 60 and 70 °C, but with a high influence from the adjacent ranges. In summary, Figure 9 illustrates the fall in temperature trends when the digital twin is activated.
Note that temperature values lower than 45 °C have been achieved in both cases. These temperatures could have been reached because the belt was empty or with little sand. Therefore they were not taken into consideration in this evaluation. In addition, if a temperature lower than 45 °C was reached, it could be the case that an episode of mud could be produced. Therefore, the system tries to work avoiding those values.
As a brief summary, the results are clear and the use of the developed digital system reduces temperatures, keeping them more constant and controlled.

4. Discussion and Conclusions

In this research work, the main focus was on designing and creating an advanced system to monitor and control the temperature of return sand in a green sand iron casting process. This process was previously controlled by a less advanced system that was not capable of maintaining a stable temperature. In order to enhance the existing system, our new approach was based on digitization of the plant, and created a digital representation of the current state of the manufacturing process and could calculate the liters of water that must be added to keep the process controlled. Once the calculation of liters was obtained, the digital twin could send the information to the SCADA system that governs the manufacturing plant, which could act on the process by applying the proposed water addition. This method means that operators do not have to worry about the management and control of water additions and sand temperature because the digital twin already does it for them automatically.
The results achieved by the system are impressive. Currently, the temperature remains stable in a controlled range. In this way, the average temperature of the return sand is reduced at least 4 °C and the standard deviations of these values are drastically reduced, showing that the current process is stable. In addition, the apparition of registers in a very high range of temperature values (greater than 100 °C) has been totally eliminated.
Despite the good results achieved, during the real tests in the plant, special situations or cases were detected that the digital twin could face. These situations should become the focus of future work that would further improve the presented approach. Specifically, these situations are the following:
  • The time of year causes variations in ambient temperature, humidity, or other atmospheric factors. These changes mean that, given the same addition value, the real system does not behave in the same way. For this reason, an adjustment factor was incorporated. Hence, an operator could manually reduce or increase the calculated addition values. However, as future work, this factor could be calculated automatically. According to each specific time of the year that the environmental values are collected at a plant, this factor should be adjusted.
  • The digital twin represents the reality as a sequence of molds. It is true that molds are not kept in a perfect sequence inside the vibrating device, but our approximation works. The current parameterization of the system was carried out for a specific case, however, if there were changes in machinery the system would not be adjusted and would not work properly. Therefore, it is necessary to work on a better digitization that could provide enough information to allow the system to automatically calculate the adjustments of the digital representation.
  • These types of systems are sensitive to data. In other words, if the data generated are wrong or contain errors, the system cannot perform its job properly. This can only be solved if data monitoring and validation systems are generated to ensure their quality. Likewise, if there are crashes in the information capture systems or sensor failures, the system would fail, again due to it not representing reality. In fact, maintenance teams take on greater importance to oversee making sure that the complex ecosystem of captors and actuators work properly.
Regardless of these situations and the aforementioned future work, our developed digital twin achieved the objectives defined at the beginning of this research. It allows automated control of the return sand temperature without the use of coolers. In addition, its processing is carried out automatically, eliminating low added value tasks in the manufacturing process. Therefore, the employment of this type of system is the way to improve foundry processes, and especially those that want to be called intelligent processes.

Author Contributions

Conceptualization, B.B. and J.N.; methodology, B.B.; software, D.-C.S. and J.N.; validation, B.B., J.N. and D.-C.S.; writing—original draft preparation, J.N.; writing—review and editing, B.B., D.-C.S. and J.N. All authors have read and agreed to the published version of the manuscript.

Funding

This research received no external funding.

Data Availability Statement

Not appliable.

Conflicts of Interest

The authors declare no conflict of interest.

References

  1. Pattnaik, S.; Karunakar, D.B.; Jha, P.K. Developments in investment casting process—A review. J. Mater. Processing Technol. 2012, 212, 2332–2348. [Google Scholar] [CrossRef]
  2. Fedoryszyn, A. Quality stabilisation of synthetic sand containing bentonite in process lines. Arch. Foundry Eng. 2010, 10, 143–148. [Google Scholar]
  3. Fedoryszyn, A.; Rudy, C.; Smyksy, K. The rationalization of construction and operation of the equipment for the molding sand preparation. Arch. Metall. Mater. 2013, 58, 915–918. [Google Scholar] [CrossRef] [Green Version]
  4. Ayani, M.; Ganebäck, M.; Ng, A.H. Digital Twin: Applying emulation for machine reconditioning. Procedia Cirp. 2018, 72, 243–248. [Google Scholar] [CrossRef]
  5. Kovacevic, L.; Oliveira, R.; Terek, P.; Terek, V.; Pristavec, J.; Škoric, B. i in.: The Direction of Foundry Industry: Toward the Foundry 4.0. J. Mechatron. Autom. Identif. Technol. 2020, 5, 23–28. [Google Scholar]
  6. Sertucha, J.; Loizaga, A.; Suarez, R. Improvement opportunities for simulation tools. In Proceedings of the 16th European Conference and Exhibition on Digital Simulation for Virtual Engineering (Invited Talk), Toulouse, France, 10–12 October 2006. [Google Scholar]
  7. He, B.; Bai, K.J. Digital twin-based sustainable intelligent manufacturing: A review. Adv. Manuf. 2021, 9, 1–21. [Google Scholar] [CrossRef]
  8. Anjos, V.; Vilela, F. The Journey to Olimpo—Description of the work developed by Sakthi Protugal in the pursuit of perfection. In Proceedings of the GIFA 2019 Conference Proceedings. CAEF-Forum (Invited Talk), Sintra, Portugal, 17–19 June 2019. [Google Scholar]
  9. Kozłowski, J.; Sika, R.; Górski, F.; Ciszak, O. Modeling of foundry processes in the era of industry 4.0. In Design, Simulation, Manufacturing: The Innovation Exchange; Springer: Berlin/Heidelberg, Germany, 2018; pp. 62–71. [Google Scholar]
  10. Kritzinger, W.; Karner, M.; Traar, G.; Henjes, J.; Sihn, W. Digital Twin in manufacturing: A categorical literature review and classification. IFAC-PapersOnLine 2018, 51, 1016–1022. [Google Scholar] [CrossRef]
  11. Fuller, A.; Fan, Z.; Day, C.; Barlow, C. Digital twin: Enabling technologies, challenges and open research. IEEE Access 2020, 8, 108952–108971. [Google Scholar] [CrossRef]
  12. Boschert, S.; Rosen, R. Digital Twin—The Simulation Aspect. In Mechatronic Futures Challenges and Solutions for Mechatronic Systems and their Designers; Hehenberger, P., Bradley, D., Eds.; Springer: Berlin/Heidelberg, Germany, 2016; pp. 59–74. [Google Scholar]
  13. Posner, E.A.; Spier, K.E.; Vermeule, A. Divide and conquer. J. Leg. Anal. 2010, 2, 417–471. [Google Scholar] [CrossRef] [Green Version]
  14. Mackey, L.; Jordan, M.; Talwalkar, A. Divide-and-conquer matrix factorization. Adv. Neural Inf. Processing Syst. 2011, 24. [Google Scholar]
  15. Horowitz, E.; Zorat, A. Divide-and-conquer for parallel processing. IEEE Trans. Comput. 1983, 32, 582–585. [Google Scholar] [CrossRef]
  16. Gruzman, V.M. Foundry production digitalization. In IOP Conference Series: Materials Science and Engineering; IOP Publishing: Bristol, UK, 2020; Volume 966, p. 012127. [Google Scholar]
  17. Doroshenko, V.S.; Tokova, O.V. The Examples of Digitalization of Foundry Production: Virtual Engineering, Digital Twin, Additive Technologies. Control. Syst. Comput. 2020, 5, 64–69. [Google Scholar] [CrossRef]
  18. Kleeberg, C. MELTING 4.0 “–DIGITALISATION and DIGITAL CONTROL OF THE MELT SHOP OPERATIONS in FOUNDRIES AND STEEL MILLS. Fundid. Fundic. Ferreas Y No Ferreas En Arena Coquilla Y Fundición A Presión 2021, 267, 20–22. [Google Scholar]
  19. Juran, J.M.; Gryna, F.M. Quality Control Handbook (No. 658.562 Q-1q); McGraw Hill: New York, NY, USA, 1974. [Google Scholar]
  20. Chokkalingam, B.; Raja, V.; Anburaj, J.; Immanual, R.; Dhineshkumar, M. Investigation of shrinkage defect in castings by quantitative Ishikawa diagram. Arch. Foundry Eng. 2017, 17, 174–178. [Google Scholar] [CrossRef] [Green Version]
  21. Chokkalingam, B.; Boovendravarman, S.; Tamilselvan, R.; Raja, V. Application of Ishikawa diagram to investigate significant factors causing rough surface on sand casting. Proc. Eng. Sci. 2020, 2, 353–360. [Google Scholar] [CrossRef]
  22. Luca, L.; Luca, T.O. Ishikawa diagram applied to identify causes which determines bearings defects from car wheels. In IOP Conference Series: Materials Science and Engineering; IOP Publishing: Bristol, UK, 2019; Volume 564, p. 012093. [Google Scholar]
  23. Beeley, P. Foundry Technology; Elsevier: Amsterdam, The Netherlands, 2001. [Google Scholar]
  24. Murthy, I.N.; Rao, J.B. Investigations on physical and chemical properties of high silica sand, Fe-Cr slag and blast furnace slag for foundry applications. Procedia Environ. Sci. 2016, 35, 583–596. [Google Scholar] [CrossRef]
Figure 1. Ishikawa Diagram of cause–effect factors in green sand molding, collected after observations of the process and the addition of expert knowledge extracted from the bibliographic studies.
Metals 12 00730 g001
Figure 2. Diagram showing the end of the cooling line with a mold cup temperature sensor (T0), another sensor at the cooling drum inlet to improve temperature adjustment (T1), and a final sensor (T2) installed on the cooling drum outlet tape.
Metals 12 00730 g002
Figure 3. Diagram representing the temperature sensors (T3 and T4) and humidity sensors (H1, H2, and H3) on tapes at the exits of the cooling drums of both production lines and just before taking the sand to the silo.
Metals 12 00730 g003
Figure 4. Mold sequence diagram in the digital twin and how n = 25 molds are selected for the average weight calculation.
Metals 12 00730 g004
Figure 5. Relationship between the flow of sand with respect to the addition of water when the outlet temperature of the sand is 60 °C.
Metals 12 00730 g005
Figure 6. Relationship between metal flow with respect to the addition of water when the outlet temperature of the sand is 60 °C.
Metals 12 00730 g006
Figure 7. Ratio of sand and metal flows with respect to the proposed addition of water. The addition of water is related to the sand/metal ratio of the molds. The black lines show the minimum water additions.
Metals 12 00730 g007
Figure 8. Evolution of the dwell time factor.
Metals 12 00730 g008
Figure 9. Graph showing the number of registers recorded when using the digital twin or the previous system available at the foundry.
Metals 12 00730 g009
Table 1. Mathematical equation obtained by the correlation of the flows and the addition of water.
Q MetalQ SandConstant
Coef.11.75847040.173421604−6.84395782
Error8.622765051.967405178.54667084
R2/SResidual0.939416071.442050501-
F/d.f23.2590423-
SCReg/ScRef96.73480446.238528944-
Table 2. Operating modes of staggered additions in prolonged stops.
Downtime (tstop) (min)
15 < tstop < 6060 ≤ tstop < 300
Multiplier FactorNumber of MoldsMultiplier FactorNumber of Molds
0.2560.2512
0.5060.5012
0.7560.7512
16112
Table 3. Dispersion measurements that show how, when using the digital twin, the temperature of the return sand is reduced, it is also more constant and temperatures above 100 °C are avoided.
Average Temperature Standard Deviation Count of Registers with High Temperature (>100 °C)
Without Digital Twin64.796 °C9.4999200
With Digital Twin60.874 °C7.0390
Publisher’s Note: MDPI stays neutral with regard to jurisdictional claims in published maps and institutional affiliations.

