Article

TiO2–SnO2 Nanocomposites for Photocatalytic Environmental Remediation under UV-Light

by
Sandip M. Deshmukh
1,
Santosh S. Patil
2,
Santosh B. Babar
1,
Sultan Alshehri
3,
Mohammed M. Ghoneim
4,
Asiya M. Tamboli
5,
Nguyen Hoang Lam
6,
Nguyen Tam Nguyen Truong
6,*,
Chang Duk Kim
7,
Mohaseen S. Tamboli
5,*,
Sanjay M. Khetre
8,* and
Sambhaji R. Bamane
9
1
Department of Chemistry, Vishwasrao Naik Mahavidyalay, Shirala 415408, Maharashtra, India
2
Department of Chemistry and Chemical Engineering, Inha University, 100 Inha-ro, Michuhol-gu, Incheon 22212, Korea
3
Department of Pharmaceutical Sciences, College of Pharmacy, Almaarefa University, Ad Diriyah, Riyadh 13713, Saudi Arabia
4
Department of Pharmacy Practice, College of Pharmacy, Almaarefa University, Ad Diriyah, Riyadh 13713, Saudi Arabia
5
Korea Institute of Energy Technology (KENTECH), 200 Hyeokshin-ro, Naju 58330, Jeollanam-do, Korea
6
School of Chemical Engineering, Yeungnam University, 280 Daehak-ro, Gyeongsan 38541, Korea
7
Department of Physics, Kyungpook National University, 80 Daehak-ro, Buk-gu, Daegu 41566, Korea
8
Nanomaterials Research Laboratory, Department of Chemistry, Dahiwadi College, Dahiwadi 415508, Maharashtra, India
9
Department of Chemistry, Sushila Shankarrao Gadhave Mahavidyalaya, Khandala 412802, Maharashtra, India
*
Authors to whom correspondence should be addressed.
Metals 2022, 12(5), 733; https://doi.org/10.3390/met12050733
Submission received: 17 January 2022 / Revised: 15 March 2022 / Accepted: 17 March 2022 / Published: 26 April 2022

Abstract

:
The photocatalytic removal of water contaminants for ecological systems has become essential in the past few decades. Consequently, for commercialization, cost-efficient, earth-abundant and easy to synthesize photocatalysts for dye degradation are of urgent need. We have demonstrated a simple and feasible approach for fabricating TiO2–SnO2 nanocomposite photocatalysts via urea-assisted-thermal-decomposition with different mass ratios. The as-synthesized materials were characterized by different physicochemical techniques. The phase formation and crystallite size were calculated by using XRD. The STEM, UV-Vis, DRS, HR-TEM and EDS revealed the effective formation of the heterojunction between TiO2 and SnO2, and enrichment in the UV-absorption spectrum. All synthesized materials were used for the photocatalytic degradation of methyl orange (MO) under UV light. The optimized results of the TiO2–SnO2 nanocomposite showed excellent photostability and photocatalytic activity over a number of degradation-reaction cycles of methyl-orange (MO) dye under the illumination of ultraviolet light. In addition, the recent method has great potential to be applied as a proficient method for mixed-metal-oxide-nanocomposite synthesis.

1. Introduction

Dyes play a prominent role in modern life, such as in clothes, beauty products, the paper industry, and foods [1]. Dyes are categorized into metal-complex dyes, functional dyes, azo dyes and reactive dyes [2]. They are organic compounds with functional groups R-N = N-R, R and R substituents [3]. The methyl orange is a dye-containing the azo group, so it is called an azo dye [4,5]. These dye-industry wastes are considered toxic, poisonous and non-biodegradable. Generally, these wastes are discharged into rivers, hence becoming the cause of serious water pollution [6,7]. In addition, it gives rise to various problems such as lower sunlight penetration into streams, toxic life for mammals, fishes and other sea life. Therefore, the main task in the present era is to reduce water pollution and have safe water for the ecological community. Towards this endeavor, the degradation of dyes is executed by various methods such as precipitation and adsorption, which involve oxidase and hydroxylase enzymes [8]. TiO2 nanoparticles are considered to be the most efficient at reducing organic dyes due to their excellent features such as low cost, high reactivity and chemical stability [9,10]. Additionally, they exhibit high photostability, non-toxicity, and greater oxidation strength with good crystallinity, surface area, and crystallite size, and hence are used as semiconductor photocatalysts for water and air purification [11,12,13,14,15]. TiO2 is present in the form of allotropes that are categorized as rutile, brookite and anatase. Amongst these, the anatase phase has more surface area and a high crystallinity, which increases photoactivity [16,17]. However, the band gap of TiO2 (~3.2 eV) is quite large, which results in the fast recombination of the exciton and the lack of visible-light utilization, which in turn hampers its potential applicability as a photocatalyst at the commercial level. In this case, it is necessary to combine TiO2 with another semiconductor metal oxide in order to reduce the fast recombination of excitons. SnO2 semiconductors with a lower bandgap can trap the photogenerated charge carriers and decrease the recombination rate. SnO2 mixed with TiO2 increases the catalytic activity due to the generation of an intermediate band gap [18,19,20]. The photocatalytic efficiency depends upon the recombination rate of the electron-hole pair coming from the surface-charge transfer. The semiconductor decreases the recombination rate of the produced charge carriers, demonstrating the enhancement in photocatalytic activity [21,22,23,24,25,26]. The extensive use of the combination of TiO2/SnO2 as photocatalyst is due to its higher quantum yield. The effective separation of the electron-hole pair of photoionized compound is because of the different CB of TiO2 and SnO2 [27,28,29]. Most of the synthesis techniques for the preparation of the TiO2/SnO2 composites are complicated due to the addition of SnO2, which in turn aids in decreasing crystallinity. Therefore, we converted the anatase to the rutile phase by using the combustion method with the suitable condition. The complex metal oxides such as TiO2/SnO2 photocatalyst were prepared by using the stearic-acid method [30,31].
Herein, we reported the convenient strategy for the preparation of TiO2/SnO2 nanocomposites through combustion method, which resulted in an anatase structure, high surface area, high crystallinity and excellent photocatalytic activity. In the present study, the TiO2/SnO2 nanocomposite showed enhanced photocatalytic activity towards the MO-dye degradation under ultraviolet-light irradiation.

2. Experimental

2.1. Materials

Stannous chloride (SnCl4·H2O) (Merck, Mumbai, India), Titanium oxysulphate (TiOSO4·H2O) (Sigma Aldrich, Mumbai, India), Urea (NH2CONH2) purchased from Merck (Mumbai, India), and Methyl Orange (Molychem, Mumbai, India) of analytical grade were used.

2.2. Synthesis of SnO2, TiO2 Nanoparticles (NPs) and TiO2–SnO2 Nanocomposite

The SnO2 and TiO2 NPs were prepared following the urea-assisted combustion method as per our previous report [32]. The as-obtained TiO2 and SnO2 were represented as TU and SU, respectively. For the preparation of TiO2–SnO2 nanocomposites, the SnCl4·H2O, TiOSO4·H2O and NH2CONH2 were grounded into fine powders in mortar and pestle and subjected to heat treatment at high temperature (600 °C) with a heating rate of 15 °C/min for 3 h. The synthesized photocatalyst was washed away by utilizing the distilled water (DW) then dried in an oven at 110 °C. The fine powder was obtained by grinding this final product. Photocatalyst TiO2–SnO2 nanocomposites were obtained with different mass ratios of TiOSO4·H2O:SnCl4·H2O (0.950:0.050, 0.900:0.100, 0.850:0.150, 0.800:0.200, 0.750:0.250, and 0.700:0.300) and denoted as TSU95, TSU90, TSU85, TSU80, TSU75 and TSU70, respectively.

2.3. Structural Characterization

The nanocrystalline structure of as-synthesized SnO2 NPs, TiO2 NPs and TiO2–SnO2 nanocomposites were studied with the help of XRD with CuKα radiation (λ = 1.5406 Å) (Pan analytical diffractometer, Almelo, The Netherlands). The morphological features were analyzed by and scanning electron microscopy (SEM, Hitachi S-4800), transmission electron microscopy (TEM) (Titan G2 ChemiSTEM Cs Probe, FEI Company, Hillsboro, OR, USA). The elemental location and chemical composition of a particular selected area were analyzed with the help of scanning–transmission electron microscopy. The elemental mapping and X-ray energy-dispersive spectrometer (Titan G2 ChemiSTEM Cs Probe, FEI Company, Hillsboro, OR, USA) were useful for the analysis of chemical composition and elemental location in the particular area. The absorption of light by the photocatalyst was studied with the help of diffuse reflectance spectra (DRS) and UV-Vis’s spectrophotometer (LABINDIA Analytical UV-3092, Shimadzu, Model-UV-3600, Kyoto, Japan). The spectrofluorometer (JASCO, Model FP.750, Tokyo, Japan) was used for the identification of photoluminescence spectra (PL) of various synthesized materials.

2.4. Photocatalytic Degradation of Methyl Orange (MO) Dye

The photocatalytic activity of as-prepared samples (TU, SU, TSU95, TSU90, TSU85, TSU80, TSU75 and TSU70) were measured under UV-light irradiation. In this experiment, 0.1 gm catalyst was mixed with 100 mL of 20 ppm aqueous MO solution. At room temperature, the reaction mixture was stirred (by using a magnetic stirrer) for half an hour before light irradiation. This was helpful for the formation of adsorption–desorption methyl-orange (MO) molecules for the equilibrium on the surface of the catalyst. At a specified interval of time, 3 mL solution was withdrawn. Quantitative determination of MO was performed by measuring the intensity of absorption peak using a UV-Vis spectrophotometer. For ultraviolet-light irradiation, Philips lamp HPL-N (250 W, Amsterdam, The Netherlands) was used as a light source. The UV-Vis spectrophotometer (Shimadzu, Model-UV-3600) was used for absorbance measurement of MO, and it was measured at 464 nm. In each run, distilled water was used for washing the separated photocatalyst. For monitoring MO recyclability, the washed photocatalyst sample was added to a fresh solution of methyl orange for the next cycle, and the absorbance of the MO was measured.

3. Results and Discussion

3.1. XRD Analysis

Figure 1 shows the XRD pattern of the as-synthesized photocatalyst such as TU, SU, TSU95, TSU90, TSU85, TSU80, TSU75 and TSU70. The TU sample shows peaks at 2θ = 25.3°, 37.7°, 48.0°, 53.9°, 55.1°, 62.6°, 68.8°, 70.3°, and 75.1° that resemble the (hkl) planes of (101), (004), (200), (105), (211), (204), (116), (220), and (215), respectively. The observed peak is related to the anatase phase of TiO2 (JCPDS 21-1272) [32]. Furthermore, the characteristics peaks of SnO2 (SU) appear at 26.4°, 33.7°, 37.8°, 51.6° and 61.7°, which are indexed to the (hkl) planes of (110), (101), (200), (220) and (002), respectively. The SU shows the rutile tetragonal structure of SnO2, and it is well matched with the JCPDS card number 77-0452.
The XRD pattern of TSU95 and TSU90 does not show any typical diffraction peaks of SnO2 due to its minor weight ratio in the nanocomposites. In contrast, in the TSU85, TSU80 and TSU75 nanocomposites, the slight appearance of characteristic peaks of SnO2 in the range of 25–38° were observed, which correspond to the (hkl) planes of (110), (101) and (200). No extra peaks were observed in any of the nanocomposites, which showed the successful coupling of the anatase TiO2 and the tetragonal SnO2. Hence the formation of the TiO2–SnO2 nanocomposite is confirmed.
The crystallite size (D) of all prepared composites was studied by applying Scherrer’s equation.
D = 0.9 λ β cos θ
where the wavelength of the X-ray is λ, θ is the angle of diffraction and β is the full width at half maximum (FWHM). The diffraction peak present at the (101) plane of all the samples was used for calculating the crystallite size. The crystallite size of the TU, SU, TSU95, TSU90, TSU85, TSU80, TSU75 and TSU70 samples was observed to be 14, 25.96, 13.43, 14.05, 13.5, 13.75, 13.78, and 13.77 nm, respectively. The chemical composition, structural and optical parameters of the as-synthesized samples are summarized in Table 1. TiO2 is the major component of the TiO2–SnO2 nanocomposite. When the concentration of Ti is increased in the source precursor, it can effectively prevent the accumulation of Sn, leading to the high dispersion of Ti and Sn, which prevents the agglomeration and particle growth. As a result, relatively small SnO2–TiO2 nanocomposites can be formed and the nanocomposites display a high surface area which is beneficial for catalytic application [33,34].

3.2. Morphological and Structure Analysis of TiO2–SnO2 Nanocomposite

The structure and morphology of the as-synthesized TiO2–SnO2 nanocomposites were analyzed by using HRTEM, EDX, SEM and STEM. Figure 2a–f represents the SEM images of the TSU95, TSU90, TSU85, TSU80, TSU75 and TSU70 nanocomposite at different magnifications. Figure 2d (TSU80 sample) shows well-aggregated, composed and porous nanoparticles (NPs) of SnO2 and TiO2 with sizes of 10–30 nm. The interfacial interaction and production of the heterojunction between SnO2 and TiO2 NPs contained spherical-shaped NPs.
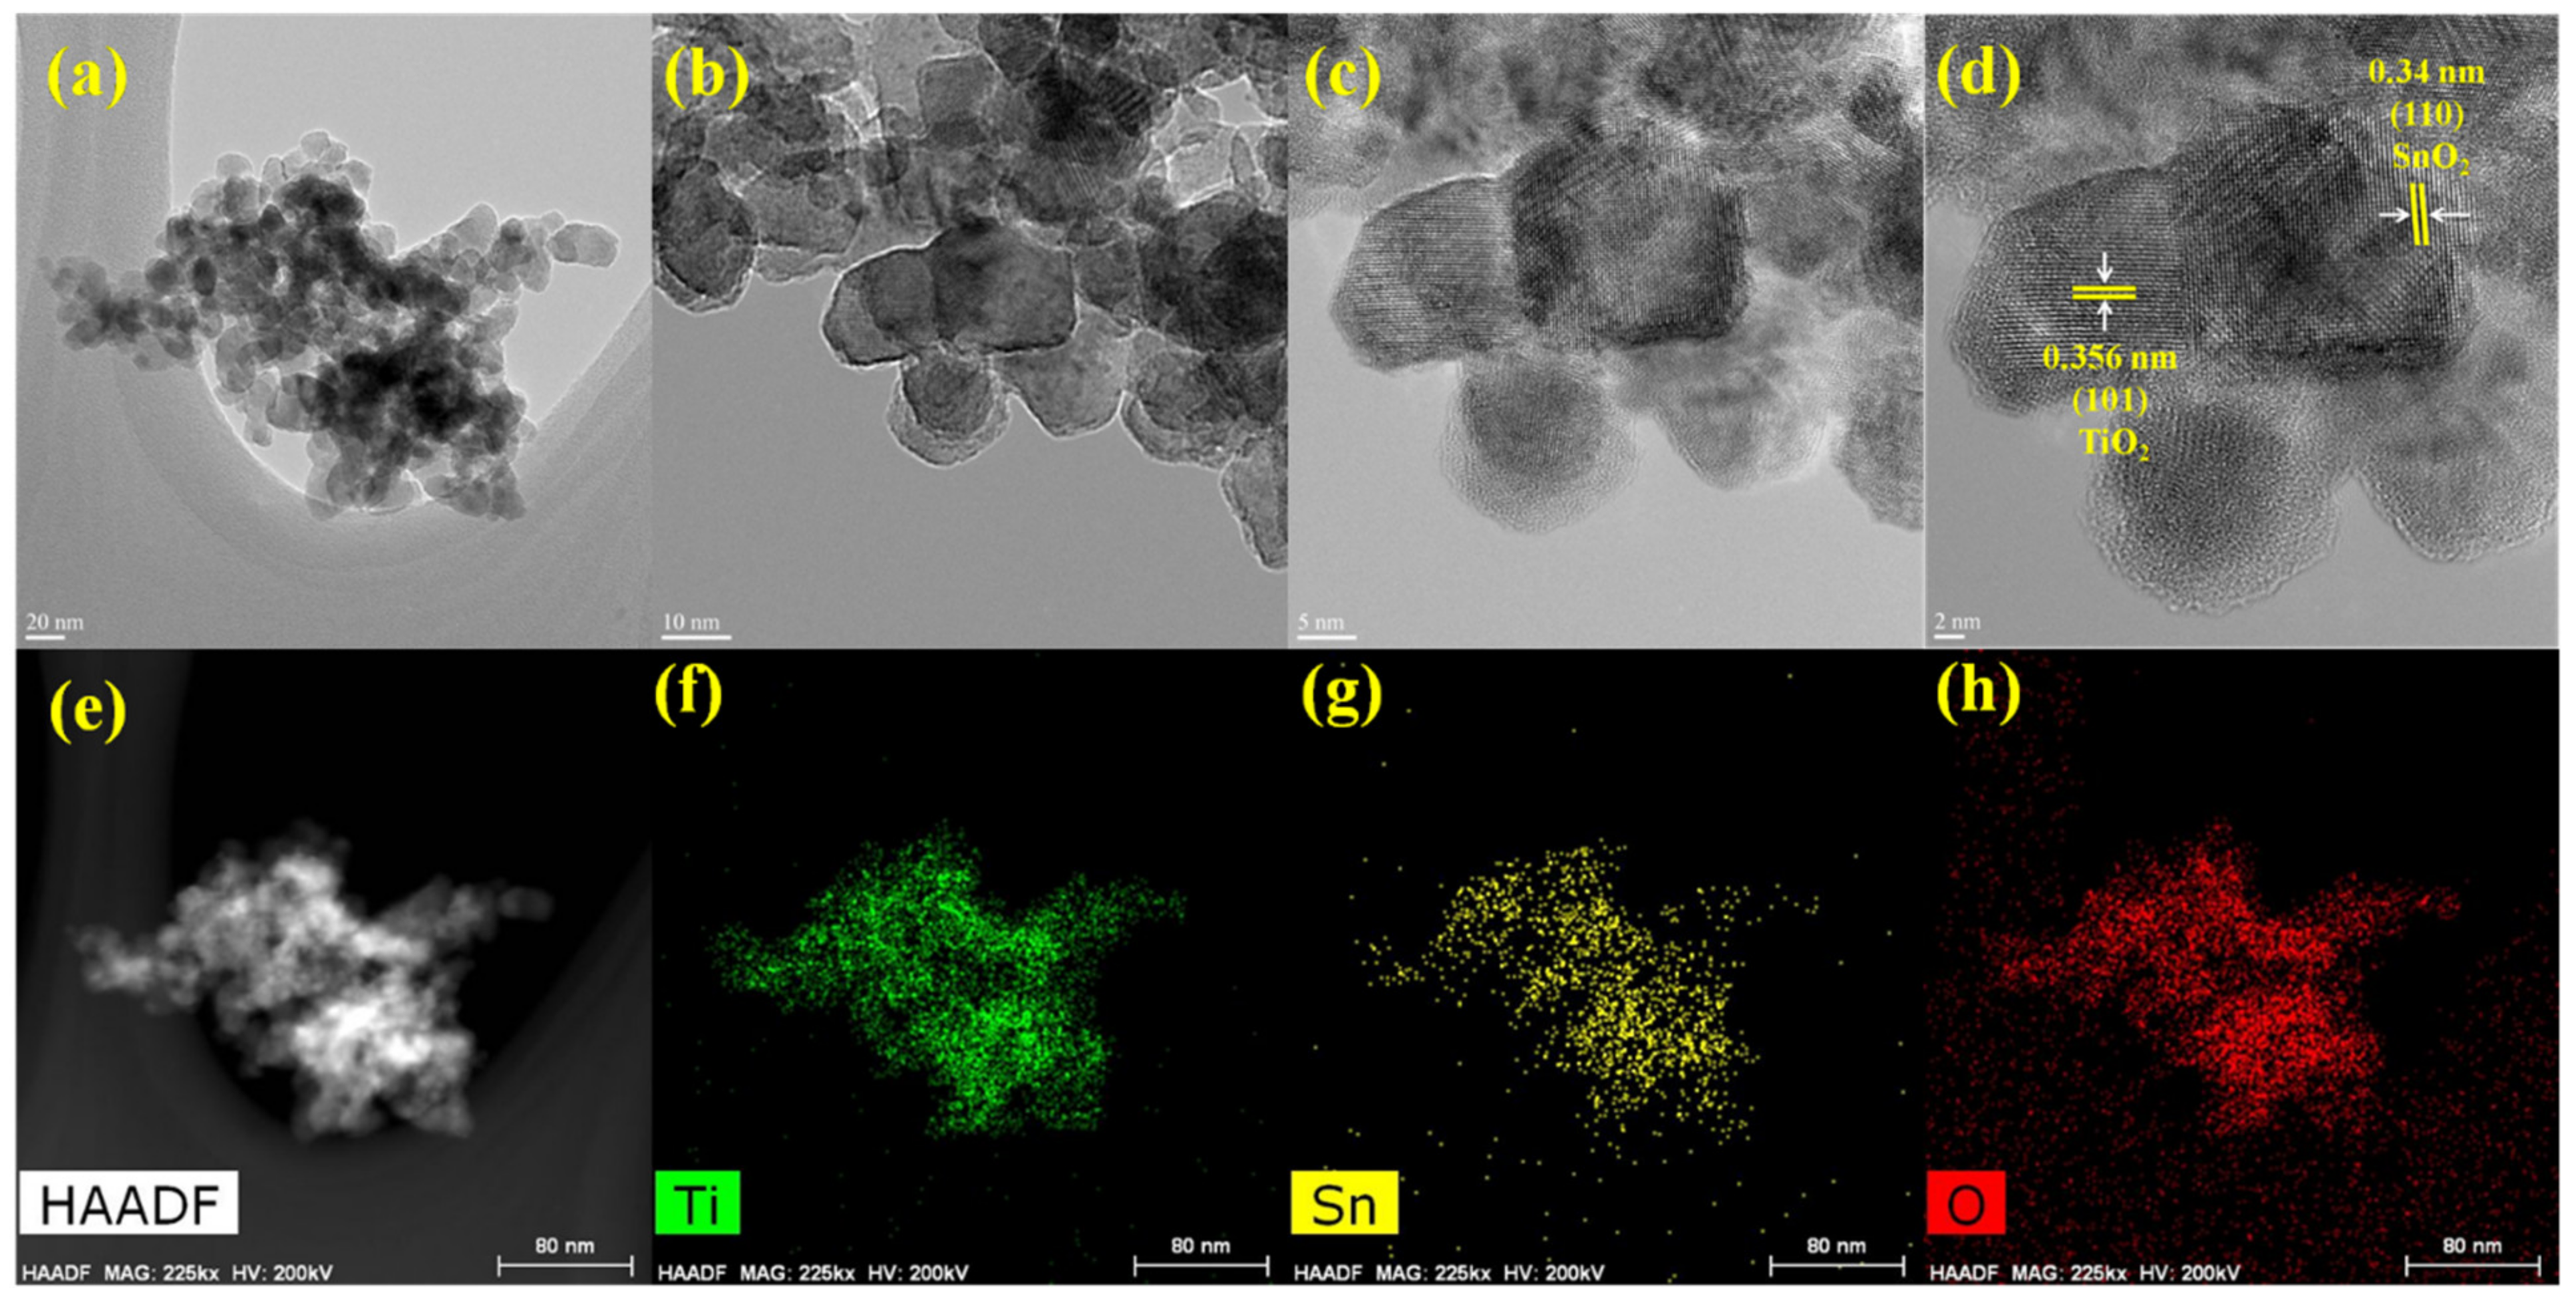
Figure 3a–d show the TEM images of the TSU80 sample recorded at different magnifications. Figure 3a shows a low-resolution TEM image of the TSU80 sample. From Figure 3b, it can be seen that the material has interconnected, porous, aggregated, and spherical NPs with sizes of 10–30 nm. Figure 3d depicts the high-resolution TEM image of the TSU80 sample. The crystallographic planes of SnO2 show the interplanar distance of 0.26 nm (101) and 0.34 nm (110), respectively. On the other hand, the interplanar distance 0.356 nm was observed for TiO2, which corresponds to the crystallographic plane (101) and is in good agreement with the XRD data. Furthermore, Figure 3e–h shows the elemental mapping that confirms the uniform distribution of Ti, Sn and O elements throughout the nanocomposite. They also show that the SnO2 nanoparticles are uniformly spread over the surface of the TiO2 nanostructure, which reveals the coupling of TiO2–SnO2. The SEM and TEM and images of the TSU80 sample reveal no separate boundary between the SnO2 and TiO2 phase because of the identical morphology and structure of the TiO2 NPs and SnO2 NPs.

3.3. Optical Properties

The photocatalytic activity mainly depends on the absorption of light and its wavelength. Figure 4a shows the UV-Vis diffuse reflectance spectra of the TU, SU, TSU95, TSU90, TSU85, TSU80, TSU75 and TSU70 samples. From the Figure 4a, the remarkable absorption peaks can be observed. The optimized nanocomposites of the TSU80 sample show higher absorption in terms of UV and visible regions, which may easily be due to transferring the electron from the valence band (VB) to the conduction band (CB). Band-gap energies were calculated using the following equation
α h ν = A h ν Eg n
where α is the absorption coefficient, A is a constant related to the effective mass of the electrons and holes, Eg is the energy gap and n is a constant related to the type of optical transition; n = 2 for indirect transition and n = 1/2 for the direct transition.
The estimated Eg values from Tauc plots (Figure 4b) were found to be 3.22, 3.5, 3.25, 3.23, 3.25, 3.03 and 3 eV for TU, SU, TSU95, TSU90, TSU85, TSU80 and TSU75, respectively. The band-gap energy was reduced upon the combination of SnO2 with TiO2 due to the intimate interfacial interaction [33,35].

3.4. PL Spectra

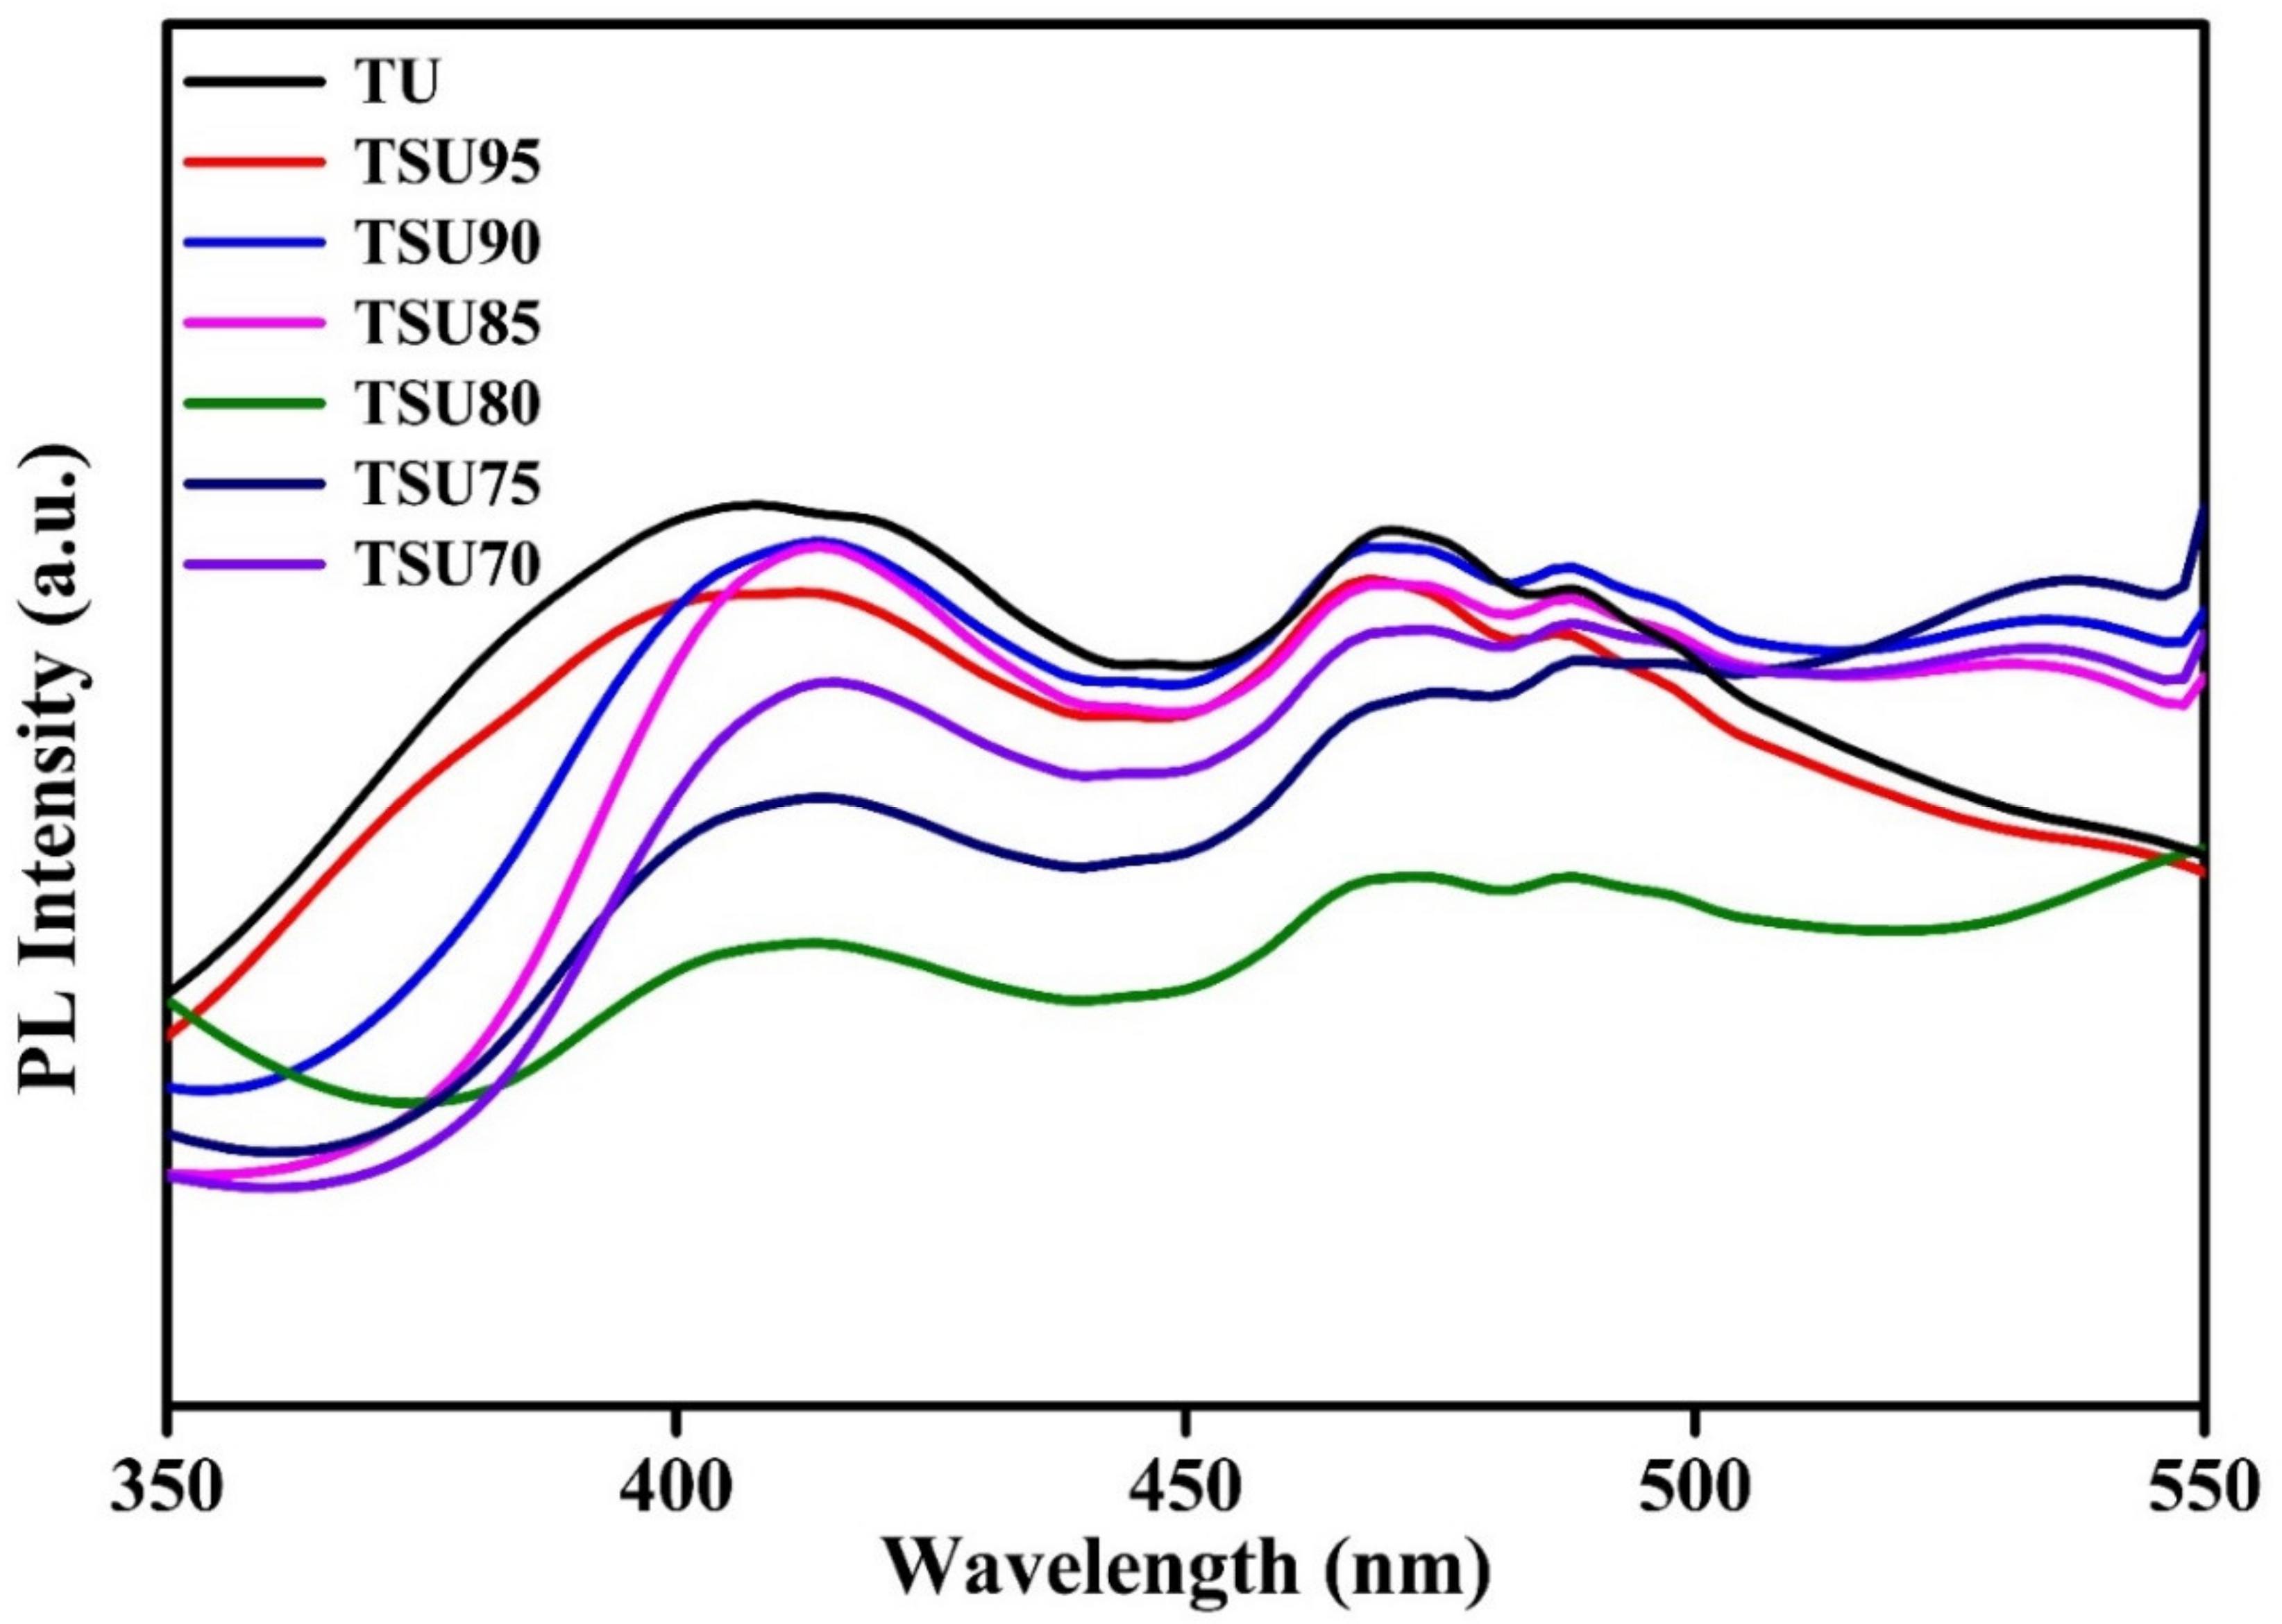
Photoluminescence (PL) spectra were acquired to gain more insights into charge-carrier separation. The PL spectra of photocatalysts (TU, TSU95, TSU90, TSU85, TSU80, TSU75 and TSU70) were measured at the excitation wavelength of 295 nm for TiO2 and TiO2–SnO2 nanocomposite at room temperature as shown in Figure 5. The PL spectra depicts the two broad emission peaks centered at 410 and 470 nm, which are attributed to band-edge emission and oxygen vacancies, respectively. When the TiO2–SnO2 heterojunction was formed, the PL intensity of the TSU80 nanocomposite was drastically reduced, indicating recombination of the charge carrier is suppressed due to interfacial charge transport from TiO2 and SnO2 was reduced. This is advantageous for the improvement of the photocatalytic performances for the degradation of methyl-orange dyes under light irradiation.

3.5. Photocatalytic Degradation of Methyl Orange Applying UV Light

Photocatalyst performances of TU, SU, TSU95, TSU90, TSU85, TSU80, TSU75 and TSU70 were evaluated for MO-dye degradation under UV-light irradiation. The photocatalytic performance was studied by monitoring the absorbance of MO (λmax = 464 nm) at regular intervals of time using UV-Vis spectroscopy. The degradation efficiency was estimated by using the following equation [36].
D %   = C 0 C C 0
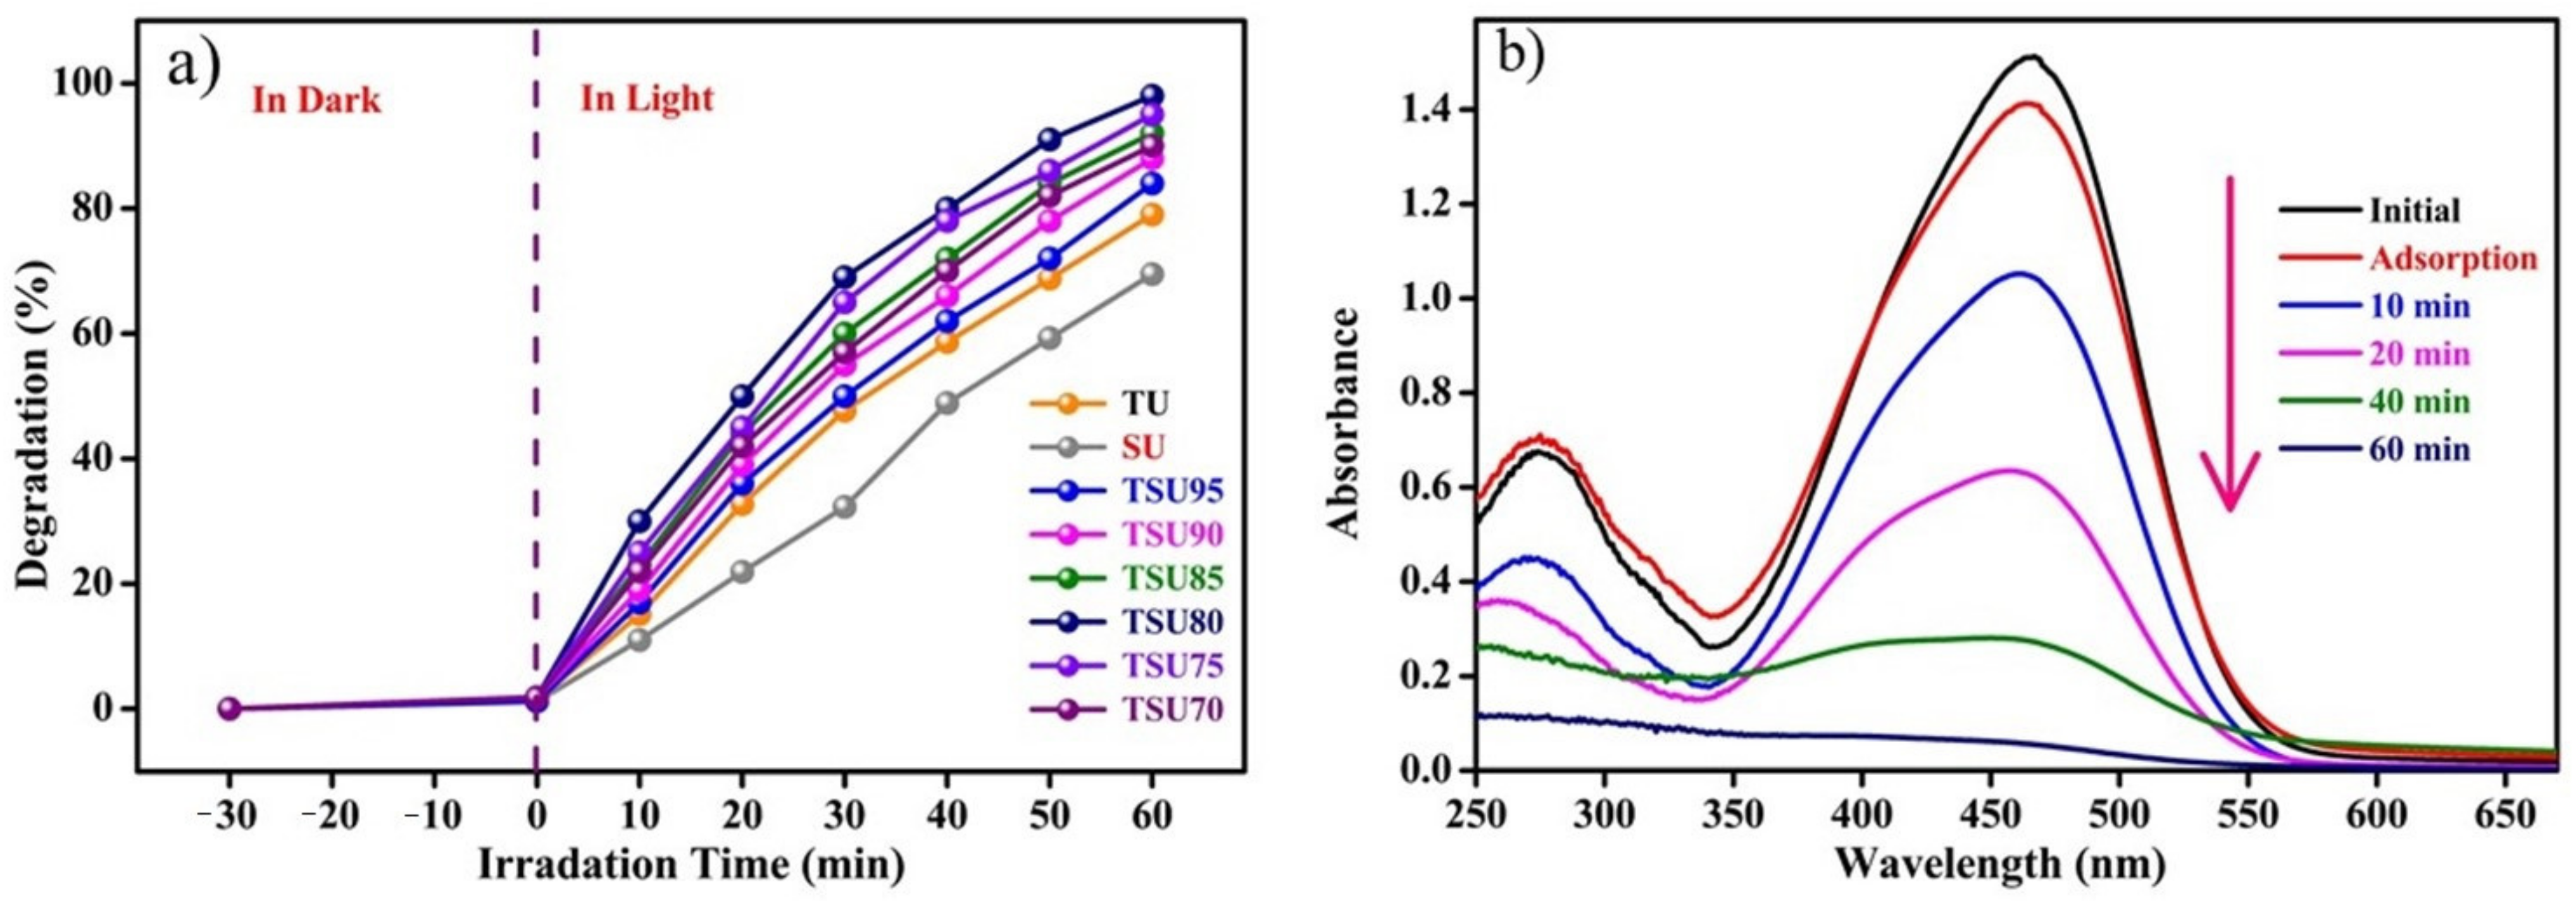
where C0 is the initial concentration and C is the final concentration of methyl orange, respectively. Figure 6a depicts the relationship between irradiation time and MO-dye degradation in the presences of UV light by different photocatalysts. The degradation activity of the as-synthesized photocatalyst for MO degradation was found to be 79.03, 69.5, 84, 88, 92, 98, 95 and 90% for TU, SU, TSU95, TSU90, TSU85, TSU80, TSU75 and TSU70, for 60 min of light irradiation. The produced TSU80 (~98%) exhibited excellent photocatalytic activity than the pure-phase TU (79.03%) and SU (69.5%) over 60 min of light irradiation. This could be attributed to the intimate interfacial connection and the heterojunction effect between the TiO2 and SnO2, which could greatly contribute to charge-carrier (electron/hole) separation and utilization. The degradation of MO was found to increase with an increase in the incorporation of SnO2; however, the excessive inclusion of SnO2 (>80) had a negative effect on the photocatalytic activity, indicating that TSU80 is an optimal catalyst. Figure 6b shows the UV-Vis-absorbance spectra for the degradation of MO dye using TSU80 catalyst.
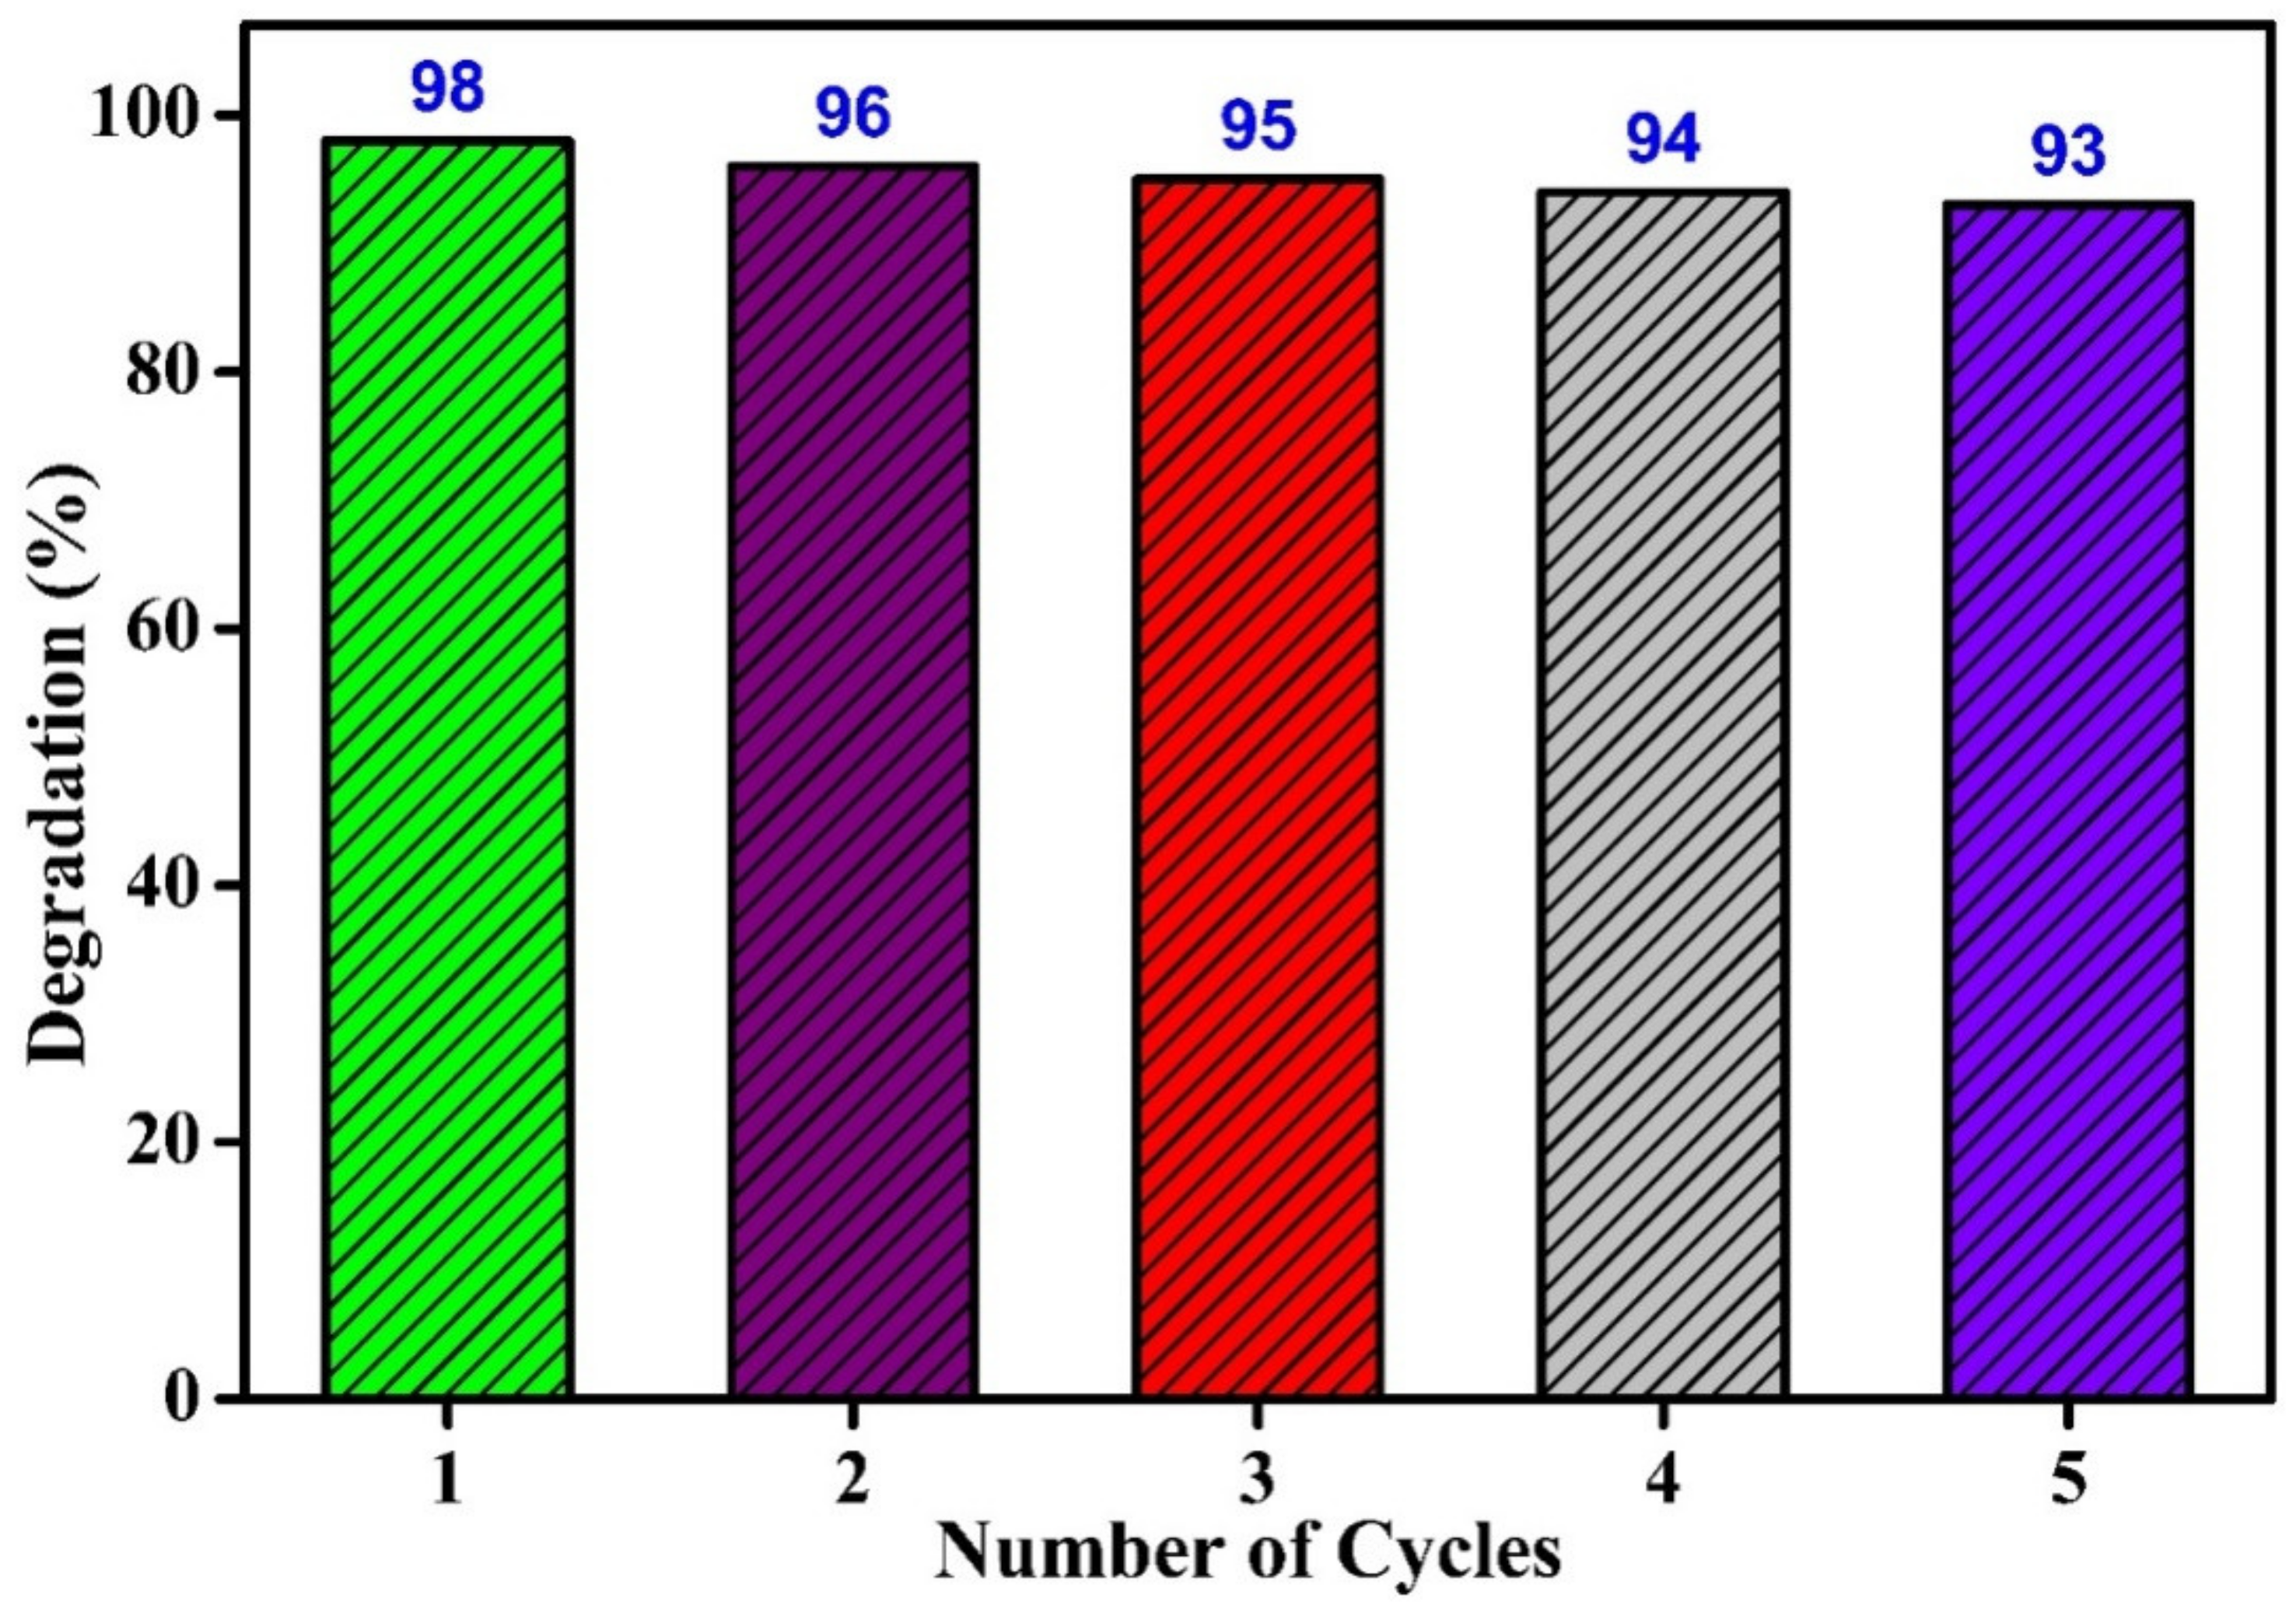
The photostability and recyclability are vital factors for a photocatalyst to be applied for commercial applications. Therefore, the stability of the as-synthesized composites was evaluated under similar conditions by collecting the photocatalyst after measurement and reuse. As shown in Figure 7, the photocatalytic activity was retained to ~90% after five successive cycles, demonstrating that these photocatalysts can be used multiple times.
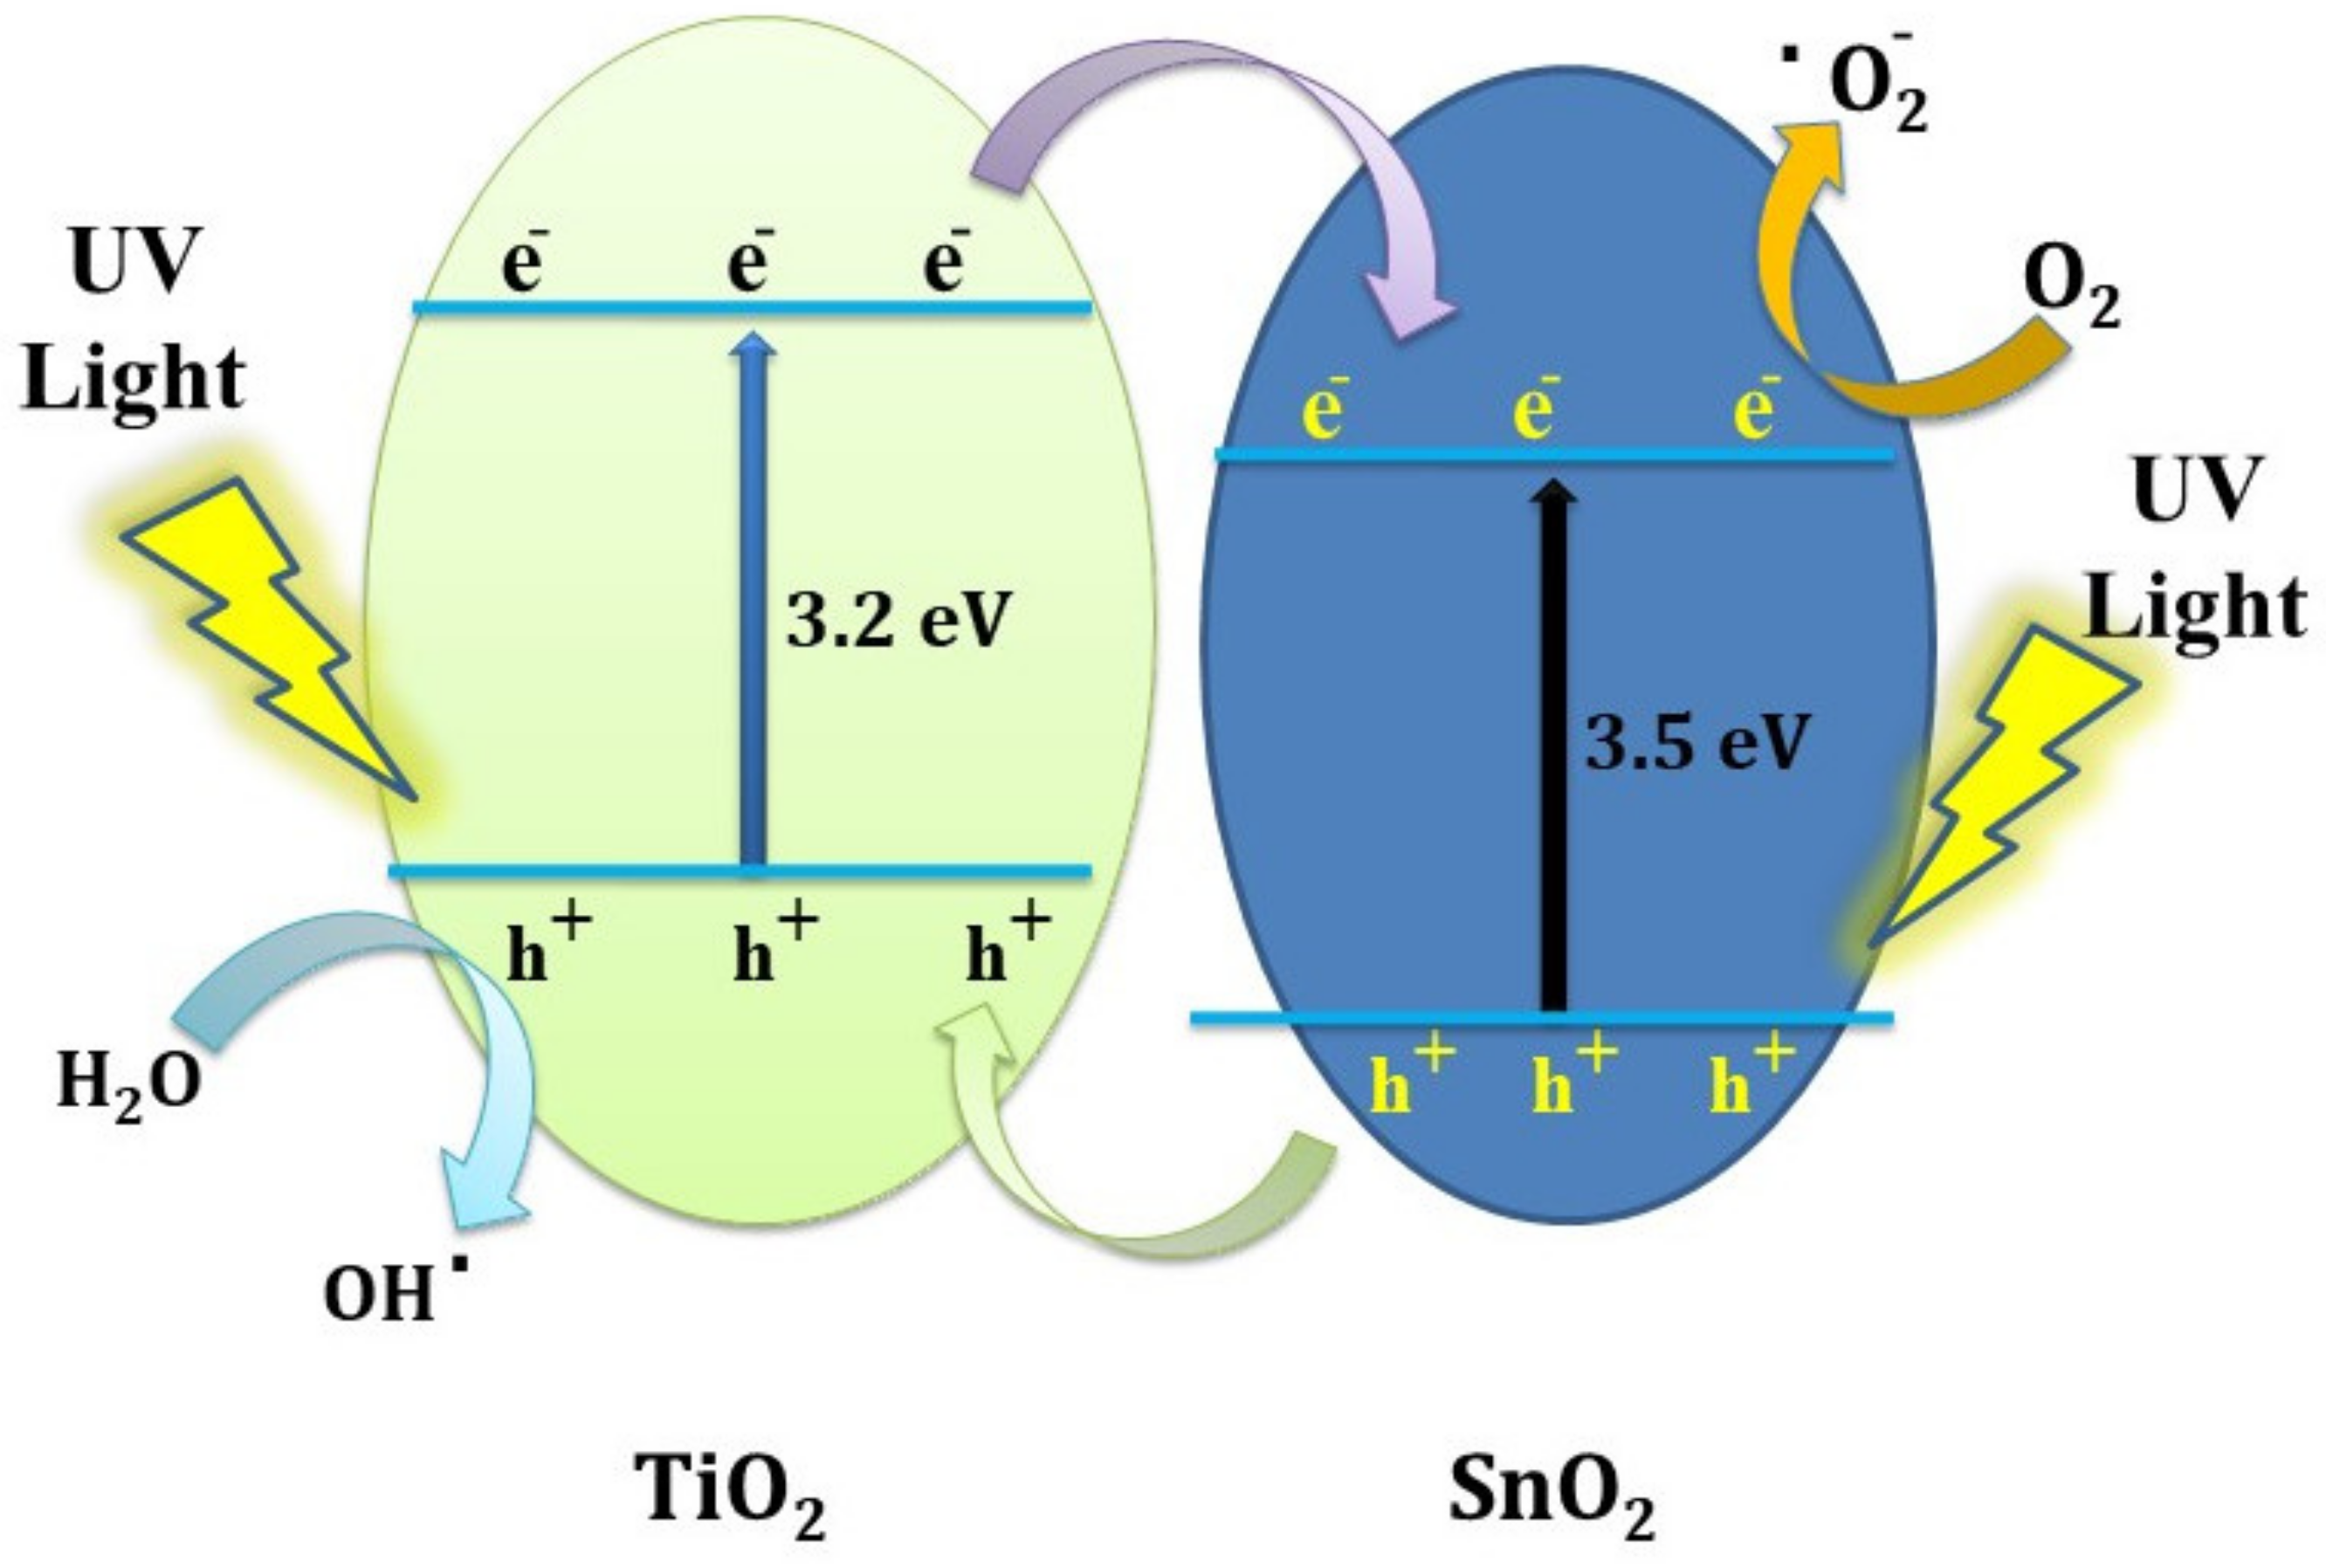
The schematic representation illustrates the charge-transfer pathway on the TiO2–SnO2 nanocomposite for photocatalytic MO-dye degradation (Scheme 1). Based on the above discussion and band-gap energy of SnO2 (rutile tetrahedral, 3.5 eV) and TiO2 (anatase, 3.2 eV), the TiO2–SnO2 nanocomposite exhibits type II band alignment [37]. Upon light irradiation, both SnO2 and TiO2 excited the electrons from the valence band (VB) to the conduction band (CB) and created photoexcited holes (h+) in the VB and electrons (e) in the CB. The TiO2 has a higher negative CB than that of SnO2, which is likely form heterojunction between the SnO2 and TiO2. The electrostatic field generated at the interfaces of TiO2–SnO2 provides a driving force for the transfer of an electron from the CB of TiO2 to the CB of SnO2, as the CBM of TiO2 is more negative than that of SnO2. Meanwhile, the photogenerated holes (h+) in the VB of SnO2 transfer into the VB of TiO2 [37]. This process increases the separation ability and lifespan of the induced electron-hole pairs. The formed charge carriers then migrate to the surface of SnO2, capturing molecular oxygen that forms superoxide radicals (•O2). Similarly, holes (h+) in the VB of TiO2 oxidize the H2O, thereby producing hydroxyl radicals (•OH). These •OH and •O2 radicals act as strong oxidizing agents towards the degradation of methyl orange in wastewater at an impressive reaction rate.
From these results, it is evident that MO-dye degradation directly depends upon the dosage of Sn (IV). The Sn (IV) incorporation can efficiently increase the rate of photocatalytic reaction in the TiO2/SnO2 nanocomposite. The enhancement of photocatalytic activity depends on several factors. (i) The number of holes and photogenerated electrons are relatively low in pure TiO2 due to a higher recombination rate, therefore the photodegradation of methyl orange requires more time. In the case of TiO2/SnO2, the degradation of MO was high due to due to increasing the separation of photogenerated holes and electrons. (ii) The calcination at high temperature (600 °C) is beneficial for the separation of holes and electrons because it greatly produces the photoactive phases such as anatase and rutile. (iii) The as-synthesized nanocomposite photocatalyst exhibits a higher specific surface area that can greater increase active-site exposure for the catalytic reaction than TiO2.

4. Conclusions

In summary, an inexpensive, easy and simple combustion technique was used for the fabrication of a TiO2–SnO2 nanocomposite. The as-synthesized TiO2–SnO2 composite showed excellent photocatalytic efficiency for methyl-orange degradation under UV light irradiation compared to pure TiO2 and SnO2. The enhanced surface area of the nanocomposite enables higher MO-dye adsorption while type II band alignment at the interface leads to a reduction of unwanted electron hole recombination and likely enhance photoactivity (98.4%/60 min). This significant photoactivity was retained even after repeated use (five cycles), indicating possibility for practical applications in wastewater treatments. Thus, unique synthesis method developed in this study may lead to innovative designs of active photocatalysts for environmental remediation applications.

Author Contributions

Writing—original draft, Methodology, S.M.D.; Writing—review & editing, S.S.P.; Data curation, Formal analysis, S.B.B.; Funding acquisition, S.A. and M.M.G.; Writing—review & editing, A.M.T.; Validation, N.H.L.; Resources, N.T.N.T.; Formal analysis, data collection, C.D.K. Conceptualizations, Writing—review & editing, M.S.T.; Supervision, Investigation S.M.K. Supervision, Project administration. S.R.B. All authors have read and agreed to the published version of the manuscript.

Funding

This research was funded by Researchers Supporting Program (TUMA-Project-2021-2), AlMaarefa University, Riyadh, Saudi Arabia.

Institutional Review Board Statement

Not applicable.

Informed Consent Statement

Not applicable.

Data Availability Statement

Not applicable.

Acknowledgments

The authors deeply acknowledge the Researchers Supporting Program (TUMA-Project-2021-2), AlMaarefa University, Riyadh, Saudi Arabia for supporting steps of this work.

Conflicts of Interest

The authors declare that they have no known competing financial interest or personal relationships that could have appeared to influence the work reported in this paper.

References

  1. Aspland, J.R. Textile Dyeing and Coloration; AATCC: Research Triangle Park, NC, USA, 1997. [Google Scholar]
  2. Mahmood, A.; Khan, S.U.-D.; Rana, U.A. Theoretical designing of novel heterocyclic azo dyes for dye sensitized solar cells. J. Comput. Electron. 2014, 13, 1033–1041. [Google Scholar] [CrossRef]
  3. Sha, Y.; Mathew, I.; Cui, Q.; Clay, M.; Gao, F.; Zhang, X.J.; Gu, Z. Rapid degradation of azo dye methyl orange using hollow cobalt nanoparticles. Chemosphere 2016, 144, 1530–1535. [Google Scholar] [CrossRef] [PubMed]
  4. Cherrak, R.; Hadjel, M.; Benderdouche, N. Heterogenous Photocatalysis Treatement of Azo Dye Methyl Orange by Nano Composite TiO2/Diatomite. Orient. J. Chem. 2015, 31, 1611–1620. [Google Scholar] [CrossRef]
  5. Devi, L.G.; Reddy, K.M. Enhanced photocatalytic activity of silver metallized TiO2 particles in the degradation of an azo dye methyl orange: Characterization and activity at different pH values. Appl. Surf. Sci. 2010, 256, 3116–3121. [Google Scholar] [CrossRef] [Green Version]
  6. Zhou, M.; Lou, X.W.; Xie, Y. Two-dimensional nanosheets for photoelectrochemical water splitting: Possibilities and opportunities. Sci. Direct 2013, 8, 598–618. [Google Scholar] [CrossRef]
  7. Zulfiqar, M.; Sufian, S.; Bahadar, A.; Lashari, N.; Rabat, N.E.; Mansor, N. Surface-fluorination of TiO2 photocatalysts for remediation of water pollution: A review. J. Clean. Prod. 2021, 317, 128354. [Google Scholar] [CrossRef]
  8. Kumar, S.S.; Muruganandham, T.; Jaabir, M.S.M. Photocatalytic Degradation of Methyl Orange using TiO2/SnO2 Binary Nano Composite. Int. J. Curr. Microbiol. App. Sci. 2014, 3, 514–522. [Google Scholar] [CrossRef]
  9. Schneider, J.; Matsuoka, M.; Takeuchi, M.; Zhang, J.; Horiuchi, Y.; Anpo, M.; Bahnemann, D.W. Understanding TiO2 Photocatalysis: Mechanisms and Materials. Chem. Rev. 2014, 114, 9919–9986. [Google Scholar] [CrossRef]
  10. Lee, S.-Y.; Park, S.-J. TiO2 photocatalyst for water treatment applications. J. Ind. Eng. Chem. 2013, 19, 1761–1769. [Google Scholar] [CrossRef]
  11. Al-Salim, N.I.; Bagshaw, S.A.; Bittar, A.; Kemmitt, T.; McQuillan, A.J.; Mills, A.M.; Ryan, M.J. Characterisation and activity of sol–gel-prepared TiO2 photocatalysts modified with Ca, Sr or Ba ion additives. J. Mater. Chem. 2000, 10, 2358–2363. [Google Scholar] [CrossRef]
  12. Konovalova, T.A.; Kispert, L.D.; Konovalov, V.V. Surface Modification of TiO2 Nanoparticles with Carotenoids. EPR Study. J. Phys. Chem. B 1999, 103, 4672–4677. [Google Scholar] [CrossRef]
  13. Iwasaki, M.; Hara, M.; Kawada, H.; Tada, H.; Ito, S. Cobalt Ion-Doped TiO2 Photocatalyst Response to Visible Light. J. Colloid Interface Sci. 2000, 224, 202–204. [Google Scholar] [CrossRef]
  14. Ito, S.; Inoue, S.; Kawada, H.; Hara, M.; Iwasaki, M.; Tada, H. Low-Temperature Synthesis of Nanometer-Sized Crystalline TiO2 Particles and Their Photoinduced Decomposition of Formic Acid. J. Colloid Interface Sci. 1999, 216, 59–64. [Google Scholar] [CrossRef]
  15. Ding, X.-Z.; Liu, X.-H. Synthesis and microstructure control of nanocrystalline titania powders via a sol–gel process. Mater. Sci. Eng. A 1997, 224, 210–215. [Google Scholar] [CrossRef]
  16. Moon, J.; Takagi, H.; Fujishiro, Y.; Awano, M. Preparation and characterization of the Sb-doped TiO2 photocatalysts. J. Mater. Sci. 2001, 36, 949–955. [Google Scholar] [CrossRef]
  17. Ovenstone, J. Preparation of novel titania photocatalysts with high activity. J. Mater. Sci. 2001, 36, 1325–1329. [Google Scholar] [CrossRef]
  18. Chen, Y.; Liu, B.; Chen, J.; Tian, L.; Huang, L.; Tu, M.; Tan, S. Structure design and photocatalytic properties of one-dimensional SnO2-TiO2 composites. Nanoscale Res. Lett. 2015, 10, 200. [Google Scholar] [CrossRef] [Green Version]
  19. Chai, S.; Zhao, G.; Li, P.; Lei, Y.; Zhang, Y.-N.; Li, D. Novel Sieve-Like SnO2/TiO2 Nanotubes with Integrated Photoelectrocatalysis: Fabrication and Application for Efficient Toxicity Elimination of Nitrophenol Wastewater. J. Phys. Chem. C 2011, 115, 18261–18269. [Google Scholar] [CrossRef]
  20. Tada, H.; Hattori, A.; Tokihisa, Y.; Imai, K.; Tohge, N.; Ito, S. A Patterned-TiO2/SnO2 Bilayer Type Photocatalyst. J. Phys. Chem. B 2000, 104, 4585–4587. [Google Scholar] [CrossRef]
  21. Spanhel, L.; Weller, H.; Henglein, A. Photochemistry of semiconductor colloids. 22. Electron ejection from illuminated cadmium sulfide into attached titanium and zinc oxide particles. J. Am. Chem. Soc. 1987, 109, 6632–6635. [Google Scholar] [CrossRef]
  22. Gopidas, K.R.; Bohorquez, M.; Kamat, P.V. Photophysical and photochemical aspects of coupled semiconductors: Charge-transfer processes in colloidal cadmium sulfide-titania and cadmium sulfide-silver(I) iodide systems. J. Phys. Chem. 1990, 94, 6435–6440. [Google Scholar] [CrossRef]
  23. Serpone, N.; Borgarello, E.; Grätzel, M. Visible light induced generation of hydrogen from H2S in mixed semiconductor dispersions; Improved efficiency through inter-particle electron transfer. J. Chem. Soc. Chem. Commun. 1984, 342–344. [Google Scholar] [CrossRef]
  24. Hotchandani, S.; Kamat, P.V. Charge-transfer processes in coupled semiconductor systems. Photochemistry and photoelectrochemistry of the colloidal cadmium sulfide-zinc oxide system. J. Phys. Chem. 1992, 96, 6834–6839. [Google Scholar] [CrossRef]
  25. Sato, T.; Masaki, K.; Sato, K.-I.; Fujishiro, Y.; Okuwaki, A. Photocatalytic properties of layered hydrous titanium oxide/CdS–ZnS nanocomposites incorporating CdS–ZnS into the interlayer. J. Chem. Technol. Biotechnol. 1996, 67, 339–344. [Google Scholar] [CrossRef]
  26. Machida, M.; Ma, X.W.; Taniguchi, H.; Yabunaka, J.-I.; Kijima, T. Pillaring and photocatalytic property of partially substituted layered titanates, Na2Ti3-x Mx O7 and K2Ti4-x Mx O9 (M = Mn, Fe, Co, Ni, Cu). J. Mol. Catal. A Chem. 2000, 155, 131–142. [Google Scholar] [CrossRef]
  27. Bedja, I.; Kamat, P.V. Capped Semiconductor Colloids. Synthesis and Photoelectrochemical Behavior of TiO2-Capped SnO2Nanocrystallites. J. Phys. Chem. 1995, 99, 9182–9188. [Google Scholar] [CrossRef]
  28. Vinodgopal, K.; Kamat, P.V. Enhanced Rates of Photocatalytic Degradation of an Azo Dye Using SnO2/TiO2 Coupled Semiconductor Thin Films. Environ. Sci. Technol. 1995, 29, 841–845. [Google Scholar] [CrossRef] [PubMed]
  29. Yang, J.; Li, D.; Wang, X.; Yang, X.; Lu, L. Rapid Synthesis of Nanocrystalline TiO2/SnO2 Binary Oxides and Their Photoinduced Decomposition of Methyl Orange. J. Solid State Chem. 2002, 165, 193–198. [Google Scholar] [CrossRef]
  30. Xiong, G.; Wei, G.; Yang, X.; Lu, L.; Wang, X. Characterization and size-dependent magnetic properties of Ba3Co2Fe24O41 nanocrystals synthesized through a sol-gel method. J. Mater. Sci. 2000, 35, 931–936. [Google Scholar] [CrossRef]
  31. Wang, X.; Li, D.; Lu, L.; Wang, X. Synthesis of substituted M- and W-type barium ferrite nanostructured powders by stearic acid gel method. J. Alloy. Compd. 1996, 237, 45–48. [Google Scholar] [CrossRef]
  32. Deshmukh, S.M.; Tamboli, M.S.; Shaikh, H.; Babar, S.B.; Hiwarale, D.P.; Thate, A.G.; Shaikh, A.F.; Alam, M.A.; Khetre, S.M.; Bamane, S.R. A Facile Urea-Assisted Thermal Decomposition Process of TiO2 Nanoparticles and Their Photocatalytic Activity. Coatings 2021, 11, 165. [Google Scholar] [CrossRef]
  33. Yang, J.; Zhang, J.; Zou, B.; Zhang, H.; Wang, J.; Schubert, U.; Rui, Y. Black SnO2–TiO2 Nanocomposites with High Dispersion for Photocatalytic and Photovoltalic Applications. ACS Appl. Nano Mater. 2020, 3, 4265–4273. [Google Scholar] [CrossRef]
  34. Jilani, A.; Ansari, M.O.; Rehman, G.U.; Shakoor, M.B.; Hussain, S.Z.; Othman, M.H.D.; Ahmad, S.R.; Dustgeer, M.R.; Alshahrie, A. Phenol removal and hydrogen production from water: Silver nanoparticles decorated on polyaniline wrapped zinc oxide nanorods. J. Ind. Eng. Chem. 2022, in press. [Google Scholar] [CrossRef]
  35. AlAbduljabbar, F.A.; Haider, S.; Ali, F.A.A.; Alghyamah, A.A.; Almasry, W.A.; Patel, R.; Mujtaba, I.M. Efficient Photocatalytic Degradation of Organic Pollutant in Wastewater by Electrospun Functionally Modified Polyacrylonitrile Nanofibers Membrane Anchoring TiO2 Nanostructured. Membranes 2021, 11, 785. [Google Scholar] [CrossRef] [PubMed]
  36. Jilani, A.; Rehman, G.U.; Ansari, M.O.; Othman, M.H.D.; Hussain, S.Z.; Dustgeer, M.R.; Darwesh, R. Sulfonated polyaniline-encapsulated graphene@graphitic carbon nitride nanocomposites for significantly enhanced photocatalytic degradation of phenol: A mechanistic study. New J. Chem. 2020, 44, 19570–19580. [Google Scholar] [CrossRef]
  37. Wang, C.; Shao, C.; Zhang, X.; Liu, Y. SnO2 Nanostructures-TiO2 Nanofibers Heterostructures: Controlled Fabrication and High Photocatalytic Properties. Inorg. Chem. 2009, 48, 7261–7268. [Google Scholar] [CrossRef] [PubMed]
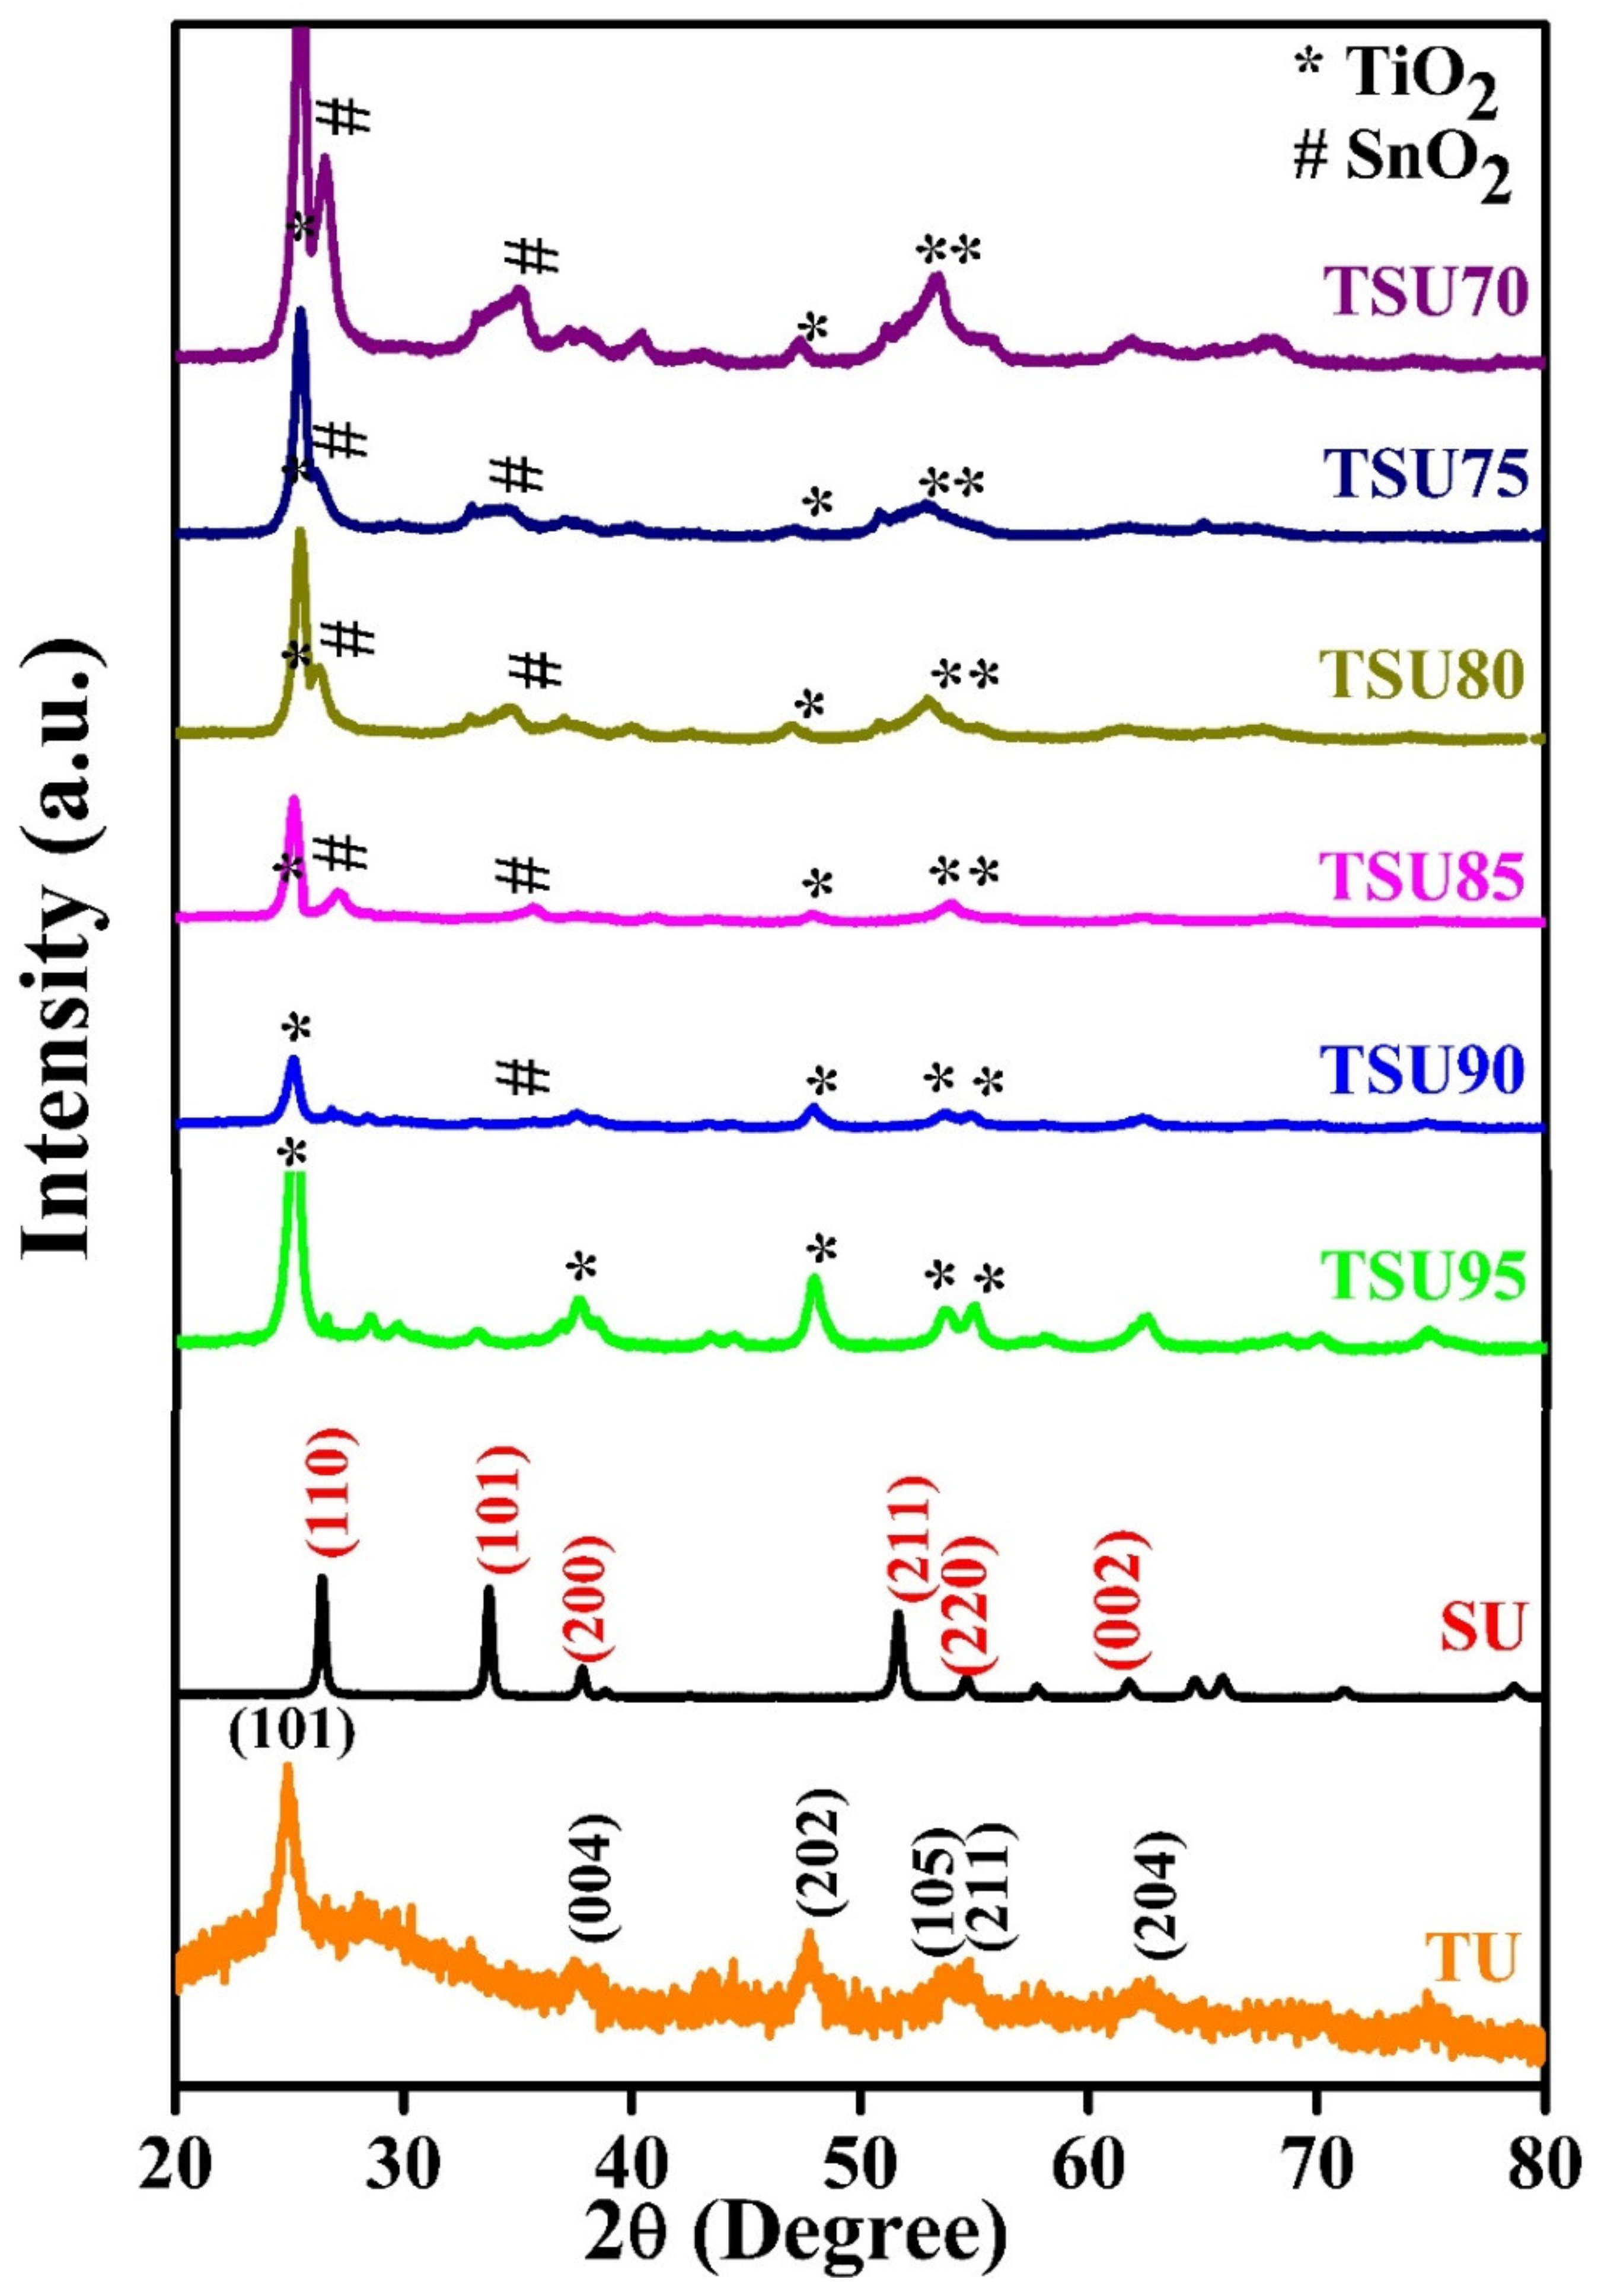
Figure 1. XRD patterns of pure TiO2 (TU), pure SnO2 (SU) and TiO2–SnO2 nanocomposites (TSU95, TSU90, TSU85, TSU80, TSU75 and TSU70) synthesized by combustion method.
Metals 12 00733 g001
Figure 2. SEM images of as-synthesized TiO2–SnO2 nanocomposites (a) TSU95, (b) TSU90, (c) TSU85, (d) TSU80, (e) TSU75 and (f) TSU70.
Metals 12 00733 g002
Figure 3. (a,b) TEM images of sample TSU80 at different magnification, (c,d) HRTEM of the TiO2–SnO2 heterojunction region (e) HAADF image and (fh) elemental mapping of TSU80 nanocomposite.
Metals 12 00733 g003
Figure 4. (a) UV-Vis diffuse reflectance spectra and (b) Tauc plot of TU, SU, TSU95, TSU90, TSU85, TSU80 and TSU75.
Metals 12 00733 g004
Figure 5. Photoluminescence (PL) spectra of TU, TSU95, TSU90, TSU85, TSU80 and TSU75.
Metals 12 00733 g005
Figure 6. (a) Photocatalytic degradation of MO using different photocatalysts under UV-light irradiation (b) UV-Vis-absorbance spectra for the degradation of MO dye using TSU80 catalyst.
Metals 12 00733 g006
Figure 7. Reusability of TSU80 catalyst for degradation of MO dye under UV light irradiation.
Metals 12 00733 g007
Scheme 1. Schematic representation illustrating the charge-transfer pathway of TiO2/SnO2 (TSU80) nanocomposite for MO degradation under UV light irradiation.
Metals 12 00733 sch001
Table 1. Composition, Structural and Optical parameters of as synthesized samples.
Sr. NoSampleWeight Ratio of Precursors
(mg)
(TiOSO4·H2O:SnCl4·H2O)
Crystallite Size
(nm)
Band Gap
(eV)
1Pure TiO2 (TU)1000143.22
2Pure SnO2 (SU)100025.963.5
3TSU95950:5013.433.25
4TSU90900:10014.053.23
5TSU85850:15013.53.25
6TSU80800:20013.753.03
7TSU75750:25013.783
8TSU70700:30013.773
Publisher’s Note: MDPI stays neutral with regard to jurisdictional claims in published maps and institutional affiliations.