
Experimental and Numerical Analysis of the Behavior of Beam–Column Connections with Reinforced Side Plates

Abstract
:1. Introduction
2. Experimental Program
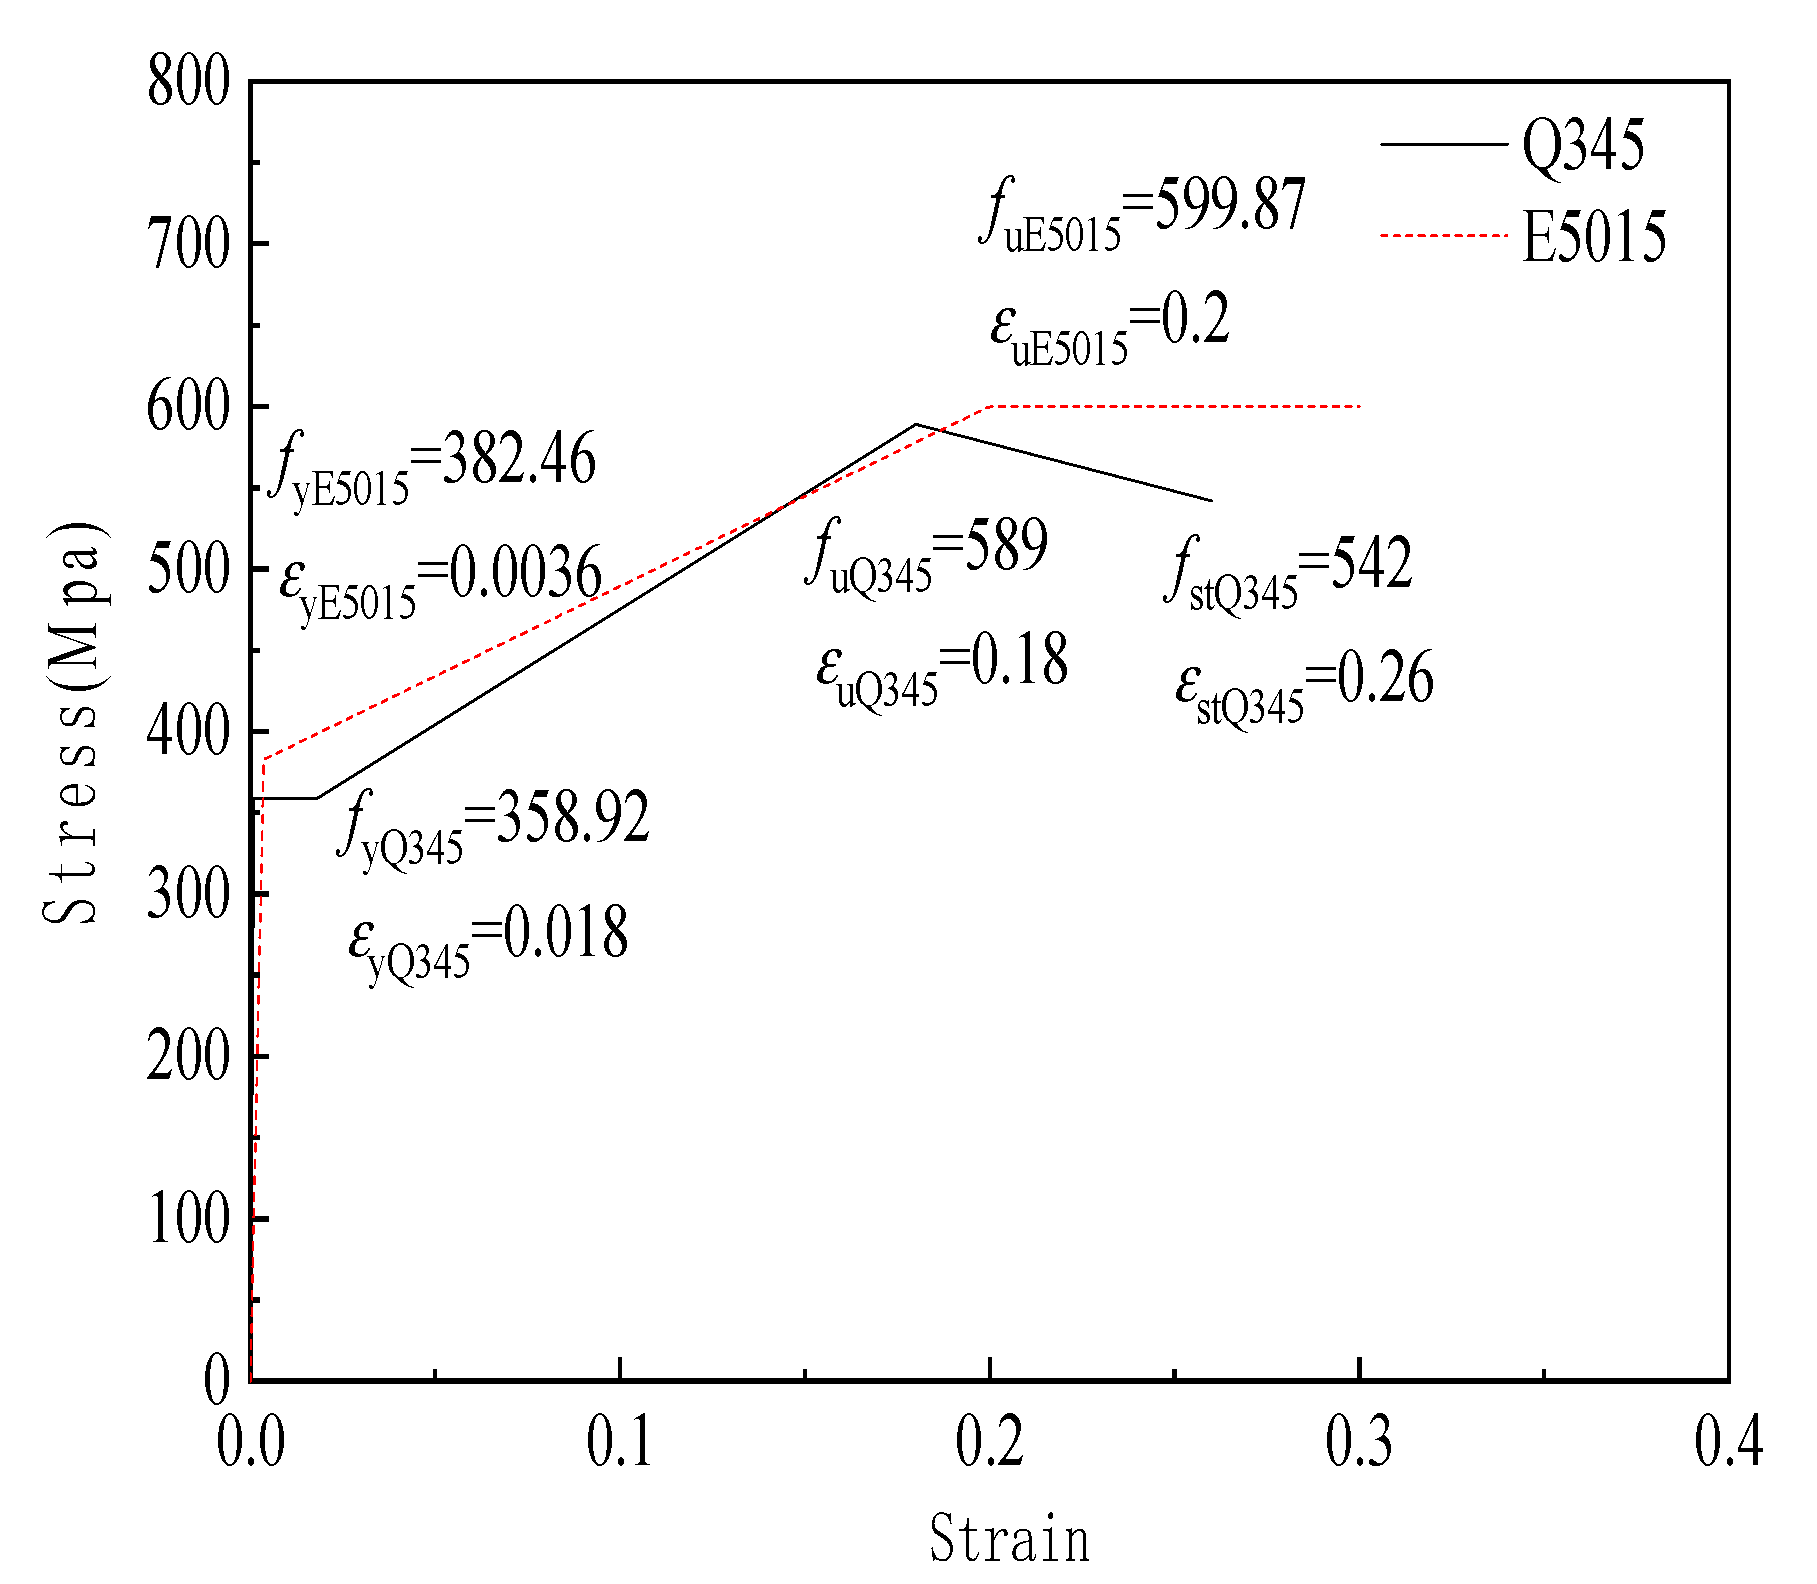
2.1. Specimen Design
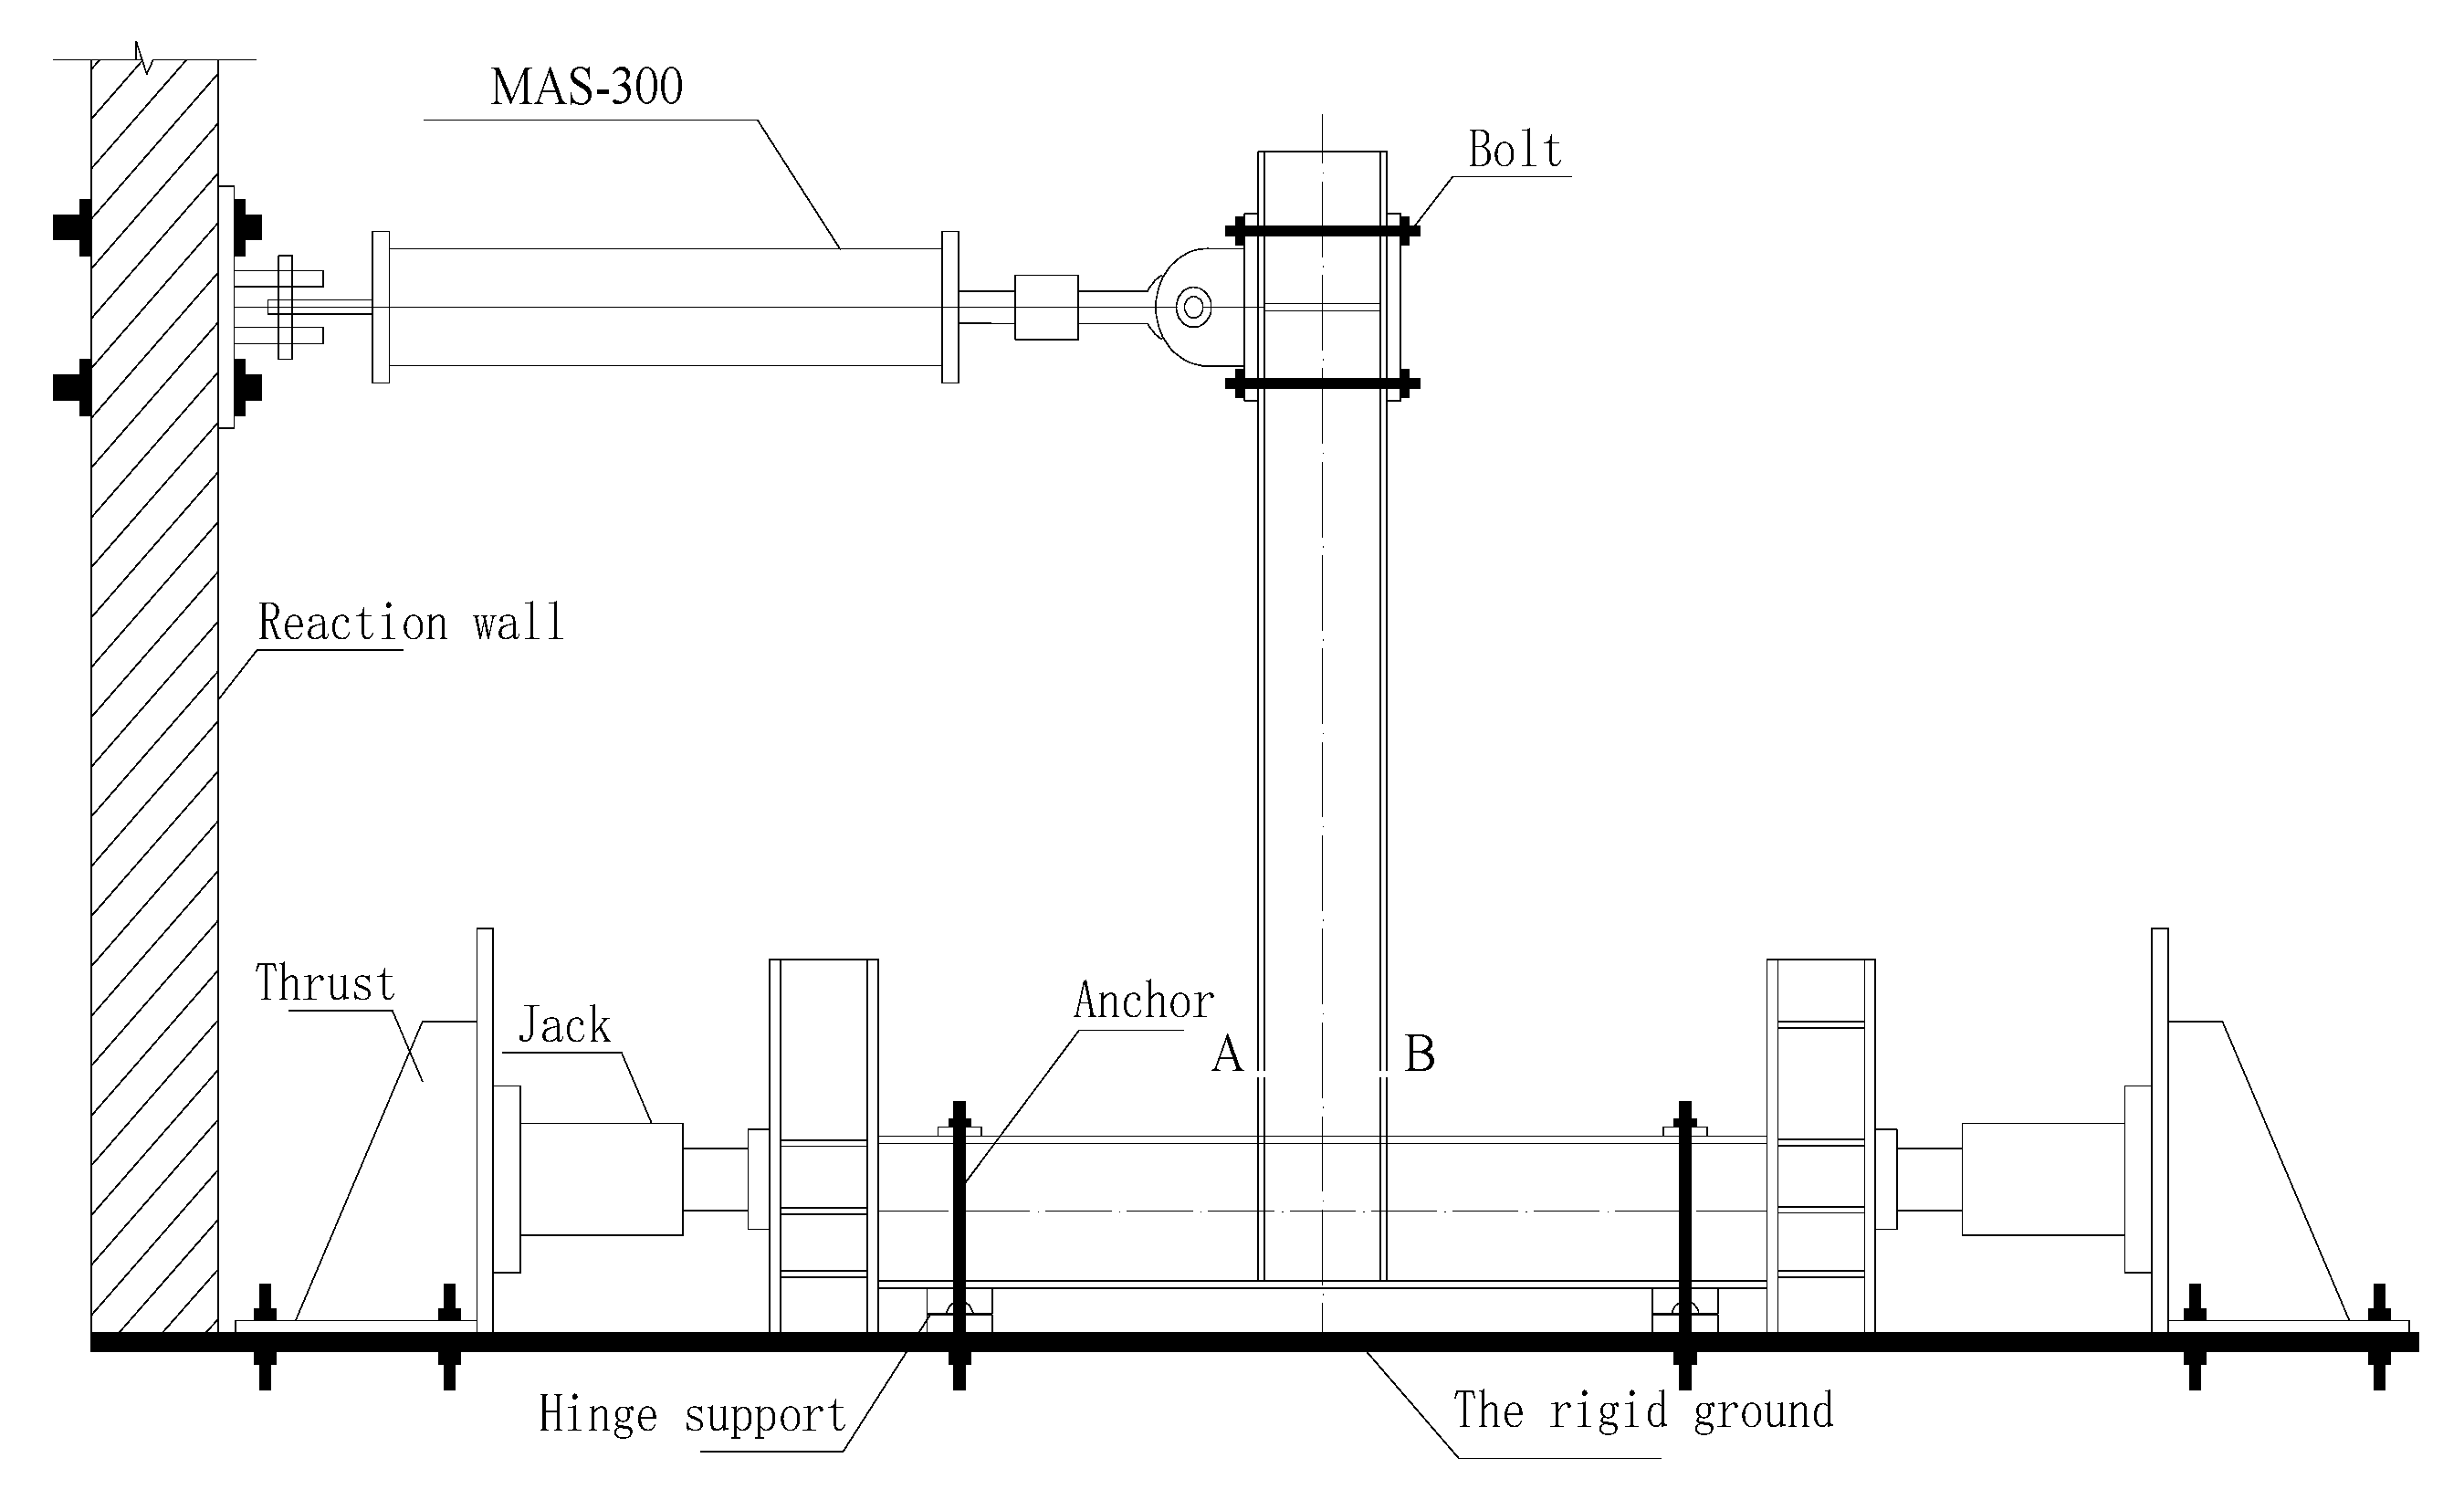
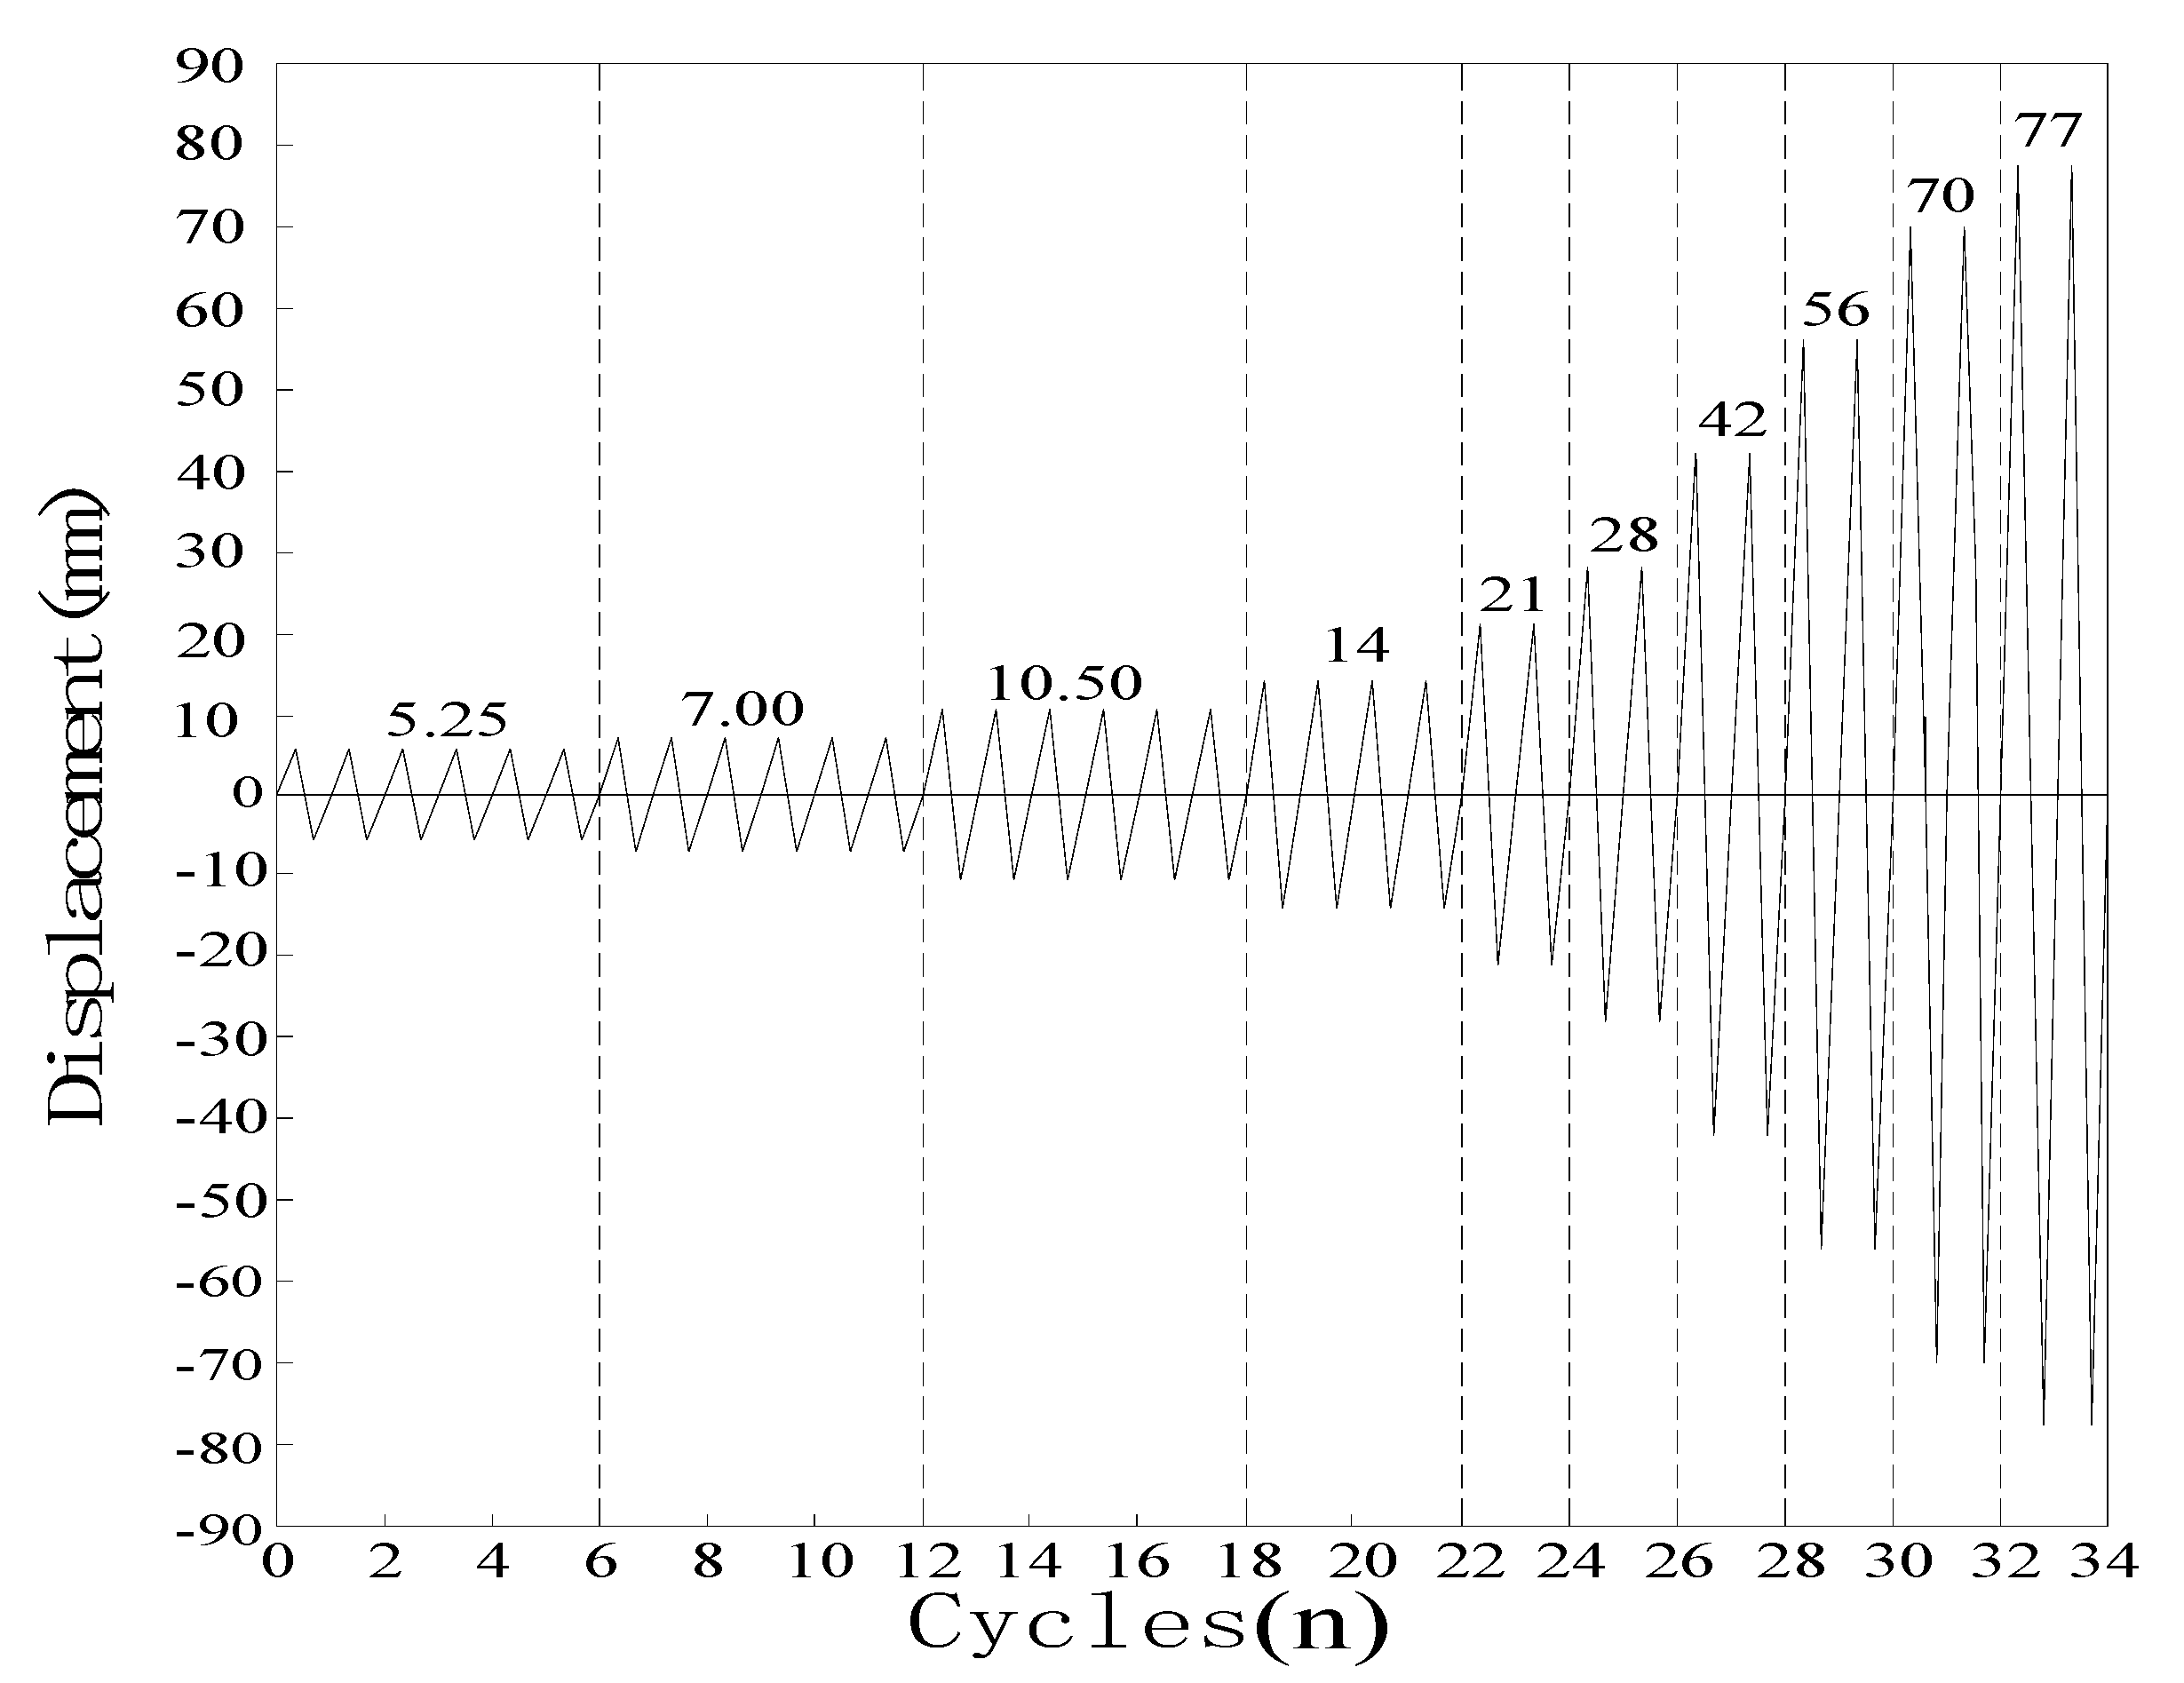
2.2. Test Loading and Measurement
3. Test Results and Analysis
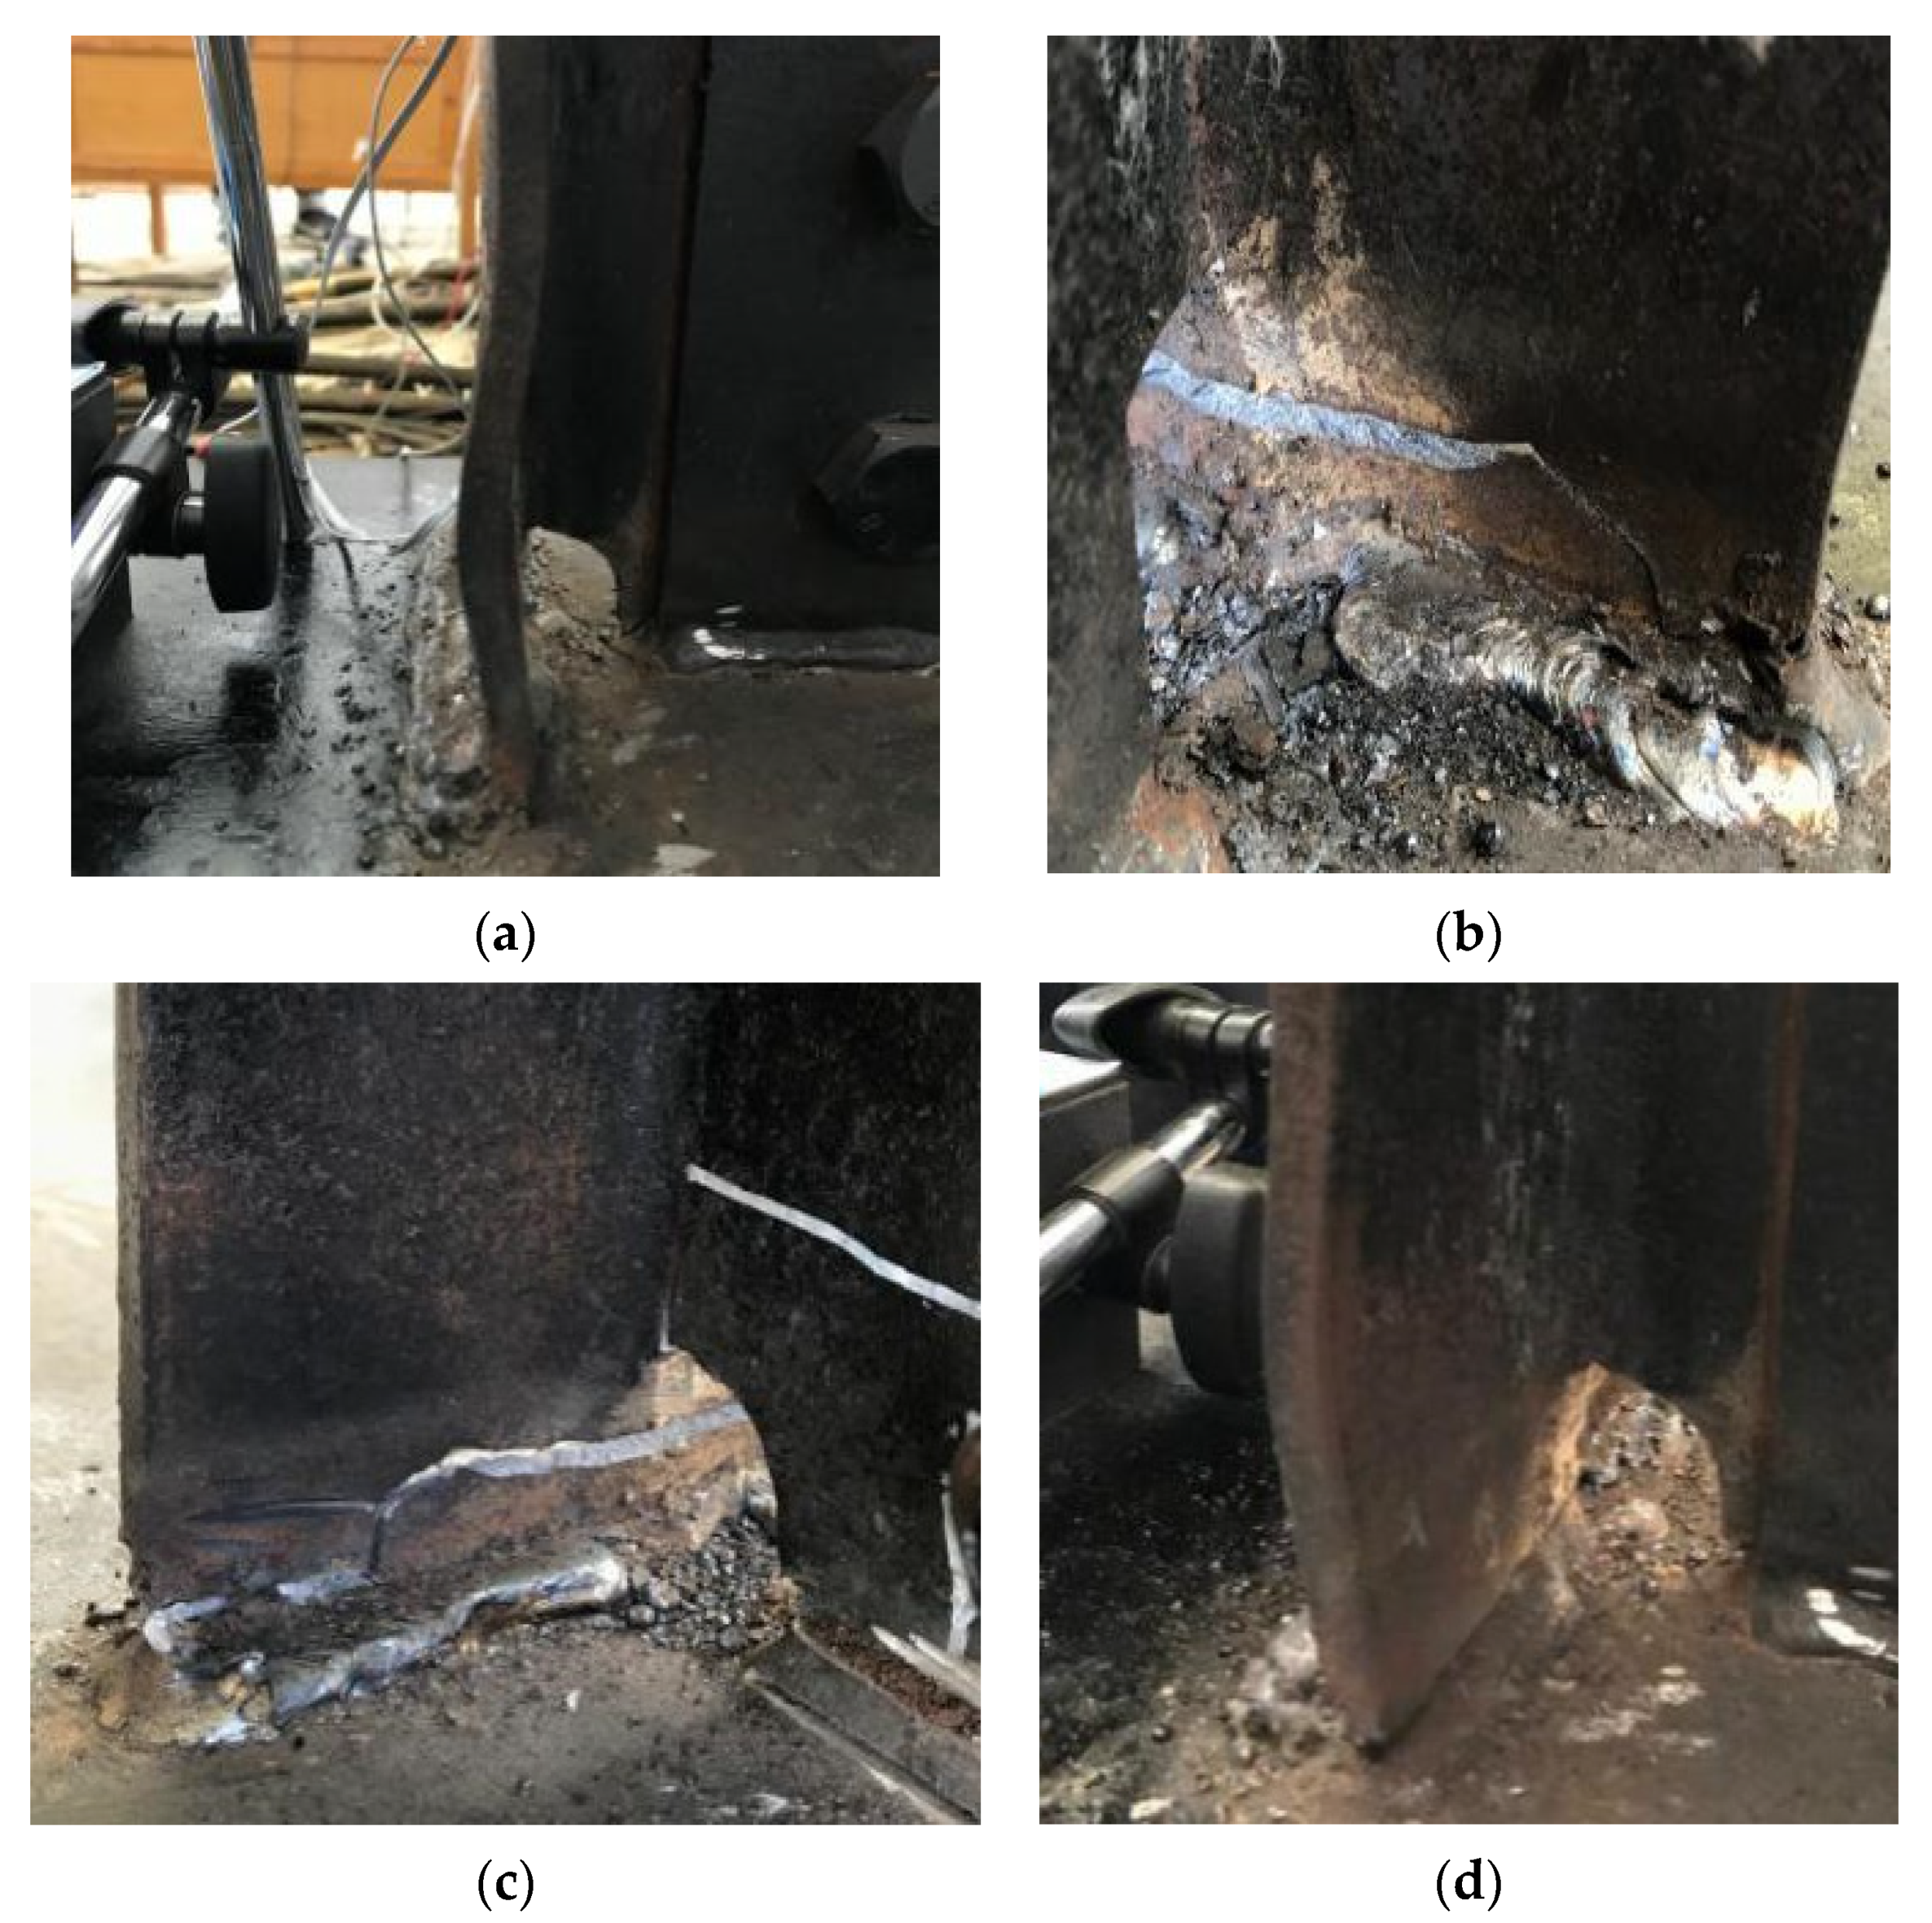
3.1. Test Phenomenon and Failure Form
- (1)
- NBN specimen
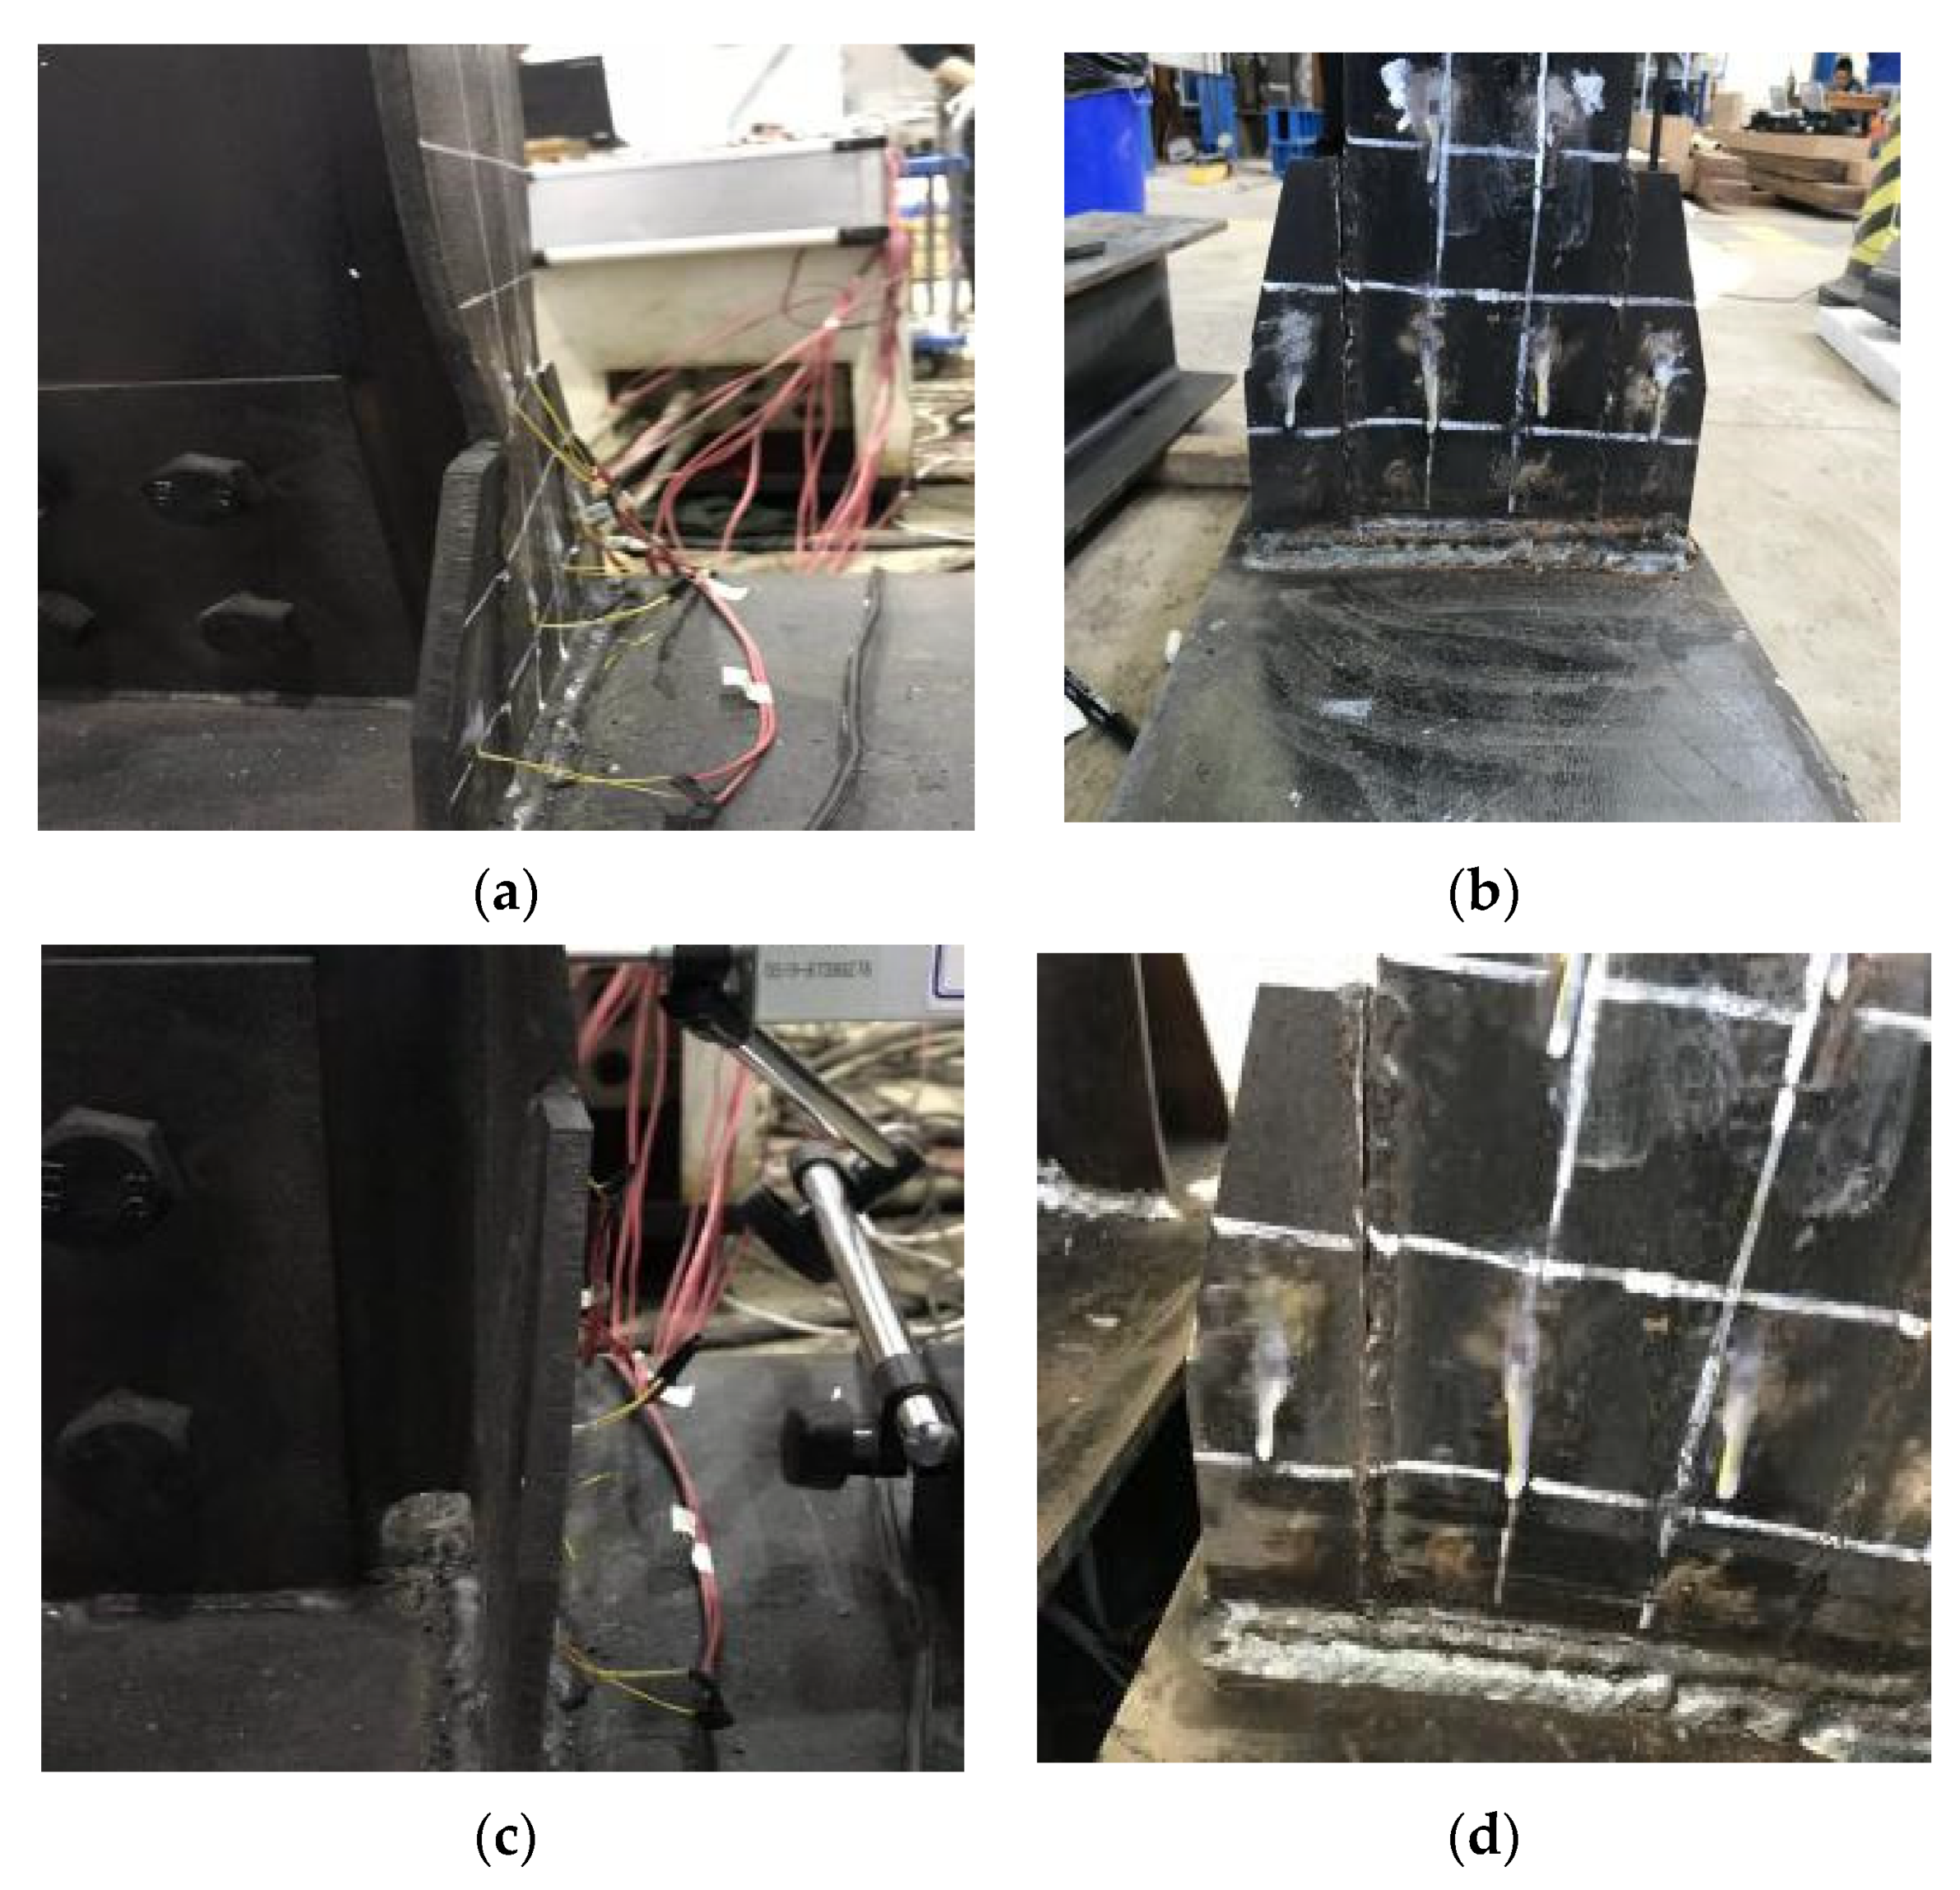
- (2)
- SRN specimen
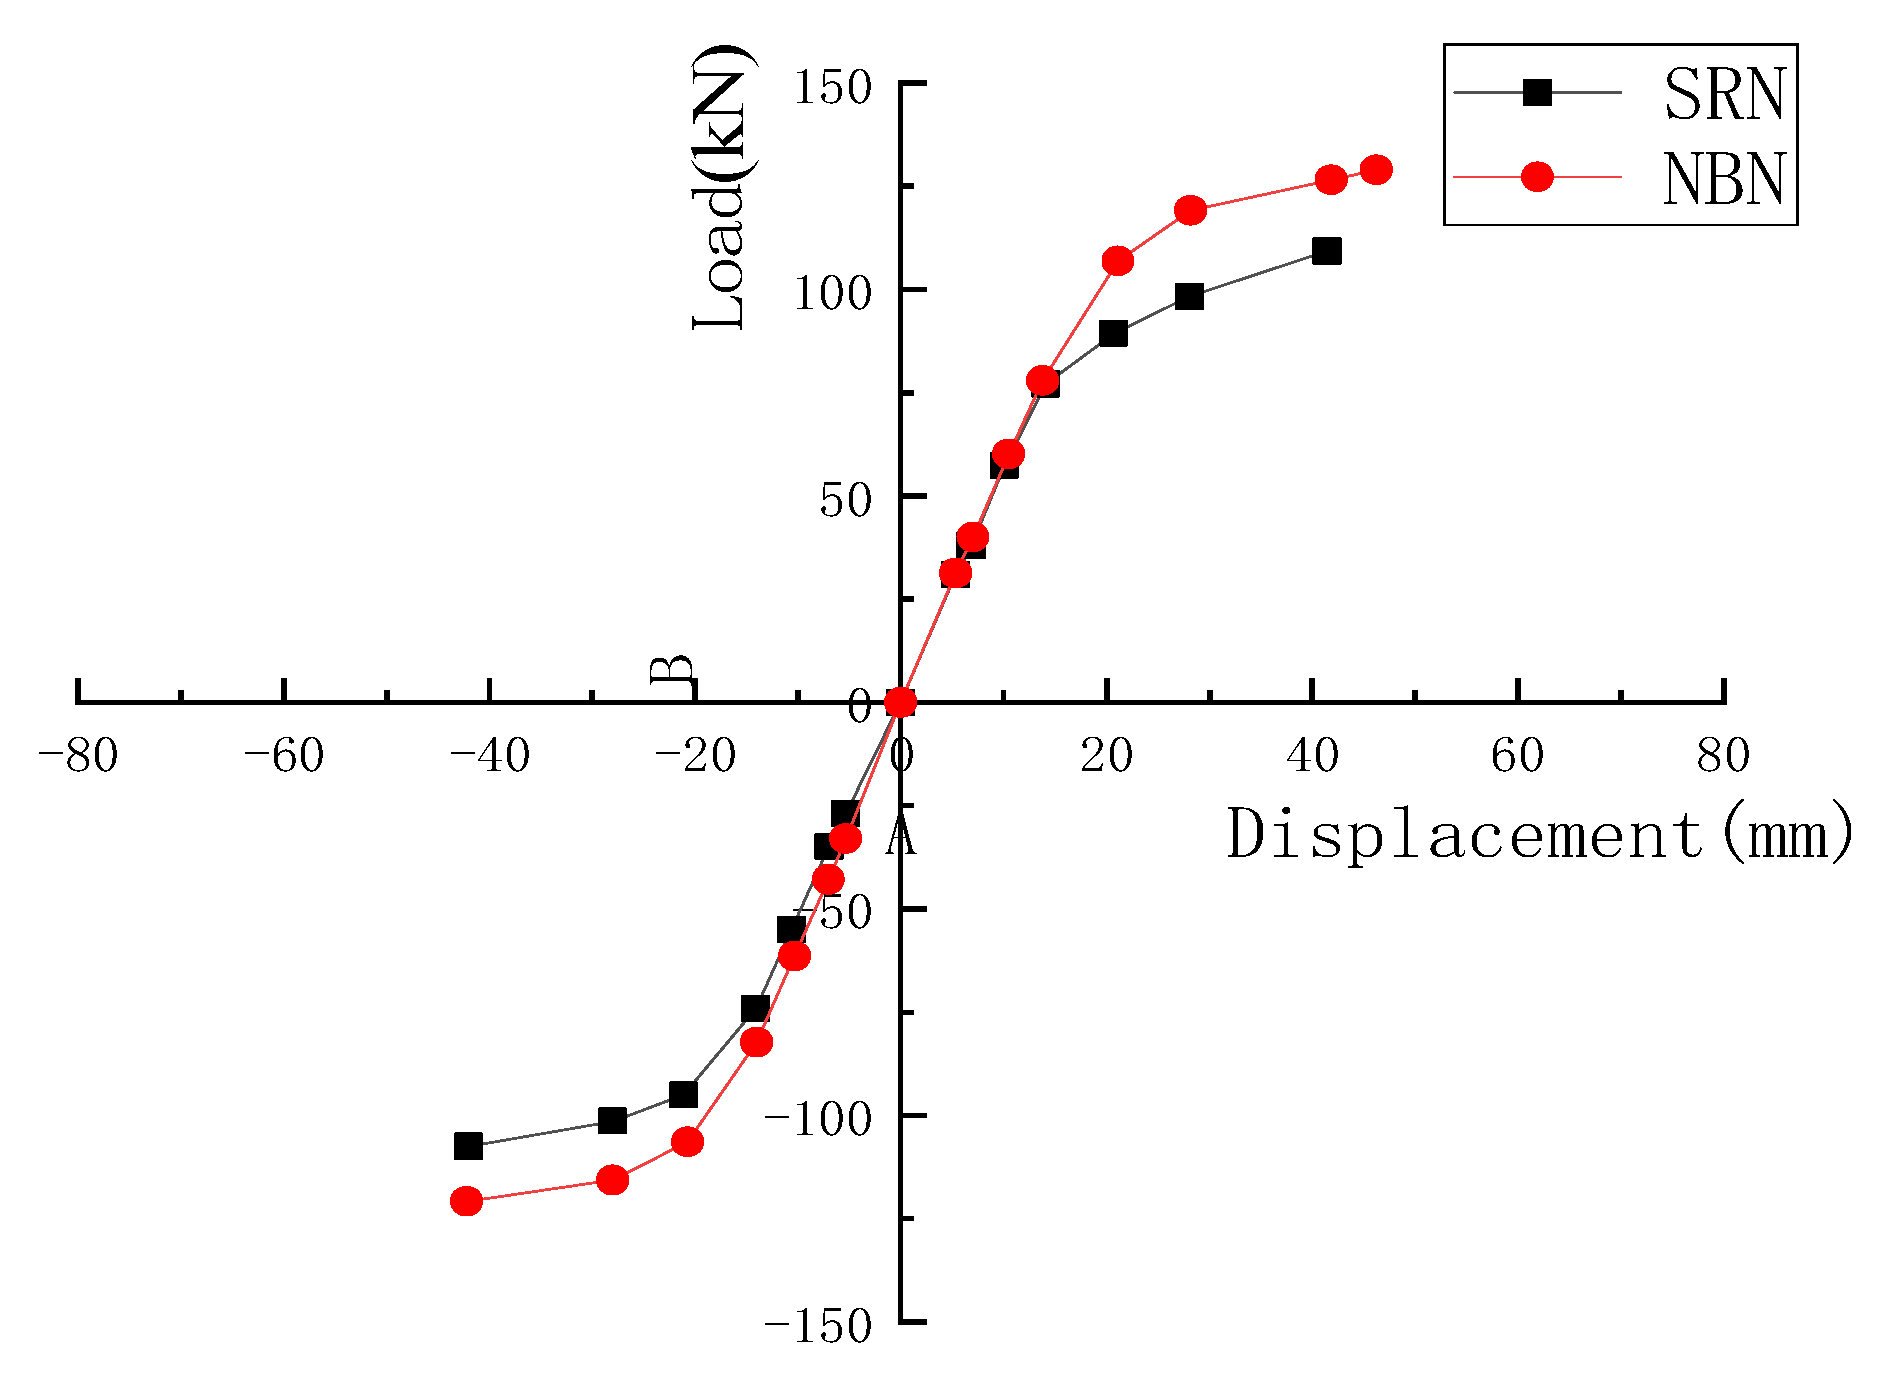
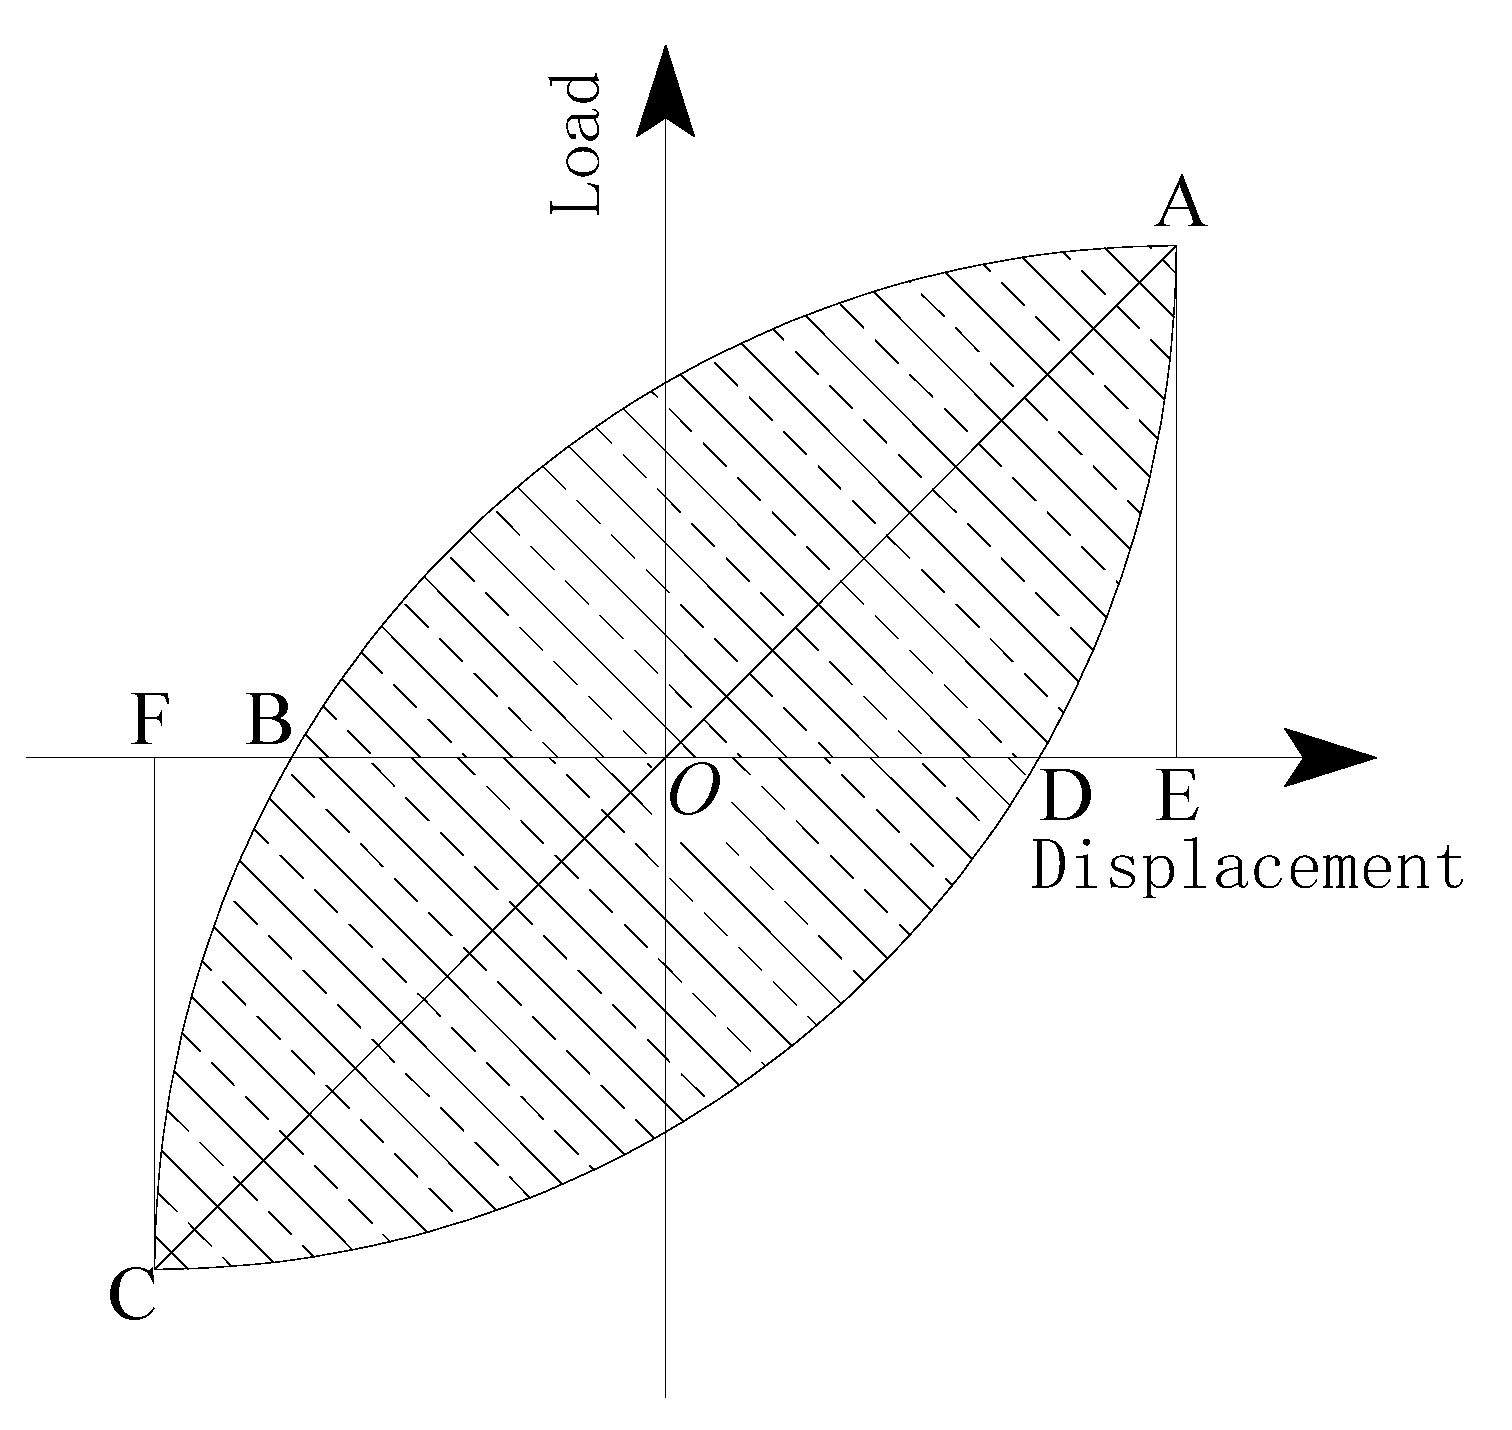
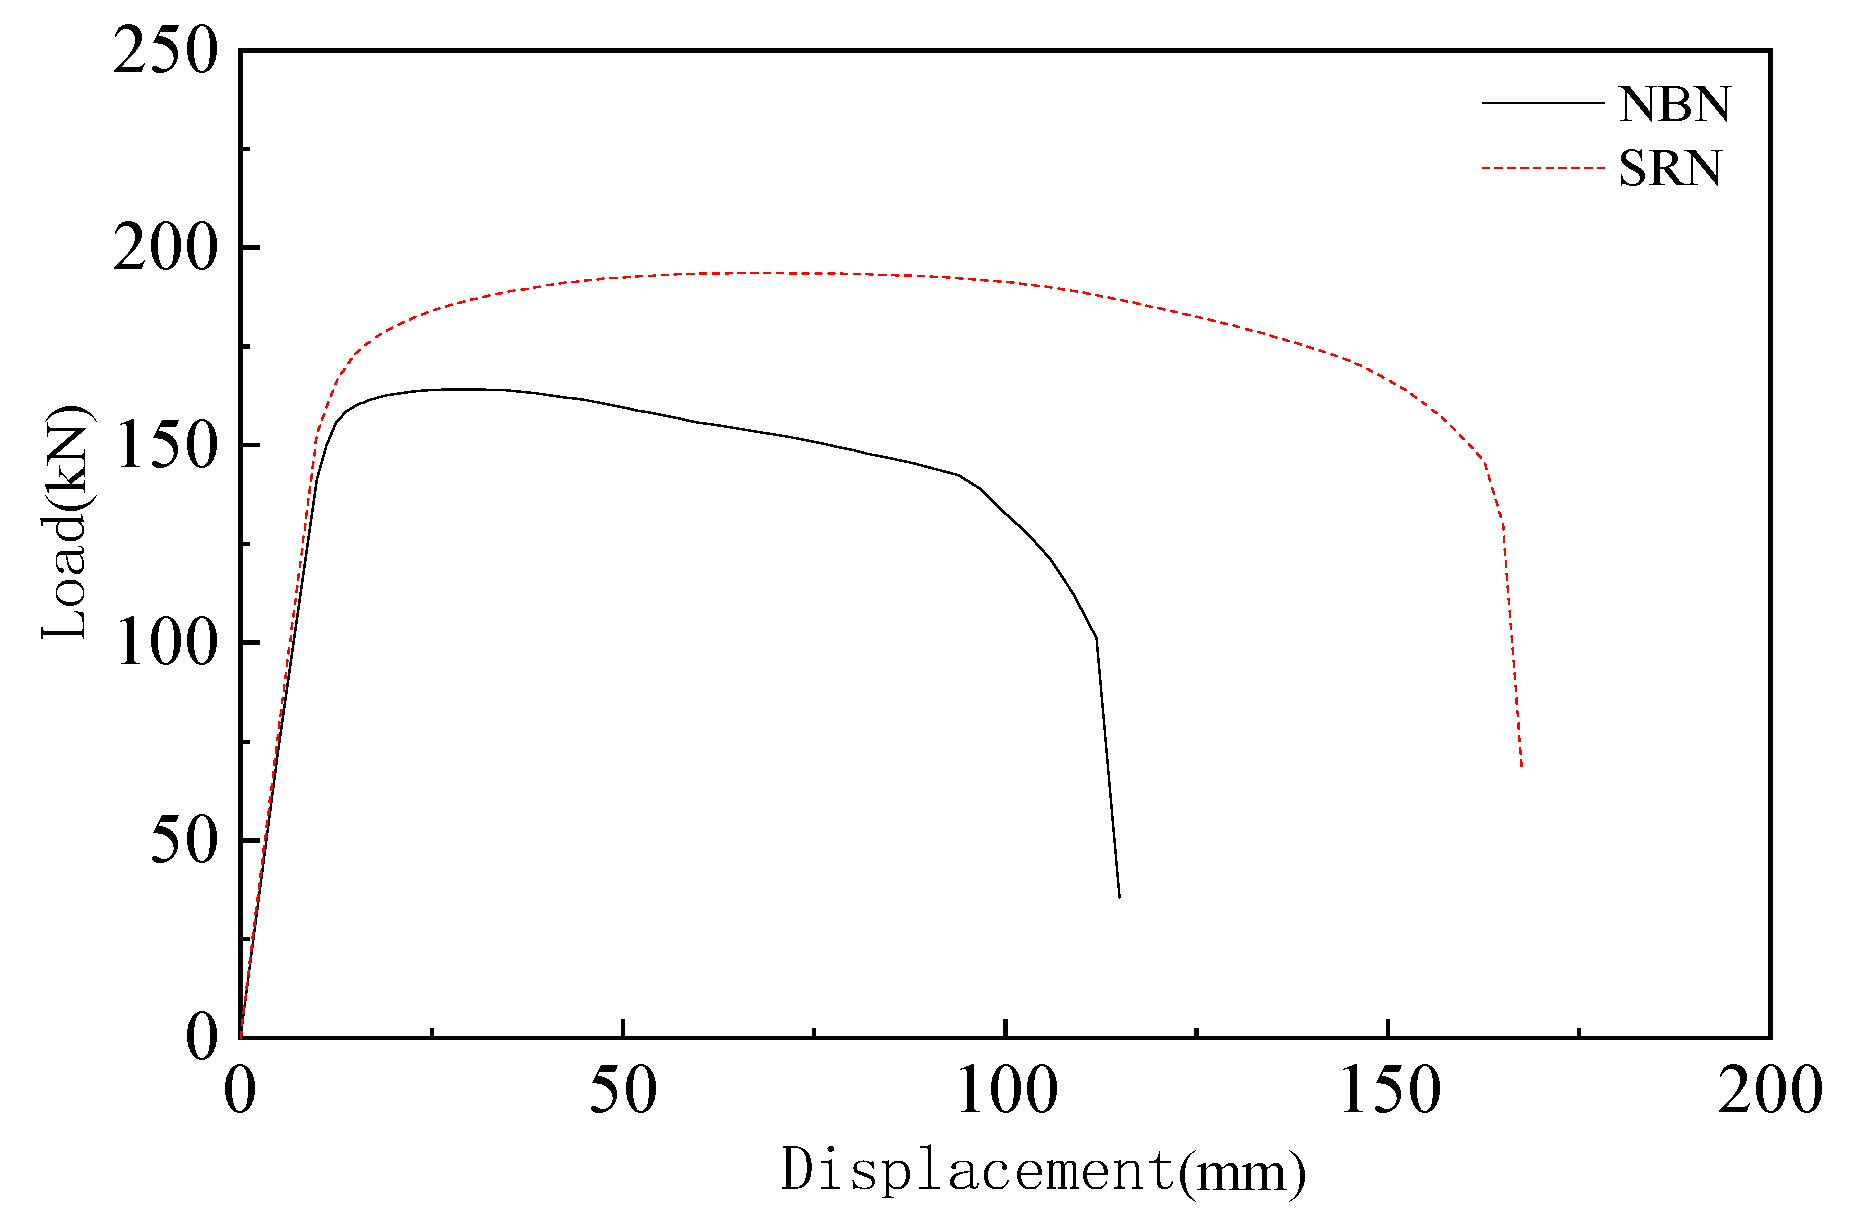
3.2. Hysteresis Curve and Skeleton Curve
3.3. Ductility
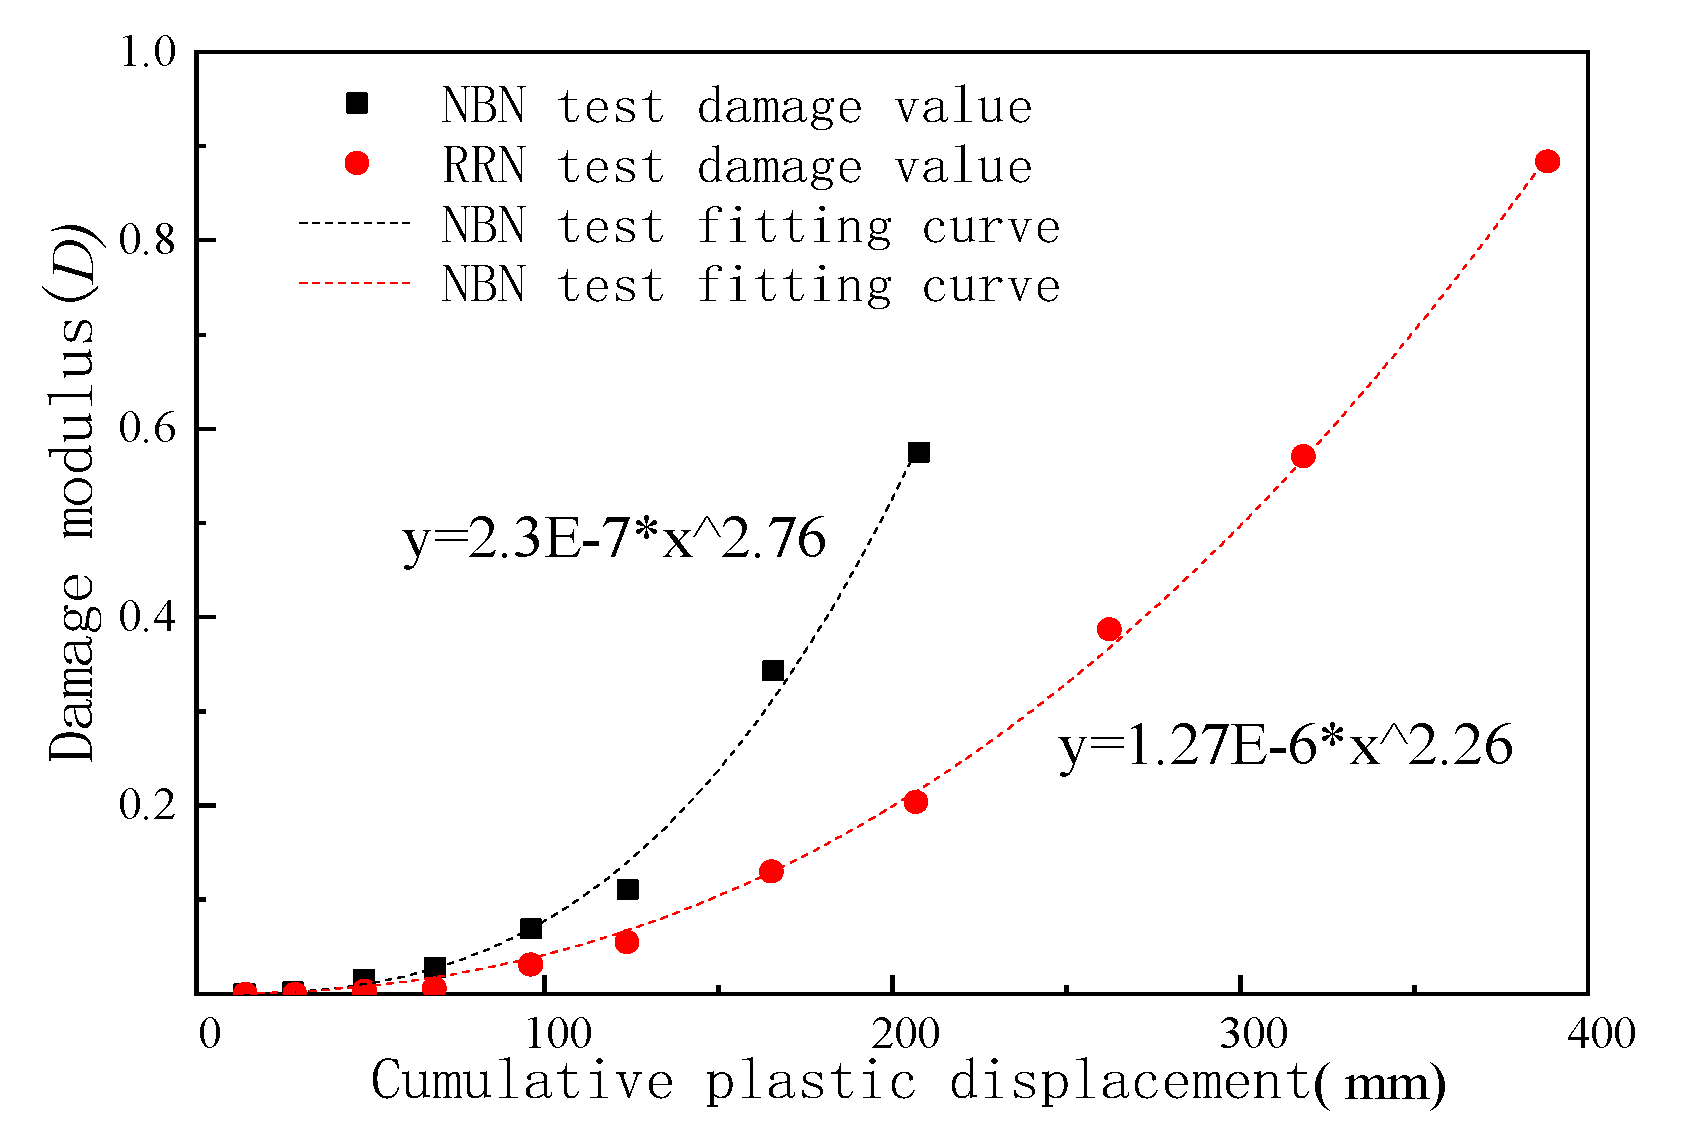
3.4. Nodal Damage Analysis
4. Finite Element Analysis
4.1. Model Building
4.2. Model Validation
4.2.1. Specimen Deformation
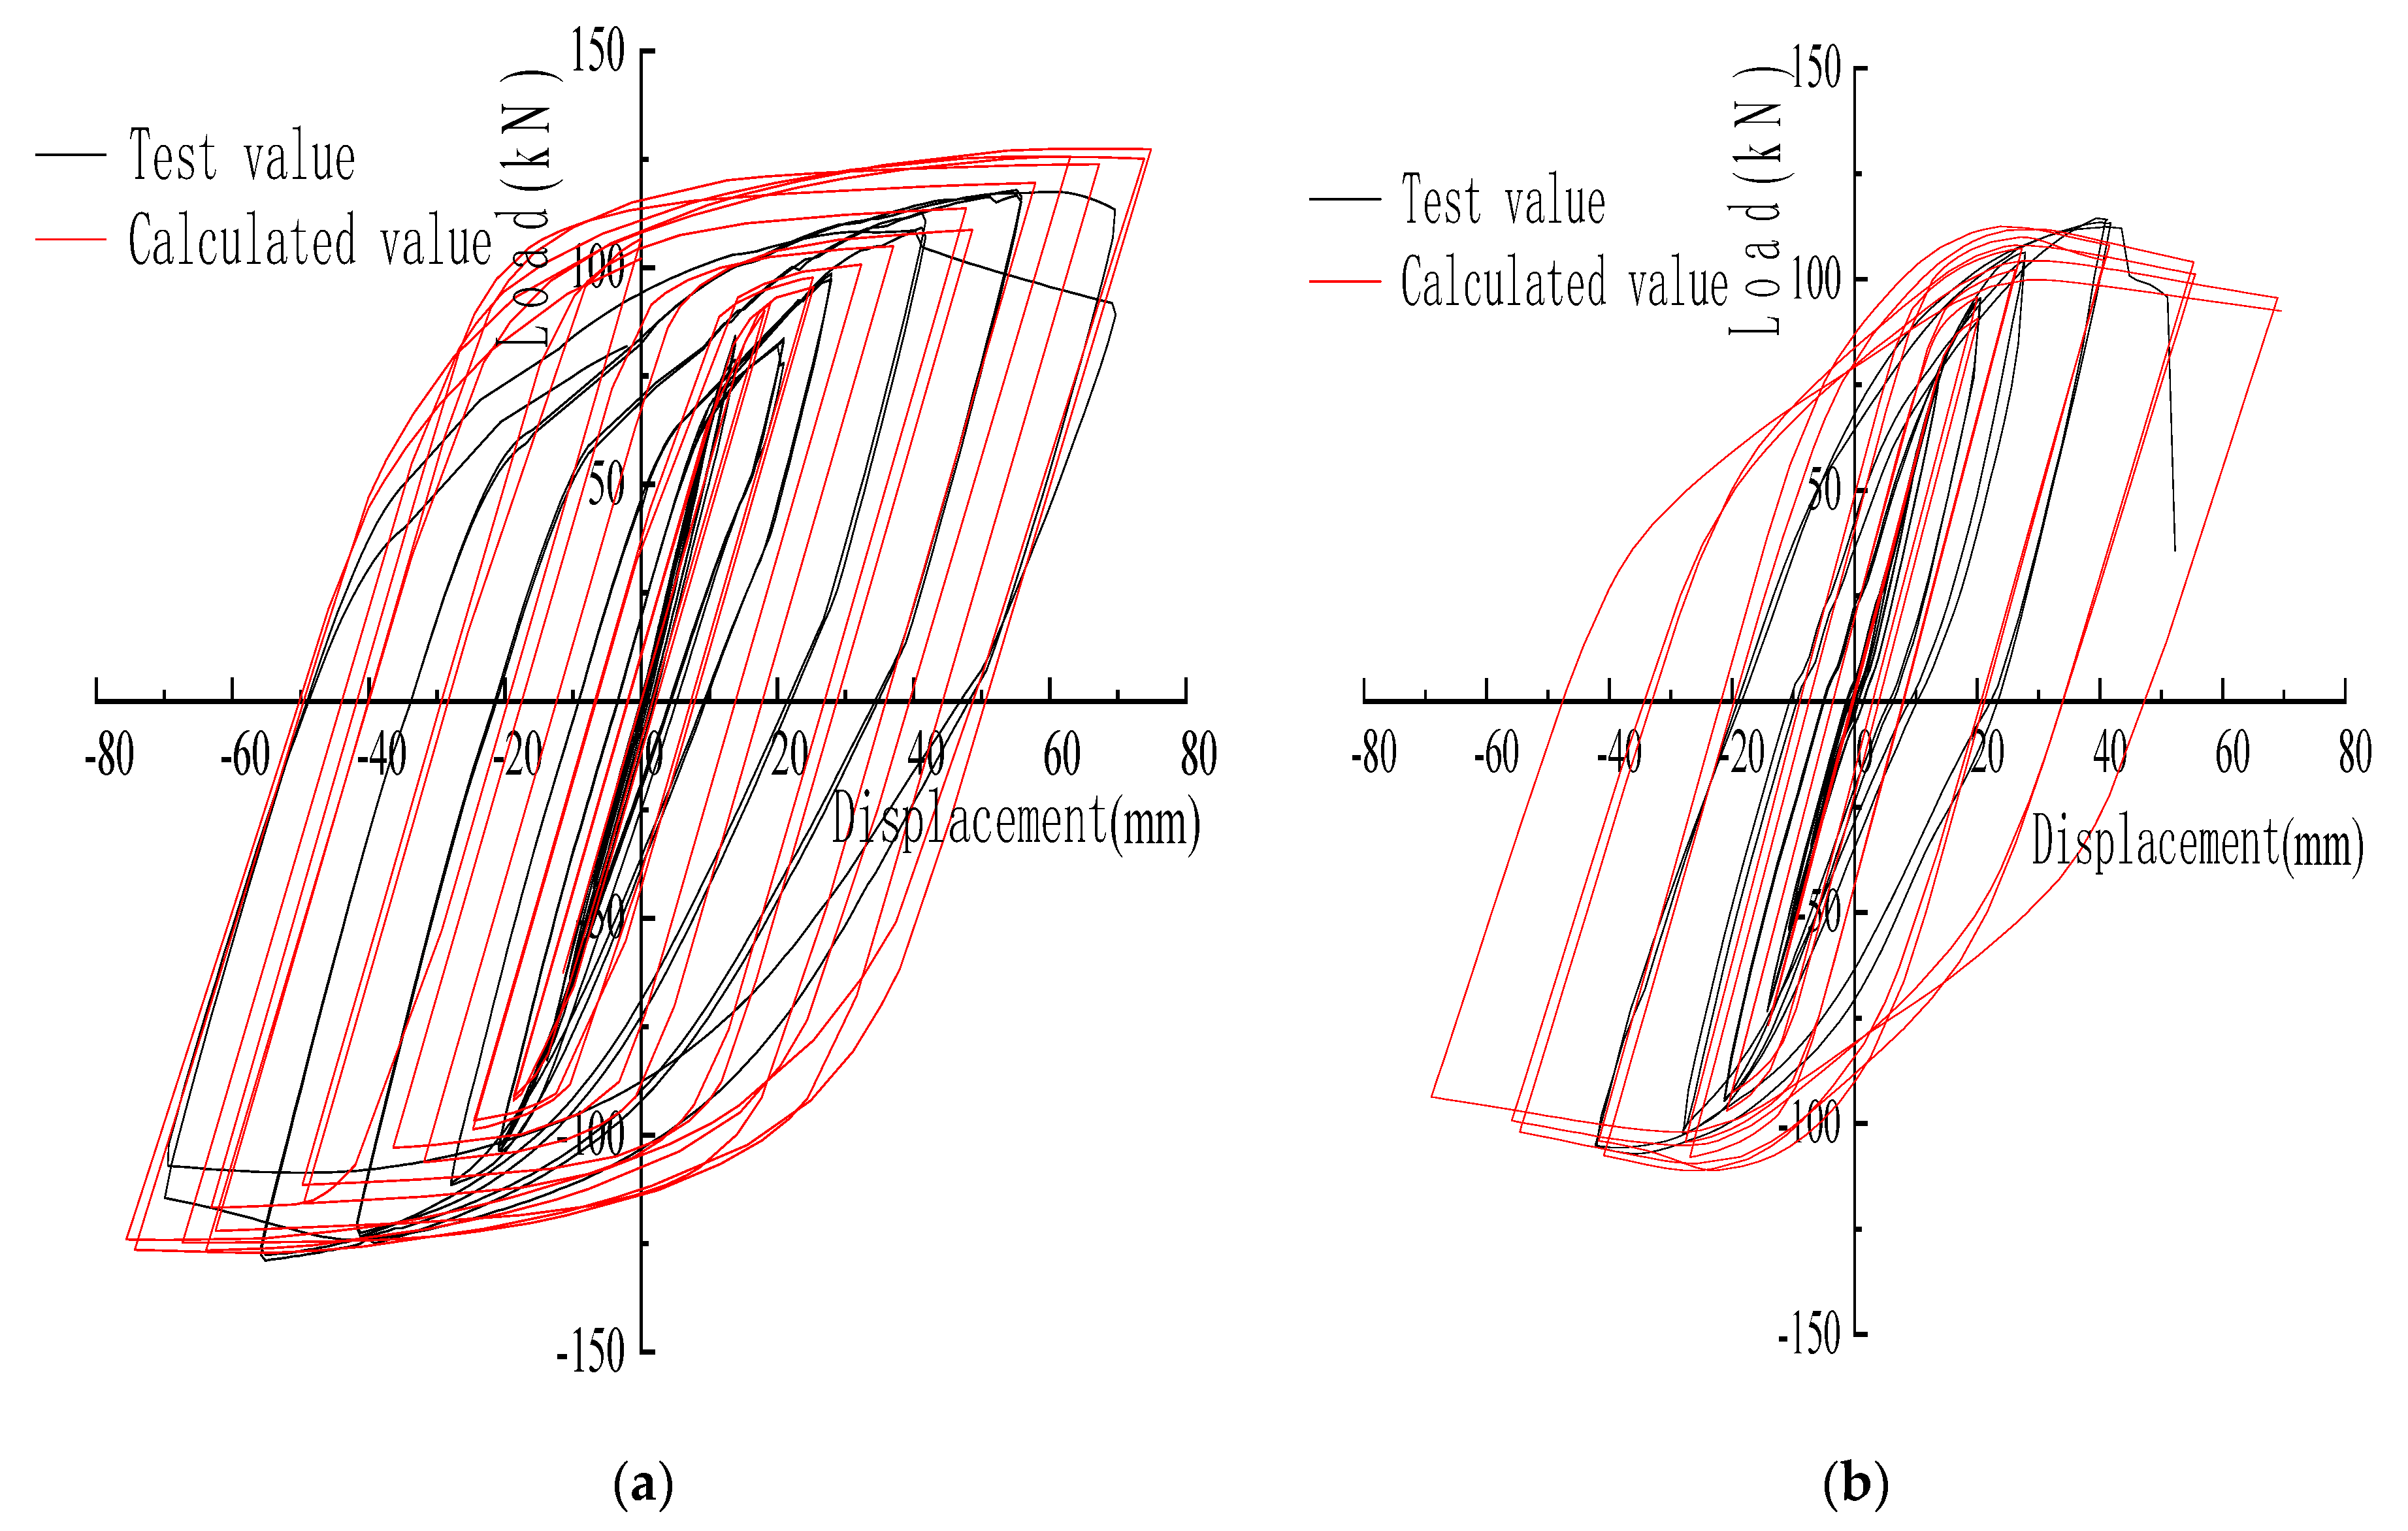
4.2.2. Comparison of Test Piece Hysteresis Curve and Skeleton Curve
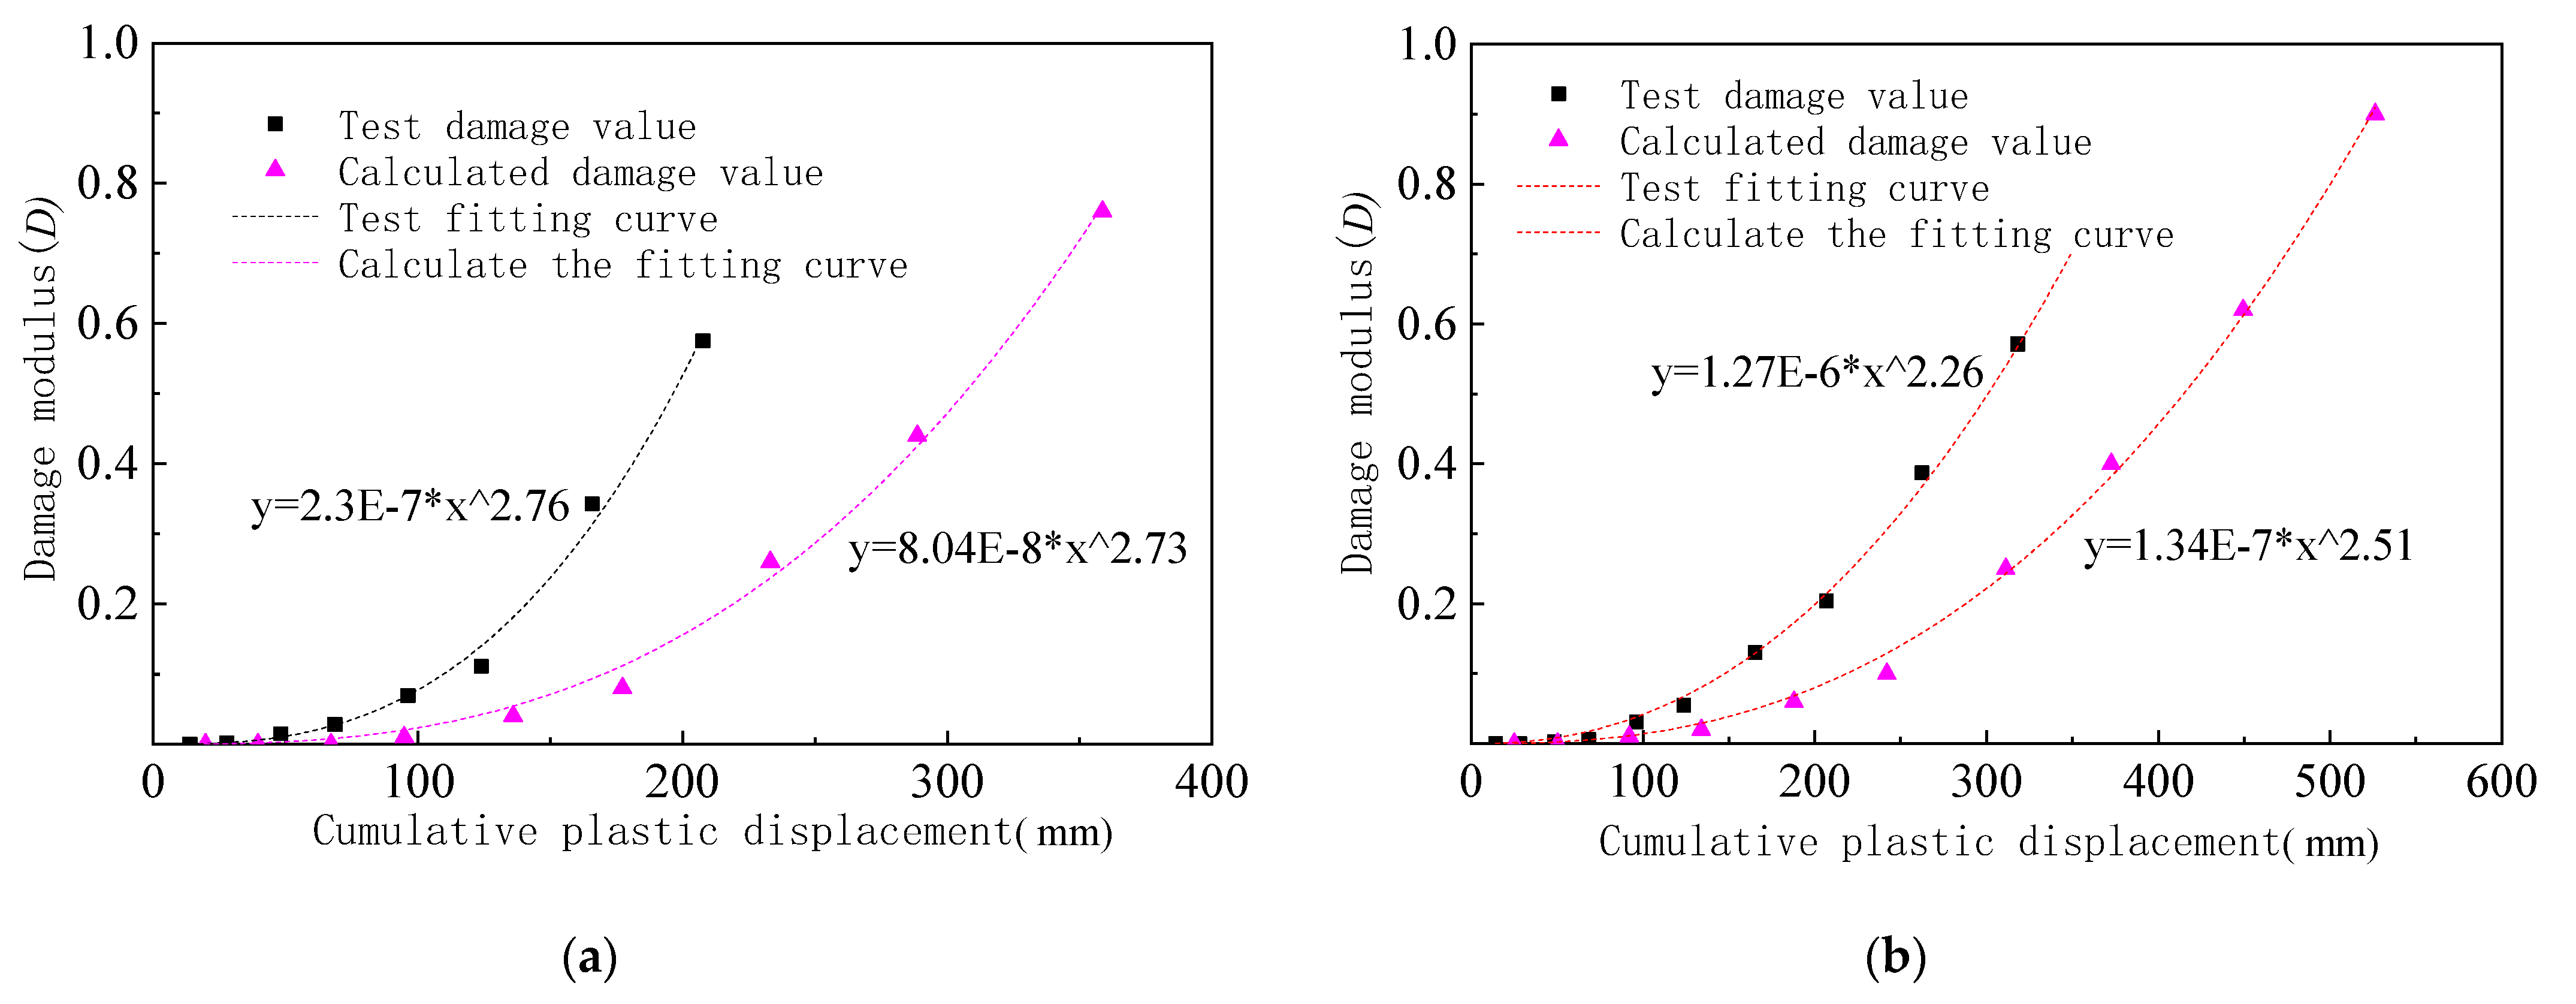
4.2.3. Damage Curve Comparison
5. Conclusions
- (1)
- In this test, the beam–column connections buckled at the beam flange and cracking occurred in the welds, and the specimens were then destroyed. The beam–column connections with reinforced side plates can effectively shift the plastic hinge away from the beam end, thus achieving the design goal of outward movement of the plastic hinge.
- (2)
- The comparison between NBN and SRN showed that SRN has a higher ultimate bearing capacity and a fully developed ductility performance, and a more significant outward movement of its plastic hinge. After the ultimate load was reached, the two connections begin to experience damage, but not stress concentration. This showed that both connections have good seismic performance.
- (3)
- By comparing the results of the numerical simulation and the structural test of NBN and SRN, the failure mode and the hysteresis curves were basically consistent, thus verifying the validity of the finite element analysis model and the accuracy of the finite element model parameters.
Author Contributions
Funding
Institutional Review Board Statement
Informed Consent Statement
Data Availability Statement
Conflicts of Interest
References
- Saher, E.K.; Sakr, M.A.; Khalifa, T.M.; Eladly, M.M. Modelling and behavior of beam-to-column con-nections under axial force and cyclic bending. J. Constr. Steel Res. 2017, 129, 171–184. [Google Scholar]
- Ma, H.W.; Wang, J.W.; Eric, M.L.; Wan, Z.Q.; Wang, K. Experimental study of the behavior of beam-column connections with expanded beam flanges. Steel Compos. Struct. 2019, 31, 319–327. [Google Scholar]
- Ma, H.W.; Zhang, Z.; Wang, K.; Liu, Y.; Guo, K.; Wang, F.Z.; Landolfo, R. Analysis on Fracture Behavior and Optimization of Beam-Column Connections with Expanded Flanges of Steel Frames. Adv. Civ. Eng. 2020, 2020, 8845824. [Google Scholar] [CrossRef]
- Bae, D. Experimental study on fatigue strength of in-plane welded gusset joints. KSCE J. Civ. Eng. 2004, 8, 89–93. [Google Scholar] [CrossRef]
- Cho, J.; Lee, B.; Moon, Y.; Van Tyne, C. Investigation of residual stress and post weld heat treatment of multi-pass welds by finite element method and experiments. J. Mater. Processing Technol. 2004, 155–156, 1690–1695. [Google Scholar] [CrossRef]
- Radhi, H.E.; Barrans, S. Finite Element Analysis of Effect of Weld Toe Radius and Plate Thickness on Fatigue Life of Butt Welded Join; University of Huddersfield: Huddersfield, UK, 2010. [Google Scholar]
- Chen, Y.X.; Peng, M.L.; Da, T.L. Study of Fatigue strength of structural details of U-Rib and diaphragm welding joints. Bridge Constr. 2014, 44, 63–68. [Google Scholar]
- Ma, J.P.; Xu, Y.L.; Zhang, C. Research on hysteretic performance of beam-column joints reinforced by steel frame side plates. J. Disaster Prev. Mitig. Eng. 2018, 38, 336–344. [Google Scholar]
- Lu, L.F.; Wang, L.L.; Xu, Y.L.; Zhang, H.S. Finite element analysis on hysteretic behavior of joint with side-plate reinforced beam flange weak-axis connections of steel frames. Xi’an Jianzhu Keji Daxue Xuebao/J. Xi’an Univ. Archit. Technol. 2017, 49, 646–653. [Google Scholar]
- Yu, S.G. Research on Hysteretic Performance of Fabricated Beam Flange Side Plate Strengthening-Dog Bone Weakened Joint; Chang’an University: Xi’an, China, 2019. [Google Scholar]
- Wang, Y. Seismic Design Theory and Application of New Ductile Joints in Steel Structures; Science Press: Beijing, China, 2012. [Google Scholar]
- Kim, T.; Whittaker, A.S.; Gilani, A.S.J. Experimental evaluation of plate-reinforced steel mo-ment-resisting connections. J. Struct. Eng. 2002, 128, 483–491. [Google Scholar] [CrossRef]
- Guo, H.C.; Zhou, X.Z.; Li, W. Experimental and numerical study on seismic performance of Q690 high-strength steel plate reinforced joints. Thin-Walled Struct. 2021, 161, 107510. [Google Scholar] [CrossRef]
- Nagel, S.; Knodel, P.; Ummenhofer, T. Testing of ultra-low cycle fatigue at complex loading scenarios. Procedia Struct. Integr. 2017, 5, 1377–1384. [Google Scholar] [CrossRef]
- Liu, Y.; Jia, L.J.; Ge, H.B. Ductile-fatigue transition fracture mode of welded T-joints under quasi-static cyclic large plastic strain loading. Eng. Fract. Mech. 2017, 176, 38–59. [Google Scholar] [CrossRef]
- Zhong, Z.P.; Liu, H.; Ma, J.J. Fracture assessment of the weld–base metal interface of high-strength steel weld joint. Strength Mater. 2018, 50, 11–19. [Google Scholar] [CrossRef]
- Xiong, J. Research on Damage Performance and Calculation Model of Welded Joints of Steel Frame under Strong Earthquake; Tsinghua University: Beijing, China, 2011. [Google Scholar]
- Liao, F.F.; Wang, W.; Chen, Y.Y. Prediction of ultra-low cycle fatigue fracture of steel structure joints under reciprocating loads. J. Tongji Univ. 2014, 42, 540–546. [Google Scholar]
- Wei, K.F.; Han, D. Damage analysis of welded joints of steel structure and measures to improve seismic performance. Ind. Constr. 2016, 46, 163–168. [Google Scholar]
- Liu, D. Analysis of Fracture Characteristics of Expanded Wing Joints and Dog-Bone Joints in Steel Frame; Qingdao Technological University: Qingdao, China, 2016. [Google Scholar]
- Liu, X.Y.; Wang, Y.Q.; Shi, Y.J.; Tan, Q.H. Experimental study on low-cycle fatigue fracture perfor-mance of high-strength steel frame beam-column joints. J. Build. Struct. 2018, 39, 28–36. [Google Scholar]
- Ma, H.W.; Zheng, H.; Zhang, W.; Tang, Z.Z.; Eric, M.L. Experimental and Numerical Study of Mechanical Behavior of Welded Steel Plate Joints. Metals 2020, 10, 1293. [Google Scholar] [CrossRef]
- Ma, H.W.; Zhang, H.; Zhang, W.; Tang, Z.Z. Experimental and Numerical Study of Mechanical Proper-ties for the Double-Ribbed Reinforced Beam-Column Connection. Adv. Steel Constr. 2020, 16, 297–309. [Google Scholar]
- Wang, S.S.; Geng, H.Q.; Wu, Y.Q.; Zhao, Y.K. Quasi-static test study on seismic performance of steel frame beam-column joints. J. Disaster Prev. Sci. Technol. Coll. 2016, 18, 14–20. (In Chinese) [Google Scholar]
- Song, Q.Y.; Heidarpour, A.; Zhao, X.L.; Han, L.H. Performance of flange-welded/web-bolted steel I-beam to hollow tubular column connections under seismic load. Thin-Walled Struct. 2017, 116, 250–264. [Google Scholar] [CrossRef]
- Zhao, X.; Ma, H.J.; Ding, K. Optimal wind-induced vibration attenuation design of viscous damper systems for super tall structures. J. Vib. Eng. 2018, 31, 12–19. [Google Scholar]
- Yang, Y.; Ye, K.; Li, C.; Michailides, C.; Zhang, W. Dynamic behavior of wind turbines influenced by aerodynamic damping and earthquake intensity. Wind Energy 2018, 21, 303–319. [Google Scholar] [CrossRef]
- Cui, N.; Ma, Z.G.; Yang, D.W.; Qi, F.Z.; Yang, W.M.; Luo, N.; Zhou, Y.J. Coal pillar size optimization and energy analysis of roadway driving along the island face. J. Min. Saf. Eng. 2017, 34, 914–920. [Google Scholar]
- Thanh, N.D.; Filip, C.; Filippou, A. damage model for structures with degrading response. Earthq. Eng. Struct. Dyn. 2017, 47, 311–332. [Google Scholar]
- Bao, Y.; Cen, S.; Li, C.F. Distortion-resistant and locking-free eight-node elements effectively capturing the edge effects of Mindlin–Reissner plates. Eng. Comput. 2017, 34, 548–586. [Google Scholar] [CrossRef] [Green Version]
- Jie, X.; Hui, J. Numerical analysis for controlling residual stresses in welding design of dissimilar materials girth joints. Int. J. Precis. Eng. Manuf. 2018, 19, 57–66. [Google Scholar]


| Parmeter | Yield Strength fy/MPa | Tensile Strength fu/MPa | Elastic Modulus E/MPa |
|---|---|---|---|
| Q345B Steel | 358.92 | 589 | 203,069 |
| E5015 Electrode | 382.46 | 599.87 | 204,720 |
| Specimen | Force Direction | Δy/mm | Py/kN | Δu/mm | Pu/kN | μ |  |
|---|---|---|---|---|---|---|---|
| NBN | Positve | 20.64 | 88.56 | 51.33 | 114.00 | 2.04 | 2.08 |
| Negative | 19.85 | 89.98 | 42.02 | 106.30 | 2.12 | ||
| SRN | Positve | 23.03 | 110.18 | 49.98 | 129.03 | 2.17 | 2.57 |
| Negative | 20.06 | 100.62 | 59.36 | 136.15 | 2.96 |
Publisher’s Note: MDPI stays neutral with regard to jurisdictional claims in published maps and institutional affiliations. |
© 2022 by the authors. Licensee MDPI, Basel, Switzerland. This article is an open access article distributed under the terms and conditions of the Creative Commons Attribution (CC BY) license (https://creativecommons.org/licenses/by/4.0/).
Share and Cite
Ma, H.; Wang, Y.; Zhang, W.; Liu, Y. Experimental and Numerical Analysis of the Behavior of Beam–Column Connections with Reinforced Side Plates. Metals 2022, 12, 810. https://doi.org/10.3390/met12050810
Ma H, Wang Y, Zhang W, Liu Y. Experimental and Numerical Analysis of the Behavior of Beam–Column Connections with Reinforced Side Plates. Metals. 2022; 12(5):810. https://doi.org/10.3390/met12050810
Chicago/Turabian StyleMa, Hongwei, Yiming Wang, Wei Zhang, and Yan Liu. 2022. "Experimental and Numerical Analysis of the Behavior of Beam–Column Connections with Reinforced Side Plates" Metals 12, no. 5: 810. https://doi.org/10.3390/met12050810
APA StyleMa, H., Wang, Y., Zhang, W., & Liu, Y. (2022). Experimental and Numerical Analysis of the Behavior of Beam–Column Connections with Reinforced Side Plates. Metals, 12(5), 810. https://doi.org/10.3390/met12050810