Author Contributions
Conceptualization E.P.; methodology E.P., A.F.J. and W.A.M.; software M.A.M.; validation E.P., W.A.M. and M.A.M.; formal analysis E.P., C.A., A.F.J. and W.A.M.; investigation E.P., A.F.J., W.A.M., M.A. and F.B.; resources E.P., C.A., A.S.H., M.A., M.A.M. and F.B.; data curation E.P. and W.A.M.; writing—original draft preparation E.P., A.F.J.; writing—review and editing E.P., C.A., A.F.J., W.A.M., A.S.H., M.A., M.A.M. and F.B.; visualization E.P., A.F.J. and M.A.M.; supervision E.P., W.A.M., M.A. and F.B.; project administration E.P., A.S.H., F.B. and M.A.; funding acquisition E.P., C.A. and A.S.H. All authors have read and agreed to the published version of the manuscript.
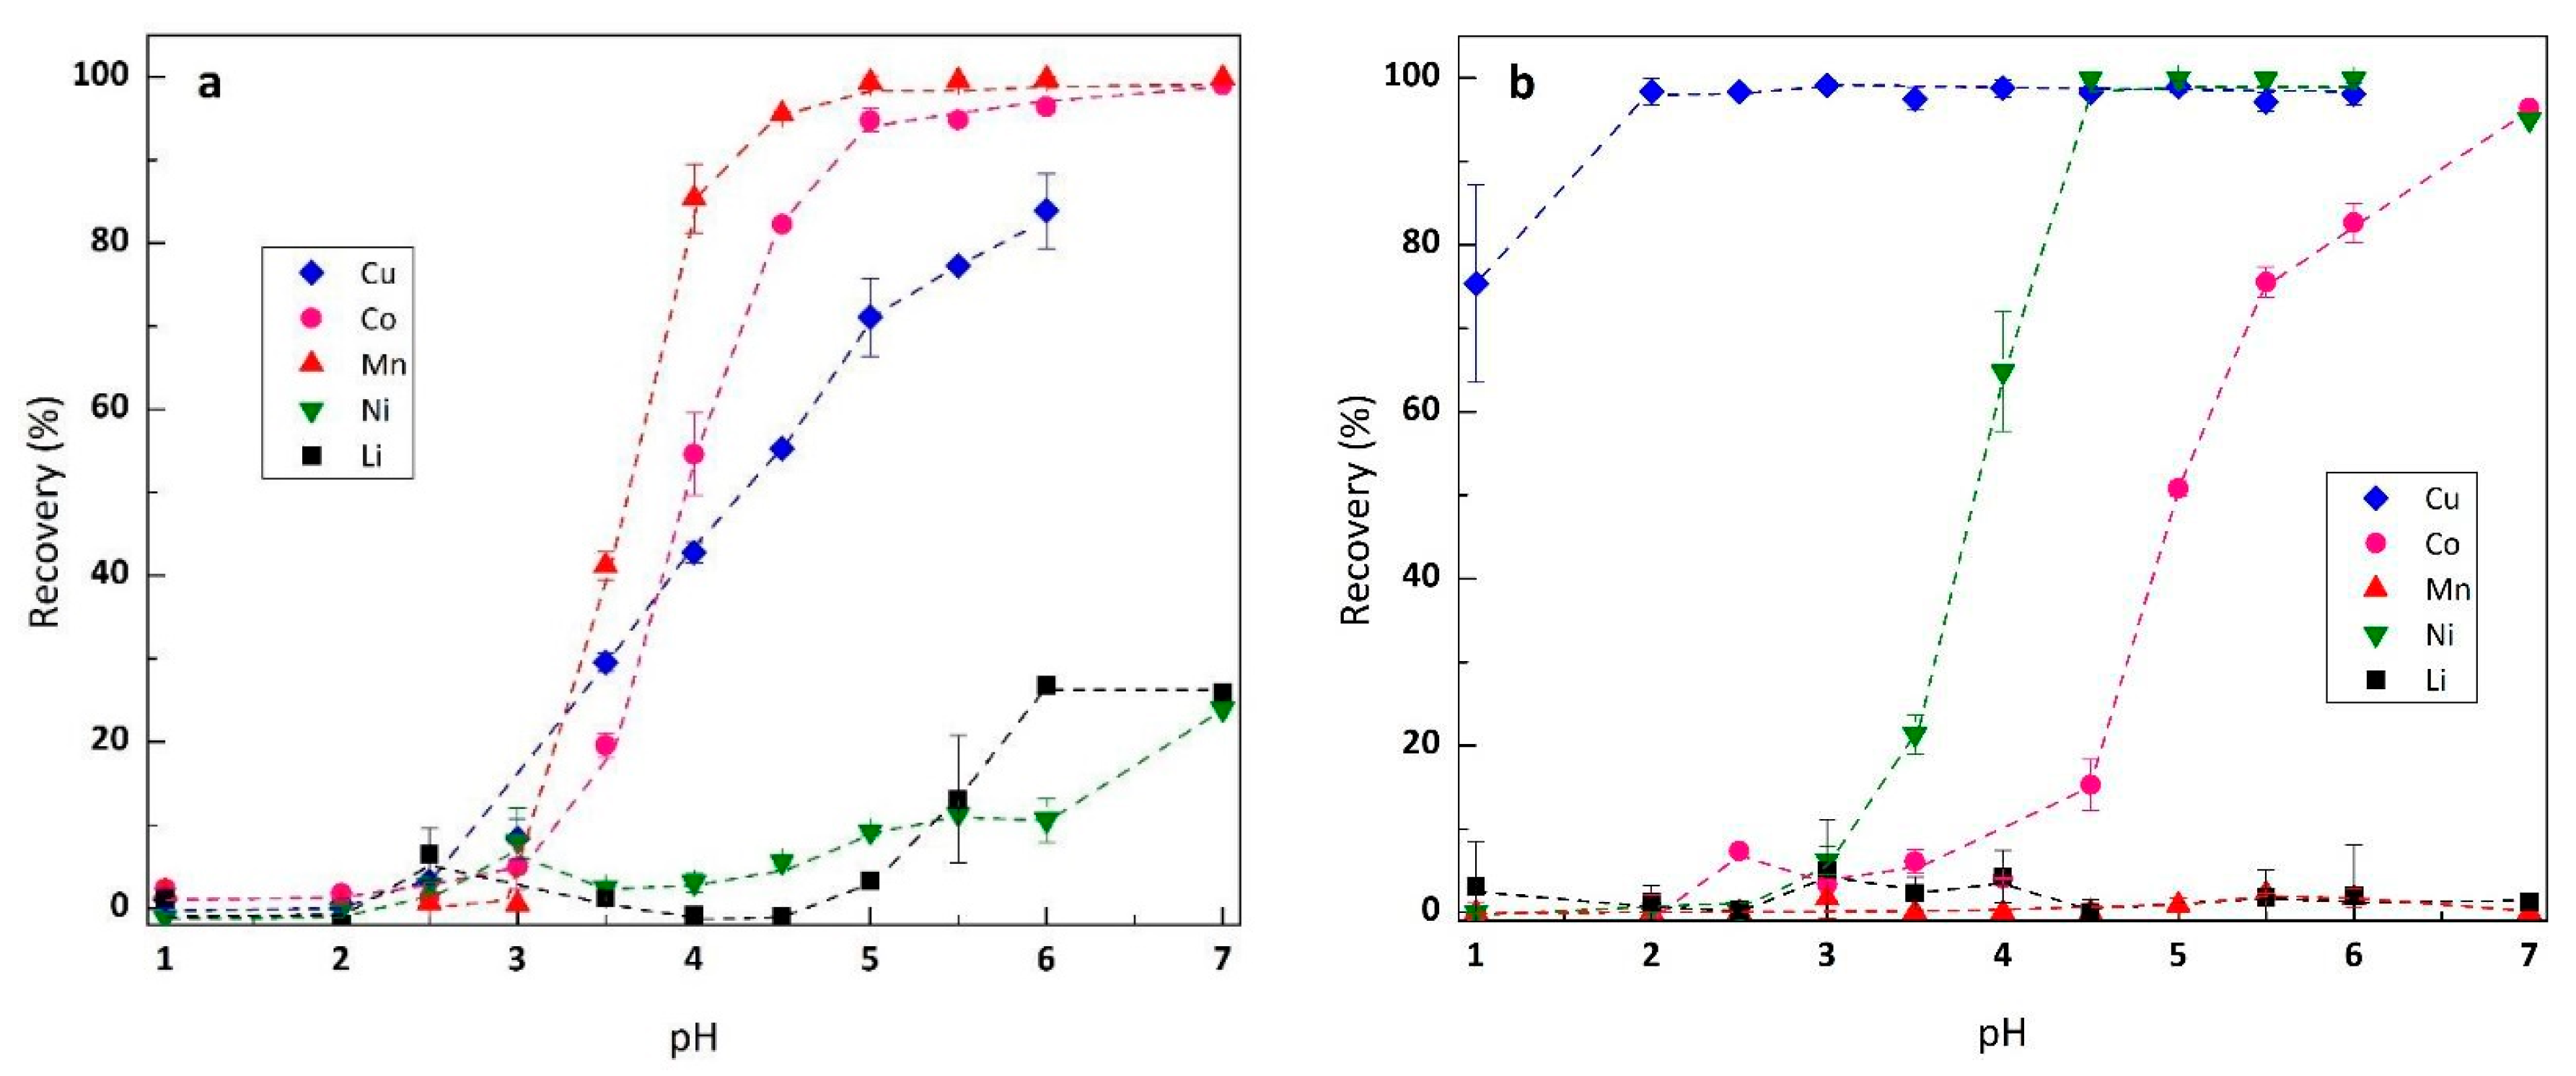
Figure 1.
The extraction rate of the metal ion by (a). Cyanex® 272 10% v/v and (b). LIX® 84-I 10% v/v according to the initial pH of leach liquor.
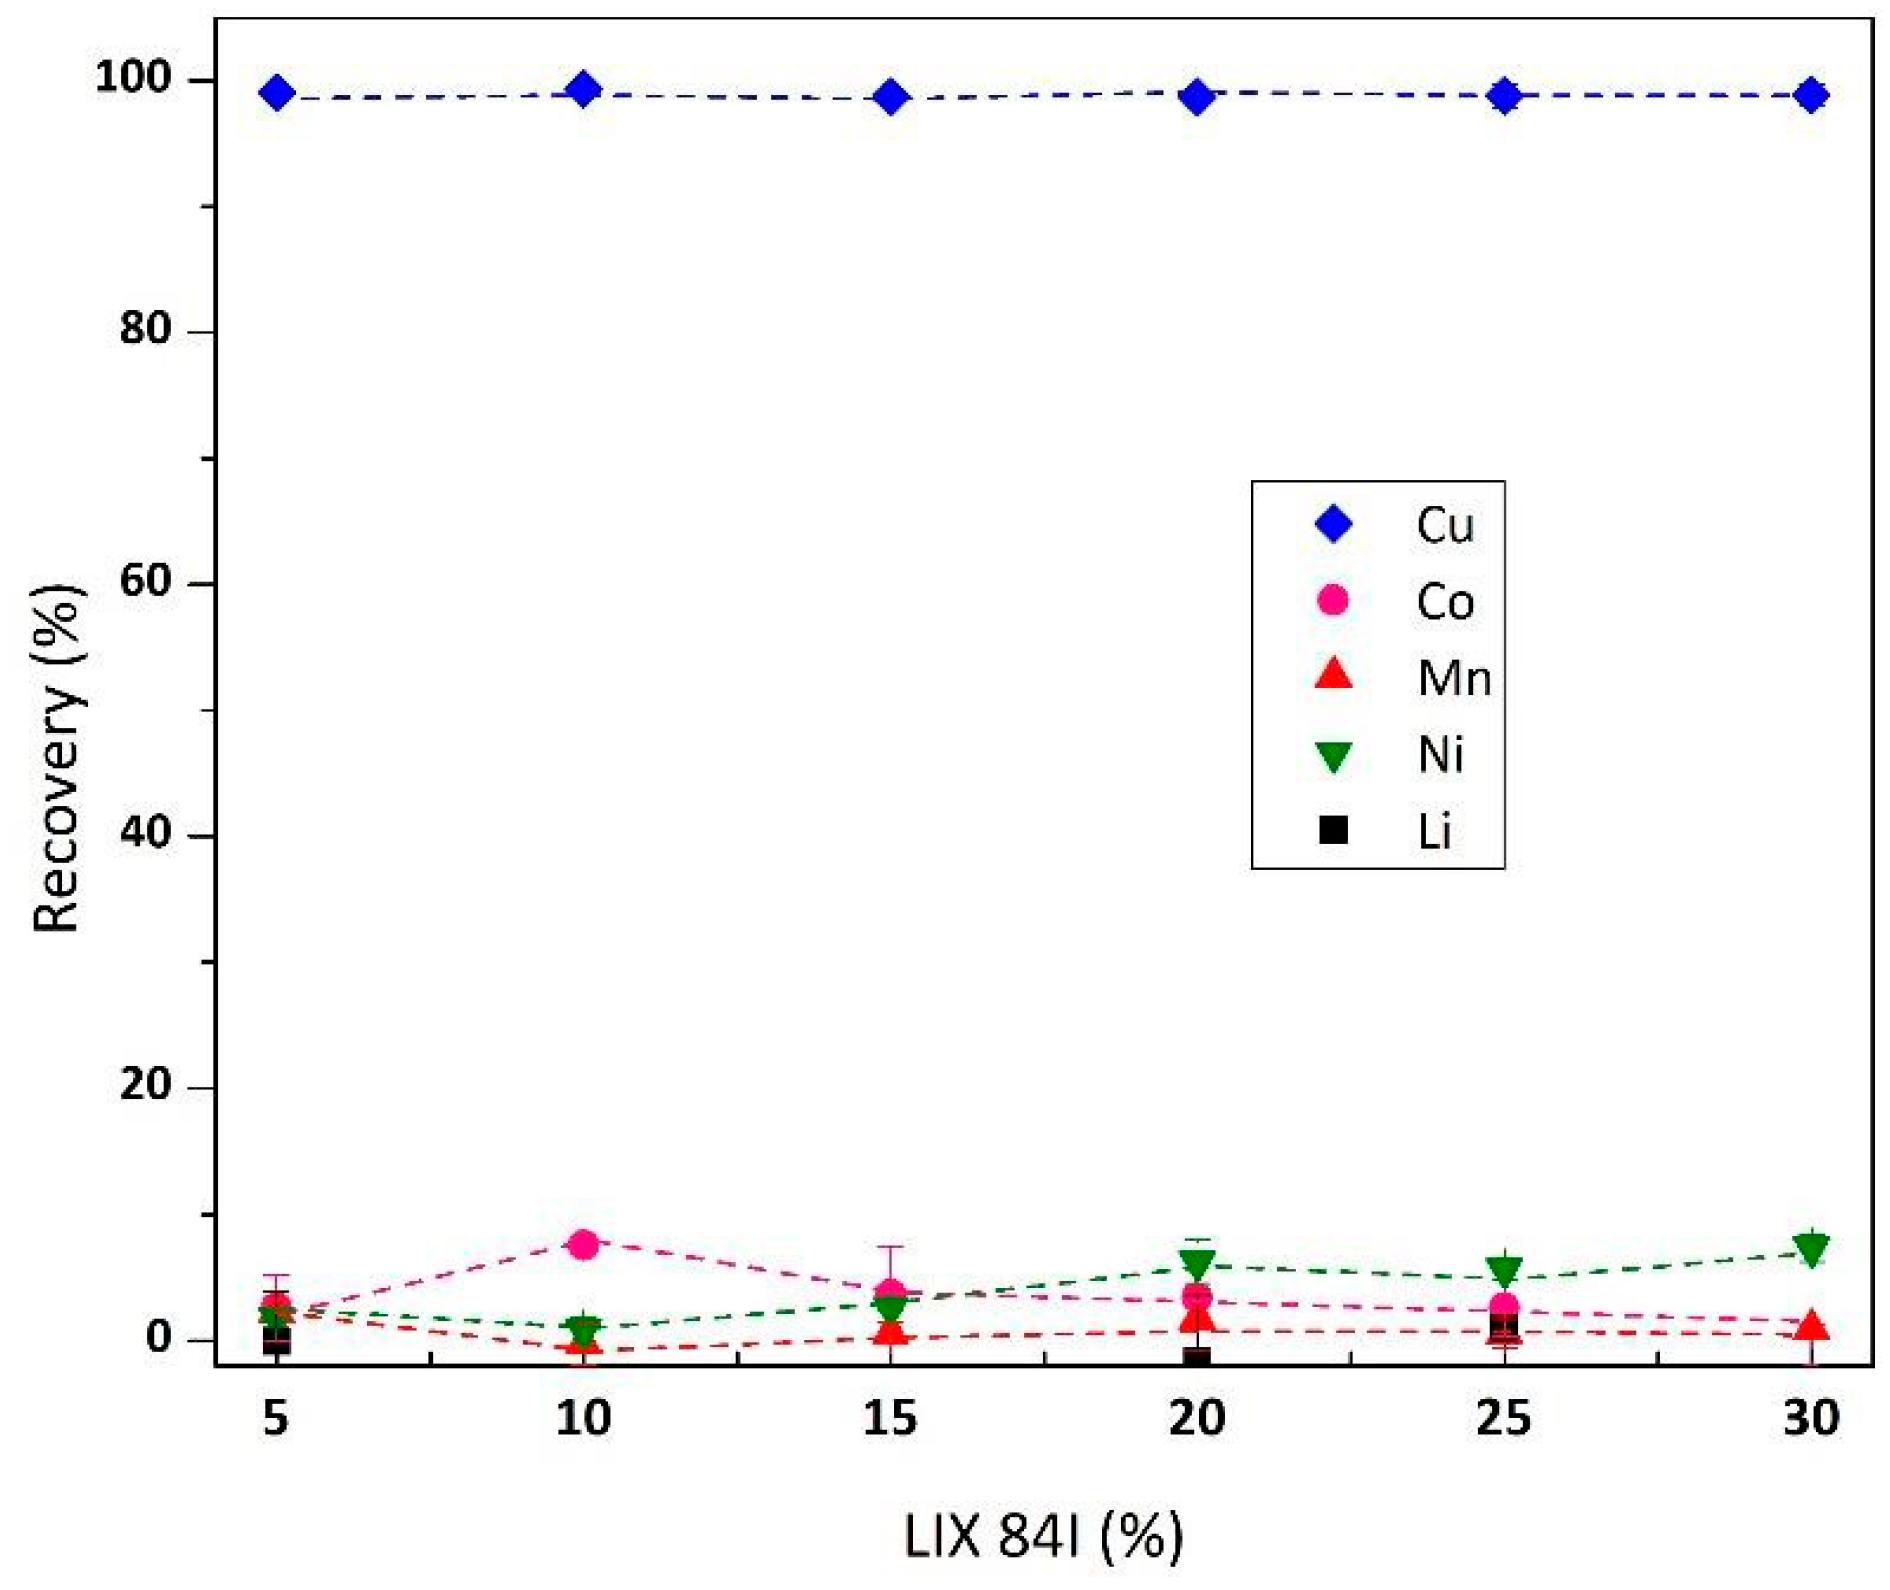
Figure 2.
Effect of LIX® 84-I concentration (v/v) on Cu isolation from leachate (pH 3, metal concentration in feed Cu 0.23 g/L, Co 3.54 g/L, Mn 0.16 g/L, Ni 0.14 g/L and Li 0.62 g/L).
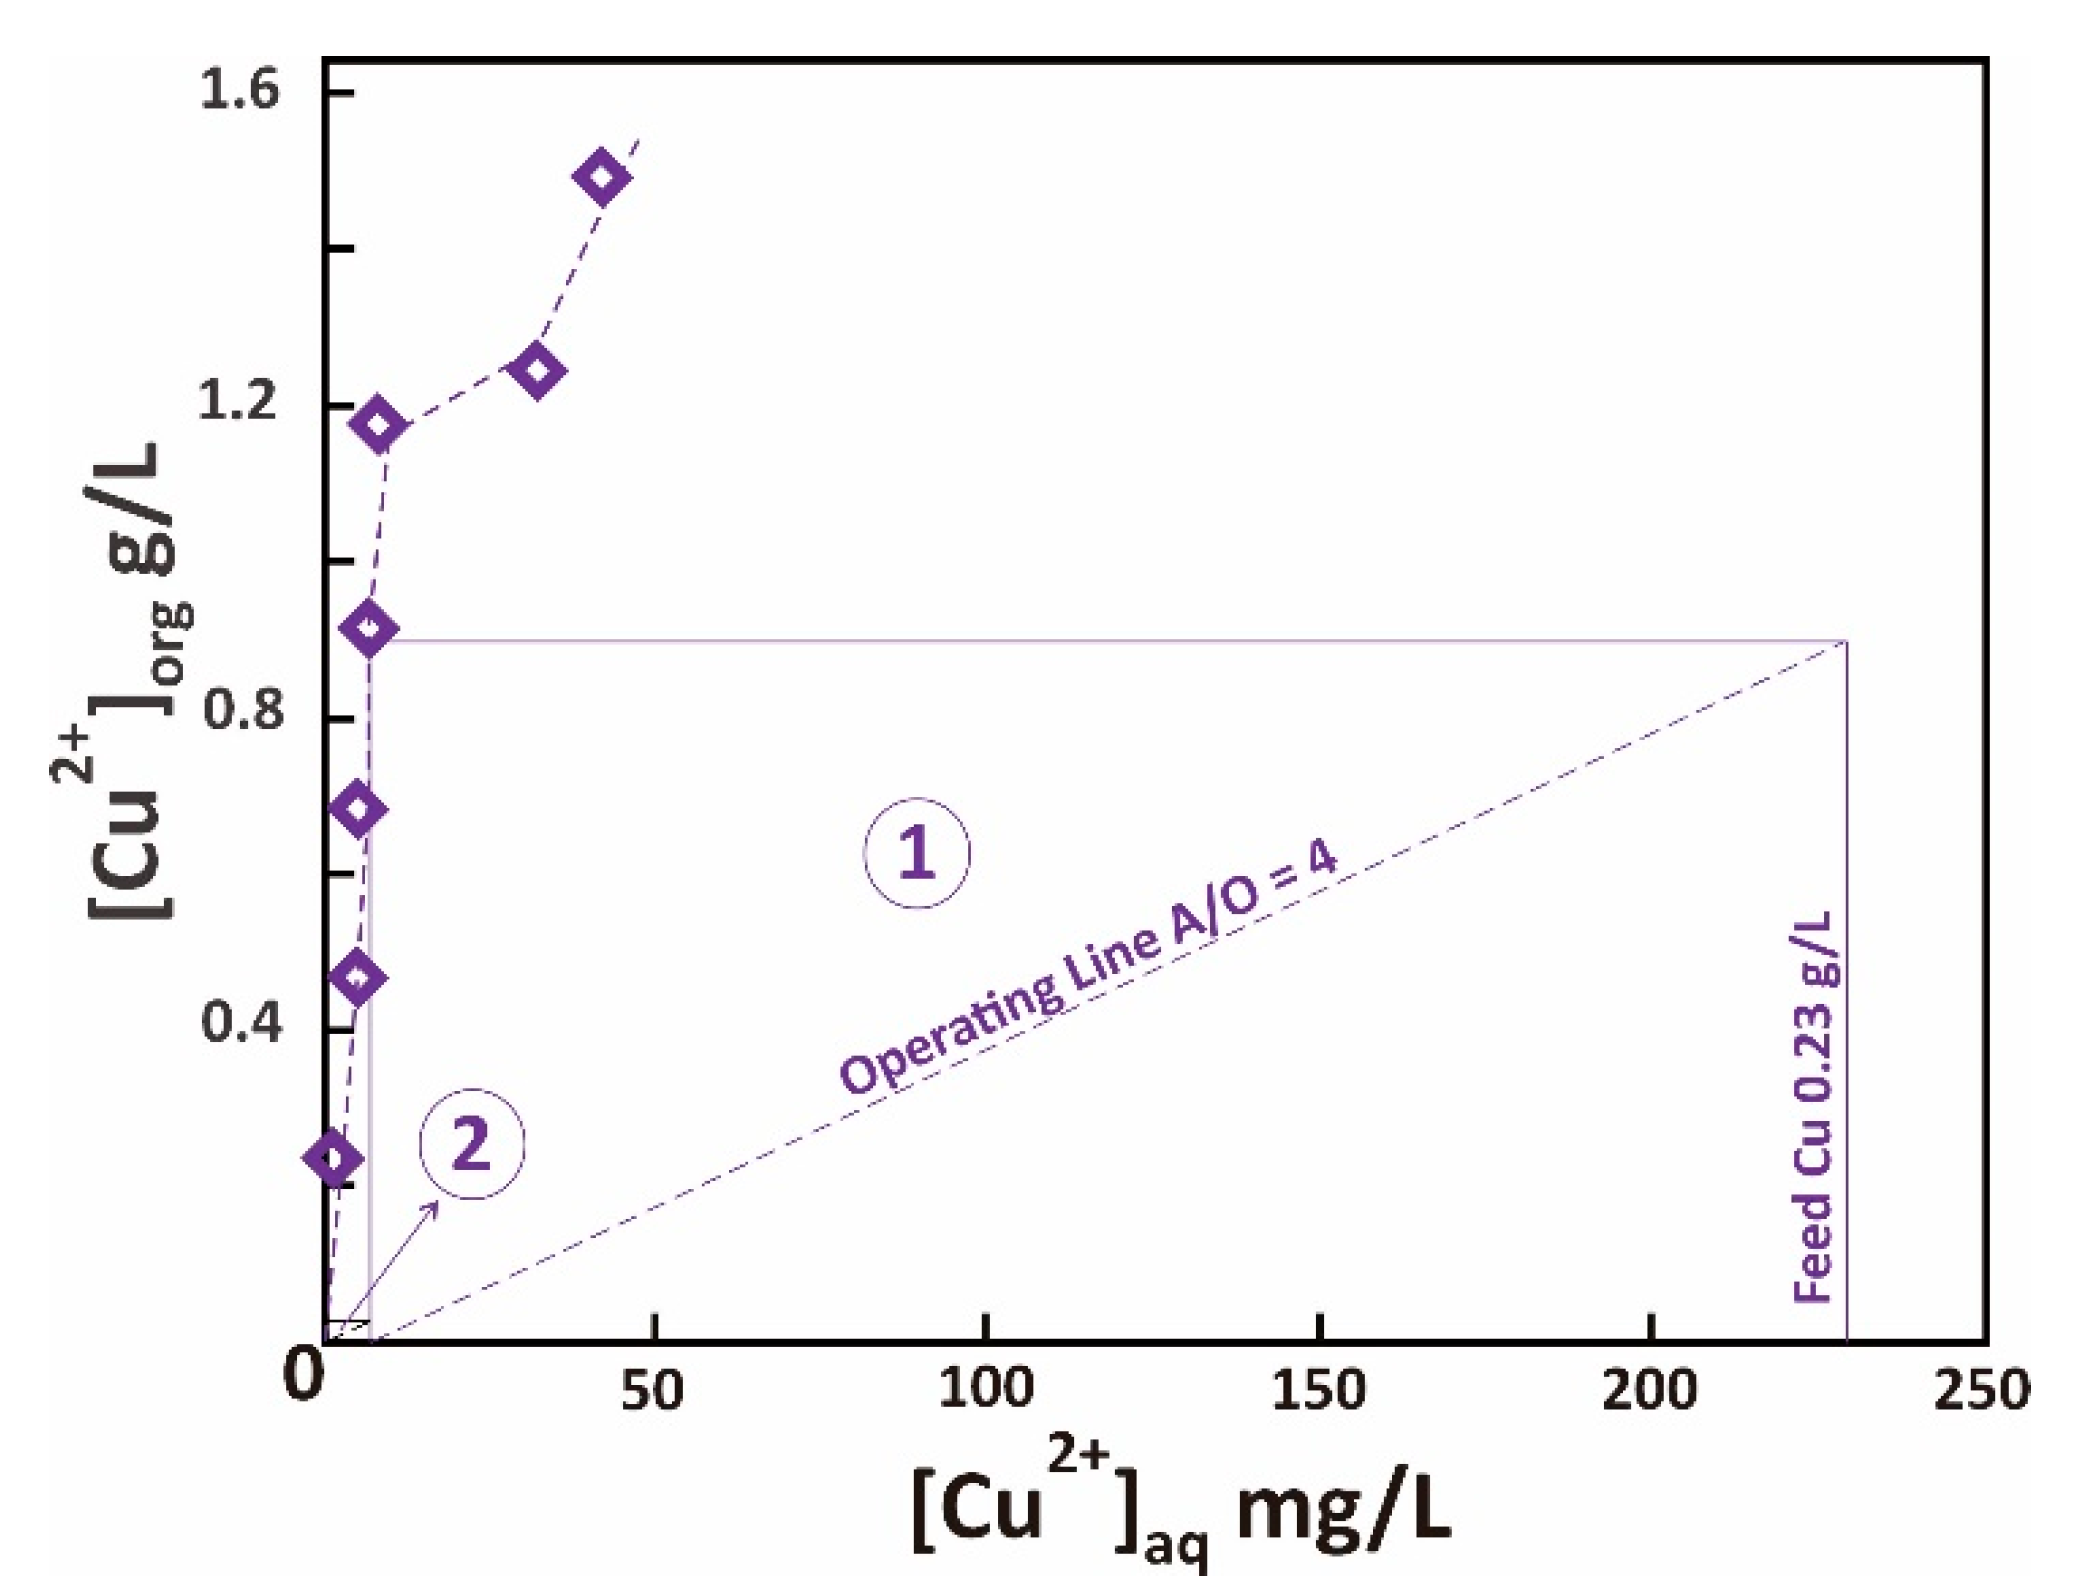
Figure 3.
Extraction isotherm of Cu using LIX® 84-I 10% v/v, pH 3, McCabe-Thiele plot is shown for A/O ratio 4.
Figure 4.
Effect of Cyanex® 272 concentration (v/v) on Co-Mn co-extraction from raffinate (pH 5, metal concentration in feed Co 3.3 g/L, Mn 0.16 g/L, Ni 0.14 g/L and Li 0.62 g/L).
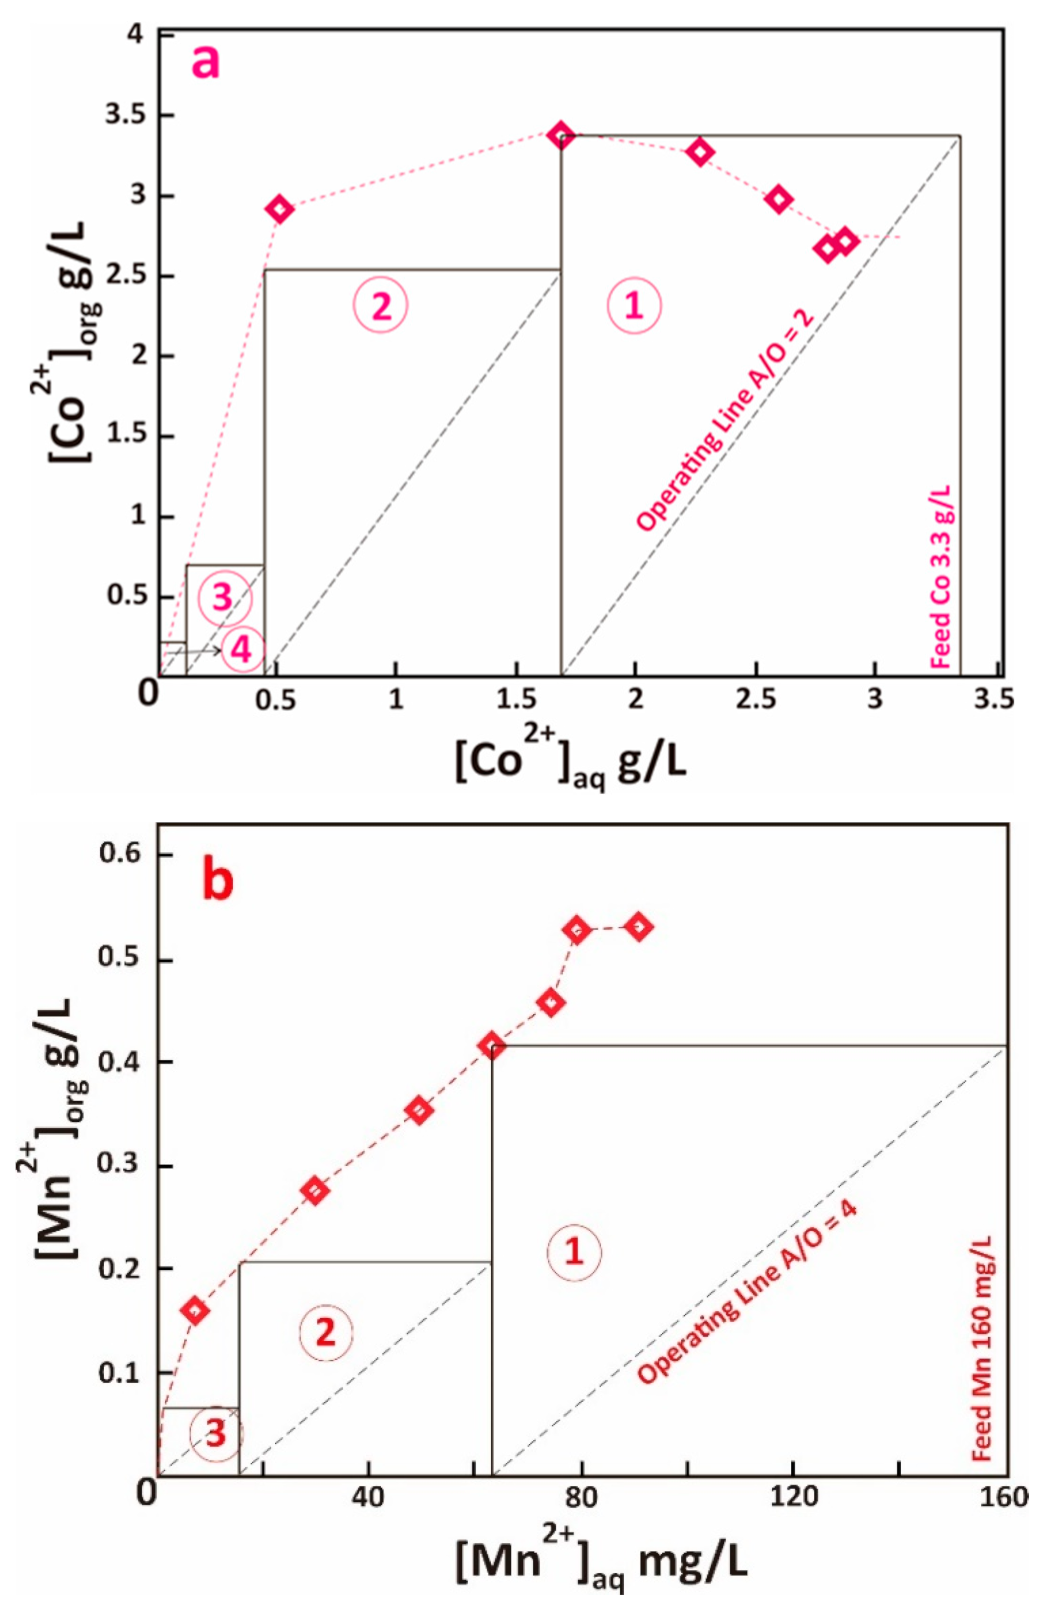
Figure 5.
Extraction isotherm of (a). Co and (b). Mn using Cyanex® 272 10% v/v, pH 5, McCabe-Thiele plot is shown for A/O ratio 2 (Co) and 4 (Mn).
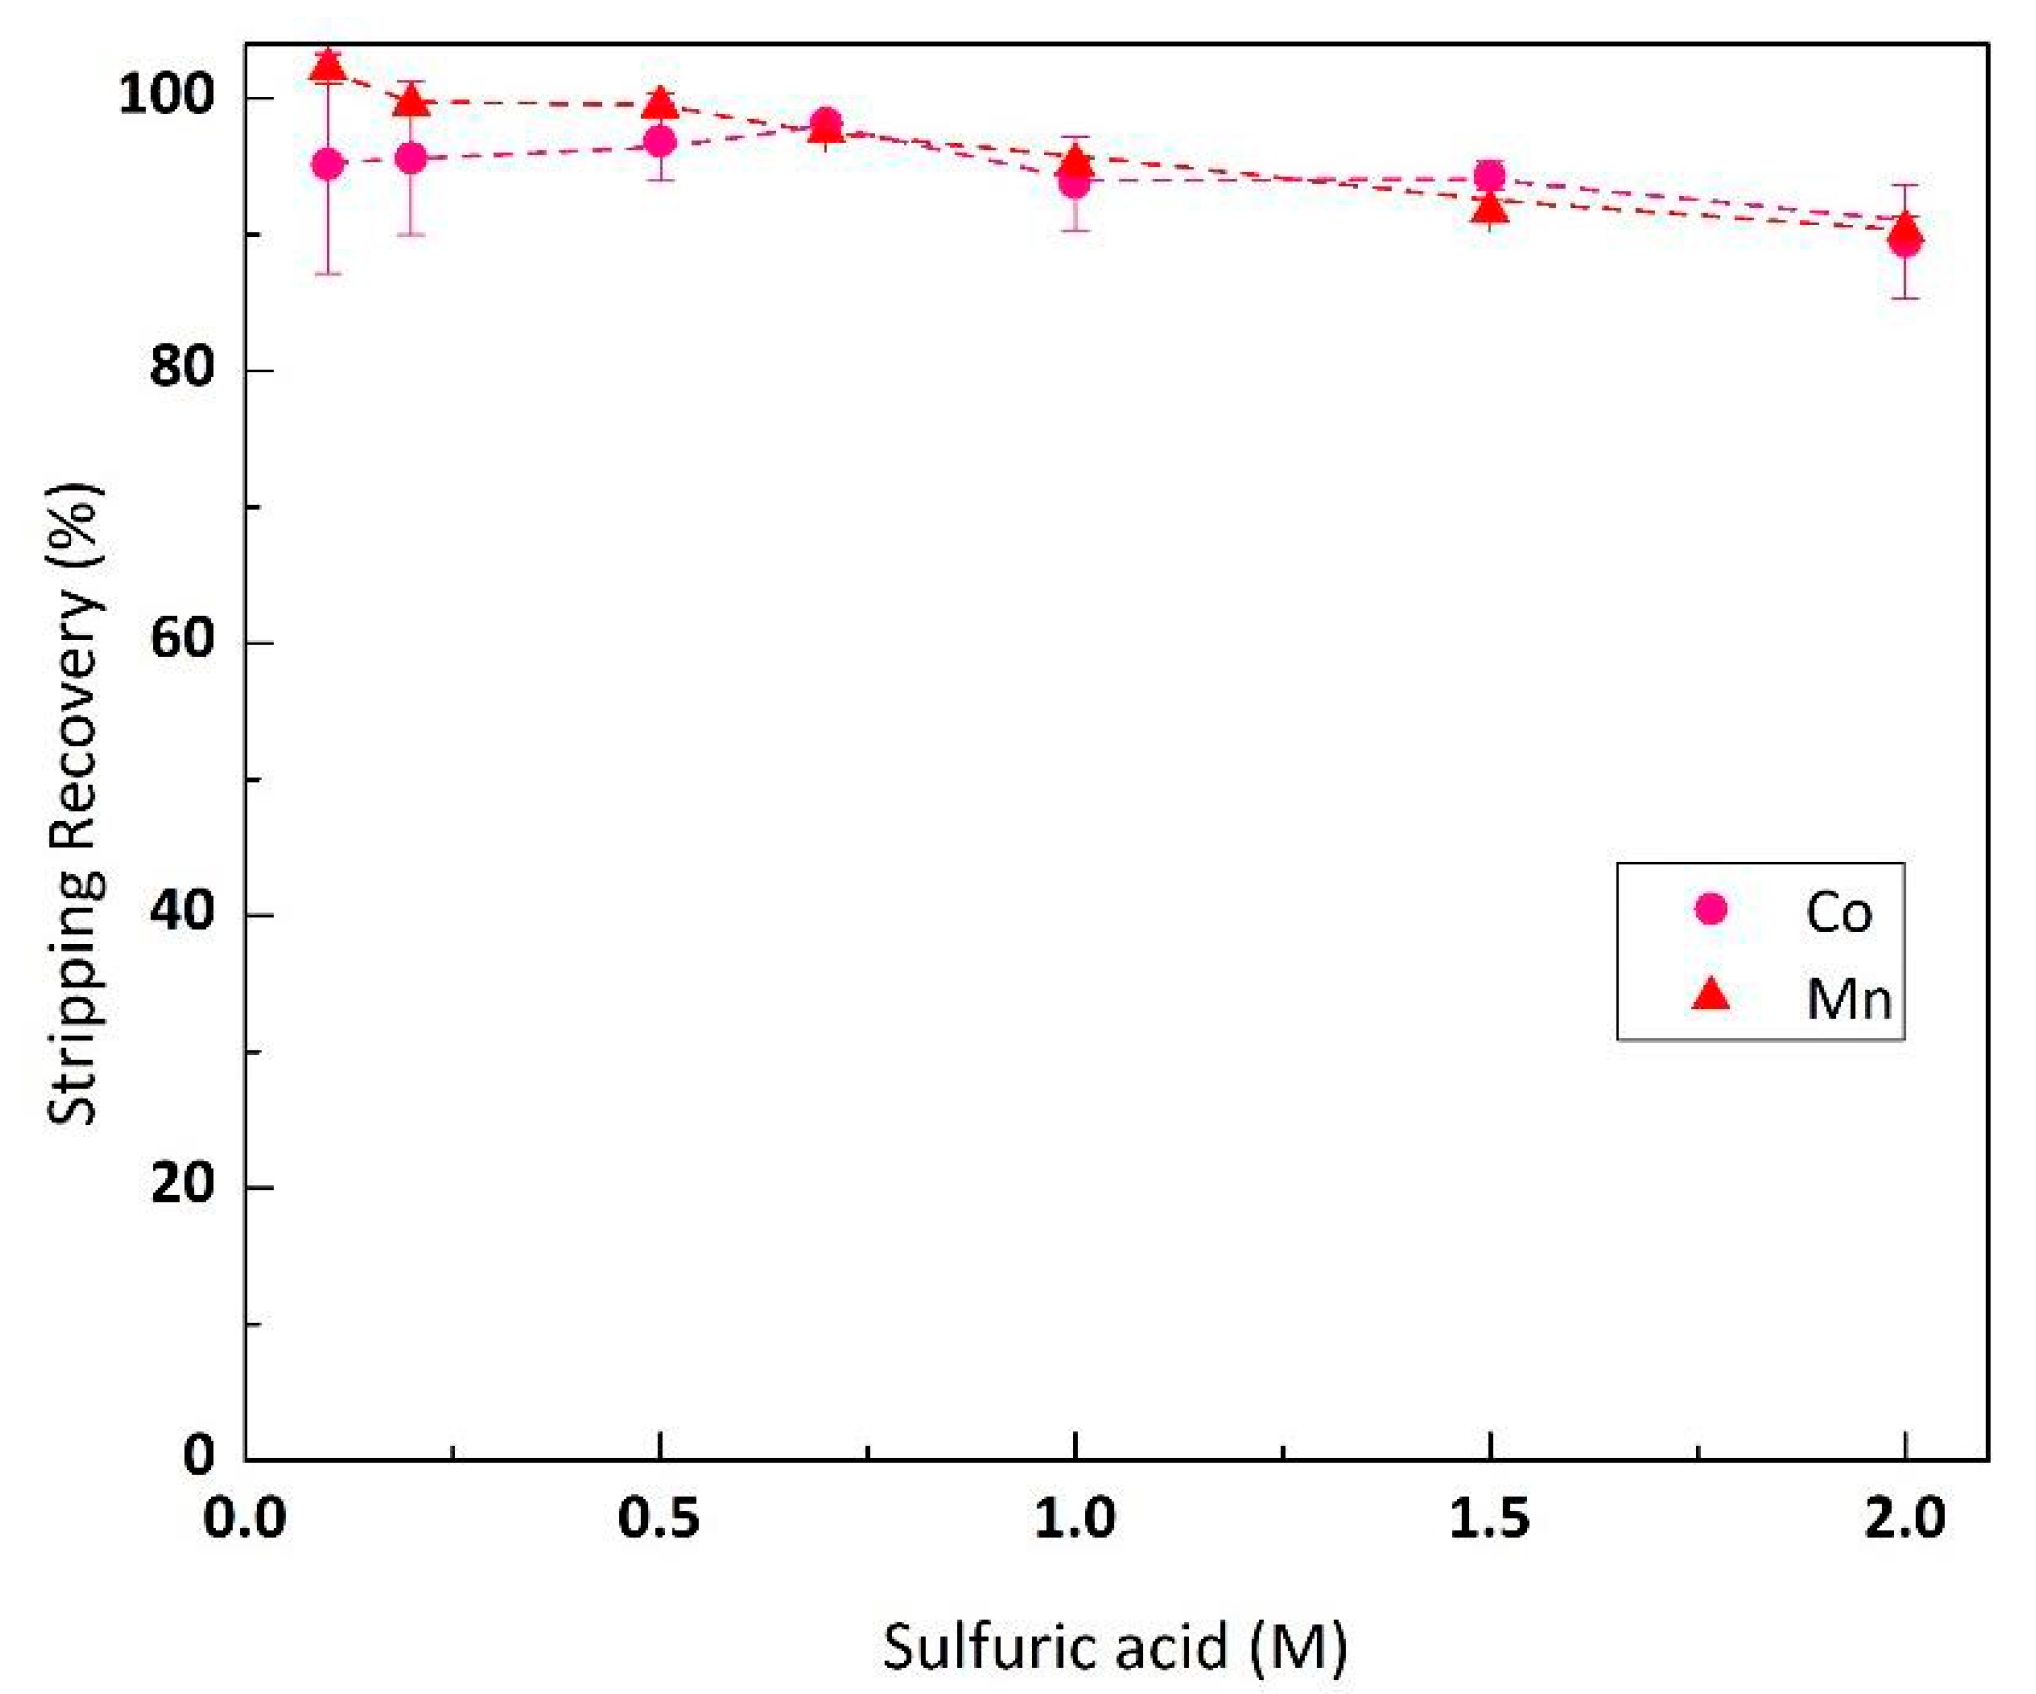
Figure 6.
Effect of sulfuric acid concentration on Co-Mn stripping rate from loaded organic (O/A ratio 1, organic feed Cyanex® 272 10% v/v, Co 3.3 g/L, Ni 0.17 g/L).
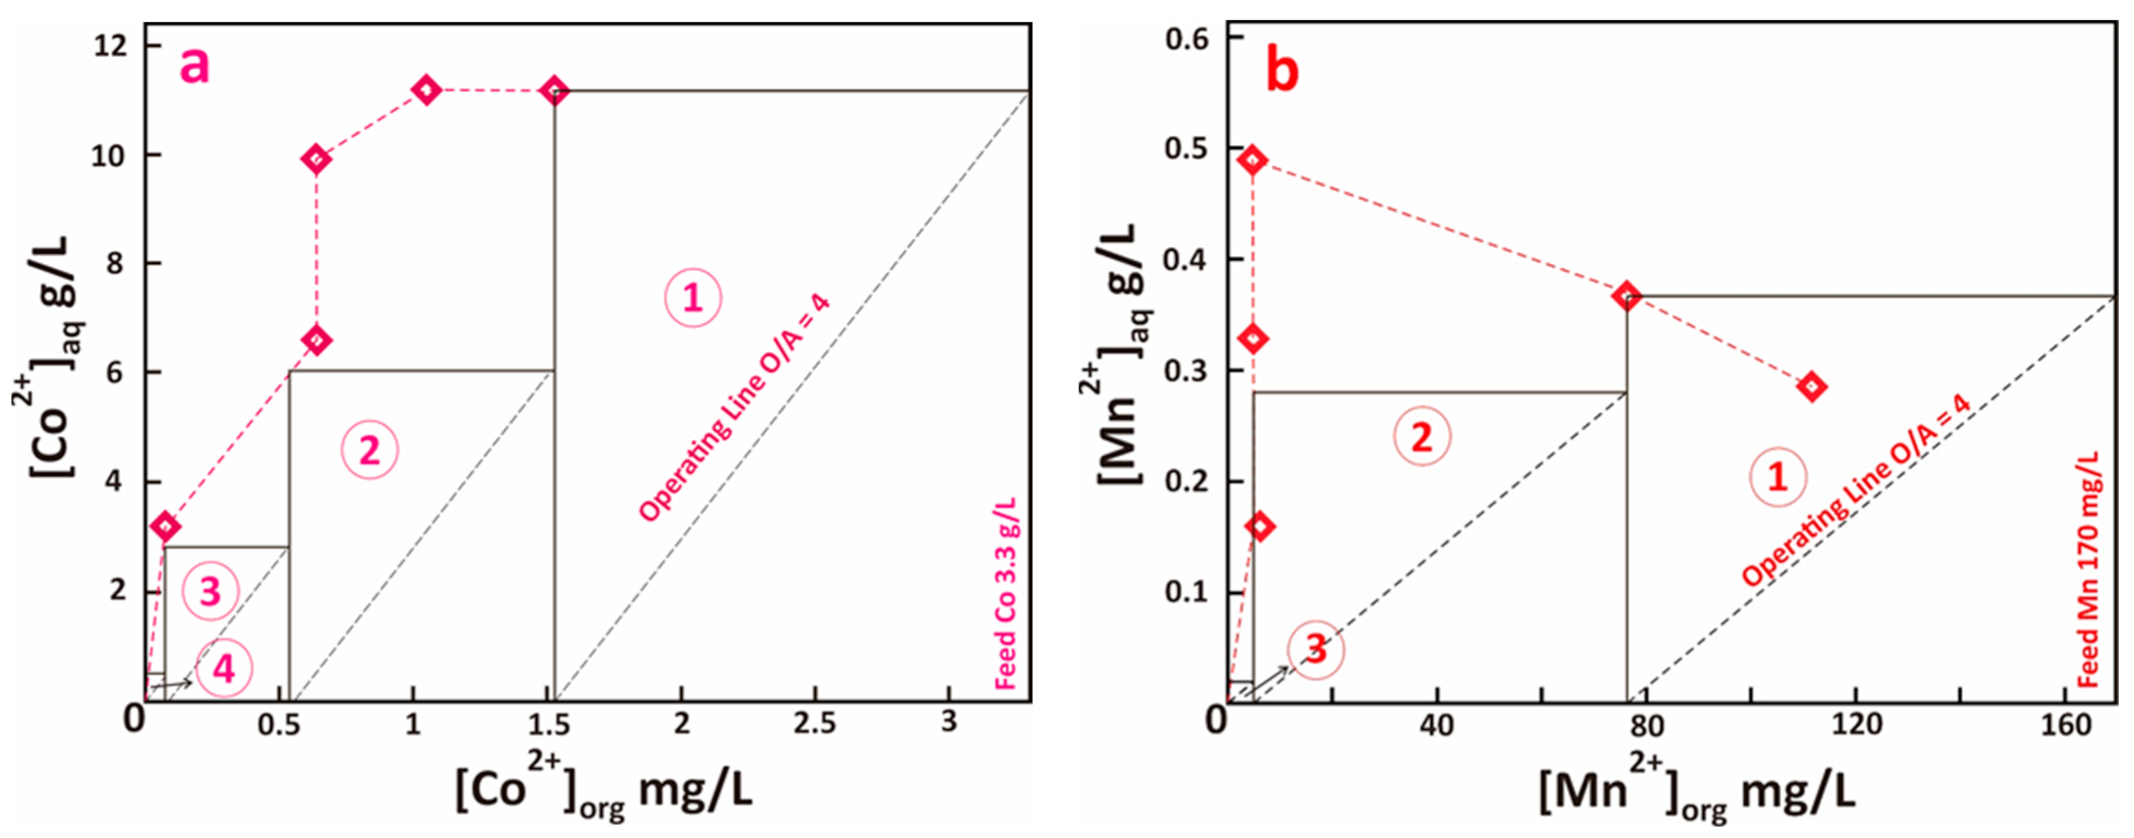
Figure 7.
Stripping isotherm of (a). Co and (b). Mn from loaded organic (feed Co 3.3 g/L, Mn 0.17 g/L) using sulfuric acid 0.2 M, McCabe-Thiele plot is shown for O/A ratio 5 (Co) and 4 (Mn).
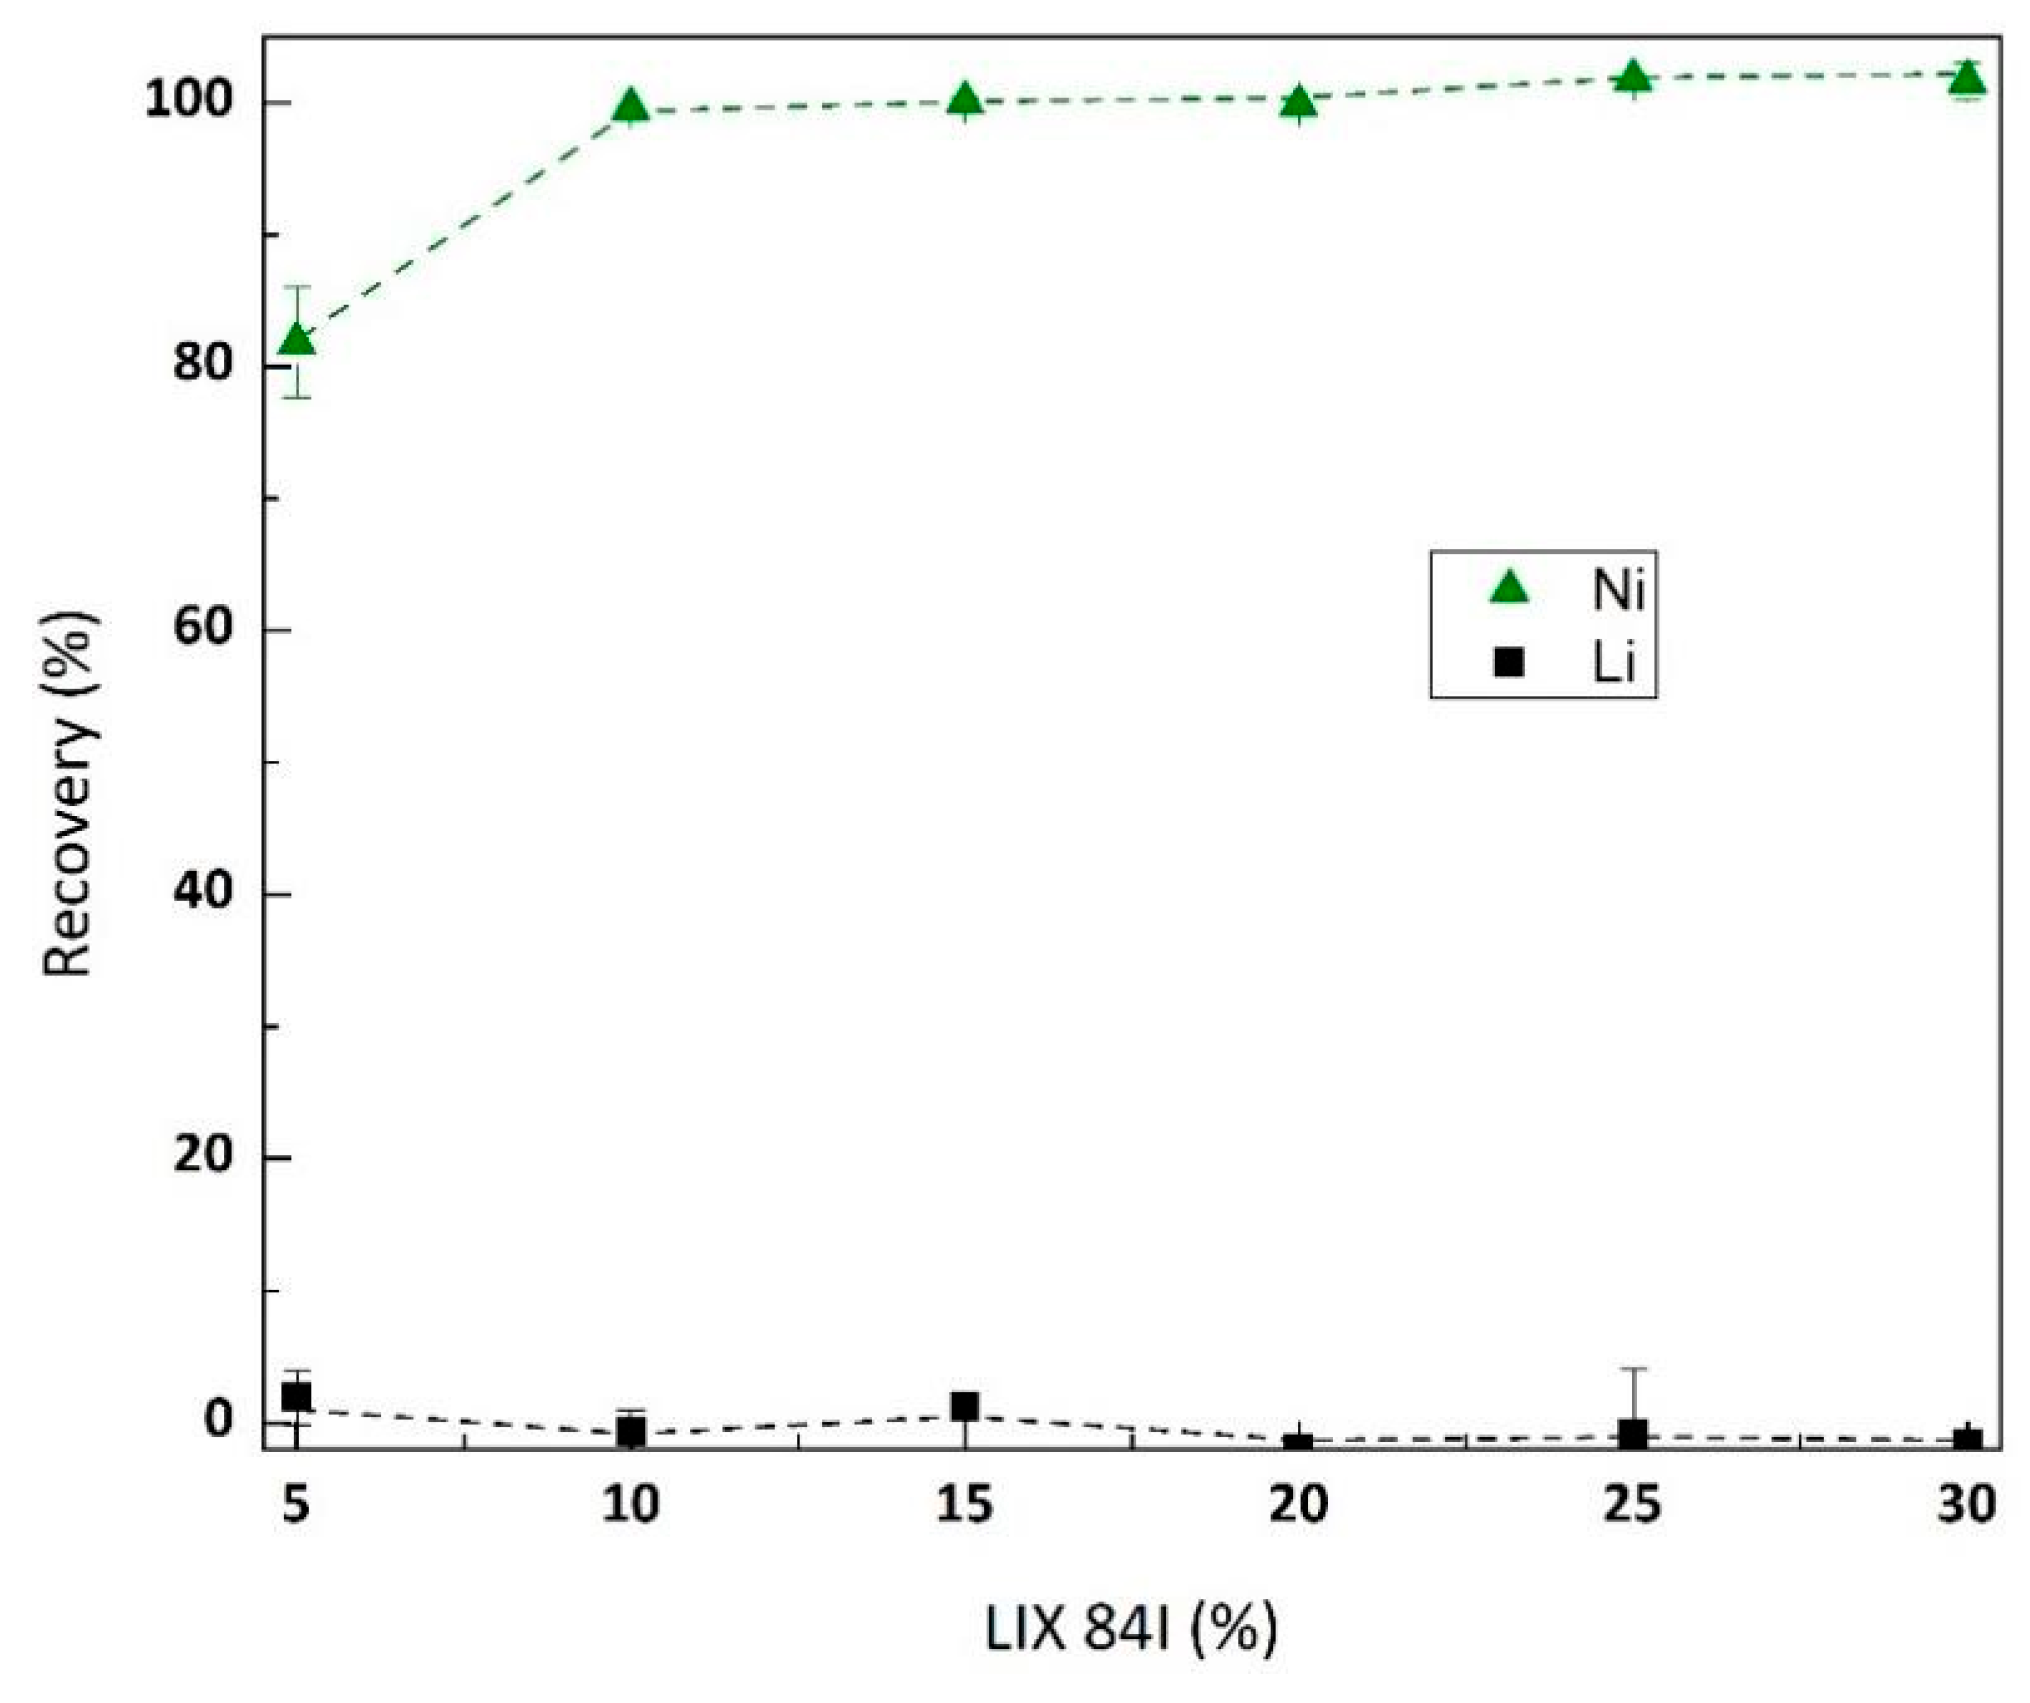
Figure 8.
Effect of LIX® 84-I concentration (v/v) on Ni and Li extraction from raffinate (pH 5, metal concentration in feed Ni 0.13 g/L and Li 0.55 g/L).
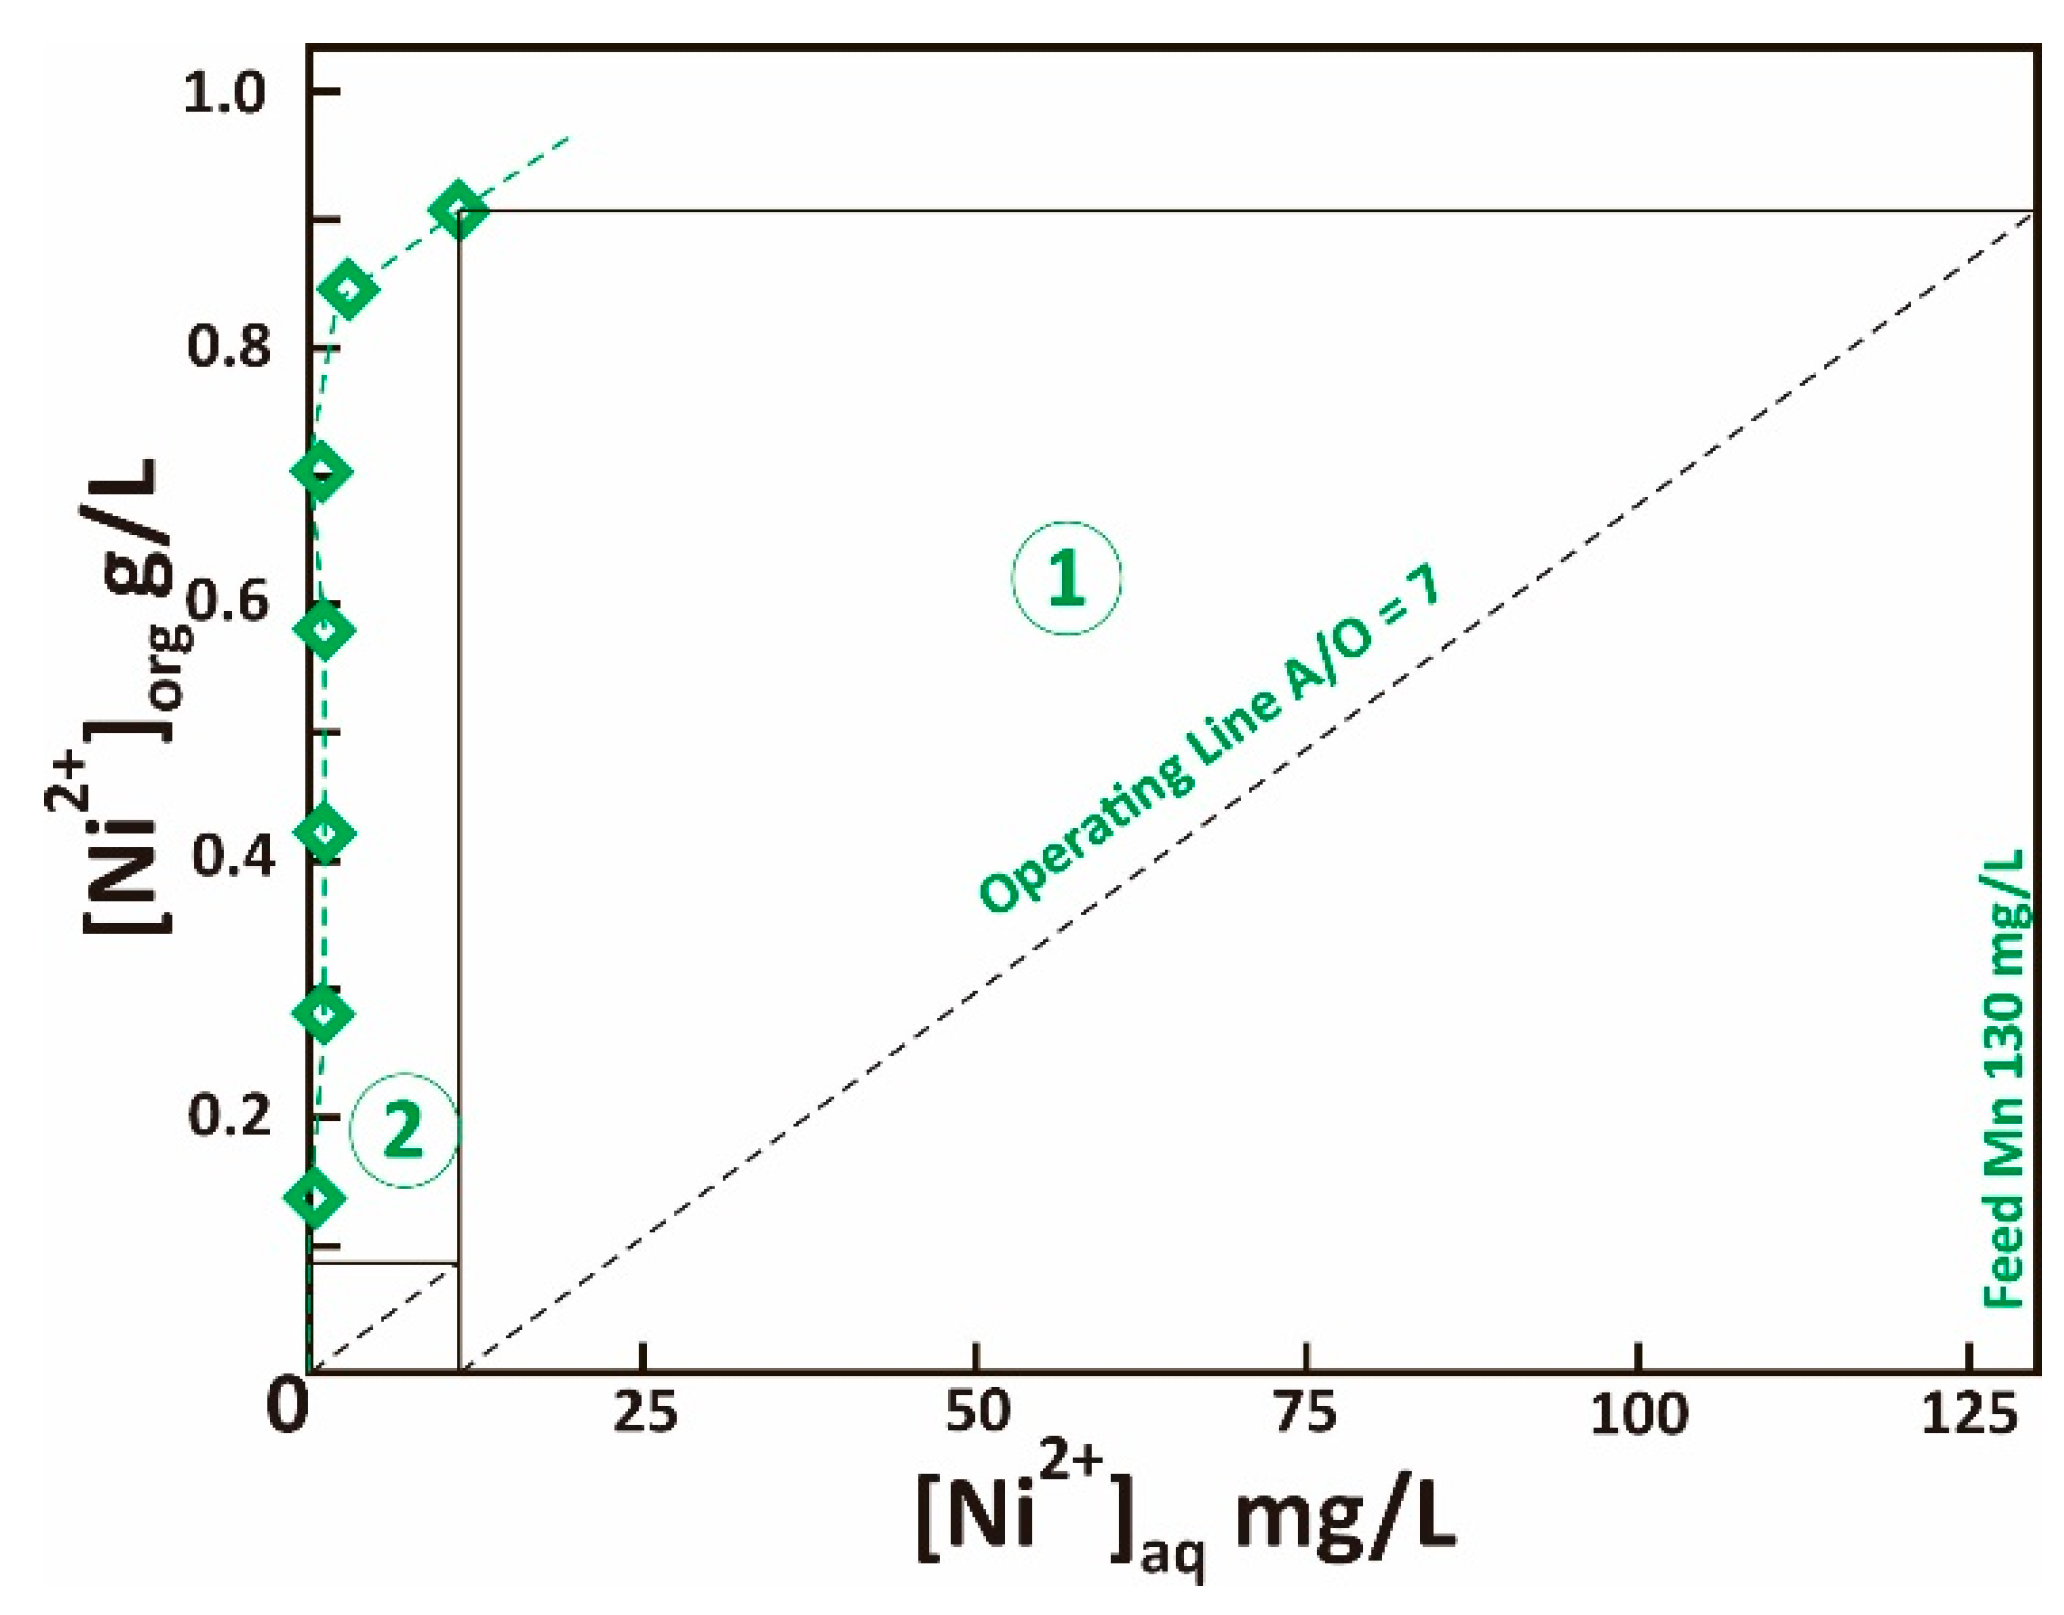
Figure 9.
Extraction isotherm of Ni using LIX® 84-I 10% v/v, pH 5, McCabe-Thiele plot is shown for A/O ratio 7.
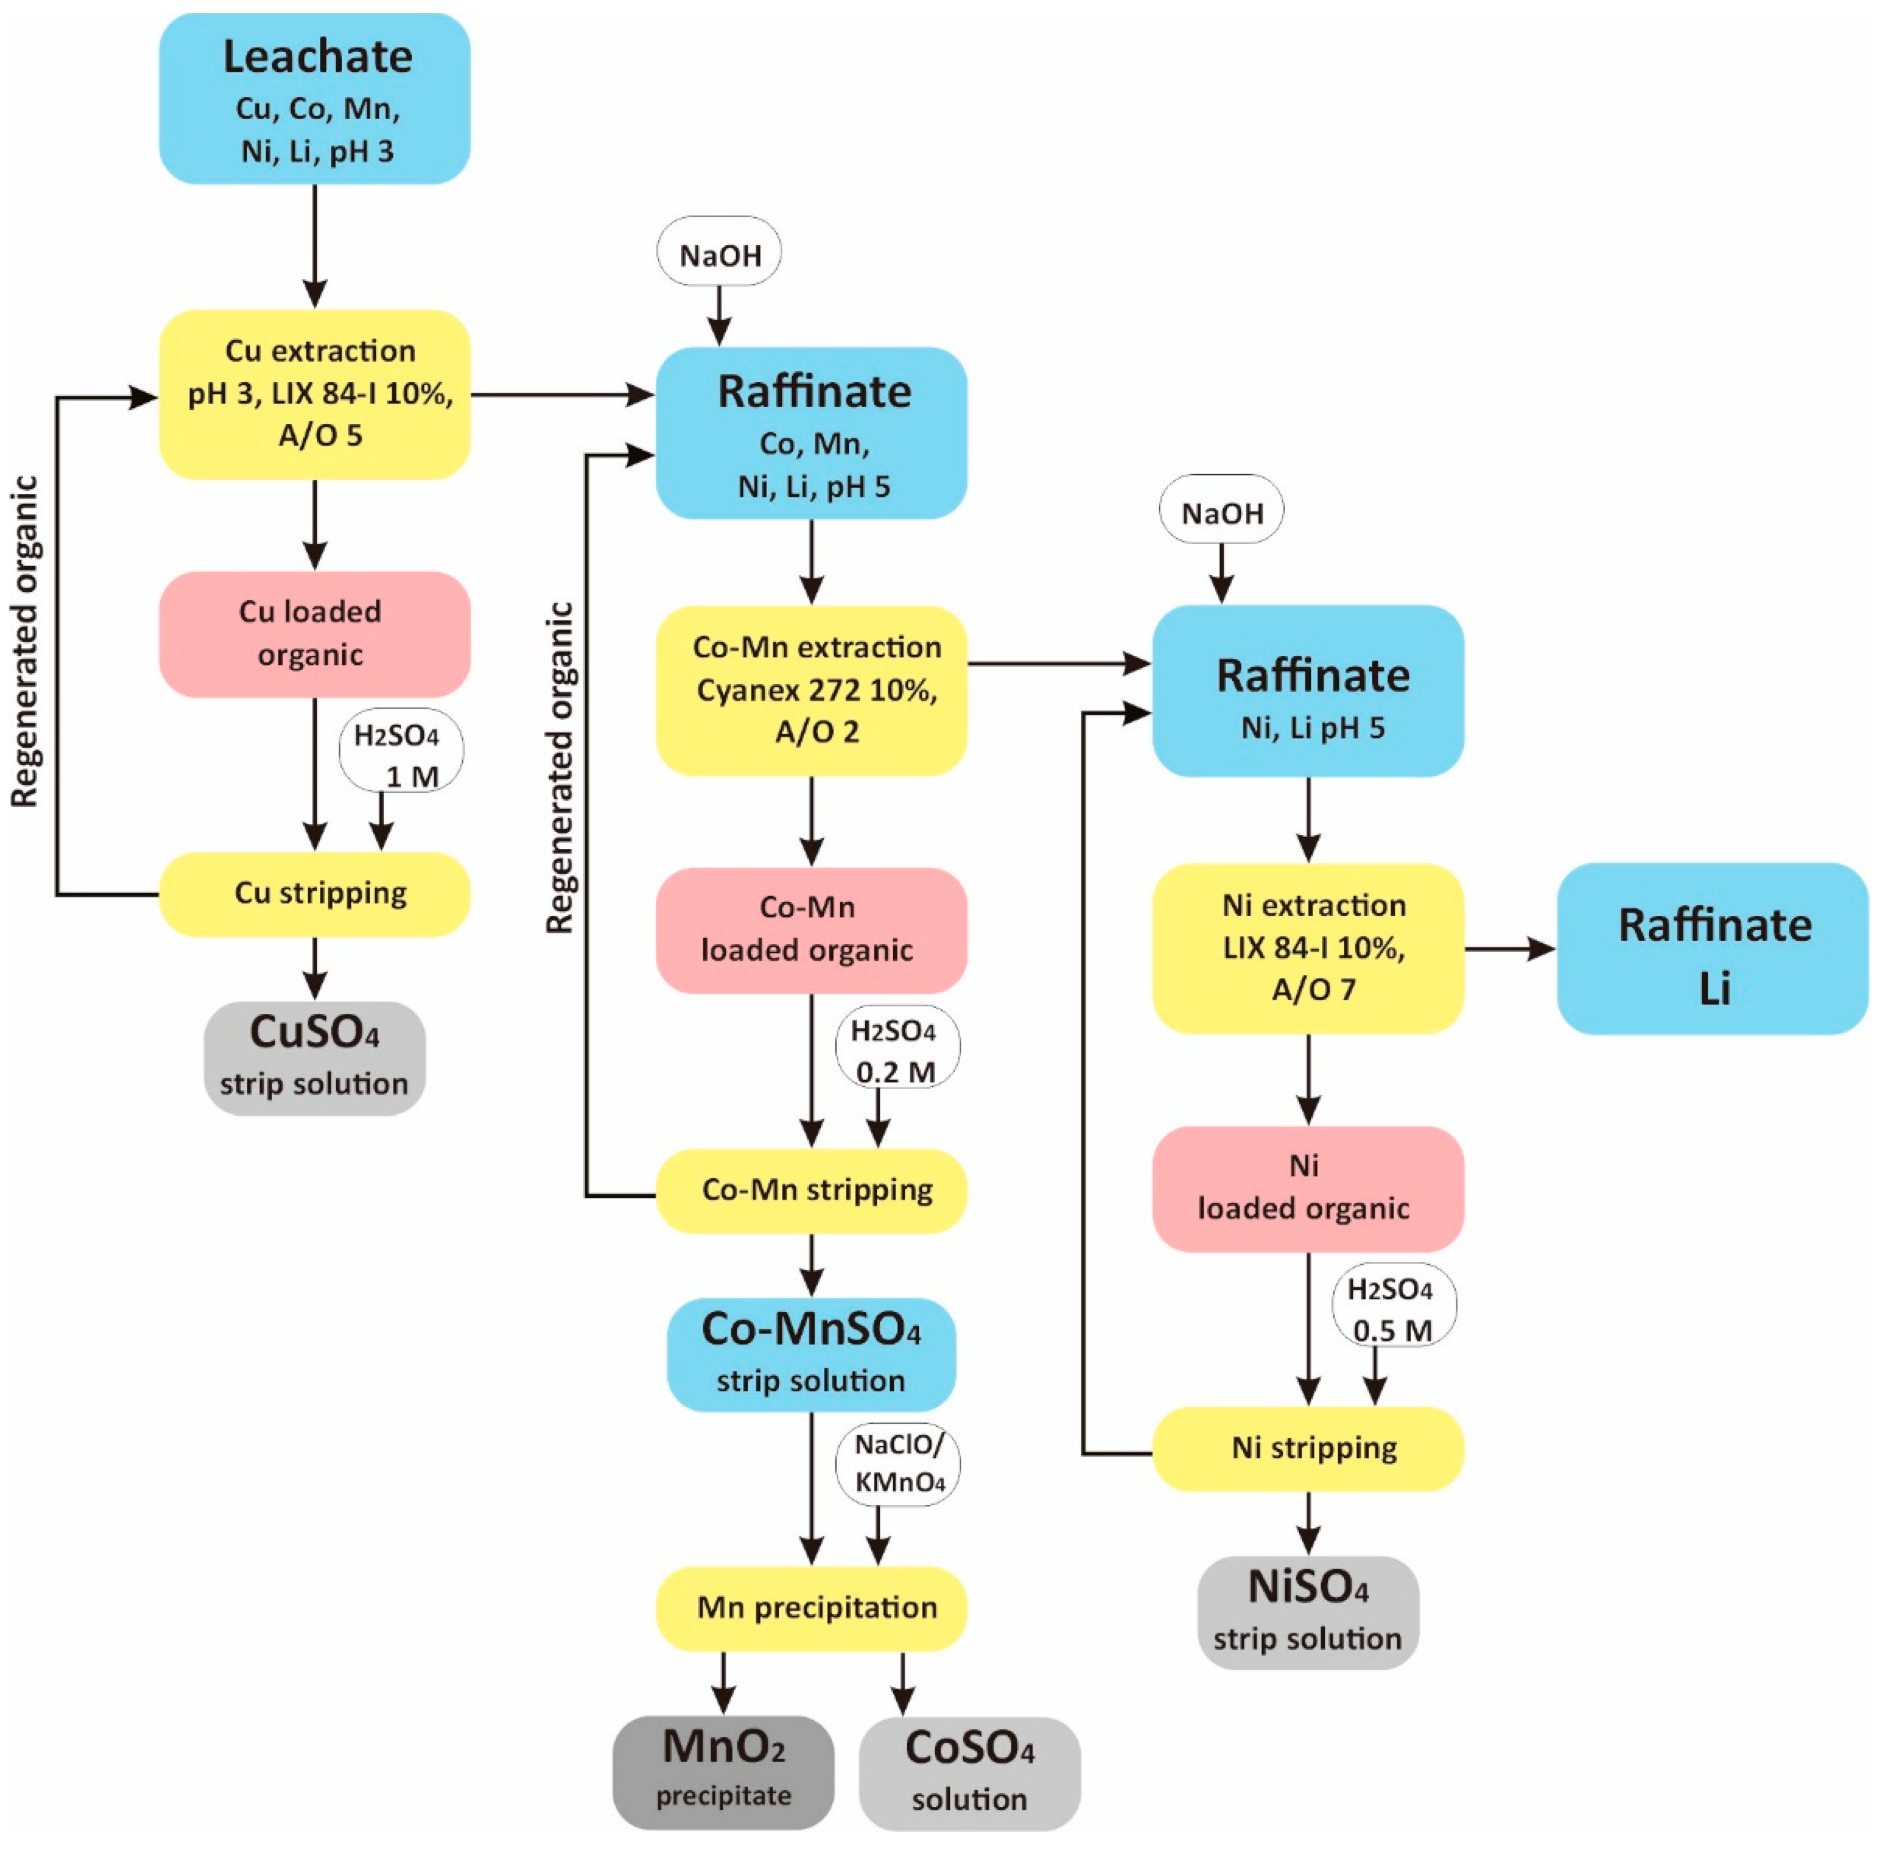
Figure 10.
Proposed scheme for transition metal fractionation from LIB leach liquor (tannic acid-acetic acid media) by solvent extraction and oxidative precipitation.
Table 1.
Previous investigation on elements separation and purification using solvent extraction from LIB leach liquor.
| No. | Leach Liquor | Elements | Extractant | Optimum Condition | Stripping Rate | Reference |
|---|
| 1 | Chloride | Co (1 g/L) | TOA 0.2 M in kerosene | O/A 1, HCl 6 M (99%) | 98% using Sulfuric acid 2 M | [20] |
| Cyanex301 0.1 M in kerosene | O/A 1, pH 6–7 (95%) | 91% using Sulfuric acid 1 M |
| 2 | Chloride | Co 2.9 g/L | Cyphos IL 102 0.2 M in toluene | O/A 1, HCl 8 M (94%) | 99% using HCl 0.05 M, A/O 1 | [21] |
| 3 | Sulfate | Co | Cyanex® 272 1 M | O/A 1, pH 5.5 (99%) | | [22] |
| Cu (1.4 g/L) | Acorga M5640 10% | O/A 1, pH 1 (96%) |
| 4 | Sulfate | Co (12.3 g/L) | Versatic 10 50% | O/A 1, pH 6 (98.5%) | | [23] |
| Ni (28.5 g/L) | Versatic 10 40% | O/A 1, pH 6 (99.2%) |
| Mn (14.65 g/L) | Versatic 10 50% | O/A 1, pH 6 (97%) |
| 5 | sulfate | Mn 1.2 g/L | TODGA in [C4mim][NTf2] | O/A 1, pH 3.3 (90%) | | [24] |
| Co 1 g/L | [P66614][Cl] | H2SO4 9 M (93%) |
| Ni 0.8 g/L | DES DecA:Lid | O/A 1, pH 4 (92%) |
| 6 | Sulfate | Mn 10 g/L | DEHPA 0.5 M | O/A 1.25, pH 3.25 (70%) | Sulfuric acid 1 M | [25] |
| 7 | Sulfate | Mn 0.55 g/L | DEHPA 10% | O/A 1.2, pH 2.7 (84%) | | [26] |
| 8 | Sulfate | Mn 4.96 g/L | Na-DEHPA | O/A 2.33, pH 3 (88%) | | [27] |
| 9 | Sulfate | Co 14 g/L | Cyanex® 272 1 M, TOA 5% | O/A 1.3, pH 6.8–7.1 (99%) | pH 5–6, A/O 0.67 | [28] |
| Ni 0.5 g/L | Cyanex® 272 1 M, TOA 5% | O/A 1.3, pH 6.8–7.1 (>90%) |
| 10 | Citrate | Mn | DEHPA 12% | O/A 2, pH 2.5 (99%) | Citric acid 1.5 M | [19] |
Table 2.
Metal content in leach liquor used in the solvent extraction and precipitation study.
| Element | Cu | Co | Mn | Ni | Li |
|---|
| Concentration (g/L) | 0.25 | 3.3 | 0.14 | 0.13 | 0.6 |
Table 3.
Cu extraction rate and theoretical stages required for complete extraction at different A/O ratios (LIX
® 84-I 10%
v/
v, feed solution metal concentration as in
Table 2, pH 3).
| A/O Ratio v/v | Cu Rec (%) | Number of Theoretical Stages |
|---|
| 1 | 99.34 ± 0.07 | 1 |
| 2 | 97.83 ± 2.05 | 2 |
| 3 | 96.04 ± 1.72 | 2 |
| 4 | 96.99 ± 2.87 | 2 |
| 5 | 98.10 ± 1.77 | 2 |
| 6 | 85.89 ± 0.05 | 2 |
| 7 | 81.41 ± 8.86 | 2 |
Table 4.
Cu stripping recovery according to mineral acid type and acid concentration (O/A 1, feed organic LIX® 84-I 10% v/v, Cu 4.8 g/L).
| Acid Concentration (M) | Cu Stripping Recovery (%) |
|---|
| Sulfuric Acid | Nitric Acid | Hydrochloric Acid |
|---|
| 0.1 | 61.05 ± 2.90 | 35.62 ± 2.75 | 33.93 ± 0.47 |
| 0.5 | 84.76 ± 4.99 | 72.19 ± 1.63 | 70.70 ± 0.14 |
| 1 | 97.11 ± 2.77 | 94.35 ± 6.33 | 95.75 ± 2.75 |
| 2 | 95.38 ± 0.40 | 97.23 ± 0.78 | 98.46 ± 0.35 |
| 5 | 89.33 ± 0.91 | 94.79 ± 0.42 | 100.75 ± 1.56 |
Table 5.
Co-Mn extraction rate and theoretical stages required for complete extraction at different A/O ratio (Cyanex® 272 10% v/v, feed solution Co 3.3 g/L, Mn 0.16 g/L, pH 5).
| A/O Ratio v/v | Co | Mn |
|---|
| Rec (%) | Number of Theoretical Stages | Rec (%) | Number of Theoretical Stages |
|---|
| 1 | 84.67 ± 11.72 | 2 | 95.44 ± 2.63 | 2 |
| 2 | 48.86 ± 5.07 | 4 | 81.37 ± 2.82 | 3 |
| 3.2 | 31.35 ± 0.90 | 4 | 69.30 ± 0.69 | 3 |
| 4.2 | 21.35 ± 1.63 | 5 | 60.83 ± 0.62 | 3 |
| 5.3 | 15.31 ± 3.86 | 7 | 53.90 ± 1.62 | 4 |
| 6.4 | 12.93 ± 0.68 | 8 | 51.03 ± 2.01 | 4 |
| 7.5 | 8.05 ± 0.73 | 10 | 43.79 ± 0.77 | 5 |
Table 6.
Co-Mn stripping rate and theoretical stages required for complete stripping at different O/A ratios using sulfuric acid 0.2 M (feed organic Cyanex® 272 10% v/v, Co 3.2 g/L, Mn 0.16 g/L).
| O/A Ratio v/v | Co | Mn |
|---|
| Rec (%) | Number of Theoretical Stages | Rec (%) | Number of Theoretical Stages |
|---|
| 1 | 95.62 ± 3.95 | 2 | 99.54 ± 0.06 | 2 |
| 2 | 81.02 ± 0.87 | 2 | 97.49 ± 0.68 | 2 |
| 3 | 81.15 ± 3.29 | 2 | 97.58 ± 0.23 | 2 |
| 4 | 68.89 ± 1.42 | 3 | 54.86 ± 0.53 | 3 |
| 5 | 54.72 ± 1.29 | 3 | 33.91 ± 0.18 | 3 |
Table 7.
The precipitation rate and selectivity of Co and Mn using oxalic acid based on mol ratio of Oxalate/Co and initial pH of strip solution.
| | Precipitation Rate (%) | Precipitation Selectivity |
|---|
| Co | Mn | Mn% in Co Precipitate |
|---|
| pH | Oxalate/Co mol ratio 0.5 |
| 1 | 56.58 ± 0.17 | 1.86 ± 0.44 | 0.13 ± 0.03 |
| 2 | 64.40 ± 0.22 | 7.73 ± 0.11 | 0.33 ± 0.00 |
| 3 | 49.40 ± 0.02 | 0.72 ± 0.65 | 0.05 ± 0.05 |
| 4 | 45.38 ± 0.16 | 8.25 ± 1.85 | 0.74 ± 0.16 |
| 5 | 50.03 ± 0.09 | 2.09 ± 1.77 | 0.16 ± 0.13 |
| pH | Oxalate/Co mol ratio 0.75 |
| 1 | 71.64 ± 0.10 | 11.13 ± 0.36 | 0.58 ± 0.02 |
| 2 | 72.28 ± 0.12 | 14.95 ± 0.13 | 0.80 ± 0.06 |
| 3 | 72.75 ± 0.17 | 12.89 ± 0.01 | 0.64 ± 0.00 |
| 4 | 72.39 ± 0.93 | 11.26 ± 0.31 | 0.58 ± 0.02 |
| 5 | 73.36 ± 0.19 | 15.67 ± 1.21 | 0.82 ± 0.07 |
| pH | Oxalate/Co mol ratio 1 |
| 1 | 90.09 ± 0.07 | 15.90 ± 5.32 | 0.68 ± 0.23 |
| 2 | 90.65 ± 0.22 | 15.05 ± 1.40 | 0.65 ± 0.06 |
| 3 | 91.57 ± 0.19 | 17.65 ± 6.83 | 0.76 ± 0.29 |
| 4 | 91.17 ± 0.26 | 20.55 ± 1.91 | 0.88 ± 0.08 |
| 5 | 90.62 ± 0.60 | 17.80 ± 0.97 | 0.75 ± 0.04 |
| pH | Oxalate/Co mol ratio 1.2 |
| 1 | 91.12 ± 1.98 | 29.00 ± 1.94 | 1.25 ± 0.06 |
| 2 | 93.51 ± 0.11 | 30.16 ± 1.68 | 1.27 ± 0.07 |
| 3 | 95.63 ± 0.11 | 54.49 ± 0.48 | 2.22 ± 0.02 |
| 4 | 93.15 ± 0.12 | 31.46 ± 1.44 | 1.36 ± 0.06 |
| 5 | 92.84 ± 0.50 | 30.29 ± 0.47 | 1.31 ± 0.01 |
Table 8.
The precipitation rate and selectivity of Co and Mn using sodium hypochlorite based on mol ratio of hypochlorite/Mn and initial pH of the strip solution.
| | Precipitation Rate (%) | Precipitation Selectivity |
|---|
| Co | Mn | Log [Co/Mn] in Solution |
|---|
| pH | Hypochlorite/Mn mol ratio 2 |
| 3 | −1.11 ± 0.68 | 63.21 ± 0.95 | 1.87 |
| 5 | 2.61 ± 0.61 | 68.26 ± 2.62 | 1.91 |
| 7 | −3.15 ± 0.16 | 66.78 ± 1.85 | 1.92 |
| pH | Hypochlorite/Mn mol ratio 3 |
| 3 | −3.95 ± 0.49 | 92.37 ± 3.63 | 2.60 |
| 5 | −2.05 ± 1.03 | 94.57 ± 0.88 | 2.69 |
| 7 | 0.96 ± 0.42 | 92.61 ± 5.41 | 2.70 |
| pH | Hypochlorite/Mn mol ratio 5 |
| 3 | −1.64 ± 0.22 | 99.96 ± 0.02 | 4.83 |
| 5 | 1.38 ± 1.33 | 100.04 ± 0.02 | 4.93 |
| 7 | 4.33 ± 0.75 | 100.02 ± 0.00 | 4.92 |
Table 9.
The precipitation rate and selectivity of Co and Mn using potassium permanganate based on mol ratio of permanganate/Mn and initial pH of the strip solution.
| | Precipitation Rate (%) | Precipitation Selectivity |
|---|
| Co | Mn | Log [Co/Mn] in Solution |
|---|
| pH | Permanganate/Mn2+ mol ratio 1/6 |
| 3 | 1.20 ± 0.02 | 24.08 ± 0.62 | 1.51 |
| 5 | −1.99 ± 2.01 | 24.24 ± 1.04 | 1.52 |
| 7 | −1.61 ± 0.08 | 23.67 ± 1.43 | 1.52 |
| pH | Permanganate/Mn2+ mol ratio 1/3 |
| 3 | 1.42 ± 3.47 | 34.18 ± 17.91 | 1.58 |
| 5 | 2.61 ± 0.78 | 45.07 ± 0.11 | 1.65 |
| 7 | 1.60 ± 0.22 | 44.56 ± 0.33 | 1.64 |
| pH | Permanganate/Mn2+ mol ratio 2/3 |
| 3 | 12.79 ± 1.29 | 91.08 ± 0.27 | 2.35 |
| 5 | 4.61 ± 1.58 | 91.96 ± 1.19 | 2.43 |
| 7 | 5.43 ± 1.94 | 91.71 ± 0.25 | 2.41 |
| pH | Permanganate/Mn2+ mol ratio 4/3 |
| 3 | 7.29 ± 0.54 | 73.01 ± 0.54 | 1.90 |
| 5 | 7.37 ± 0.98 | 79.47 ± 0.76 | 2.00 |
| 7 | 7.17 ± 0.67 | 82.19 ± 0.63 | 2.07 |
Table 10.
Ni extraction rate and theoretical stages required for complete extraction at different A/O ratios (LIX® 84-I 10% v/v, feed solution 0.13 g/L, pH 5).
| A/O Ratio v/v | Ni Rec (%) | Number of Theoretical Stages |
|---|
| 1 | 99.79 ± 0.09 | 1 |
| 2 | 99.26 ± 0.01 | 1 |
| 3 | 99.26 ± 0.01 | 1 |
| 4 | 99.28 ± 0.04 | 1 |
| 5 | 99.41 ± 0.20 | 1 |
| 6 | 97.96 ± 1.45 | 2 |
| 7 | 91.69 ± 1.08 | 2 |
Table 11.
Ni stripping recovery according to mineral acid type and acid concentration (O/A 1, feed organic LIX® 84-I 10% v/v, Ni 4.2 g/L).
| Acid Concentration (M) | Ni Stripping Recovery (%) |
|---|
| Sulfuric Acid | Nitric Acid | Hydrochloric Acid |
|---|
| 0.1 | 61.18 ± 0.24 | 50.84 ± 3.44 | 56.32 ± 0.15 |
| 0.5 | 62.44 ± 0.70 | 62.87 ± 0.28 | 55.87 ± 2.06 |
| 1 | 62.26 ± 1.18 | 65.79 ± 0.51 | 62.22 ± 1.17 |
| 2 | 61.01 ± 0.35 | 65.86 ± 0.34 | 60.07 ± 0.87 |
| 5 | 58.19 ± 1.42 | 63.50 ± 1.18 | 63.93 ± 4.31 |


 ,
, 


