
Fatigue Analysis of Long-Span Steel Truss Arched Bridge Part II: Fatigue Life Assessment of Suspenders Subjected to Dynamic Overloaded Moving Vehicles

Abstract
:1. Introduction
2. Project Summary
3. Finite Element Analysis
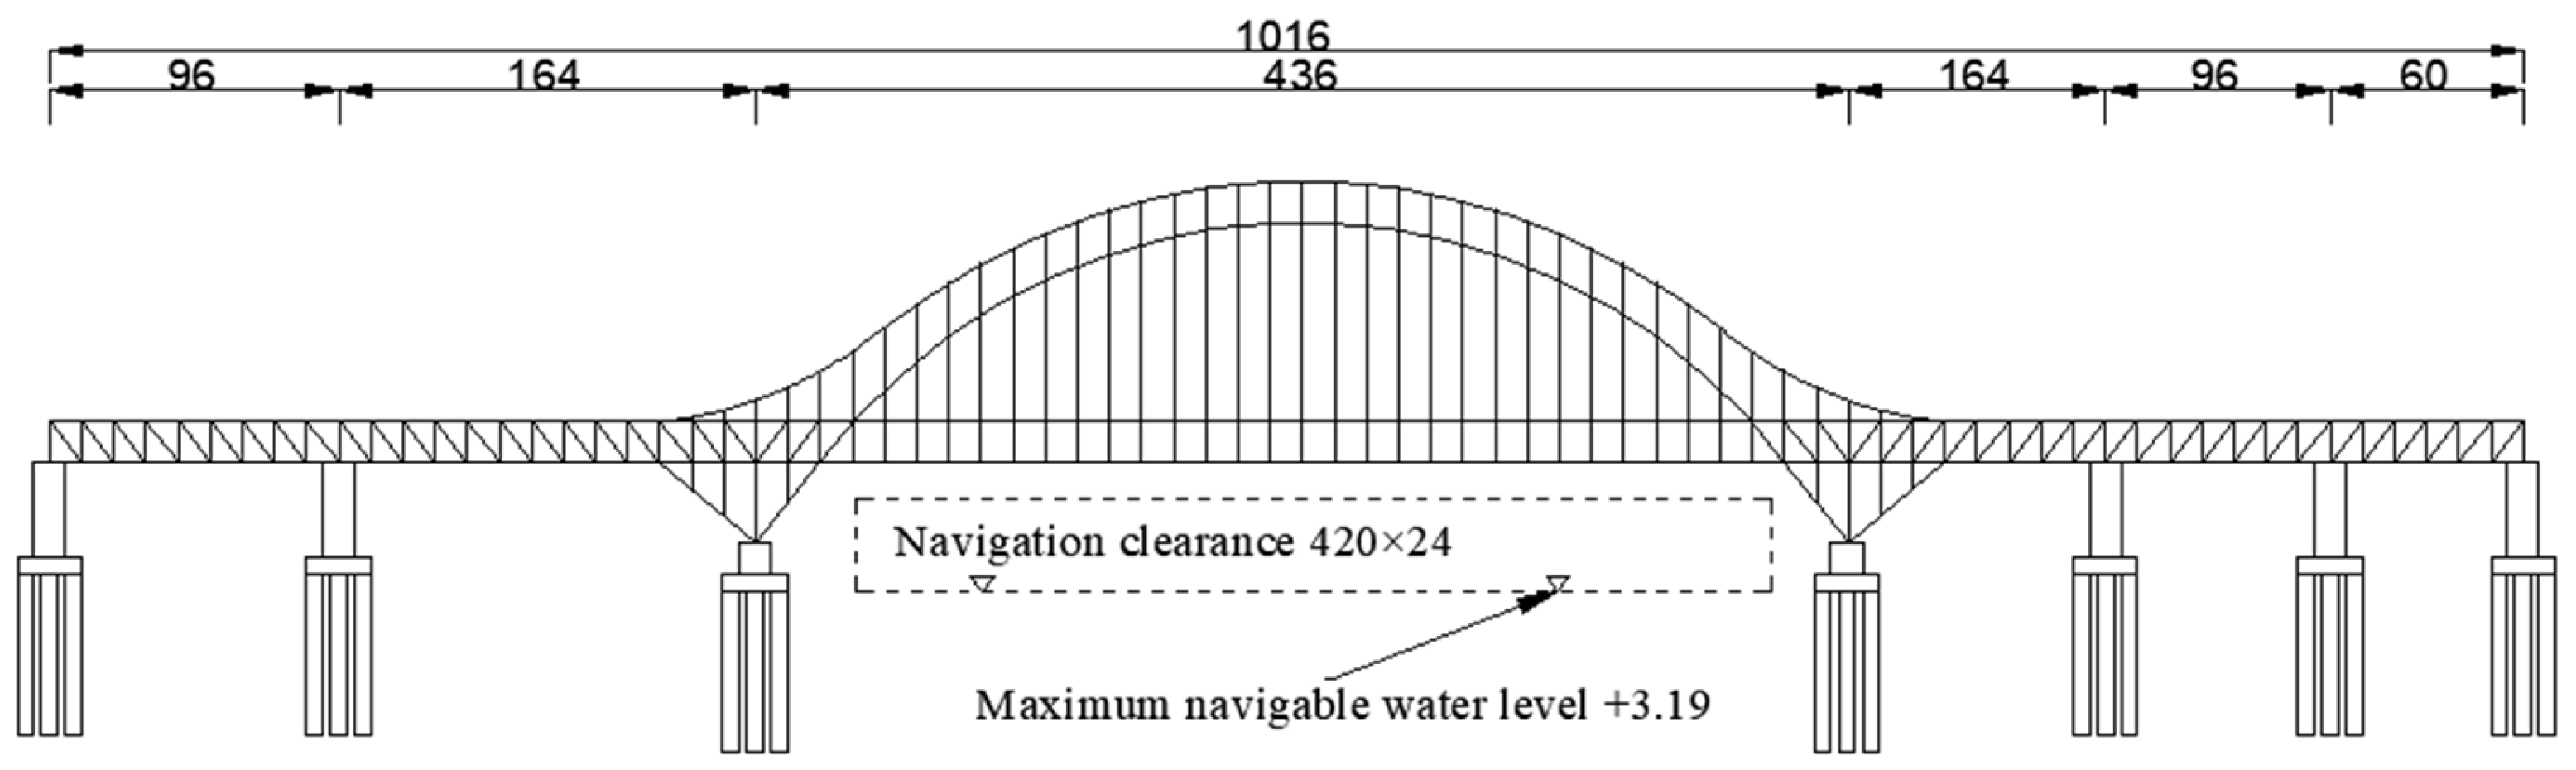
3.1. FE Model of the Bridge
3.2. Suspenders’ Parameters
3.3. Chemical Composition and Mechanical Properties of Suspender Cable
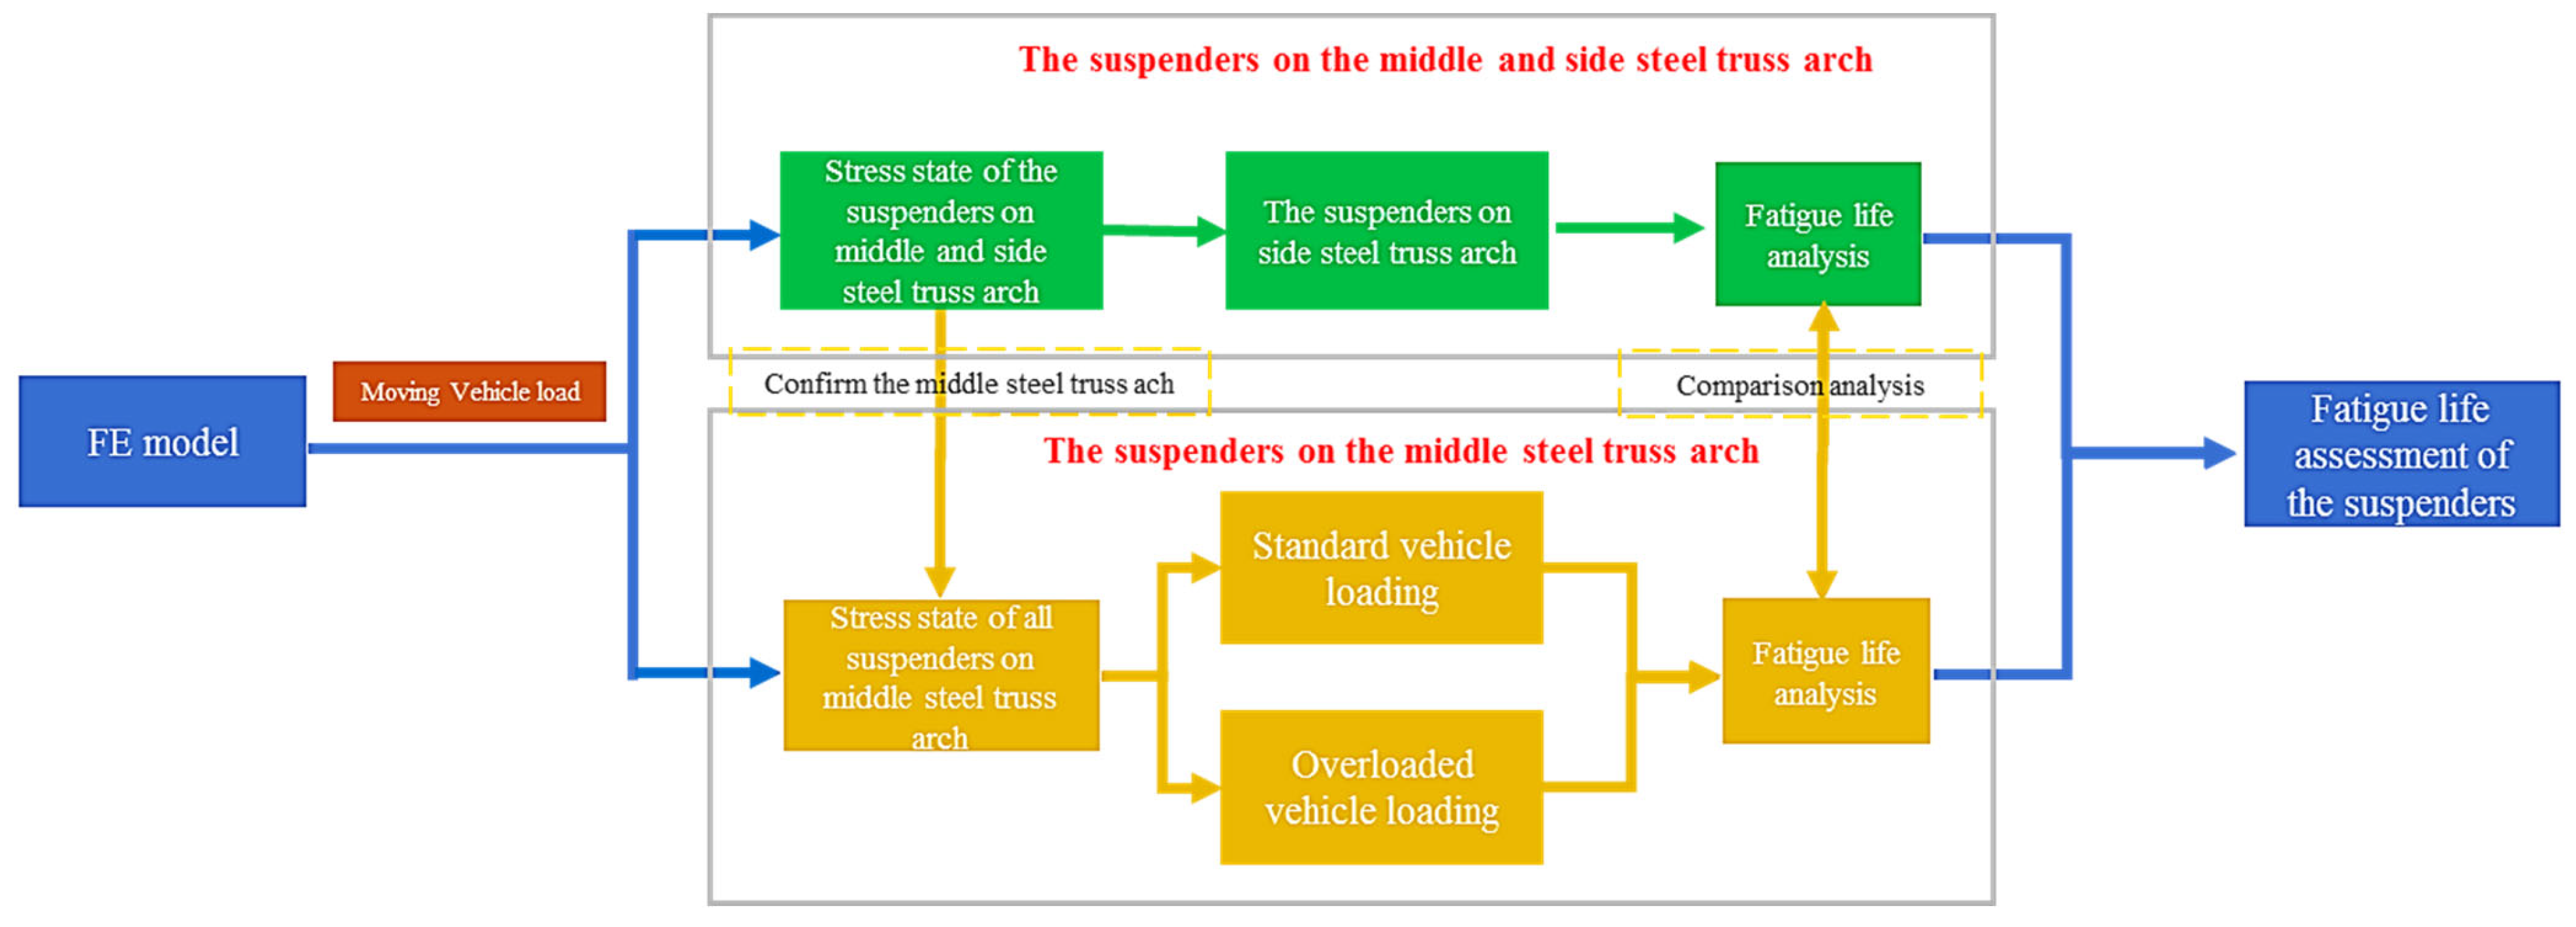
4. Movie Vehicle Load and Fatigue Life Assessment Method
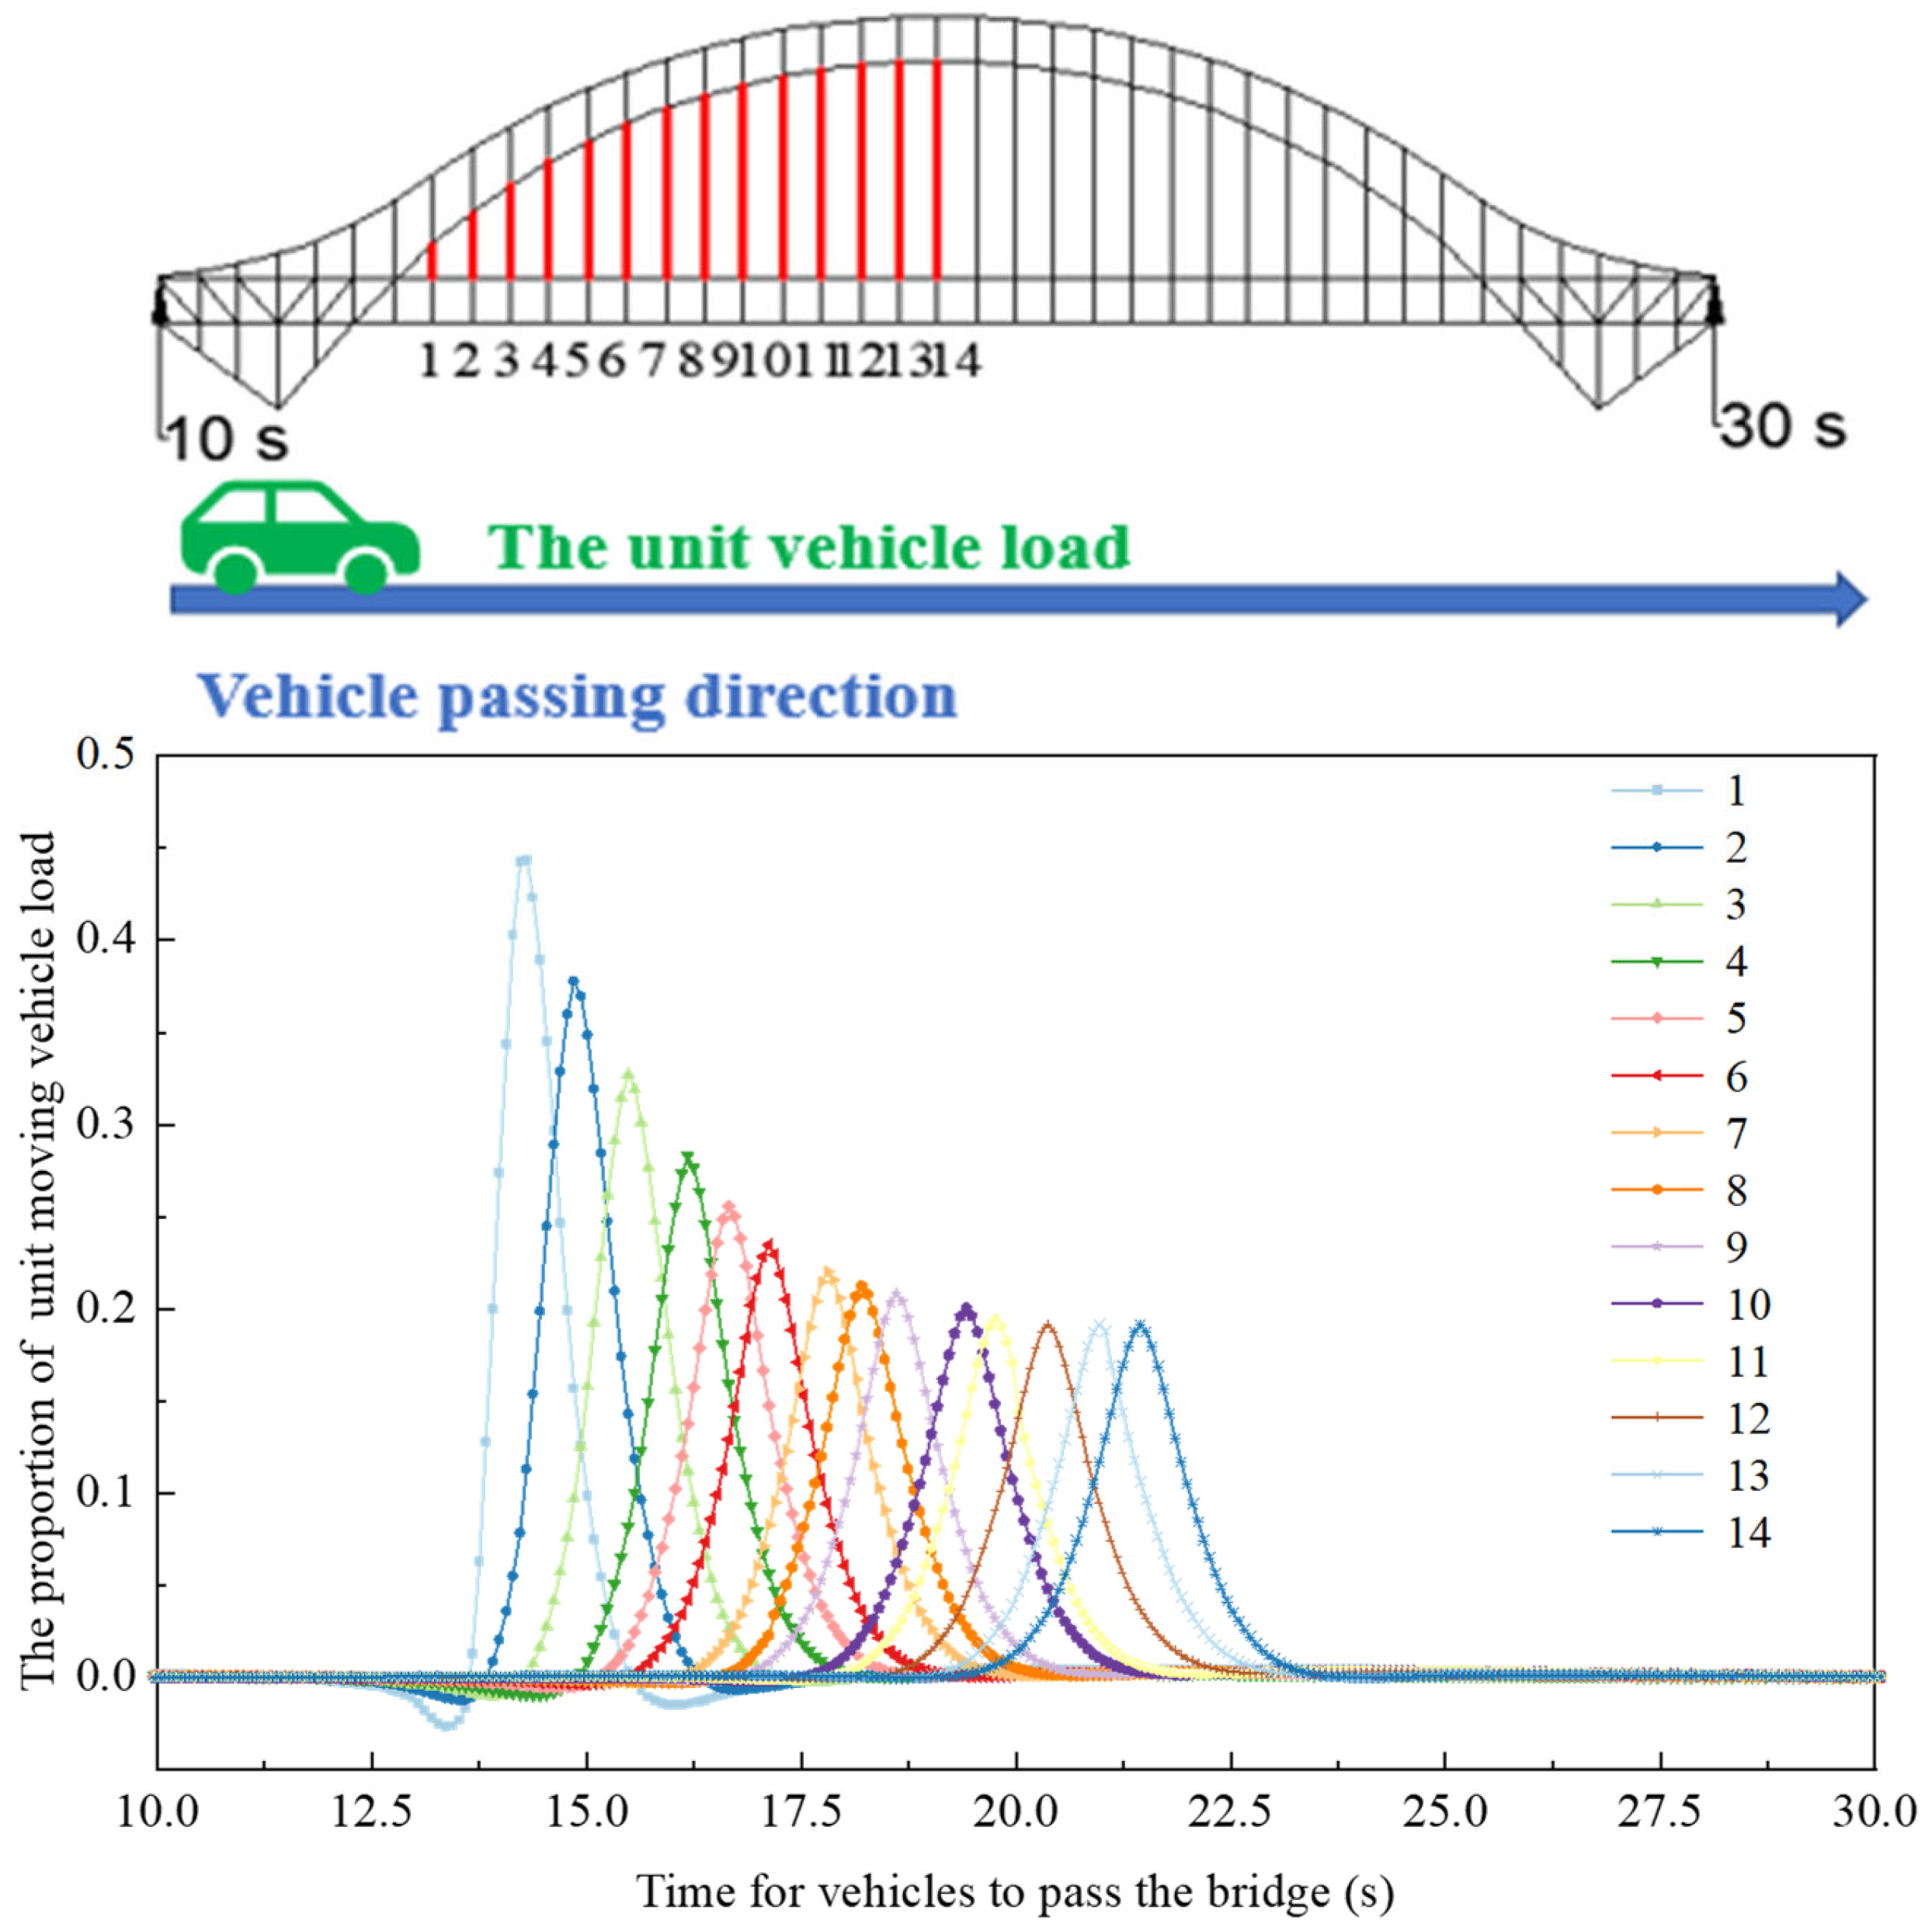
4.1. Moving Vehicle Load
4.2. Fatigue Life Assessment Method
5. Results and Discussion
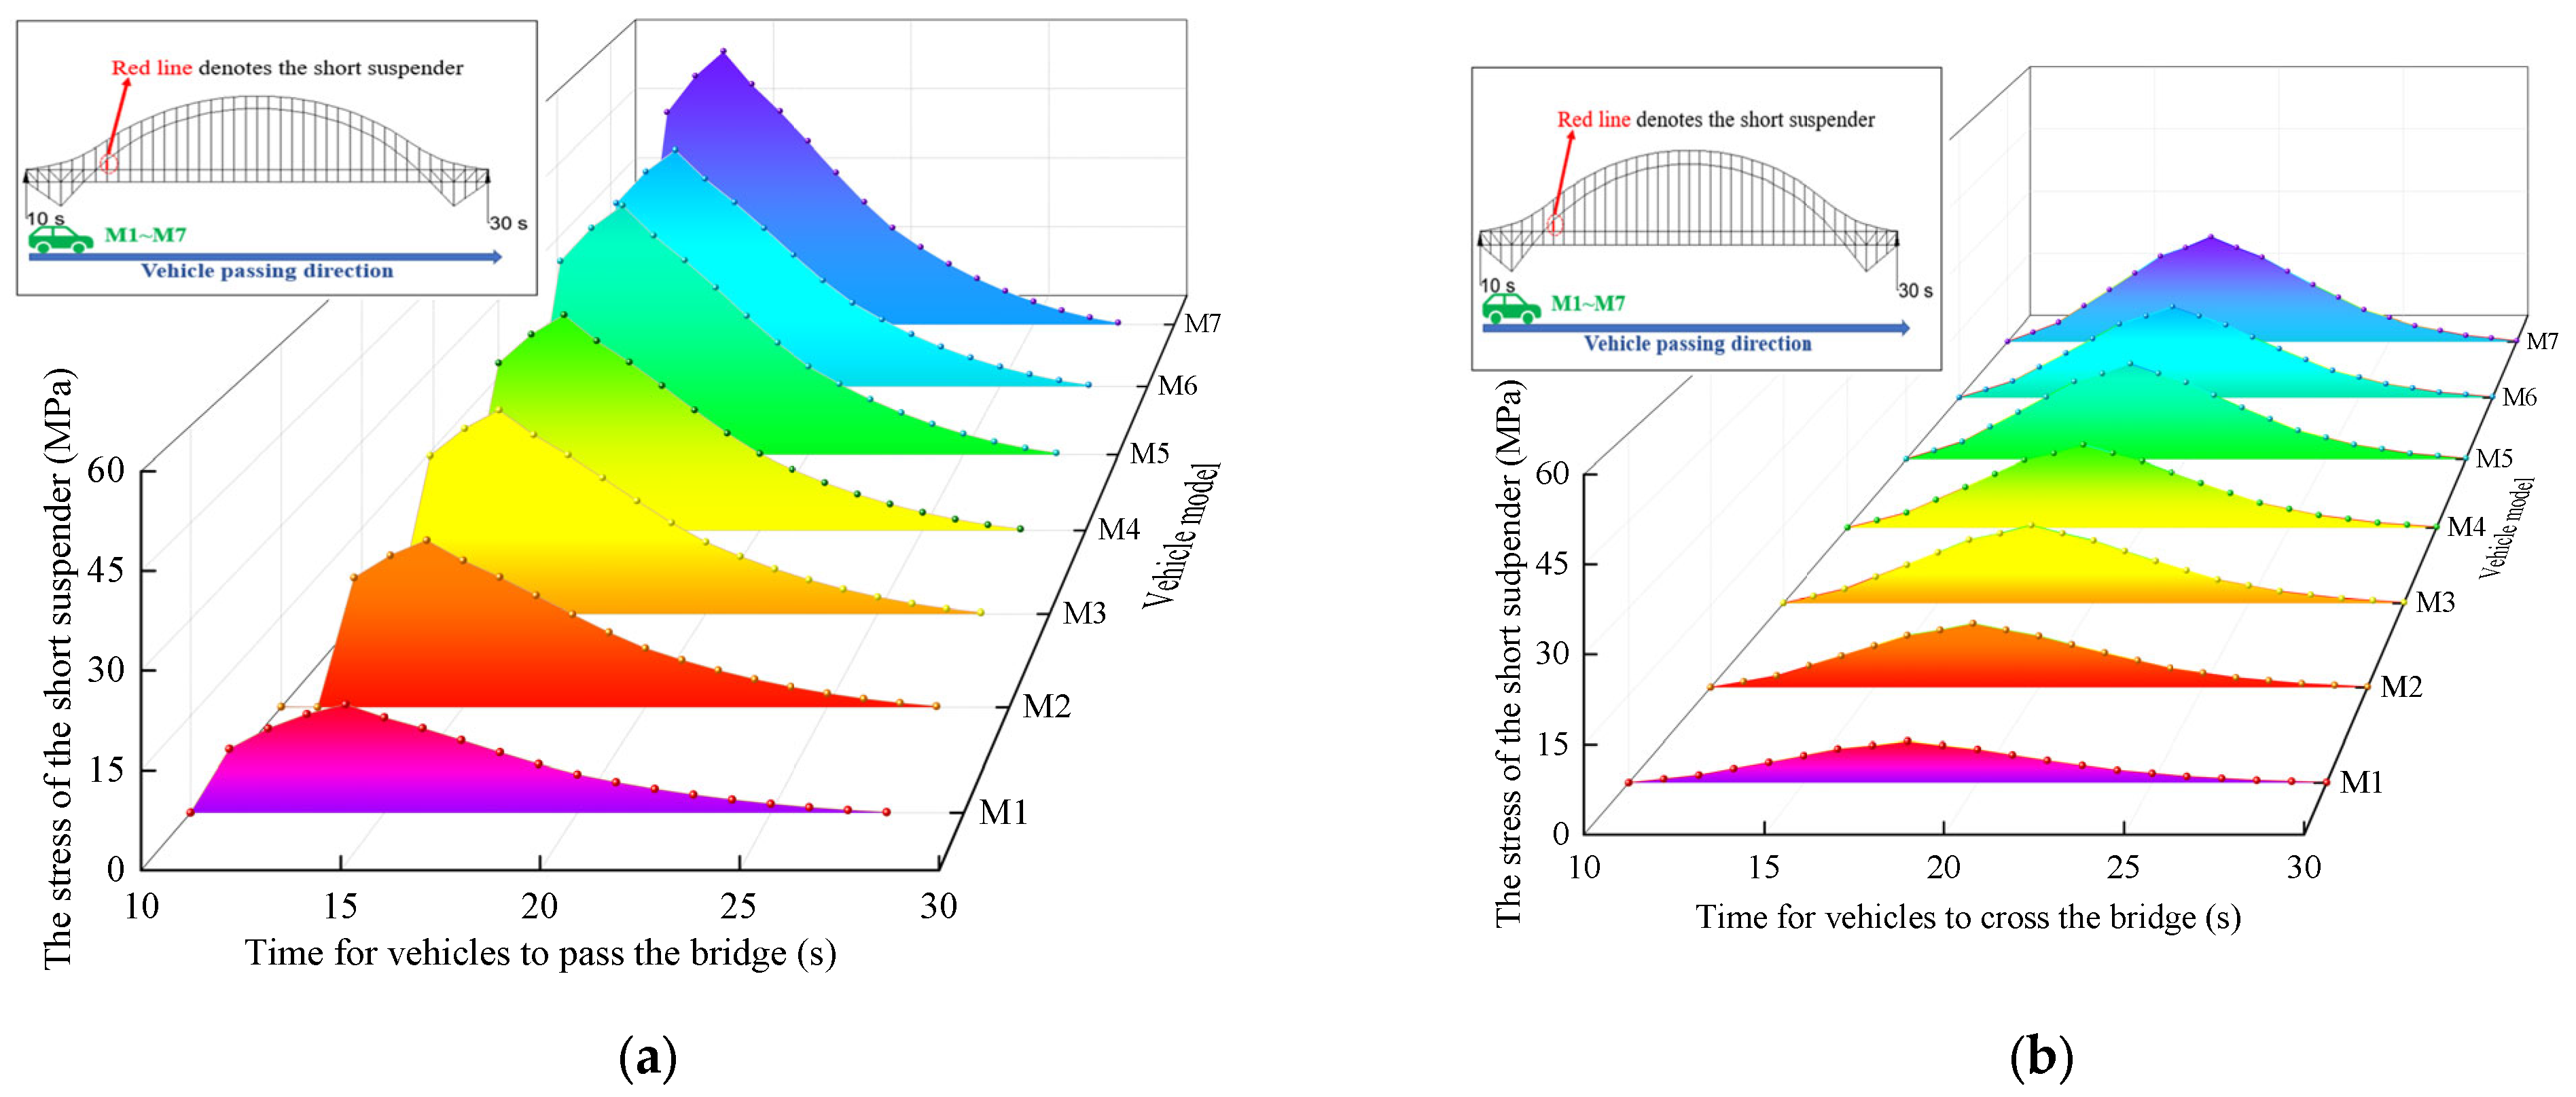
5.1. Impact of Steel Truss Arch on the Short Suspender
5.2. Impact of Overloaded Rate
6. Conclusions
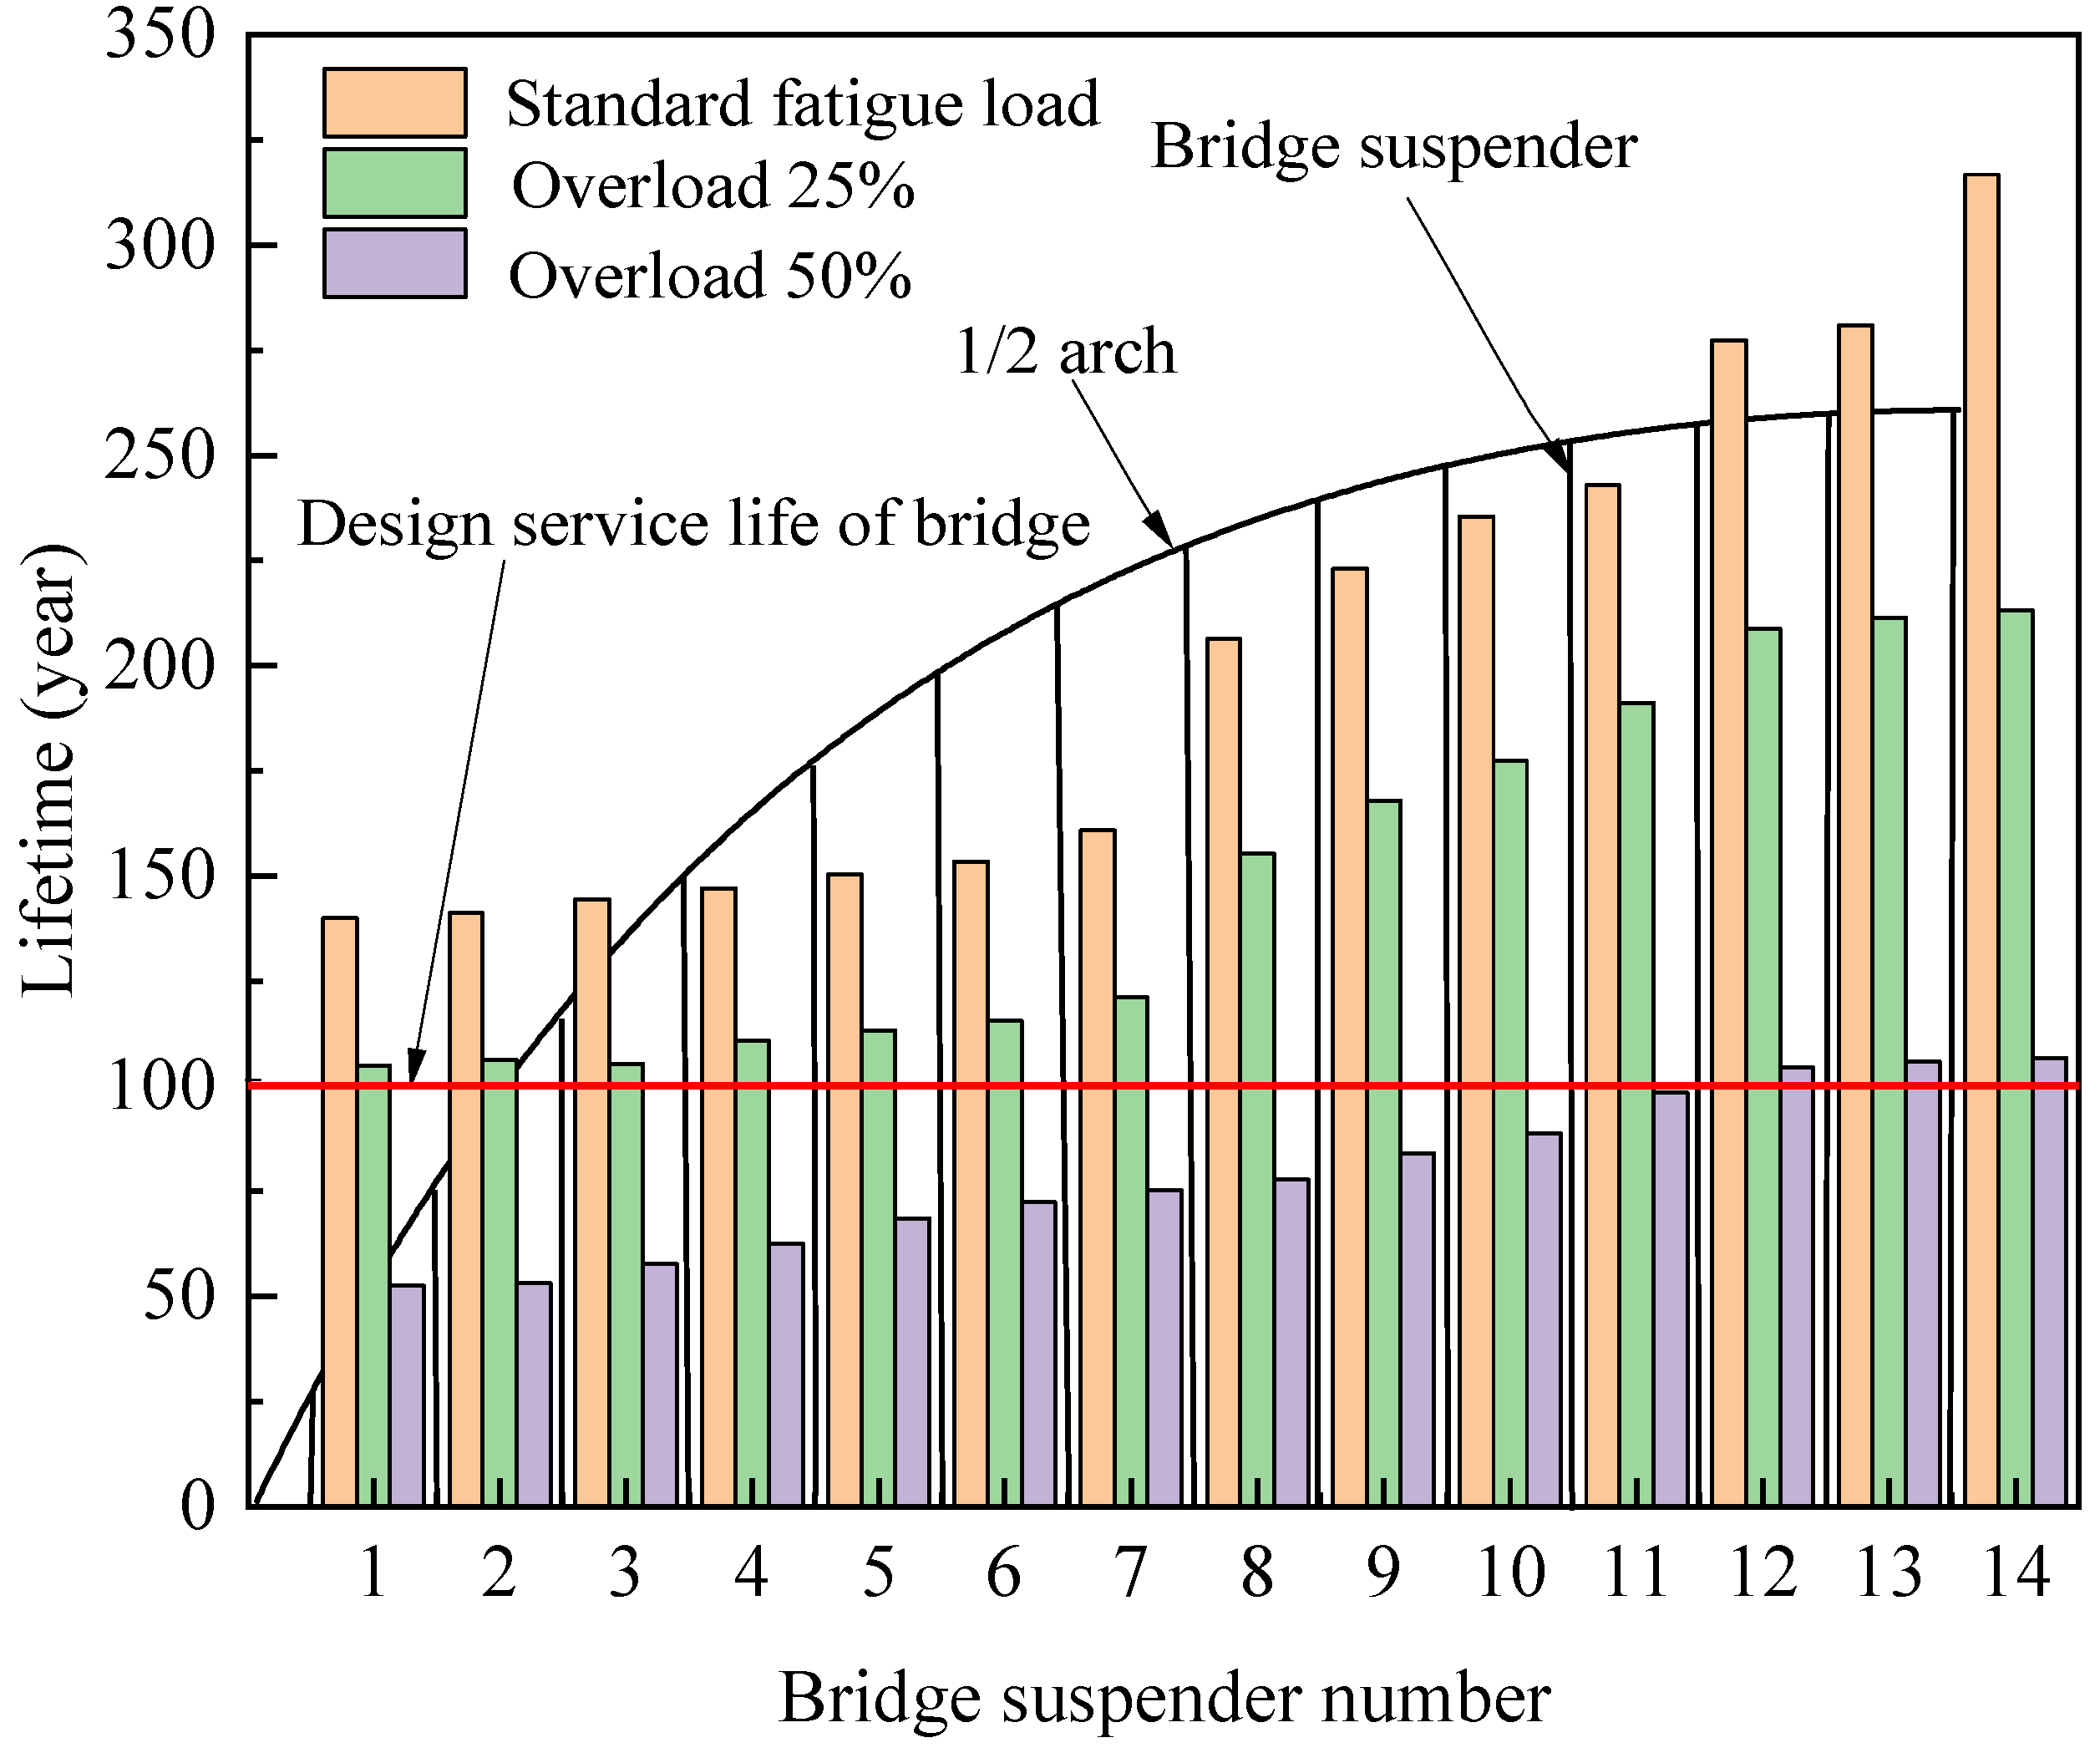
- The short suspenders near the arch foot show a larger stress amplitude than others, while the stress on the suspenders in the middle steel truss arch is greater than the suspenders in the side truss arch. However, the fatigue life of the short suspender under a standard traffic load is 140 years, which meets the design requirement of 100 years.
- The fatigue life of the suspenders decreases by 20% and 30% under the overloaded rate of 25% and 50%, respectively. With a vehicle design speed of 80 km/h, the fatigue life of the short suspender on the mid-truss arch is about 50 years under the 50% overloaded rate, which is significantly lower than the bridge design life of 100 years.
- The fatigue life shows a non-linear decreasing trend with the increasing overloading ratio. Overloading has a significant effect on the suspender life of steel truss arch bridges. Herein, the overloaded vehicles should be strictly controlled to ensure the safety of the bridge during its service.
Author Contributions
Funding
Institutional Review Board Statement
Informed Consent Statement
Data Availability Statement
Acknowledgments
Conflicts of Interest
Nomenclature
| N | number of fatigue cycles, |
| σm | mean stress value of σa and σb, |
| σa, σb | tensile strength of the suspenders and the mean stress of the suspenders, |
| d, D | fatigue damage per single cycle and fatigue damage per day, |
| m | coefficient of the fatigue damage, |
| x | number of cycles to reach a stress level, |
| n | number of vehicle cycles, |
| σae | the equivalent stress amplitude of the suspender. |
References
- Yoda, T. Classifications, Designloading, and Analysis Methods; Butterworth-Heinemann: Oxford, UK, 2017; pp. 84–93. [Google Scholar]
- Polepeddi, R. The Effect of Fatigue Damage in Rating Bridges under Overload Conditions; Illinois Institute of Technology ProQuest Dissertations Publishing: Chicago, IL, USA, 1997. [Google Scholar]
- An, Y.; Guan, D.; Ding, Y.; Ou, J. Fast Warning Method for Rigid Hangers in a High-Speed Railway Arch Bridge Using Long-Term Monitoring Data. J. Perform. Constr. Facil. 2017, 31, 04017103. [Google Scholar] [CrossRef]
- Wang, W.; Deng, L.; Shao, X. Fatigue Design of Steel Bridges Considering the Effect of Dynamic Vehicle Loading and Overloaded Trucks. J. Bridg. Eng. 2016, 21, 04016048. [Google Scholar] [CrossRef]
- Mohammadi, J.; Polepeddi, R. Bridge Rating with Consideration for Fatigue Damage from Overloads. J. Bridg. Eng. 2000, 5, 259–265. [Google Scholar] [CrossRef]
- Carpinteri, A.; Fortese, G.; Ronchei, C.; Scorza, D.; Spagnoli, A.; Vantadori, S. Fatigue life evaluation of metallic structures under multiaxial random loading. Int. J. Fatigue 2016, 90, 191–199. [Google Scholar] [CrossRef]
- Macek, W.; Lagoda, T.; Mucha, N. Energy-based fatigue failure characteristics of materials under random bending loading in elastic-plastic range. Fatigue Fract. Eng. Mater. Struct. 2017, 41, 249–259. [Google Scholar] [CrossRef]
- Pejkowski, Ł.; Seyda, J. Fatigue of four metallic materials under asynchronous loadings: Small cracks observation and fatigue life prediction. Int. J. Fatigue 2020, 142, 105904. [Google Scholar] [CrossRef]
- Zhang, B.; Chen, W.; Xu, J. Load effect and fatigue damage of bridges under combined actions of traffic and wind: A case study. Stahlbau 2016, 85, 281–291. [Google Scholar] [CrossRef]
- Zhang, W.; Cai, C.S.; Pan, F. Fatigue Reliability Assessment for Long-Span Bridges under Combined Dynamic Loads from Winds and Vehicles. J. Bridg. Eng. 2013, 18, 735–747. [Google Scholar] [CrossRef]
- Yang, Y.-B.; Liao, S.-S.; Lin, B.-H. Impact formulas for vehicles moving over simple and continuous beams. J. Struct. Eng. 1995, 121, 1644–1650. [Google Scholar] [CrossRef]
- Kwon, K.; Frangopol, D.M. Bridge fatigue reliability assessment using probability density functions of equivalent stress range based on field monitoring data. Int. J. Fatigue 2010, 32, 1221–1232. [Google Scholar] [CrossRef]
- Kwon, K.; Frangopol, D.; Soliman, M. Probabilistic fatigue life estimation of steel bridges by using a bilinear S-N approach. J. Bridge Eng. 2012, 32, 121–1232. [Google Scholar] [CrossRef]
- Raju, S.; Moses, F.; Schilling, C. Reliability calibration of fatigue evaluation and design procedures. J. Struct. Eng. 1990, 5, 1356–1369. [Google Scholar] [CrossRef]
- Mohammadi, J.; Shah, N. Statistical Evaluation of Truck Overloads. J. Transp. Eng. 1992, 118, 651–665. [Google Scholar] [CrossRef]
- Obrien, E.J.; Enright, B.; Getachew, A. Importance of the Tail in Truck Weight Modeling for Bridge Assessment. J. Bridg. Eng. 2010, 15, 210–213. [Google Scholar] [CrossRef]
- Obrien, E.J.; Hayrapetova, A.; Walsh, C. The use of micro-simulation for congested traffic load modeling of medium- and long-span bridges. Struct. Infrastruct. Eng. 2012, 8, 269–276. [Google Scholar] [CrossRef]
- Schilling, C.G. Stress Cycles for Fatigue Design of Steel Bridges. J. Struct. Eng. 1984, 110, 1222–1234. [Google Scholar] [CrossRef]
- Schilling, C.G.; Klippstein, K.H. Fatigue of Steel Beams by Simulated Bridge Traffic. J. Struct. Div. 1977, 103, 1561–1575. [Google Scholar] [CrossRef]
- Schilling, C.G.; Klippstein, K.H. New Method for Fatigue Design of Bridges. J. Struct. Div. 1978, 104, 425–438. [Google Scholar] [CrossRef]
- Schilling, C.G.; Klippstein, K.H.; Barsom, J.M.; Blake, G.T. Fatigue of Welded Steel Bridge Members under Variable-Amplitude Loadings; National Cooperative Highway Research Program Rep. 188; Transportation Research Board: Washington, DC, USA, 1978; Volume 4. [Google Scholar]
- Wang, T.-L.; Liu, C. Influence of Heavy Trucks on Highway Bridges; Rep. No. FL/DOT/RMC/6672-379; Florida Department of Transportation: Tallahassee, FL, USA, 2000. [Google Scholar]
- Wang, T.-L.; Liu, C.; Huang, D.; Shahawy, M. Truck Loading and Fatigue Damage Analysis for Girder Bridges Based on Weigh-in-Motion Data. J. Bridg. Eng. 2005, 10, 12–20. [Google Scholar] [CrossRef]
- Zhao, J.; Tabatabai, H. Evaluation of a Permit Vehicle Model Using Weigh-in-Motion Truck Records. J. Bridg. Eng. 2012, 17, 389–392. [Google Scholar] [CrossRef]
- Zhang, W.; Cai, C.S. Fatigue Reliability Assessment for Existing Bridges Considering Vehicle Speed and Road Surface Conditions. J. Bridg. Eng. 2012, 17, 443–453. [Google Scholar] [CrossRef]
- Zhang, W.; Cai, C.S. Reliability-Based Dynamic Amplification Factor on Stress Ranges for Fatigue Design of Existing Bridges. J. Bridg. Eng. 2013, 18, 538–552. [Google Scholar] [CrossRef]
- Zhao, J.; Yin, G.S.; An, L.M.; Liu, Y.T.; Ren, Y.L. Middle span closure technology of main bridge of Guangzhou Mingzhu Way Bridge. Bridge Constr. 2021, 51, 127–133. (In Chinese) [Google Scholar]
- MIDAS 2019. Computer Software. Midas: Beijing, China.
- Jiang, C.; Wu, C.; Jiang, X. Uniform corrosion and pitting corrosion of high strength steel wires for bridge cables. J. Tongji Univ. 2018, 46, 1615–1621. (In Chinese) [Google Scholar] [CrossRef]
- Suspender of Highway Suspension Bridge: JT/T 449-2021; Ministry of Transport of the People’s Republic of China: Beijing, China, 2021. (In Chinese)
- Hu, H.Y.; Zhao, J.; Ren, Y.L.; An, L.M.; Liu, Y.T. Overall Design of Main Bridge of Guangzhou Mingzhu Wan Bridge. Bridge Constr. 2021, 51, 93–99. (In Chinese) [Google Scholar]
- Traffic Volume Report of Guangzhou Mingzhu Wan Bridge; China Railway Construction Bridge Bureau Group Co., Ltd. Postdoctoral Workstation: Guangzhou, China, 2019.
- Standard for Design of Steel Structures: GB 50017—2017 Beijing; China Architecture and Building Press: Guangzhou, China, 2017. (In Chinese)
- Xia, T.X.; Yao, W.X.; Liu, X.M.; Ji, Y.F. Study on the Applicability of Miner’s Theory in multi-axis two-step Spectrum considering material dispersion. Chin. J. Mech. Eng. 2015, 51, 38–45. [Google Scholar] [CrossRef]
- Zhang, S.Y.; Wu, H. Multi-axial Low-cycle Fatigue Life Evaluation based on Sequential Rain Flow Method and Critical Plane Method. Mech. Q. 2020, 9, 465–476. (In Chinese) [Google Scholar]
- MATLAB [Computer software]; MathWorks: Natick, MA, USA, 2020.
- Guangzhou Mingzhu Wan Bridge (96+164+436+164+96+60) m Six-Span Continuous Steel Truss Arch Construction Calculation Book; China Railway Construction Bridge Bureau Group Co., Ltd. Postdoctoral Workstation: Guangzhou, China, 2019.


| Chemical Composition | C | Si | Mn | Cr | S | Cu |
|---|---|---|---|---|---|---|
| Mass fraction (%) | 0.85~0.90 | 0.12~0.32 | 0.60~0.90 | 0.10~0.25 | ≤0.025 | ≤0.10 |
| Nominal Diameter (mm) | Tensile Strength (MPa) | Elongation | Modulus of Elasticity (MPa) |
|---|---|---|---|
| 7.0 ± 0.07 | 1670 | ≥4.0 | (2.0 ± 0.1) × 105 |
| Vehicle Model Type | Vehicle Model (Axle Weight, kN, Axle Spacing, mm) | Total Weight (kN) | Daily Traffic Flow | The Proportion of Total Traffic |
|---|---|---|---|---|
| M1 |  | 135 | 1543 | 14.78 |
| M2 | 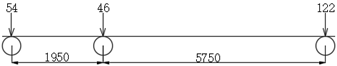 | 222 | 223 | 2.14 |
| M3 | 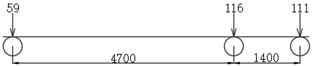 | 286 | 73 | 0.70 |
| M4 |  | 319 | 460 | 4.14 |
| M5 | 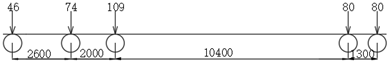 | 389 | 13 | 0.13 |
| M6 | 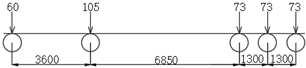 | 387 | 135 | 1.29 |
| M7 | 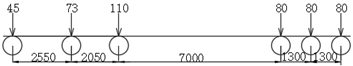 | 468 | 1453 | 13.92 |
| Stress Amplitude σa (MPa) | Number of Cycles (Times) | Stress Amplitude σa (MPa) | Number of Cycles (Times) |
|---|---|---|---|
| 0~1 | 3900 | 25~30 | 0 |
| 1~5 | 1839 | 30~35 | 0 |
| 5~10 | 2061 | 35~40 | 0 |
| 10~15 | 0 | 40~45 | 0 |
| 15~20 | 0 | 45~50 | 0 |
| 20~25 | 0 | >50 | 3900 |
| Vehicle Model | Standard | Overweight Rate | Traffic Flow Per Day | |
|---|---|---|---|---|
| Weight (kN) | 25% (kN) | 50% (kN) | ||
| M1 | 135 | 168.75 | 202.5 | 1543 |
| M2 | 222 | 277.5 | 333 | 223 |
| M3 | 286 | 357.5 | 429 | 73 |
| M4 | 319 | 398.5 | 478.5 | 460 |
| M5 | 389 | 486.25 | 583.5 | 13 |
| M6 | 387 | 483.75 | 580.5 | 135 |
| M7 | 486 | 585 | 729 | 1453 |
Publisher’s Note: MDPI stays neutral with regard to jurisdictional claims in published maps and institutional affiliations. |
© 2022 by the authors. Licensee MDPI, Basel, Switzerland. This article is an open access article distributed under the terms and conditions of the Creative Commons Attribution (CC BY) license (https://creativecommons.org/licenses/by/4.0/).
Share and Cite
Liu, P.; Lu, H.; Chen, Y.; Zhao, J.; An, L.; Wang, Y.; Liu, J. Fatigue Analysis of Long-Span Steel Truss Arched Bridge Part II: Fatigue Life Assessment of Suspenders Subjected to Dynamic Overloaded Moving Vehicles. Metals 2022, 12, 1035. https://doi.org/10.3390/met12061035
Liu P, Lu H, Chen Y, Zhao J, An L, Wang Y, Liu J. Fatigue Analysis of Long-Span Steel Truss Arched Bridge Part II: Fatigue Life Assessment of Suspenders Subjected to Dynamic Overloaded Moving Vehicles. Metals. 2022; 12(6):1035. https://doi.org/10.3390/met12061035
Chicago/Turabian StyleLiu, Peng, Hongping Lu, Yixuan Chen, Jian Zhao, Luming An, Yuanqing Wang, and Jianping Liu. 2022. "Fatigue Analysis of Long-Span Steel Truss Arched Bridge Part II: Fatigue Life Assessment of Suspenders Subjected to Dynamic Overloaded Moving Vehicles" Metals 12, no. 6: 1035. https://doi.org/10.3390/met12061035