
Residual Stress Reduction with the LTT Effect in Low Carbon Manganese-Steel through Chemical Composition Manipulation Using Dissimilar Filler Material in Laser Beam Welding

 , , ,
, , ,
Abstract
:1. Introduction
2. Materials and Methods
2.1. Materials
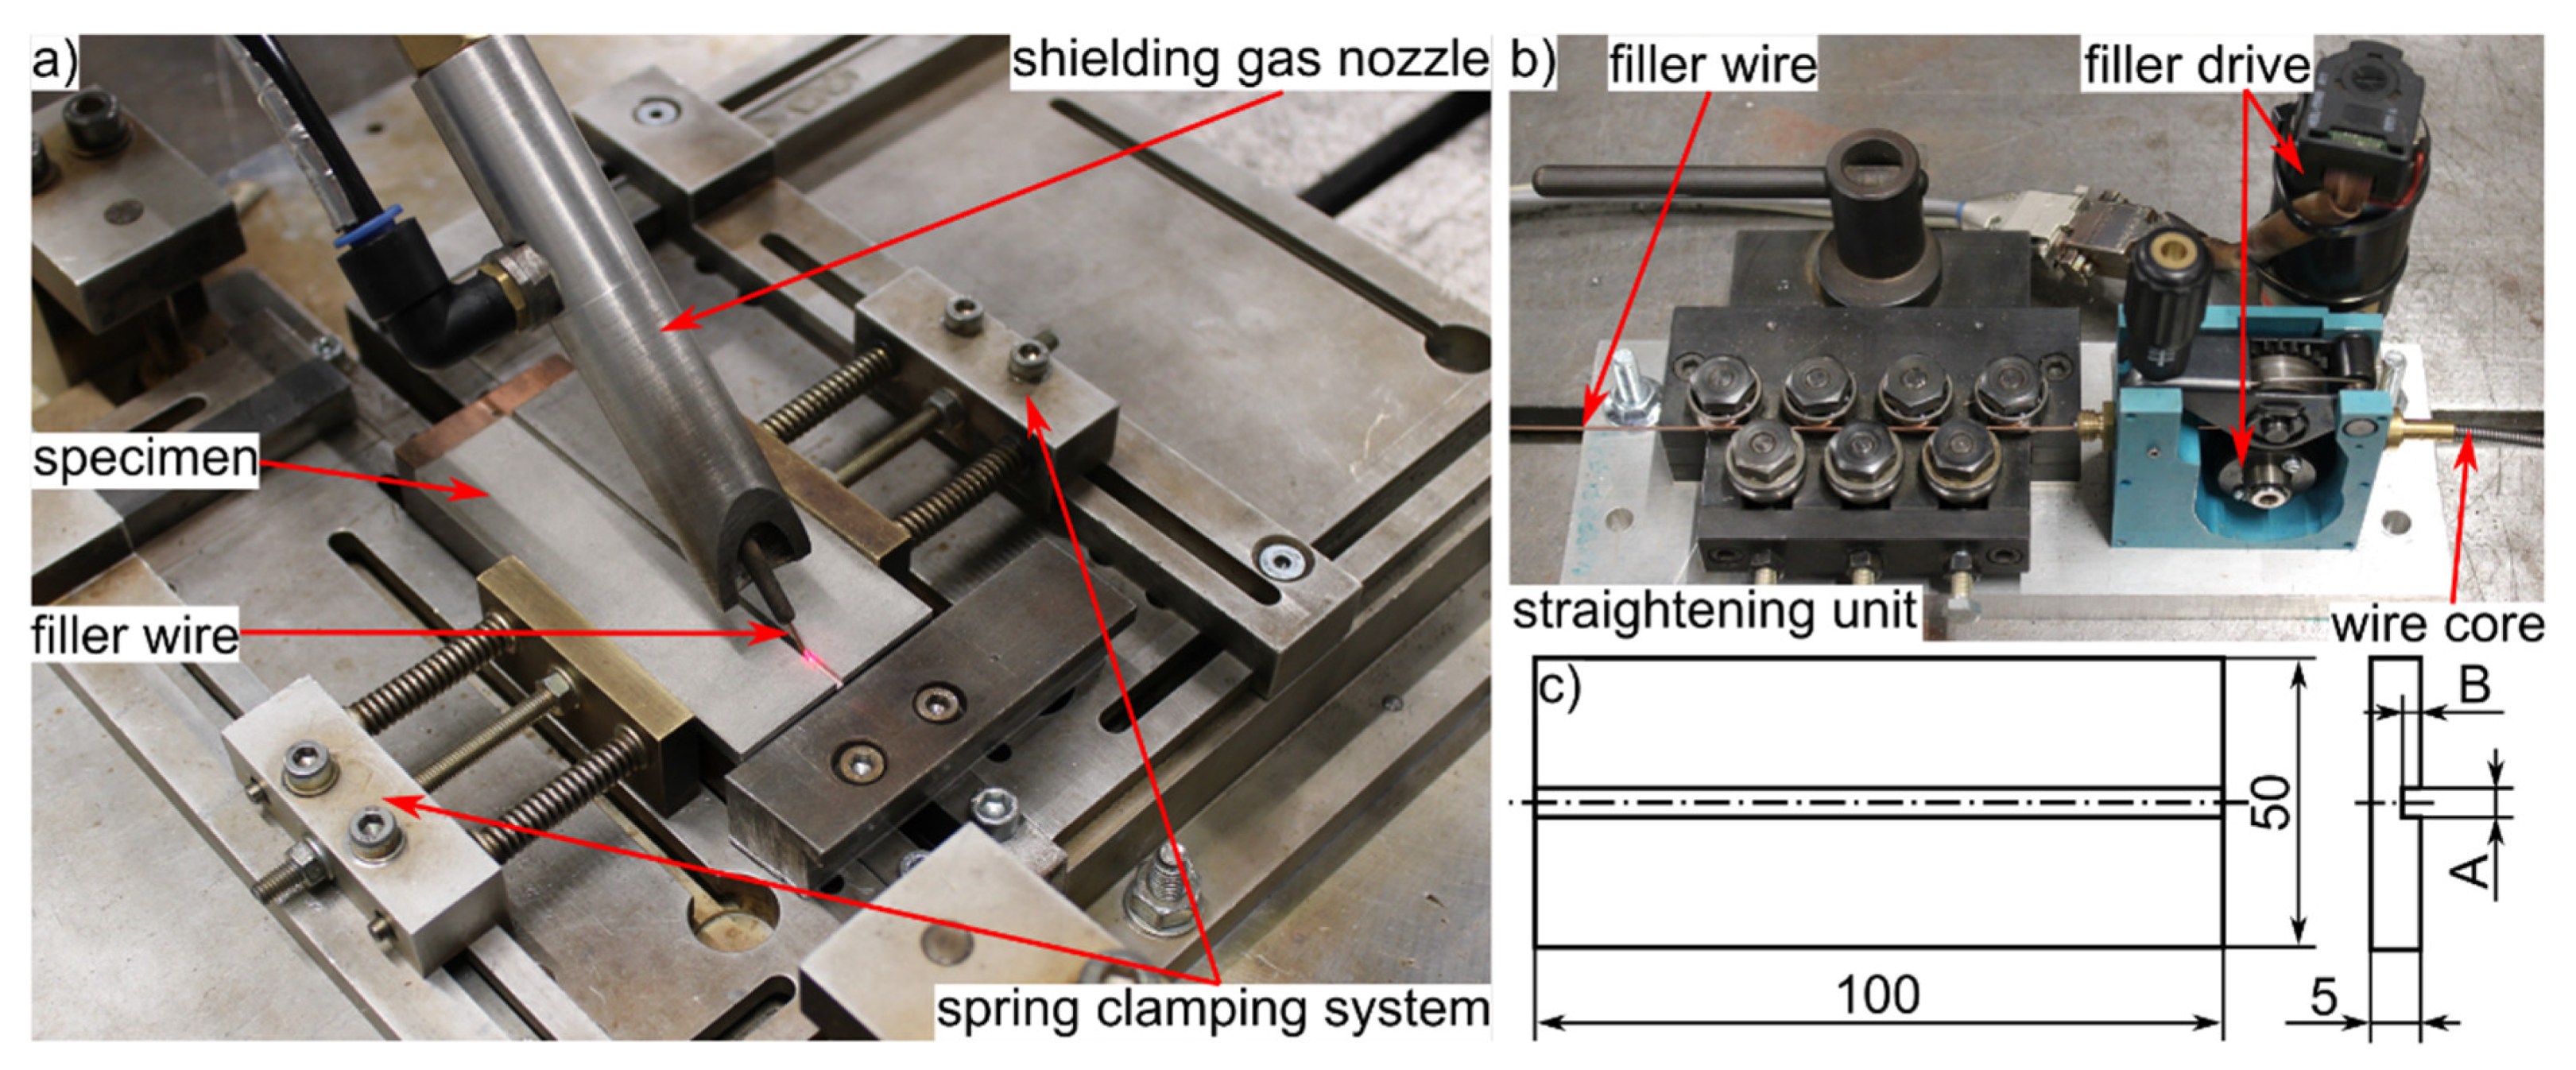
2.2. Welding Trials
3. Results
3.1. Energy-Dispersive X-ray Spectroscopy
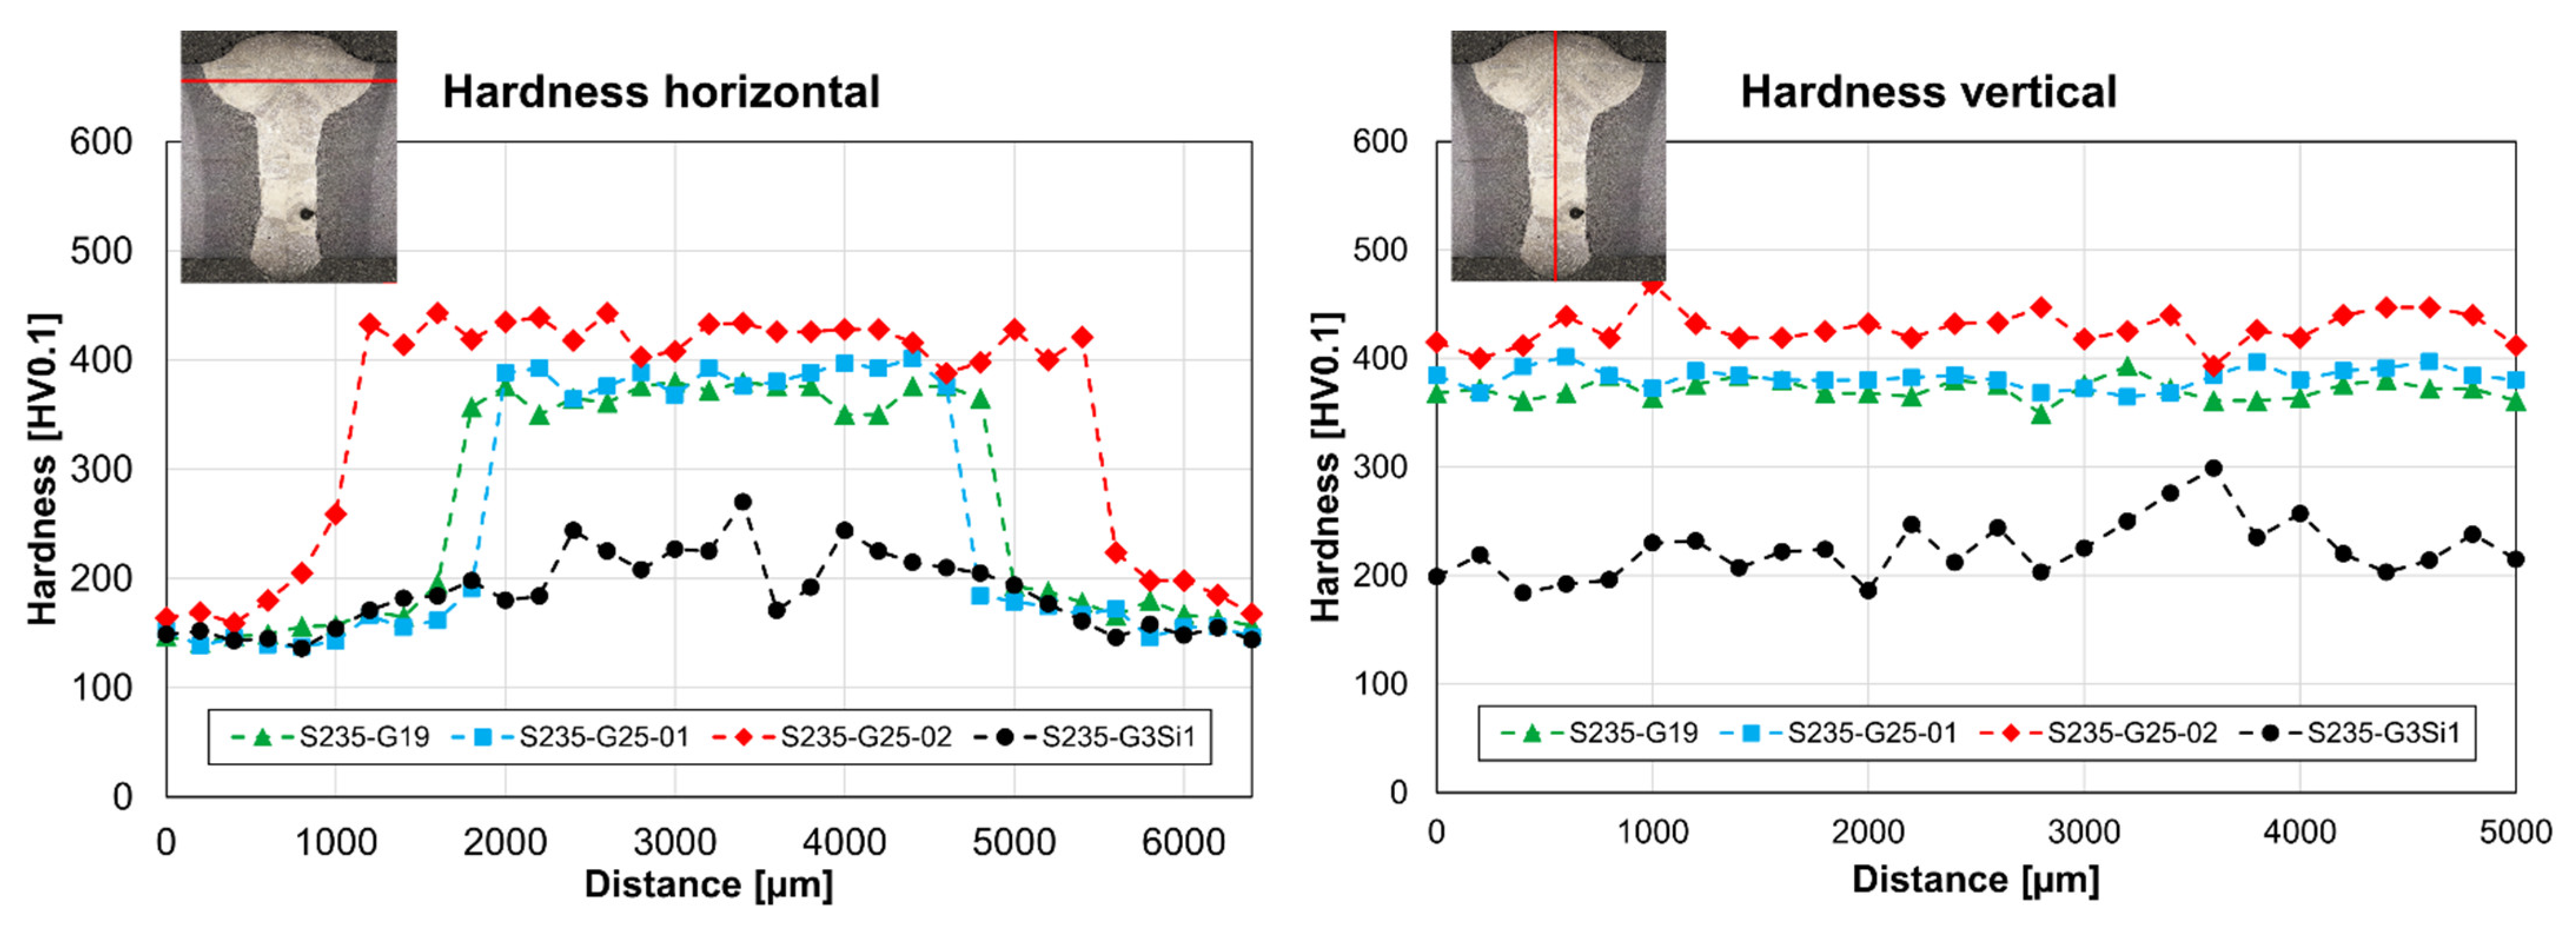
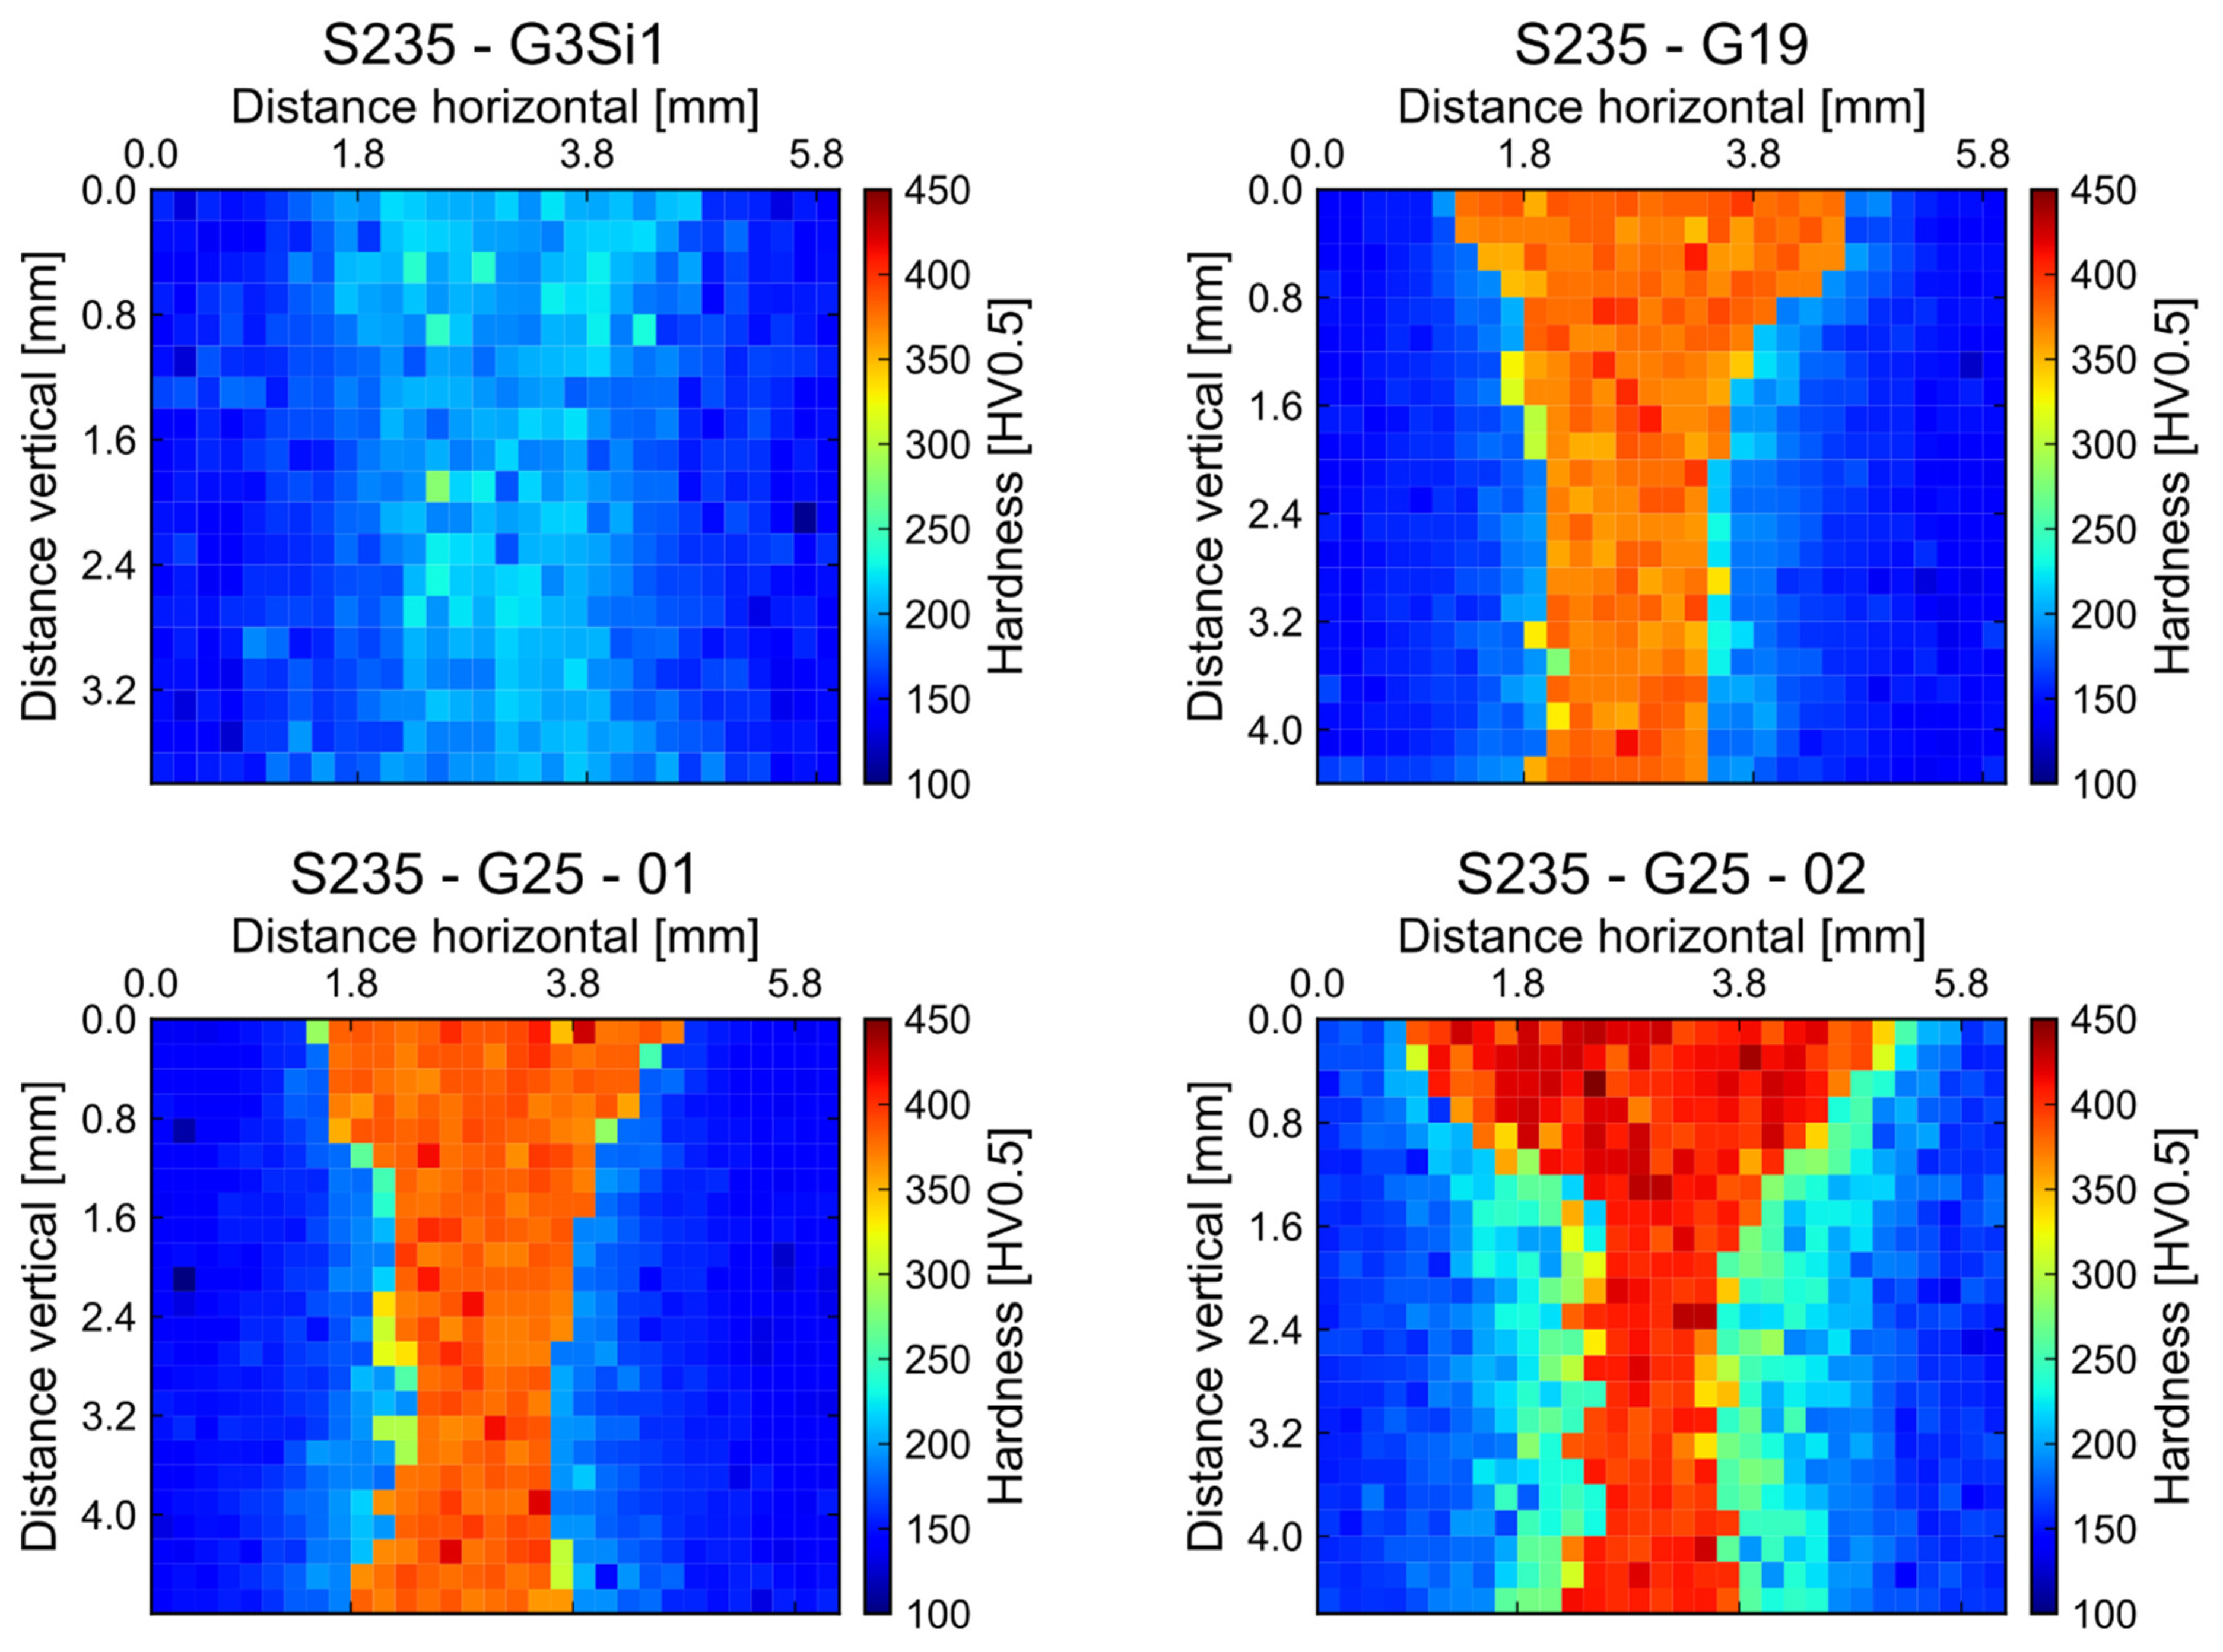
3.2. Vickers Hardness
- In ferritic-pearlitic steels, the strength properties and hardenability are improved to a great extent in the presence of Cr and Ni. Cr increases the strength and refines the grain, while Ni makes the steel tougher [12].
- Compared to ferrite, harder structures such as martensite could be present (the carbon in martensite significantly prevents the migration of dislocation lines, which is why the martensite is harder than ferrite).
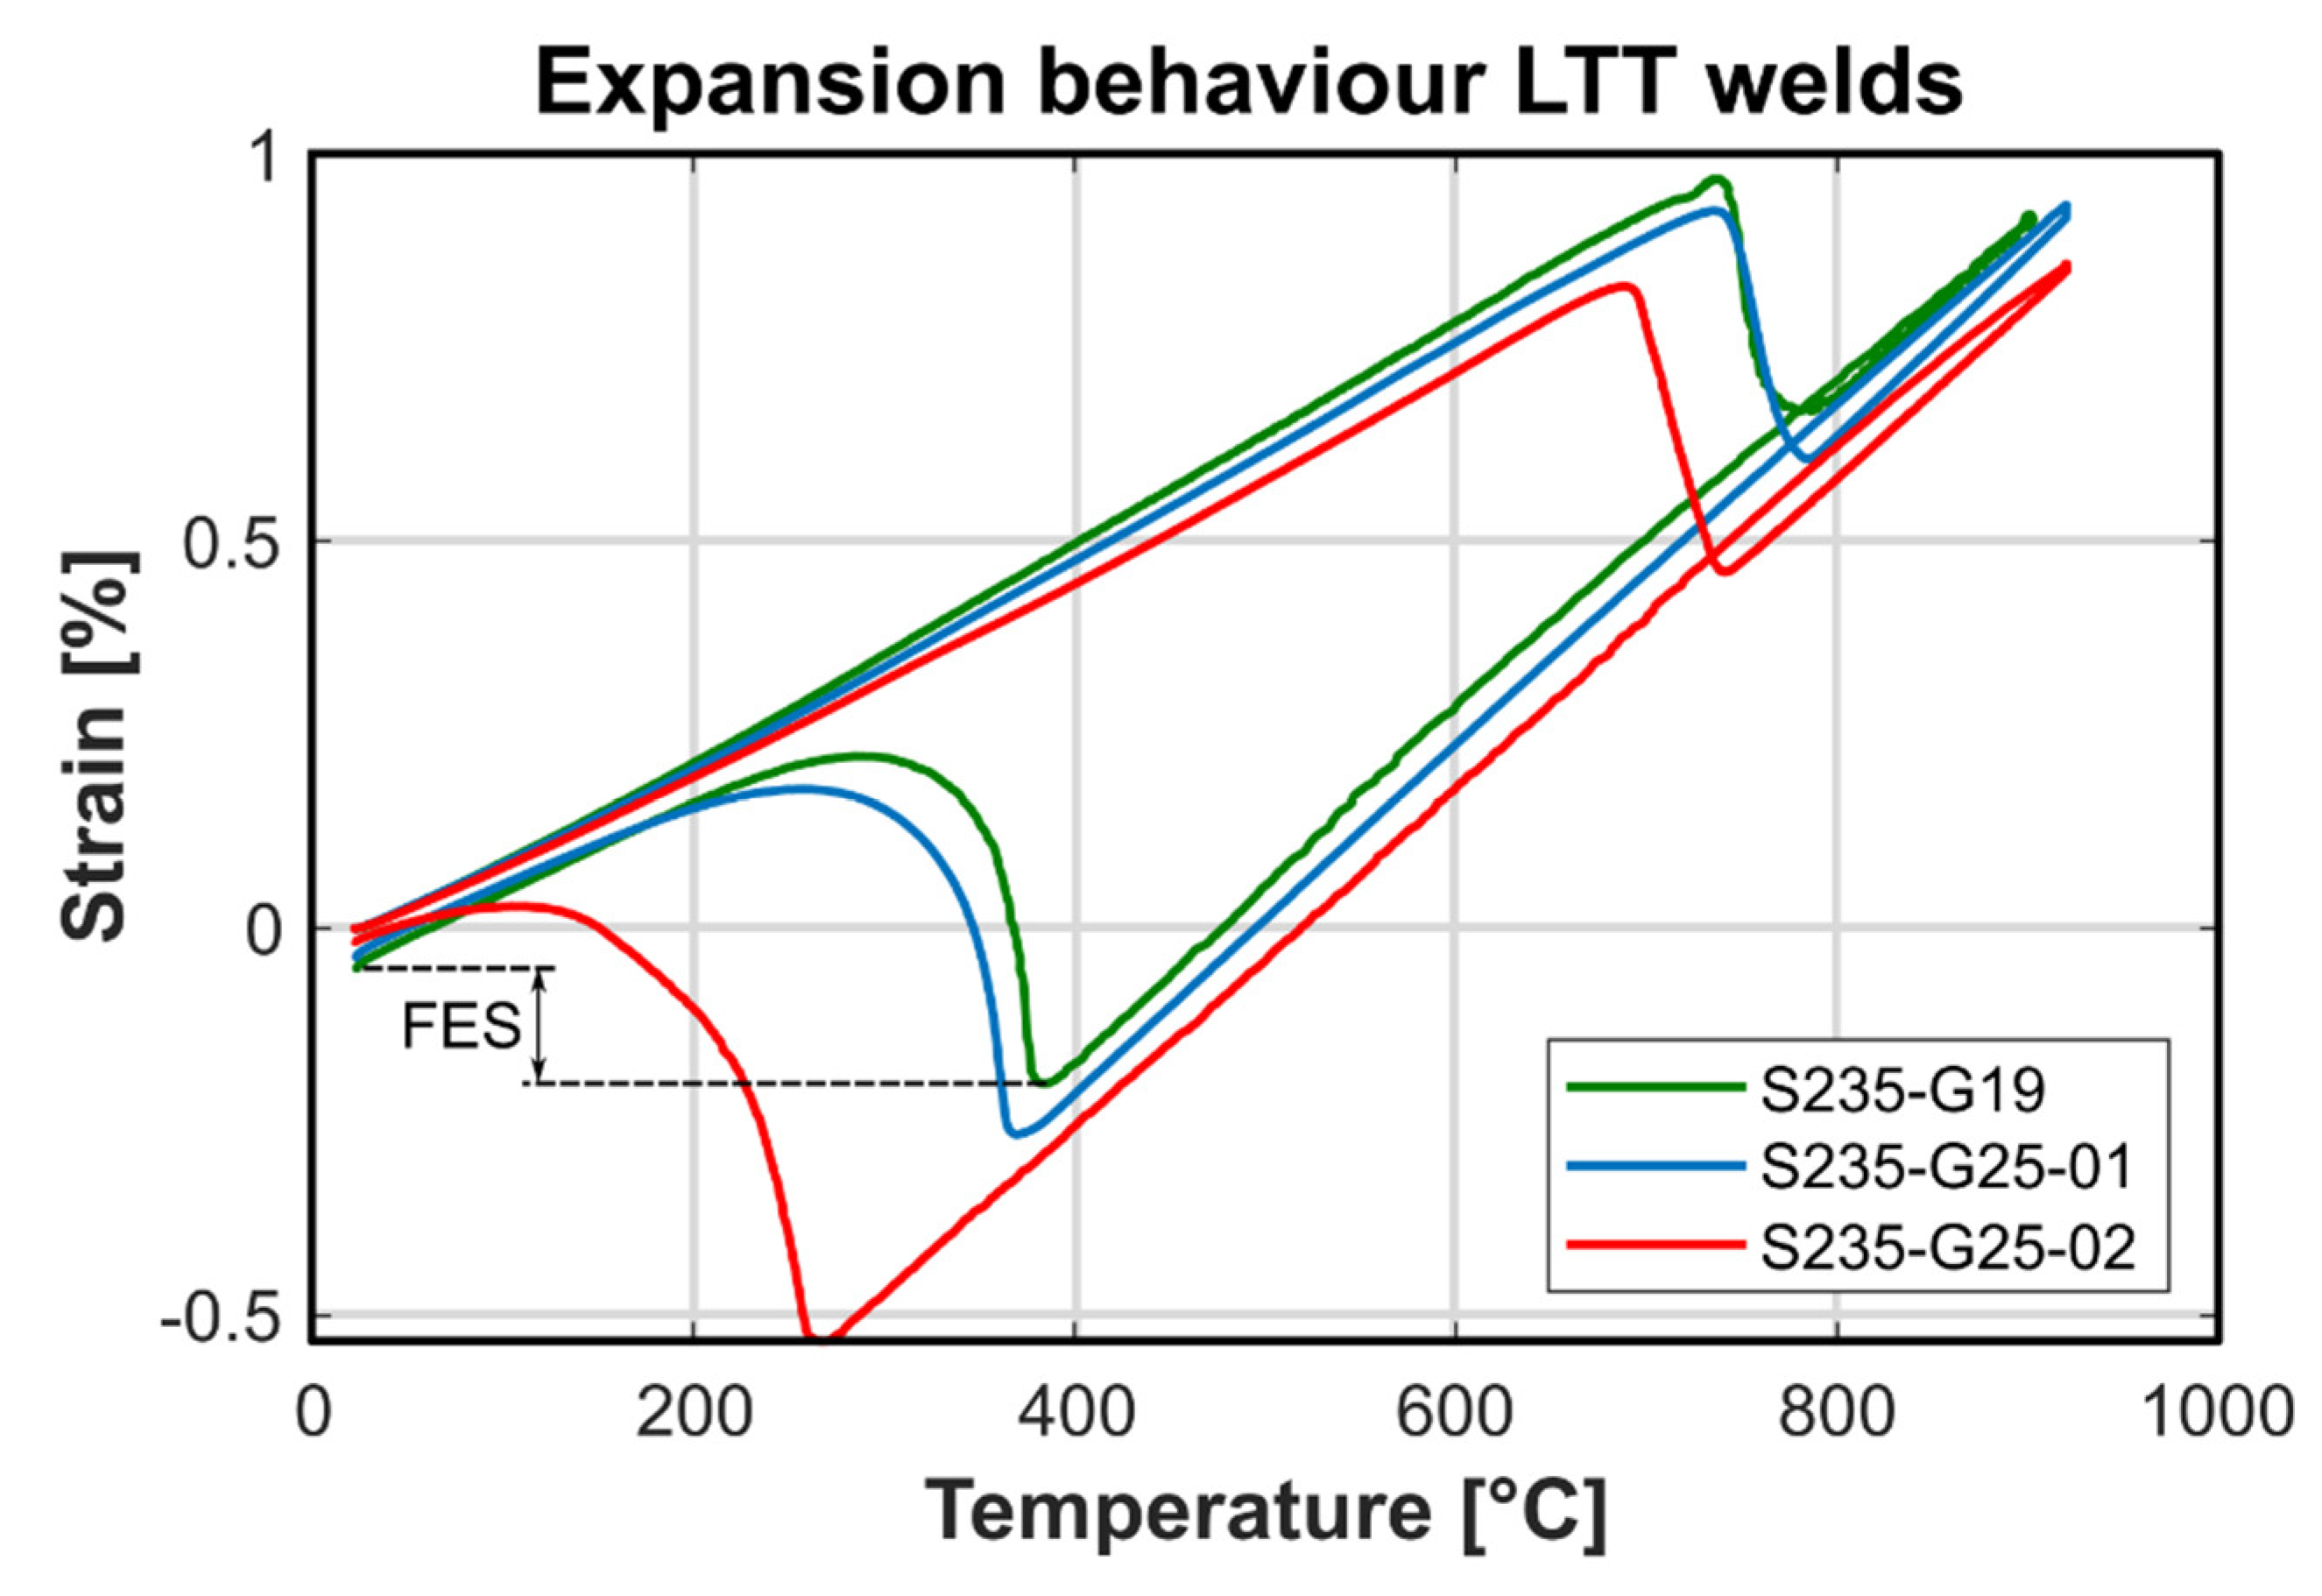
3.3. Dilatometry
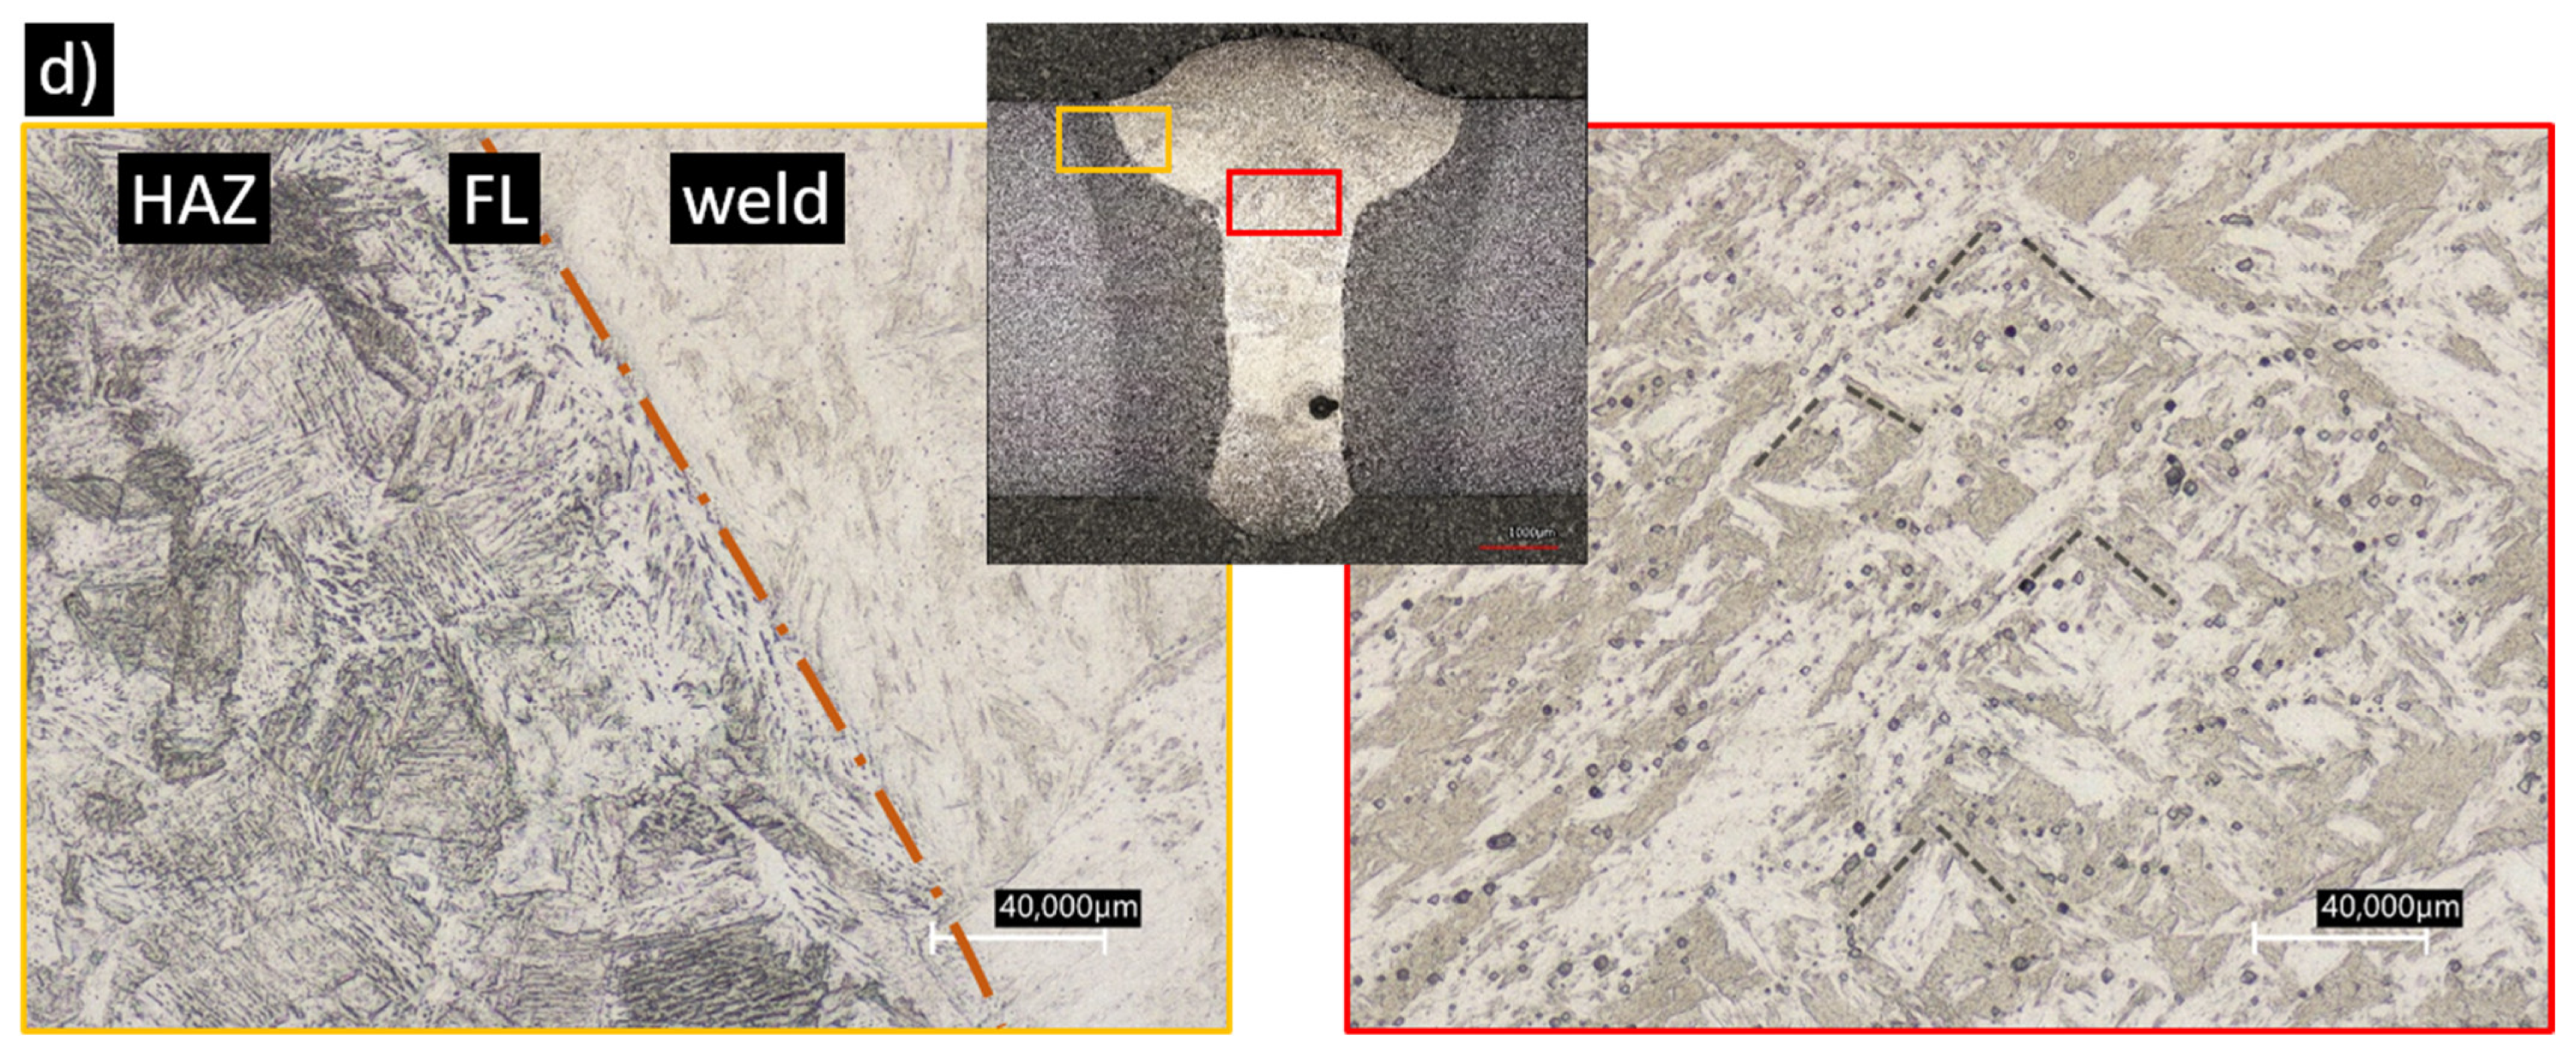
3.4. Microstructure
3.4.1. Nital Etching
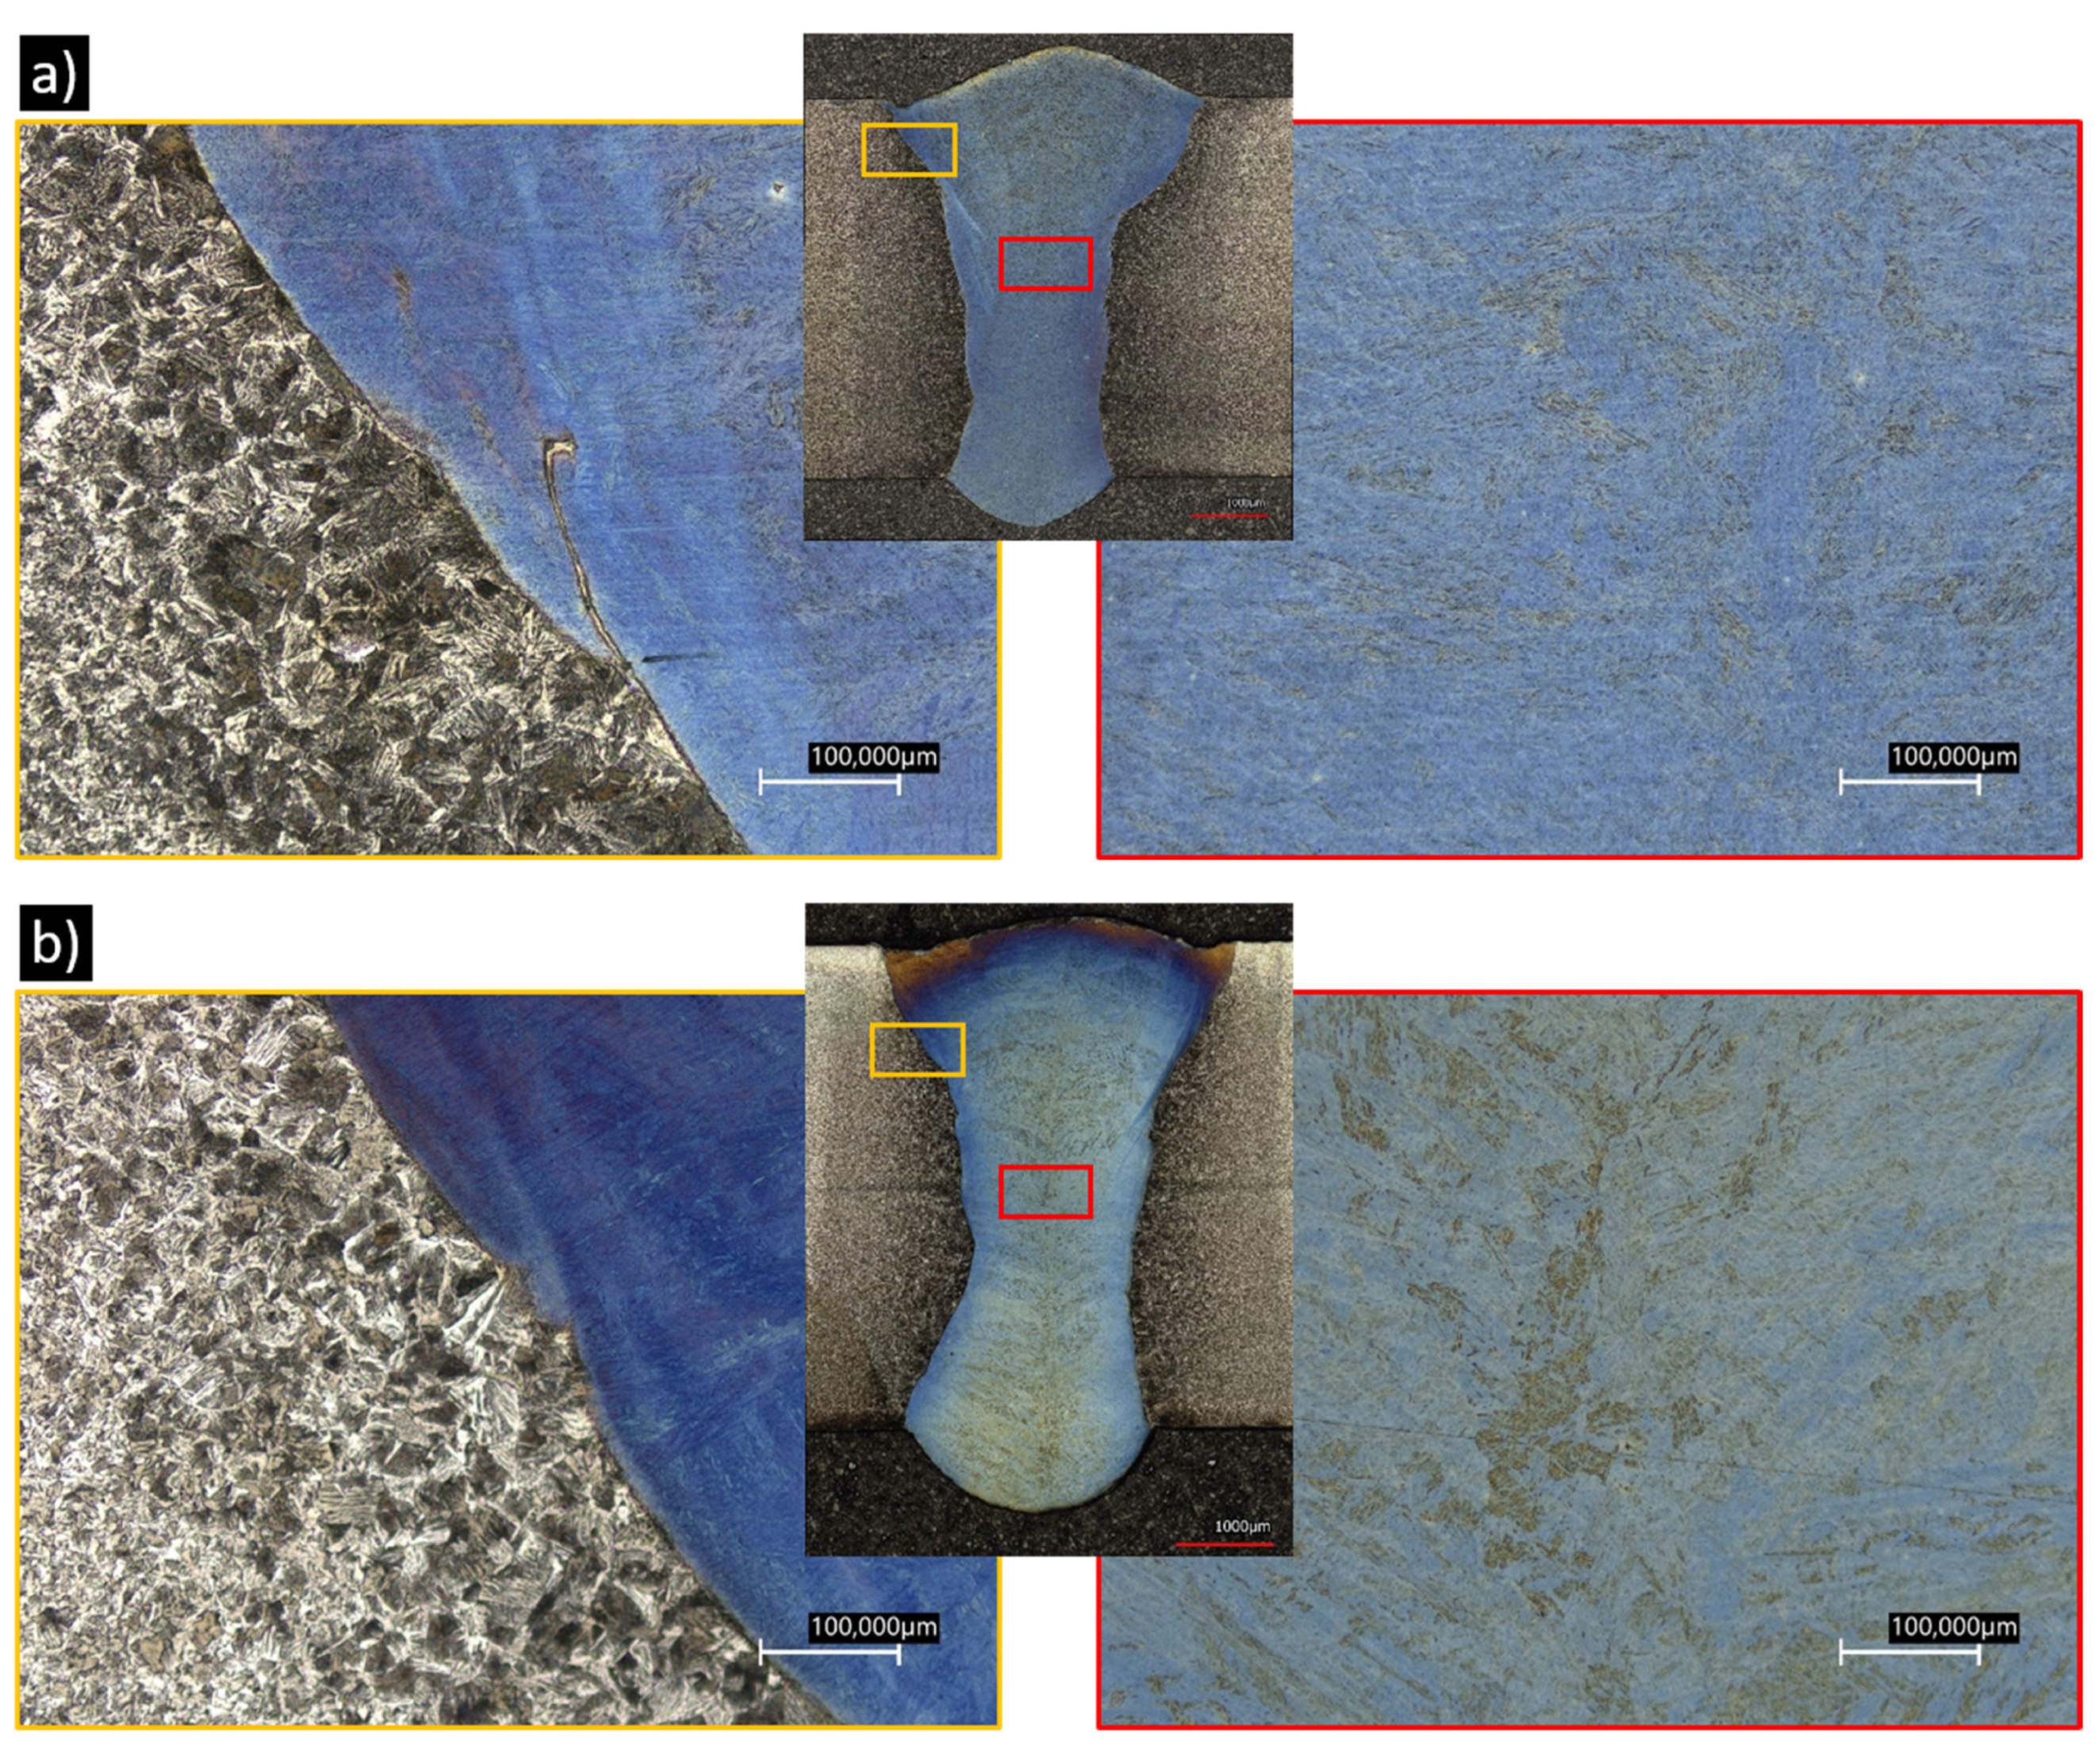
3.4.2. Color Etching
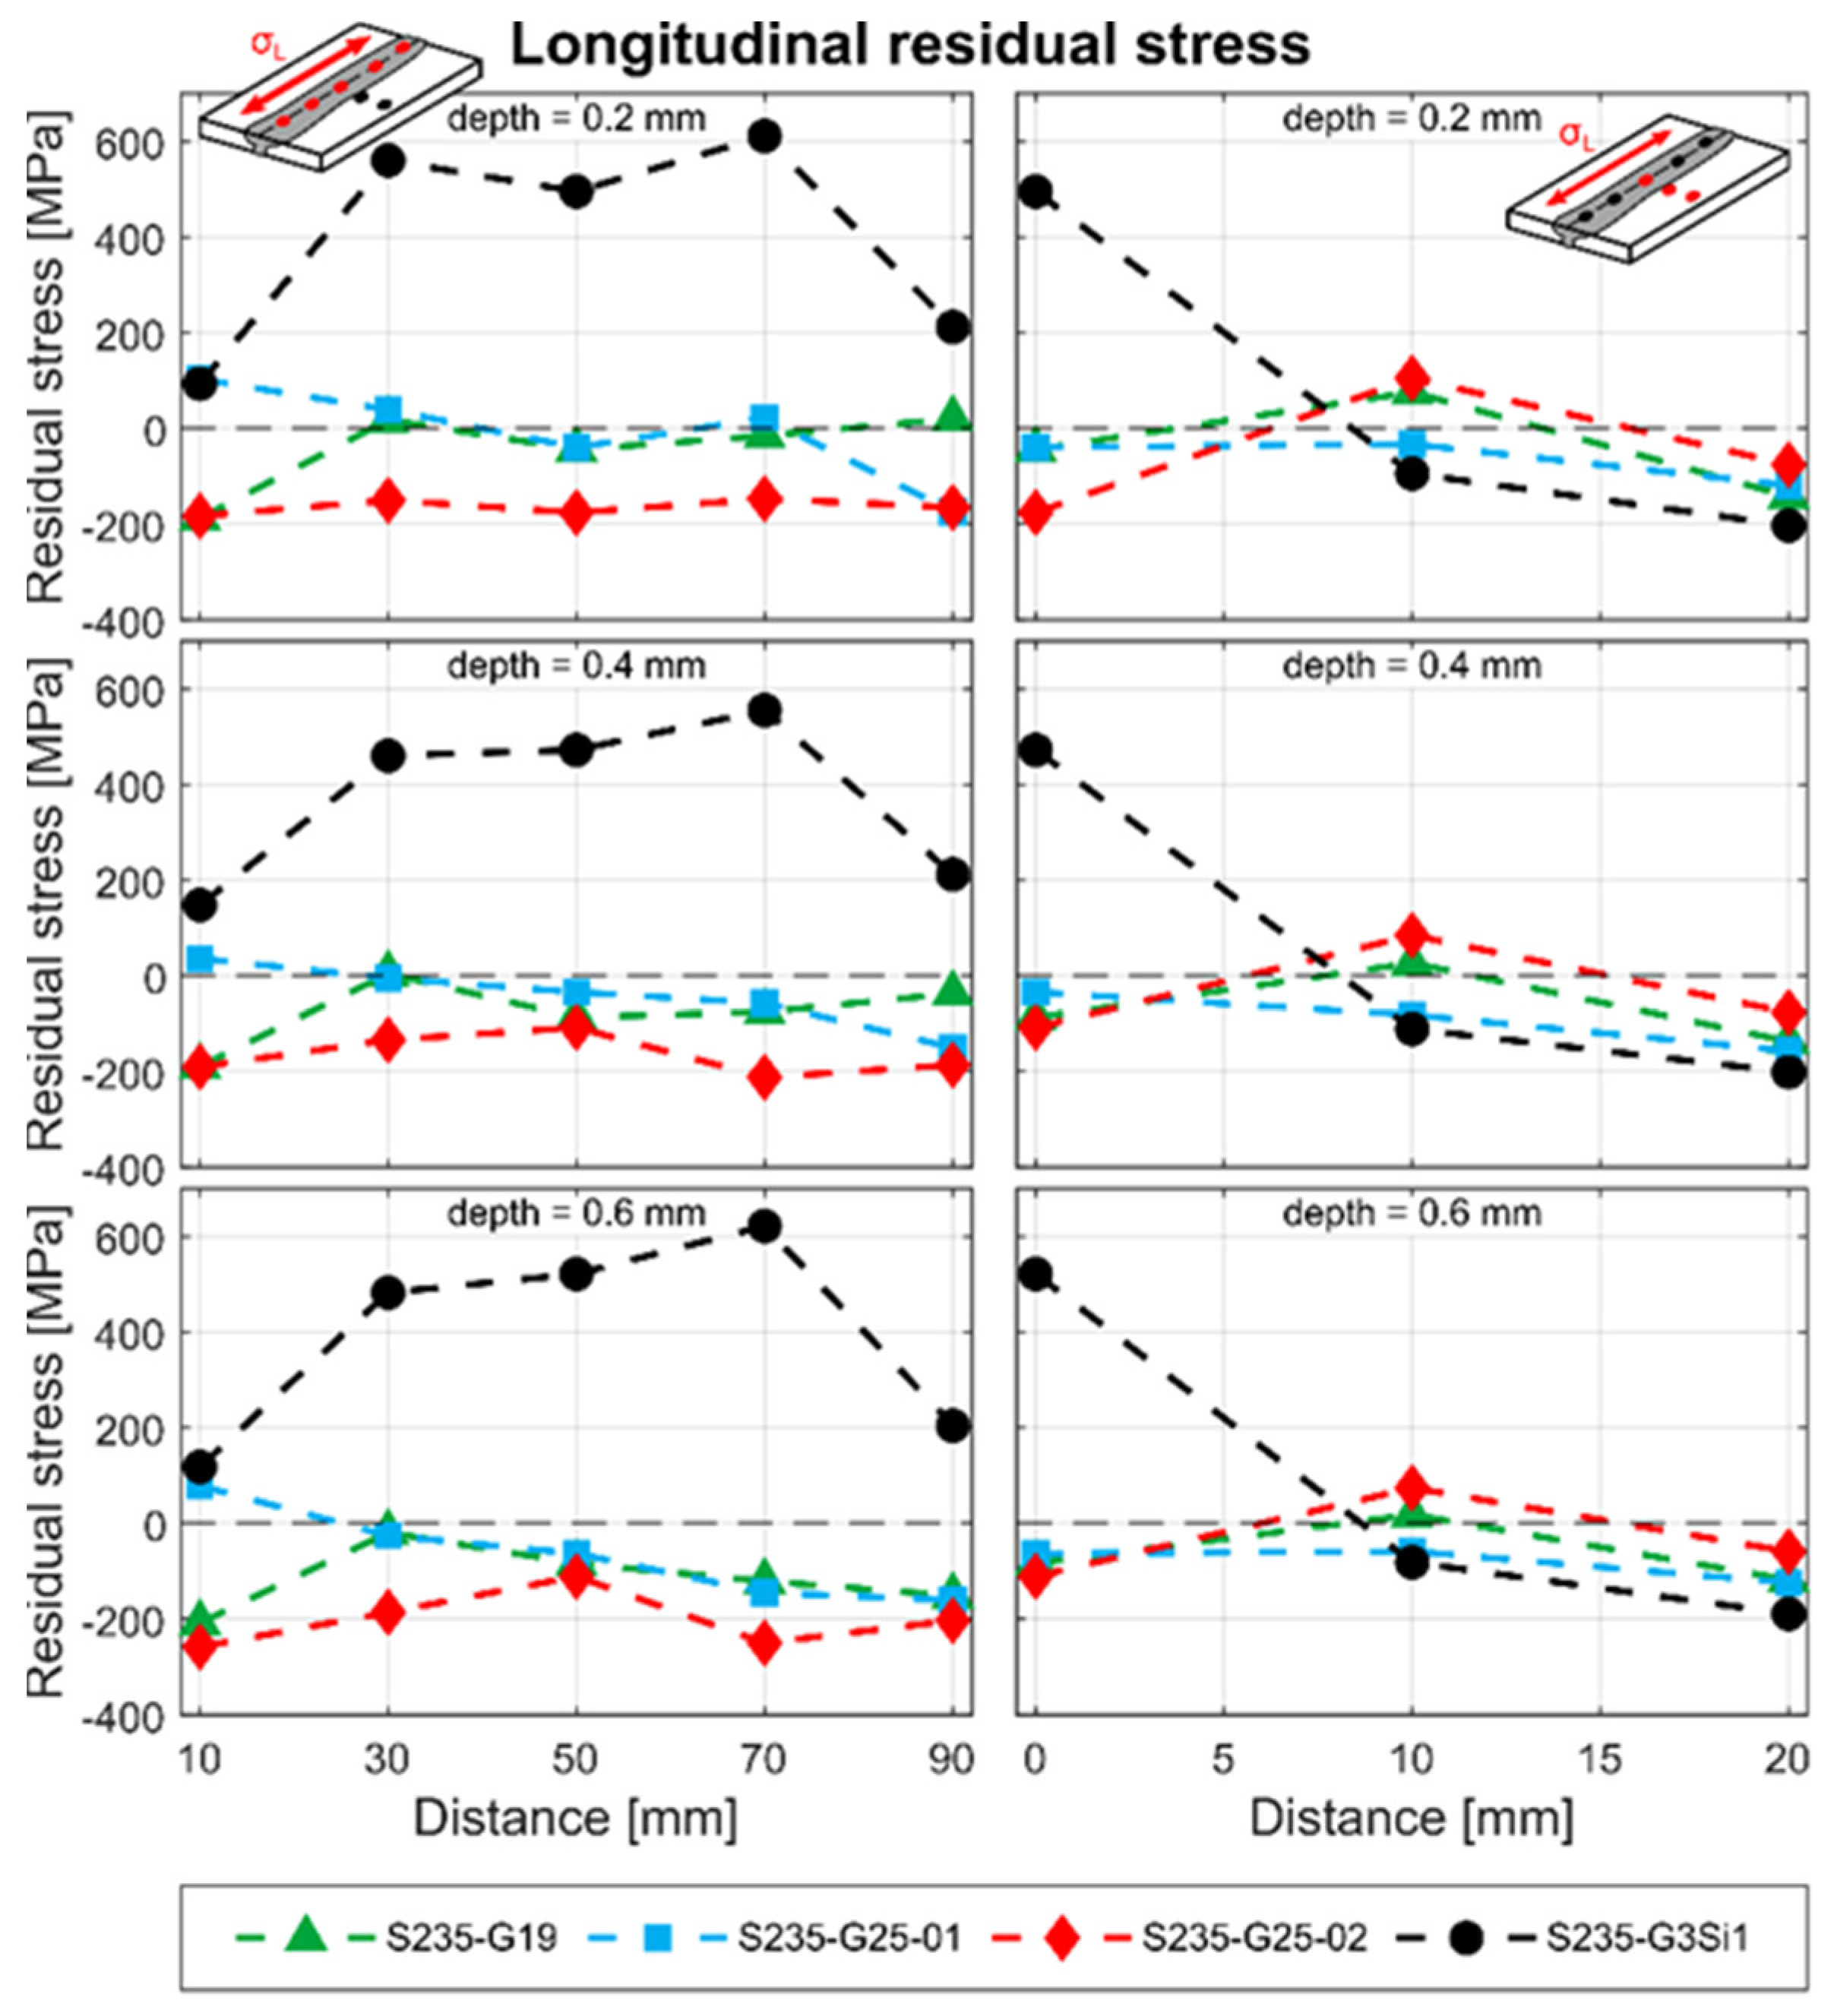
3.5. Residual Stress Measurements
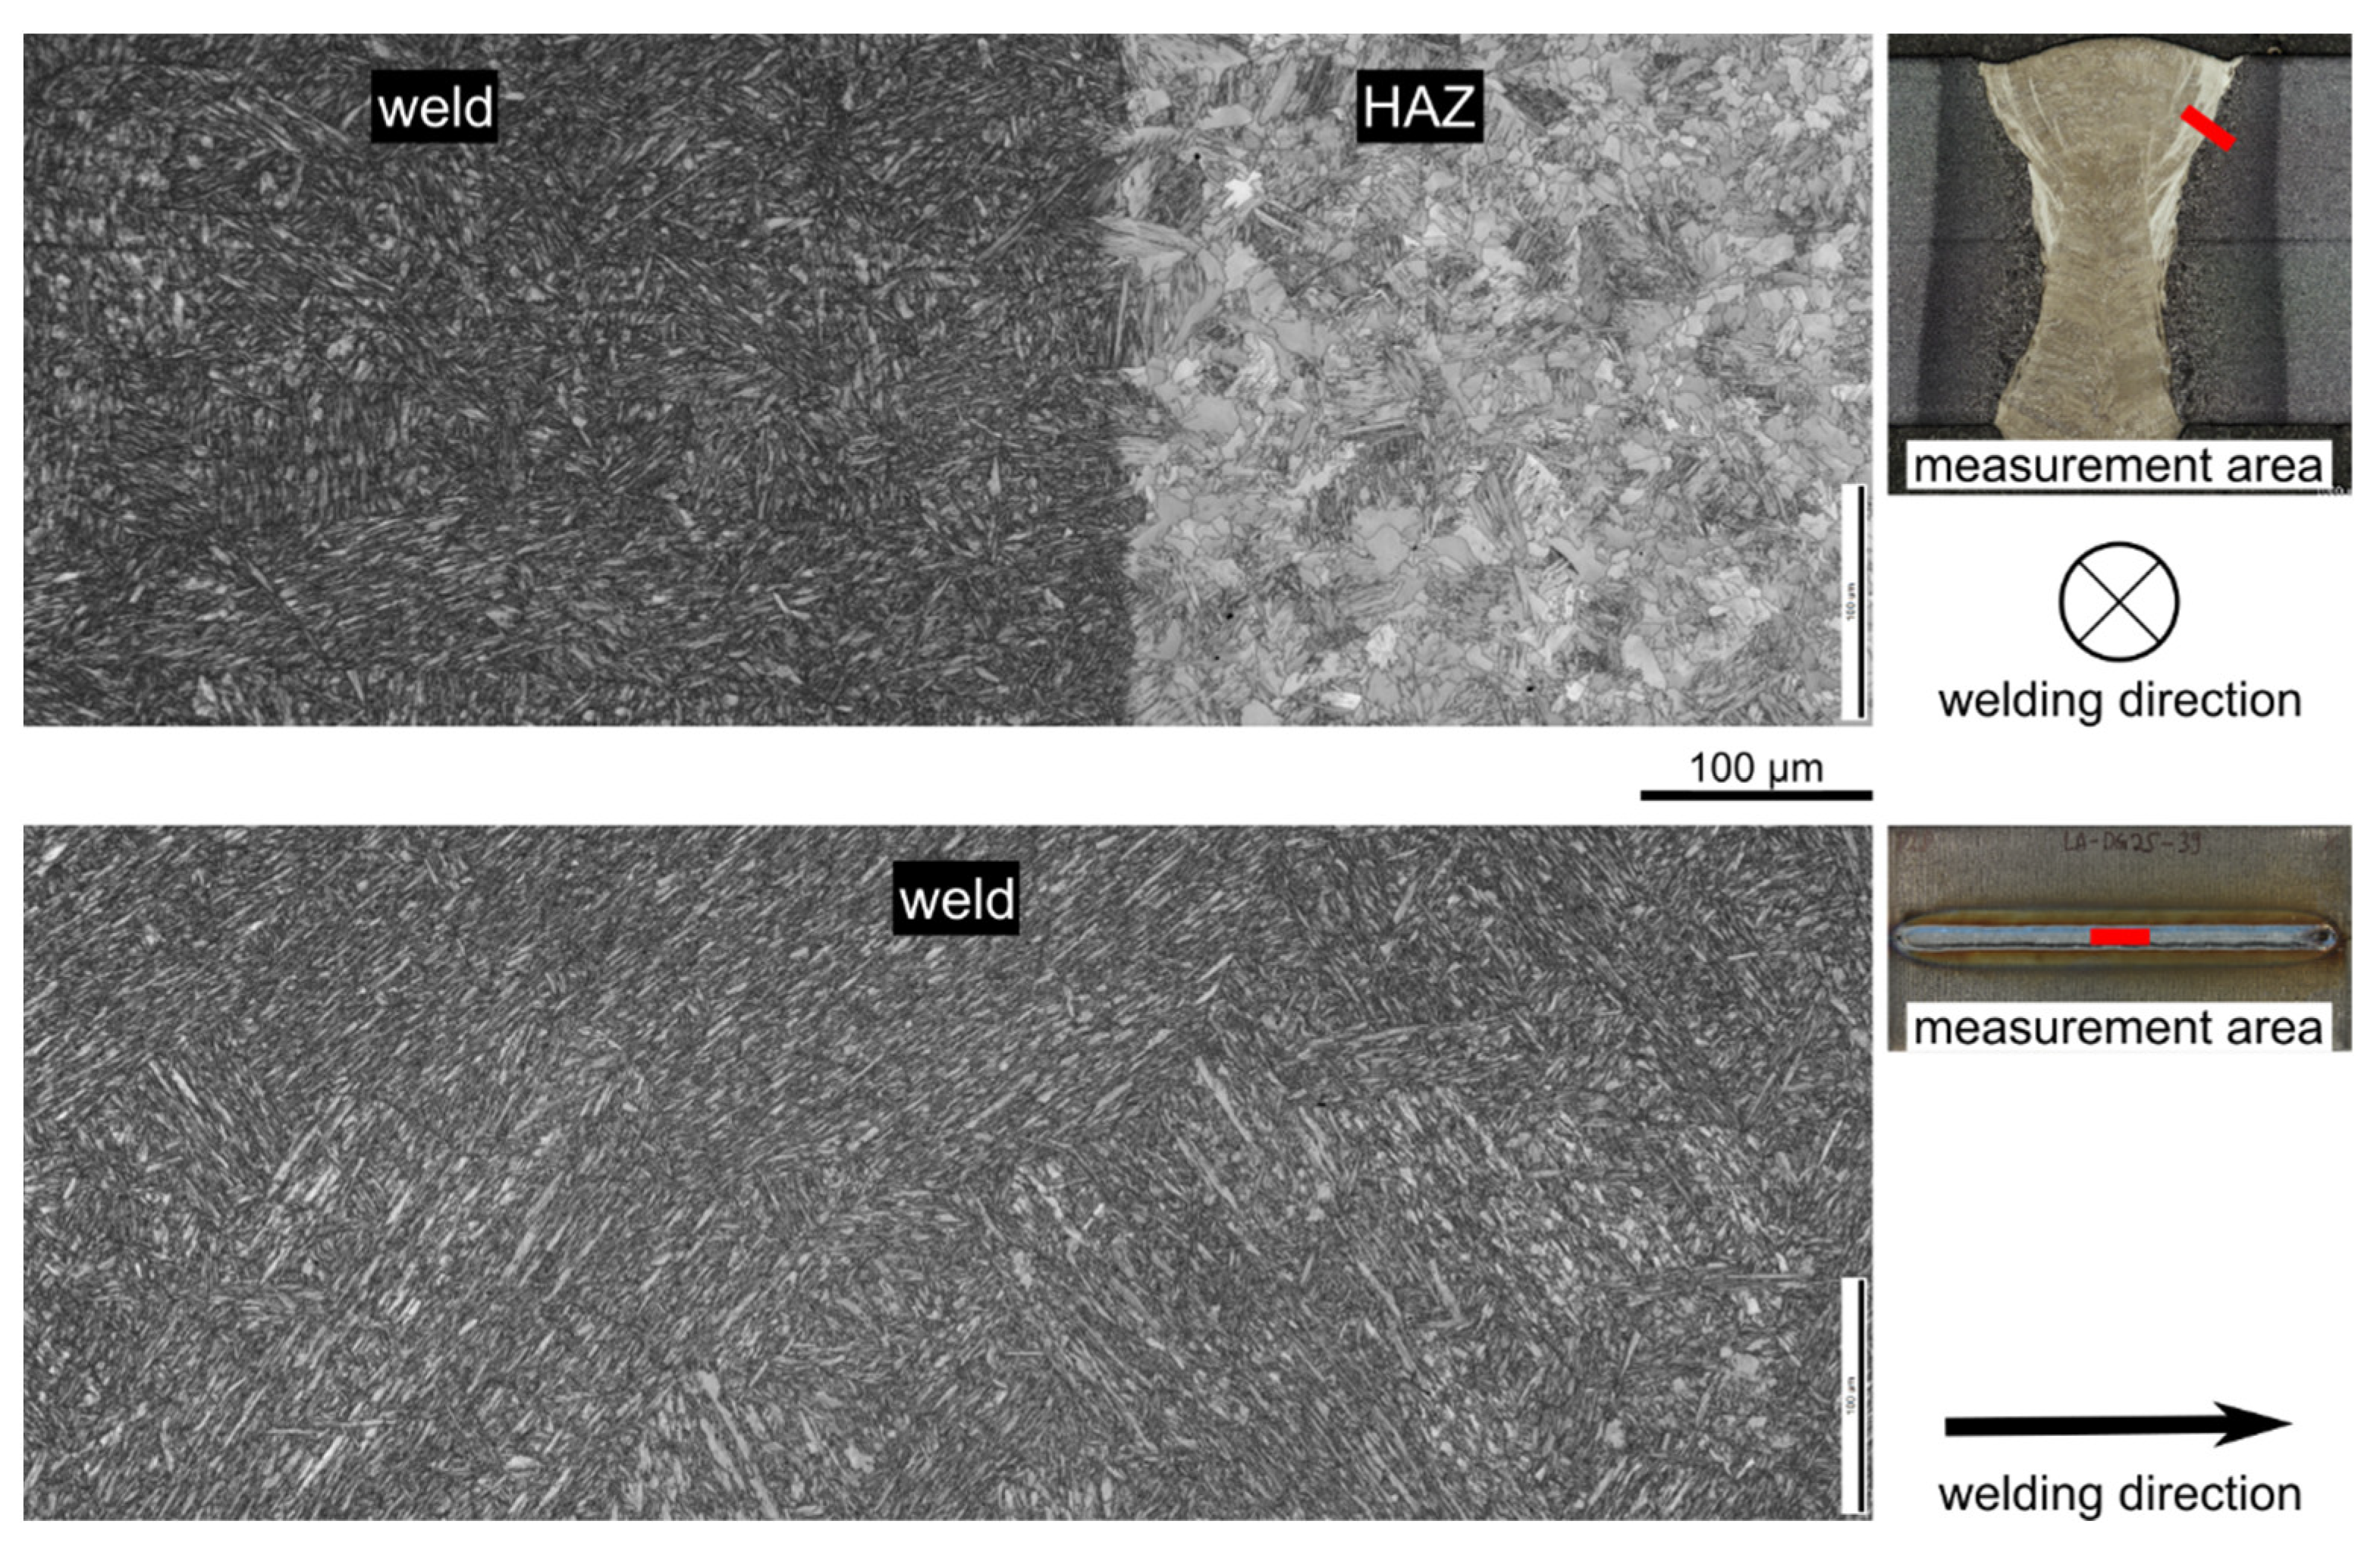
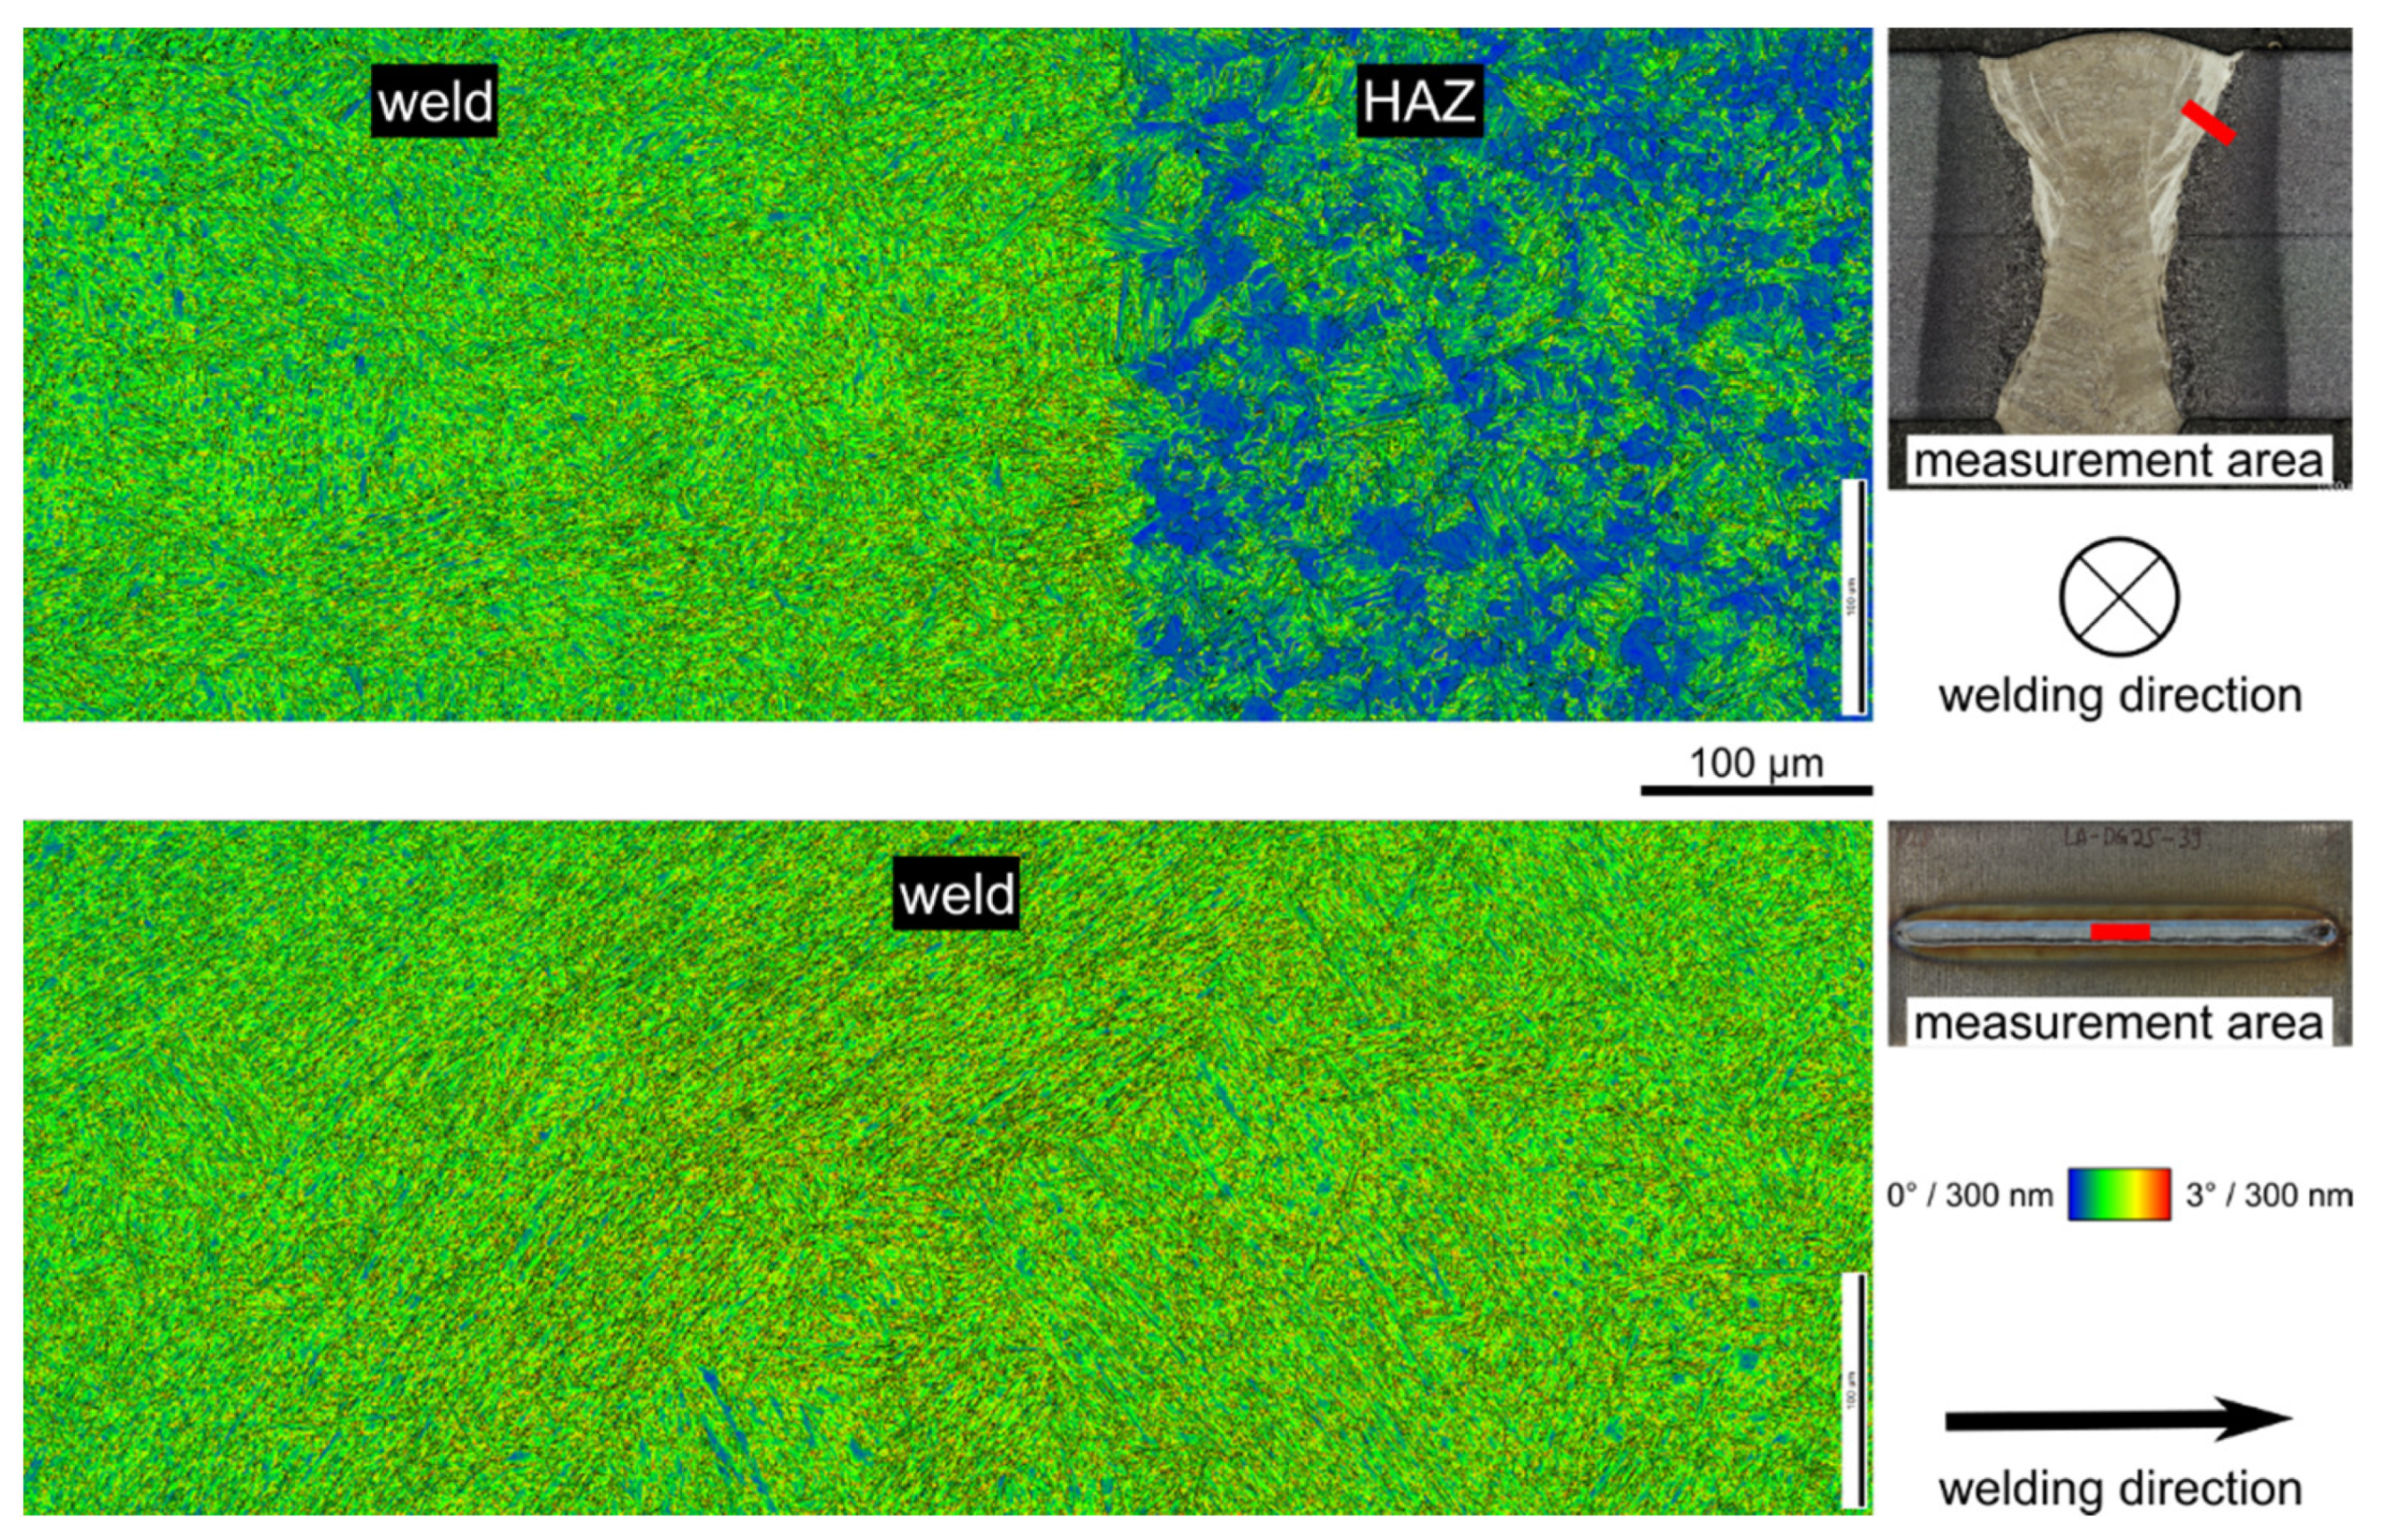
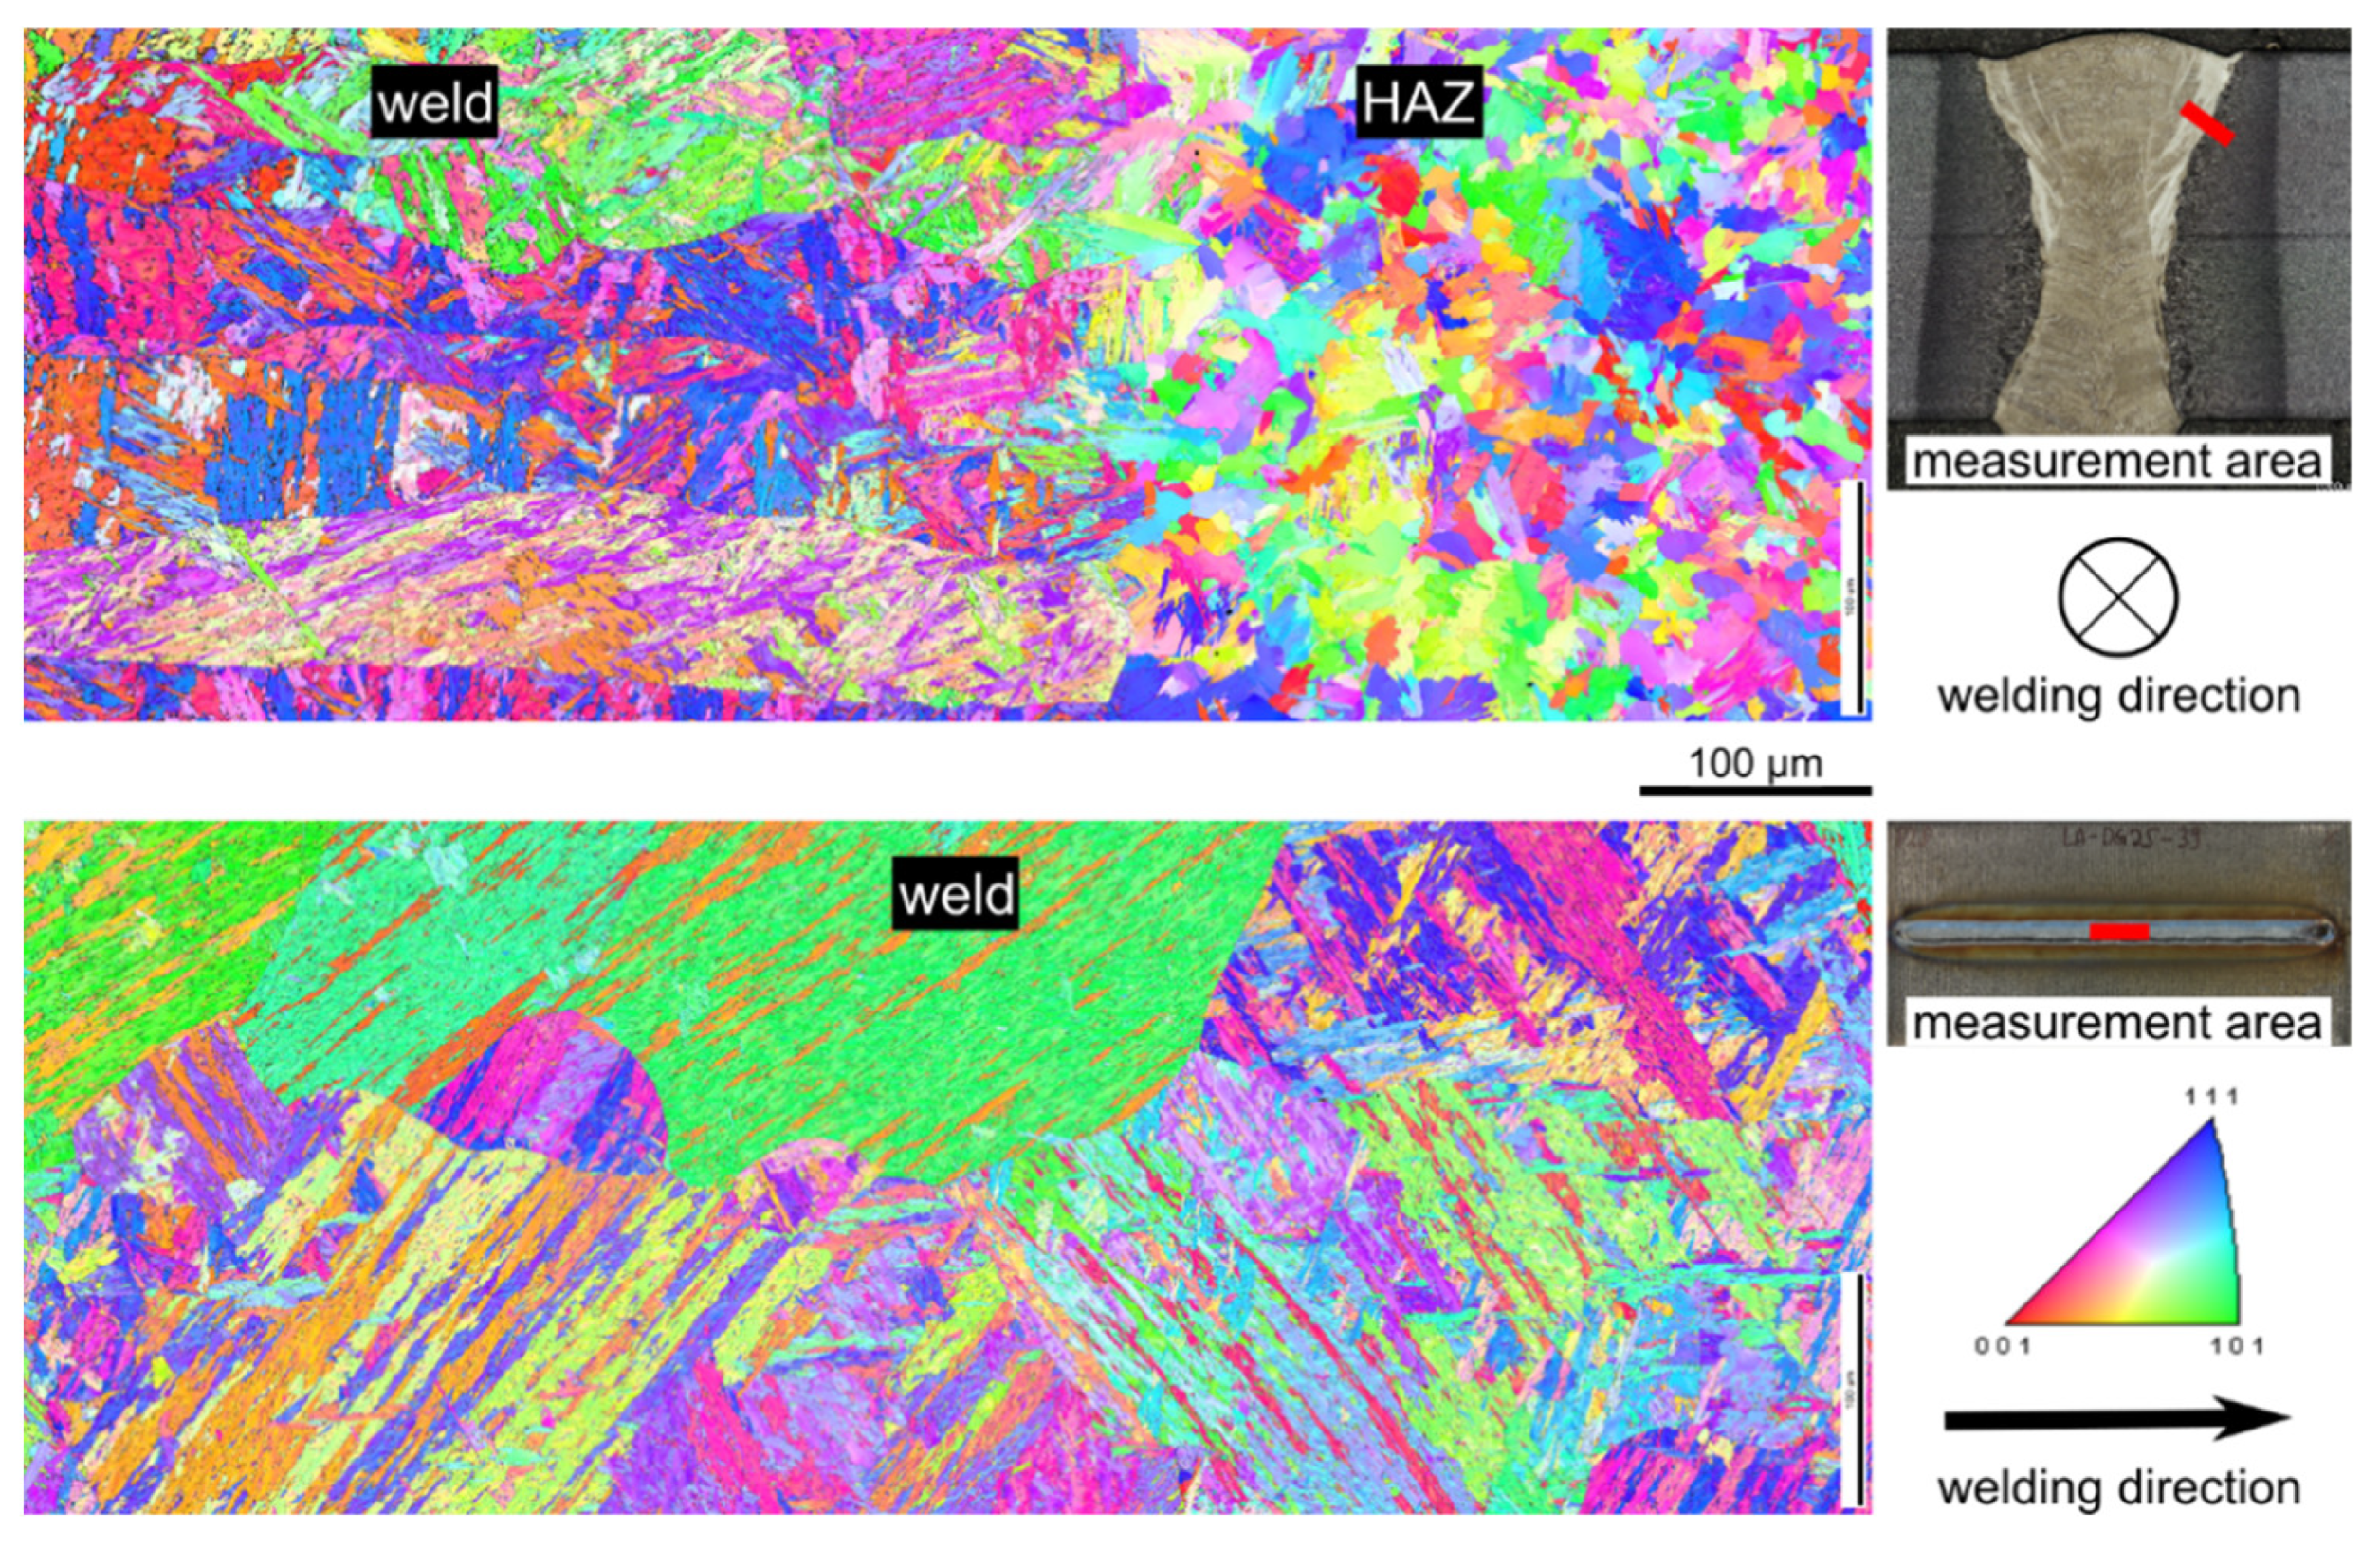
3.6. Electron Backscatter Diffraction
4. Discussion
Author Contributions
Funding
Data Availability Statement
Acknowledgments
Conflicts of Interest
References
- Nitschke-Pagel, T.; Wohlfahrt, H. Residual stresses in welded joints—Sources and consequences. In Materials Science Forum; Trans Tech Publications, Ltd.: Freienbach, Switzerland, 2002; pp. 215–226. [Google Scholar] [CrossRef]
- Maddox, S.J. Fatigue Strength of Welded Structures, 2nd ed.; Abington Publishing: Cambridge, MA, USA, 1991; ISBN 1855730138. [Google Scholar]
- Hensel, J. Mean stress correction in fatigue design under consideration of welding residual stress. Weld World 2020, 64, 535–544. [Google Scholar] [CrossRef] [Green Version]
- Dilthey, U. Schweißtechnische Fertigungsverfahren 2: Verhalten der Werkstoffe beim Schweißen, 3rd ed.; Springer: Berlin/Heidelberg, Germany, 2005; ISBN 3-540-21674-X. [Google Scholar]
- Kromm, A.; Böllinghaus, T. Umwandlungsverhalten und Eigenspannungen beim Schweißen Neuartiger LTT-Zusatzwerkstoffe; Bundesanstalt für Materialforschung und -Prüfung (BAM): Berlin, Germany, 2011; ISBN 978-3-9813853-9-7. [Google Scholar]
- Wohlfahrt, H.; Nitschke-Pagel, T.; Kaßner, M. Schweißbedingte eigenspannungen—Entstehung und erfassung, auswirkung und bewertung. DVS BERICHTE 1997, 187, 6–13. [Google Scholar]
- Ohta, A.; Watanabe, O.; Matsuoka, K.; Siga, C.; Nishijima, S.; Maeda, Y.; Suzuki, N.; Kubo, T. Fatigue strength improvement by using newly developed low transformation temperature welding material. Weld World 1999, 43, 38–42. [Google Scholar]
- Kromm, A.; Dixneit, J.; Kannengiesser, T. Residual stress engineering by low transformation temperature alloys—State of the art and recent developments. Weld World 2014, 58, 729–741. [Google Scholar] [CrossRef]
- Wohlfahrt, H. Die Bedeutung der Austenitumwandlung für die Eigenspannungsentstehung beim Schweißen. Härterei Tech. Mittelungen 1986, 41, 248–257. [Google Scholar] [CrossRef]
- Akyel, F.; Olschok, S.; Reisgen, U. Reduction of distortion by using the low transformation temperature effect for high alloy steels in electron beam welding. Weld World 2020, 65, 23–34. [Google Scholar] [CrossRef]
- Akyel, F.; Gamerdinger, M.; Olschok, S.; Reisgen, U.; Schwedt, A.; Mayer, J. Adjustment of chemical composition with dissimilar filler wire in 1.4301 austenitic stainless steel to influence residual stress in laser beam welds. J. Adv. Join. Process. 2022, 5, 100081. [Google Scholar] [CrossRef]
- Totten, G.E. Steel Heat Treatment Handbook, 2nd ed.; CRC Press: Boca Raton, FL, USA, 2007; ISBN 9780849384523. [Google Scholar]
- A01 Committee. Practice for Quantitative Measurement and Reporting of Hypoeutectoid Carbon and Low-Alloy Steel Phase Transformations; ASTM International: West Conshohocken, PA, USA, 2018. [Google Scholar]
- Hosseini, S.A.; Gheisari, K.; Moshayedi, H.; Warchomicka, F.; Enzinger, N. Basic alloy development of low-transformation-temperature fillers for AISI 410 martensitic stainless steel. Sci. Technol. Weld. Join. 2020, 25, 243–250. [Google Scholar] [CrossRef]
- Wu, S.; Wang, D.; Zhang, Z.; Li, C.; Liu, X.; Meng, X.; Feng, Z.; Di, X. Mechanical properties of low-transformation-temperature weld metals after low-temperature postweld heat treatment. Sci. Technol. Weld. Join. 2019, 24, 112–120. [Google Scholar] [CrossRef]
- Ryde, L. Application of EBSD to analysis of microstructures in commercial steels. Mater. Sci. Technol. 2006, 22, 1297–1306. [Google Scholar] [CrossRef]
- Zaefferer, S.; Romano, P.; Friedel, F. EBSD as a tool to identify and quantify bainite and ferrite in low-alloyed Al-TRIP steels. J. Microsc. 2008, 230, 499–508. [Google Scholar] [CrossRef] [PubMed]
- Pinard, P.T.; Schwedt, A.; Ramazani, A.; Prahl, U.; Richter, S. Characterization of dual-phase steel microstructure by combined submicrometer EBSD and EPMA carbon measurements. Microsc. Microanal. 2013, 19, 996–1006. [Google Scholar] [CrossRef] [PubMed]


| Material | Chemical Composition 1 [mass %] | ||||||||
|---|---|---|---|---|---|---|---|---|---|
| C | Si | Mn | Cr | Mo | Ni | Fe | Creq 2 | Nieq 3 | |
| S235JR | 0.13 | 0.01 | 0.78 | 0.02 | 0.001 | 0.007 | 98.8 | 0.041 | 4.24 |
| G19 9 | 0.02 | 0.76 | 1.61 | 19.61 | 0.17 | 9.68 | 67.6 | 20.93 | 10.91 |
| G25 20 | 0.11 | 0.55 | 1.32 | 24.96 | 0.12 | 20.89 | 51.6 | 25.91 | 24.89 |
| G3Si1 | 0.07 | 0.86 | 1.44 | 0.045 | 0.008 | 0.019 | 97.3 | 1.36 | 2.80 |
| Weld Parameter | Oscillation Parameter | Seam Preparation | ||||||
|---|---|---|---|---|---|---|---|---|
| Name | Power p [kW] | Weld Speed vw [m/min] | Wire Speed vd [m/min] | Frequency [Hz] | Figure [–] | Width [mm] | Width A [mm] | Depth B [mm} |
| S235-G3Si1 | 5.0 | 0.8 | 1.5 | 100 | sine | 1.7 | 1.0 | 0.8 |
| S235-G19 | 5.1 | 0.8 | 2.47 | 100 | sine | 1.7 | 1.0 | 0.8 |
| S235-G25-01 | 5.1 | 0.8 | 1.9 | 100 | sine | 1.7 | 1.0 | 0.8 |
| S235-G25-02 | 5.3 | 0.8 | 3.45 | 180 | sine | 1.9 | 1.0 | 1.5 |
| Alloying Elements | S235-G19 | S235-G25-01 | S235-G25-02 | ||||
|---|---|---|---|---|---|---|---|
| Mean | SD | Mean | SD | Mean | SD | ||
| C 1 | [mass %] | 0.11 | - | 0.84 | - | 0.72 | - |
| Cr | [mass %] | 3.73 | 0.62 | 3.89 | 0.64 | 6.88 | 0.84 |
| Ni | [mass %] | 1.83 | 0.35 | 3.12 | 0.57 | 5.10 | 0.64 |
| Mo | [mass %] | 0.115 | 0.076 | 0.102 | 0.082 | 0.106 | 0.075 |
| Mn | [mass %] | 0.93 | 0.12 | 0.89 | 0.16 | 1.11 | 0.16 |
| Creq 2 | [mass %] | 4.07 | - | 4.13 | - | 7.22 | - |
| Nieq 2 | [mass %] | 5.57 | - | 7.37 | - | 9.40 | - |
| S235-G19 | S235-G25-01 | S235-G25-02 | ||
|---|---|---|---|---|
| Cr/Ni | [mass %] | 3.73/1.83 | 3.89/3.12 | 6.88/5.10 |
| Ac3 | [°C] | 825.23 ± 23.25 | 788.04 ± 5.53 | 746.28 ± 5.8 |
| Ac1 | [°C] | 746.32 ± 10.1 | 702.69 ± 8.72 | 654.13 ± 14.32 |
| Ms | [°C] | 414.83 ± 6.61 | 388.25 ± 13.08 | 282.48 10.49 |
| Mf | [°C] | 188.34 ± 7.94 | 168.33 ± 7.21 | 77.95 ± 5.03 |
| FES | [%] | 0.104 ± 0.01 | 0.201 ± 0.026 | 0.485 ± 0.047 |
| dilatation austenite | [%] | 0.268 ± 0.036 | 0.279 ± 0.011 | 0.288 ± 0.037 |
| dilatation martensite | [%] | 0.302 ± 0.013 | 0.361 ± 0.03 | 0.525 ± 0.048 |
Publisher’s Note: MDPI stays neutral with regard to jurisdictional claims in published maps and institutional affiliations. |
© 2022 by the authors. Licensee MDPI, Basel, Switzerland. This article is an open access article distributed under the terms and conditions of the Creative Commons Attribution (CC BY) license (https://creativecommons.org/licenses/by/4.0/).
Share and Cite
Akyel, F.; Gamerdinger, M.; Olschok, S.; Reisgen, U.; Schwedt, A.; Mayer, J. Residual Stress Reduction with the LTT Effect in Low Carbon Manganese-Steel through Chemical Composition Manipulation Using Dissimilar Filler Material in Laser Beam Welding. Metals 2022, 12, 911. https://doi.org/10.3390/met12060911
Akyel F, Gamerdinger M, Olschok S, Reisgen U, Schwedt A, Mayer J. Residual Stress Reduction with the LTT Effect in Low Carbon Manganese-Steel through Chemical Composition Manipulation Using Dissimilar Filler Material in Laser Beam Welding. Metals. 2022; 12(6):911. https://doi.org/10.3390/met12060911
Chicago/Turabian StyleAkyel, Fatma, Maximilian Gamerdinger, Simon Olschok, Uwe Reisgen, Alexander Schwedt, and Joachim Mayer. 2022. "Residual Stress Reduction with the LTT Effect in Low Carbon Manganese-Steel through Chemical Composition Manipulation Using Dissimilar Filler Material in Laser Beam Welding" Metals 12, no. 6: 911. https://doi.org/10.3390/met12060911