Article

Cross-Scale Simulation Research on the Macro/Microstructure of TC4 Alloy Wire Laser Additive Manufacturing

1
Henan Key Laboratory of Intelligent Manufacturing of Mechanical Equipment, Zhengzhou University of Light Industry, Zhengzhou 450002, China
2
Innovation Academy of Intelligent Equipment (Ningbo) Co., Ltd., Ningbo 315700, China
3
The College of Materials Science and Technology, Zhengzhou University, Zhengzhou 450066, China
4
National Engineering Research Center of Light Alloy Net Forming and State Key Laboratory of Metal Matrix Composite, Shanghai Jiao Tong University, Shanghai 200240, China
*
Author to whom correspondence should be addressed.
Metals 2022, 12(6), 934; https://doi.org/10.3390/met12060934
Submission received: 25 April 2022 / Revised: 22 May 2022 / Accepted: 23 May 2022 / Published: 28 May 2022

Abstract

:
A cross-scale model of macro-micro coupling is established for the wire laser additive manufacturing process of the TC4 titanium alloy. The model reproduces the dynamic evolution process of the molten pool shape, reveals the temperature change law in the molten pool, and simulates the microstructure and morphology of different regions of the molten pool. Finally, the model is used to quantitatively analyze the effects of process parameters (laser power, scanning speed) on the growth morphology of dendrites during solidification. The research shows that with the increase in laser power and the decrease in scanning speed, the peak temperature of the molten pool increases rapidly, and the size of the molten pool increases gradually. When the laser scanning speed is greater than 5 mm/s, the molten pool length decreases significantly. After solidification, an asymmetrically distributed equiaxed grain structure is formed at the upper part of the molten pool, the bottom of the molten pool is made up of slender columnar crystals, and the columnar-to-equiaxed transition (CET) occurs in the middle of the molten pool. With the decrease in laser power and the increase in scanning speed, the growth rate of dendrites becomes faster, the arm spacing and the overall morphology of dendrites become smaller, and the arrangement of columnar crystals have a tighter microstructure.

1. Introduction

The TC4 titanium alloy (Ti-6Al-4V (wt.%)) has the advantages of low density, high specific strength, corrosion resistance, etc. It is called “marine metal” or “space metal”, which accounts for more than 50% of the total output of various commercial titanium alloys in the world, and has broad application prospects [1,2]. The strength of TC4 is 1.012 GPa and the specific strength is 23.5, while the specific strength of alloy steel is less than 18 [3]. However, the TC4 alloy has low thermal conductivity, only 1/5 of that of iron, and possesses low plasticity but high hardness. It is difficult to prepare complex parts with an integrated structure using the traditional casting–forging–machining method, which seriously limits its application in aerospace, automotive, and biomedical fields [4,5]. Recent studies have found that additive manufacturing (AM) technology is widely used in TC4 alloy processing and manufacturing because of its special forming principle, which can produce fully dense and near-net-shaped complex metal parts [6,7,8,9,10,11]. Additive manufacturing offers potential solutions when conventional manufacturing reaches its technological limits. These include a high degree of design freedom, lightweight design, functional integration, and rapid prototyping [12].
Wire laser additive manufacturing (WLAM) is an additive manufacturing process that uses laser as a heat source and builds metal solid components layer by layer using material accumulation. It not only has the advantages of high efficiency, low cost, and short production cycles, but also can produce large-size complex components [13,14,15,16]. Due to the high energy density of the laser, many dynamic and transient metallurgical phenomena are involved in the processing process, including rapid melting, rapid cooling, and non-equilibrium rapid solidification [17,18,19,20]. These phenomena control the growth morphology, solute segregation, and phase transformation process of the solidified alloy, and ultimately affect the mechanical properties of the parts [21,22]. Therefore, a better understanding of the solidification behavior of the molten pool and determining the dendrite growth process are crucial for the control of the macro/microstructure of the workpiece. At present, many researches have focused on exploring the relationship between the process parameters of additive manufacturing and product performance [23,24,25,26,27,28,29], which can provide ideas on future directions for optimizing the process and improving product performance to a certain extent. For the complex physical and metallurgical phenomena involved in the solidification process of the molten pool, traditional methods, such as experimental observation, recording, and analysis, not only require a lot of manpower, material resources, and time investment, as it is difficult to observe the dynamic changes in the solidification structure of the molten pool during processing, but these deficiencies can also be well compensated by numerical simulation [30,31].
With the integration development of additive manufacturing technology and numerical simulation technology, more and more researchers have begun to study and solve problems in related fields through numerical simulation technology [32,33,34,35]. In the laser cutting direction, Ammar H. Elsheikh et al. studied an experimental investigation on continuous CO2 laser cutting of polymethylmethacrylate (PMMA) sheet. The effects of four process factors on five process responses were investigated using different experiments and finite element temperature simulations [36,37,38,39,40]. In additive manufacturing, Zhou et al. [41] not only prepared the laminated-graded Ag-multilayer graphene–TC4 alloy self-lubricating composites (GTMAC) with better friction and wear properties using laser additive manufacturing, but also investigated the equivalent stress distributions on the friction surfaces using the finite element method. Sara Giganto et al. [42] designed and manufactured several benchmark artefacts to evaluate the accuracy of the selective laser melting (SLM) manufacturing process using finite element simulations. Regarding geometrical accuracy, it was recommended to avoid surfaces with 45° negative slopes or higher. On the other hand, the material shrinkage effect could be compensated by resizing features according to X and Y direction. Zhou et al. [43] aimed to uncover the multiscale relations among the geometry, surface finish, microstructure, and fatigue properties of curved-surface AlSi10Mg parts fabricated by powder bed fusion (PBF) additive manufacturing using different experiments and finite element simulations. They found that the as-built specimens with the smallest curvature exhibited the best surface quality, smallest grain sizes, and thinnest grain boundaries. Furthermore, they found that the shortest fatigue life was a result of the highest bending and shear stresses along the loading direction. Linares et al. [44] proposed a methodology to control the fatigue life of 17-4 Ph stainless steel by selecting the most relevant manufacturing parameters. They found that the fatigue limit of the specimens manufactured by SLM (471.7 MPa at 10 7 cycles) reached near 90% of the value found in samples machined from a bar, increasing the fatigue limit by 18%. Sahoo et al. [45] simulated the microstructure evolution of the TC4 electron beam additive manufacturing process. It was found that the columnar dendrite spacing and dendrite width decreased with an increase in the temperature gradient and scanning speed, and the phase field simulation value of columnar dendrite arm spacing was close to the experimental and analytical measurements. Xiao et al. [46] combined the macroscopic transient mass and heat transfer model with the microscopic phase field model to simulate the solidification behavior and dendrite growth behavior of the molten pool in the direct energy deposition of the nickel-based superalloy. The study found that the solidification rate showed an opposite trend to the temperature gradient, and the cooling rate decreased along the liquid–solid interface from the top to the bottom of the molten pool. Yao et al. [47] numerically simulated the solidification process of direct energy deposition additive manufacturing by combining the phase field model with the established thermal model. It was found that an increase in the laser power increased the temperature gradient near the side of the sample, making the equiaxed grains finer. In the solidification process, due to the increase in the temperature gradient, the equiaxed grains increase with a decrease in the scanning speed, while the columnar grains are almost unaffected by the change in scanning speed. Although the above researchers have made great progress in the multi-scale simulation of additive manufacturing technology, most of the current research focuses on the effect of process parameters on the microstructure and morphology. Compared with the powder deposition, the study of the change in microstructure morphology caused by different thermal diffusion in different regions of molten pool has not been fully carried out. The research on WLAM processing of wire is still in its infancy.
In this paper, the macroscopic molten pool heat transfer model and the microscopic phase field model are combined to establish a cross-scale model which can simulate the shape change in the molten pool and the evolution of the dendrite morphology of the TC4 alloy during the WLAM process. This is achieved using molten pool model calculations and an analysis of the change law of the molten pool temperature; morphology and solidification parameters; a physical model of the coupled macro/microorganism synergistic response; simulation of the microstructure evolution process in different regions of the melt pool; and a quantitative analysis of the effects of laser power, laser scanning rate, and other process parameters on the dendrite morphology.

2. Physical Model

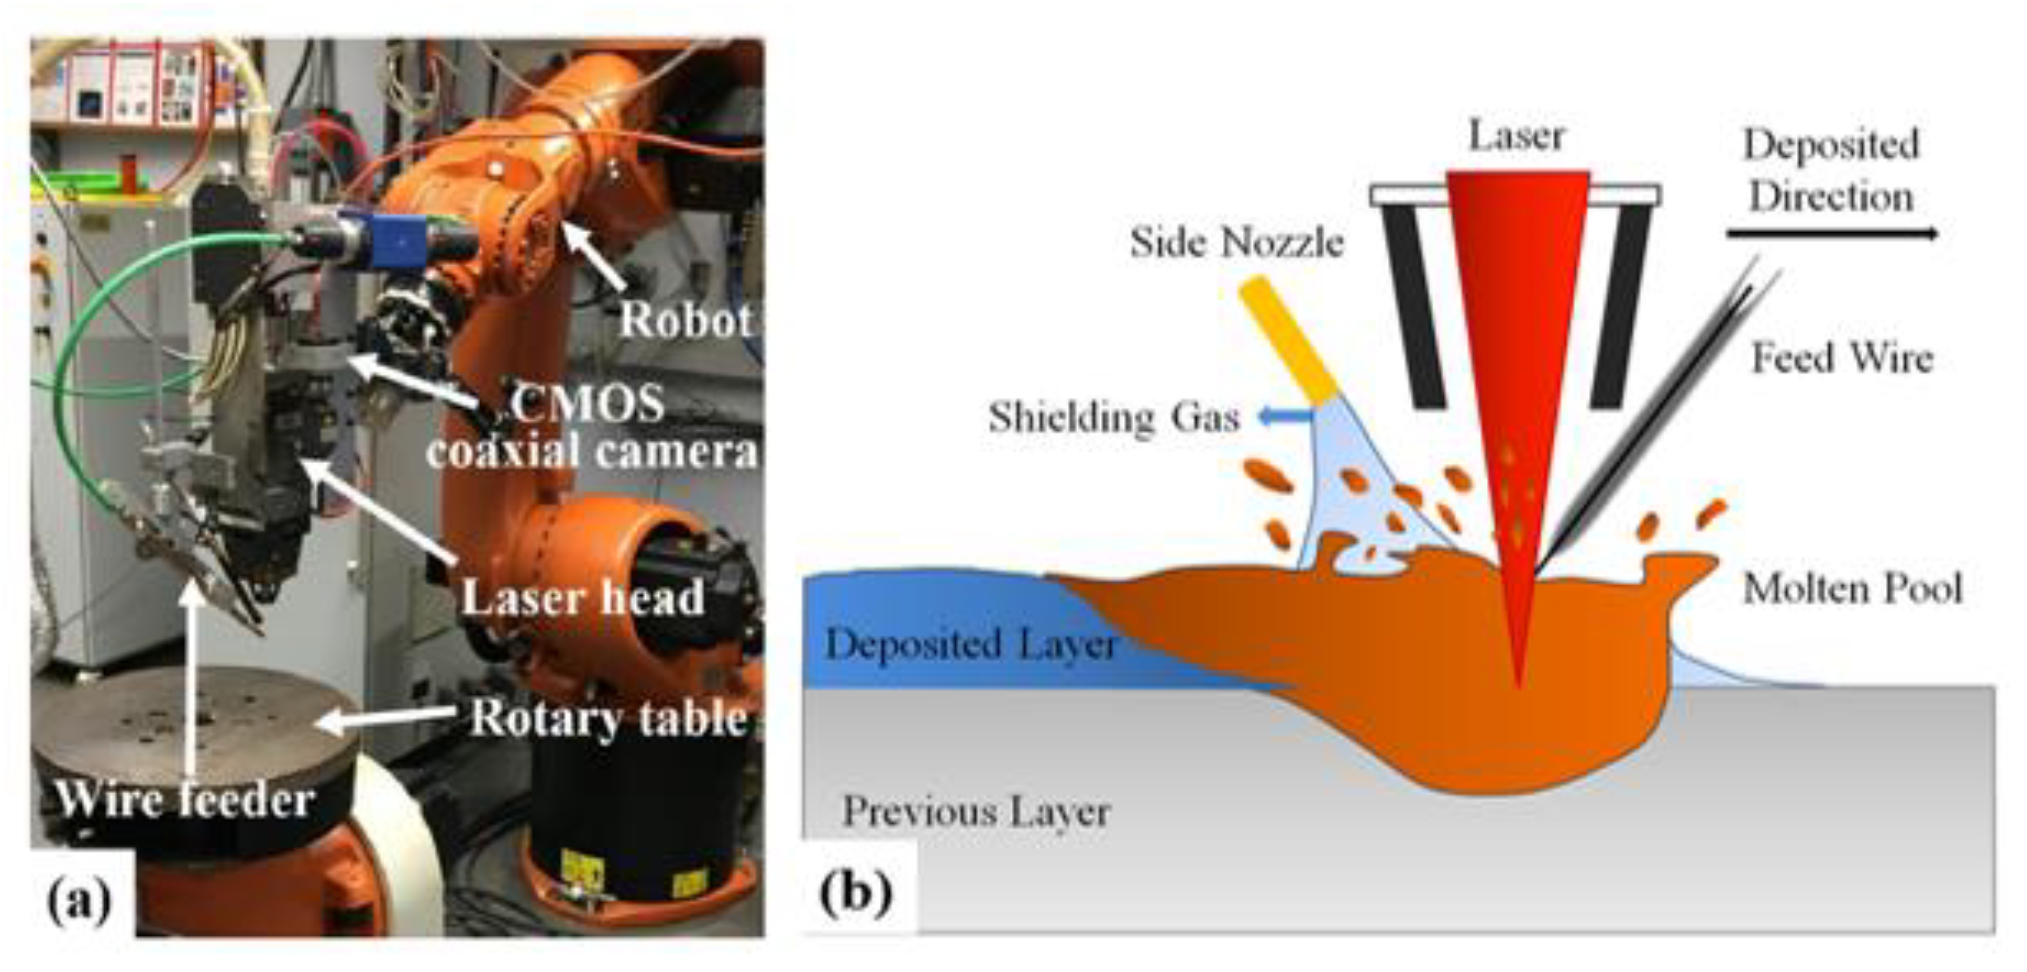
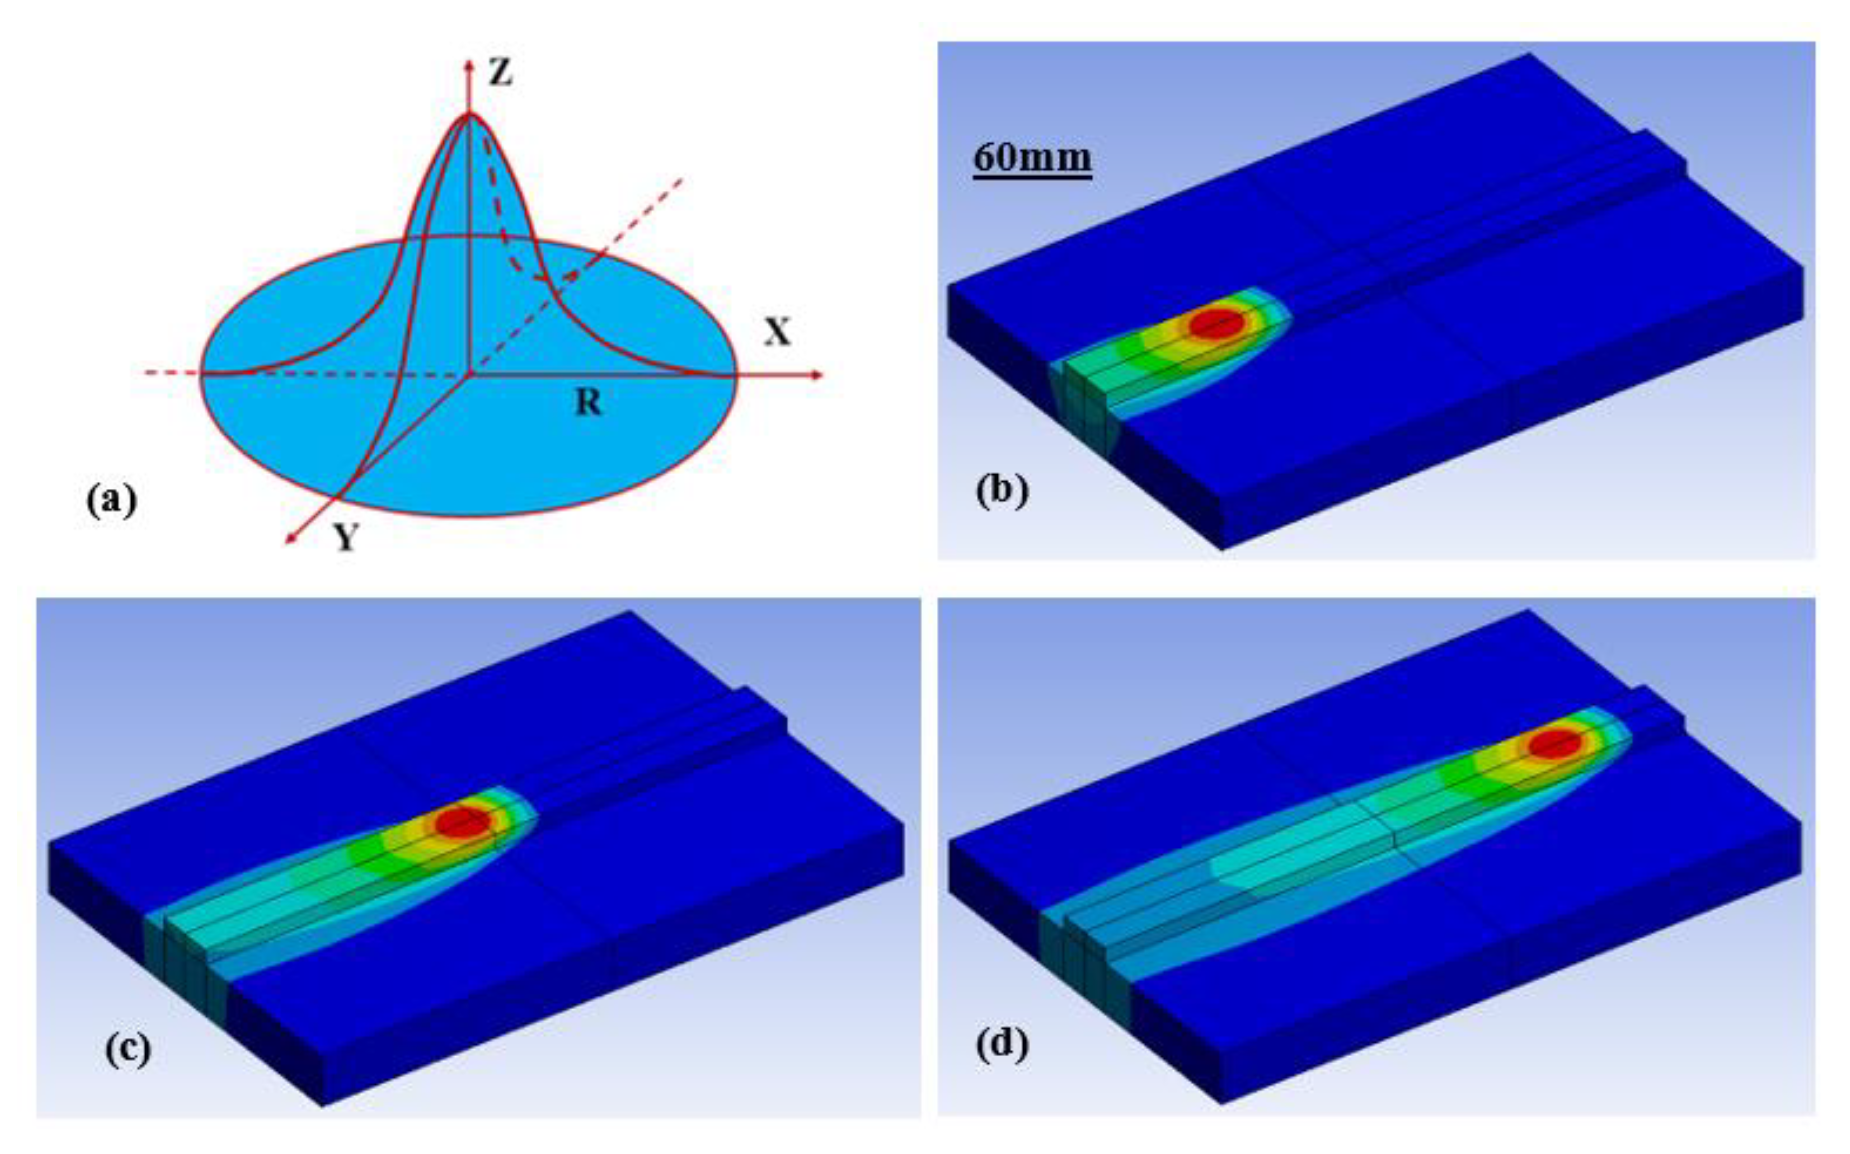
2.1. Molten Pool Model

The wire laser additive manufacturing system is shown in Figure 1a [13]. The metal wire enters the pre-planned scanning path through the wire feeding device, and then irradiated and heated by the laser, gradually melting to form a molten pool. Part of the matrix metal remelts, and the metallurgical bonding between layers is realized after the solidification of the molten pool. As shown in Figure 1b, with the laser moving, the molten pool is solidified in a state of continuous movement, and the parameters such as temperature gradient and cooling rate constantly change, which can affect the solidification structure and morphology of the molten pool. In order to simulate the dynamic crystallization process of molten pool, a three-dimensional heat transfer model of the TC4 titanium alloy laser additive process is firstly established to calculate the complex heat transfer process of the laser additive and obtain the macroscopic welding temperature field and molten pool shape.
At present, the common heat source models used to simulate the heat transfer process of laser additive manufacturing include the gaussian heat source model and the double ellipsoid heat source model [48,49]. For the laser beam, the impact force on the molten pool is small during processing, and the power density distribution of the focused laser spot output by the laser is more similar to the Gaussian distribution. It is considered that the heat input is generated by the body heat source, and the heat source penetrates evenly in the direction of plate thickness. The power distribution of gaussian heat source is shown in Figure 2a, and the specific mathematical expression is as follows [50]:
Q ( x , y , t ) = 2 A × P / ( π × R 2 ) e x p { [ ( x x t ) 2 + ( y y t ) 2 ] / R 2 }
where P and R is the laser power and spot radius, respectively. A is the energy absorption coefficient of the material; A = 0.3.
The geometric model is established based on the size of the substrate and the additive layer, and the grid is divided using the appropriate cell size. The laser heat source position moves along the scanning path according to the preset program, and the metal wire is transferred using the wire feeding device which is heated and melted in the corresponding position, forming a molten pool, followed by cooling. According to Chinese national standard GB/T 3620.1-2016, the composition of the TC4 alloy is shown in Table 1. The main material thermo-physical parameters of the TC4 alloy are shown in Table 2, and the TC4 base temperature is set to 20 degrees Celsius, which is used for single-channel and single-layer experiment. The specific process parameters include laser power, laser moving speed, and wire feeding speed, etc. The preliminary simulation results are shown in Figure 2b–d.

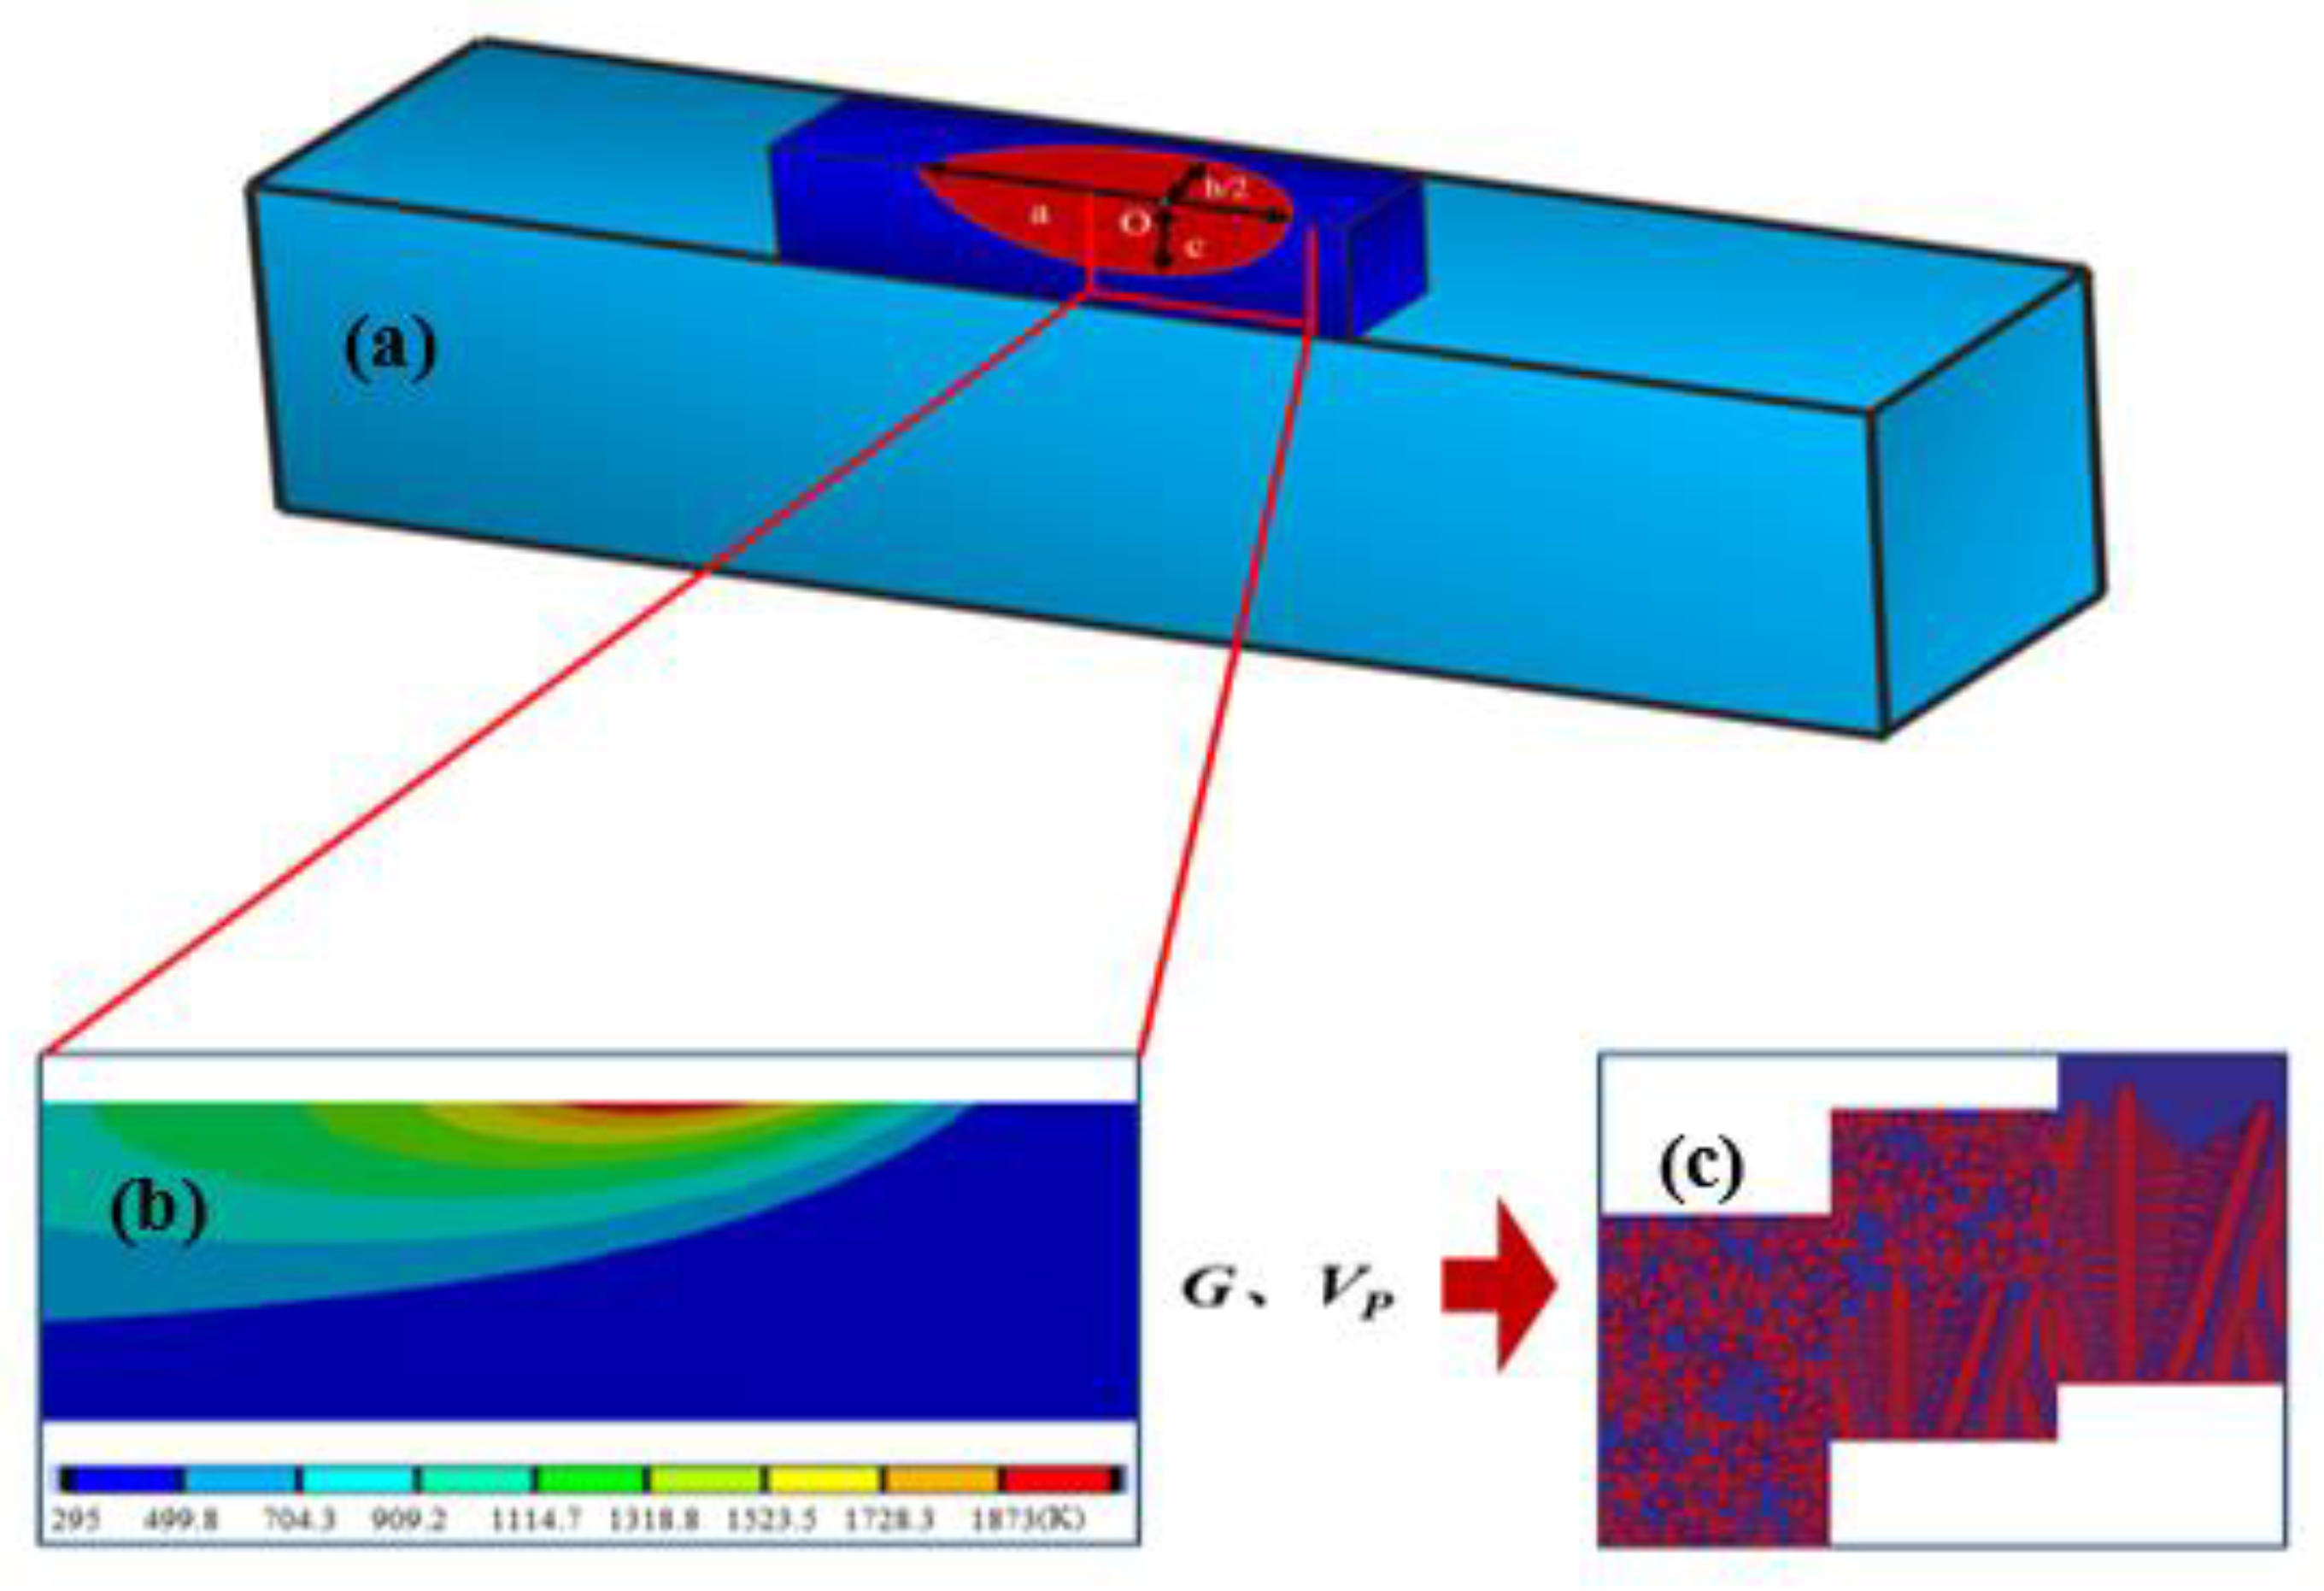
2.2. Phase Field Model

In the process of processing, macro and micro are inextricably linked, and the thermal history of the molten pool affects the microstructure of the material. The evolution course of the microstructure determines the mechanical properties of the material, such as yield strength, tensile strength, and fatigue strength, and profoundly affects the final quality of the product. According to the characteristics of molten pool movement, the macroscopic calculation results are coupled with the quantitative phase field model to predict the microstructure evolution of molten pool during dynamic solidification process more accurately, as shown in Figure 3, where a is the shape of the molten pool, b is the local temperature distribution of the molten pool, and c is the result of phase field simulation. Macroscopic solidification parameters of molten pool are as follows:
R ( t ) = V · cos α ( t )
G ( t ) = G x 2 ( t ) + G y 2 ( t ) + G z 2 ( t )
where R(t) is the solidification speed, and G(t) is the temperature gradient along the three-dimensional space. The governing equation of the phase field is as follows:
τ 0 a s 2 [ 1 ( 1 k ) T d ] φ t = W 0 2 [ a s 2 φ i ] + W 0 2 m = x , y [ m ( | φ i | 2 a s a s ( m φ i ) ) ] + φ i φ i 3 λ ( 1 φ i 2 ) 2 ( U + T ˜ ) α ( 1 + φ i 2 ) j i ( 1 + φ j 2 ) 2
[ 1 + k ( 1 k ) h ( φ i ) ] 2 U t = { D l 1 h ( φ i ) 2 U J A T } + 1 2 [ 1 + ( 1 k ) U ] i φ i t
where φ represents the physical state of each point in the system, φ = 1 represents the solid phase, φ = −1 represents the liquid phase, φ changes continuously between −1–1 at the solid–liquid interface, τ 0 is the relaxation time, W 0 represents the interface thickness, λ is the phase field coupling coefficient, and the physical quantitative relationship is between d 0 = a 1 W 0 / λ , τ 0 = a 2 λ W 0 2 / D . The microscopic capillary length is d 0 = Γ / ( m c ( 1 k ) / k ) , where Γ is the Gibbs–Thomas coefficient, m is the liquidus slope, c is the concentration at infinity, k is the solute distribution coefficient, a1 = 0.8839, a2 = 0.6267 is the reverse solute closure item, which can maintain a local balance in the solid–liquid interface and eliminate various interface effects. Its specific form is [43]:
J A T = 1 2 2 ( 1 k i D s , i D l , i ) [ 1 + ( 1 k i ) U ] i t φ i φ i | φ i |
The anisotropy function is: a s ( n ) = 1 + ε 6 cos [ 6 ( ϕ ϕ 0 ) ] , where φ is the angle between the interface normal and y direction, and φ0 is the angle between the preferred growth direction and the heat flow. The thermal physical parameters required for this process are shown in Table 3.

3. Results and Discussion

3.1. Influence of Process Parameters on Macro/Microstructure of Molten Pool

The power and scanning speed of laser determines the temperature and size of the molten pool. It controls the structure and morphology of the melt after solidification, and is closely related to the generation of micro-segregation, inclusions, micro-cracks, and porosity in the structure. These can ultimately affect the mechanical properties and corrosion resistance of the molded parts [26,27,28]. The characteristics of the molten pool not only guarantee the microstructure and performance of the entire processing process, but also the final formed parts. In order to study the change rule of the molten pool morphology and solidification structure in the process of different process parameters, the different laser power and scanning speed of the WLAM of single-layer single-channel sample is analyzed. Quantitative control analysis is carried out to study the solidification of the formed parts and the variation of the molten pool temperature, and the influence of these two parameters on the growth morphology of the dendrites is investigated during the solidification of the molten pool, where a, b, and c represent the maximum length (melting length), width (melting width), and depth (melting depth) of the molten pool, respectively, as shown in Figure 3a.

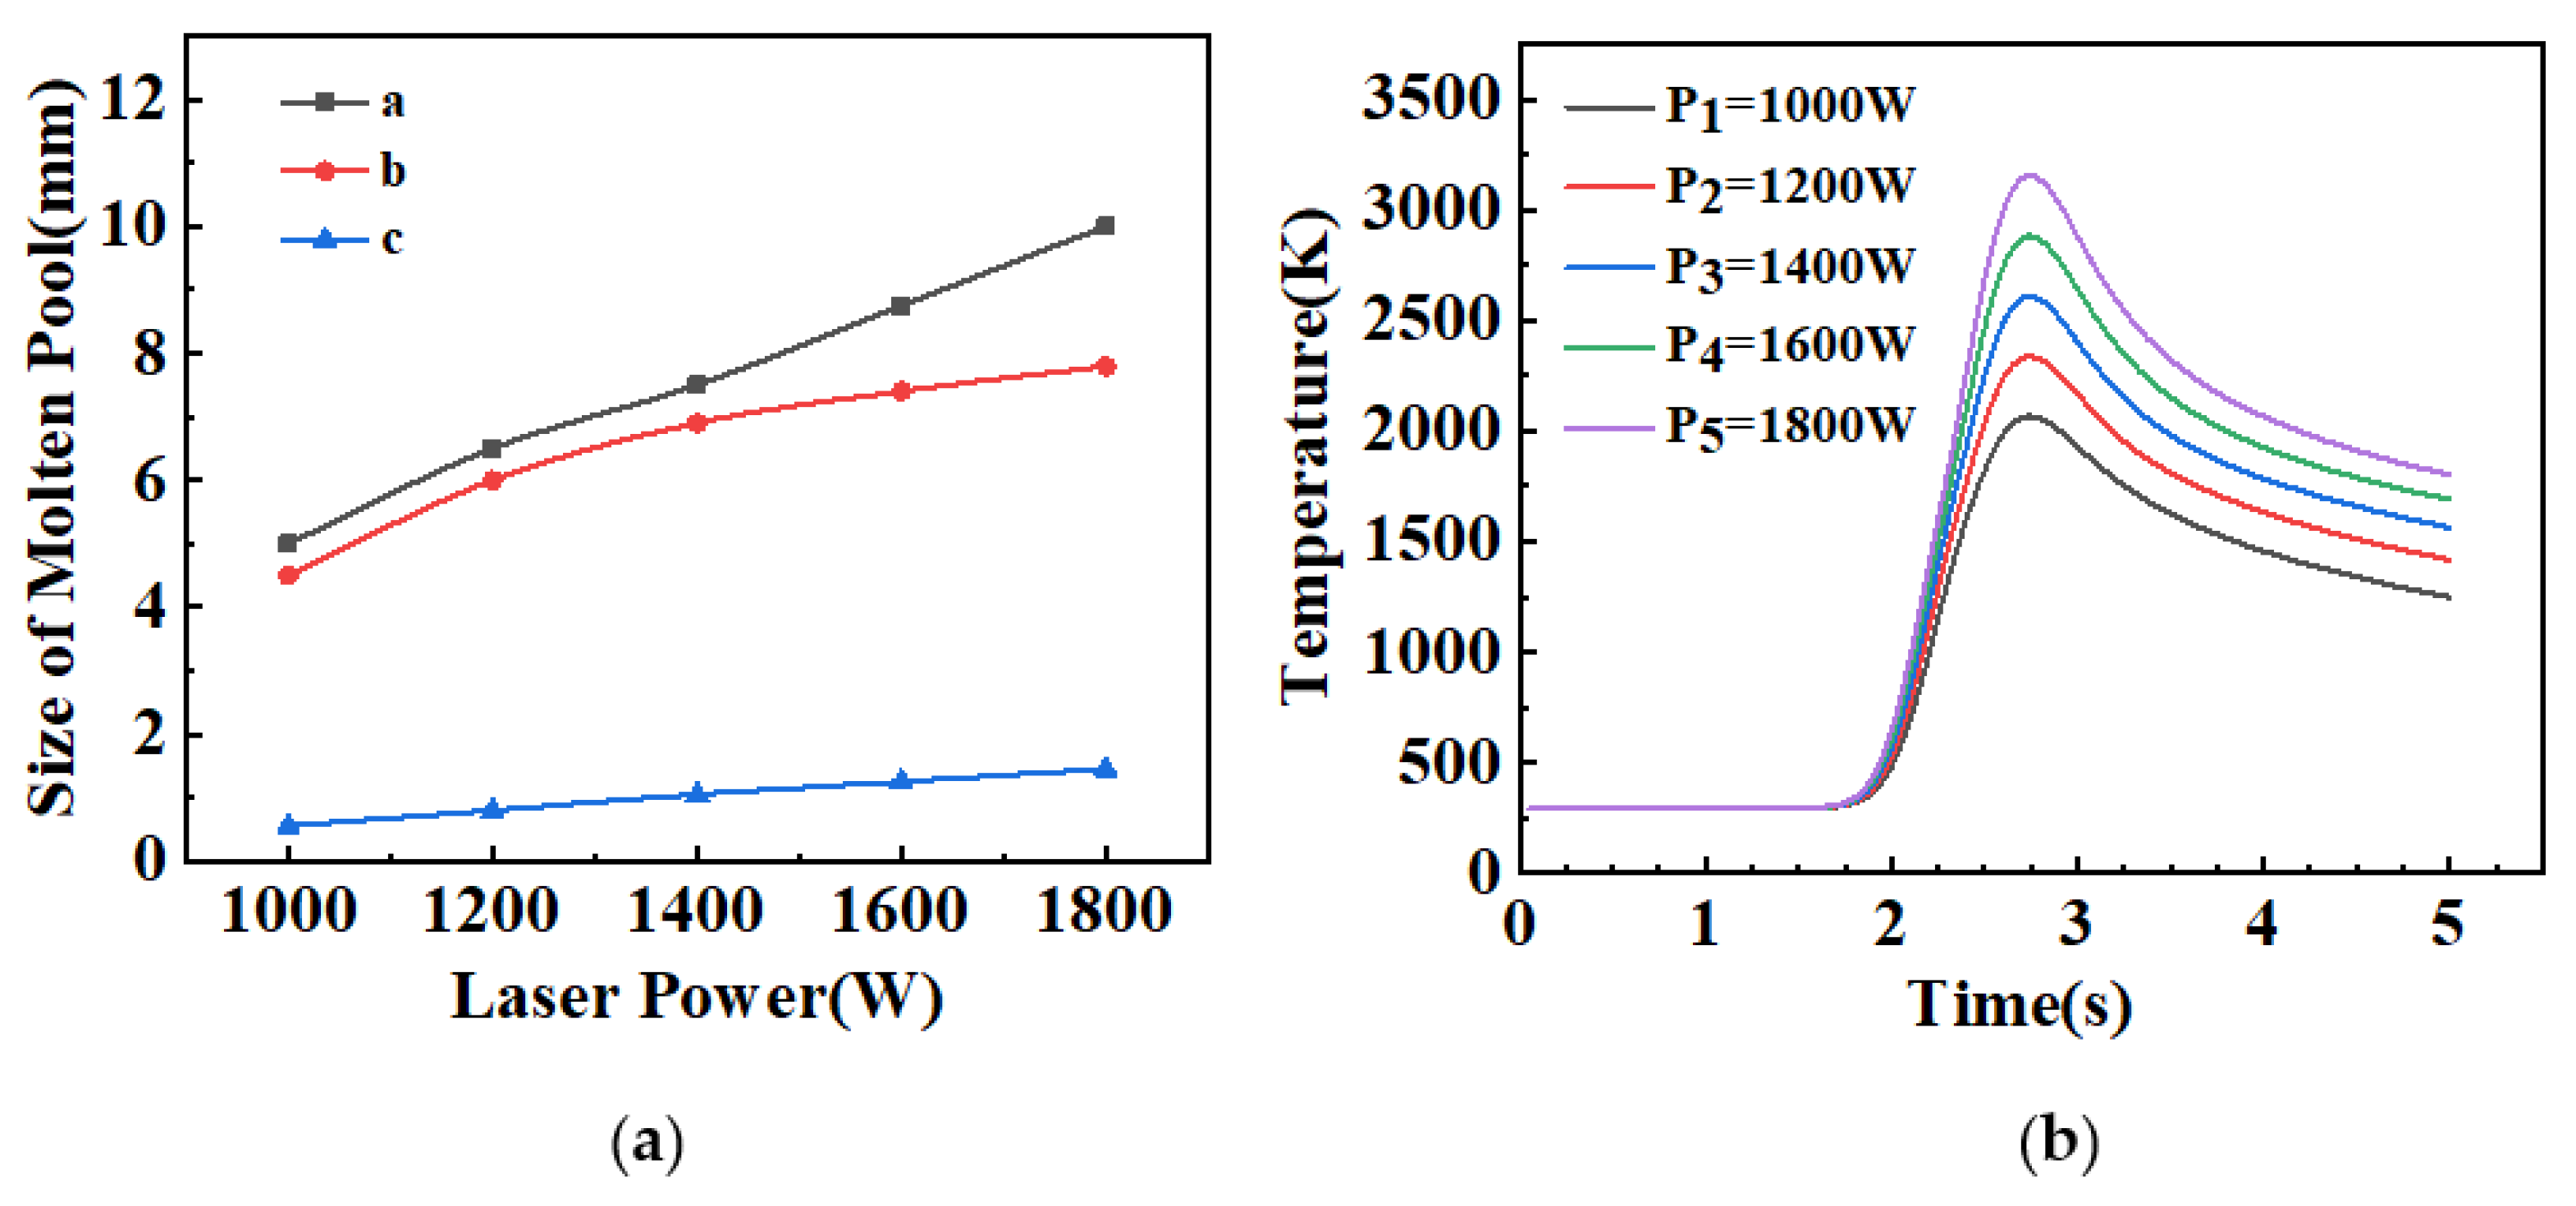
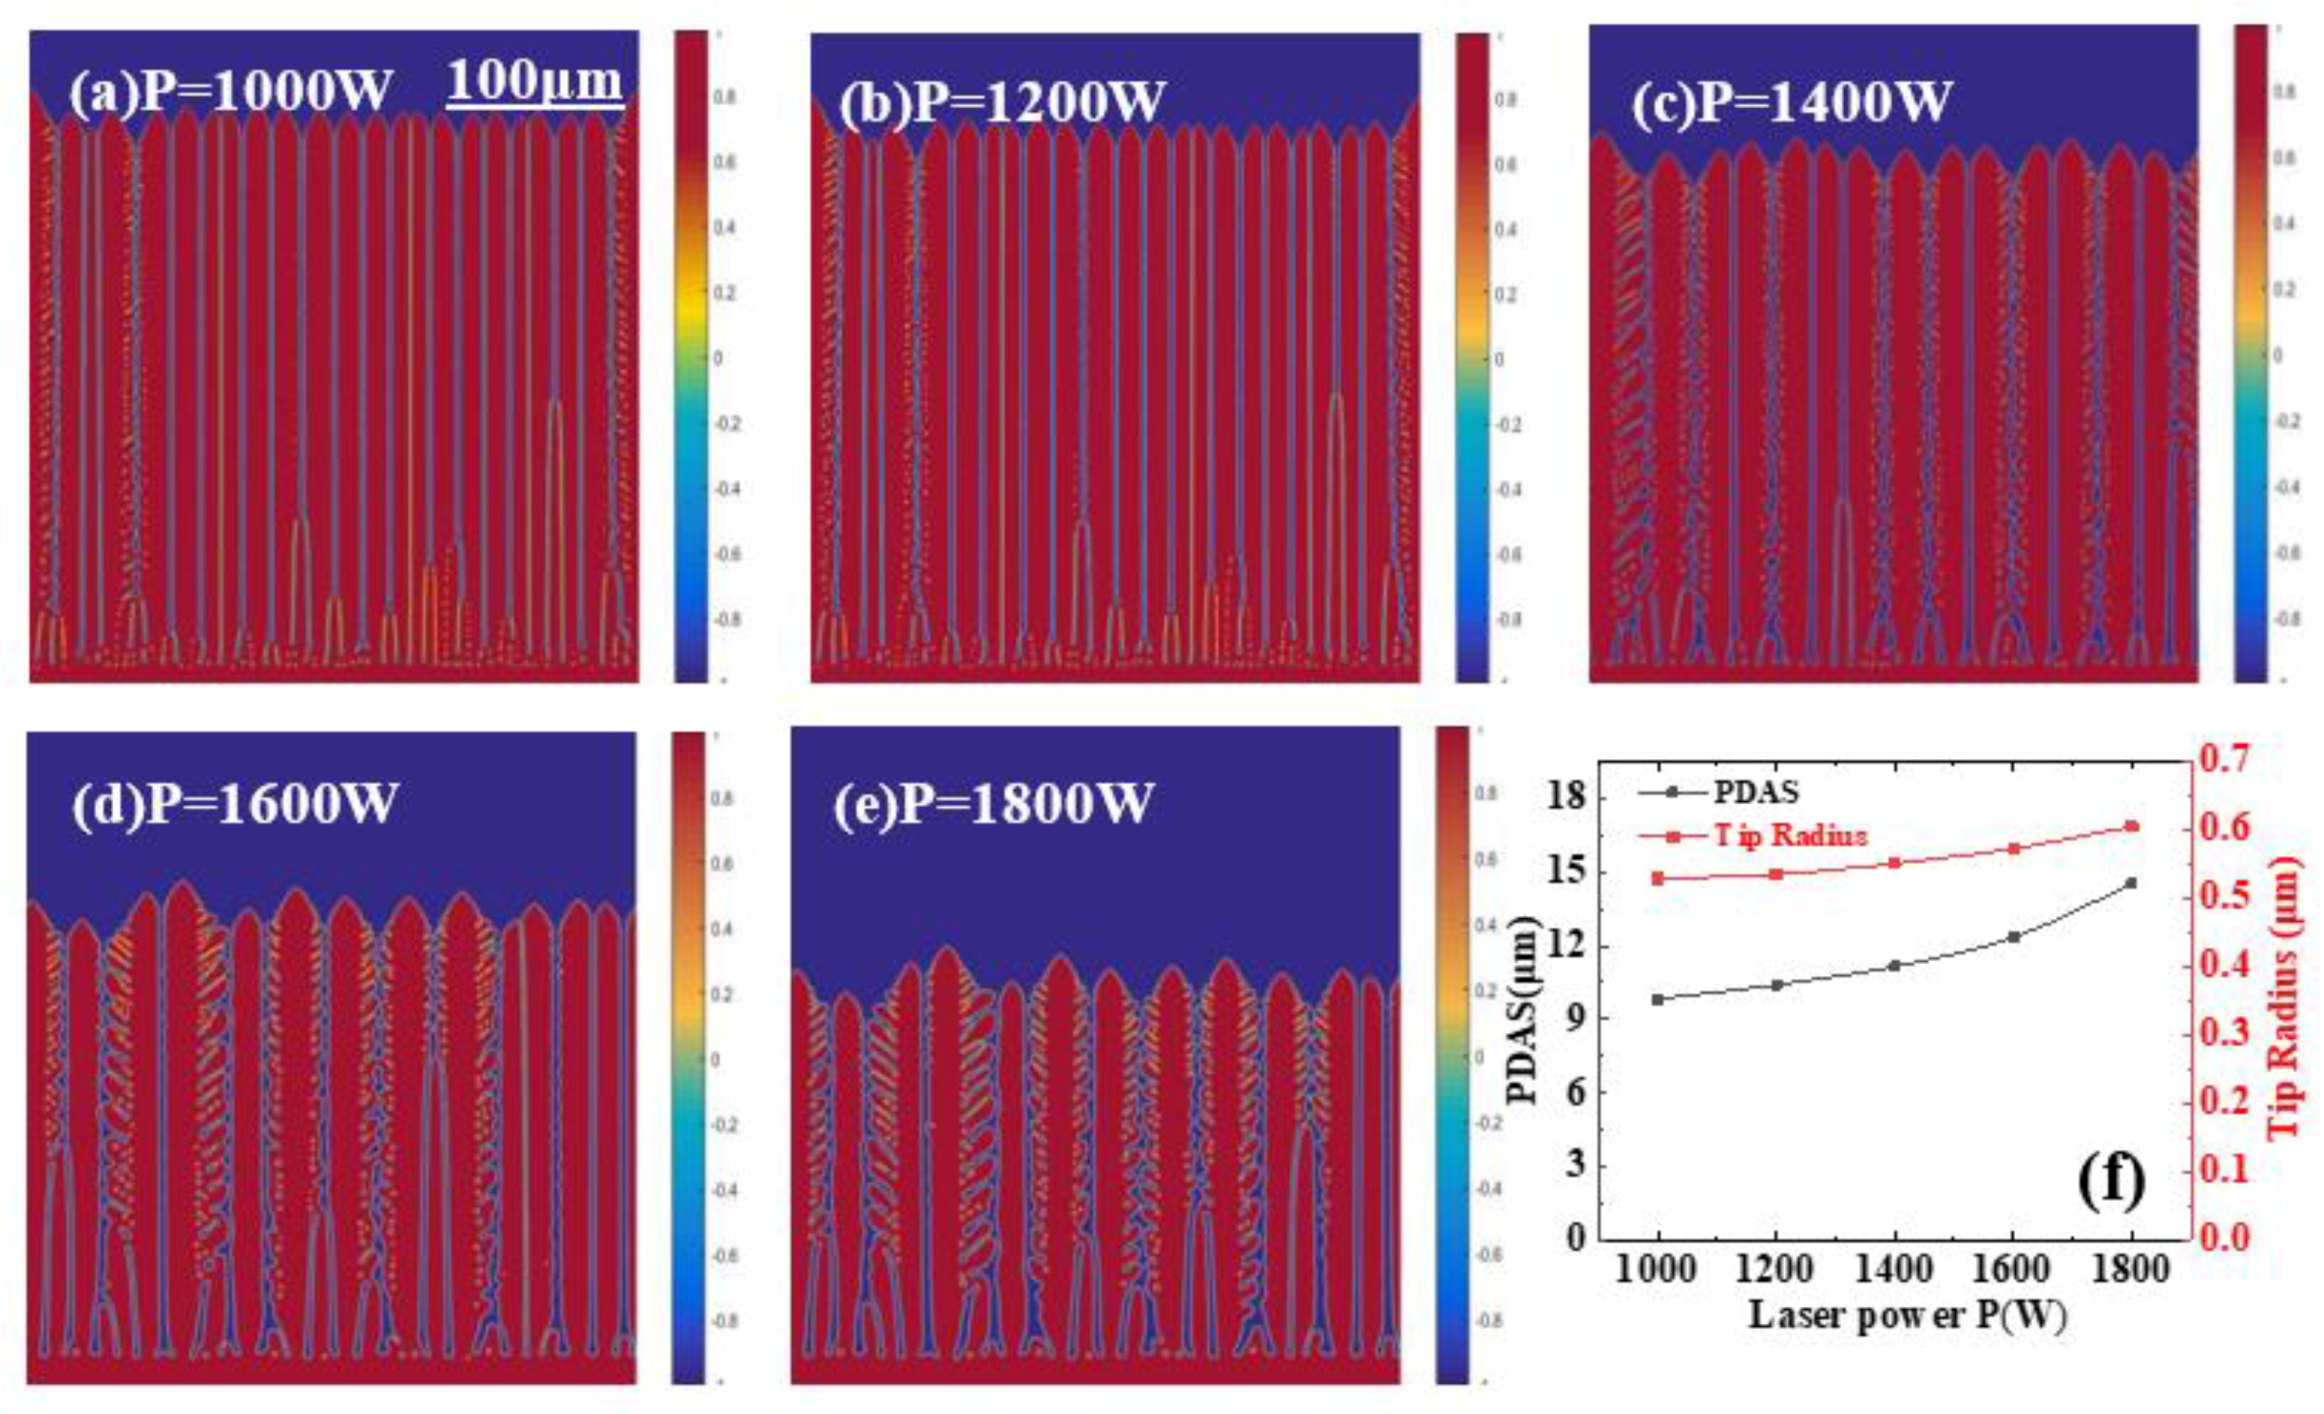
3.1.1. Effect of Laser Power on Macro/Microstructure of Molten Pool

The size of the laser scanning power P directly determines the size, morphology, and solidification parameters of the molten pool, and controls the size and type of the solidified structure of the molten pool. Figure 4 shows the molten pool size and temperature parameters under different laser power conditions with a constant laser scanning rate of 1 mm/s. It can be seen from the figure that with the increase in laser power, the average temperature in the molten pool increases rapidly, and the size of the molten pool also increases approximately linearly. When the laser power reaches 1400 W, the melting length and the melting width maintain a linear growth trend, while the increasing trend of the melting width tends to be gentle. Compared with the melting depth, the melting length and width have larger dimensions. Simultaneously, the heat input of the laser also increases linearly, causing the molten pool to expand rapidly in all directions, and the lateral expansion speed is faster than the longitudinal expansion speed. It can be seen from Figure 4b that the temperature of the part is positively correlated with the power, but the temperature change trends under different laser power are generally the same. When the laser power is equal to 1000 W, the peak temperature of the molten pool is only 2058 K. When the power is increased to 1800 W, the peak temperature of the molten pool reaches 3125 K. As a result of the higher of the laser power, the higher of the heat input to the parts in the same time, the larger of the range of the temperature field, so the peak temperature obtained at the measurement point is higher. According to the above analysis, in the case of other process parameters determined, a smaller molten pool volume is formed when selecting a lower laser power, and the resulting workpiece has an additive layer with high forming accuracy and a low dilution rate.
The size, shape, and dendritic arm spacing of dendrites are the characteristics of dendrite properties. Mechanical properties improve due to smaller dendrite spacing and denser structure [53]. In this study, the solidification microstructure phase distribution and dendrite size variation trend of different powers are quantitatively analyzed under the fixed other parameters, and the results are shown in Figure 5. As demonstrated in the figure, the position of the solid–liquid interface of columnar dendrites decreases with an increase in the laser power, but the overall position is relatively close, and the dendrite also changes from slender to stubby. When the power reaches 1400 W, the growth of secondary dendrites appears in a large range, and the development of dendrites is more complete. It can also be seen that the average value of columnar crystal spacing also gradually increases. This is mainly because when other processing parameters are kept constant, the laser power is lower, and the temperature gradient at the solidification feature point of the molten pool is greater, which makes the temperature at the tip of the columnar crystal lower for the same time period, so the growth rate of the dendrite tip is faster. The longer the growth time, the more likely it is to obtain thicker columnar crystals in the competitive growth stage, thus increasing the size of columnar spacing. Figure 5f demonstrates the variation of the primary dendrite arm spacing and tip radius of the columnar crystals under different laser powers. It can be seen that the primary dendrite arm spacing and tip radius of columnar crystals are positively correlated with the laser power, and the dendrite arm spacing ranges from 9.83 μm to 14.51 μm, while the tip radius ranges from 0.529 μm to 0.650 μm. It can be considered from the above analysis that the solidified structure of the molten pool has a higher temperature gradient and cooling rate under low power conditions. Therefore, the melt obtains a finer dendritic structure after solidification. This is because with an increase in power, the cooling rate at the solid–liquid interface of the molten pool tends to decrease as a whole, resulting in a slow growth rate of dendrites. In the primary stage, the competitive growth of dendrites is grievous, the number of dendrites in a unit area decreases, and the dendrite development is more perfect. It can be noted that under a fixed scanning rate, a lower laser power can improve the cooling rate of the melt during solidification, resulting in a smaller spacing between columnar dendrites and a finer structure.

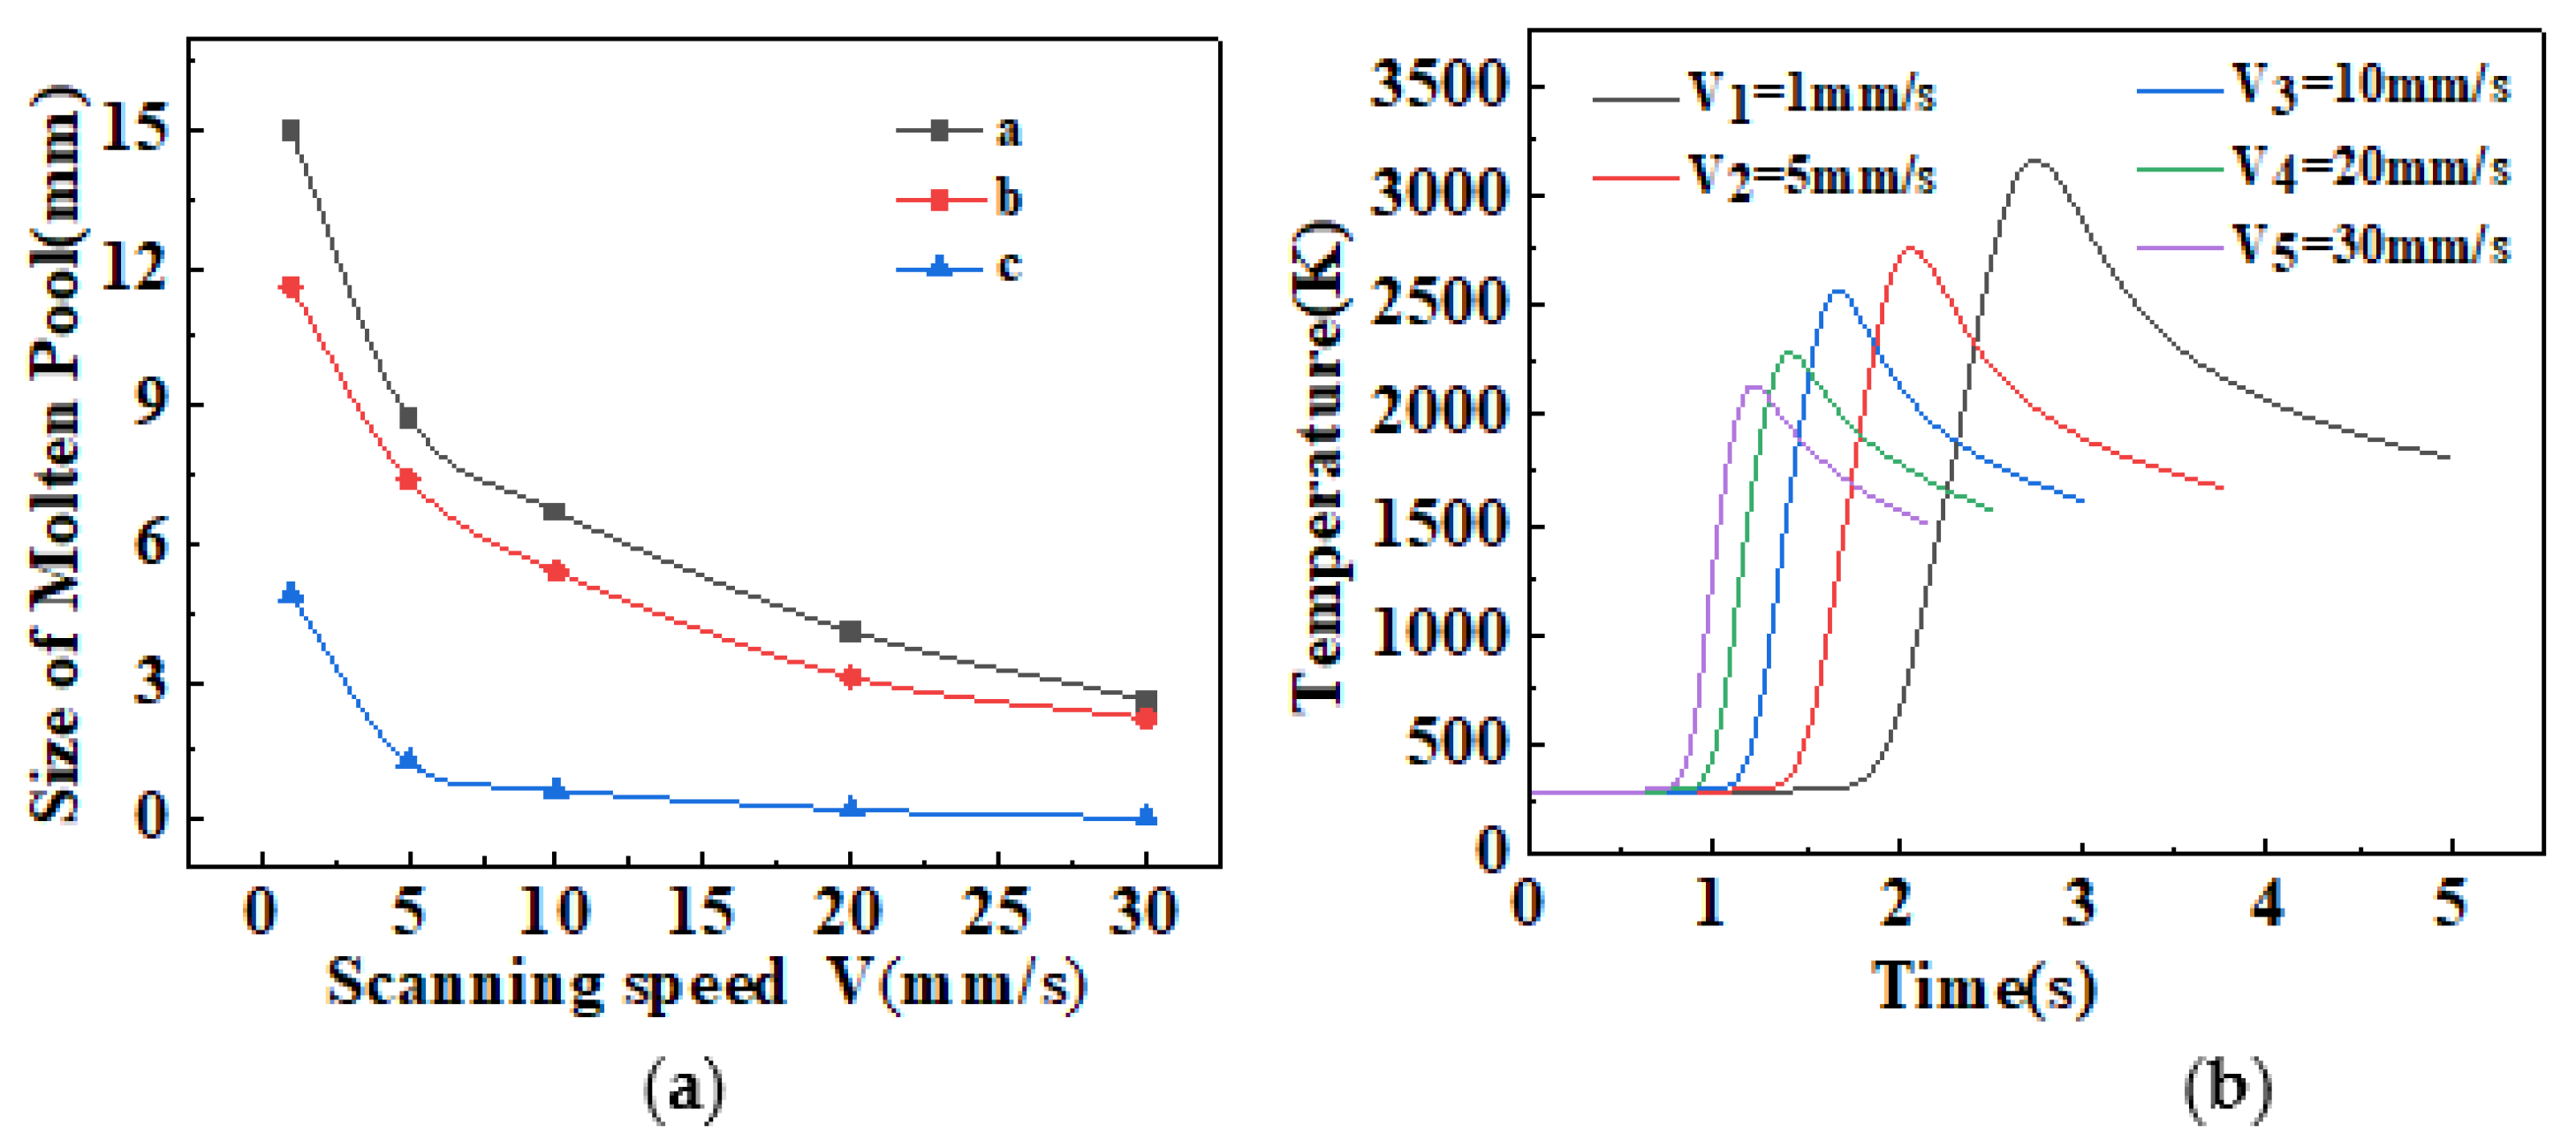
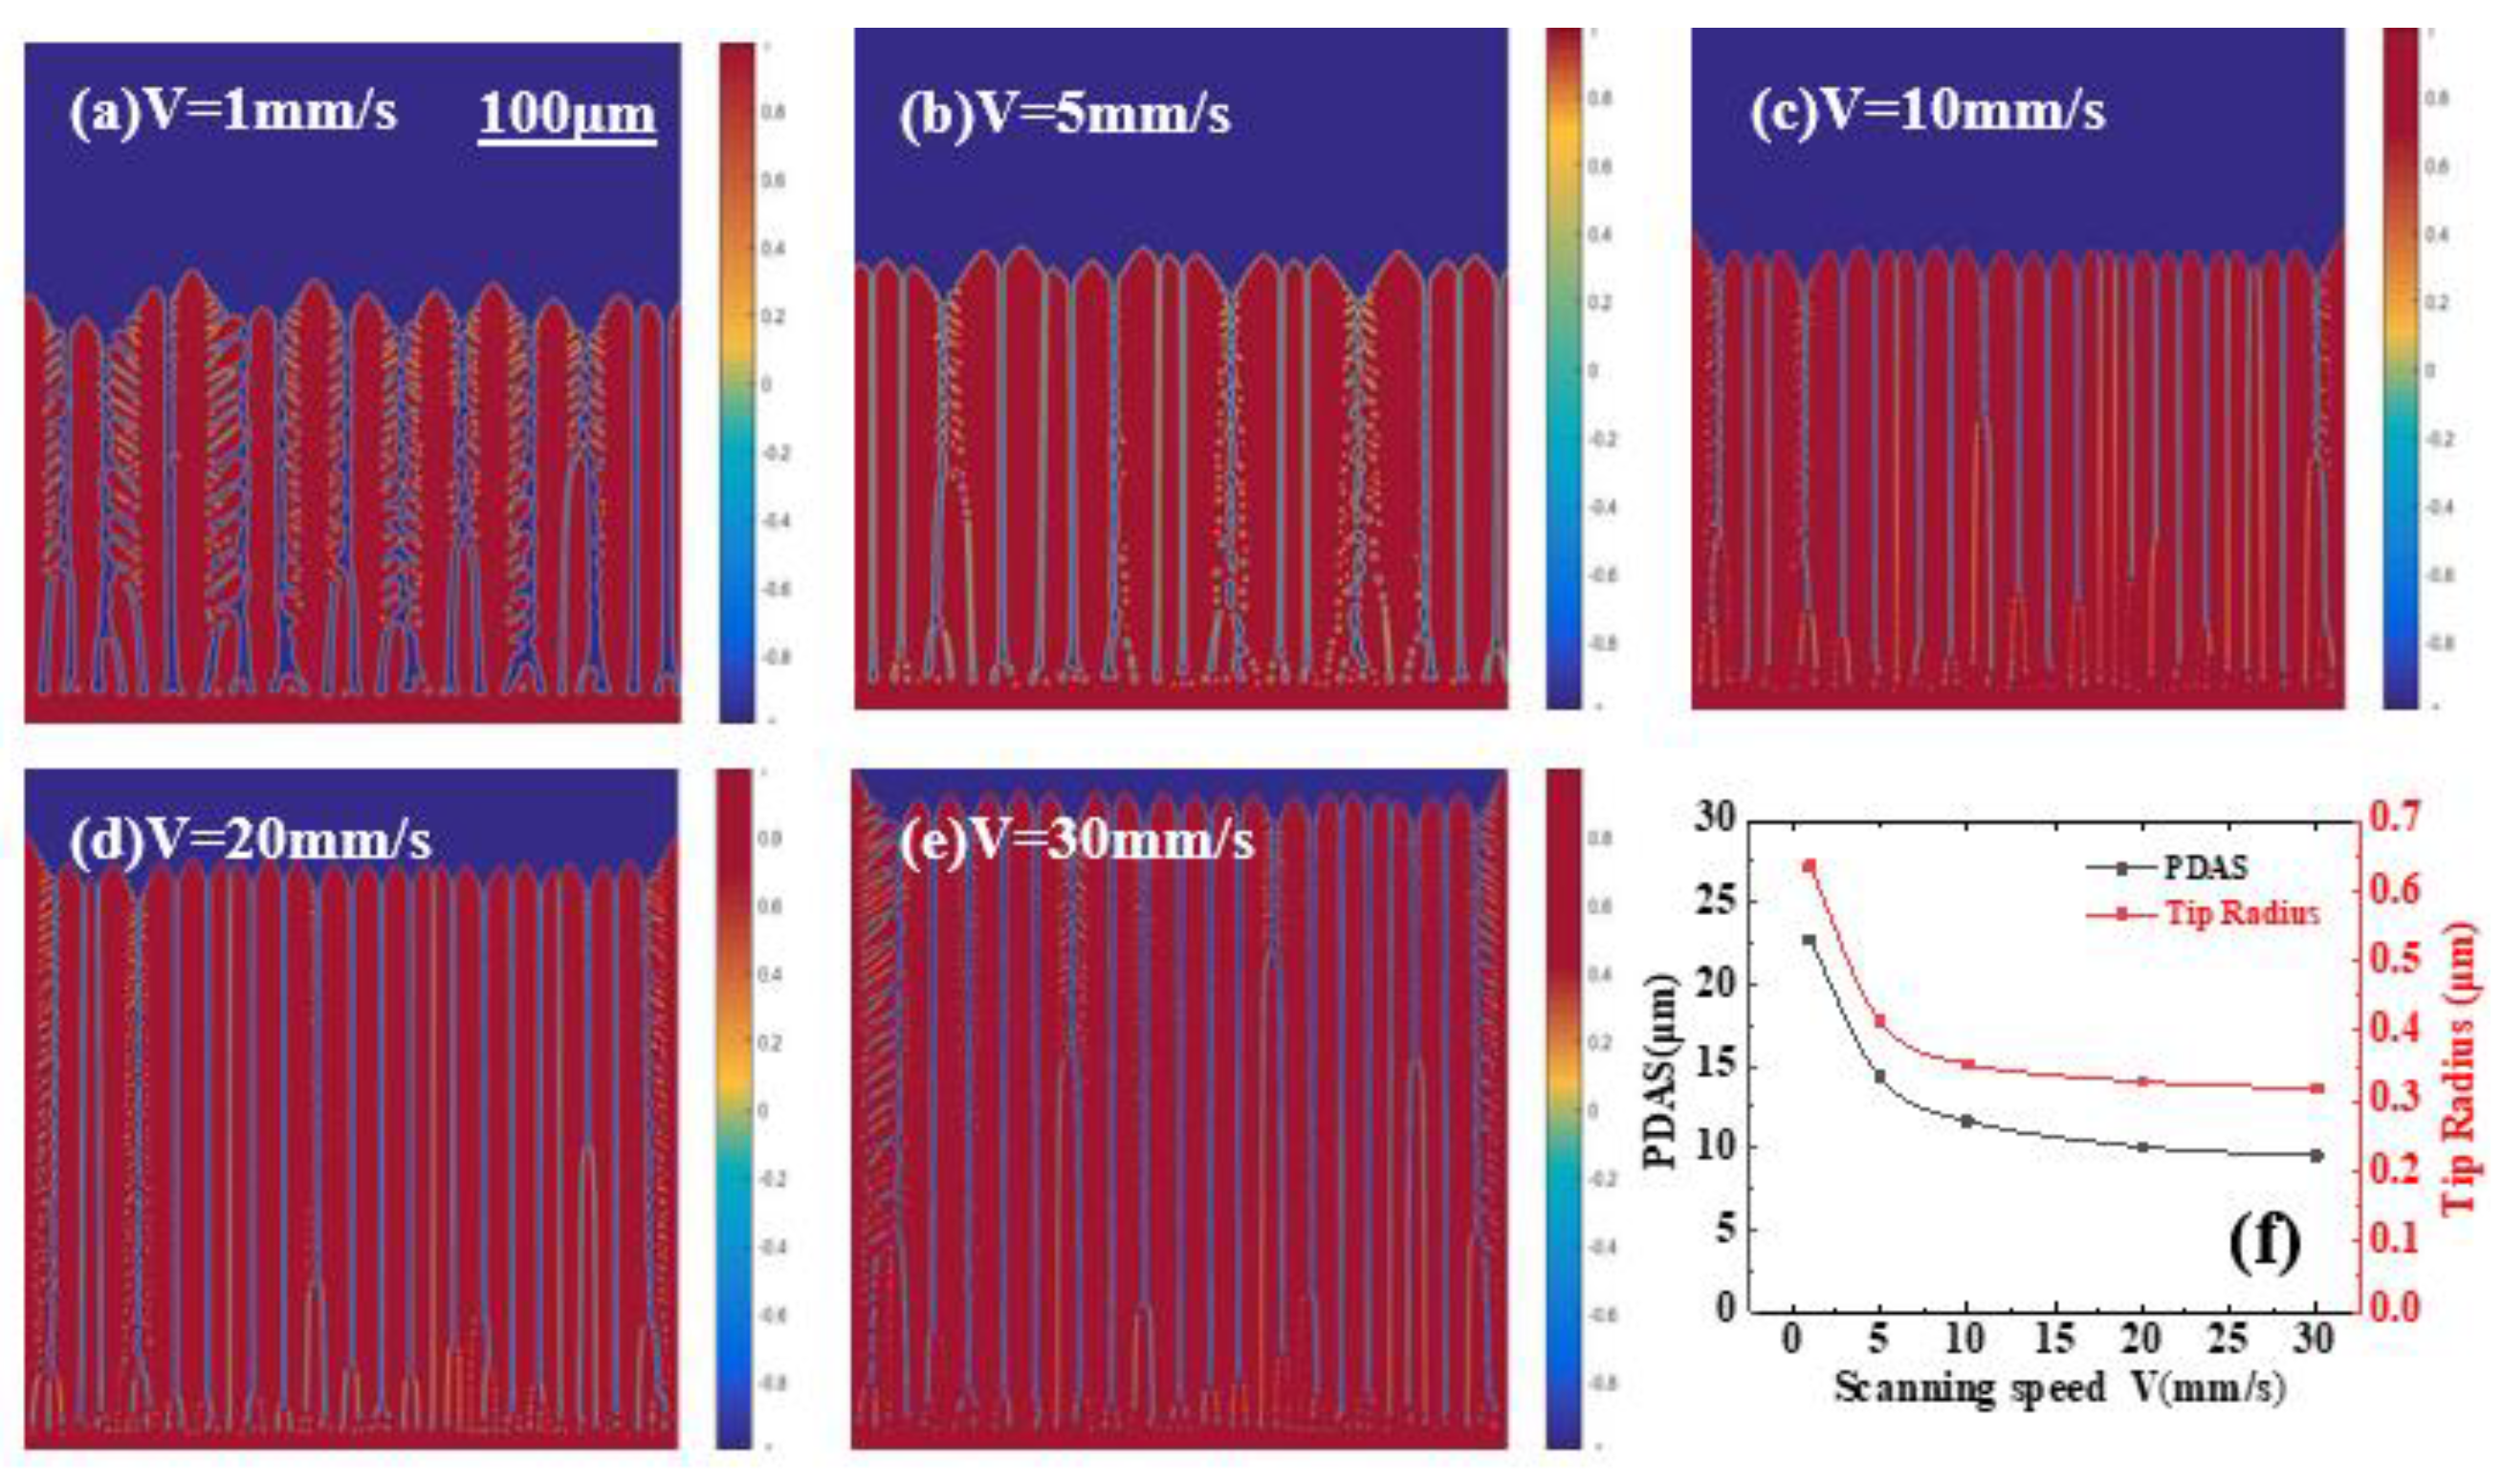
3.1.2. Influence of Laser Scanning Speed on Macro/Microstructure of Molten Pool

The scanning speed V also affects the morphology, the size, and the moving speed of the molten pool, which plays an important role in controlling the internal structure of the formed part. Figure 6 shows the molten pool at a fixed laser power of 1000 W with different laser moving rates. It can be seen that when the scanning speed is less than 5 mm/s, each size of the molten pool expands sharply as the scanning speed decreases. Moreover, with the scanning speed increases, the size of the molten pool decreases and tends to flatten. This is because when increasing the speed of the laser movement, less dwell time in the same area, shorter heating times, and insufficient heat absorption produce significant penetration depth, resulting in a reduction in the size of the melt pool. It is important to note that in the actual processing process, when the laser speed is too large, the depth of the molten pool decreases accordingly, and the droplet transition is unstable, which easily causes instability of the molten pool. On the contrary, when the laser moving speed is too low, the heat input increases, more molten metal is produced, and the metal steam generated by the recoil pressure is not enough to maintain the existence of the hole. At this time, the small hole not only no longer deepens, but may collapse instead, and the processing process may become unstable, making it easy to splash molten droplets.
In order to further explore the relationship between the scanning speed and the microstructure, the quantitative simulation analysis of the change trend of the dendritic morphology of the WLAM solidification structure under different scanning rates is carried out, and the results are shown in Figure 7. The reason for this is that as the scanning speed increases, the cooling rate at the solid–liquid interface of the molten pool also increases, and the cooling rate determines the degree of supercooling at the front edge of the liquid–solid interface. The greater the cooling rate of the molten pool, the higher the degree of supercooling at the front of the dendrite interface, which tends to generate a stronger solidification driving force, making the solidification rate and the tip growth rate much faster. It can be seen from Figure 7f that the growth morphology of columnar crystals changes with the scan rate. With an increase in the scan rate, the number of columnar dendrites in the simulated area gradually increases, and the spacing of primary dendrites decreases. The magnitude of the rate is negatively correlated; the higher the scan rate, the smaller the tissue obtained. When the scanning speed is less than 5 mm/s, the growth of columnar crystals is limited, the growth time is greatly increased, a relatively coarse columnar crystal structure is formed, and the curvature radius of the columnar crystal tip is also larger. With an increase in the scanning speed, the cooling rate of the solidification interface increases, the growth rate of the columnar crystal tip increases, the structure of the columnar crystal gradually refines, and the tip curvature radius gradually decreases. When the scan rate is 10 mm/s, the dendrite spacing is almost half of that at 1 mm/s. This is because a large scan rate can generate a large cooling rate at the solid–liquid interface of the molten pool, and with an increase in the cooling rate, the solidification rate increases, which can lead to an increase in the radius of the columnar dendrite tips, thus limiting the dendrite growth. This results in smaller primary dendrite spacing and ultimately inhibits the growth of secondary dendrite arms.

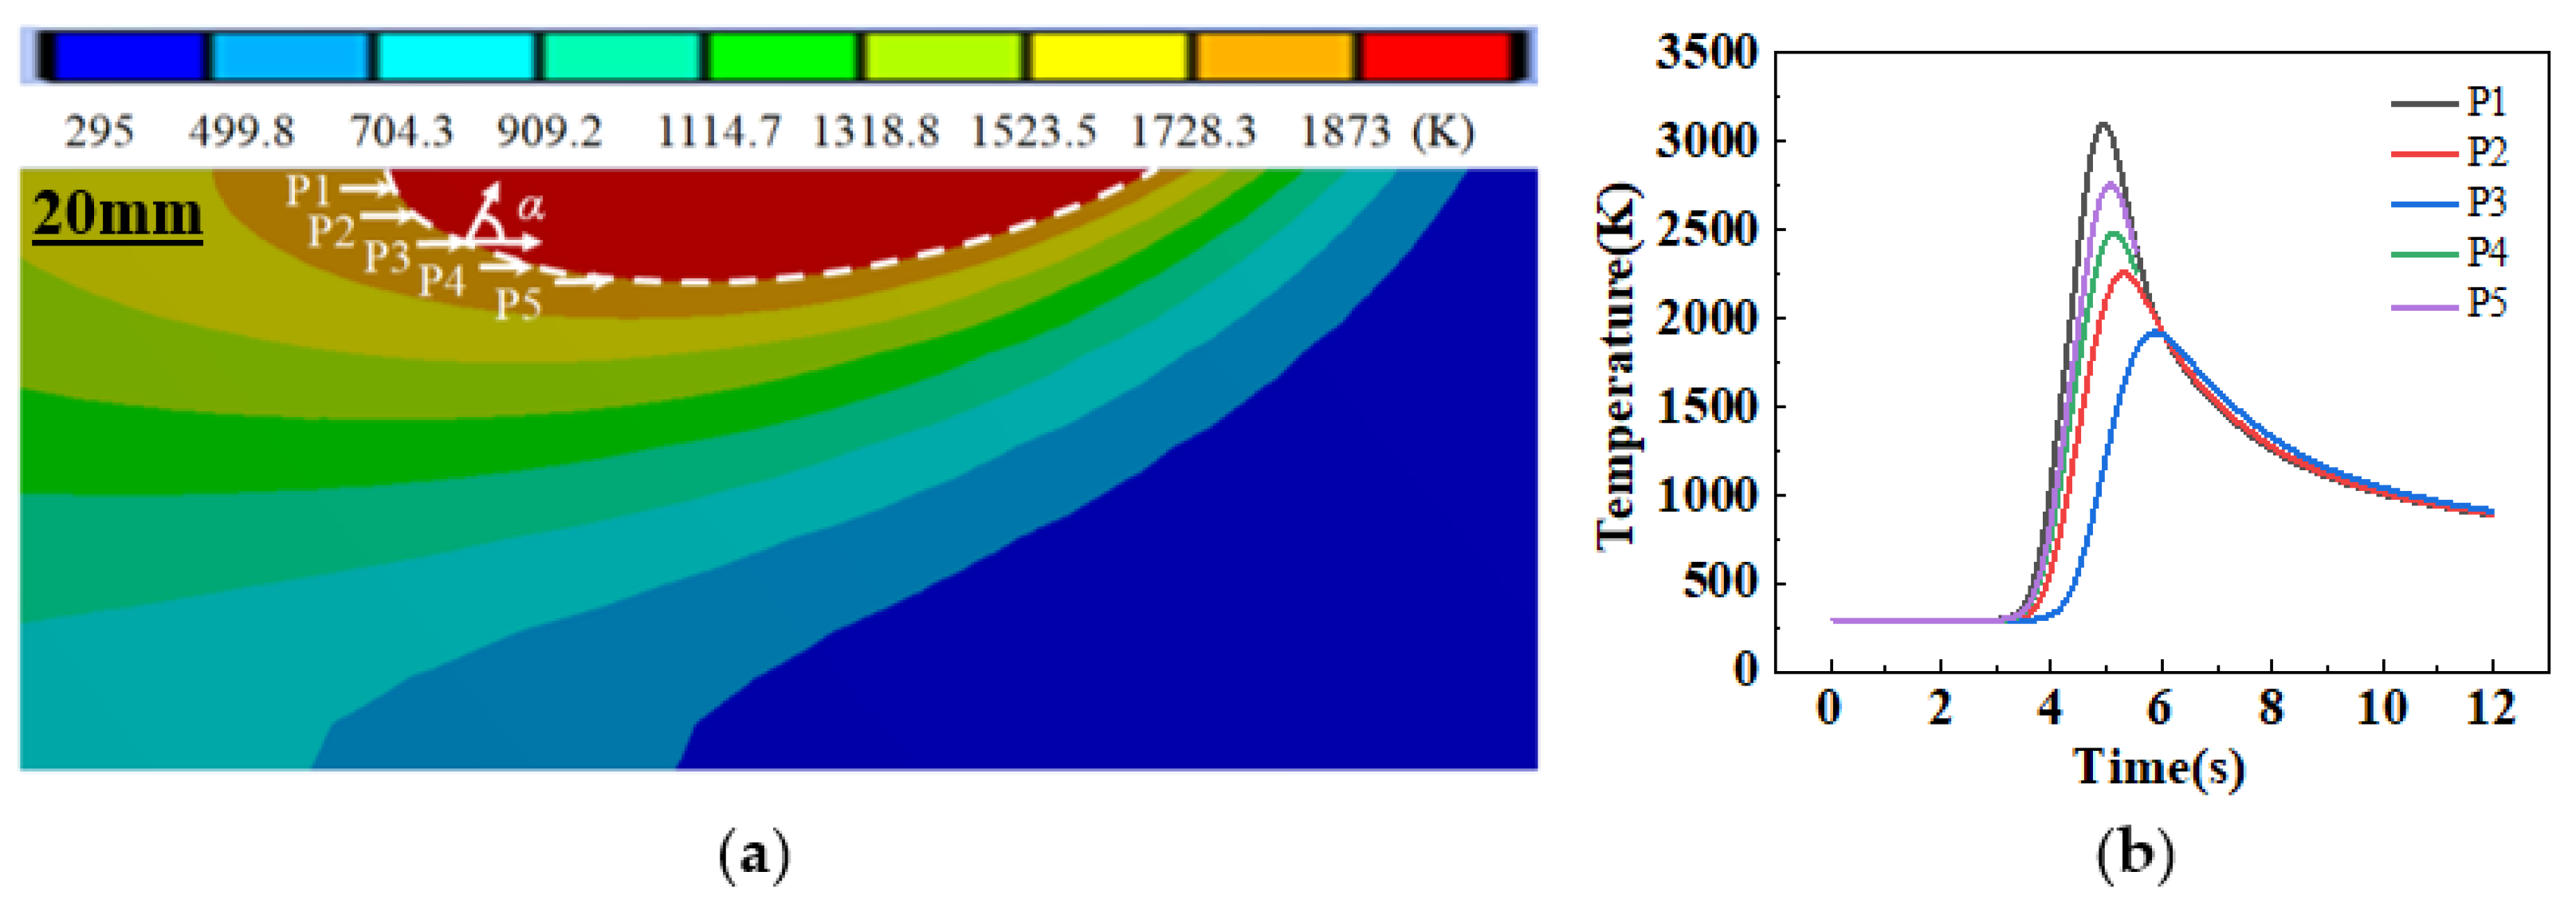
3.2. Microstructure Analysis of Different Positions of Molten Pool

In the process of WLAM processing, the temperature distribution and diffusion rate in the molten pool are different as the laser moves, resulting in the solidification parameters of each region of the molten pool are very different. Figure 8 shows the temperature history curve of different positions of the molten pool with time under the same process parameters (P = 1800 W, V = 1 mm/s), where α is the angle between the normal and the molten pool interface and the scanning direction. From the top to the bottom of the molten pool, α is selected as 15°, 30°, 45°, 60°, and 75°. It can be seen from the figure that during the wire laser additive manufacturing process, the temperature at the top of the molten pool is significantly lower than that of the middle and bottom, while the temperature history of the middle and bottom is not much different, which can affect the microstructure of the molten pool, demonstrating the decisive role of the workpiece performance.
In order to comprehensively study the microstructure evolution of the deposited layer during WLAM processing of the TC4 titanium alloy, the solidification characteristic parameters at the S/L interface were obtained through the above molten pool temperature field, and the microstructure evolution process was simulated in different regions (shown in Figure 8). Figure 9 shows the growth morphology of dendrites at different positions of the molten pool under laser power P = 1800 W and scanning speed V = 1 mm/s. It can be seen from the figure that due to the different solidification parameters in different regions, the growth morphology of dendrites changes. There is a marked difference in size. The growth morphology of dendrites at the P1 position is dominated by equiaxed crystals, the dendrite arms are relatively coarse, and there is basically no secondary dendrite arms. At the P2–P4 position, the dendritic growth morphology undergoes a large transformation, and a mixed crystal region with both equiaxed and columnar crystals appears, and the columnar to equiaxed transition (CET) occurs. The closer to the bottom of the molten pool, the smaller the number of equiaxed crystals, so the columnar crystals gradually become the main crystal form, the length of the columnar crystals continues to increase, the overall dendrite becomes more slender, and the development of secondary dendrite arms is more complete. At the tail of the simulated region, there is sufficient space for dendrite growth, making the overall size of the dendrite larger. This is because the number of dendrites is small at the tail of the simulated region, and the solute released by the equiaxed crystal growth can diffuse sufficiently, resulting in the melt in this region not reaching the specified nucleation and supercooling, so too many grains are not formed. At the P5 position, the crystal transformation of the dendrites completely disappears, the whole area becomes dominated by columnar crystals, and a few dendrite tips with three dendrite arms are present. It can be seen that the crystal transformation mainly occurs in the middle and upper part of the molten pool because of the large temperature gradient and small solidification speed at the bottom of the molten pool. As the position shifts upward, the temperature gradient gradually decreases and solidification speed gradually increases, and the temperature gradient and solidification speed can control the occurrence of crystal transformation. When the solidification speed is constant, the temperature gradient is smaller and more favorable crystal transformation occurs. When the temperature gradient is fixed, following an increase in the solidification rate, crystal transformation is more likely to occur.
In order to obtain a clearer understanding of the microstructure and morphology of different regions of the molten pool, the variation trends of the dendrite length, secondary dendrite arm spacing, and tip radius in the above-mentioned regions are analyzed. The results are shown in Figure 10. It can be seen from Figure 10a that during the solidification process, only equiaxed crystals are formed at the upper part of the molten pool, so the length of columnar crystals at the P1 position is zero. The closer the selected area is to the lower part of the molten pool, the more area the columnar crystals occupy, and the columnar length also increases. Figure 10b shows the variation trend of the secondary dendrite arm spacing and tip radius in different regions of the molten pool. From the top to the bottom of the bath (P2–P5), the secondary dendrite arm spacing gradually decreases and tends to be stable, while the tip radius decreases when the position moves upwards. It can be seen that under a larger temperature gradient and smaller solidification speed, the distance between the secondary arms of the dendrite and the tip radius is larger. As the position moves down, the temperature gradient increases gradually, and the upper part of the molten pool has a larger cooling rate, a faster dendrite growth rate, and a smaller radius between the secondary dendrite arms and tip.
The solute segregation phenomenon generated during the solidification process affects the mechanical properties and corrosion resistance of components. In order to obtain a clear understanding of the degree of solute segregation in each position of the molten pool, the changes in the solute, other than the titanium concentration at the vertical columnar crystal position in each region, are selected. The analysis and discussion are carried out, and the results are shown in Figure 11, where (P1–P4) corresponds to the solute concentration changes at (P1–P4) in Figure 9; the horizontal line area in the figure is the columnar crystal region; the wave region represents the equiaxed crystal region; and the peaks and troughs correspond to the interdendritic interstitial and dendrite interior, respectively. The sudden change in the curve represents the concentration change in the solid–liquid interface. During the solidification process, the solute migrates from the solid phase to the liquid phase through a redistribution process, so the solute concentration in the solid phase region is relatively low. It can be found from Figure P1 that there is no stable horizontal line area in the entire region, and the solute concentration in the entire region jumps between the peaks and troughs, which is the solute concentration change in a completely equiaxed state. At the positions of P2~P4, it can be clearly seen that there is a sudden concentration change from the horizontal line area to the fluctuating area, representing the interface position where the equiaxed and columnar crystals are transformed.
Figure 11 (P5, P6) shows the change curve of the solute concentration along the growth direction of the columnar crystal at the position of the yellow solid line and the dotted line in Figure 9 (P5), and the change in solute concentration at the tip of the columnar crystal at the position 11 (P5) shows the growth front. During the solute redistribution process, the solute concentration rises rapidly at the interface through the solid phase and then gently decreases to the equilibrium concentration level. This is mainly because the input cooling rate is large, the dendrite growth rate is fast, and the enriched solute diffusion is not timely. Excessive solute segregation levels can reduce the mechanical properties of the sample. It can be seen from Figure 11 (P6) that the concentration of the liquid phase between adjacent columnar crystals is much greater than the equilibrium concentration level, resulting in a serious segregation phenomenon, and the liquid phase concentration gradually decreases near the growth front. This is mainly because the input cooling rate is large, the columnar crystal growth rate is fast, and the enriched solute is not diffused in time; thus, most of the solute discharged from the dendrite accumulates between the main dendrite and the secondary dendrite arms, forming a relatively severe solute segregation phenomenon, resulting in the enrichment or depletion of alloy elements during solidification, as well as changes in the alloy composition, which in turn affect the solidified structure and affect the mechanical properties of the specimen.

3.3. Comparative Analysis of Experiments

Figure 12a is the cross-section of the single-channel wire laser sample of the TC4 alloy. The figure shows that the structure of the single-channel region is composed of different microscopic regions, including the base material (BM), the heat-affected zone (HAZ), and the deposited columnar grain zone (CG). Figure 12b–d are the simulation results of the local microscopic phase field at different times under the corresponding conditions. It can be seen from the figure that the molten pool formed top-down complete columnar crystals during the solidification process. Moreover, the grain growth tends to be in the direction perpendicular to the solid–liquid interface. Because this direction shows the largest temperature gradient, it has the largest driving force during solidification. Furthermore, during the solidification process, the preferred orientations of the primary dendrites are different, resulting in serious dendrite competitive growth, and only a few dendrites are well developed, which is in good agreement with the experimental results.

4. Conclusions

This study uses the macro molten pool heat transfer model combined with microscopic phase field model to establish a multi-scale model; a simulation of the TC4 alloy wire laser to add material in the manufacturing process, changing the shape of the molten pool and the dendrite morphology evolution; and an analysis of the different laser powers and the effect of laser scanning speed on the molten pool size, temperature distribution, and the influence of local tissue dendrite growth morphology. The main conclusions are as follows:
(1)
With the increase in laser power, the molten pool temperature rises rapidly and the molten pool size expands gradually. When the laser scanning speed increases, the peak temperature and size of the molten pool decrease, and when the laser scanning speed is greater than 5 mm/s, the molten pool length decreases significantly.
(2)
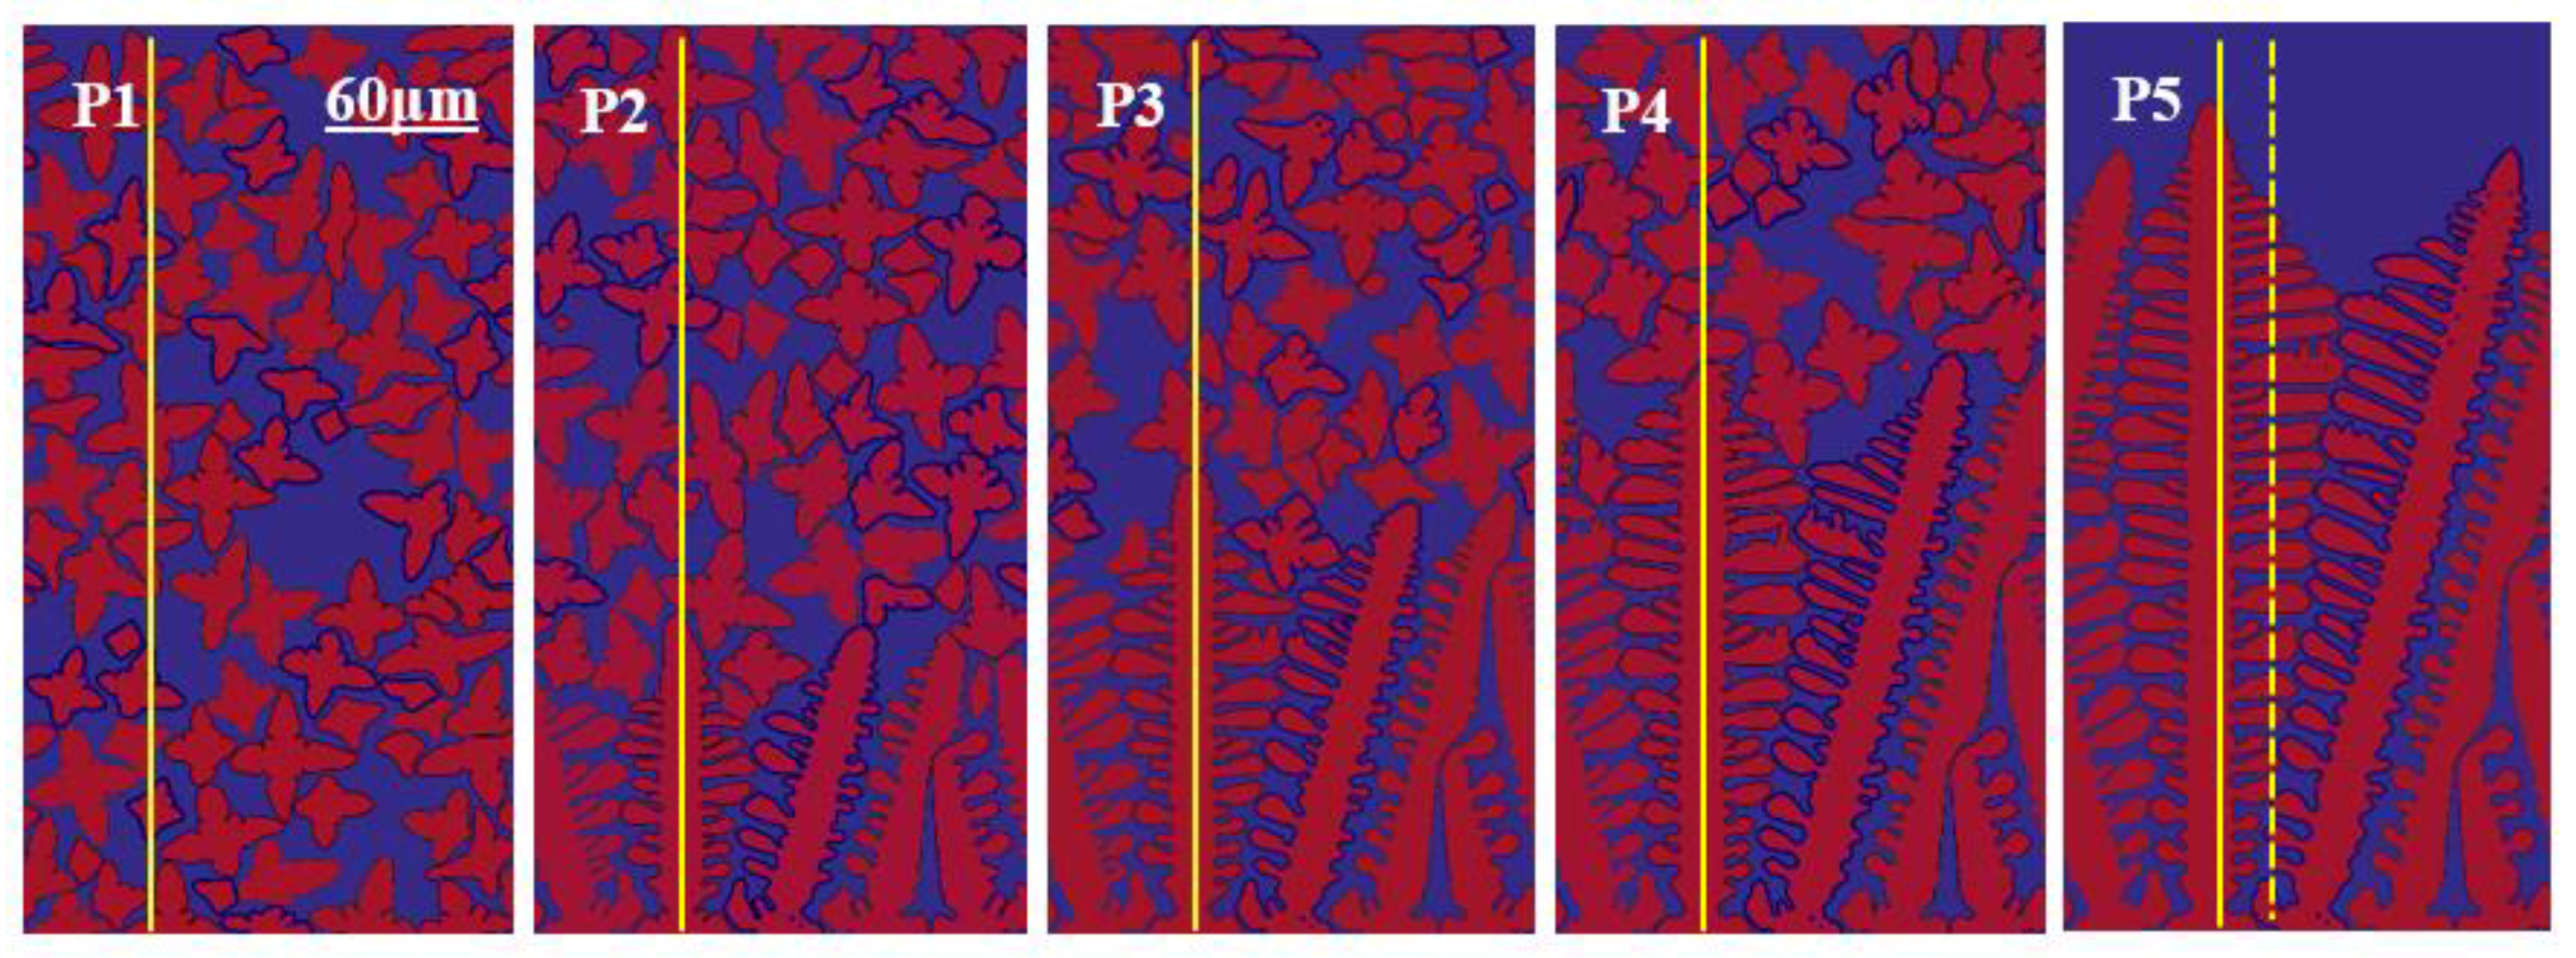
Under the fixed process parameters, the cooling rate at the upper part of the molten pool is smaller, and fine equiaxed crystal structure is formed after solidification. The columnar to equiaxed transition occurs in the middle of the molten pool, and the bottom of the molten pool is elongated as a columnar crystal. In addition, the cooling rate at the bottom of the molten pool is relatively high, the dendrite growth rate is relatively fast, and the solute is mostly concentrated between the primary and secondary dendrite arms due to the delay of solute diffusion, resulting in a more serious solute segregation phenomenon.
(3)
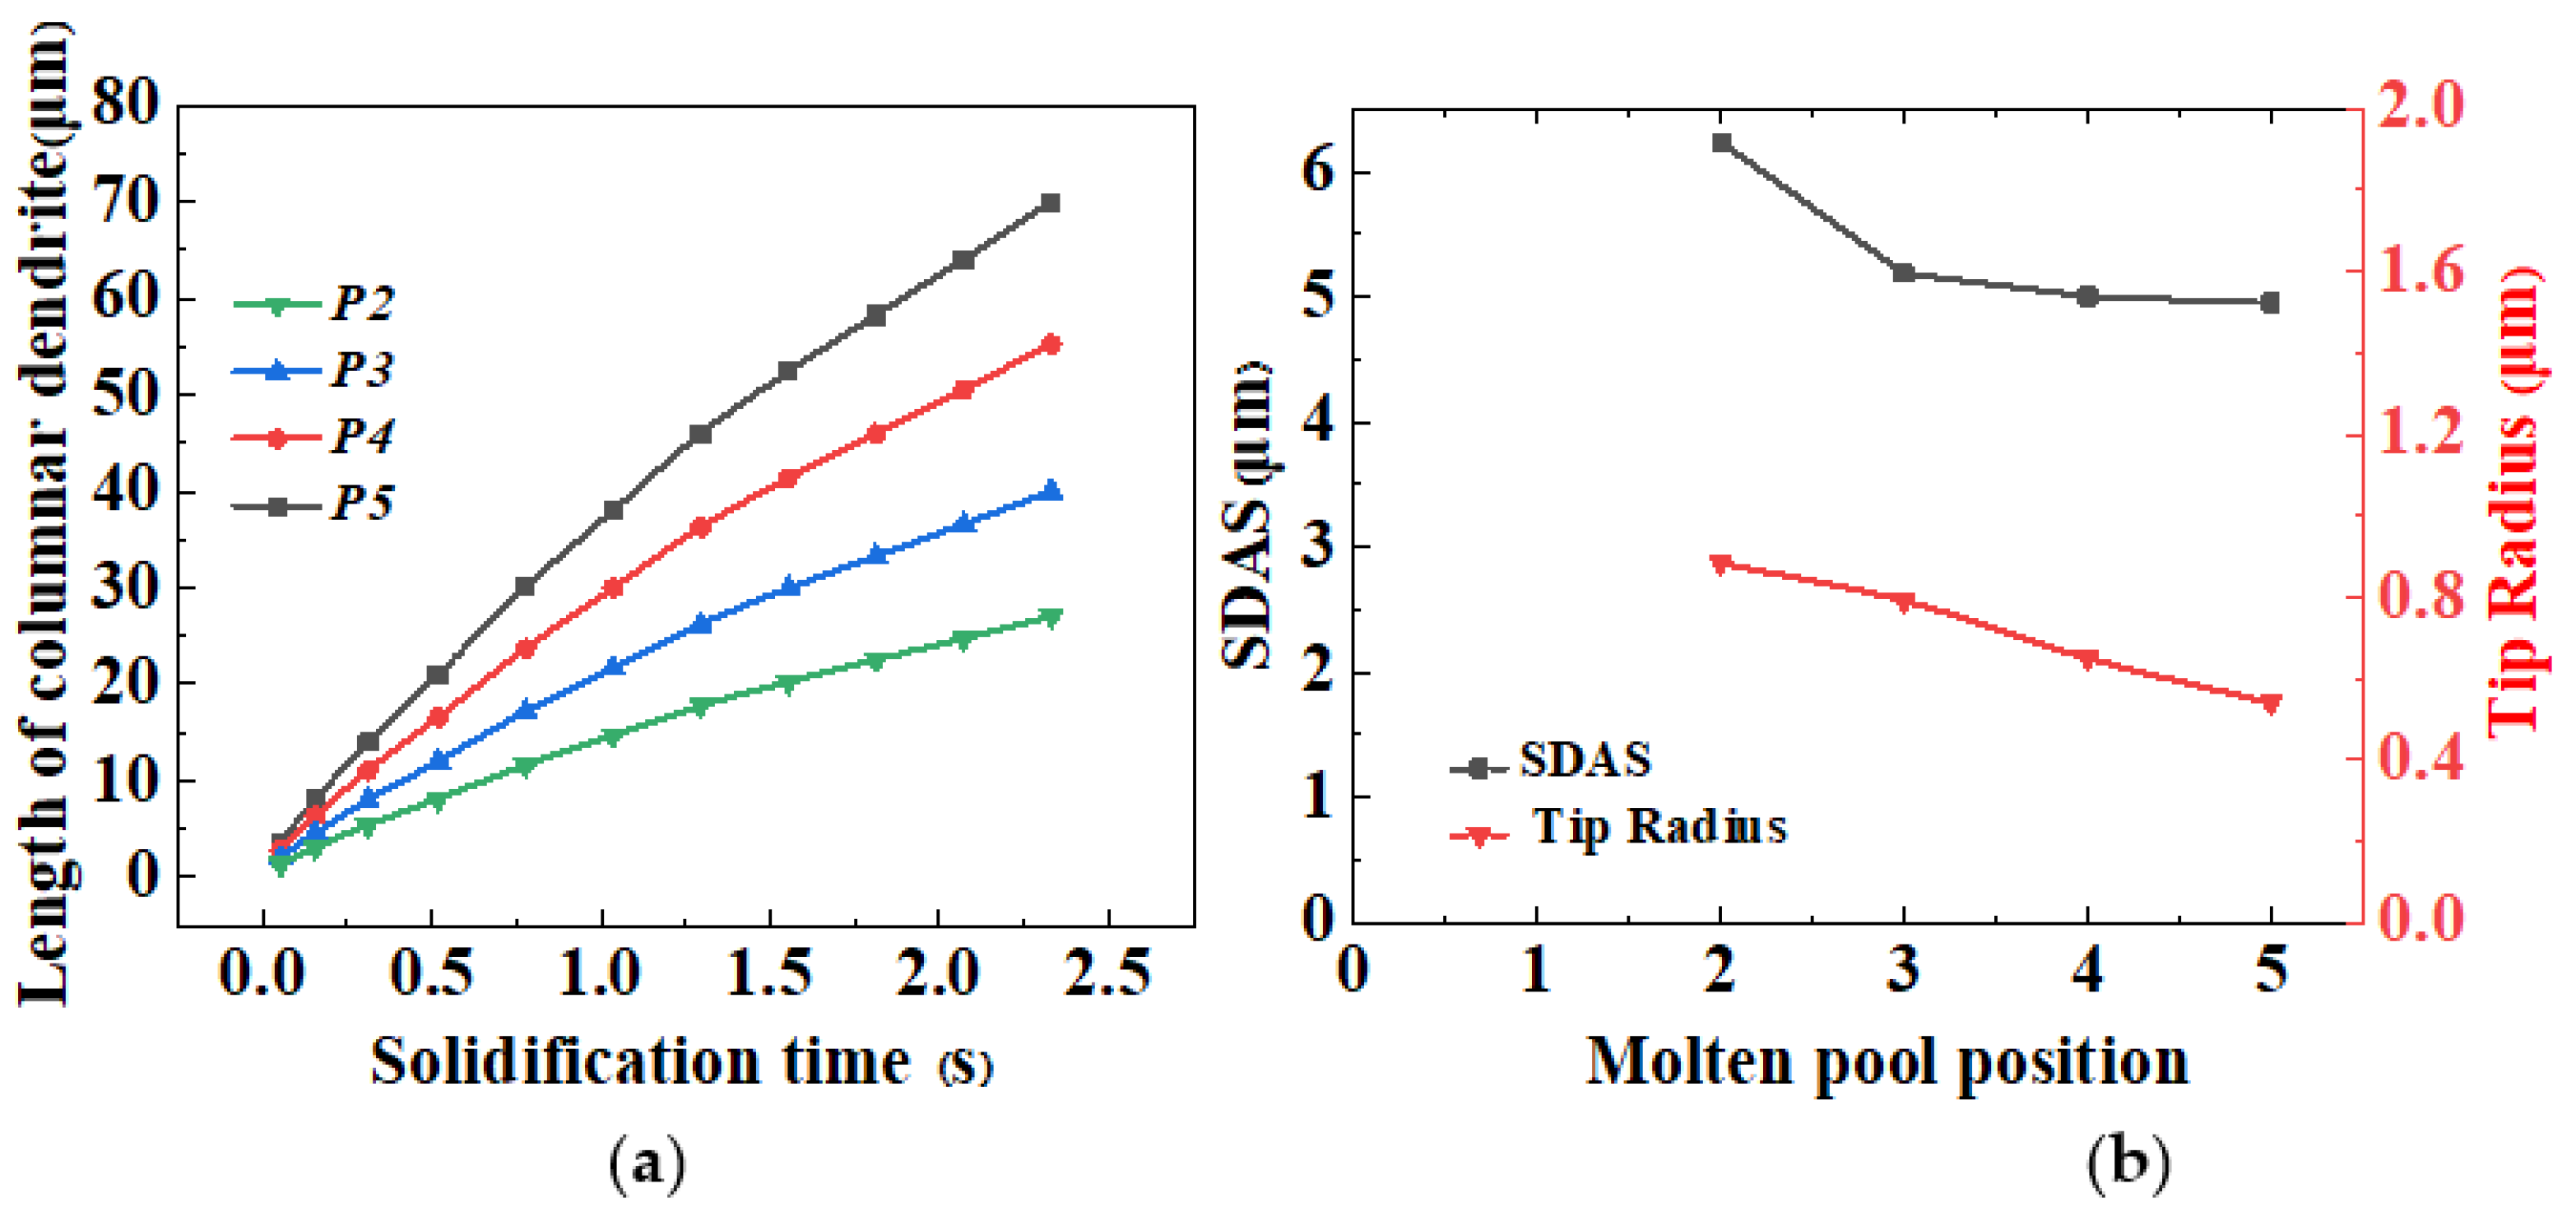
When the laser scanning speed V = 1 mm/s, the position of the solid–liquid interface of columnar dendrites decreases with an increase in laser power, the dendrite arm spacing ranges from 9.83 μm to 14.51 μm, the tip radius ranges from 0.529 μm to 0.650 μm, and the development of secondary dendrites becomes more perfect. At the same time, the dendrites obtained gradually change from long and thin to short, and the average level of columnar crystal spacing increases gradually.
(4)
When the laser power P = 1800 W, the dendrite growth rate increases with an increase in the laser scanning speed. When the liquid–solid interface position is higher, the solid phase volume fraction of columnar dendrites is larger, the tip radius of dendrites is smaller, the dendrite size is finer, the dendrite arrangement becomes more dense, and the development of secondary dendrites is inhibited. When the scan rate is 10 mm/s, the dendrite spacing is almost half of that at 1 mm/s.

Author Contributions

Y.W. and C.C. conceived and designed the experiments; C.C. performed the experiments; C.C., X.L., J.W. and Y.Z. analyzed the data; S.G., W.L. and L.P. contributed to the reagents/materials/analysis tools; and C.C. wrote the paper. All authors have read and agreed to the published version of the manuscript.

Funding

This research was funded by the National Natural Science Foundation’s Youth Science Foundation Project (51901208), the Henan University Key Scientific Research Project (20B430020), the key scientific and technological projects in the Henan Province (202102210016 and 202102210272), and the Zhengzhou University of Light Technology Doctoral Research Initiation Fund (JDG20190098).

Institutional Review Board Statement

Not applicable.

Informed Consent Statement

Not applicable.

Data Availability Statement

The data presented in this study are available on request from the corresponding author. The data are not publicly available due to privacy.

Conflicts of Interest

The authors declare no conflict of interest.

References

  1. Zheng, T.; Song, Q.H.; Du, Y.C.; Liu, Z. Development of Tool Wear Standards and Wear Mechanism for Micro Milling Ti-6Al-4V Alloy. Metals 2021, 12, 726. [Google Scholar] [CrossRef]
  2. Surmeneva, M.; Grubova, I.; Glukhova, N.; Khrapov, D.; Koptyug, A.; Volkova, A.; Ivanov, Y.; Cotrut, C.M.; Vladescu, A.; Teresov, A.; et al. New Ti–35Nb–7Zr–5Ta Alloy Manufacturing by Electron Beam Melting for Medical Application Followed by High Current Pulsed Electron Beam Treatment. Metals 2021, 11, 1066. [Google Scholar] [CrossRef]
  3. Wu, S.Q.; Lu, Y.J.; Gan, Y.L.; Huang, T.T.; Zhao, C.Q.; Lin, J.J.; Guo, S.; Lin, J.X. Microstructural evolution and microhardness of a selective-laser-melted Ti–6Al–4V alloy after post heat treatments. J. Alloys Compd. 2016, 672, 643–652. [Google Scholar] [CrossRef]
  4. Zhuang, Z.; Jing, C.; Hua, T.; Xiaolin, Z.; Weidong, H. Microstructure and mechanical properties of laser repaired TC4 titanium alloy. Trans. Nonferrous Met. Soc. China 2017, 27, 2613–2621. [Google Scholar] [CrossRef] [Green Version]
  5. Ren, Y.M.; Lin, X.; Fu, X.; Tan, H.; Chen, J.; Huang, W.D. Microstructure and deformation behavior of Ti-6Al-4V alloy by high-power laser solid forming. Acta Mater. 2017, 132, 82–95. [Google Scholar] [CrossRef]
  6. Lu, S.L.; Qian, M.; Tang, H.P.; Yan, M.; Wang, J.; StJohn, D.H. Massive transformation in Ti-6Al-4V additively manufactured by selective electron beam melting. Acta Mater. 2016, 104, 303–315. [Google Scholar] [CrossRef]
  7. Xu, W.; Brandt, M.; Sun, S.; Elambasseril, J.; Liu, Q.; Latham, K.; Xia, K.; Qian, M. Additive manufacturing of strong and ductile Ti-6Al-4V by selective laser melting via in situ martensite decomposition. Acta Mater. 2015, 85, 74–84. [Google Scholar] [CrossRef]
  8. Shi, X.Z.; Ma, S.Y.; Liu, C.M.; Wu, Q.; Lu, J.; Liu, Y.; Shi, W. Selective laser melting-wire arc additive manufacturing hybrid fabrication of Ti-6Al-4V alloy: Microstructure and mechanical properties. Mater. Sci. Eng. 2017, 684A, 196–204. [Google Scholar] [CrossRef]
  9. Lin, J.J.; Lv, Y.H.; Liu, Y.X.; Xu, B.S.; Sun, Z.; Li, Z.G.; Wu, Y.X. Microstructural evolution and mechanical properties of Ti-6Al-4V wall deposited by pulsed plasma arc additive manufacturing. Mater. Des. 2016, 102, 30–39. [Google Scholar] [CrossRef]
  10. Donoghue, J.; Antonysamy, A.A.; Martina, F.; Colegrove, P.; Williams, S.; Prangnell, P. The effectiveness of combining rolling deformation with Wire–Arc Additive Manufacture on β-grain refinement and texture modification in Ti-6Al-4V. Mater. Charact. 2016, 114, 103–114. [Google Scholar] [CrossRef]
  11. DebRoy, T.; Wei, H.L.; Zuback, J.S.; Mukherjee, T.; Elmer, J.W.; Milewski, J.O.; Beese, A.M.; Wilson-Heid, A.; De, A.; Zhang, W. Additive manufacturing of metallic components—Process, structure and properties. Prog. Mater. Sci. 2018, 92, 112–224. [Google Scholar] [CrossRef]
  12. Mahyar, K.; Ghasemi, A.; Rolfe, B.; Gibson, I. Additive manufacturing a powerful tool for the aerospace industry. Rapid Prototyp. J. 2022, 28, 87–100. [Google Scholar]
  13. Oliveira, J.P.; Santos, T.G.; Miranda, R.M. Revisiting fundamental welding concepts to improve additive manufacturing: From theory to practice. Prog. Mater. Sci. 2020, 107, 100590. [Google Scholar] [CrossRef]
  14. Akbari, M.; Kovacevic, R. An investigation on mechanical and microstructural properties of 316LSi parts fabricated by a robotized laser/wire direct metal deposition system. Addit. Manuf. 2018, 23, 487–497. [Google Scholar] [CrossRef]
  15. Günther, J.; Krewerth, D.; Lippmann, T.; Leuders, S.; Tröster, T.; Weidner, A.; Biermann, H.; Niendorf, T. Fatigue life of additively manufactured Ti-6Al-4V in the very high cycle fatigue regime. Int. J. Fatigue 2017, 94, 236–245. [Google Scholar] [CrossRef]
  16. Fatemi, A.; Molaei, R.; Simsiriwong, J.; Sanaei, N.; Pegues, J.; Torries, B.; Phan, N.; Shamsaei, N. Fatigue behaviour of additive manufactured materials: An overview of some recent experimental studies onTi-6Al-4V considering various processing and loading direction effects. Fatigue Fract. Eng. Mater. Struct. 2019, 42, 991–1009. [Google Scholar] [CrossRef]
  17. Zhang, D.; Qiu, D.; Gibson, M.A.; Zheng, Y.; Fraser, H.L.; StJohn, D.H.; Easton, M.A. Additive manufacturing of ultrafine-grained high-strength titanium alloys. Nature 2019, 576, 91–95. [Google Scholar] [CrossRef]
  18. Xu, W.; Lui, E.W.; Pateras, A.; Qian, M.; Brandt, M. In situ tailoring microstructure in additively manufactured Ti-6Al-4V for superior mechanical performance. Acta Mater. 2017, 125, 390–400. [Google Scholar] [CrossRef]
  19. Zhao, C.; Fezzaa, K.; Cunningham, R.W.; Wen, H.; De Carlo, F.; Chen, L.; Rollett, A.D.; Sun, T. Real-time monitoring of laser powder bed fusion process using high-speed X-ray imaging and diffraction. Sci. Rep. 2017, 7, 3602–3614. [Google Scholar] [CrossRef]
  20. Leung, C.L.A.; Marussi, S.; Atwood, R.C.; Towrie, M.; Withers, P.J.; Lee, P.D. In situ X-ray imaging of defect and molten pool dynamics in laser additive manufacturing. Nat. Commun. 2018, 9, 1355–1364. [Google Scholar] [CrossRef] [Green Version]
  21. Enneti, R.; Morgan, R.; Atre, S. Effect of process parameters on the selective laser melting (SLM) of tungsten. Int. J. Refract. Met. Hard Mater. 2018, 71, 315–319. [Google Scholar] [CrossRef]
  22. Peyre, P.; Rouchausse, Y.; Defauchy, D.; Régnier, G. Expermental and numerical analysis of the selective laser sintering (SLS) of PA12 and PEKK semi-crystalline polymers. J. Mater. Process. Technol. 2015, 225, 326–336. [Google Scholar] [CrossRef]
  23. Singh, S.; Sharma, V.S.; Sachdeva, A. Optimization and analysis of shrinkage in selective laser sintered polyamide parts. Mater. Manuf. Process. 2012, 27, 707–714. [Google Scholar] [CrossRef]
  24. Almangour, B.; Grzesiak, D.; Borkar, T.; Yang, J.-M. Densification behavior, microstructural evolution, and mechanical properties of TiC/316L stainless steel nanocomposites fabricated by selective laser melting. Mater. Des. 2018, 138, 119–128. [Google Scholar] [CrossRef]
  25. Kolleck, R.; Vollmer, R.; Veit, R. Investigation of a combined micro-forming and punching process for the realization of tight geometrical tolerances of conically formed hole patterns. CIRP Ann. Manuf. Technol. 2011, 60, 331–334. [Google Scholar] [CrossRef]
  26. Zhu, Z.; Dhokia, V.G.; Nassehi, A.; Newman, S.T. A review of hybrid manufacturing processes—State of the art and future perspectives. Int. J. Comput. Integr. Manuf. 2013, 26, 596–615. [Google Scholar] [CrossRef] [Green Version]
  27. Francois, M.M.; Sun, A.; King, W.E.; Henson, N.; Tourret, D.; Bronkhorst, C.; Carlson, N.; Newman, C.; Haut, T.; Bakosi, J.; et al. Modeling of additive manufacturing processes for metals: Challenges and opportunities. Curr. Opin. Solid State Mater. Sci. 2017, 21, 198–206. [Google Scholar] [CrossRef]
  28. Harrison, N.J.; Todd, I.; Mumtaz, K. Reduction of micro-cracking in nickel super alloys processed by selective laser melting: A fundamental alloy design approach. Acta Mater. 2015, 94, 59–68. [Google Scholar] [CrossRef] [Green Version]
  29. Wang, Y.B.; Wei, M.M.; Chen, C.; Wu, Y.; Peng, L.; Chen, L.-Q. Phase-field study of the effects of the multi-controlling parameters on columnar dendrite during directional solidification in hexagonal materials. Eur. Phys. J. E 2020, 43, 41. [Google Scholar] [CrossRef]
  30. Wang, Y.B.; Jia, S.S.; Wei, M.G.; Peng, L.; Wu, Y.; Ji, Y.; Chen, L.-Q.; Liu, X. Coupling in situ synchrotron X-ray radiography and phase-field simulation to study the effect of low cooling rates on dendrite morphology during directional solidification in Mg-Gd alloys. J. Alloys Compd. 2020, 815, 152385. [Google Scholar] [CrossRef]
  31. Tourret, D.; Clarke, A.; Imhoff, S.; Gibbs, P.J.; Gibbs, J.W.; Karma, A. Three-dimensional multiscale modeling of dendritic spacing selection during Al-Si directional solidification. JOM 2015, 67, 1776–1785. [Google Scholar] [CrossRef]
  32. Steinbach, I.; Beckermann, C.; Kauerauf, B.; Li, Q.; Guo, J. Three-dimensional modeling of equiaxed dendritic growth on a mesoscopic scale. Acta Mater. 1999, 47, 971–982. [Google Scholar] [CrossRef]
  33. Shang, S.; Han, Z.; Sun, W.; Luo, A.A. A phase field model coupled with pressure-effect-embedded thermodynamic modeling for describing microstructure and microsegregation in pressurized solidification of a ternary magnesium alloy. Comput. Mater. Sci. 2017, 136, 264–270. [Google Scholar] [CrossRef]
  34. Pan, H.; Han, Z.; Liu, B. Study on Dendritic Growth in Pressurized Solidification of Mg–Al Alloy Using Phase Field Simulation. J. Mater. Sci. Technol. 2016, 32, 68–75. [Google Scholar] [CrossRef]
  35. Yang, M.; Xiong, S.; Guo, Z. Effect of different solute additions on dendrite morphology and orientation selection in cast binary magnesium alloys. Acta Mater. 2016, 112, 261–272. [Google Scholar] [CrossRef]
  36. Elsheikh, A.H.; Shanmugan, S.; Muthuramalingam, T.; Kumar, R.; Essa, F.A.; Ibrahim, A.M.M. Modeling of the Transient Temperature Field during Laser Heating. Lasers Manuf. Mater. Process. 2021, 8, 97–112. [Google Scholar] [CrossRef]
  37. Khoshaim, A.B.; Elsheikh, A.H.; Moustafa, E.B.; Basha, M.; Showaib, E.A. Experimental investigation on laser cutting of PMMA sheets: Effects of process factors on kerf characteristics. J. Mater. Res. Technol. 2021, 11, 235–246. [Google Scholar] [CrossRef]
  38. Elsheikh, A.H.; Shehabeldeen, T.A.; Zhou, J.; Showaib, E.; Elaziz, M.A. Prediction of laser cutting parameters for polymethylmethacrylate sheets using random vector functional link network integrated with equilibrium optimizer. J. Intell. Manuf. 2021, 32, 1377–1388. [Google Scholar] [CrossRef]
  39. Elsheikh, A.H.; Deng, W.; Showaib, E.A. Improving laser cutting quality of polymethylmethacrylate sheet: Experimental investigation and optimization. J. Mater. Res. Technol. 2020, 9, 1325–1339. [Google Scholar] [CrossRef]
  40. Muthuramalin, T.; Akash, R.; Krishnan, S.; Phan, N.H.; Pi, V.N.; Elsheikh, A.H. Surface quality measures analysis and optimization on machining titanium alloy using CO 2 based laser beam drilling process. J. Manuf. Process. 2021, 62, 1–6. [Google Scholar] [CrossRef]
  41. Zhou, H.Y.; Wu, C.H.; Tang, D.Y.; Shi, X.L.; Xue, Y.; Huang, Q.; Zhang, J.; Elsheikh, A.H.; Ibrahim, A.M.M. Tribological performance of gradient Ag-multilayer graphene/TC4 alloy self-lubricating composites prepared by laser additive manufacturing. Tribol. Trans. 2021, 64, 819–829. [Google Scholar] [CrossRef]
  42. Giganto, S.; Martínez-Pellitero, S.; Cuesta, E.; Zapico, P.; Barreiro, J. Proposal of design rules for improving the accuracy of selective laser melting (SLM) manufacturing using benchmarks parts. Rapid Prototyp. J. 2021, 28, 1129–1143. [Google Scholar] [CrossRef]
  43. Zhou, Y.; Abbara, E.M.; Jiang, D.; Azizi, A.; Poliks, M.D.; Ning, F. High-cycle fatigue properties of curved-surface AlSi10Mg parts fabricated by powder bed fusion additive manufacturing. Rapid Prototyp. J. 2021, 1–15. [Google Scholar] [CrossRef]
  44. Linares, J.M.; Chaves-Jacob, J.; Lopez, Q. Fatigue life optimization for 17-4Ph steel produced by selective laser melting. Rapid Prototyp. J. 2022, 28, 1182–1192. [Google Scholar] [CrossRef]
  45. Sahoo, S.; Chou, K. Phase-field simulation of microstructure evolution of Ti–6Al–4V in electron beam additive manufacturing process. Addit. Manuf. 2016, 9, 14–24. [Google Scholar] [CrossRef]
  46. Xiao, W.; Li, S.; Wang, C.; Shi, Y.; Mazumder, J.; Xing, H.; Song, L. Multi-scale simulation of dendrite growth for direct energy deposition of nickel-based super alloys. Mater. Des. 2018, 164, 107553. [Google Scholar] [CrossRef]
  47. Yao, X.X.; Ge, P.; Li, J.Y.; Wang, Y.; Li, T.; Liu, W.; Zhang, Z. Controlling the solidification process parameters of direct energy deposition additive manufacturing considering laser and powder properties. Comput. Mater. Sci. 2020, 182, 109788. [Google Scholar] [CrossRef]
  48. Sammons, P.M.; Bristow, D.A.; Landers, R.G. Height Dependent Laser Metal Deposition Process Modeling. ASME/ISCIE 2013, 135, 054501. [Google Scholar] [CrossRef]
  49. Wang, Q.; Li, J.; Gouge, M.; Nassar, A.R.; Michaleris, P.; Reutzel, E. Physics-Based Multivariable Modeling and Feedback Linearization Control of Melt-Pool Geometry and Temperature in Directed Energy Deposition. J. Eng. Ind. 2017, 139, 021013. [Google Scholar] [CrossRef]
  50. Yuan, X.; Chen, N.G.X.; Wang, X.; Guo, X. Simulation Research on Temperature Field of IN 625 Alloy by Micro-arc Plasma Additive Manufacturing Using Gaussian Heat Source. IOP Conf. Ser. Earth Environ. Sci. 2021, 692, 022060. [Google Scholar] [CrossRef]
  51. Zhou, Q.Y. Study on Calculation Methods of Transient Temperature Field during Selective Laser Melting. Ph.D. Thesis, Harbin Engineering University, Harbin, China, 2017. [Google Scholar]
  52. Echebarria, B.; Folch, R.; Karma, A.; Plapp, M. Quantitative phase-field model of alloy solidification. Phys. Rev. E 2004, 70, 061604. [Google Scholar] [CrossRef] [PubMed] [Green Version]
  53. Liu, D.; Wang, Y. Mesoscale multi-physics simulation of rapid solidification of Ti-6Al-4V alloy. Addit. Manuf. 2019, 25, 551–562. [Google Scholar] [CrossRef]
Figure 1. (a) Wire laser additive manufacturing system [13] and (b) schematic diagram.
Metals 12 00934 g001
Figure 2. Heat source model and preliminary simulation results. (a) Gaussian heat density distribution, (b) t = 3 s, (c) t = 6 s, (d) t = 9 s.
Metals 12 00934 g002
Figure 3. Schematic diagram of macro-micro coupling. (a) Molten pool model, (b) Molten pool temperature distribution, (c) Micro dendrite structure.
Metals 12 00934 g003
Figure 4. (a) Influence of laser power on molten pool morphology; (b) influence of laser power on peak temperature.
Metals 12 00934 g004
Figure 5. Analysis of dendrite morphology under different laser powers. (a) P = 1000 W, (b) P = 1200 W, (c) P = 1400 W, (d) P = 1600 W, (e) P = 1800 W, (f) Effect of laser power on dendrite arm spacing and tip radius.
Metals 12 00934 g005
Figure 6. (a) Influence of laser moving speed on the molten pool morphology; (b) influence of laser moving speed on the peak temperature.
Metals 12 00934 g006
Figure 7. Dendrite morphology analysis at different laser scanning rates. (a) V = 1 mm/s, (b) V = 5 mm/s, (c) V = 10 mm/s, (d) V = 20 mm/s, (e) V = 30 mm/s, (f) Influence of scan speed on dendrite arm spacing and tip radius.
Metals 12 00934 g007
Figure 8. Temperature curves of molten pool at different positions over time. (a) Molten pool temperature distribution, (b) Variation trend of temperature in different positions of molten pool.
Metals 12 00934 g008
Figure 9. Dendrite growth morphology at different locations of molten pool.
Metals 12 00934 g009
Figure 10. (a) Length of columnar dendrites and (b) secondary dendrite arm spacing and tip radius in different positions of the molten pool.
Metals 12 00934 g010
Figure 11. Variation of concentration on the axis of vertical columnar crystal at different positions.
Metals 12 00934 g011
Figure 12. Comparison between the cross section of the single-channel machining experiment and the simulated dendrite morphology. (a) Wire Laser single-channel microstructure, (b) t = 0.0018 s, (c) 0.003 s, (d) 0.0046 s.
Metals 12 00934 g012
Table 1. Chemical composition of the TC4 titanium alloy.
Alloy ElementImpurities not Greater Than
AlVTiFeCNHOOthers
5.5–6.83.5–4.5margin0.300.100.050.0150.200.40
Table 2. Thermal physical properties of materials [51].
Temperature
/°C
Specific Heat
/(J/(kg·°C))
Thermal Conductivity
/(W/(m·°C))
Density
/(g/cm3)
206116.84.51
1006247.44.42
2006538.74.38
3006749.84.32
50070311.84.28
1000103015.24.24
1500185022.14.19
2500185222.23.92
Table 3. Physical parameters of the main TC4 alloys used in the simulation [52].
SymbolValueUnit
Tl1928K
Ts1878K
c010wt.%
k0.5-
DL9.5 × 10−9m2 s−1
Γ1.88 × 10⁻⁷K·m
mL0.5K·wt.%−1
ε0.05-
Publisher’s Note: MDPI stays neutral with regard to jurisdictional claims in published maps and institutional affiliations.

