
Simplified Elastoplastic Fatigue Correction Factor Analysis Approach Based on Minimum Conservative Margin


Abstract
:1. Introduction
2. Analysis Method of Ke
2.1. Ke in ASME and RCC-M
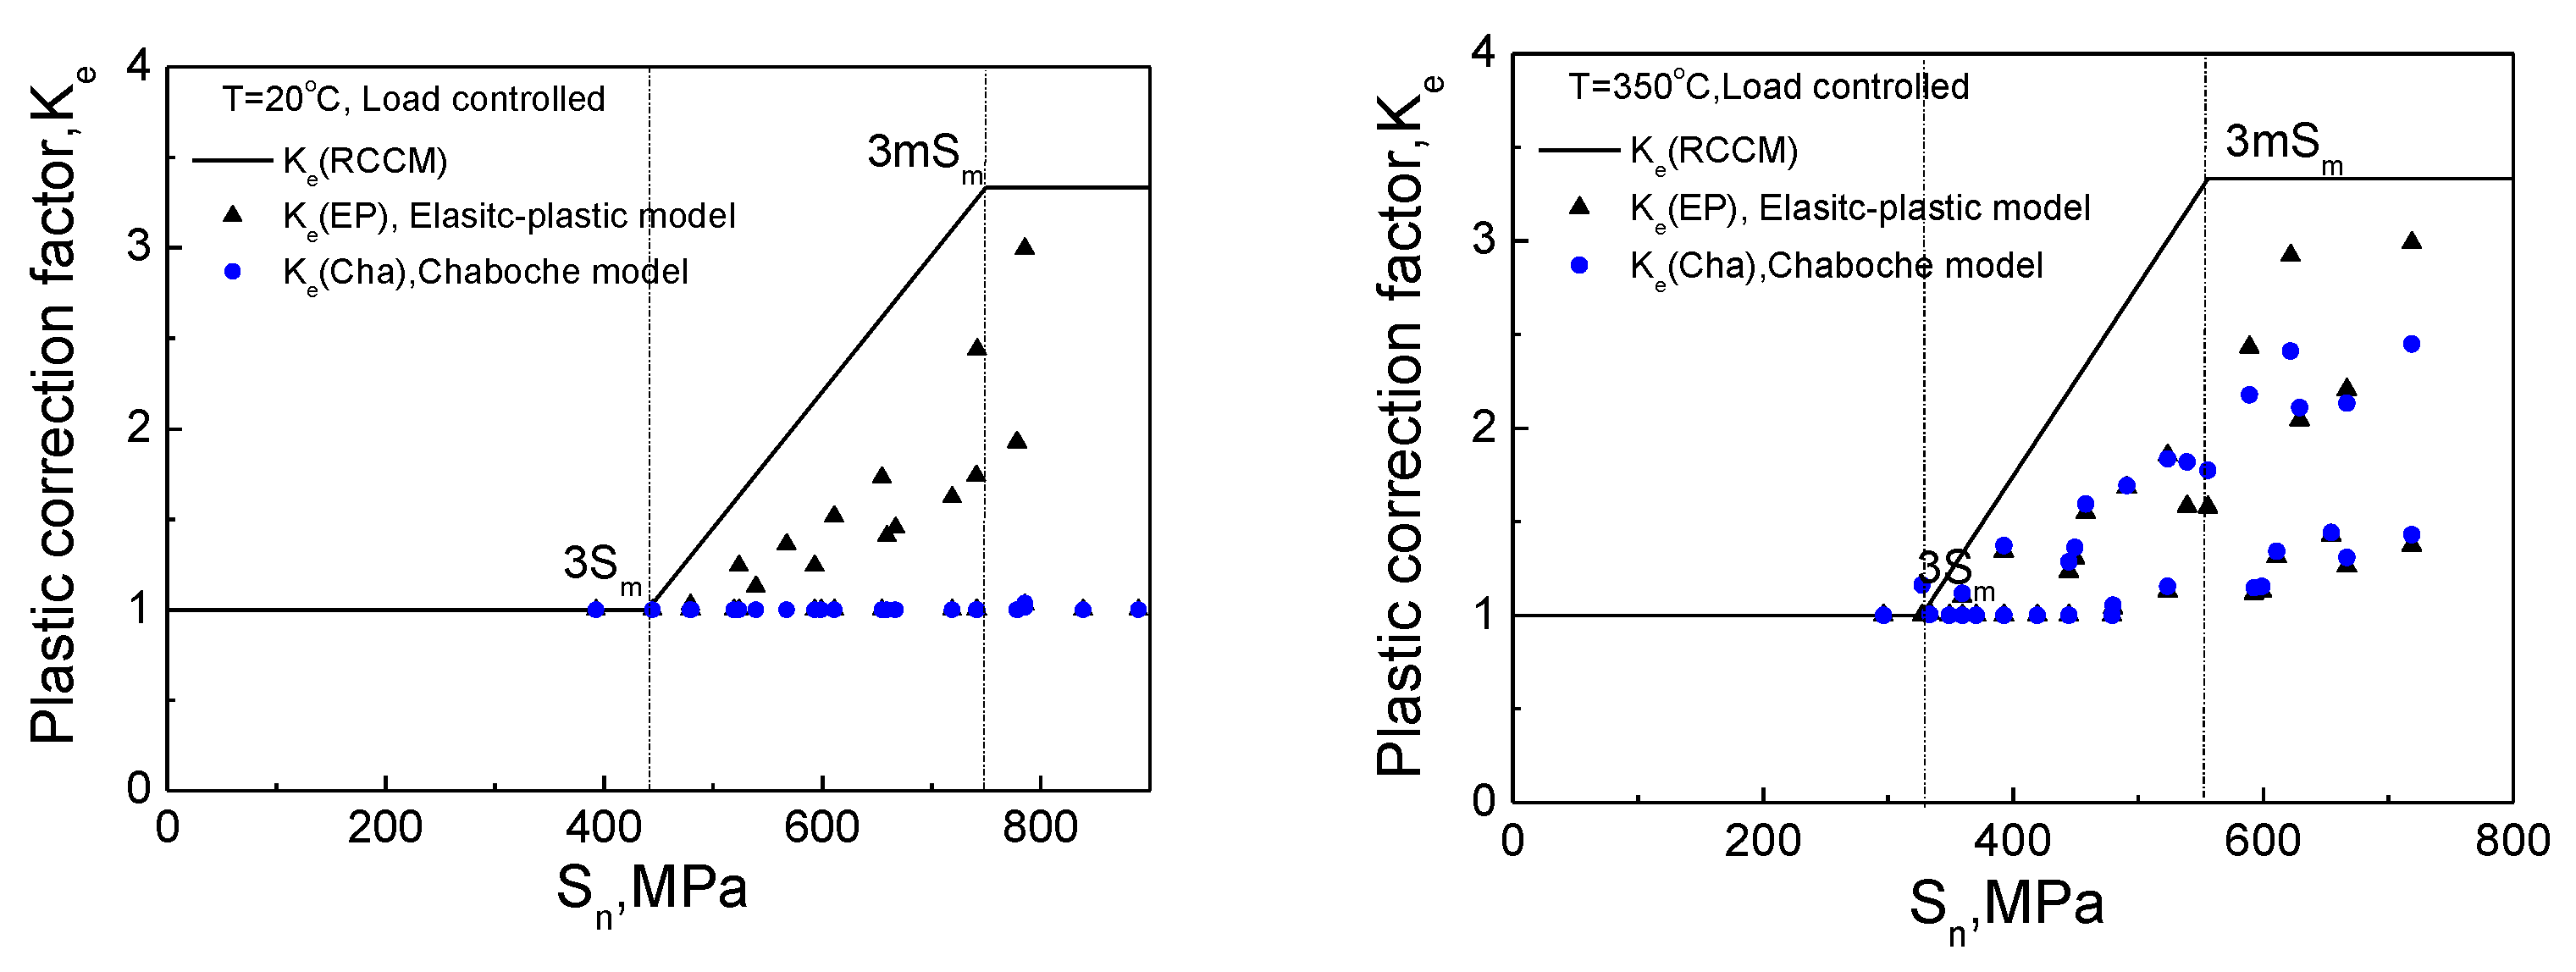
2.2. Numerical Method for Determining Ke Parameters
- (1)
- Influence of material strength and constitutive model
- (2)
- Load effect
- (a)
- Load type: thermal load; mechanical load; mixed load (thermal load plus mechanical load)
- (b)
- Loading control mode: stress control and displacement control
- (c)
- Temperature: two typical temperatures (T = 30 °C and T = 350 °C)
- (3)
- Geometry
- (4)
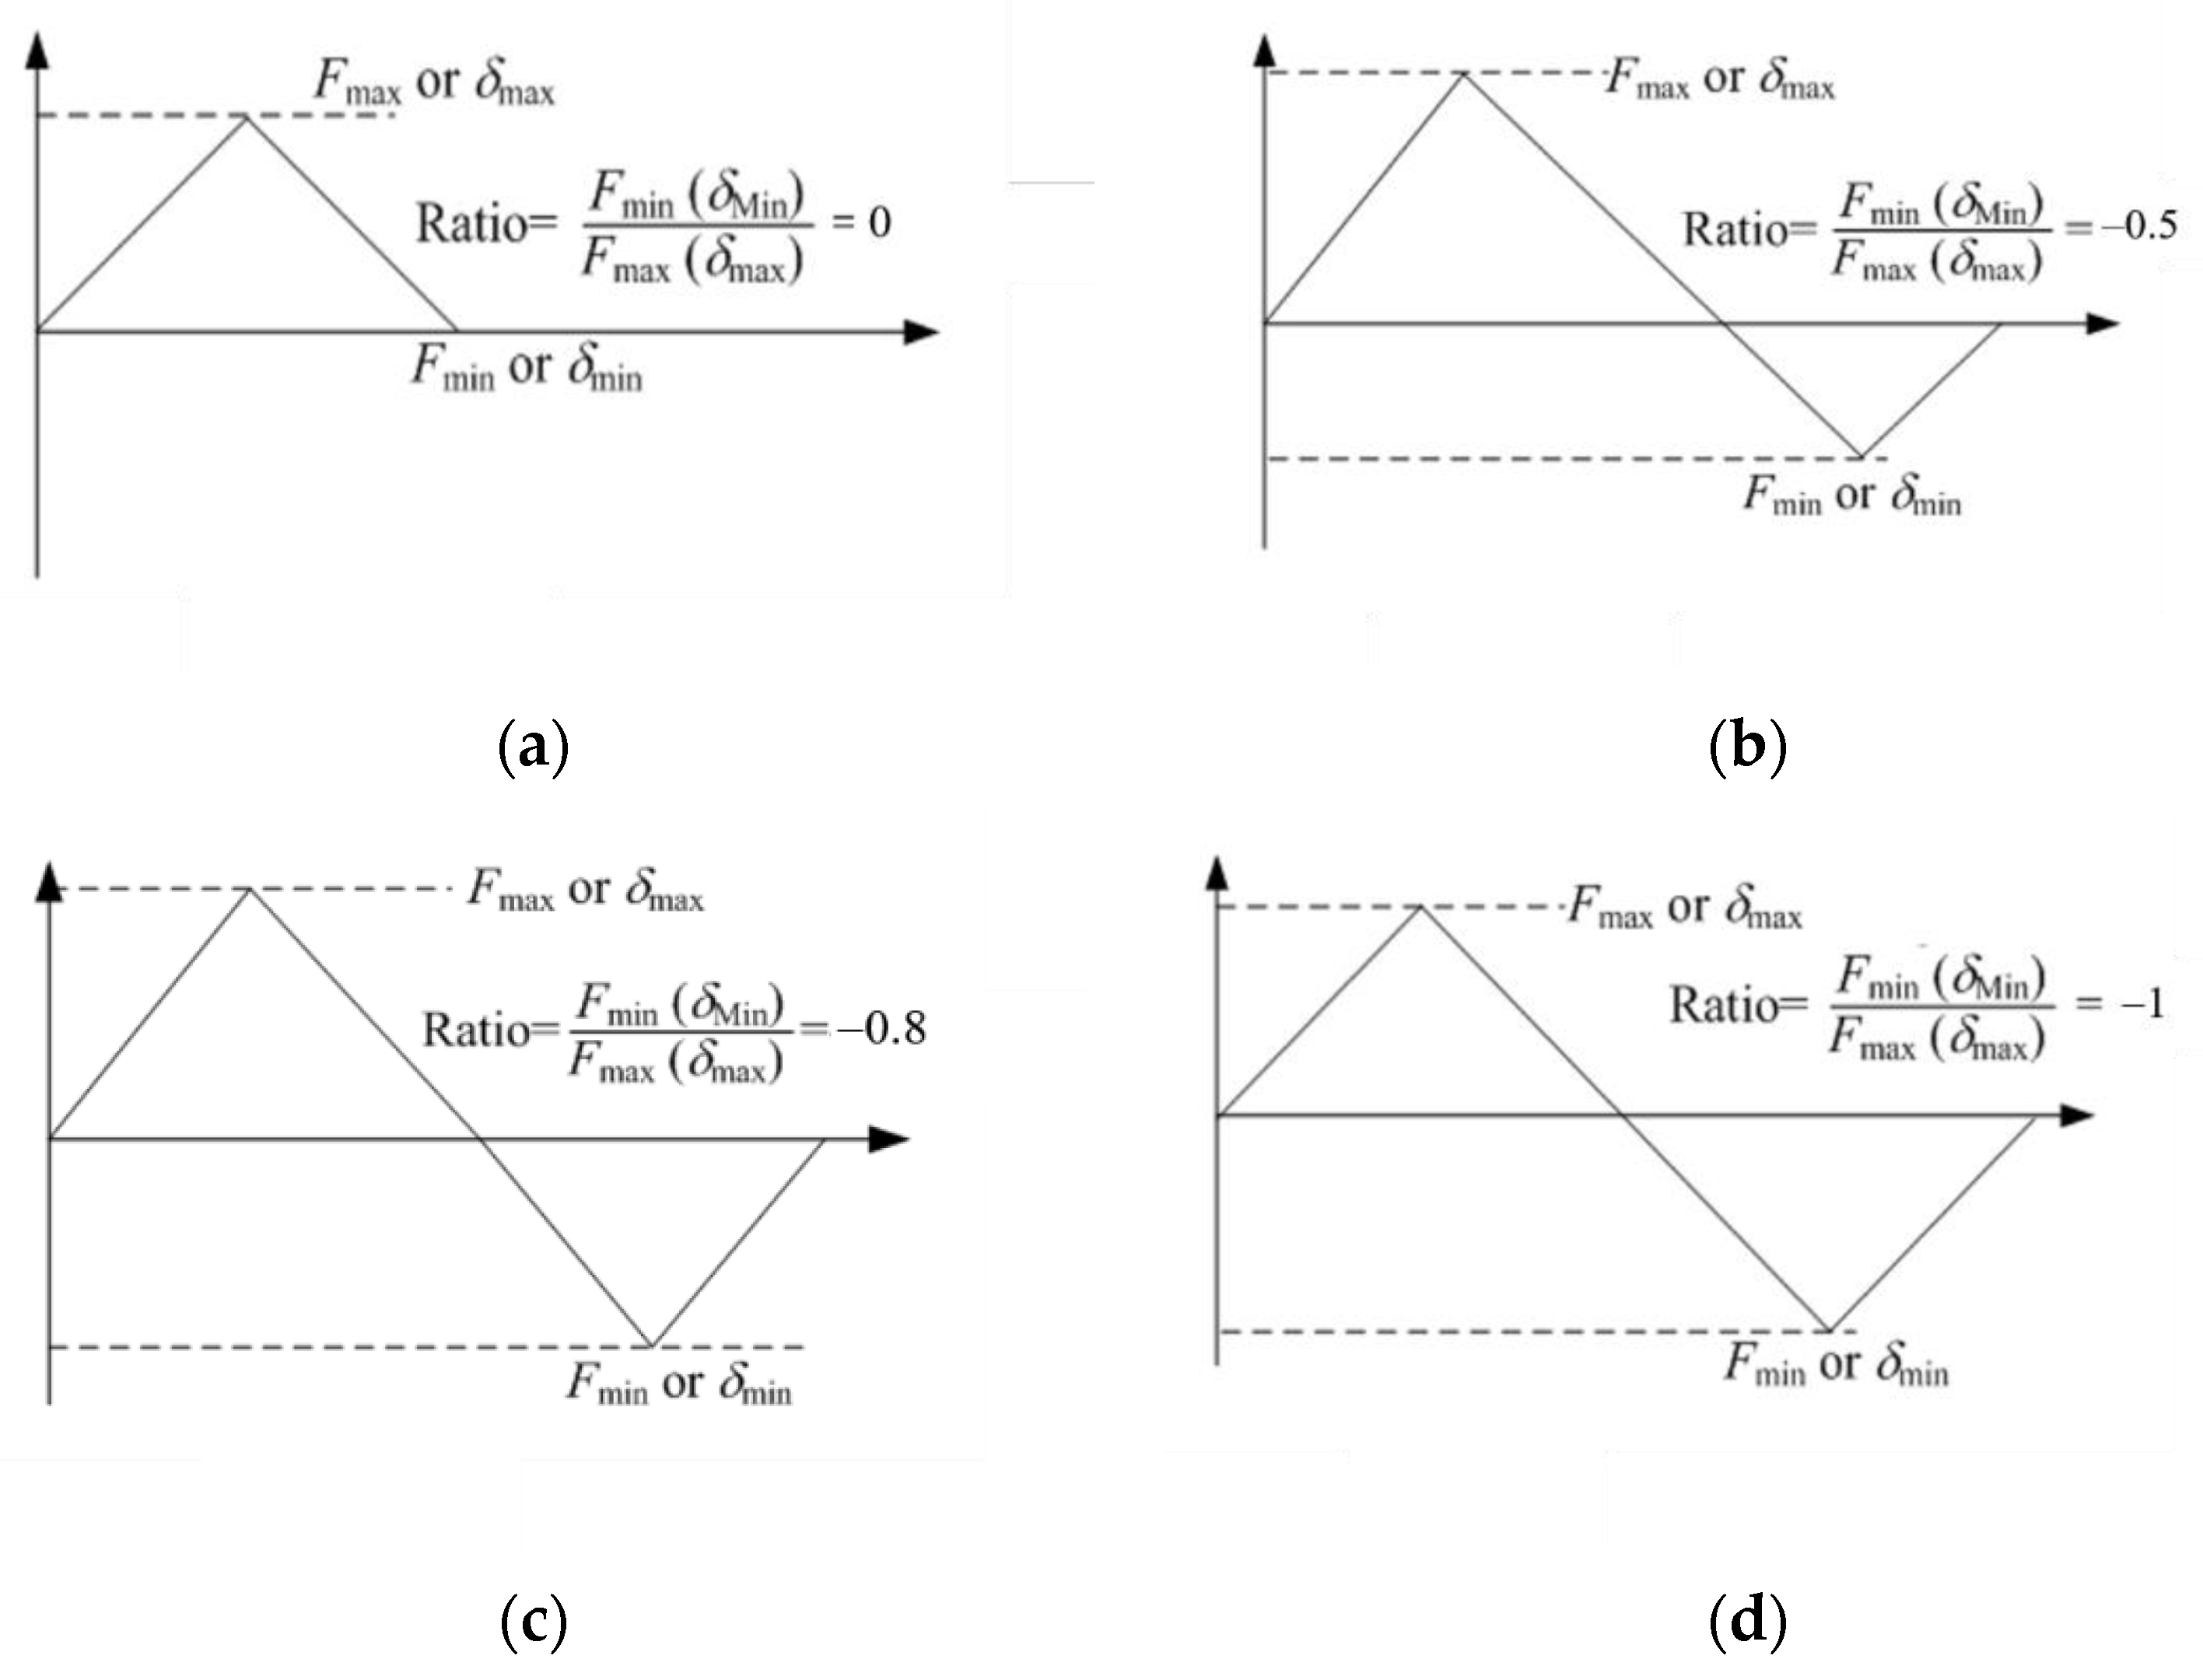
- Loading waveform (Ratio)

| Node | P (MPa) | Sn (MPa) | Sp (Therm) | Sp (Mech) | Δee (%) | Δep (%) | Ke (EP) | Ke (Therm) | Ke (Mech) | Ke (Mixed) | η (%) |
|---|---|---|---|---|---|---|---|---|---|---|---|
| 1576 | −30/0 | 609.5 | 1073.9 | 120.0 | 0.55 | 0.89 | 1.62 | 1.59 | 3.33 | 1.77 | 19.58 |
| −38/0 | 616.1 | 1073.9 | 152.0 | 0.56 | 0.93 | 1.66 | 1.59 | 3.33 | 1.81 | 17.96 | |
| −60/0 | 646.0 | 1073.9 | 200.0 | 0.58 | 0.98 | 1.69 | 1.60 | 3.33 | 1.88 | 21.33 | |
| −70/0 | 720.1 | 1073.9 | 280.0 | 0.61 | 1.08 | 1.76 | 1.63 | 3.33 | 1.98 | 22.20 | |
| −80/0 | 775.7 | 1073.9 | 340.0 | 0.64 | 1.25 | 1.94 | 1.64 | 3.33 | 2.05 | 10.02 | |
| 298 | −30/0 | 655.0 | 1088.8 | 120.6 | 0.56 | 0.91 | 1.62 | 1.61 | 3.33 | 1.78 | 20.87 |
| −38/0 | 661.3 | 1088.8 | 152.7 | 0.56 | 0.94 | 1.67 | 1.61 | 3.33 | 1.82 | 18.96 | |
| −60/0 | 675.4 | 1088.8 | 200.9 | 0.58 | 0.99 | 1.70 | 1.61 | 3.33 | 1.88 | 20.02 | |
| −70/0 | 749.9 | 1088.8 | 281.3 | 0.62 | 1.10 | 1.78 | 1.63 | 3.33 | 1.98 | 20.75 | |
| −85/0 | 805.9 | 1088.8 | 341.6 | 0.65 | 1.27 | 1.97 | 1.65 | 3.33 | 2.05 | 7.66 |
3. Experiments and Constitutive Model
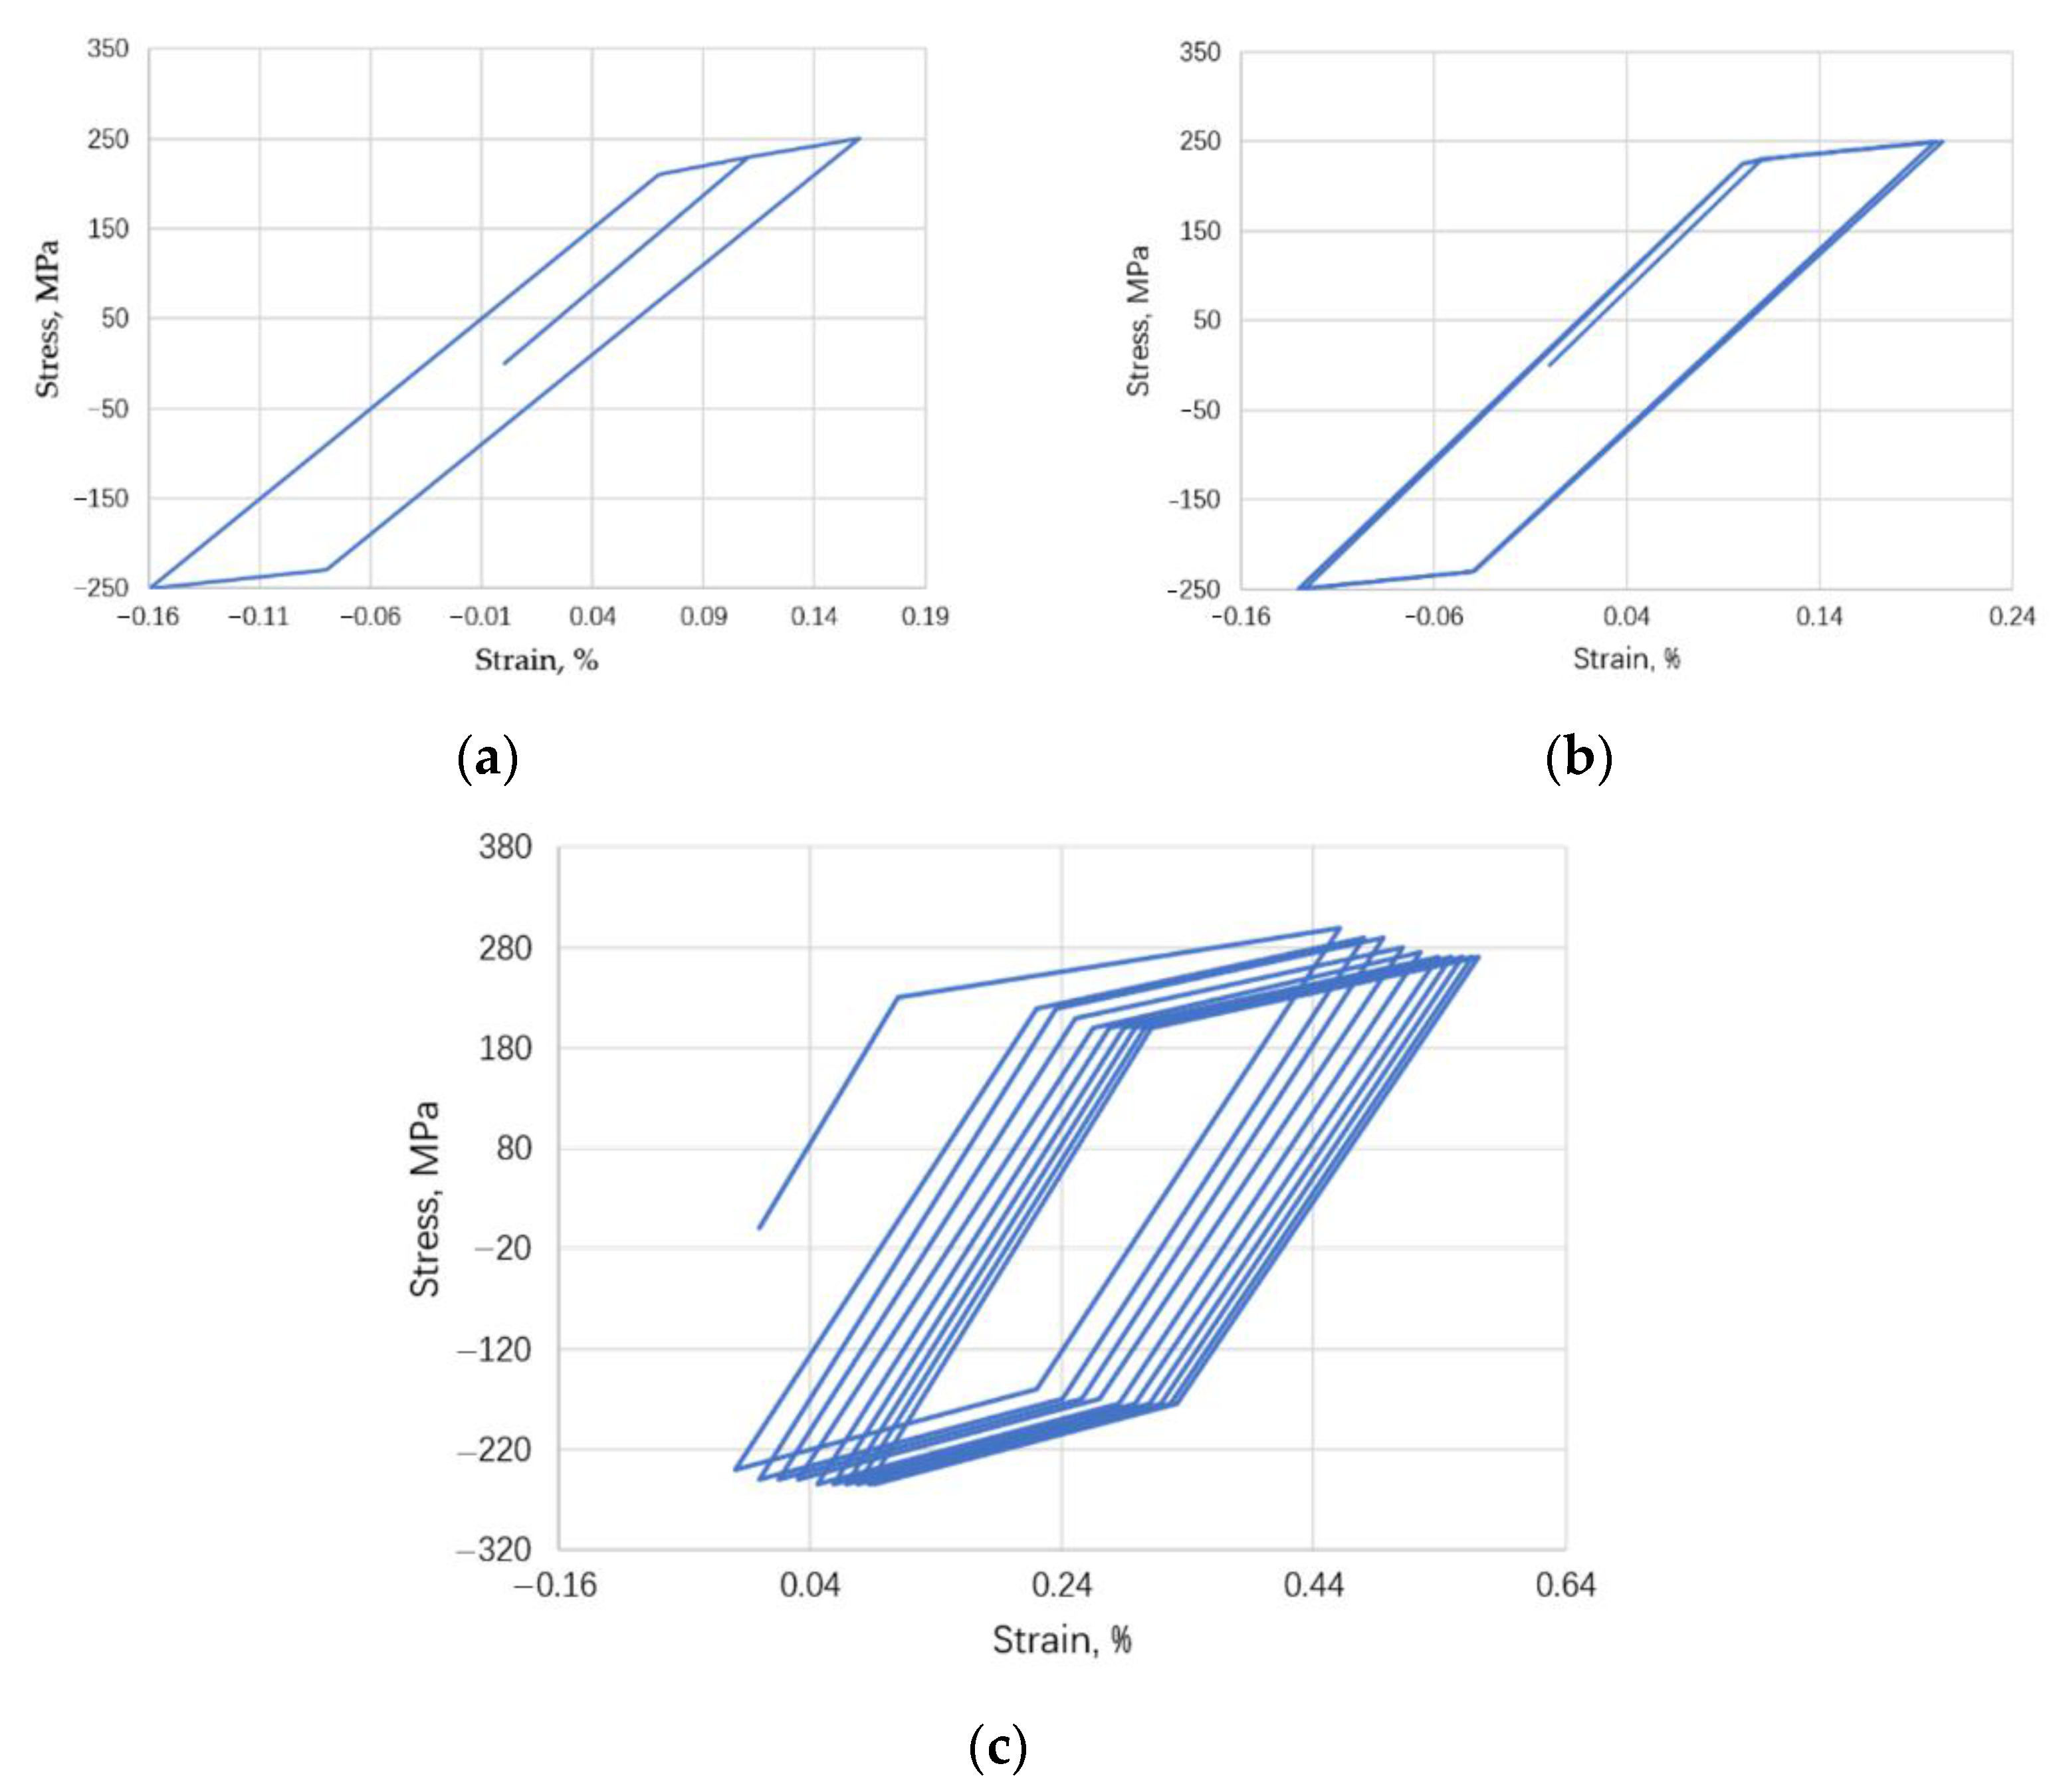
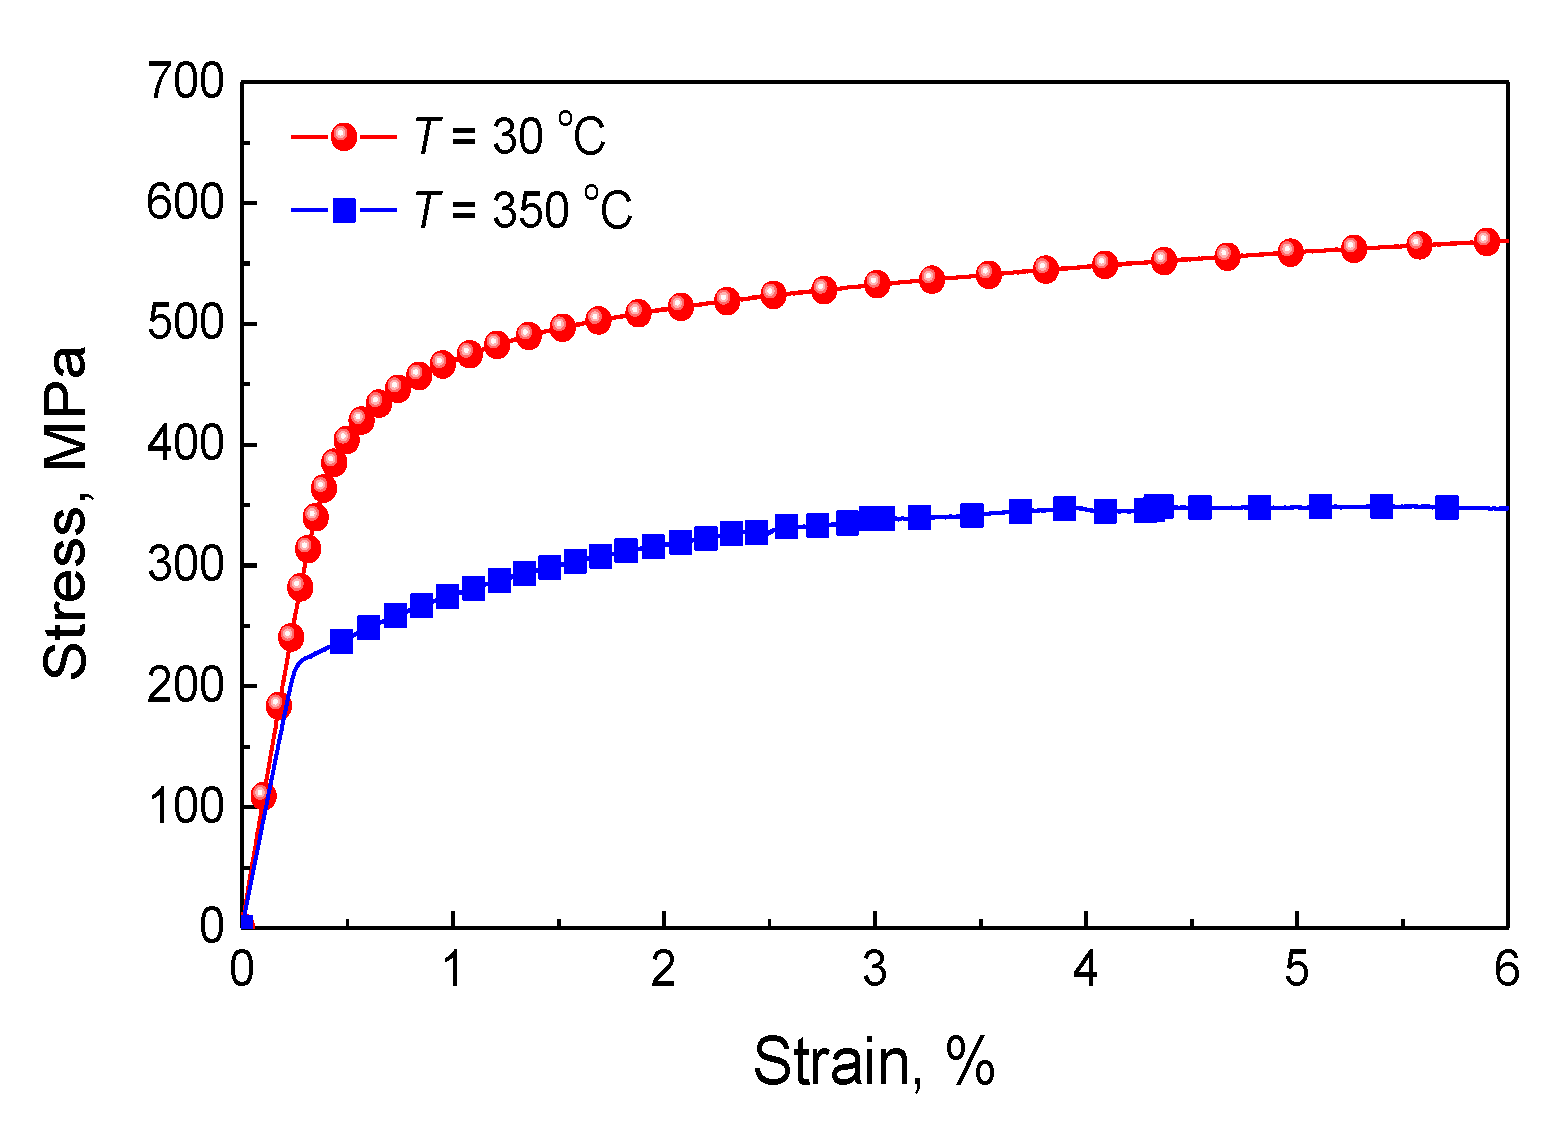
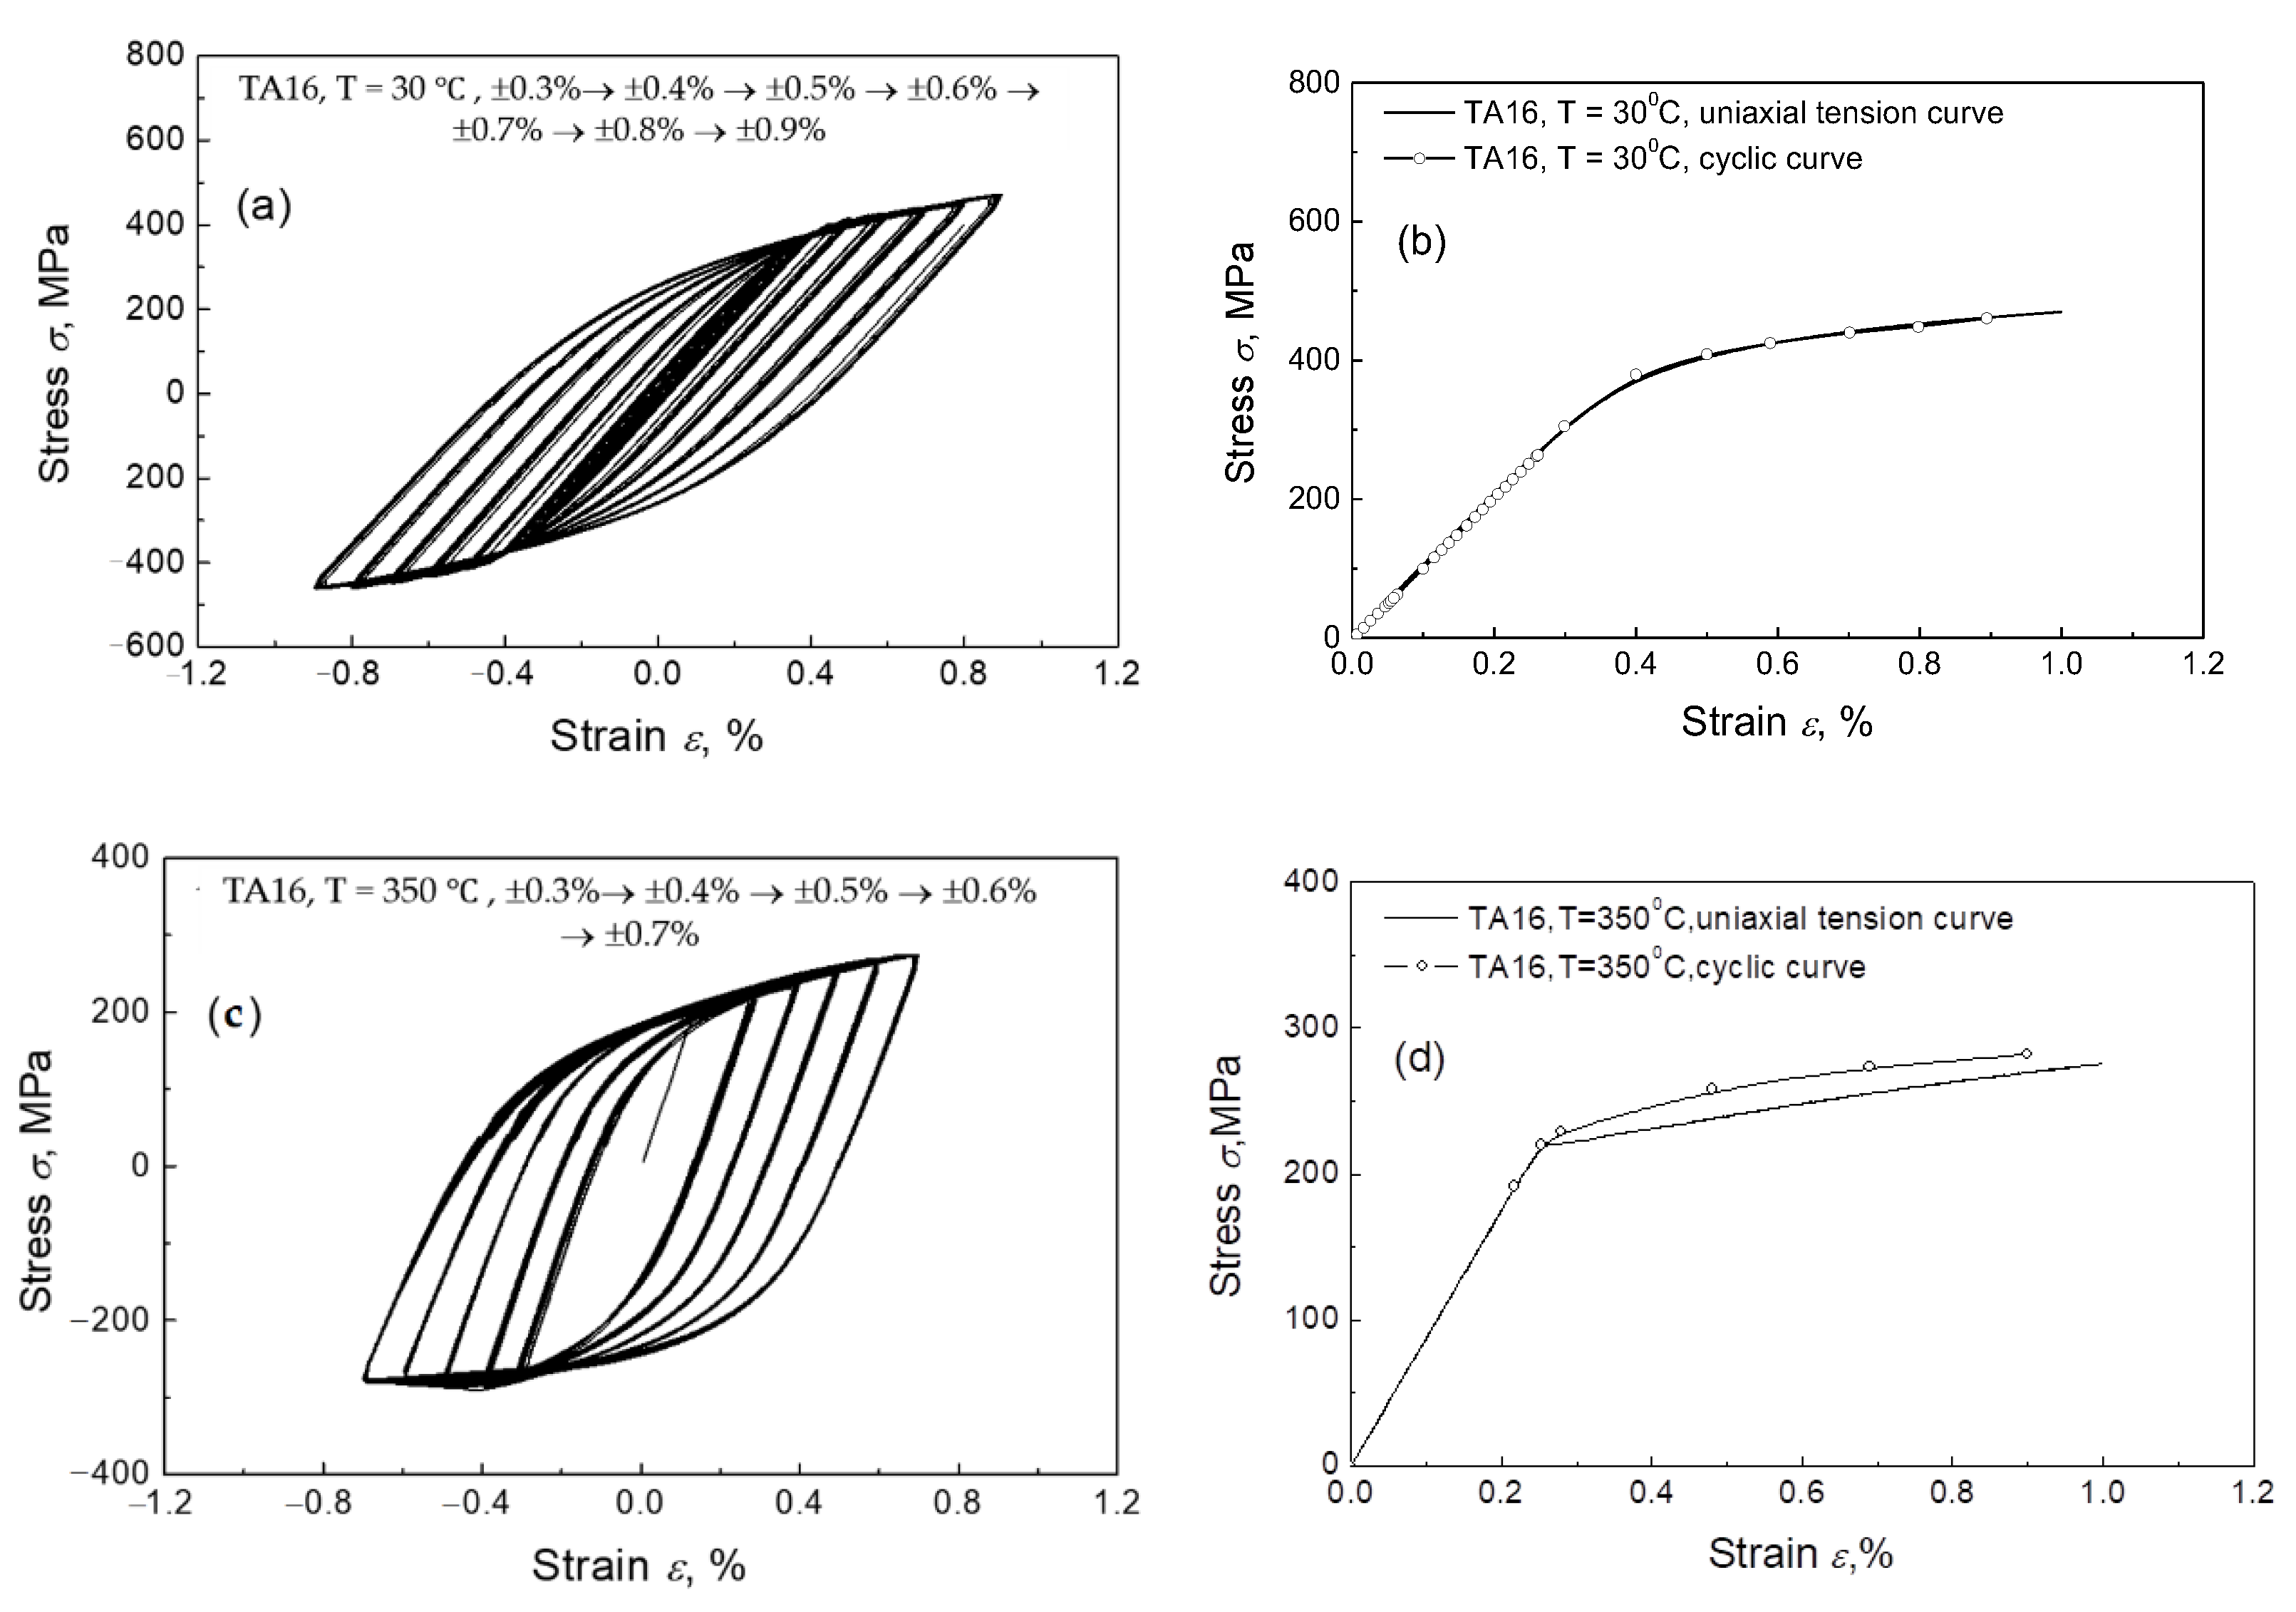
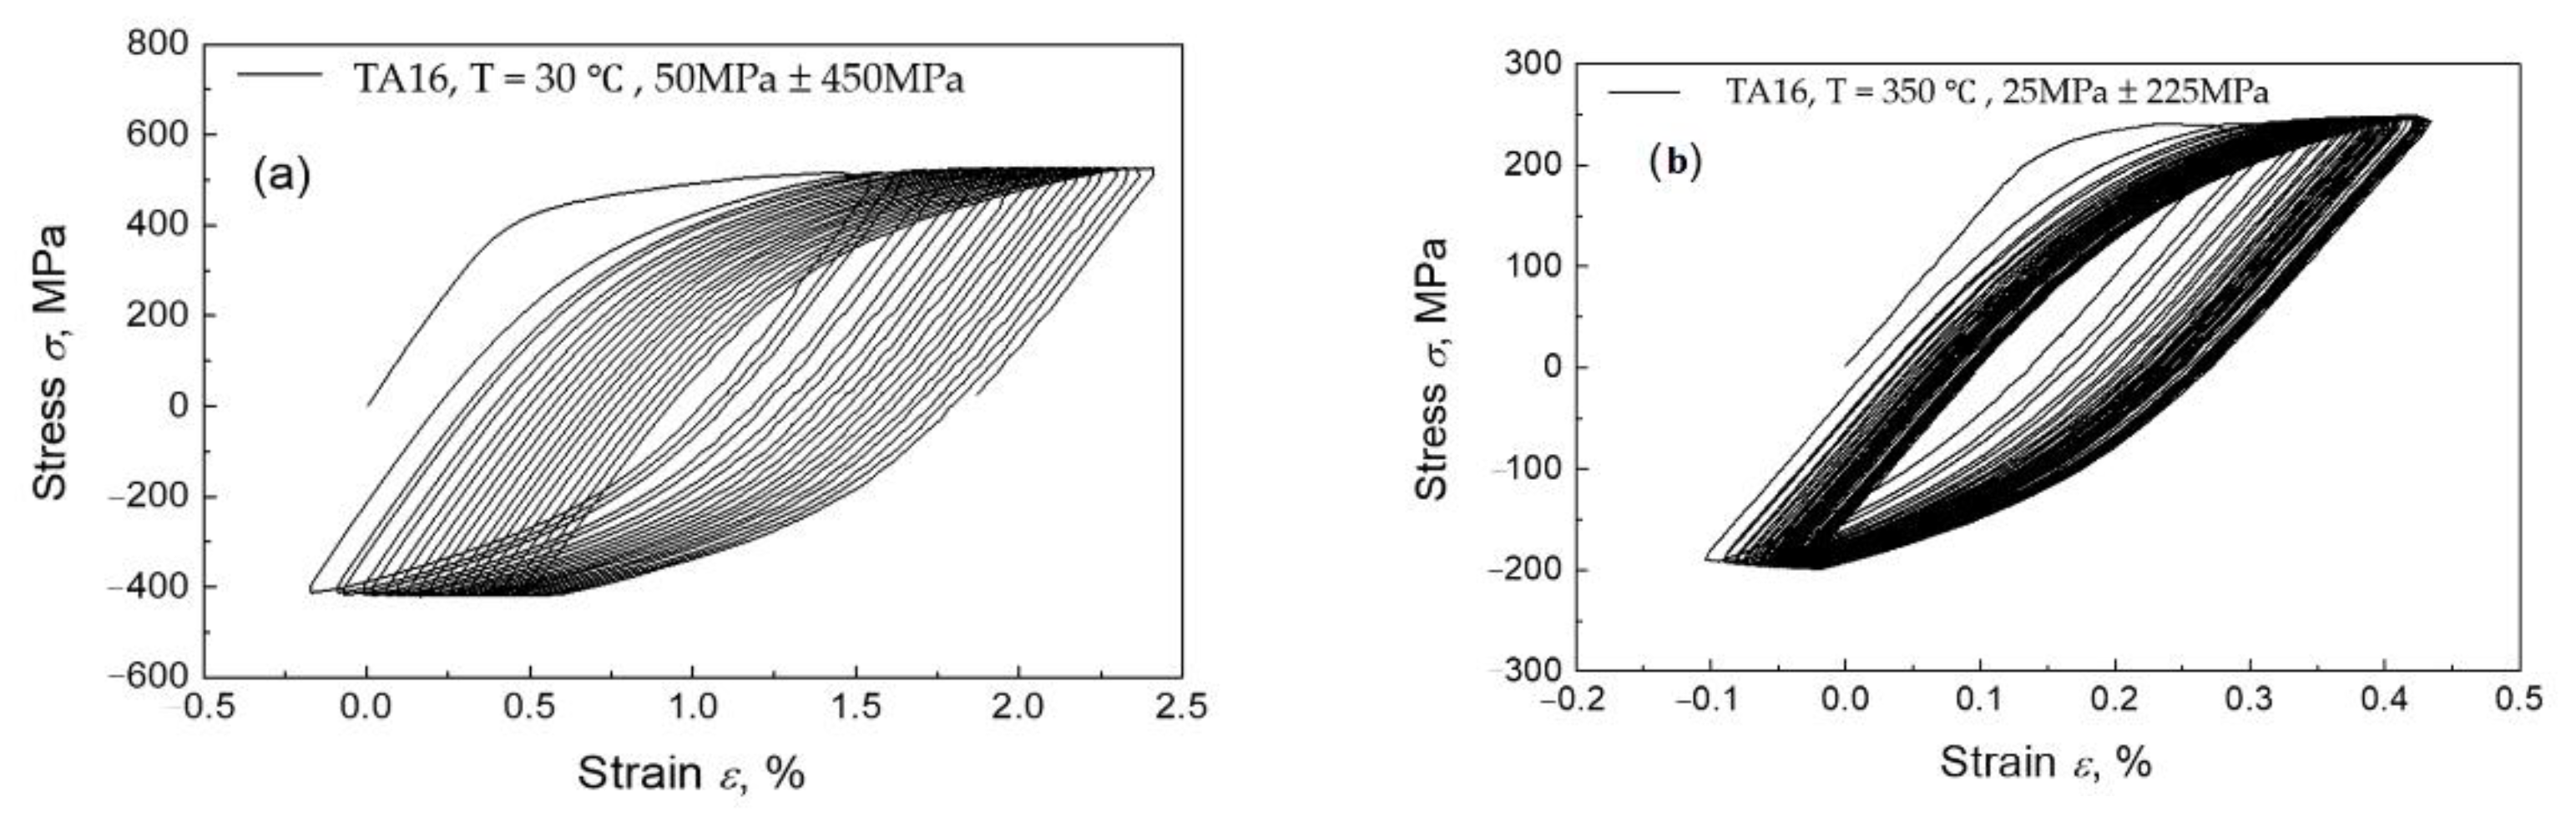
3.1. TA16 Axial and Cyclic Experiments
3.2. Cyclic Constitutive Model
4. The Ke for New Material TA16
4.1. Determining Ke Parameters
4.2. Verification Calculation
5. Conclusions
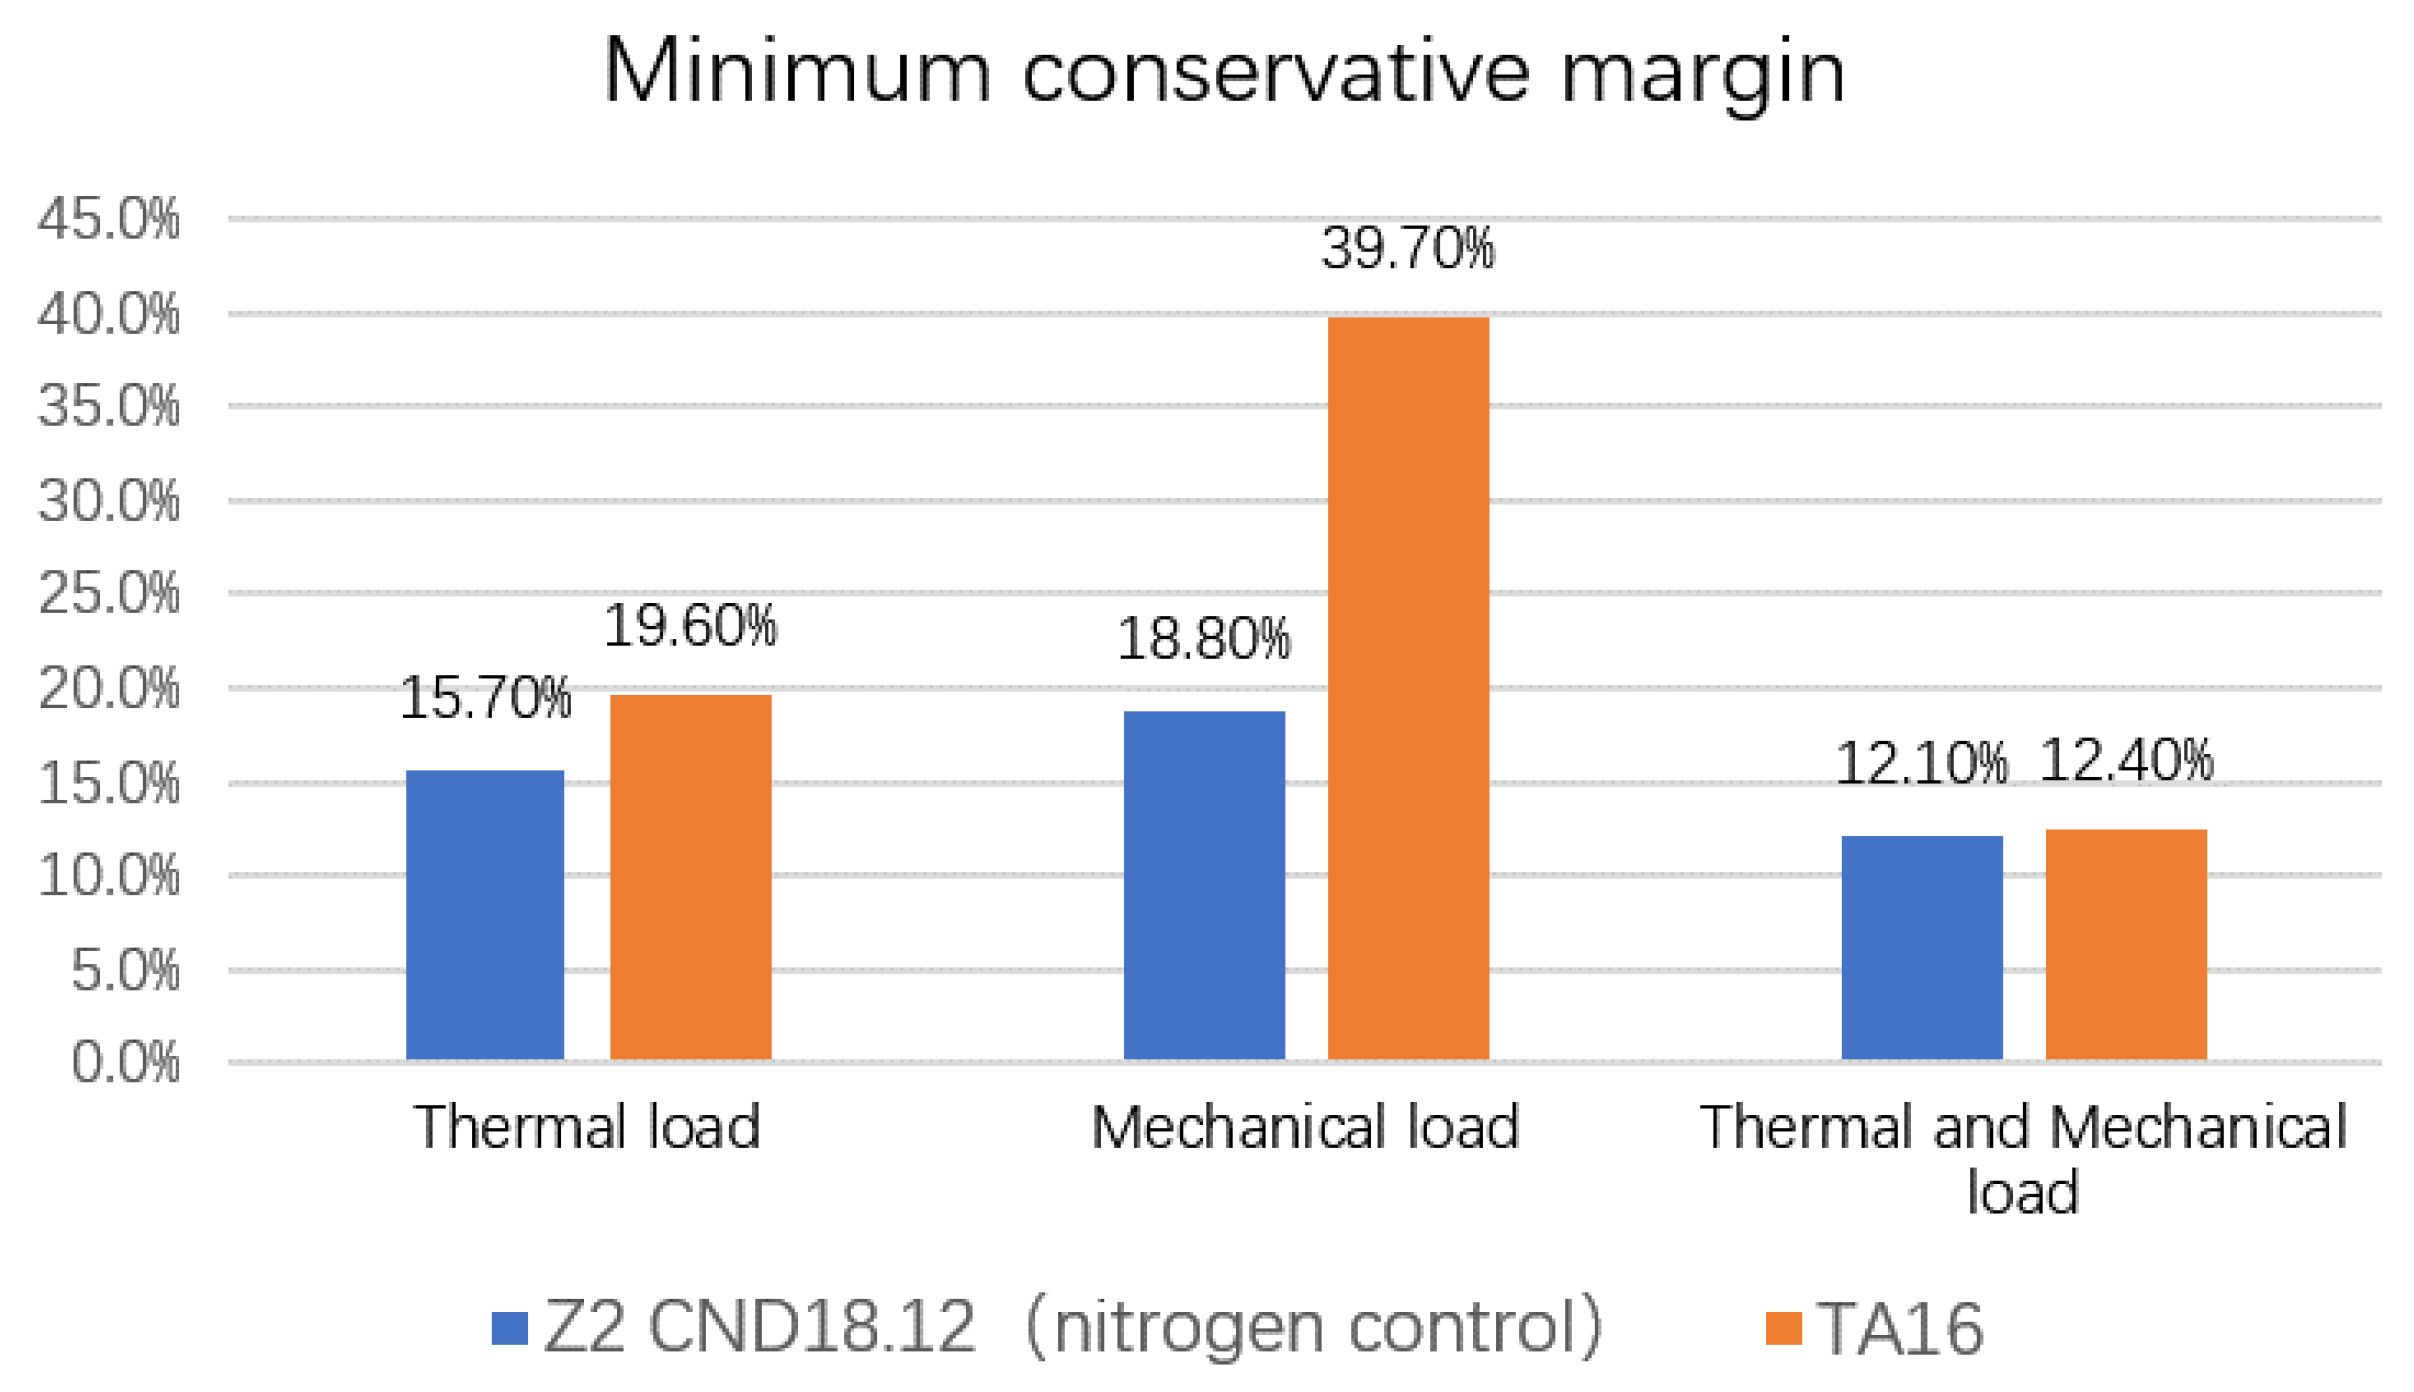
- (1)
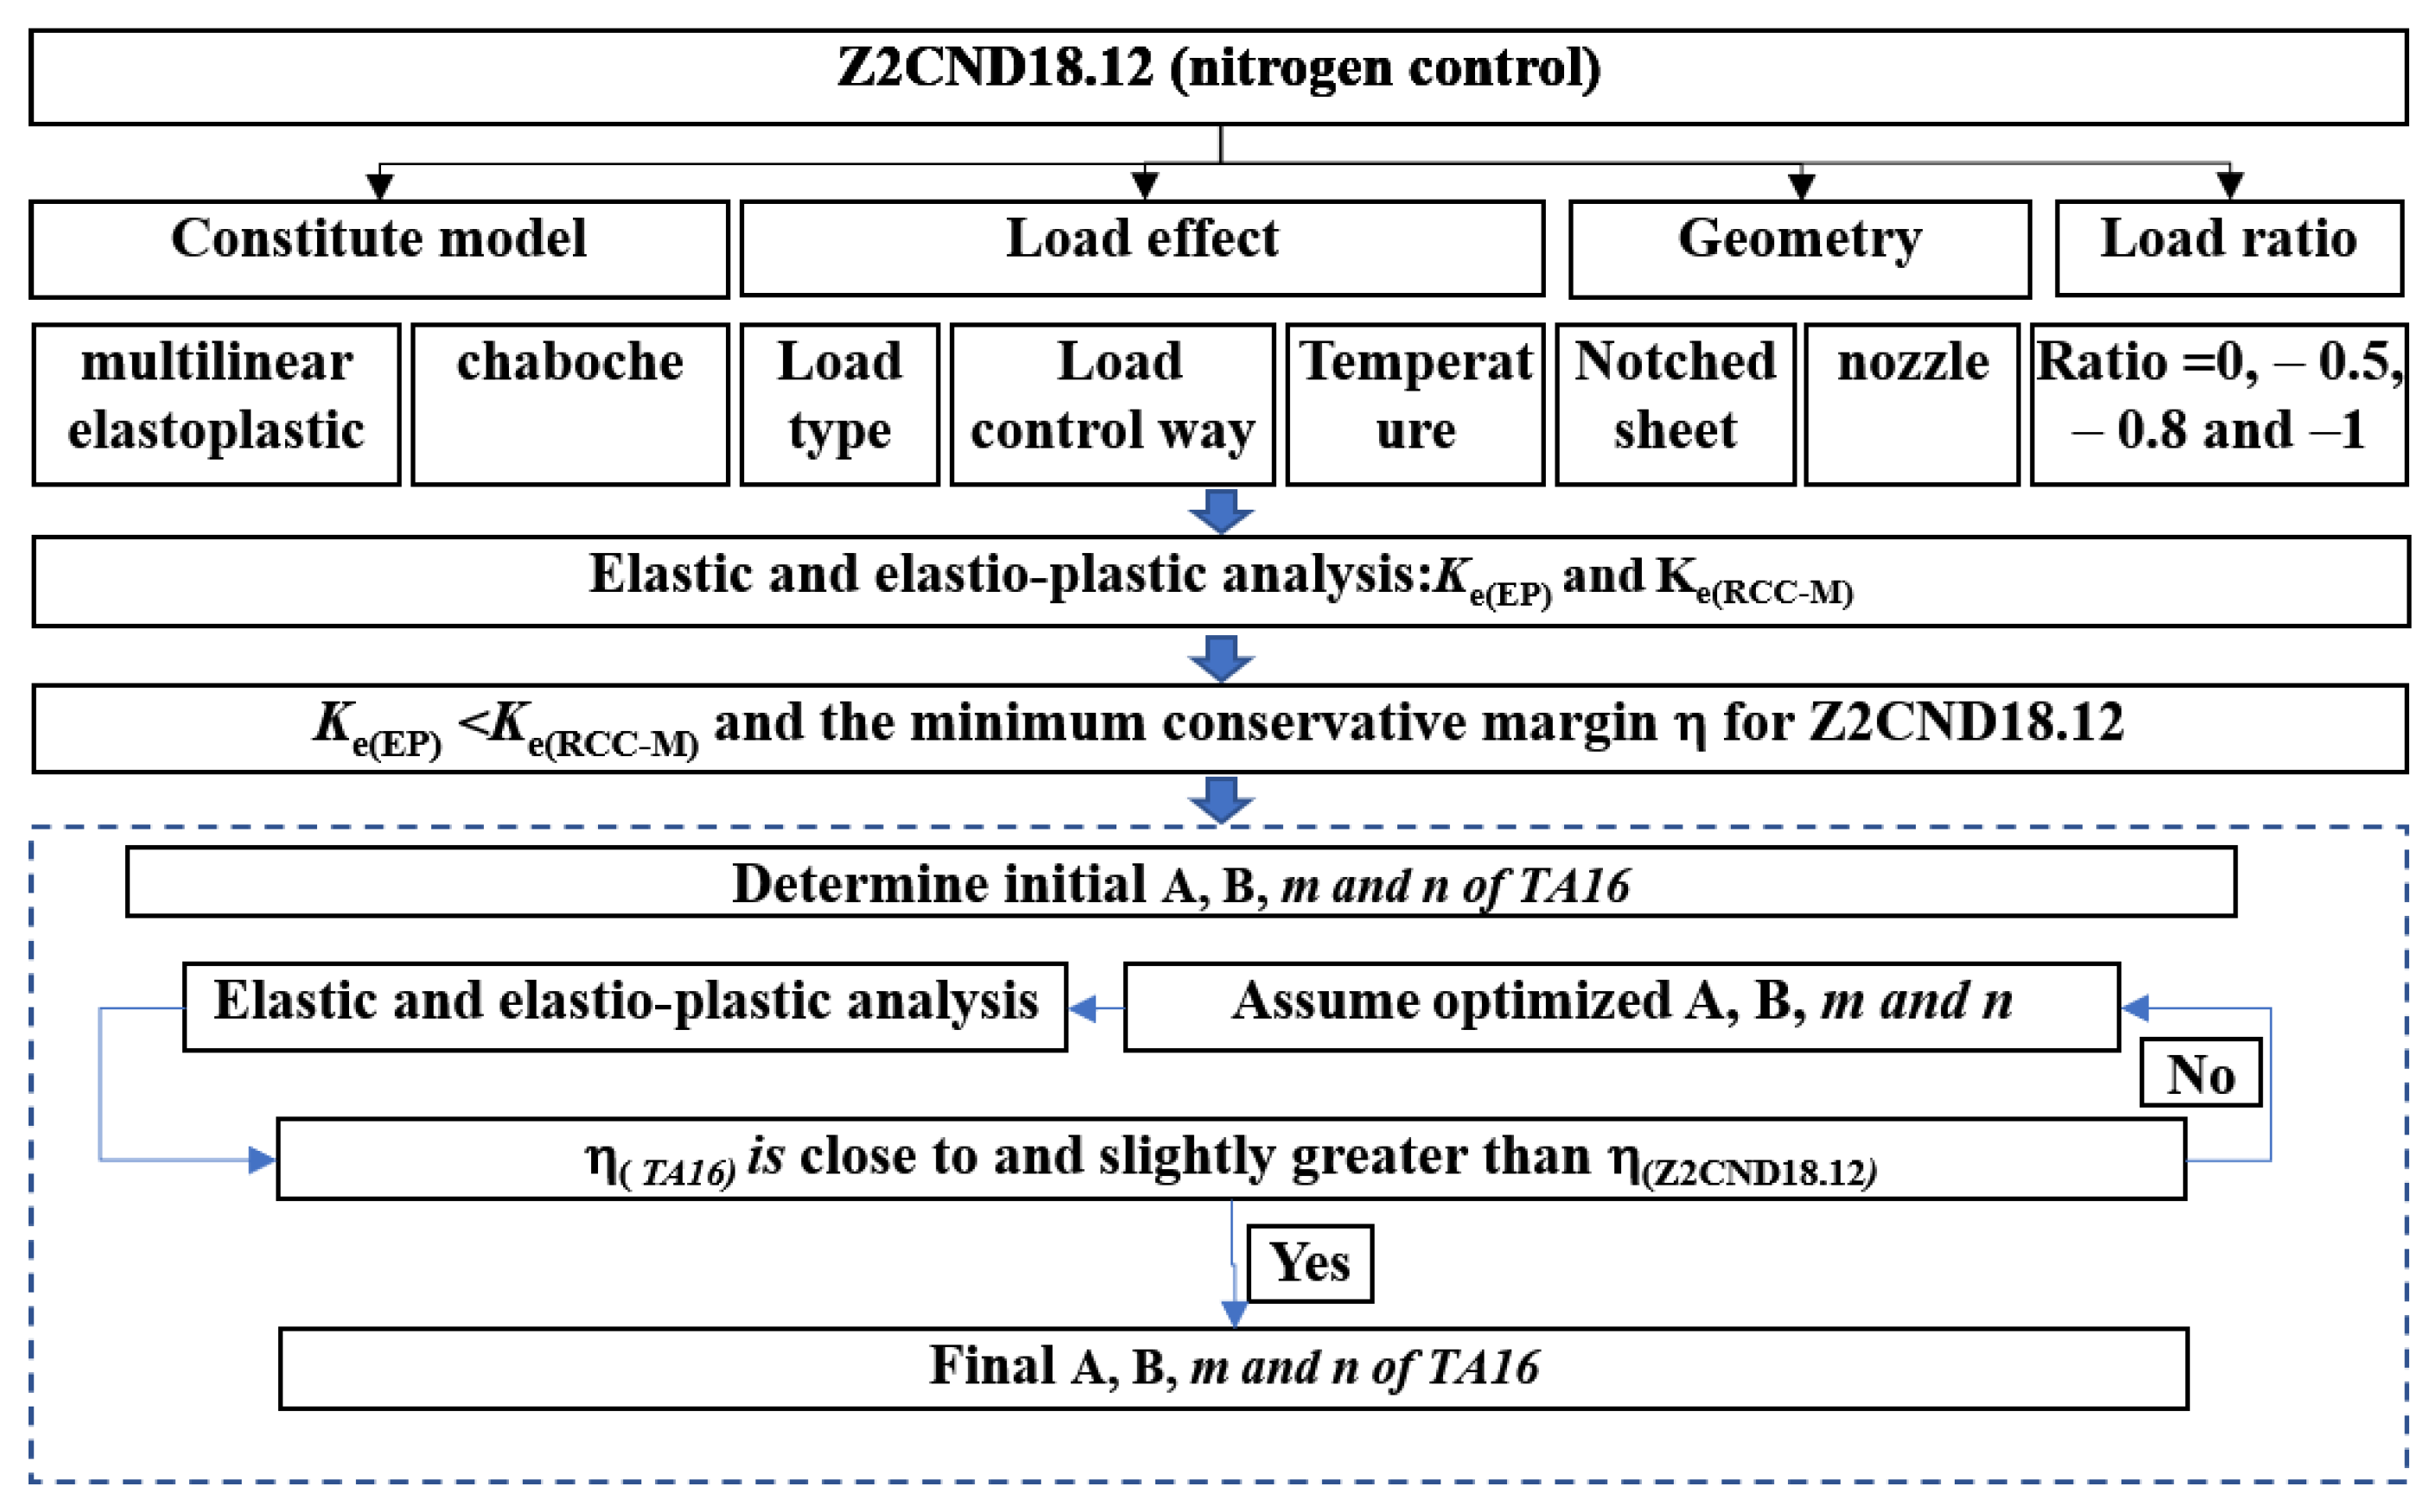
- Considering many kinds of sensitive factors, including different structure models, load types, loading control modes, temperature values and material constitutive models, the minimum conservative margin of Ke for Z2CND18.12 (nitrogen control) is 7.7%;
- (2)
- According to the minimum conservative margin of Z2CND18.12 (nitrogen control), the elastic and elastoplastic calculations for TA16 are carried out, and the Ke of TA16 is determined as A = 1.37, B = 1.26, m = 2.0 and n = 0.25;
- (3)
- For the feed water nozzle with dramatic temperature transient, the fatigue usage factor of the elastoplastic fatigue analysis is smaller than that of simplified elastoplastic analysis. It verifies the correctness and conservativeness of Ke for titanium alloy TA16.
Author Contributions
Funding
Institutional Review Board Statement
Informed Consent Statement
Data Availability Statement
Conflicts of Interest
Nomenclature
| A | The parameter of Ke(therm) |
| B | The parameter of Ke(therm) |
| Ci | Chaboche constitutive model parameter |
| Ke | Elastoplastic correction factor |
| m | The parameter of Ke |
| n | The material hardening index, Ke parameter |
| Sn | The range of primary plus secondary stress |
| Sp | The range of total stresses |
| Sm | The allowable stress intensity |
| γi | Chaboche constitutive model parameter |
| ε | Strain |
| Plastic strain rate | |
| σ | Stress |
References
- ASME. Asme Boiler and Pressure Vessel Code: Section III: Division 1 E Subsection Nb: Class 1 Components Rules for Construction of Nuclear Power Plant Components; ASME: New York, NY, USA, 2010. [Google Scholar]
- RCC-M. Design and Construction Rules for Mechanical Components of PWR Nuclear Islands, Section I: Subsection B, Class 1 Components; AFCEN: Paris, France, 2007. [Google Scholar]
- Hubel, H. Simplified Elasto-Plastic Fatigue Analysis of Smooth Structures; European Commission: Madrid, Spain, 1995. [Google Scholar]
- Branco, R.; Costa, J.; Borrego, L.; Berto, F.; Razavi, S.; Macek, W. Comparison of different one-parameter damage laws and local stress-strain approaches in multiaxial fatigue life assessment of notched components. Int. J. Fatigue 2021, 151, 106405. [Google Scholar] [CrossRef]
- Cao, Y.; Nie, W.; Yu, J.; Tanaka, K. A novel method for failure analysis based on three-dimensional analysis of fracture surfaces. Eng. Fail. Anal. 2014, 44, 74–84. [Google Scholar] [CrossRef]
- Kamal, M.; Rahman, M.M. Advances in fatigue life modeling: A review. Renew. Sustain. Energy Rev. 2018, 82, 940–949. [Google Scholar] [CrossRef]
- Macek, W.; Branco, R.; Korpyś, M.; Łagoda, T. Fractal dimension for bending–torsion fatigue fracture characterisation. Measurement 2021, 184, 109910. [Google Scholar] [CrossRef]
- Fu, X.; Wang, D. Plastic correction in simplified elasto-plastic fatigue analysis of nuclear components. Mech. Eng. 2017, 1, 67–70. [Google Scholar]
- Zhang, J.; Li, W.; Dai, H.; Liu, N.; Lin, J. Study on the elasticoplastic correlation of low-cycle fatigue for variable asymmetric loadings. Materials 2020, 13, 2451. [Google Scholar] [CrossRef] [PubMed]
- Fu, X.L.; Zhang, L.P.; Tian, J.; Shao, X.J.; Du, J.; Zhang, Y.; Liu, Z.Y. Plastic Strain Correction in Fatigue Analysis of Nuclear Power Plant Equipment. Strength Mater. 2021, 53, 183–188. [Google Scholar] [CrossRef]
- Clarkson, D.M.; Bell, C.D.; Mackenzie, D. Critical review of ASME III plasticity correction factors for fatigue design-by-analysis of nuclear power plant components. J. Press. Vessel. Technol. 2021, 143, 061201. [Google Scholar] [CrossRef]
- Lang, H.; Rudolph, J.; Ziegler, R. Performance study of Ke factors in simplified elastic plastic fatigue analyses with emphasis on thermal cyclic loading. Int. J. Press. Vessel. Pip. 2011, 88, 330–347. [Google Scholar] [CrossRef]
- Slagis, G.C. Meaning of Ke in design-by-analysis fatigue evaluation. J. Press. Vessel. Technol. 2006, 128, 8–16. [Google Scholar] [CrossRef]
- ASME. ASME Boiler and Pressure Vessel Code, Case N-779: Alternative Rules for Simplified Elastic Plastic Analysis; ASME: New York, NY, USA, 2010. [Google Scholar]
- Shao, X.; Du, J.; Zhang, L.; Xie, H.; Tian, J.; Shi, K.; Zhang, Y.; Liu, Z. Determination method of elasto-plastic correction factor of TA16 titanium alloy based on RCC-M code methodology. J. Press. Vessel. Technol. 2021, 143, 88–93. [Google Scholar] [CrossRef]
- Du, J.; Shao, X.; Zhang, L.; Kan, Q. Research on Elastoplastic Strain Correction Factor of Titanium Alloy. Nucl. Power Eng. 2014, 35, 101–105. [Google Scholar]
- Kan, Q.H.; Guo, S.J.; Li, J.; Kang, G.Z.; Yan, W.Y. Numerical investigation on plastic strain correction factor in simplified elasto-plastic fatigue analysis. Appl. Mech. Mater. 2017, 853, 226–230. [Google Scholar] [CrossRef]
- RCC-MRx. Design and Construction Rules for Mechanical Components of Nuclear Installations: High Temperature, Research and Fusion Reactors; AFCEN: Paris, France, 2018. [Google Scholar]
- He, K.; Zhao, Y.; Dang, Y.; Wang, L.; Jiang, F. Fatigue Behavior of TA16 Tube with Surface Defect under High Cycle Loading. Nucl. Power Eng. 2016, 37, 48–51. [Google Scholar]
- Luo, Q.; Wang, L.; Chen, X. Studies on the corrosion behavior of TA16 and TA17 titanium alloys in high temperature and high pressure water. Qing Jinshu 2012, 2, 56–59. [Google Scholar]
- Shao, X.; Xie, H.; Xiong, F.; Shi, K.; Yu, X. Comparative study on the nonlinear calculation of ratcheting deformation using different constitutive model. In Proceedings of the ASME Pressure Vessels and Piping Conference, Virtual, Online, 3 August 2020. PVP2020-21182. [Google Scholar]


| T = 20 °C | T = 100 °C | T = 200 °C | T = 250 °C | T = 300 °C | T = 350 °C | ||||||
|---|---|---|---|---|---|---|---|---|---|---|---|
| ε | σ (MPa) | ε | σ (MPa) | ε | σ (MPa) | ε | σ (MPa) | ε | σ (MPa) | ε | σ (MPa) |
| 0.0011 | 220 | 0.0009 | 175 | 0.0008 | 150 | 0.0008 | 138 | 0.0008 | 130 | 0.0008 | 127 |
| 0.0023 | 250 | 0.0016 | 190 | 0.0019 | 170 | 0.0019 | 160 | 0.0013 | 140 | 0.0012 | 133 |
| 0.0027 | 260 | 0.0019 | 200 | 0.0026 | 180 | 0.0027 | 170 | 0.0018 | 150 | 0.0016 | 140 |
| 0.0033 | 270 | 0.0024 | 210 | 0.0037 | 190 | 0.0039 | 180 | 0.0026 | 160 | 0.0024 | 150 |
| 0.0041 | 280 | 0.0031 | 220 | 0.0052 | 200 | 0.0057 | 190 | 0.0039 | 170 | 0.0036 | 160 |
| 0.0051 | 290 | 0.0041 | 230 | 0.0075 | 210 | 0.0085 | 200 | 0.0058 | 180 | 0.0055 | 170 |
| 0.0064 | 300 | 0.0074 | 250 | 0.0107 | 220 | 0.0103 | 205 | 0.0088 | 190 | 0.0085 | 180 |
| 0.0092 | 315 | 0.0100 | 260 | 0.0129 | 225 | 0.0125 | 210 | 0.0133 | 200 | 0.0131 | 190 |
| Model | Mechanical Load | Mixed Load | |||
|---|---|---|---|---|---|
| Temperature (°C) | Axial Pressure (MPa) | Axial Displacement (mm) | Temperature (°C) | Internal Pressure (MPa) | |
| Model-I | 30 | 40~180 | 0.2~10 | - | - |
| 350 | 40~120 | 0.1~7 | |||
| Model-II | 30 | 215~460 | 9.5~28 | 30~450 | −20~31 |
| 350 | 140~280 | 6.5~17 | |||
| Node | Temp_Load (°C) | Sn_th (MPa) | Δεee_th (%) | Δεep_th (%) | Ke_th (EP) | Ke_th (RCCM) | η (%) |
|---|---|---|---|---|---|---|---|
| 1576 | 350/20 | 693.23 | 6.276 × 10⁻³ | 9.762 × 10⁻³ | 1.555 | 1.628 | 11.580 |
| 300/20 | 584.81 | 5.219 × 10⁻³ | 7.835 × 10⁻³ | 1.501 | 1.584 | 14.211 | |
| 250/20 | 476.68 | 4.190 × 10⁻³ | 6.030 × 10⁻³ | 1.439 | 1.528 | 16.819 | |
| 200/20 | 398.68 | 3.194 × 10⁻³ | 4.373 × 10⁻³ | 1.369 | 1.466 | 20.901 | |
| 125/20 | 212.00 | 1.800 × 10⁻³ | 2.074 × 10⁻³ | 1.152 | 1.260 | 41.625 | |
| 298 | 350/20 | 748.98 | 6.368 × 10⁻³ | 9.993 × 10⁻³ | 1.569 | 1.642 | 11.331 |
| 300/20 | 631.30 | 5.292 × 10⁻³ | 8.071 × 10⁻³ | 1.525 | 1.610 | 13.981 | |
| 250/20 | 514.53 | 4.251 × 10⁻³ | 6.235 × 10⁻³ | 1.467 | 1.568 | 17.905 | |
| 200/20 | 369.46 | 3.239 × 10⁻³ | 4.486 × 10⁻³ | 1.385 | 1.492 | 21.716 | |
| 125/20 | 228.73 | 1.825 × 10⁻³ | 2.146 × 10⁻³ | 1.176 | 1.365 | 51.851 |
| Temperature | ||||
|---|---|---|---|---|
| 30 °C | 13,000 | 10 | 20,000 | 50 |
| 350 °C | 20,000 | 5 | 1000 | 50 |
| Node | ΔP (MPa) | ΔT (°C) | Sn (MPa) | Sp (MPa) | Sm (MPa) | Ke | Umax |
|---|---|---|---|---|---|---|---|
| N1 | 0/16.6 | 84/279 | 329.1 | 428.2 | 234.9 | 2.20 | 0.66 |
| N2 | 0/16.6 | 84/279 | 350.3 | 349.8 | 234.9 | 2.47 | 0.57 |
| Node | Principal Strain Range | Sa (MPa) | N | n | U |
|---|---|---|---|---|---|
| N1 | 0.00516 | 280.3 | 400 | 100 | 0.25 |
| N2 | 0.00434 | 235.9 | 555.6 | 100 | 0.18 |
Publisher’s Note: MDPI stays neutral with regard to jurisdictional claims in published maps and institutional affiliations. |
© 2022 by the authors. Licensee MDPI, Basel, Switzerland. This article is an open access article distributed under the terms and conditions of the Creative Commons Attribution (CC BY) license (https://creativecommons.org/licenses/by/4.0/).
Share and Cite
Shao, X.; Du, J.; Fu, X.; Xiong, F.; Li, H.; Tian, J.; Lu, X.; Xie, H. Simplified Elastoplastic Fatigue Correction Factor Analysis Approach Based on Minimum Conservative Margin. Metals 2022, 12, 943. https://doi.org/10.3390/met12060943
Shao X, Du J, Fu X, Xiong F, Li H, Tian J, Lu X, Xie H. Simplified Elastoplastic Fatigue Correction Factor Analysis Approach Based on Minimum Conservative Margin. Metals. 2022; 12(6):943. https://doi.org/10.3390/met12060943
Chicago/Turabian StyleShao, Xuejiao, Juan Du, Xiaolong Fu, Furui Xiong, Hui Li, Jun Tian, Xifeng Lu, and Hai Xie. 2022. "Simplified Elastoplastic Fatigue Correction Factor Analysis Approach Based on Minimum Conservative Margin" Metals 12, no. 6: 943. https://doi.org/10.3390/met12060943
APA StyleShao, X., Du, J., Fu, X., Xiong, F., Li, H., Tian, J., Lu, X., & Xie, H. (2022). Simplified Elastoplastic Fatigue Correction Factor Analysis Approach Based on Minimum Conservative Margin. Metals, 12(6), 943. https://doi.org/10.3390/met12060943