Article

Large-Arc Discharge Mechanism and Avoidance in Micro-Arc Oxidation of Magnesium Alloy

School of Materials Science and Engineering, Xi’an Shiyou University, Xi’an 710065, China
*
Author to whom correspondence should be addressed.
Metals 2022, 12(6), 949; https://doi.org/10.3390/met12060949
Submission received: 31 March 2022 / Revised: 26 May 2022 / Accepted: 29 May 2022 / Published: 31 May 2022

Abstract

:
The large-arc discharge problem occurs in the processing of magnesium alloy by micro-arc oxidation. It will cause local ablation of ceramic coating and even magnesium alloy matrix material. Thus, clarifying the mechanism and influencing factors is a necessary approach to avoid the large-arc discharge problem. In this study, a new “cooling time” parameter based on frequency and duty cycle is proposed to study the large-arc discharge trend and understand the relationship between large-arc discharge and process parameters. Then, the mechanism of the large-arc discharge phenomenon and the action of the cooling time were investigated by the theory of local-arc discharge mechanism and load characteristics of micro-arc oxidation. The results show that the mechanism of large-arc discharge is that the arc discharge is continuous in situ, and the aggregation or merger of arc discharge occurrence. Therefore, the large-arc problem can be resolved effectively through discretizing the arc discharge by adjusting the cooling time and regulating the pulse frequency and duty cycle. The cooling time made the location area of arc discharge and oxides fully cooled, and provided time for the sufficient discharge of the load capacitance, to effectively inhibit the problem of large-arc discharge.

1. Introduction

Magnesium alloy has the advantages of low density, high strength and good electromagnetic shielding effect. It is an environmentally friendly material with excellent performance and wide application range. However, magnesium is an active metal, and the standard electrode potential is relatively negative, which is prone to corrosion. Therefore, in order to make magnesium alloys widely used in production, their surface must be treated. Micro-arc oxidation is the most widely used anti-corrosion technology for magnesium alloy surfaces [1,2]. Micro-arc oxidation (MAO), also known as plasma electrolytic oxidation, is a mature process that has been widely used to form ceramic coatings in situ on non-ferrous metal surfaces, such as magnesium, aluminum, titanium, etc., to protect metals from corrosion and wear. The film layer has strong bonding force with the metal substrate, and has good wear resistance and corrosion resistance [3,4,5,6]. A micro-arc oxidation coating is accumulated on a matrix material by formation of metal oxides arising from a series of discrete micro-arc discharges, followed by rapid cooling and solidification. The coating formation by micro-arc oxidation processing clearly shows three stages: the anodic oxidation stage, the micro-arc oxidation stage, and the large-arc discharge stage [7,8]. With the voltage increase, the local-arc discharge intensifies and the MAO procedure is accompanied by the extreme emission of heat and sparks.
Generally speaking, the MAO coating typically exhibits two types of lamellar structure. The inner is the dense layer, which is close proximity to the matrix material surface and only a few microns in thickness, formed by the anodic oxidation stage. The outer layer is formed by the micro-arc oxidation stage; there are microcracks and holes in the ceramic coating [9,10]. In addition, the microcracks and pores in the ceramic coating would increase, and even the ablation of the matrix material occurs in some areas when the large-arc discharge becomes intense or with the extension of time [11,12]. However, with the thickening of the micro-arc oxidation coating, the arc starting voltage increases and the arc discharge intensifies. Thus, it is considered that large-arc discharge is an inevitable phenomenon in micro-arc oxidation process [13,14]. The intensity of the micro-arc discharge determines the characteristics of holes in the MAO ceramic coatings, and thereby the coating properties [15,16]. Therefore, controlling the micro-arc discharge process to reduce the tendency of large-arc discharge has a significant effect on the overall properties of the coatings, thereby facilitating the control of the coatings’ structure and compactness to reach the application requirements using MAO coatings.
It is well known that the structure and compactness of a micro-arc oxidation coating are related to the spark discharge. The pore size of the MAO coating surface depends on the spark discharge, and it has an important effect on its wear and corrosion resistance [17,18]. In order to improve the wear properties of the MAO ceramic coating, a suitable cathode voltage was been used to fabricate a compact coating. It has been known that the large-arc discharge occurred in stage III, and with the keep time prolonged, the spark discharge was more intense and the spark size became larger, then the local spark connected, even boiling the water [19]. This special case is usually attributed to the local-arc discharge overlay. Therefore, it seems that the large-arc discharge tendency is inevitable and has a self-reinforcing effect. In addition, the MAO loads exhibit capacitive characteristics, as an anode, so the sample will be charged during the positive pulse cycle and discharged after the pulse cycle [20]. Therefore, the large-arc discharge could be inhibited by regulating the pulse frequency and duty cycle to suspend arc discharge process and prevent the continued arc occurrence. In recent years, many investigations have focused on controlling the duty cycle [21,22]. It has been known that the MAO coating sample quality at the higher duty cycle was lower than the lower duty cycle due to the large pore size and cracks. According to those results, the effective way to inhibit large-arc discharge is to add appropriate cooling time to discretize the arc discharge. However, the effect of the cooling time on the process of micro-arc oxidation and microstructure of the coatings is still ambiguous.
Therefore, a new parameter of “cooling time” is proposed to investigate the tendency of large-arc discharge, which is dependent on pulse frequency and duty cycle. The large-arc discharge mechanism was investigated to aim at achieving an understanding of the influence of cooling time. Magnesium alloy ceramic coatings were prepared by micro-arc oxidation under a great deal of different pulse frequencies and duty cycles to establish the relationship between large-arc discharge problems and experimental conditions. Then, the mechanism of the large-arc discharge phenomenon is discussed by the theory of the local-arc discharge mechanism and load capacitance characteristic in micro-arc oxidation.

2. Experimental Procedures

2.1. Materials and Electrolyte

AZ91D alloy was used as the matrix material with a sample size of 20 mm × 40 mm × 8 mm. The chemical composition is shown in Table 1. The matrix materials were polished with the SiC abrasive paper for grit of 400 #, 800 #, 1200 #, and then placed in an ultrasonic bath in deionized water for 5 min and dried in flowing air. An electrolyte contains Na2SiO3 13 g/L, KF 12 g/L and NaOH 4 g/L in deionized water. The electrolyte temperature during the treatment was maintained about 20 °C to 40 °C through a magnetic stirring system. The 18-8 stainless steel plate was used as cathode material with a thickness of 1 mm.

2.2. MAO Coatings Preparation

Using the 30 kW discharge loop current (DLC) micro-arc oxidation power supply developed by Lanzhou University of Technology, the power supply can output a variety of pulse waveforms, such as unipolar, bipolar, etc. The effect of the load capacity can be effectively eliminated through pulse and discharge loop current alternating on and off by pulse discharge loop current power supply, making the pulse output a square wave, which provide the necessary cooling time made the spark discharge discretize [20]. The frequency of the MAO process was 400, 444, 500, 571, 667, 800, and 1000 Hz (the time of cycles ranged from 2500 μs to 1000 μs, the interval between each cycle being 250 μs). In the experiments, different duty cycles of 10%, 20%, 30%, 40%, 50%, 60%, 70%, 80% and 90% were adjusted. Cooling time (ms) for frequency (f/Hz) and duty cycle (δ/%) is shown in Table 2. The schematic diagram of voltage output waveform, operating time (to) and cooling time (tc) under one period (T) is shown in Figure 1. The relationship between cooling time and frequency and duty cycle is expressed as in Equation (1):
tc = T − to = 1/f − (1/f) × δ
where tc is the cooling time, the T is the pulse cycle which is determined by frequency, T = 1/f. The to is the operating time, f and δ represent the frequency and duty cycle, respectively. The voltage was loaded in the experiment by increasing the positive voltage from 0 to 150 V at a rate of 30 V/min. Then, the speed was reduced by 10 V/min until the voltage was 400 V, and stopped after 5 min. During this process, if a large-arc problem occured, the experiment was be stopped. In addition, arcing voltage values and experimental phenomena were recorded every 5 min, while positive/negative current values and electrolyte temperature were recorded every 2.5 min.

2.3. Characterization of MAO Coatings

The thickness of the coatings was measured by TT260 digital whirlpool thickness gauge (Beijing Era United Technology Co., Led, Beijing, China). Voltage and current output waveform were recorded by oscillograph (Uni-tut 3200: UNI-Trend Technology Co., Ltd., Dongguan, China). The surface morphology of the coatings was characterized by scanning electron microscopy (SEM, JSM6700: JEOL, Tokyo, Japan). The porosity and pore size of the coatings were determined by analysing SEM surface morphologies with image analysis software (Image J, DT200: National Institutes of Health, Bethesda, MD, USA). The composition of the ceramic coatings was analysed using an X-ray diffraction system with a Cu target. The scans step sizes were set as 0.02° and the 2θ range from 20° to 80°.

3. Results

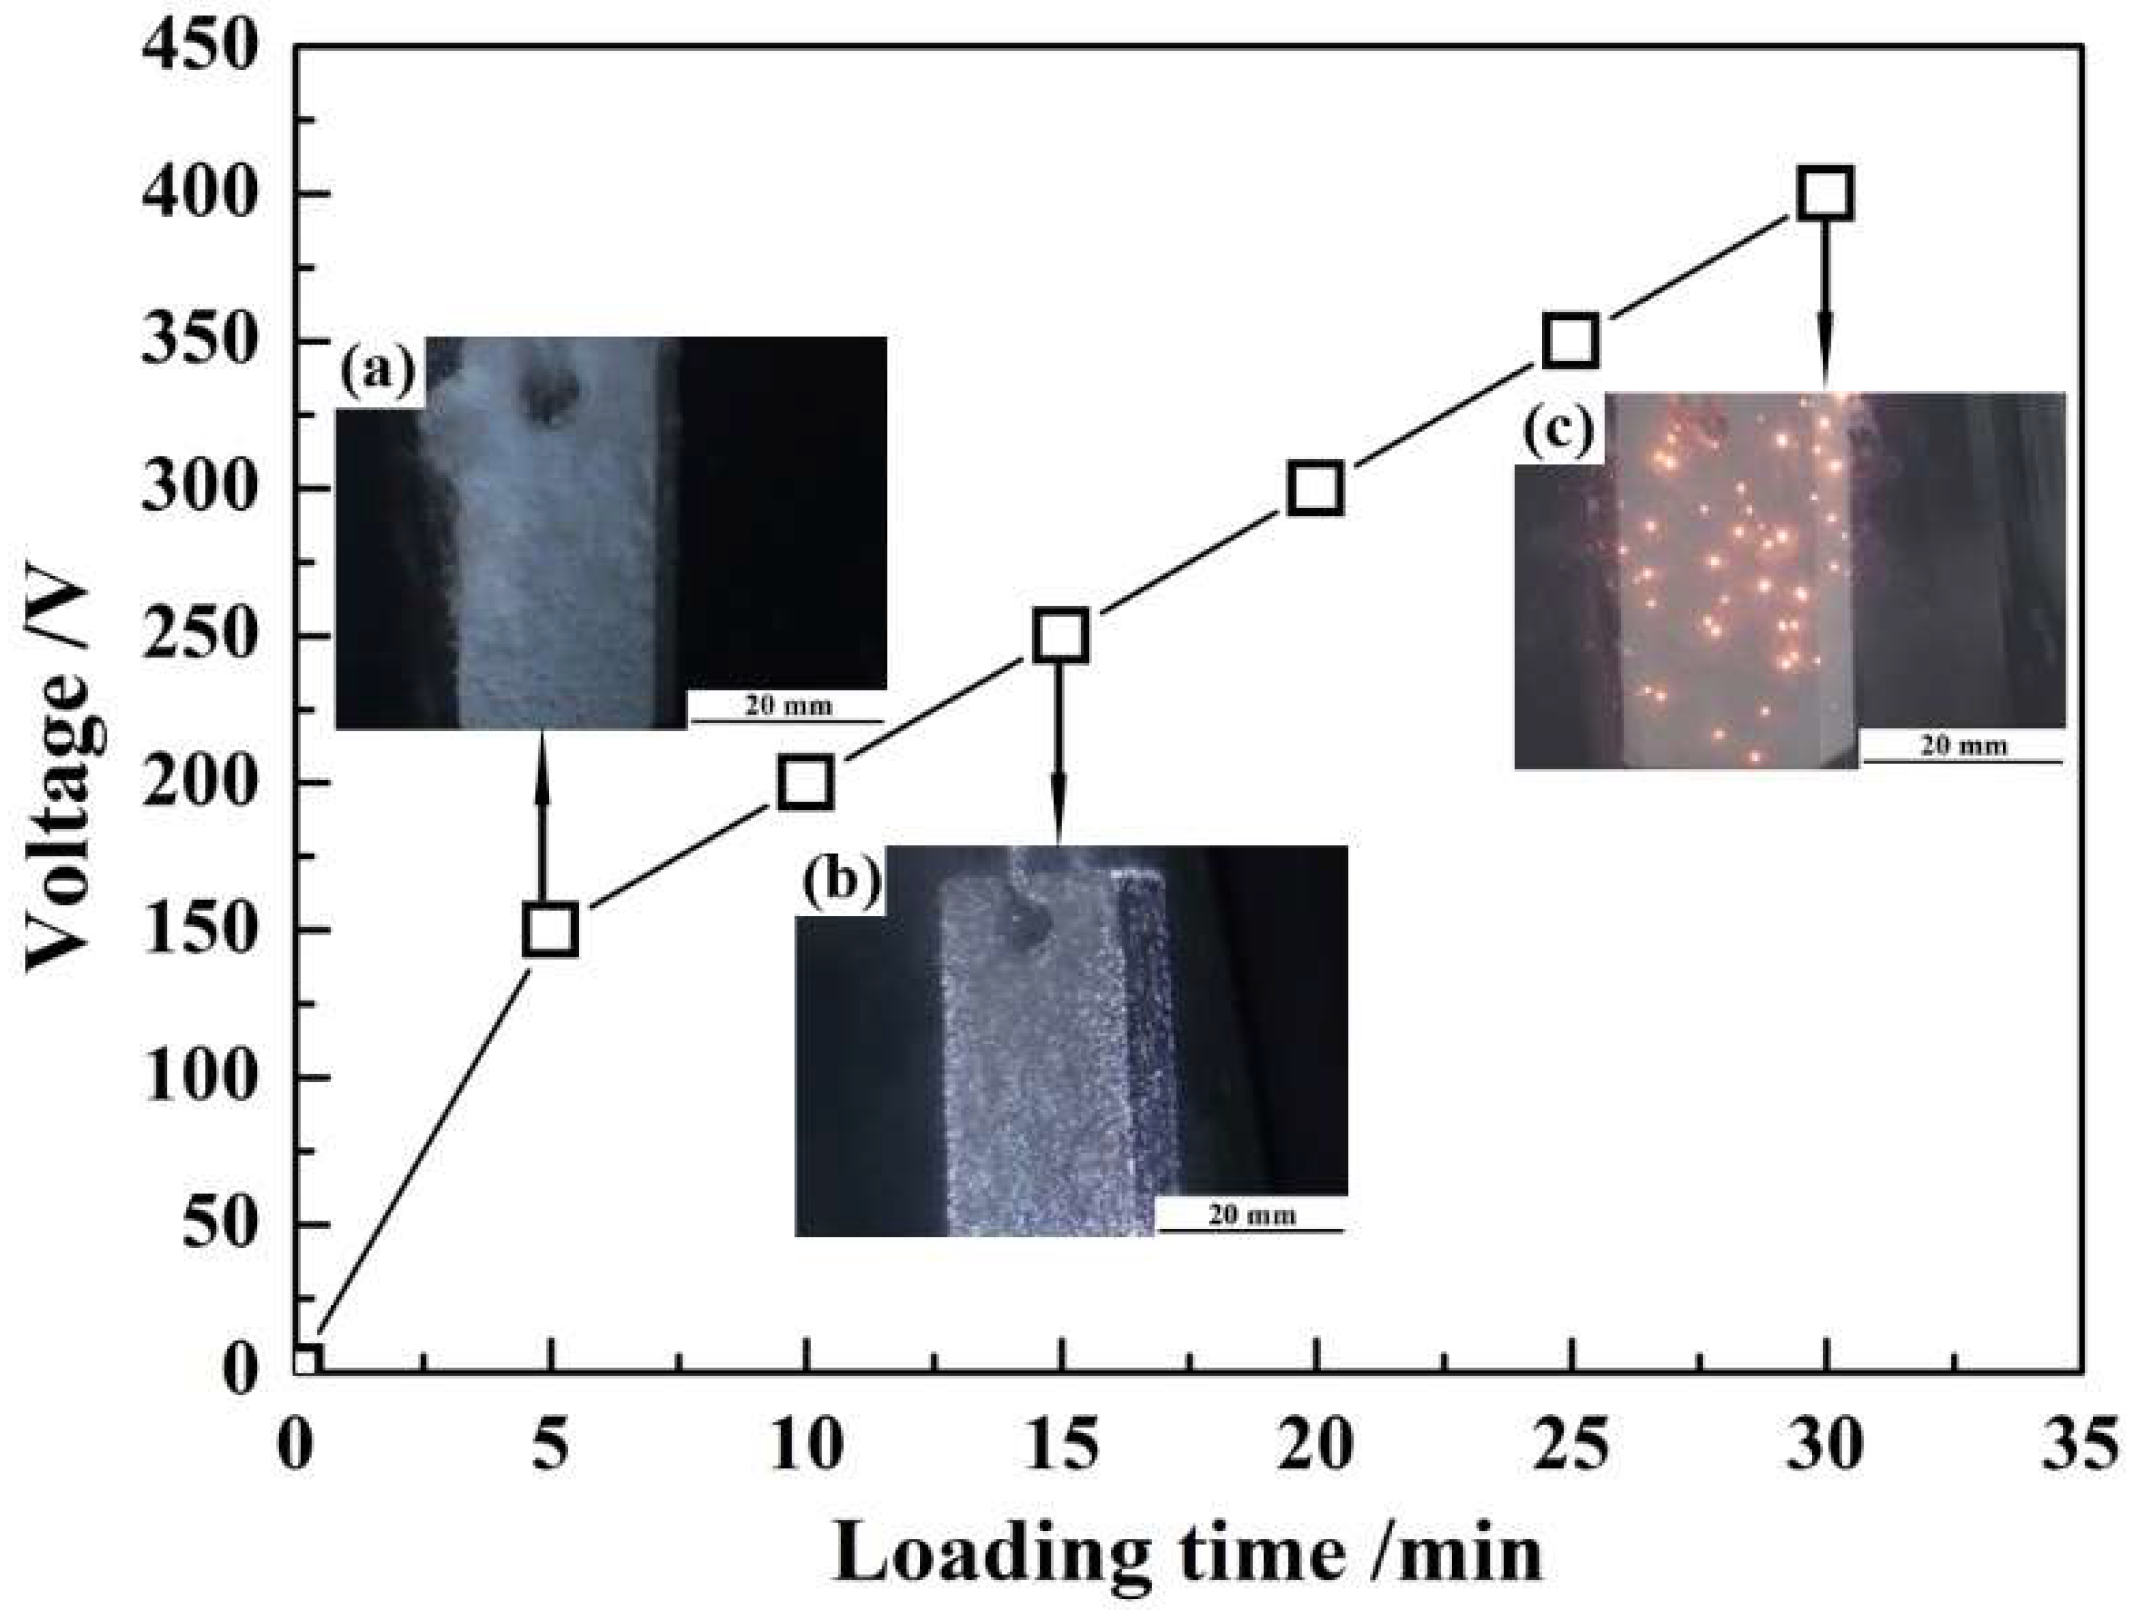
3.1. Large-Arc Discharge Characterization of MAO Coatings

3.1.1. Arc Discharge Evolution

Figure 2 shows that the variation of arc discharge characteristics with the frequency is 500 Hz, the duty cycle is 30% and the corresponding voltage is 150 V, 250 V and 400 V, respectively. When the voltage is less than 150 V, mound of bubbles appeared on the surface of the specimen, as shown in Figure 2a. Neither arc discharge could be observed at this voltage, which indicates there is no micro-arc oxidation process occurring on the surface of the sample. Numerous investigations have shown that a similar reaction of anodic oxidation mainly occurs at this stage [23]. However, in the case of the anodic oxidation coating samples, the metallic color disappeared and a grayish white coating was formed on the surface of the sample. As shown in Figure 2b, it can be evidently found that small bright white arc discharge spots began appearing on the surface of the specimen. It was found that the arc starting voltage is about 160 V. When the voltage was kept constant 200 V, with the extension of time, the arc discharge spots became gradually smaller and sparser than the arc starting time. This can be interpreted as the thickening of the oxidation coating increasing the load resistance; thus, the requirement of the breakdown voltage increased [24]. Thereby, the arc discharge intensity of the coating was weaker and the location to arc discharge was lower than before. This can be certified by the arc starting voltage having been observed to increase significantly with the increase of voltage. Subsequently, with the pulse voltage up to 400 V, the arc discharge spots significantly reduced and the spark size increased with an orange spark darkening compared with the voltage as 250 V, as shown in Figure 2c. In this operating process, the MAO reaction released an amount of heat, driving the temperature of the electrolyte up from the initial room temperature of 20 °C to 40 °C. Extremely, the arc spot further merged into a big one, which would result in the ablation of the local coating; this phenomenon is called large-arc discharge. Large-arc discharge is an inevitable stage of the micro-arc oxidation process, which will seriously affect the quality of ceramic coatings.

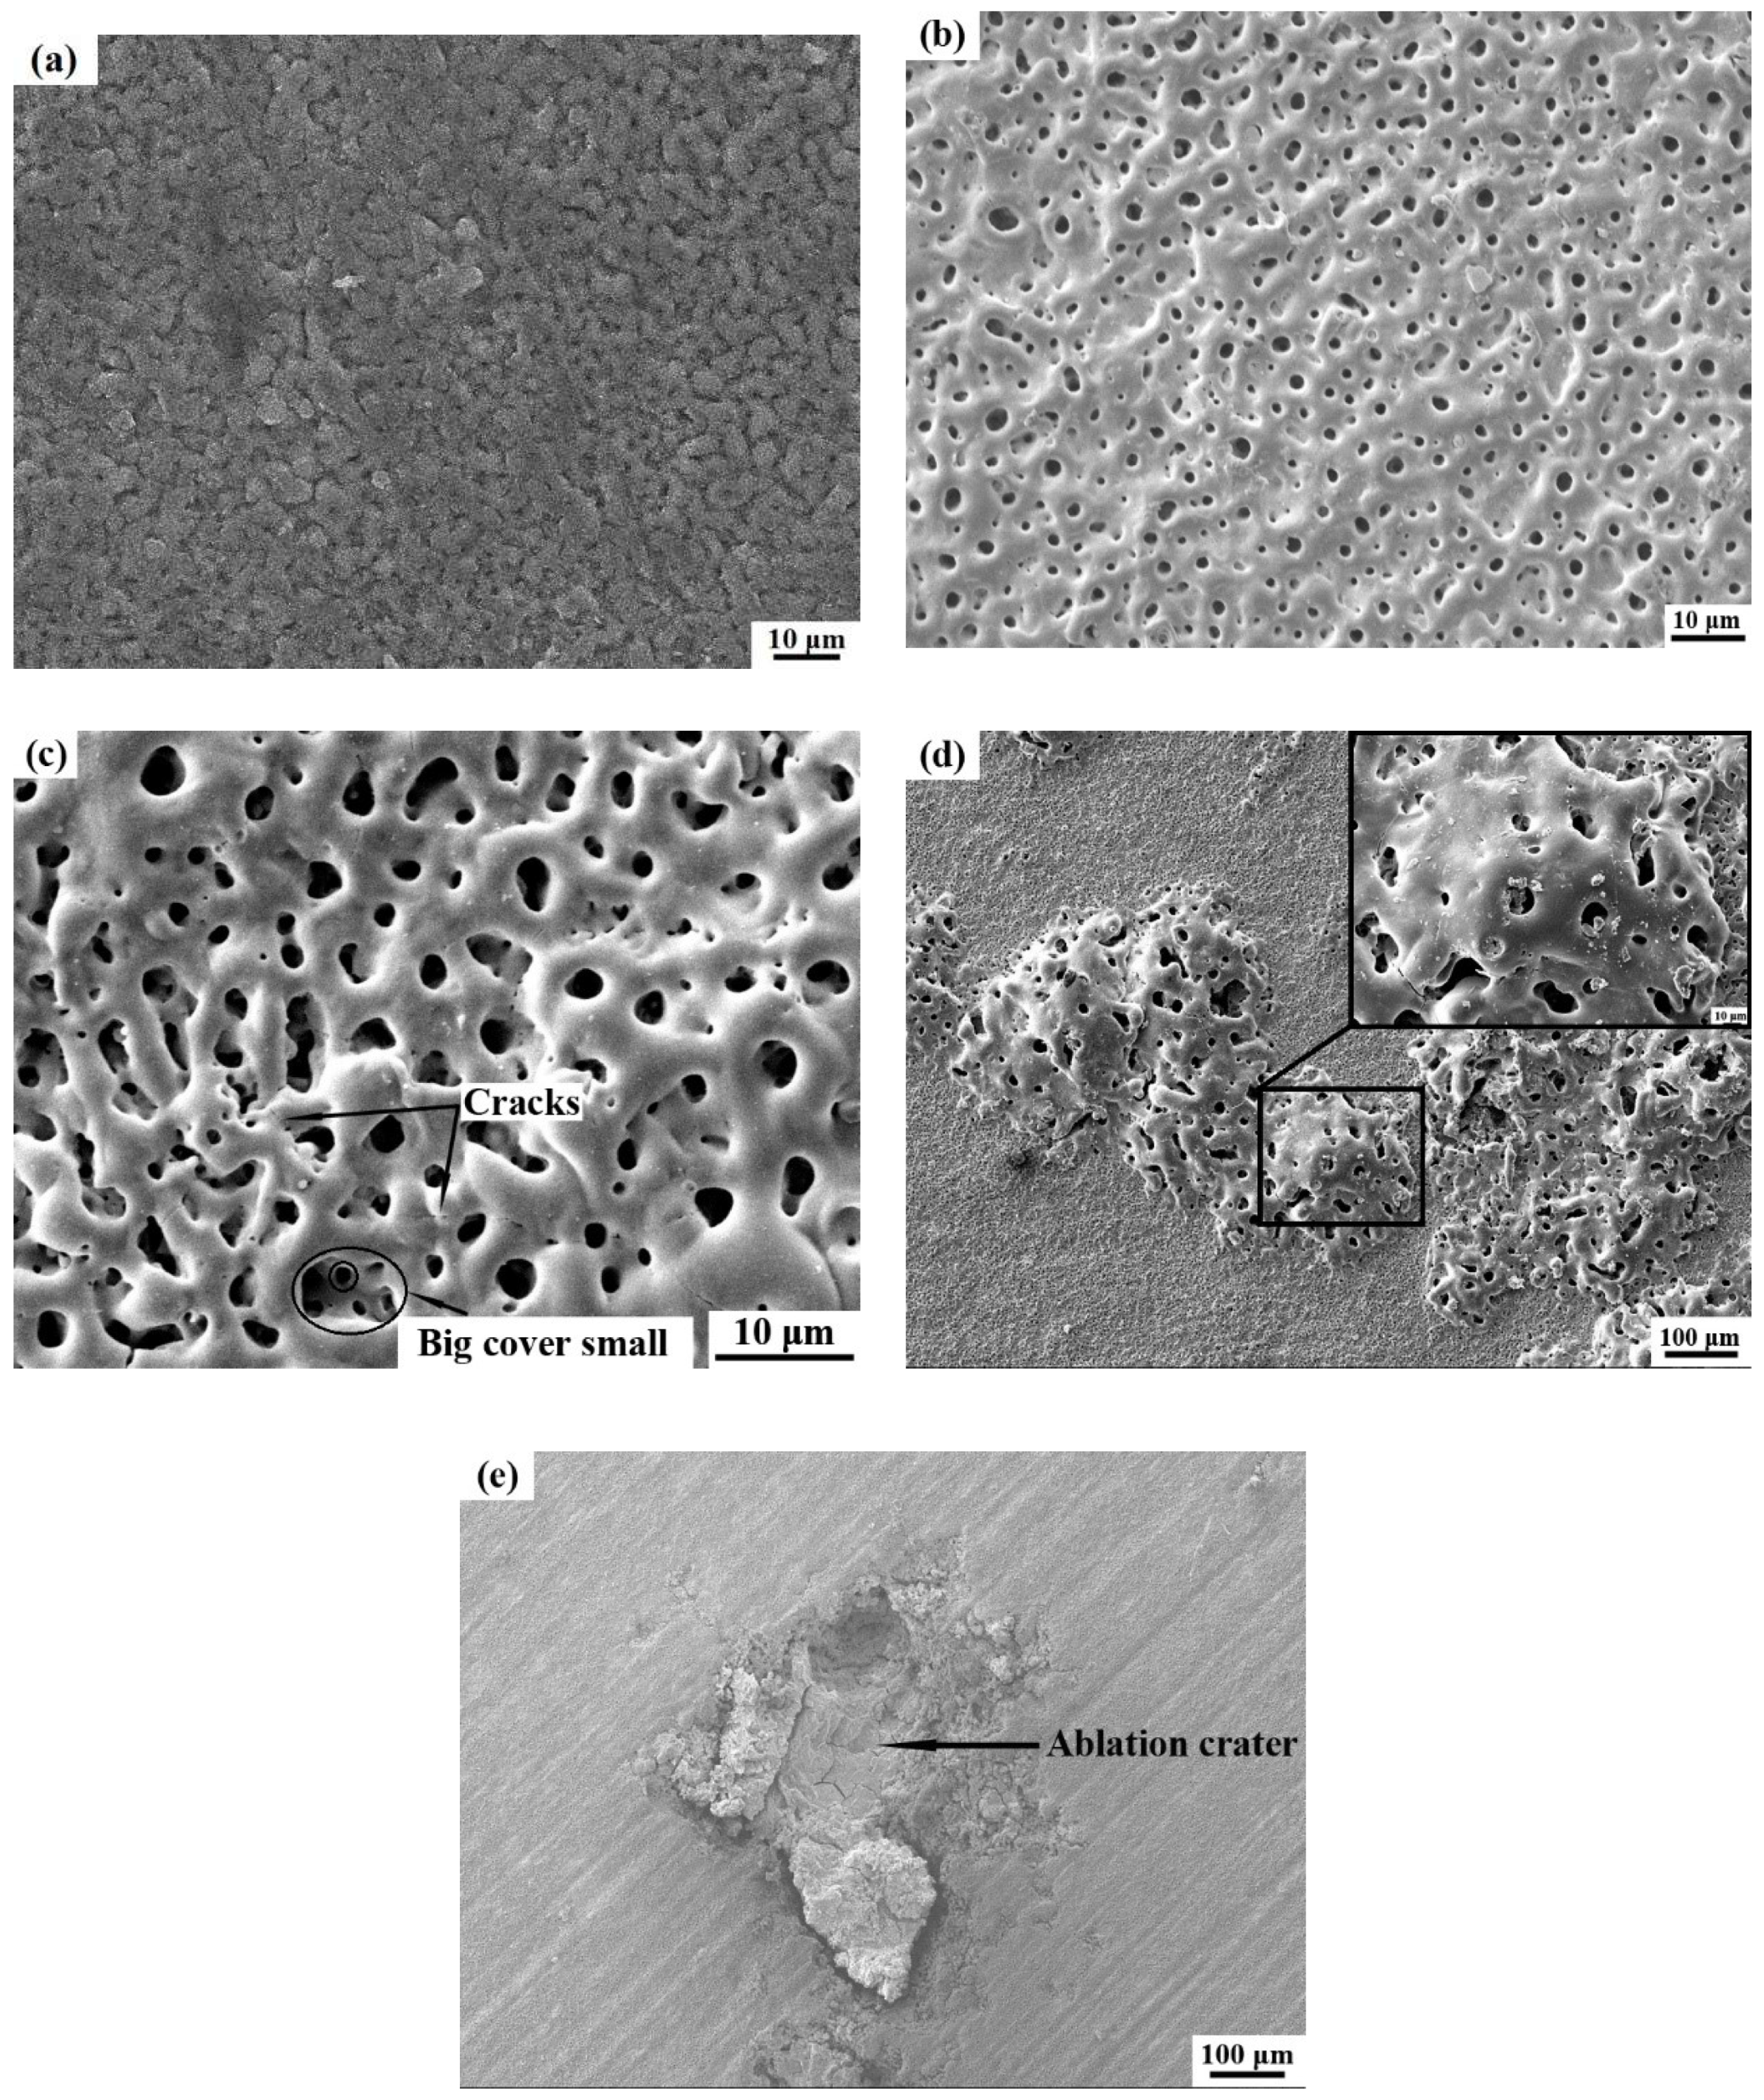
3.1.2. Surface Morphology Evolution of Ceramic Coatings

Advanced SEM technology was employed to characterize the surface morphology evolution of ceramic coatings. Figure 3 exhibits the surface morphology at different coatings where the frequency was 500 Hz, the duty cycle was 30% (cooling time 1.4 ms) and the voltage was 150 V, 250 V, 400 V for the ablation crater, respectively. At the anodic oxidation stage, the coating was worm-like with no obvious holes observed as shown in Figure 3a. This is because when the voltage is low, it is difficult to break down the film layer in most areas of the sample surface, and the arc discharge is not severe, resulting in a low temperature around the sample, and it is difficult to melt the metal surface to form a porous-structure film layer. With the voltage increased to 250 V, the morphology of coatings showed dramatic differences compared with anodic oxidation coatings, as shown in Figure 3b. Micro-pores with diameters of about 1 μm to 2 μm were uniformly distributed on the surface of the sample. The results demonstrated that these micro-pores are channels for local arc discharge, in agreement with the results in Figure 2b. Afterwards, the ceramic coating surface presents two morphologies, as shown in Figure 3c and Figure 3d, respectively. When the voltage was up to 400, the holes on the surface of the ceramic coating increased significantly, and the structure of large holes covering small holes appeared, as can be seen in the circle of Figure 3c. This fact suggests that large-arc discharge is not only the intensification of arc discharge and the enlargement of the isolated arc, but also the overlapping of several arcs over the time scale. As the voltage gradually increased during the micro-arc oxidation process, the film became thicker and breakdown became difficult. When the voltage increased, the arc discharge was more intense, and the micro-arc oxidation effect was intensified, so that the pore size of the coating surface became larger. The more violent arc discharge caused the molten metal oxides jet to the surface or backfill the original pores, and then the molten metal oxides rapidly cool, shrink and solidify, leading to a residual stress increase; thus, micro-cracks appeared on the surface of the coating. In some areas with serious large-arc discharge, fluffy bulge deposits can be seen on the surface of the sample in Figure 3d. The pore sizes reached 10 to 20 μm. Even more, if the arc intensified further, it will lead to severe ablation of the coating, as clearly shown in Figure 3e. Obviously, a large-arc discharge will severely damage the coating structures, which will greatly reduce the service performance of the coating. Therefore, large-arc discharge should be avoided as much as possible.

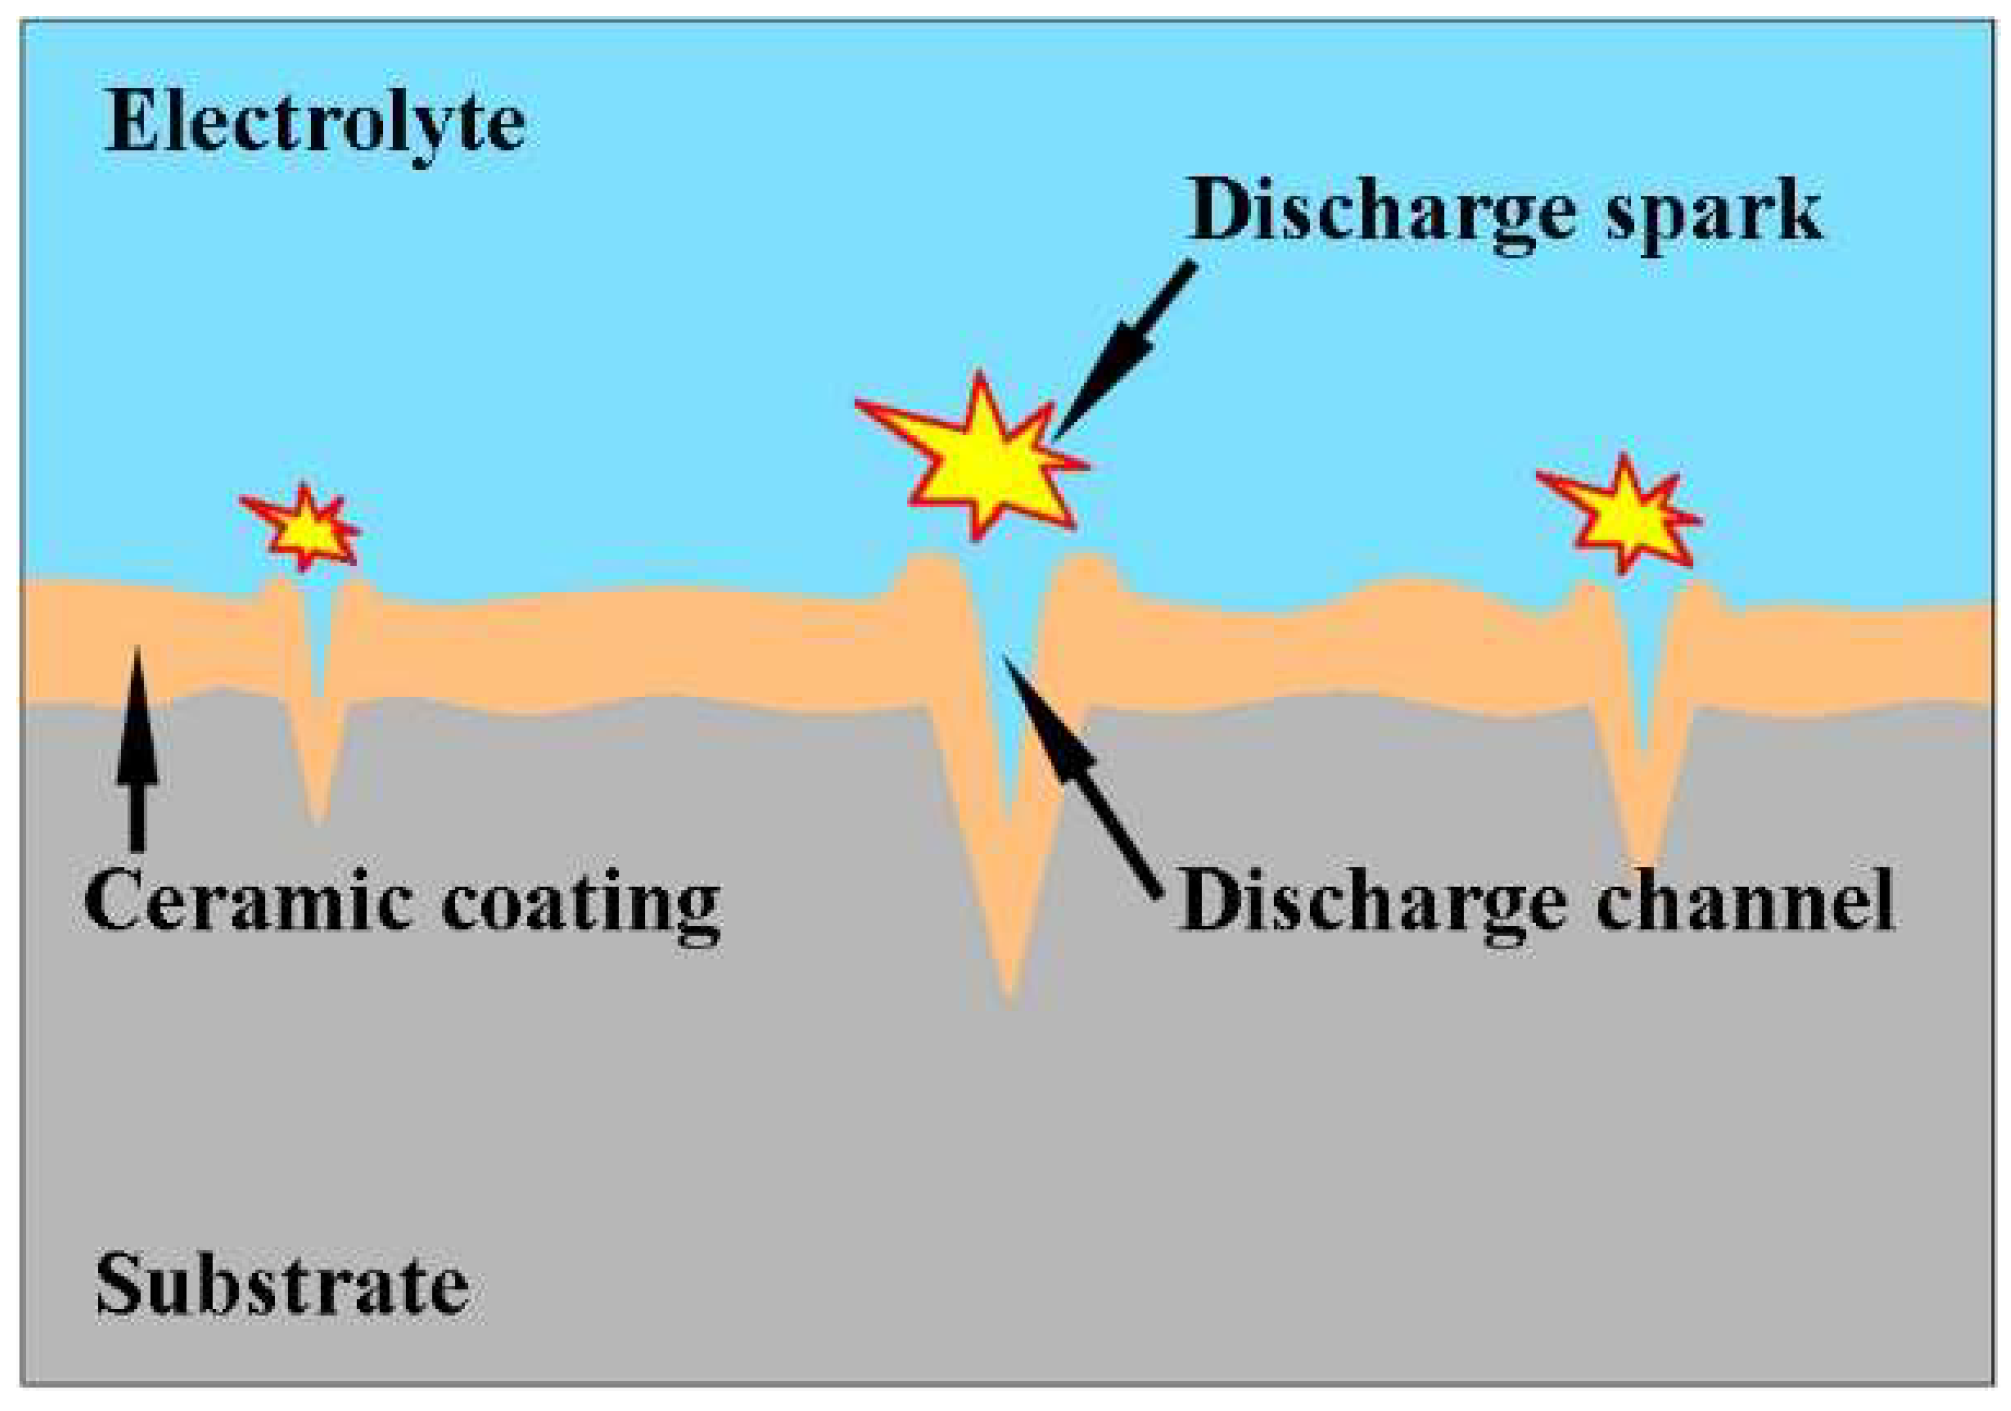
3.2. Formation Mechanism of Large-Arc Discharge

3.2.1. Phase Structure Evolution of Ceramic Coatings

The XRD pattern obtained from the coating surface is shown in Figure 4. The results indicated that the coatings were mainly composed of Mg, MgO, Mg2SiO4, and Al12Mg17. The Si element comes from the electrolyte, and the others come from the magnesium alloy matrix. It can be seen that the main component of the film is MgO, and the highest peak value reached 2308.97. The difference is that when the voltage is 400 V, the content of Mg and Al12Mg17 increased. The MgO magnesia and Mg2SiO4 transform into MgO periclase and Mg2SiO4 forsterite due to the effect of high temperature. As is well known, arc is a phenomenon of intense luminescence and thermal radiation caused by a strong negative resistance effect in the process of gas or steam being ionized under strong electric fields and changing from insulator to conductor. Arc temperature is related to gas composition, pressure and ionization degree. When the ionization degree is 0.2, the arc temperature of common gas and metal vapor is usually higher than 5000 K, and the arc temperature of oxygen is higher than 12,000 K. As mentioned above, the micro-arc oxidation coating is formed by a series of metal oxides accumulated by discrete arc discharge. The schematic diagram of the micro-arc discharge mechanism is shown in the Figure 5. As the voltage loaded on the aluminum alloy substrate continues to rise, and exceeds the breakdown voltage of the substrate, it first breaks down some weak points on the oxide-insulating film, and a micro-arc discharge occurs, instantly forming an ultra-high temperature area to ionize the gas. The energy is reduced, the degree of ionization is increased, and the discharge and oxidation processes are more severe, resulting in the melting or even gasification of the oxide and the base metal. The huge temperature difference causes the molten metal oxide to cool rapidly and shrink in volume. Since the heat loss along the heat conduction direction of the metal is faster than that of the oxide ceramic film and the solution, the volume shrinks greatly, leaving a surface hole similar to a crater. It can be considered that a large-arc discharge leads to a temperature rise and high-temperature sintering phase is created. Thereby, the arc discharge is more likely to discharge at the original arc discharge location; that is, arc discharge gathers or merges to form a continuous arc discharge or big arc points. It is demonstrated that the arc discharge has a self-reinforcing effect and, therefore, requires cooling time to dissipate heat and disperse the arc discharge.

3.2.2. Analysis of Load Characteristics

The current data show that in the micro-arc oxidation process, with the extension of the micro-arc oxidation treatment time, the thickness of the ceramic coating increases, the working voltage increases, and the large-arc discharge stage is inevitably entered. Therefore, an effective method should be proposed to suppress large-arc discharge. In order to verify the influence of cooling time on large-arc discharge, the load characteristic model is used to estimate the working voltage evolution in one cycle of micro-arc oxidation, and the influence of cooling time on large-arc discharge is investigated by the waveforms of voltage and current output.
The negative voltage in this experiment was constant at 40 V, and the positive voltage-loading method was the same as above. Figure 6a is the load voltage and current waveforms recorded by the oscilloscope when the power supply mode is bipolar pulse mode. It can be seen that although the power supply output is a square wave pulse voltage, the load voltage presents a similar saw-tooth waveform. The load voltage dropped gradually during pulse output shutdown, similar to capacitor discharge. The maximum value of the positive current appeared at the rising edge of the positive voltage pulse, while the maximum value of the negative current appeared at the front edge of negative voltage pulse, with a large peak value, rapid change and short duration, similar to differential circuit, indicating that the load presents strong capacitance. It can be seen that the capacitive characteristics of the load in the micro-arc oxidation process makes the load charge in the positive pulse cycle. When the positive pulse ends, the load will reverse discharge, so a certain discharge time is needed. In the case of the arc discharge occurring during positive pulse period, the negative pulse period will be forced to extinguish the arc discharge and the load voltage is forced down to zero or negative voltage [25]. However, due to the influence of load capacitance, when the duty ratio is large, the negative pulse period is short, insufficient to fully discharge and extinguish the arc. This is the process of natural arc quenching. Therefore, in order to force the arc to extinguish, the pulse power supply method with a discharge loop is adopted under the same parameters; the output waveforms of load voltage and current are shown in Figure 6b. When the positive pulse cycle ends, the forced load voltage drops to 0; that is, forced arc extinguishing, and the output waveform is a sine square wave. The cooling time provides time for the complete discharge of the load capacitance, forcing the arc to be extinguished and making the arc discrete, thus effectively avoiding the problem of large-arc discharge.

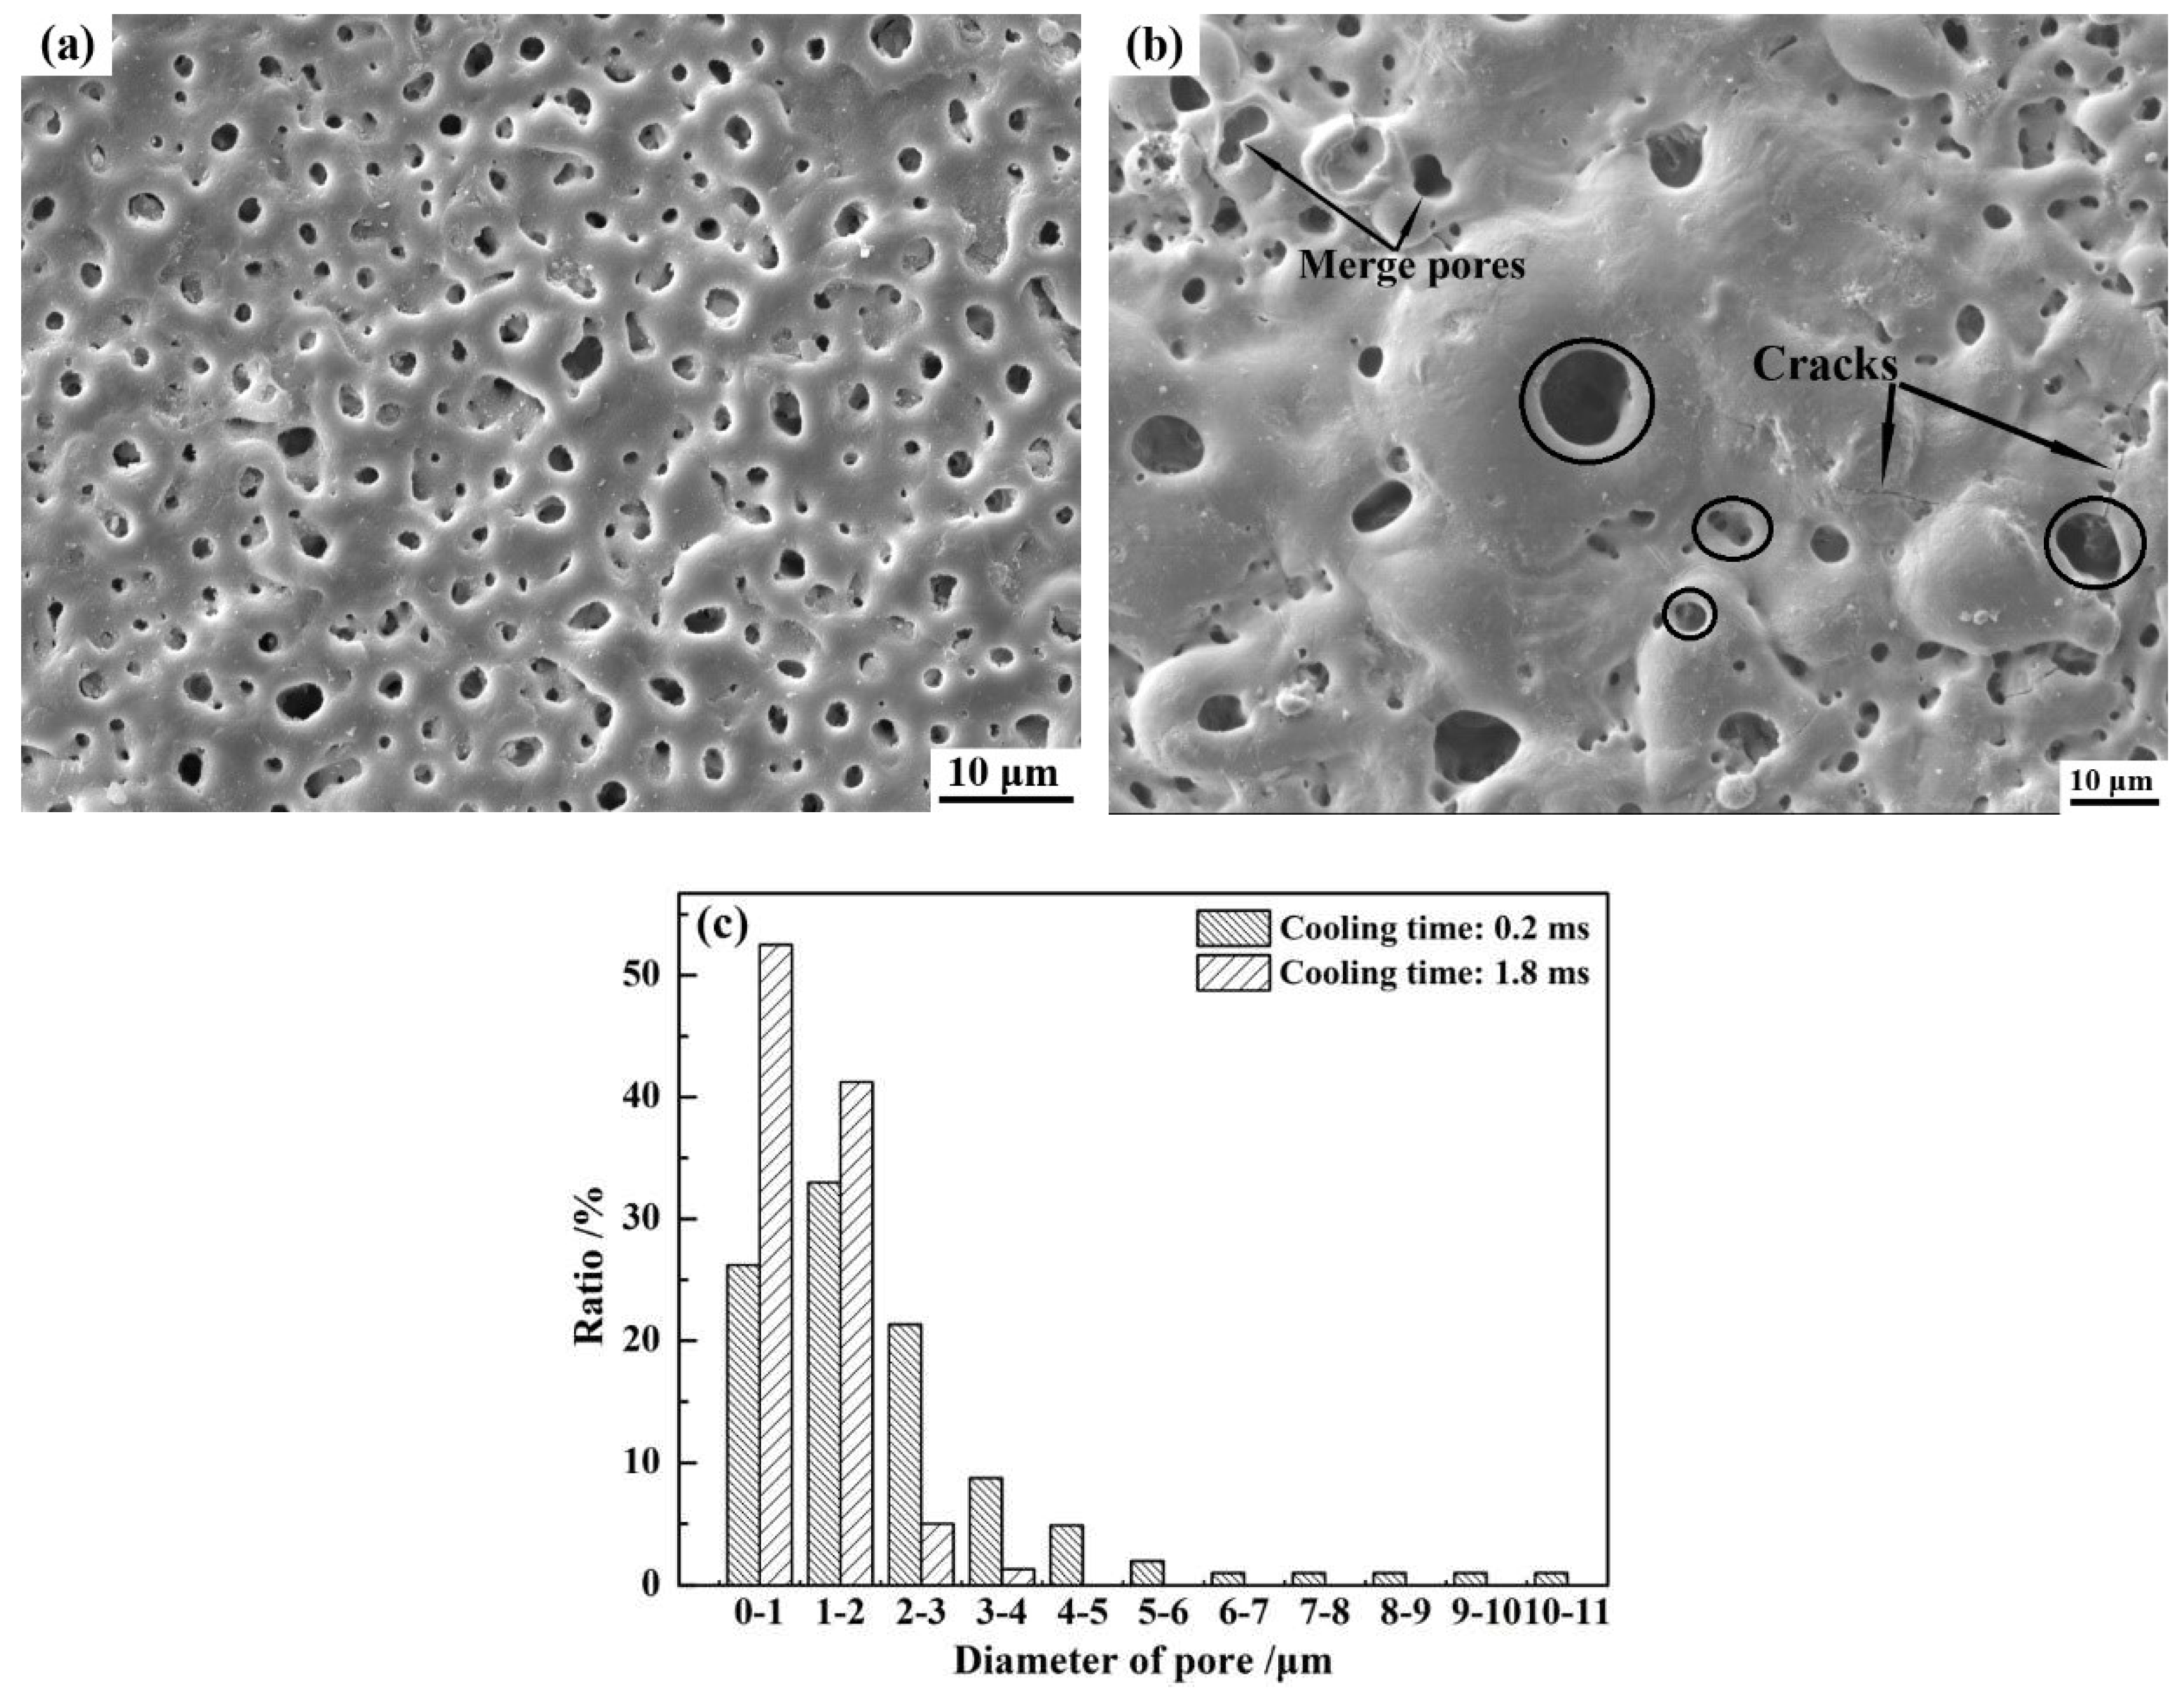
3.3. Effect of Cooling Time

3.3.1. Surface Morphology of Coatings

Figure 7a,b show the surface morphology of the coatings formed by MAO at a frequency of 500 Hz and the duty cycle of 10% and 90%, which represent cooling times of 1.8 ms and 0.2 ms, respectively, in the same cycle. It can be clearly seen that many micrometer-sized cavities were directed into the coatings. Such a feature can be attributed to the local-arc discharge. As shown in Figure 7a, the surface morphology of the coating is smooth, and the pore sizes are smaller than in Figure 7b. With the shortening of cooling time, the surface micro-pore size increased significantly. Bulging sintered oxides and micro-cracks appeared on the surface. Moreover, nano-scale pores can be found in large pores as shown in the ring type tag in Figure 7b. The diameter of pores decreased from 10.05~0.78 μm to 3.29~0.17 μm, and the distribution is shown in Figure 7c. More than 93.75% of the pore diameter is less than 2 μm when the cooling time is 1.8 ms. Moreover, there were no pores larger than 4 μm in diameter. On the contrary, with the cooling time reduced to 0.2 ms, the ratio of pores with diameters exceeding 2 μm reached 40.79%. The results indicated that with the shortening of cooling time, the arc discharge density decreased, while the intensity increasing led to an increase of the micro-arc discharge channel size. Therefore, more oxides are molten and sprayed outside on the surface of the coating. Then, s solidification- and accumulation-formed large-sized molten oxides were present, and the surface of the coating became rough. It can be concluded that cooling time has a significant effect on the surface morphology of the coating. It can be inferred that the insufficient cooling time will lead to the aggregation or merger of arc discharge and the occurrence of the large-arc discharge problem.

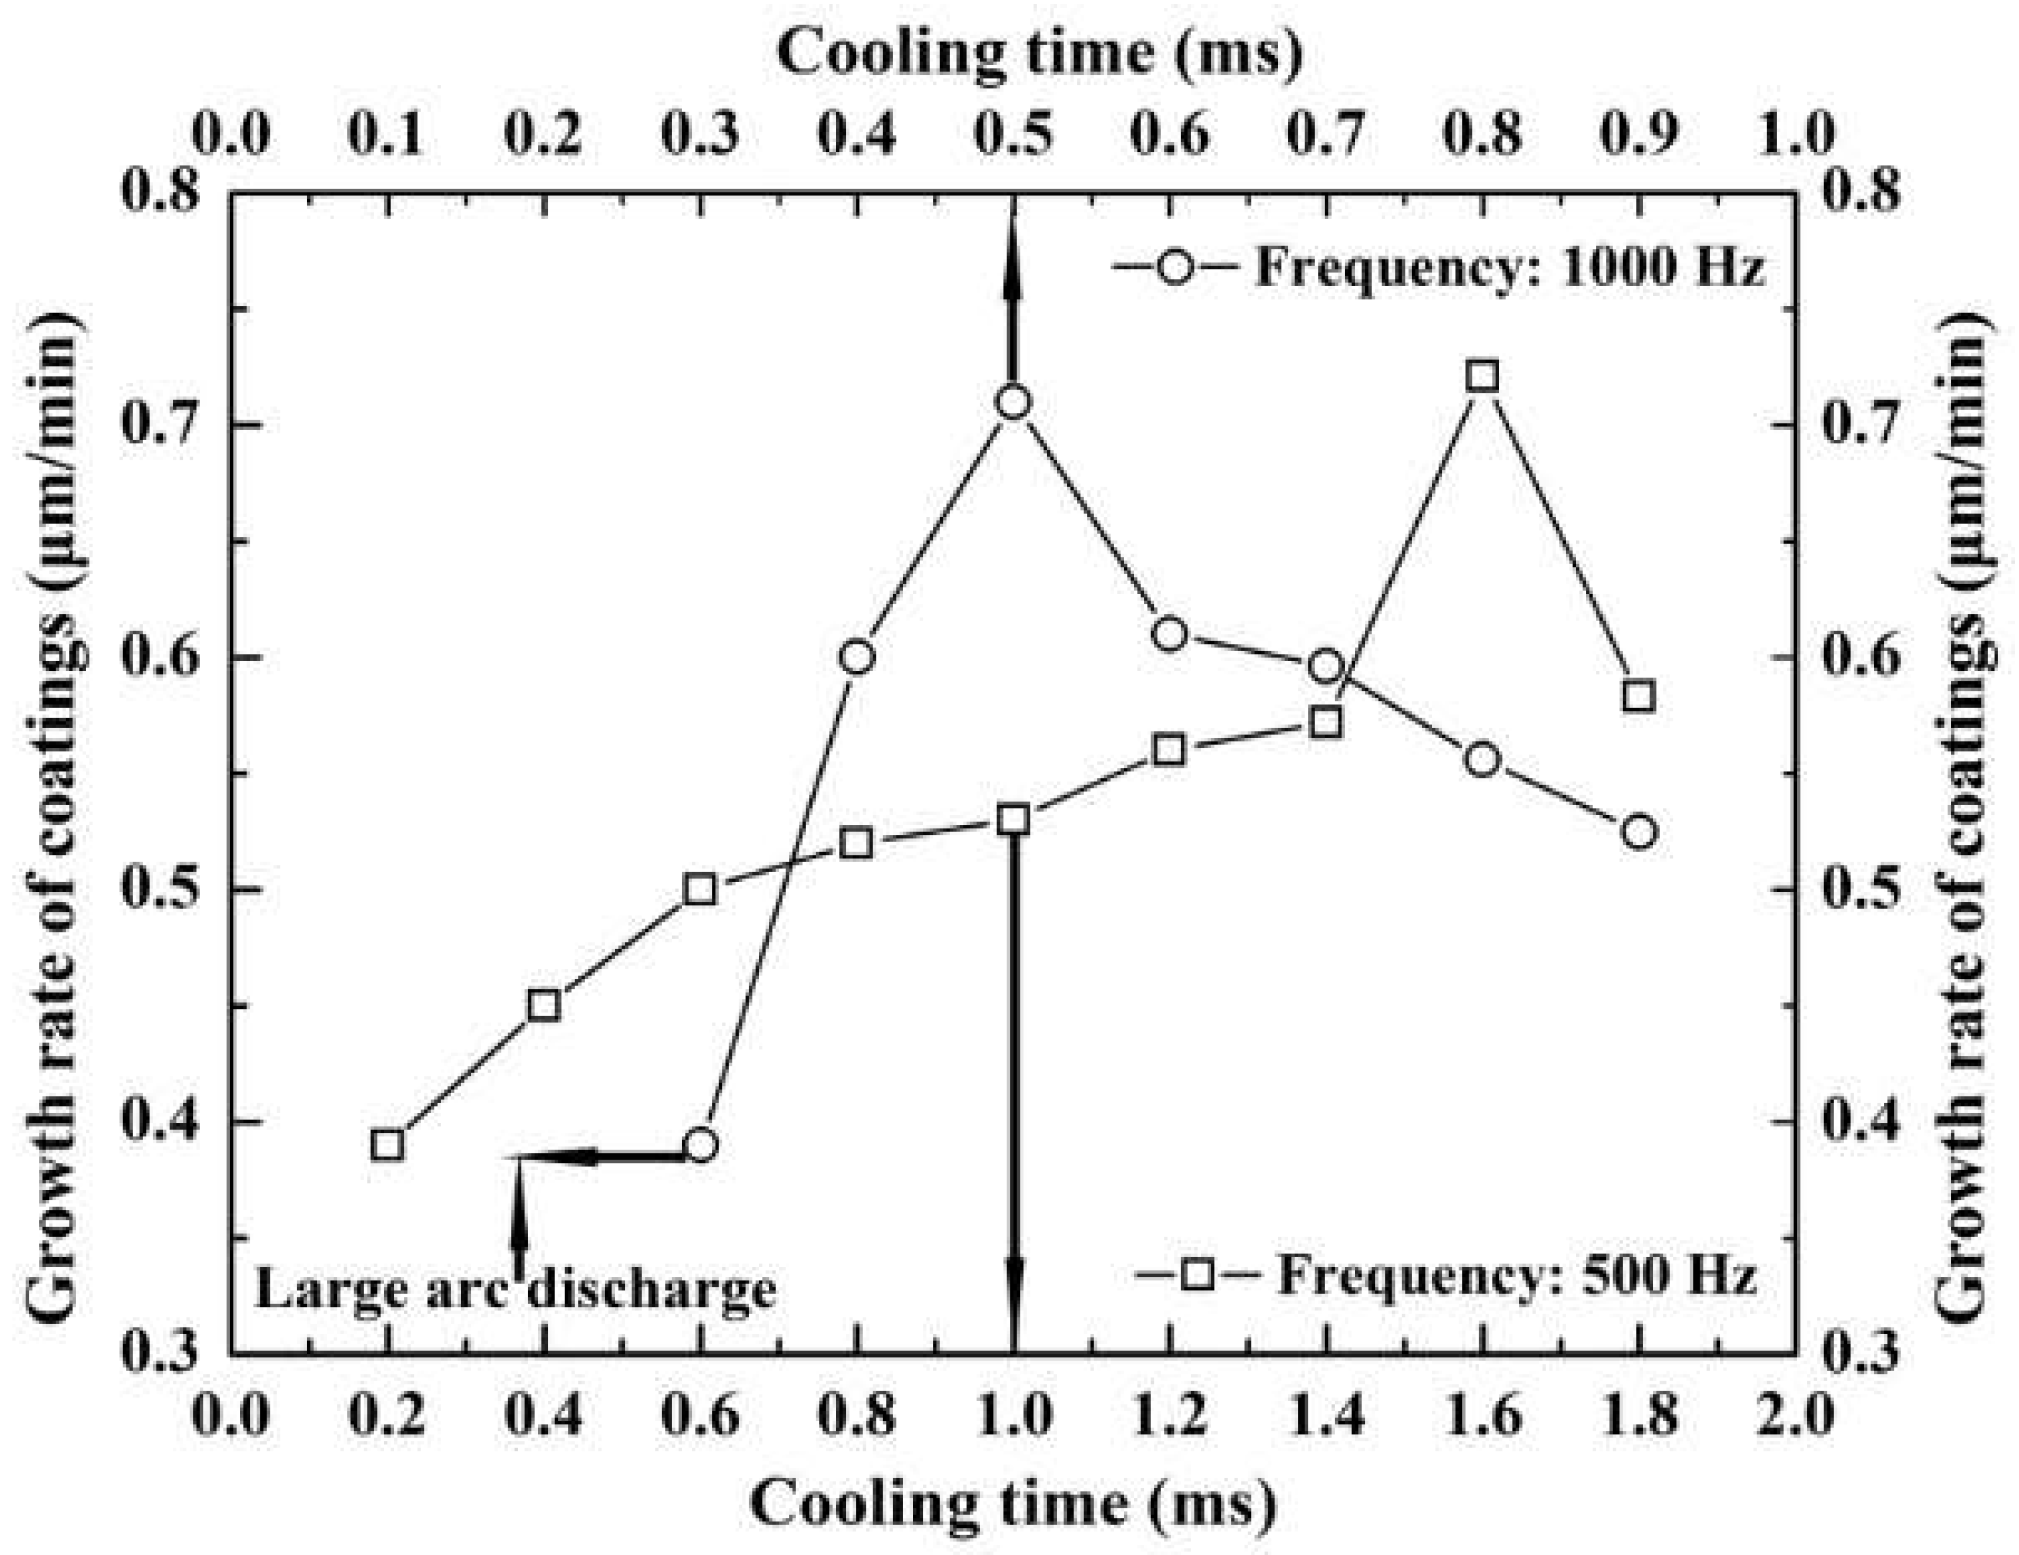
3.3.2. Growth Rate of Coatings

With the cooling time shortened, the coating growth rate firstly increased and then decreased at the same frequency. The maximum coating growth rate corresponds to cooling times of 1.6 ms and 0.5 ms, and the duty cycle was 20% and 50% and the frequency was 500 and 1000, respectively, as shown in Figure 8. It can be clearly seen that with the increase in frequency, the cooling time became shortened for the rapid growth of the coating. However, the large-arc discharge is more likely to occur at the same time. In the process of micro-arc oxidation, the growth rate of coatings is mainly determined by the number of pulses per unit time and the energy of a single pulse. Thus, the short cooling time corresponds to a large frequency, and the number of pulses per unit time is large, but the energy of a single pulse is reduced. Conversely, when the cooling time is long, the frequency is small and the number of pulses per unit time decreases, but the energy of a single pulse increases [26]. Therefore, when the number of pulses per unit time and the single pulse acted simultaneously, which would make all conductive channels in different parts and the same part break down, the film-forming rate reached the maximum. However, as the cooling time continues to shorten, the energy of a single pulse becomes the dominant factor, which is not enough to cause a large number of conductive channels to be broken down, so the coating-forming rate shows a downward trend. It can be obviously found that longer or shorter cooling times are not better, but somewhere in between is ideal, as shown in Figure 8.

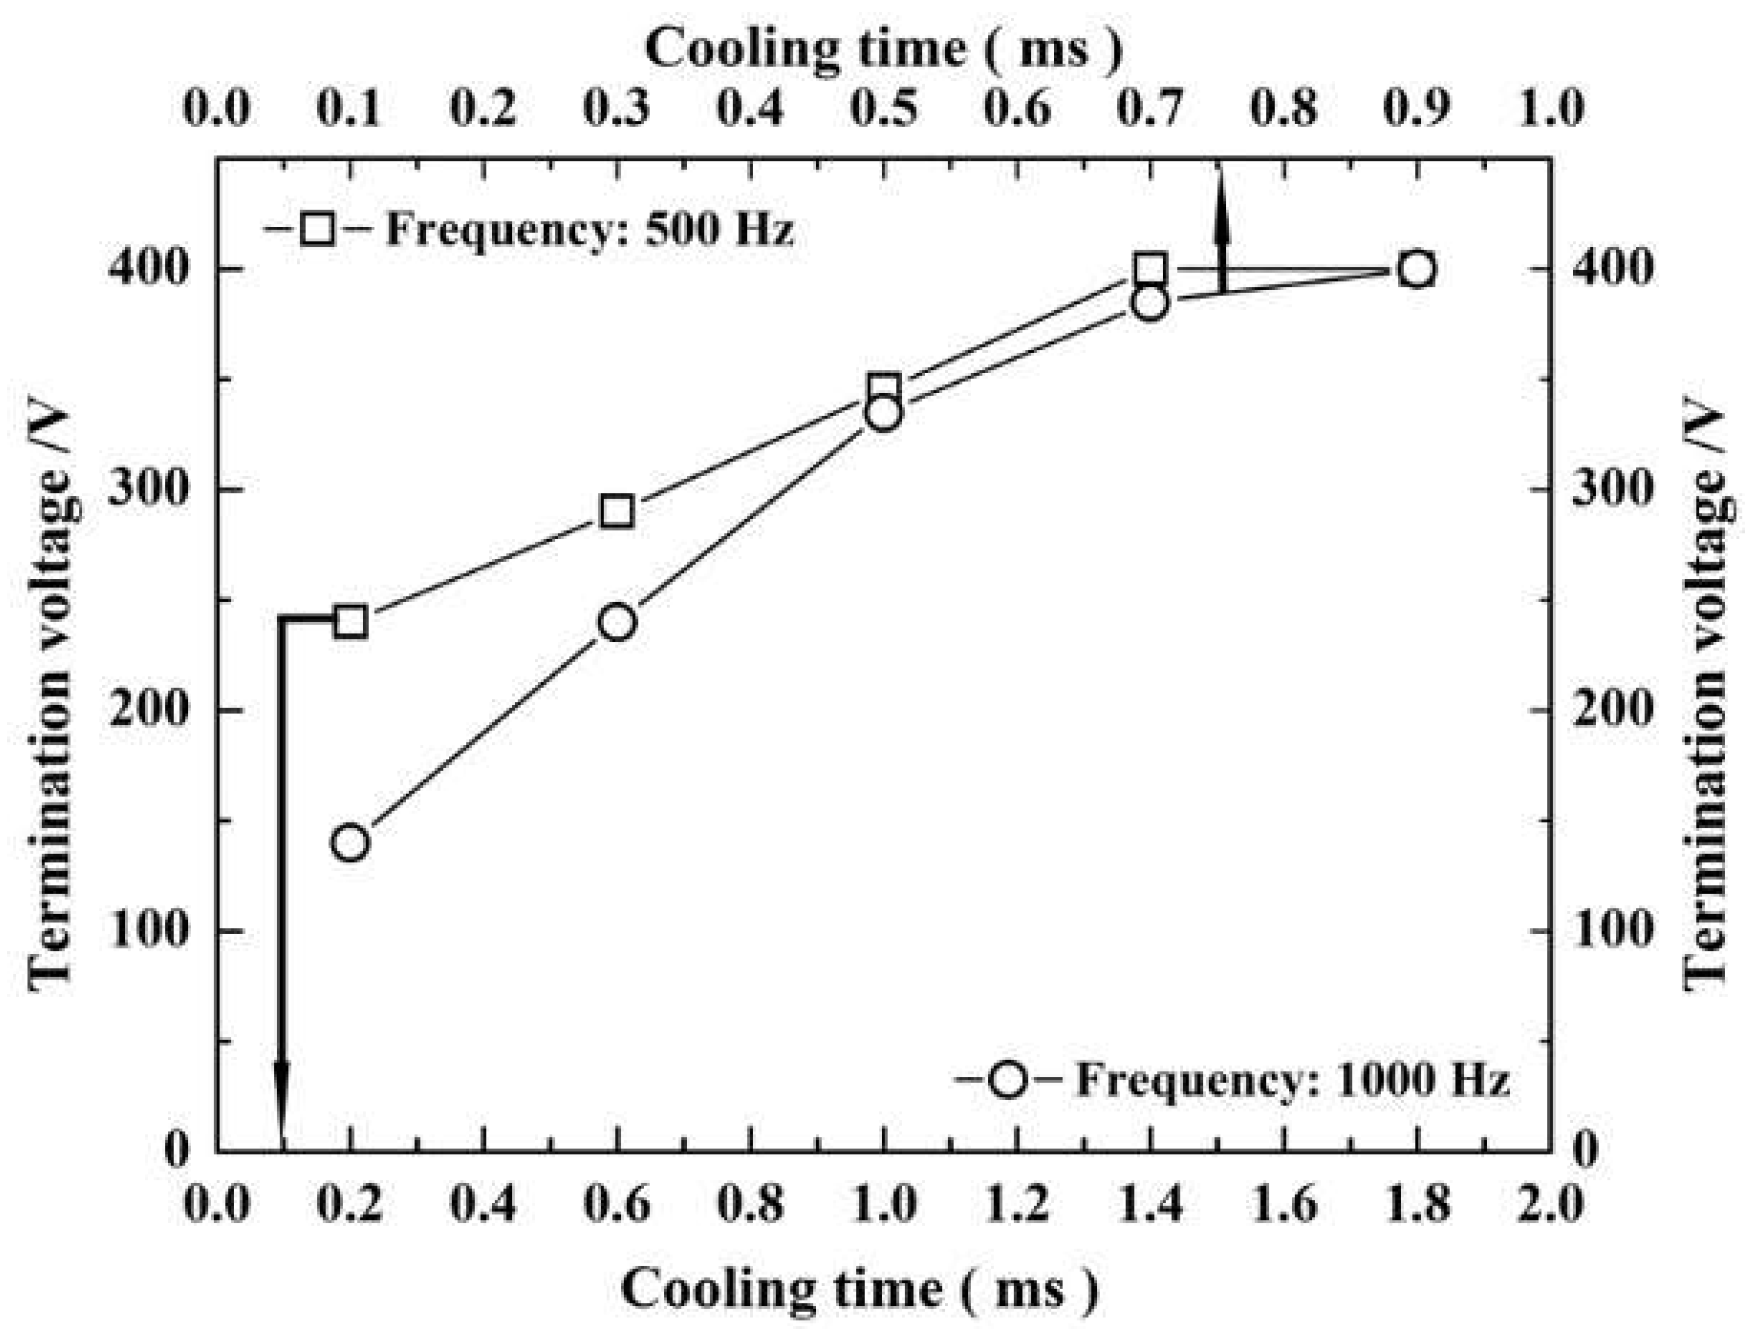
3.3.3. Tendency of Large-Arc Discharge

As pointed out previously, the large-arc phenomenon is affected by both frequency and duty cycle. Figure 9 shows the tendency of large-arc discharge at the frequency is 500 Hz and 1000 Hz, the duty cycle is from 10% to 90%. At the same frequency, with the increase of duty cycle and the decrease of cooling time, the lower the limit voltage of large-arc discharge, the more serious the large-arc tendency. When the frequency is small, the tendency of large-arc discharge will be greatly reduced even if the duty cycle increases and the cooling time is shortened. This can be attributed to the fact that although the cooling time is shortened, the cooling time can still meet the needs of arc discretization due to the extension of pulse period. It can be clearly seen that lower frequency and smaller duty cycle can improve the termination voltage of micro arc oxidation process and reduce the tendency of large-arc discharge problem.

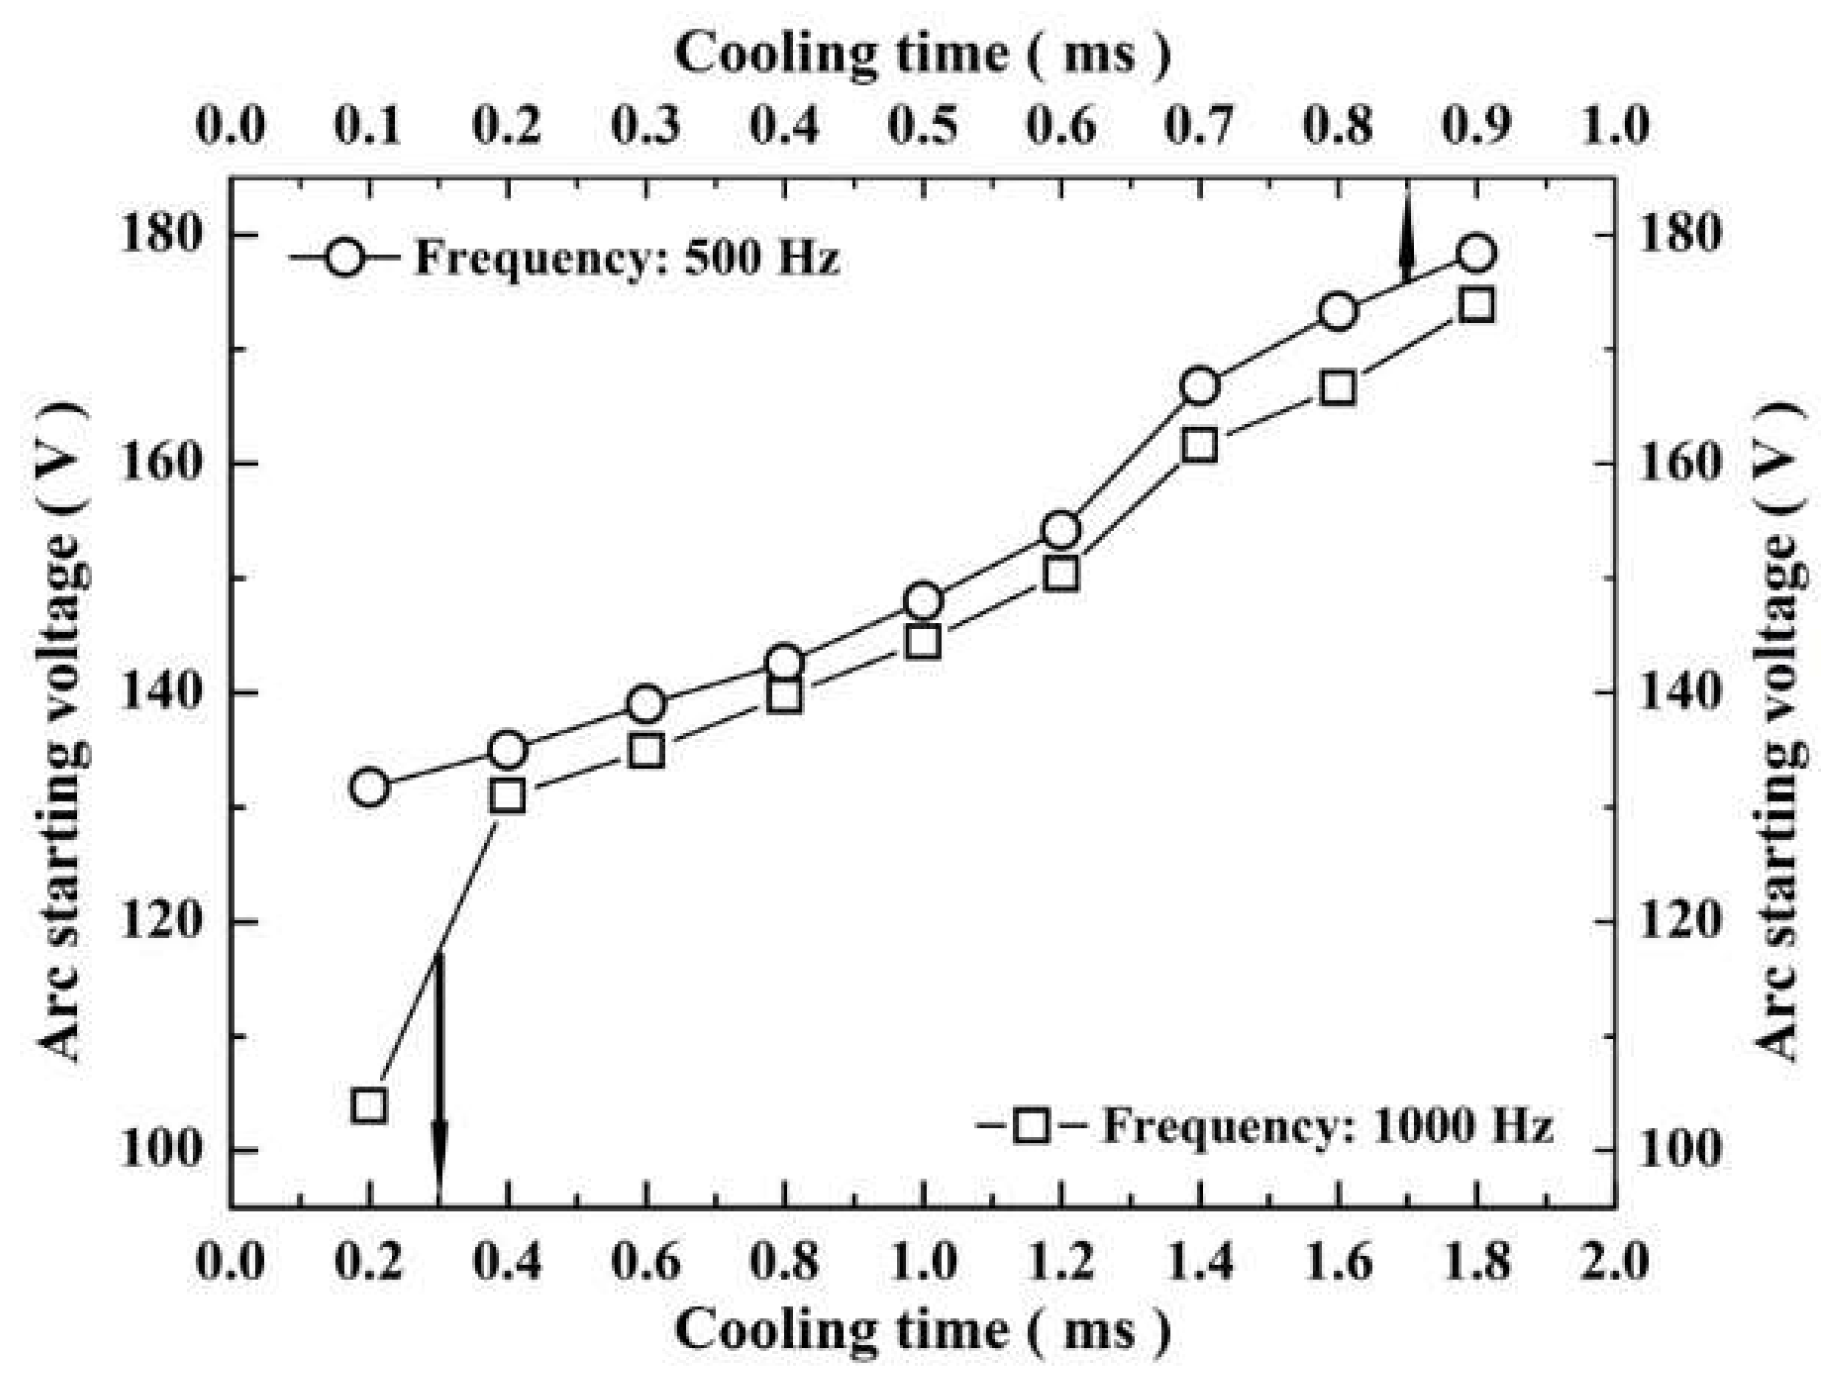
3.3.4. The Arc Starting Voltage

Figure 10 shows the relationship between arc starting voltage and cooling time when the frequency is 500 Hz and 1000 Hz and the duty cycle is from 10% to 90%. It can be seen that the arc starting voltage increases with the prolonging of cooling time. Arc starting voltage is the minimum voltage required for the gas in the conductive channel to be broken down and produce sparks. It is assumed that the heat absorption and heat dissipation per unit time are certain, and the heat dissipation increases when the cooling time is prolonged. Therefore, the number of conductive channel breakdowns will be reduced due to the reduction of energy at the same time, so the number of conductive channel breakdowns must be increased through voltage supplements, so the arc starting voltage gradually increases. It is well known that the coating thickness of micro-arc oxidation increases with increasing voltage. However, the large-arc discharge is due to the voltage being too high, and the arc in a location of continuous combustion, so that the coating surface is ablated and the substrate destroyed. Therefore, with the increase of the arc starting voltage, the termination voltage of the micro-arc oxidation will be reduced, and the large-arc discharge will occur when the termination voltage value is low, which will limit the thickness of the coating. In the case of the above relationship between cooling time and termination voltage, sufficient cooling time can effectively suppress the large-arc problem. Although the arc starting voltage increases at a long cooling time, the termination voltage is still higher than that in the case of a short cooling time. It can be considered that the effect of the arc starting voltage on large-arc discharge is limited and much lower than that of the cooling time.

4. Conclusions

In this study, the evolution of arc discharge and the effect of cooling time on large-arc discharge are investigated. The mechanism of large-arc discharge and the effect of cooling time are put forward by discussing the mechanism of local-arc discharge and the characteristics of load in micro-arc oxidation. The results show that the large-arc dis-charge in the micro-arc oxidation process is the intensification of the arc discharge and the expansion of a single arc, and it is also the overlap of several arcs on the time scale. The instantaneous high temperature increases the temperature of the microscopic region, and the arc is easily discharged at the original arc position, which has a self-enhancing effect, which leads to the aggregation or merger of arc points. The large-arc discharge coating presents a much looser structure with remarkably increased micro-pore diameter compared with conventional coating. Therefore, the phenomenon of large-arc discharge should be avoided as much as possible. A prolonged cooling time can reduce the tendency of large-arc discharge and decrease the micro-pore diameter, although the arc starting voltage goes up. It is indicated that the cooling time has more effect on the large-arc discharge than the pulse frequency. The growth rate of ceramic coating increases first and then decreases with the prolonging of the cooling time. As the pulse frequency increases, less cooling time is required, but the large-arc tendency increases. The cooling time not only provides conditions for the cooling of molten oxides created during micro-arc oxidation, but also makes the load capacitation discharge fully, so as to discretize the arc discharge and effectively avoid the problem of large-arc discharge.

Author Contributions

Conceptualization, J.-T.Y.; data curation, K.-X.G.; formal analysis, L.-S.W.; investigation, K.-X.G.; methodology, H.D.; resources, H.D.; writing—original draft, J.-T.Y. and K.-X.G.; writing—review and editing, L.-S.W.; validation, H.D.; supervision, H.D. and L.-S.W. All authors have read and agreed to the published version of the manuscript.

Funding

The present project is financially supported by the Fund for the National Natural Science Foundation of China (Grant No. 52001254); the Natural Science Foundation of Shaanxi Province (grant number 2020JQ-771); Materials Science and Engineering of Provincial Advantage Disciplines, Xi’an Shiyou University (No. YS37020203) and Key Laboratory of High-Performance Oil and Gas Field Materials, School of Material Science and Engineering, Xi’an Shiyou University.

Data Availability Statement

Not applicable.

Conflicts of Interest

The authors declare no conflict of interest.

References

  1. Xue, Y.; Pang, X.; Jiang, B.; Jahed, H. Influence of Micro-arc Oxidation Coatings on Corrosion Performances of AZ80 cast alloy. Int. J. Electrochem. Sci. 2018, 13, 7265–7281. [Google Scholar] [CrossRef]
  2. Xue, Y.; Pang, X.; Karparvarfard, S.M.H.; Jahed, H.; Luo, S.; Shen, Y. Corrosion Protection of ZK60 Wrought Magnesium Alloys by Micro-Arc Oxidation. Metals 2022, 12, 449. [Google Scholar] [CrossRef]
  3. Lin, Z.; Wang, T.; Yu, X.; Sun, X.; Yang, H. Functionalization treatment of micro-arc oxidation coatings on magnesium alloys: A review. J. Alloys Compd. 2021, 879, 160453. [Google Scholar] [CrossRef]
  4. Muhaffel, F.; Cimenoglu, H. Development of corrosion and wear resistant micro-arc oxidation coating on a magnesium alloy. Surf. Coat. Technol. 2019, 357, 822–832. [Google Scholar] [CrossRef]
  5. Jin, S.; Ma, X.; Wu, R.; Wang, G.; Zhang, J.; Krit, B.; Betsofen, S.; Liu, B. Advances in micro-arc oxidation coatings on Mg-Li alloys. Appl. Surf. Sci. Adv. 2022, 8, 100219. [Google Scholar] [CrossRef]
  6. Yao, W.; Wu, L.; Wang, J.; Jiang, B.; Zhang, D.; Serdechnova, M.; Shulha, T.; Blawert, C.; Zheludkevich, M.L.; Pan, F. Micro-arc oxidation of magnesium alloys: A review. J. Mater. Sci. Technol. 2022, 118, 158–180. [Google Scholar] [CrossRef]
  7. Li, Q.; Yang, W.; Liu, C.; Wang, D.; Liang, J. Correlations between the growth mechanism and properties of micro-arc oxidation coatings on titanium alloy: Effects of electrolytes. Surf. Coat. Technol. 2017, 316, 162–170. [Google Scholar] [CrossRef]
  8. Rakoch, A.; Monakhova, E.; Khabibullina, Z.; Serdechnova, M.; Blawert, C.; Zheludkevich, M.; Gladkova, A. Plasma electrolytic oxidation of AZ31 and AZ91 magnesium alloys: Comparison of coatings formation mechanism. J. Magnes. Alloy. 2020, 8, 587–600. [Google Scholar] [CrossRef]
  9. Zhao, Z.; Pan, Q.; Yan, J.; Ye, J.; Liu, Y. Direct current micro-arc oxidation coatings on Al-Zn-Mg-Mn-Zr extruded alloy with tunable structures and properties templated by discharge stages. Vacuum 2018, 150, 155–165. [Google Scholar] [CrossRef]
  10. Li, G.; Wang, Y.; Zhang, S.; Zhao, R.; Zhang, R.; Li, X.; Chen, C. Investigation on entrance mechanism of calcium and magnesium into micro-arc oxidation coatings developed on Ti-6Al-4V alloy. Surf. Coat. Technol. 2019, 378, 124951. [Google Scholar] [CrossRef]
  11. Cengiz, S.; Azakli, Y.; Tarakci, M.; Stanciu, L.; Gencer, Y. Microarc oxidation discharge types and bio properties of the coating synthesized on zirconium. Mater. Sci. Eng. C 2017, 77, 374–383. [Google Scholar] [CrossRef]
  12. Li, Z.-Y.; Cai, Z.-B.; Cui, Y.; Liu, J.-H.; Zhu, M.-H. Effect of oxidation time on the impact wear of micro-arc oxidation coating on aluminum alloy. Wear 2019, 426–427, 285–295. [Google Scholar] [CrossRef]
  13. Xu, J.; Xiao, Q.; Mei, D.; Tong, Y.; Zheng, Y.; Li, L.; Zhong, Z. Microstructure, corrosion resistance and formation mechanism of alumina micro-arc oxidation coatings on sintered NdFeB permanent magnets. Surf. Coat. Technol. 2017, 309, 621–627. [Google Scholar] [CrossRef]
  14. Nashrah, N.; Kamil, M.; Yoon, D.; Kim, Y.; Ko, Y. Formation mechanism of oxide layer on AZ31 Mg alloy subjected to micro-arc oxidation considering surface roughness. Appl. Surf. Sci. 2019, 497, 143772. [Google Scholar] [CrossRef]
  15. Wang, W.; Feng, S.; Li, Z.; Chen, Z.; Zhao, T. Microstructure and properties of micro-arc oxidation ceramic films on AerMet100 steel. J. Mater. Res. Technol. 2020, 9, 6014–6027. [Google Scholar] [CrossRef]
  16. Cui, L.-Y.; Zeng, R.-C.; Guan, S.-K.; Qi, W.; Zhang, F.; Li, S.-Q.; Han, E.-H. Degradation mechanism of micro-arc oxidation coatings on biodegradable Mg-Ca alloys: The influence of porosity. J. Alloys Compd. 2017, 695, 2464–2476. [Google Scholar] [CrossRef]
  17. Li, G.; Wang, Y.; Qiao, L.; Zhao, R.; Zhang, S.; Zhang, R.; Chen, C.; Li, X.; Zhao, Y. Preparation and formation mechanism of copper incorporated micro-arc oxidation coatings developed on Ti-6Al-4V alloys. Surf. Coat. Technol. 2019, 375, 74–85. [Google Scholar] [CrossRef]
  18. Li, X.-J.; Zhang, M.; Wen, S.; Mao, X.; Huo, W.-G.; Guo, Y.-Y.; Wang, Y.-X. Microstructure and wear resistance of micro-arc oxidation ceramic coatings prepared on 2A50 aluminum alloys. Surf. Coat. Technol. 2020, 394, 125853. [Google Scholar] [CrossRef]
  19. Ling, K.; Mo, Q.; Lv, X.; Qin, G.; Yang, W.; Li, L.; Li, W. Growth characteristics and corrosion resistance of micro-arc oxidation coating on Al–Mg composite plate. Vacuum 2022, 195, 110640. [Google Scholar] [CrossRef]
  20. Yao, J.-T.; Wang, S.; Zhou, Y.; Dong, H. Effects of the Power Supply Mode and Loading Parameters on the Characteristics of Micro-Arc Oxidation Coatings on Magnesium Alloy. Metals 2020, 10, 1452. [Google Scholar] [CrossRef]
  21. Dai, W.; Li, C.; He, D.; Jia, D.; Zhang, Y.; Tan, Z. Influence of duty cycle on fatigue life of AA2024 with thin coating fabricated by micro-arc oxidation. Surf. Coat. Technol. 2019, 360, 347–357. [Google Scholar] [CrossRef]
  22. Zhang, J.; Fan, Y.; Zhao, X.; Ma, R.; Du, A.; Cao, X. Influence of duty cycle on the growth behavior and wear resistance of micro-arc oxidation coatings on hot dip aluminized cast. Surf. Coat. Technol. 2018, 337, 141–149. [Google Scholar] [CrossRef]
  23. Ly, X.; Yang, S.; Nguyen, T. Effect of equal channel angular pressing as the pretreatment on microstructure and corrosion behavior of micro-arc oxidation (MAO) composite coating on biodegradable Mg-Zn-Ca alloy. Surf. Coat. Technol. 2020, 395, 125923. [Google Scholar] [CrossRef]
  24. Bai, L.; Dong, B.; Chen, G.; Xin, T.; Wu, J.; Sun, X. Effect of positive pulse voltage on color value and corrosion property of magnesium alloy black micro-arc oxidation ceramic coating. Surf. Coat. Technol. 2019, 374, 402–408. [Google Scholar] [CrossRef]
  25. Yilmaz, M.S.; Sahin, O. Applying high voltage cathodic pulse with various pulse durations on aluminium via micro-arc oxidation (MAO). Surf. Coat. Technol. 2018, 347, 278–285. [Google Scholar] [CrossRef]
  26. Songur, F.; Dikici, B.; Niinomi, M.; Arslan, E. The plasma electrolytic oxidation (PEO) coatings to enhance in-vitro corrosion resistance of Ti–29Nb–13Ta–4.6Zr alloys: The combined effect of duty cycle and the deposition frequency. Surf. Coat. Technol. 2019, 374, 345–354. [Google Scholar] [CrossRef]
Figure 1. Schematic diagram of voltage output waveform, operating time (to) and cooling time (tc) under one period (T).
Metals 12 00949 g001
Figure 2. The evolution of arc discharge at the frequency is 500 Hz, the duty cycle is 30% (cooling time is 1.4 ms) and the voltage is (a) 150 V, (b) 250 V and (c) 400 V, respectively.
Metals 12 00949 g002
Figure 3. The surface morphology of coatings at the frequency is 500 Hz, the duty cycle is 30% (cooling time is 1.4 ms) and the voltage is (a) 150 V, (b) 250 V, (c) 400 V, (d) film ablation (e) ablation crater, respectively.
Metals 12 00949 g003
Figure 4. XRD patterns for the coatings with voltage at 250 V and 400 V.
Metals 12 00949 g004
Figure 5. Schematic diagram of micro-arc discharge mechanism.
Metals 12 00949 g005
Figure 6. The load voltage and current waveform in micro-arc oxidation process. (a) bipolar pulse mode (b) the pulsed with a discharge loop current (DLC).
Metals 12 00949 g006
Figure 7. Surface morphology of the coatings when the cooling time is (a) 1.8 ms and (b) 0.2 ms and (c) distribution of pore diameter formed by MAO.
Metals 12 00949 g007
Figure 8. The growth rate of coatings at the frequency is 500 Hz and 1000 Hz, the duty cycle is from 10% to 90%.
Metals 12 00949 g008
Figure 9. The tendency of large-arc discharge at frequencies of 500 Hz and 1000 Hz, with a duty cycle from 10% to 90%.
Metals 12 00949 g009
Figure 10. The arc start voltage at the frequency is 500 Hz and 1000 Hz, the duty cycle is from 10% to 90%.
Metals 12 00949 g010
Table 1. Chemical composition of AZ91D alloy (wt %).
CompositionAlZnMnSiCuFeNiMg
Weight percentage8.5~9.50.5~0.90.17~0.4≤0.05≤0.015≤0.004≤0.001Rest
Table 2. Cooling time (ms) for frequency (Hz) and duty cycle (%).
Duty Cycle (δ/%)Frequency (f/Hz)
4004445005716678001000
102.25 ms2.03 ms1.8 ms1.57 ms1.35 ms1.25 ms0.9 ms
202.0 ms1.80 ms1.6 ms1.40 ms1.19 ms1.0 ms0.8 ms
301.75 ms1.58 ms1.4 ms1.22 ms1.04 ms0.87 ms0.7 ms
401.50 ms1.35 ms1.2 ms1.05 ms0.9 ms0.75 ms 0.6 ms
501.25 ms1.13 ms1.0 ms0.88 ms0.75 ms0.62 ms0.5 ms
601.0 ms0.9 ms0.8 ms0.7 ms0.6 ms0.5 ms0.4 ms
700.75 ms0.67 ms0.6 ms0.52 ms0.44 ms0.37 ms0.3 ms
800.50 ms0.45 ms0.4 ms0.35 ms0.3 ms0.25 ms0.2 ms
900.25 ms0.22 ms0.2 ms0.17 ms0.15 ms0.12 ms0.1 ms
Publisher’s Note: MDPI stays neutral with regard to jurisdictional claims in published maps and institutional affiliations.

