Article

Optimization, Kinetic Studies of Tin Leaching from Waste Printed Circuit Boards and Selective Tin Recovery from Its Pregnant Solution

1
Faculty of Materials and Manufacturing, Beijing University of Technology, Beijing 100124, China
2
Key Laboratory of Advanced Functional Materials, Ministry of Education, Beijing 100124, China
3
College of Robotics, Beijing Union University, Beijing 100101, China
*
Author to whom correspondence should be addressed.
Metals 2022, 12(6), 954; https://doi.org/10.3390/met12060954
Submission received: 3 May 2022 / Revised: 26 May 2022 / Accepted: 30 May 2022 / Published: 1 June 2022

Abstract

:
To protect natural resources and avoid environmental pollution, an effective method is proposed to recover tin (Sn) from waste printed circuit boards (WPCBs). In order to realize the efficient recovery of Sn, it is necessary to study the effects of experimental parameters on Sn leaching and understand the leaching kinetics of leaching processes. The statistical and mathematical technique (response surface methodology (RSM)) was used to study the effects of interactions of experimental parameters on the leaching rate and optimize experimental parameters. Moreover, a comprehensive understanding of the leaching kinetics of Sn in hydrochloric acid solution was obtained. The results show that the maximum Sn leaching rate was 97.6% which was obtained under the following optimal condition: 74.1 °C, 4.94 mol/L HCl, 495.5 rpm, and a solid–liquid ratio of 0.08 g/mL. The leaching mechanism of Sn was controlled by mixed control reaction with an activation energy of 20.3 kJ/mol. A macroscopic kinetic equation was also established, which summarizes the relationships between the experimental parameters and the leaching rates and can predict leaching results. The Sn in pregnant leach solution was recovered as stannic oxide (SnO2) by precipitation-high temperature calcining technique. In this paper, a complete flowsheet for Sn recovery from WPCBs was developed.

1. Introduction

In the past years, the upgrading and updating of electronic and electrical equipment (EEE) accelerated [1], which made the amount of WPCBs increase sharply [2,3]. The contents of valuable metals, such as copper (Cu), Sn, iron (Fe), nickel (Ni), and zinc (Zn), in WPCBs are abundant [4,5]. As the main component of solder, the content of Sn cannot be ignored. If reasonable ways are not adopted to recover it, it is harmful to the environment and human health [6].
There are very few studies on the recovery of Sn from WPCBs. Yoo et al. [6] and Jeon et al. [7] used nitric acid (HNO3) to convert Sn as very sparingly soluble tin dioxide (SnO2) from Pb-free solders. Jha et al. [8] used the separation leaching method to leach Pb and Sn by 0.2 M HNO3 and HCl, respectively. Silva et al. [9] leached Sn (33.7%) and Cu (65.7%) using aqua regia. In addition, the alkaline pressure oxidation leaching process was also used to recover Sn from WPCBs metal powders or Sn anode slime [10,11]. Guo et al. [12] used alkali fusion to convert 96.85% Sn of WPCBs into water-soluble salt (Na2SnO3), which separates Sn from Cu and precious metals. Although Sn can be recovered using these methods, some problems, such as hazardous emissions (NOx), high cost, complex equipment, and high energy consumption, limit their wide application. Hydrochloric acid (HCl) leaching was proposed in some studies, and H2O2, Fe3+, or Sn4+ was used as an oxidant to leach Sn, Pb, and Cu from waste Pb-free solder or WPCBs [3,10,11,13,14,15]. However, the oxidant makes the composition of wastewater complex, which increases the cost of the whole experiment process. In addition, the univariate method was mostly used to optimize experimental parameters during the traditional methods, which ignored the effects of interactions of various parameters on the leaching process.
As a powerful statistical analysis technique, response surface methodology (RSM), which can contribute to understanding the interactions between various parameters, reducing the number of experiments, and optimizing experimental parameters [16,17,18,19], has been used in the metal leaching process [20,21]. Therefore, the effects of parameters on Sn leaching in HCl solution and the optimization of experimental parameters can be studied using RSM, which has not been researched comprehensively. Additionally, the leaching kinetic is very important to understand the leaching mechanism and improve the leaching efficiencies of metals [22,23,24,25]. However, the information about the reaction process of Sn in leach solution was very limited, and the leaching kinetic parameters, such as activation energy and control mechanism, were not well understood comprehensively.
After leaching, the recovery of metals from pregnant leach solution is also a key step. Commonly used methods of metal recovery from solution include cementation reaction, electrodeposition, solvent extraction, and precipitation. Lee et al. [13] used tri-butyl phosphate (TBP), extracting 99.9% Sn from HCl-ferric chloride leach solution after removing Cu by cementation reaction. Yang et al. [10] recovered 86.2% Sn from alkaline pressure oxidation leach solution by electrowinning, and the purity of Sn was over 99.8%. Saleh et al. [26] extracted Sn from leach solution with Aliqua-336 (10% (v/v)) and then stripped as Sn (II) oxide using NaOH. Then, Sn (II) oxide was reduced to Sn by hydrogen. Silva et al. [9] used the electrodeposition process to recover Sn from aqua regia solution. The results indicated that more than 70% of Sn can be recovered. Yang et al. [4] recovered Sn from Sn4+-HCl leach solution after the purification process using membrane electrodeposition. During the electrodeposition process, NaCl was added to the electrolyte to improve the conductivity of the solution, promoting Sn deposition. Liu et al. [27] recovered Sn as SnO2 from alkaline pressure oxidative leach solution by the hydrothermal process after purification, which reduces reagents consumption. Compared with other recovery methods, precipitation has the characteristics of a short experimental process, low chemical reagents consumptions, and simple experimental equipment, so it is a key method to recover or remove metals selectively from solution. Seo et al. [28] and Balladares et al. [29] recovered and removed Fe, Al, and heavy metals from acid wastewater by modifying pH. Comel et al. [30] precipitated Fe, Al, and Pb as five metal phytates from acidic leachates using phytic acid. Gao et al. [31] recovered Ni and Co using ammonia, and Al and Cr using sodium hydroxide (NaOH) from saprolite-limonite laterite leachates. Matlock et al. [32] found that 1,3-benzenediamidoethanethiol dianion (BDET) can remove >90% soft heavy metals from an aqueous solution at pH = 4.5. However, few studies have been done on the recovery of Sn from HCl solution using the precipitation technique.
In this research, Sn was leached from WPCBs powders using HCl solution. The effects of experimental parameters on the Sn leaching were studied experimentally. Furthermore, RSM was employed to study the relationships between interactions of parameters and leaching rates, and optimize the leaching parameters for maximum Sn leaching rate. The leaching kinetics of Sn also were learned comprehensively based on experimental data, which could determine the kinetic parameters, rate-controlling steps and predict leaching behaviors. The Sn in pregnant leach solution was recovered by precipitation-high temperature calcining technique.

2. Experiments

2.1. Materials and Reagents

The raw material used in this work was obtained from WPCBs of waste mobile phones after manual dismantling, cutting, and crushing. After the mechanical pre-treatment, as shown in Figure 1a, the particle size is concentrated in the range of −0.15 mm + 0.08 mm, which was used for the leaching experiments. Before leaching experiments, the particles were selected by gravity separate nonmetals (plastic, resins, glass fibers), which could not absolutely remove all nonmetals. The content of WPCBs particle was determined by X-ray powder diffraction (XRD, Tsushima, Japan) and inductively coupled plasma optical emission spectrometer (ICP-OES, Optima 7000DV, PerkinElmer, Waltham, MA, America), as shown in Figure 1b and Table 1. The result shows that metal content in WPCBs is very abundant, and the content of Sn is also very considerable.

2.2. Leaching Tests

Leaching processes were performed in 250 mL beakers. Leaching solutions (100 mL) were prepared before leaching experiments, using reagent grade HCl (2–5 mol/L). Deionized-distilled water was used as a solvent to prepare all solutions. A certain amount of WPCBs powder was pressed into the leach solution when the temperature reached certain values (45–90 °C), and the pulp was stirred at a certain speed (300–500 rpm). The effect of the solid–liquid ratio (0.05–0.15 g/mL) was studied. During the leaching processes, samples (3–4 mL) were taken out at the appropriate time intervals (i.e., 20, 40, 60 …, and 180 min), and the content of Sn was analyzed by ICP-OES. The leaching rates of Sn were calculated by Equation (1).
η = C 1 × V 1 m 0 × x 0 × 100 %
where C1 is the concentration of Sn in the filtrate (mg/L), V1 is the volume of the extracted leachate (L), m0 is the weight of WPCBs powders (g), x0 is the content of the Sn.

2.3. Design of Experiments

This study used RSM to model and design experiments statistically based on quadratic Box–Behnken Design (BBD). The experiments were designed using Design Expert software, and statistical analyses were performed on them. In this design, four main factors were determined, and every factor has three levels (i.e., low (−1), median (0), and high (+1) as coded levels), as shown in Table 2. The relationship between the coded and actual values can be expressed by Equation (2) [16].
X coded = ( X actual X centre X centre X min )
where Xcoded, Xactual, Xcentre, and Xmin are coded value, actual value, actual value in the center and minimum, respectively. Based on the experimental data, the response can be estimated by a quadratic polynomial equation (Equation (3)) [33].
γ = β 0 + β 1 A + β 2 B + β 3 C + β 4 D + β 11 A 2 + β 22 B 2 + β 33 C 2 + β 44 D 2 + β 12 AB + β 13 AC + β 14 AD + β 23 BC + β 24 B + β 34 CD
where γ is the predicted response, β0 is model constant, A, B, C, and D symbol for independent variables, βi is linear coefficient, β12, β13, β14, β23, β24, and β34 are interaction coefficients, βii is the quadratic coefficient.

2.4. The Recovery of Sn from Pregnant Leach Solution

After leaching experiments, Sn in the pregnant leach solution was recovered using precipitation-high temperature calcining technique. 10 wt% NaOH water solution was used to adjust the pH of the leach solution, and the effect of pH (0.5–4.5) on Sn recovery was investigated. Besides, the effects of calcining temperature (650–800 °C) and calcining time (2−4 h) on the Sn recovery were also studied.

3. Results and Discussion

3.1. Effect of Temperature

As shown in Figure 2a, the temperature exhibits a significant effect on the leaching processes. The leaching rate of Sn was significantly improved with the increase in temperature. With the rise in temperature, the mass transfer coefficient and diffusivity are accelerated, improving leaching rates [13]. The increasing speed of the leaching rate tends to be slow when the temperature is higher than 75 °C. The possible reason for this result is inferred that other metals, such as Zn and Fe, in WPCBs influence the Sn leaching by consuming a large amount of HCl (shown in Figure S1). In addition, higher temperatures could promote the volatilization of HCl, hindering Sn leaching. The leaching rates of Sn increase with time prolonging and remain almost unchanged after 180 min, which can mainly be attributed to the reducing solution acidity with elapsed time. According to the leaching rate, 40 °C was the optimum temperature.

3.2. Effect of HCl Concentration

HCl is the main medium and has a significant effect on the leaching process. As shown in Figure 2b, HCl concentration has a positive effect on Sn leaching. With increasing HCl concentration, the flux of H+ ion across the particle boundaries is increased, which can improve the reaction rate [34]. When HCl concentration is higher than 3 mol/L, the leaching rate of Sn increases rapidly and reaches 91.0% at 4 mol/L. When HCl concentration was 5 mol/L, the leaching rate of Sn did not change significantly.

3.3. Effect of Solid–Liquid Ratio

As shown in Figure 2c, the leaching rate of Sn is inversely proportional to the solid–liquid ratio. The highest leaching rate 91.5% was attained at 0.05 g/mL. When the solid–liquid ratio increases from 0.05 g/mL to 0.10 g/mL, the leaching rate decreases to 91.0% slightly. However, when the solid–liquid ratio increases to 0.15 g/mL, the leaching rate sharply decreases to 63.1%. Increasing the solid–liquid ratio, the surface areas of metal powders are increased in per unit volume solution, which leads to an inadequate supply of H+ for reactions and increases solution viscosity [35]. Meanwhile, a higher solid-to-liquid ratio would promote the agglomeration of raw materials, causing collisions and frictions between the WPCBs powders, thereby reducing the leaching efficiency. Moreover, a greater amount of oxygen is consumed for the same oxidation conversion of Sn, inhibiting the further leaching [35]. The solid–liquid ratio was selected as 0.10 g/mL based on the leaching rate.

3.4. Effect of Stirring Speed

As shown in Figure 2d, with increasing the stirring speed from 300 rpm to 500 rpm, the leaching rate significantly increases from 79.1% to 91.0%. Higher stirring speed can promote the diffusion of leaching solution and reduce the boundary layer resistance for mass transfer [8]. Moreover, a higher stirring speed could prevent the metal powders from depositing on the tank bottom [10]. The leaching rate has little change when the agitation speed is over 400 rpm. At 400 rpm, the particles are completely suspended in the solution, minimizing the effect of liquid film boundary diffusion.

3.5. Modeling of Sn Leaching Rate

The experimental layout produced by BBD of Sn is shown in Table 3. The analysis of variance (ANOVA) was conducted to test the significance of the leaching regression model, as shown in Table 4.
As shown in Table 4, the p-value of the regression model is less than 0.05, which shows that the regression model is statistically significant [36,37]. The coefficient of determination (R2) is 0.9827 and the p-value of the lack of fit for Sn leaching is 6.5%, which implies that the predicted models for Sn leaching rates have good agreement with experimental data. The predicted and actual results distribute along a straight line, as shown in Figure 3. According to the p-values of different parameters, temperature, solid–liquid ratio, HCl concentration, and the quadratic terms of solid–liquid ratio and HCl concentration were statistically significantly at a confidence level of 95%. Based on the results for the leaching rates of Sn (Table 3), a quadratic regression model for Sn leaching rates was derived as shown in Equation (4), which could estimate an unknown γ for any coded level of A, B, C, and D.
γ = 72 . 52 + 17 . 67 A + 0 . 47 B 20 . 20 C + 8 . 06 D + 0 . 85 AB 0 . 04 AC + 3 . 30 AD 1 . 32 BC 0 . 28 BD 0 . 11 CD + 0 . 75 A 2 1 . 57 B 2 17 . 28 C 2 3 . 95 D 2
The optimum levels of various parameters and the effects of their interactions on the Sn leaching rates were studied using three-dimensional response surfaces (Figure 4). According to Figure 4a, the temperature has a positive effect on the leaching rate, particularly at a high stirring speed. In a similar manner, at a low solid–liquid ratio and high HCl concentration, the beneficial effect of temperature was apparent (Figure 4b,c). From Figure 4a–c, temperature, solid–liquid ratio, and HCl concentration have a significant effect on the leaching rate of Sn, which is consistent with the statistical analysis of data, as shown in Table 4. As shown in Figure 4d-f, stirring speed has no obvious influence on the leaching rate. The interactions between the solid–liquid ratio and stirring speed, stirring speed and HCl concentration also have a slight effect on Sn leaching.
According to RSM results, the optimum experimental parameters were: 74.1 °C, 495.5 rpm, 0.08 g/mL, and 4.94 mol/L. The corresponding predicted leaching rate was 99.6%, while the experimental leaching rate obtained at these optimum experimental parameters was 97.6%. The two leaching rates are very close, so the RSM can be used to optimize the experimental parameters. Under the optimal experimental parameters, the leaching rates of Cu, Fe, Ni, Zn, Pb, and Al are 3.10%, 94.2%, 85.2%, 99.7%, 98.3%, and 100%, respectively.

3.6. Kinetics Analysis

3.6.1. Leaching Kinetics of Sn

The leaching of Sn is a solid–liquid reaction system. The size of WPCBs particle used in this work is small (in the range of −0.15 mm + 0.08 mm), which can be assumed a spherical particle. Therefore, this work used SCM to study the leaching kinetics of Sn in the HCl solution. Under different control reactions, the kinetic equations can be shown as Equations (5)–(8) [36].
1 ( 1 X ) 1 / 3 = k 1 t
1 2 3 X ( 1 X ) 2 3 = k 2 t
1 ( 1 0.45 X ) 1 3 = k 4 t
1 ( 1 X ) 2 3 = k 3 t
where X is the leaching rate, k1, k2, k3, and k4 are the synthesis rate constant, diffusion rate constant, mixed control rate constant, and apparent kinetics constant, t is the leaching time (min).
The experimental data, produced at different temperatures (Figure 2a) were substituted by Equations (5)–(8) and then plotted and fitted. The rate constants and their correlation coefficients of different kinetic models are given in Table S1 for the chemical control reaction model (Equation (5)), diffusion control reaction model (Equation (6)), surface chemical control reaction model (Equation (7)), and mixed control reaction model (Equation (8)). According to R2, both the chemical control reaction and mixed control reaction show better linear correlations, but linear correlations of diffusion control reaction and surface chemical reaction are poor. Therefore, the kinetic model needs to be further determined in the chemical control reaction and mixed control reaction. Another important tool to determine leaching kinetic is the Arrhenius formula (Equation (9)), which can calculate the activation energy of the leaching process.
k = A 0 exp ( Ea / RT )
where A0 is the pre-exponential factor, Ea is the apparent activation energy (kJ/mol), T is the reaction temperature (K), and R is the universal gas constant (8.314 J/mol·K).
To determine the kinetic model, the Arrhenius plots of lnk versus 1000/T are obtained (Figure 5) according to the k values as shown in Table S1. The activation energies of chemical control reaction and mixed control reaction can be obtained from the slopes of the straight lines in Figure 5 as 23.1 kJ/mol and 20.3 kJ/mol, respectively. According to Abrantes [37], the activation energy of a chemical control reaction is usually greater than 41.8 kJ/mol, which proves that the leaching process of Sn is controlled by mixed control reaction (diffusion through a fluid film or the chemical reaction at the surface of an unreacted particle) [25,38]. According to the results of the effect of stirring speed on the Sn leaching rate (Figure 2d), the effect of the stirring speed on Sn leaching is not obvious. This is probably due to the fact that the leaching experiments were carried out in a small reactor, and the leaching solution was continuously stirred, so that the diffusion of reactants and products through the liquid film can be ignored [39]. Therefore, the Sn leaching process should be mainly controlled by the chemical reaction process on the solid surface. According to the intercept in Figure 5b, A0 is 6.305. Therefore, the kinetic equation of the effect of temperature is shown in Equation (10).
lnk Sn = 1.8414 2.443 × 10 3 T 1

3.6.2. Leaching Regular Patterns under Different Parameters

To obtain the macroscopic kinetic equation, the leaching regular patterns of Sn under different parameters were studied. The plots of [1 − (1 − X)2/3] vs. time for different HCl concentrations for Sn are shown in Figure 6a. According to the slopes of straight lines, the lnk vs. lnC plot is obtained, as shown in Figure 6b. The reaction order with respect to HCl concentration is 1.4246. Therefore, the kinetic equation about the effect of HCl concentration is shown as Equation (11).
lnk Sn = 0.7919 lnC   6.17926
Then, the effects of the stirring speed and solid–liquid ratio were also studied. The results are shown in Figures S2 and S3. The results indicate that the reaction orders of stirring speed and solid–liquid ratio are 0.4685 and −0.5401. Therefore, the kinetic equations of the effects of the stirring speed and solid–liquid ratio on Sn leaching are obtained as Equations (12) and (13). These research results provide help to obtain the macroscopic kinetic equation.
Lnk Sn = 1.026921 lnR 11.27427
lnk Sn = 0.9501 lnD 7.611

3.6.3. Kinetic Equations of Sn Leaching

According to Equations (7) and (9), the relationships between leaching rate constants of Sn and various variables can be expressed as Equation (14).
1 ( 1 X ) 2 3 = k 0 C a D b R c exp ( Ea / RT )
where a, b, and c are the reaction orders of HCl concentration (mol/L), solid–liquid ratio (g/mL), and stirring speed (rpm), respectively. Based on the previous studies on activity energy and leaching regular pattern, the k0 of Sn leaching was determined as 0.046. Therefore, the macroscopic kinetic equation of Sn leaching can be expressed as Equation (15), which integrates the effect of various parameters and can be used to predict the leaching rate.
1 ( 1 X ) 2 3 = 0.046 C 0 . 7919 D 0.9501 R 1.0269 exp ( 20300 / 8.314 T )

3.7. The Recovery of Sn

Based on the leaching experiment, the concentrations of various metals in the pregnant leach solution are shown in Table 5. The recovery of Sn from the pregnant leach solution is significant for the reuse of Sn resources. According to the solubility product constant (Ksp) shown in Equation (16), the stable concentrations of Sn and various metals in leach solution under different pH conditions were calculated, as shown in Figure 7a and Table S2.
K sp = [ M n ] [ OH ] a
where [Mn] is the concentration of metal ion, [OH] is the concentration of OH, a is the number of OH.
Compared with other metals, at different pH, the stable concentrations of Sn are significantly lower than those of other metals. Therefore, Sn can be selectively recovered by adjusting the pH of the solution appropriately. As shown in Figure 7a, almost all Sn can be precipitated, when the pH is in the range of 3–3.5. The effects of pH values on the Sn recovery rates are shown in Figure 7a. When the pH is 1.5, 96.5% Sn could be precipitated. Sn is basically precipitated completely when the pH value increases to 2. Figure S4 is the XRD analysis of precipitation, which indicates that Sn was precipitated as sodium tin oxide (Na4SnO4), and Cu and Fe were precipitated with Sn. Additionally, with the increase of pH value, the compositions of the calcinating products get more complex. As shown in Figure 7b, when the pH value is 3, various metal oxides such as Cu2O, CuO, Fe3O4, and PbO are formed, which affects the purity of SnO2. Therefore, the optimal pH value is 2.
Then, precipitation obtained at pH = 2 was calcinated in a muffle furnace at different temperatures and different calcinating times. Figure 7c,d show the effects of calcinating temperature and calcinating time on the calcinating products. As shown in Figure 7c,d, the calcinating temperature and calcinating time have no obvious effects on the composition of the calcinating products, but increasing the calcinating temperature and calcinating time is beneficial to the improvement of the crystallinity of the calcinating products. According to the crystallinity and experimental cost, 750 °C and 3 h were chosen as the optimum calcinating temperature and calcinating time.
After calcinating, bulk precipitation was obtained. The SEM and EDS were used to further analyze the calcinating products. As shown in Figure 8, in addition to Sn and O, the product also contains impurity metals, including Fe and Cu. The contents of the calcinating product were further studied using ICP-OES, as shown in Table S3. The result indicates that the calcinating product also contains Cu and Fe, which is the same as the XRD analysis result. The undetectable matter of 21.2 wt% should be oxygen, as above-mentioned that the oxygen exists in the calcinating product. High purity SnO2 can be used in the fields of semiconductors, gas-sensing materials, solar cells, Li-ion batteries, electrode materials, and electrochromic devices [40,41,42]. Additionally, the production of SnO2 using purified solution needs a high cost [27]. Therefore, in the future, more work needs to be done to improve the recovery rate of Sn and the purity of SnO2. The whole process of Sn recovery from WPCBs is summarized in Figure 9.

4. Conclusions

In this study, a whole recovery process of Sn from WPCBs was proposed. The effects of parameters on the leaching process and recovery process were investigated comprehensively. RSM was used to investigate the effects of interactions of various parameters on the Sn leaching and optimize experimental parameters. Additionally, the leaching kinetics of Sn in the HCl solution was studied using the shrinking core model (SCM). After leaching experiments, the Sn in the pregnant leach solution was recovered by the precipitation-high temperature calcining technique. The key results of this work are listed below:
(1)
During the leaching processes, the leaching rates of Sn increased with the increases in HCl concentration, temperature, and stirring speed, but decreased with the increase in solid–liquid ratio.
(2)
Based on the three-dimensional response surface plots, the interactive relationships between each of the following pairs of A (temperature)-B (stirring speed), A (temperature)-C (solid–liquid ratio), and A (temperature)-D (HCl concentration) showed significant effects on the Sn leaching rate.
(3)
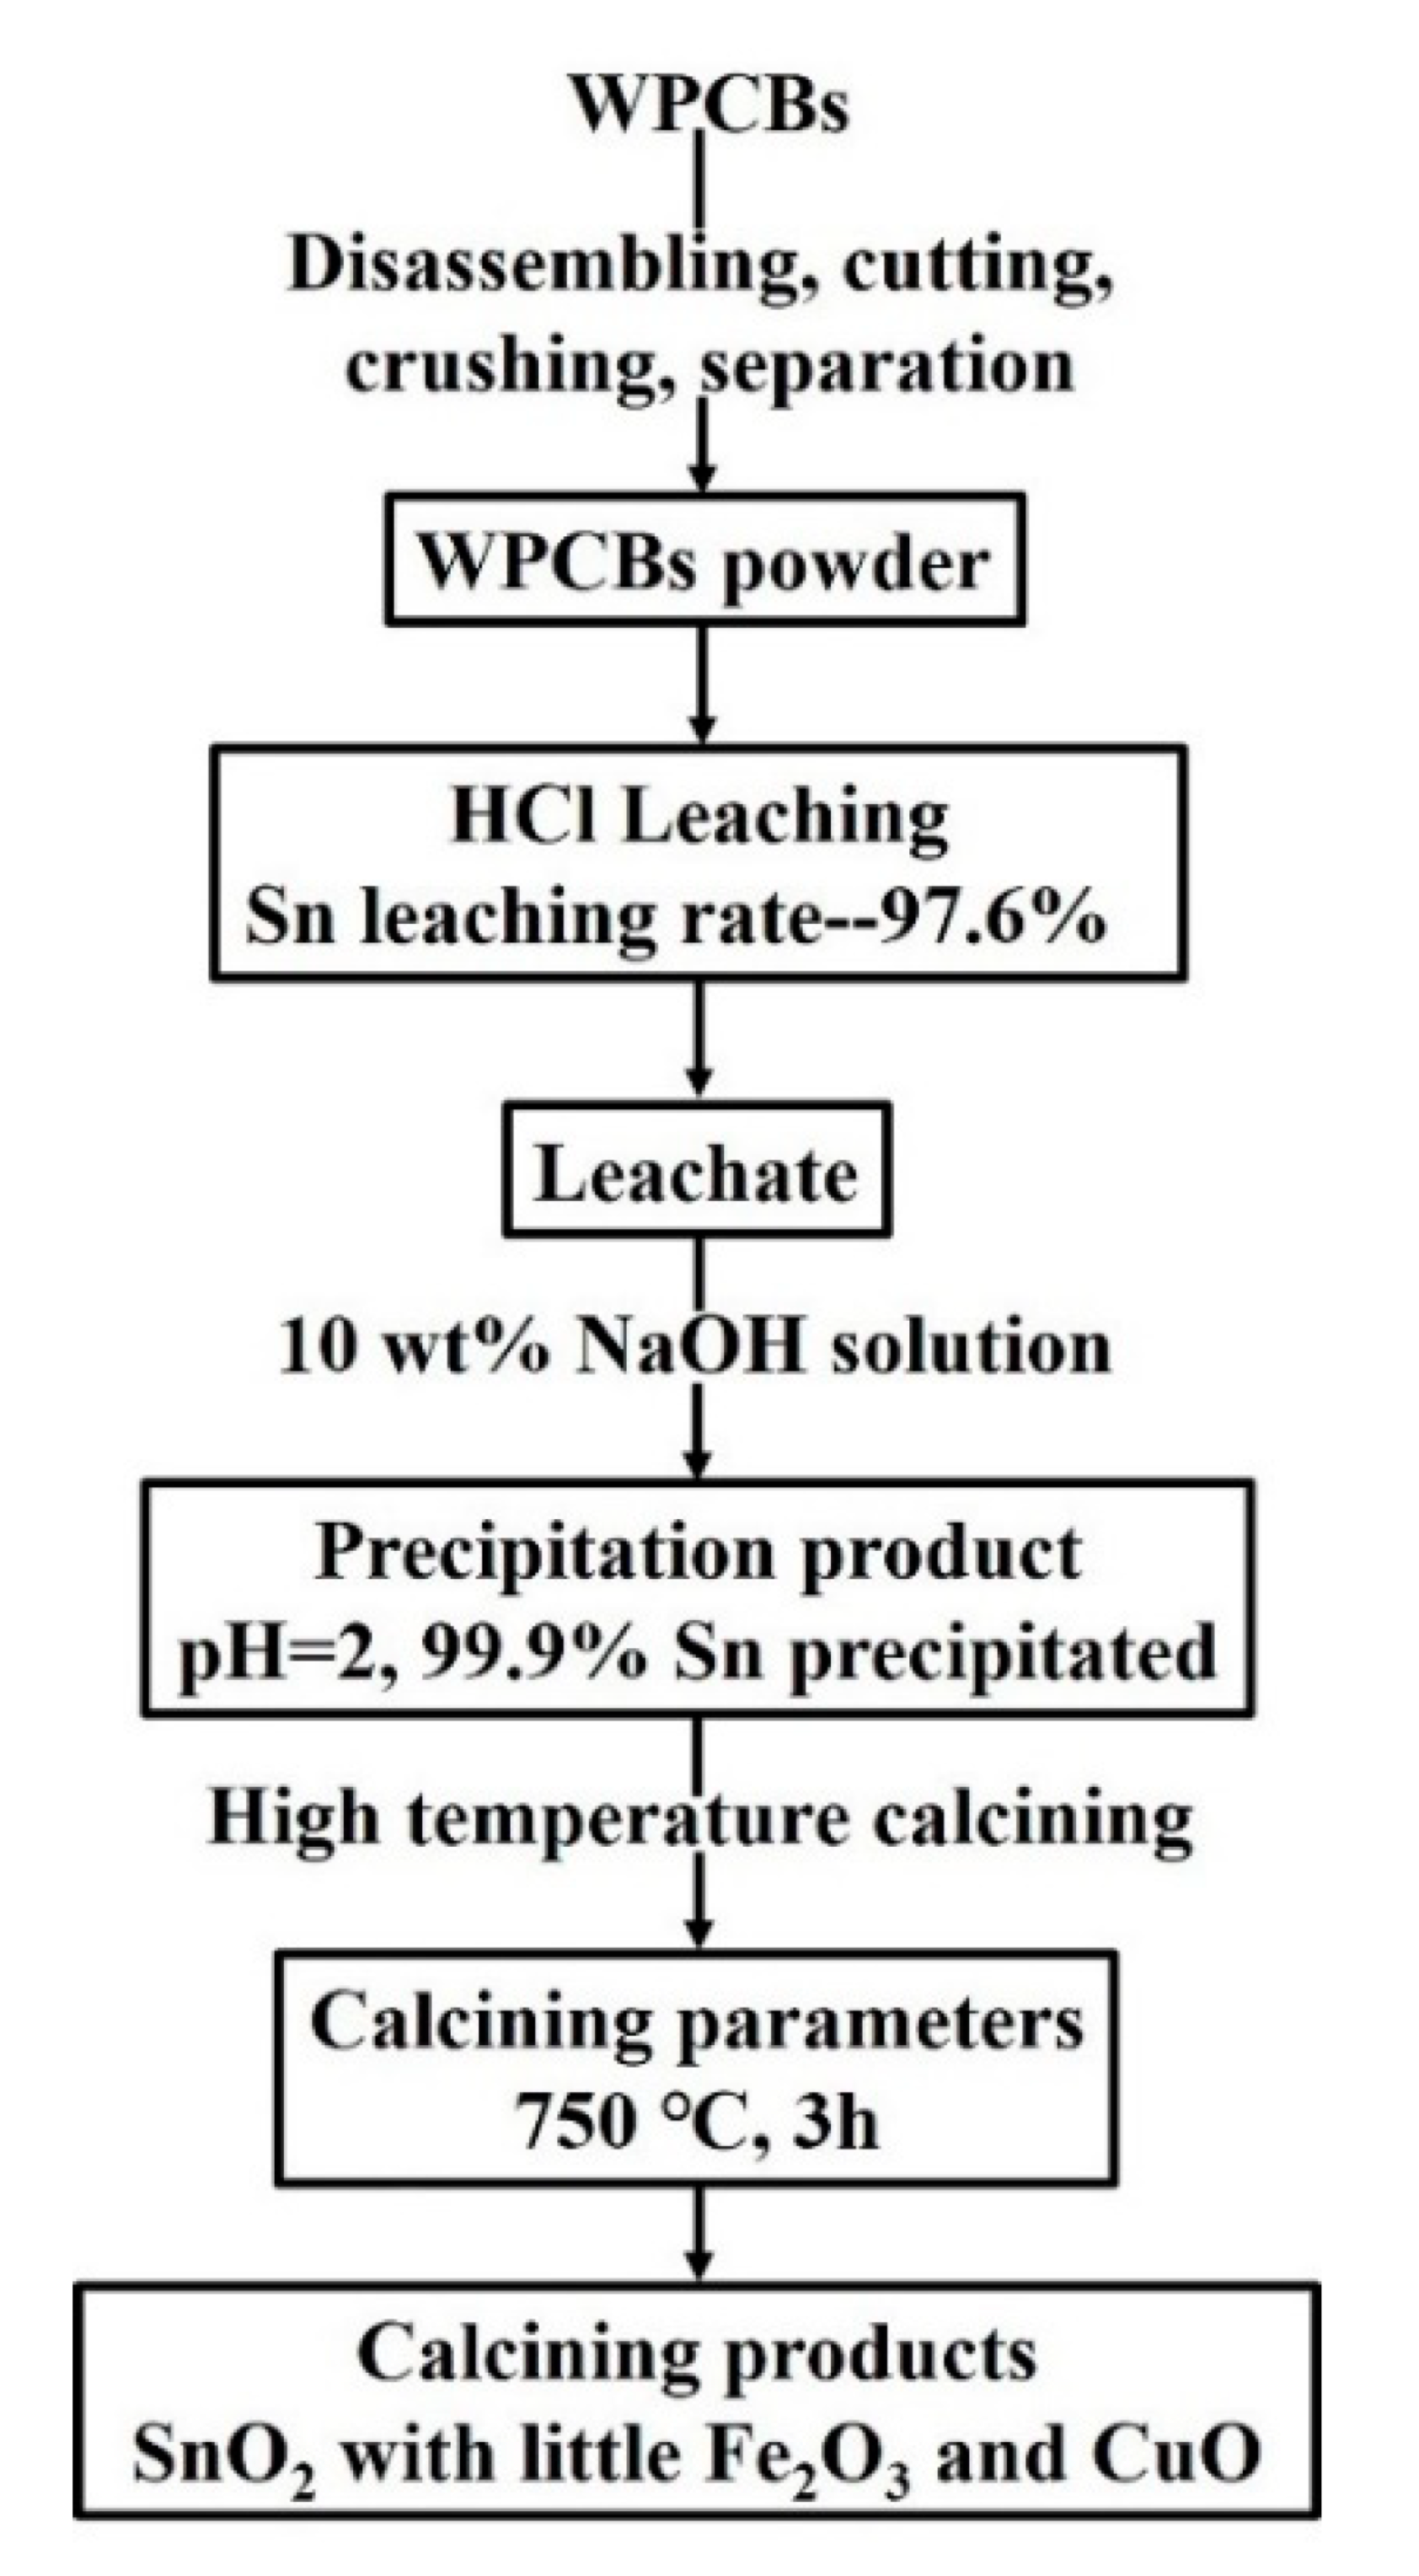
The optimal leaching parameters obtained by RSM were 74.1 °C, 495.5 rpm, 0.08 g/mL, and 4.94 mol/L HCl, and 97.6% of Sn was leached at these optimization leaching conditions.
(4)
In the HCL solution, Sn leaching process is controlled by mixed control reaction with apparent activation energies of 20.3 kJ/mol. Meanwhile, as shown in Equation (17), a macroscopic kinetic equation of the Sn leaching process was established and could suggest the effect of various factors comprehensively.
1 ( 1 X ) 2 3 = 0.046 C 0 . 7919 D 0.9501 R 1.0269 exp ( 20300 / 8.314 T )
(5)
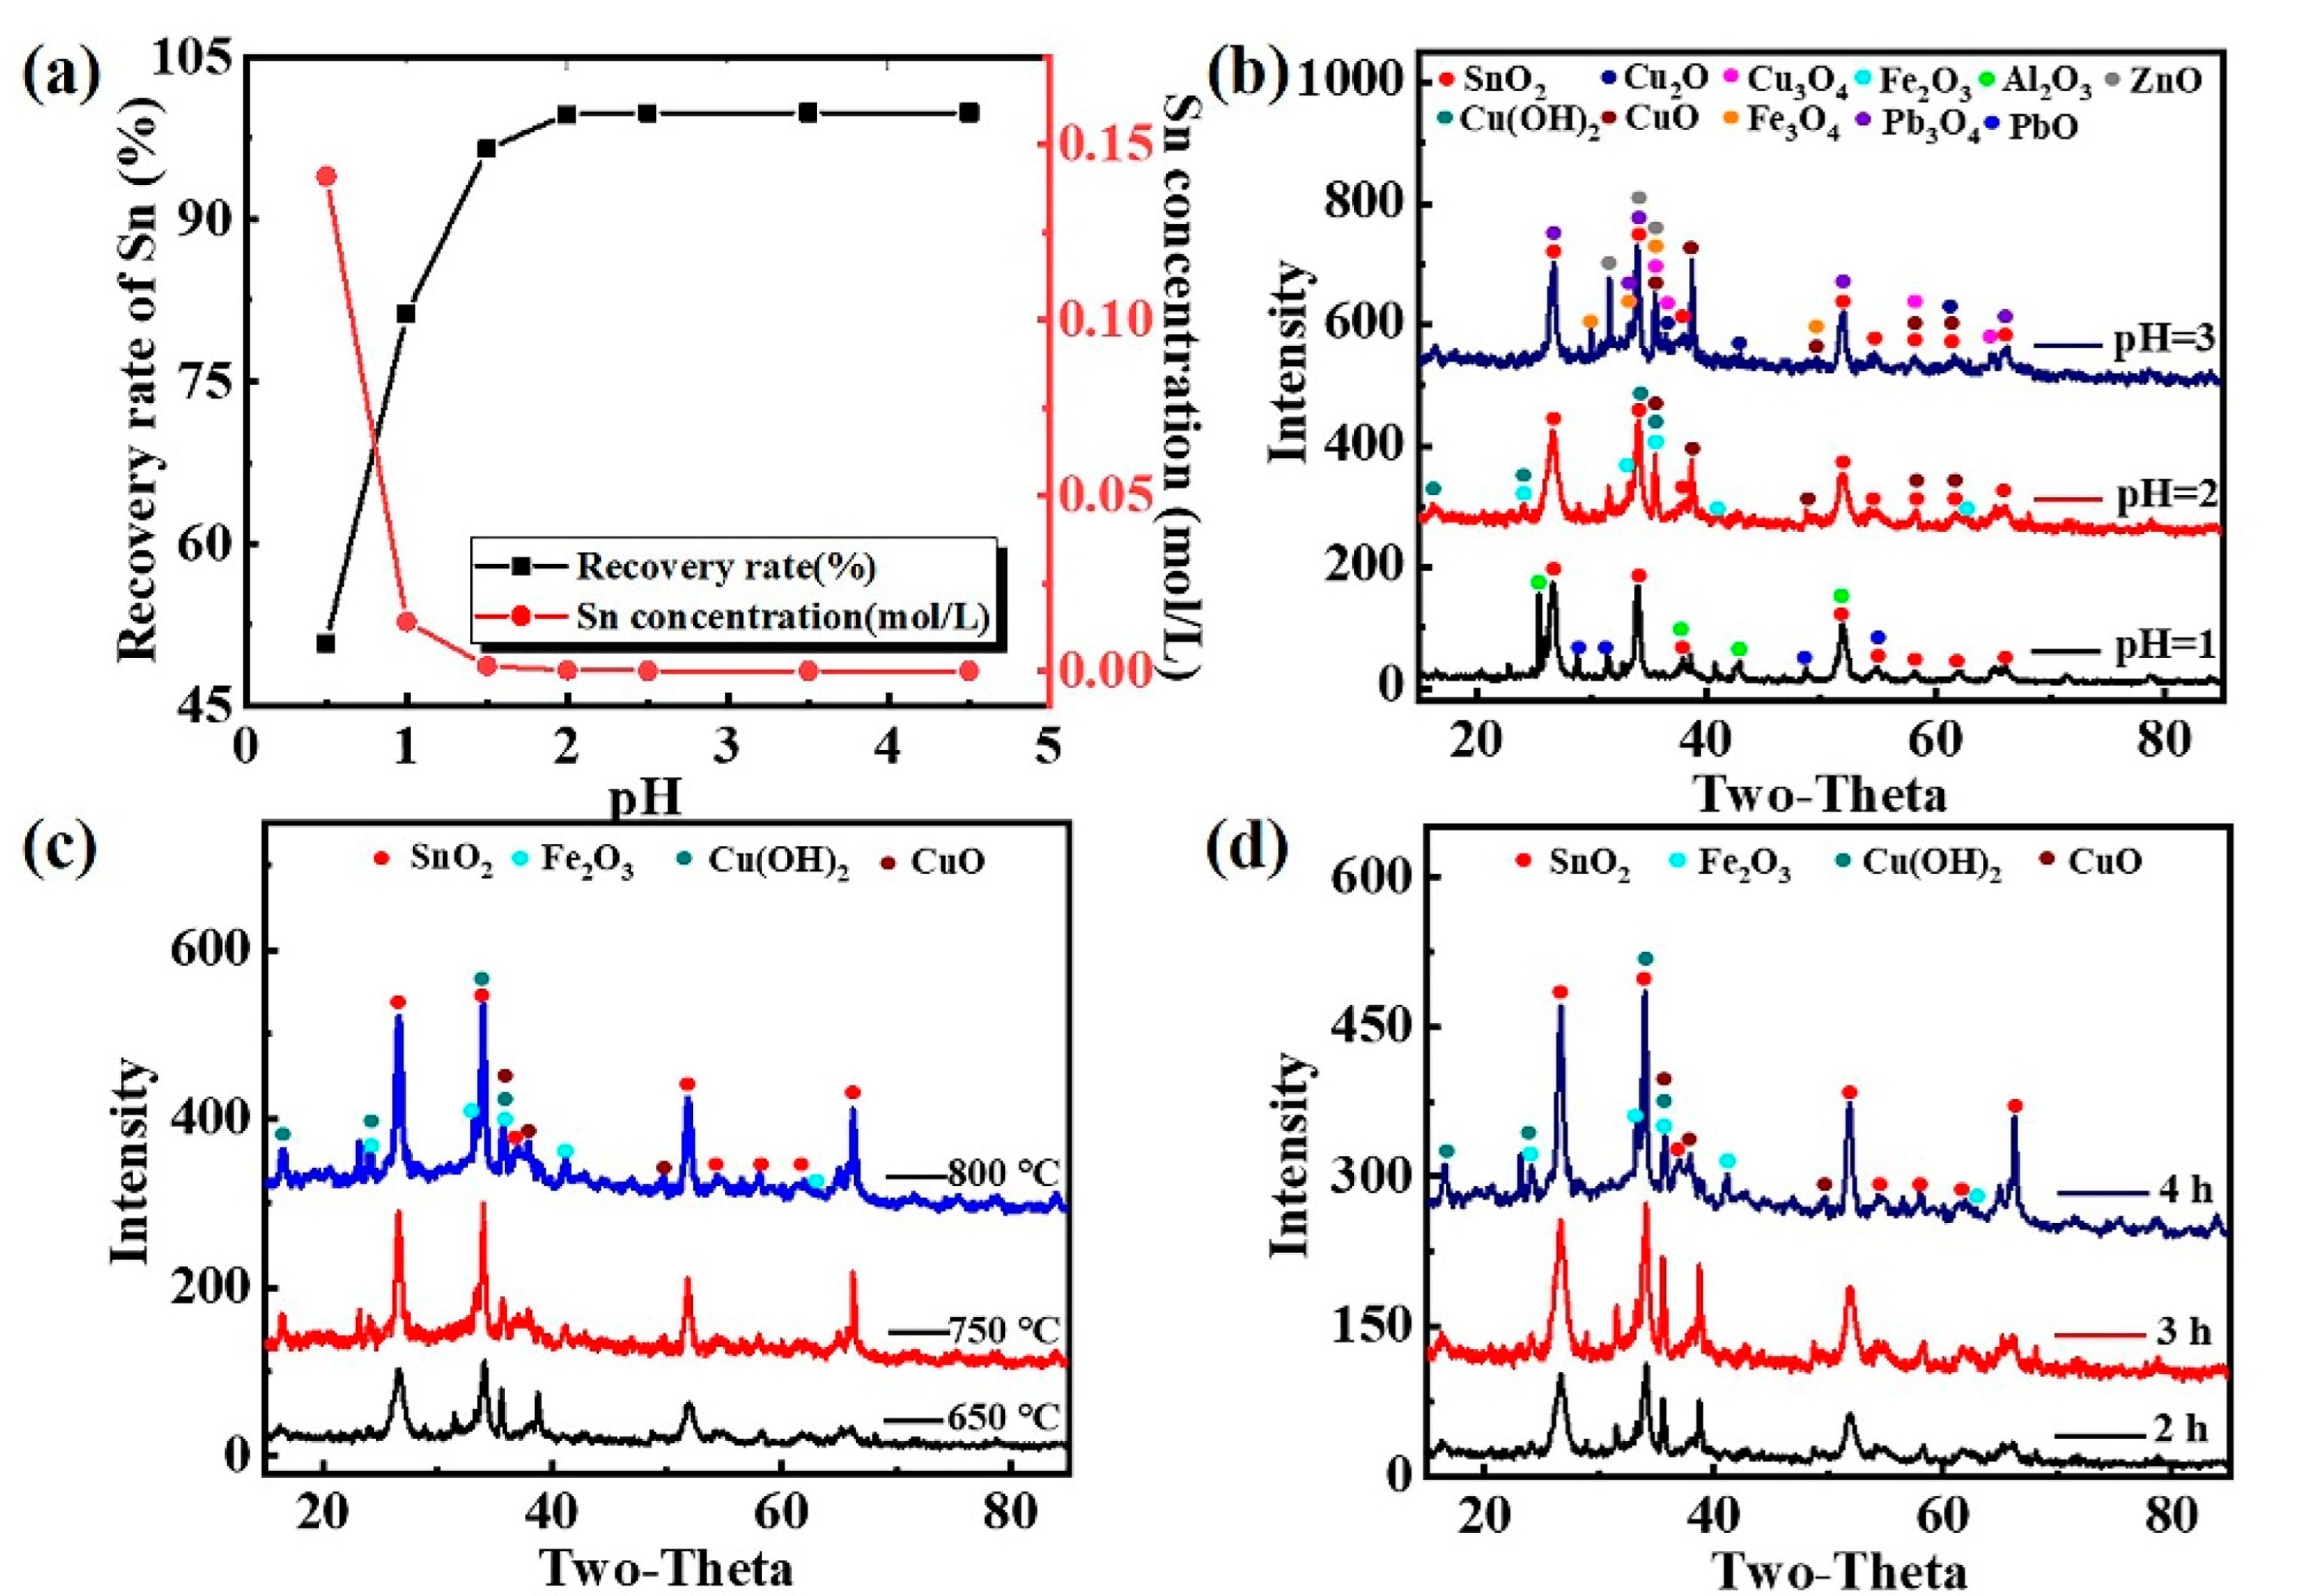
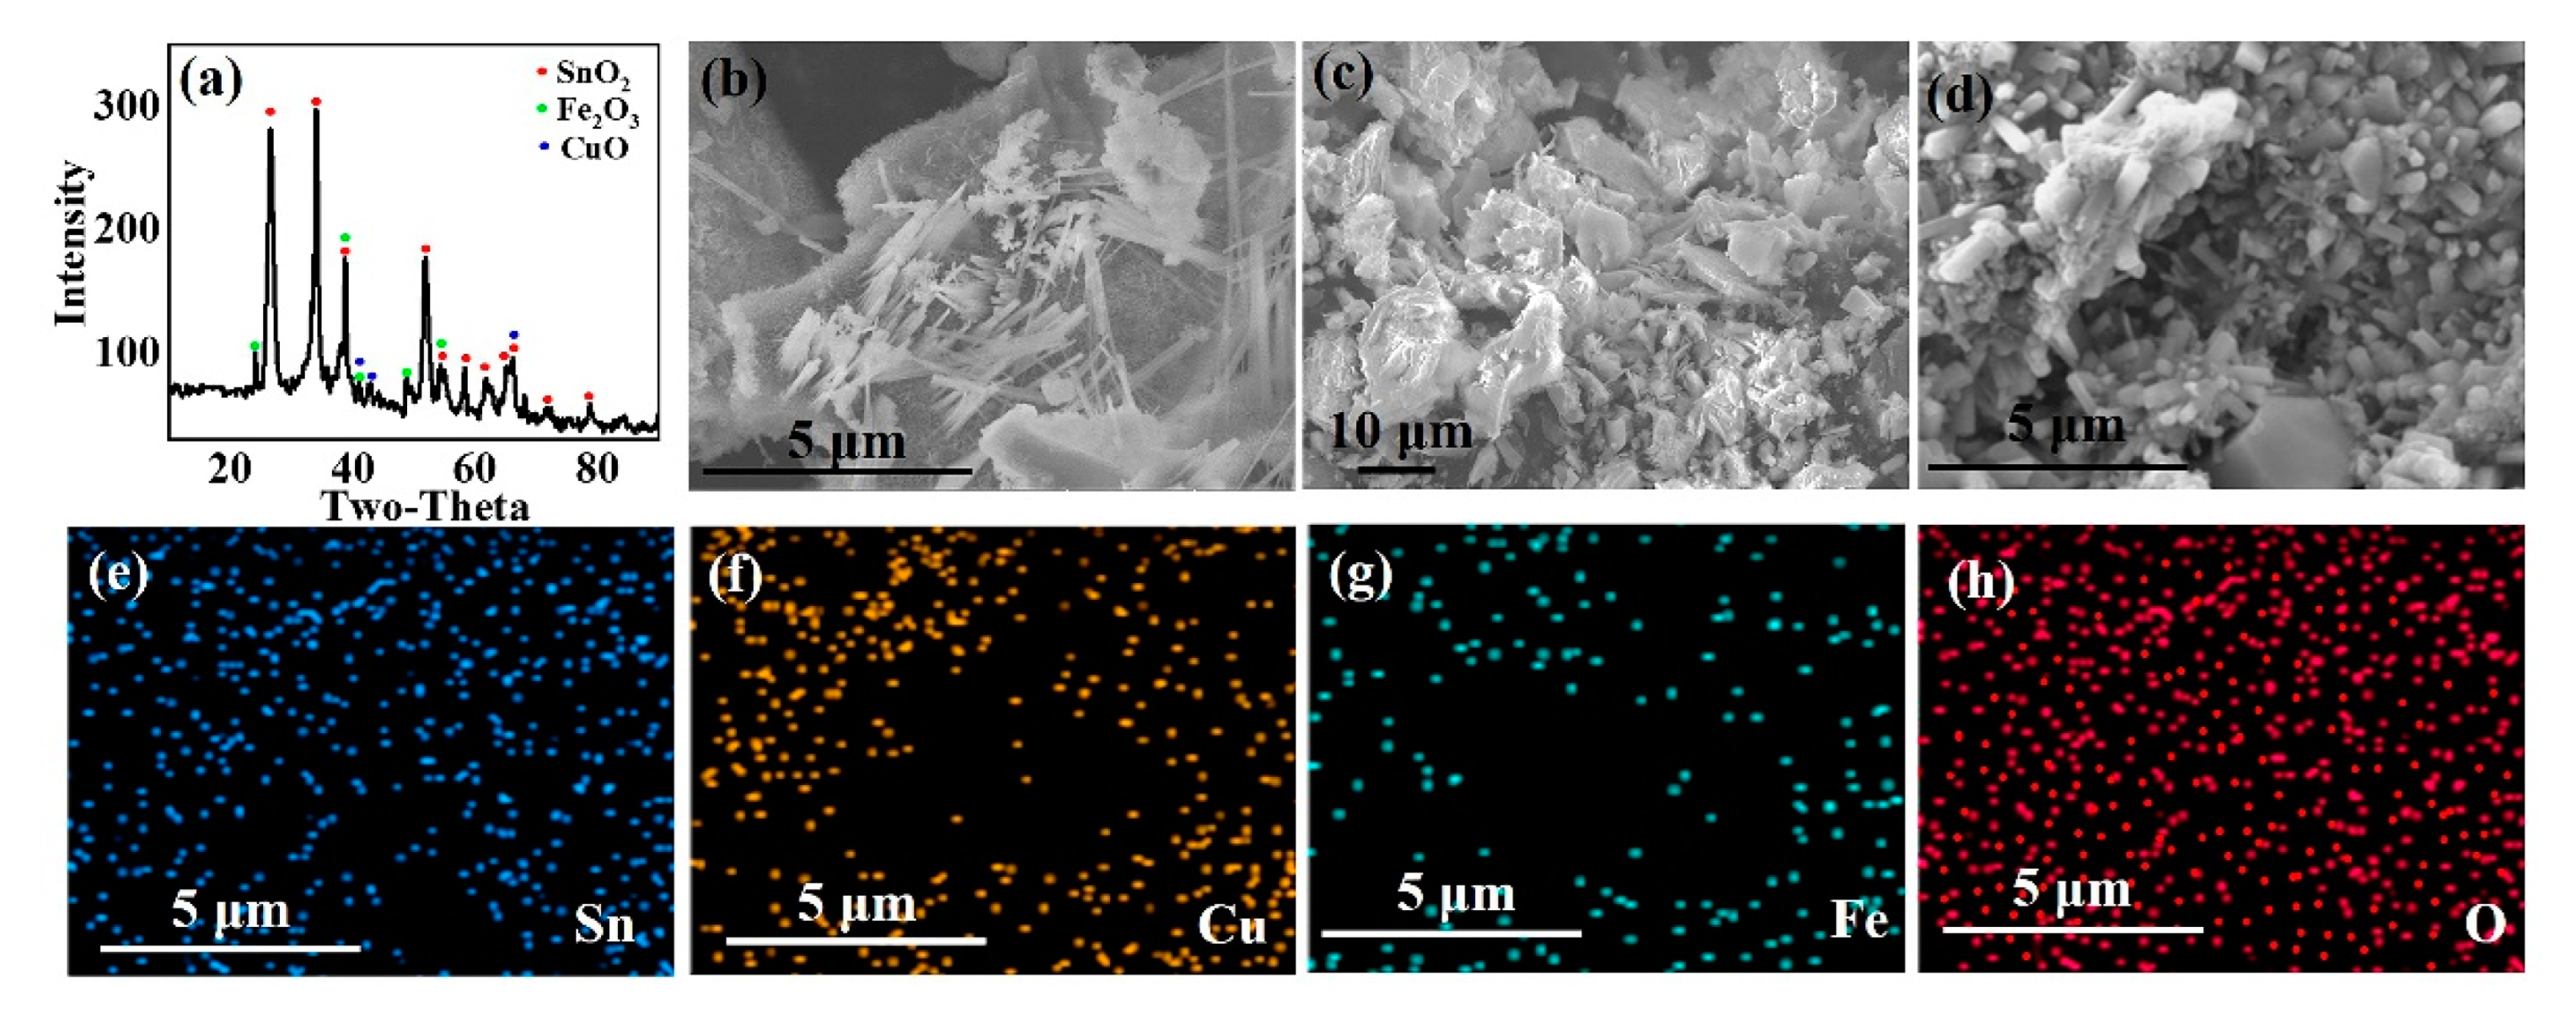
Sn in the pregnant leach solution can be precipitated selectively through adjusting pH value of leach solution as 2, and almost all Sn was recovered. Then, the precipitation product was calcinated and SnO2 with good crystallinity can be obtained by calcining at 750 °C for 3 h.
Our findings demonstrate that Sn of WPCBs can be selectively recovered using this whole recovery process. The proposed whole recovery process needs simple experimental equipment and can reduce the number of chemical reagents. More importantly, the recovery product SnO2 can realize the reuse of Sn.

Supplementary Materials

The following supporting information can be downloaded at: https://www.mdpi.com/article/10.3390/met12060954/s1, Figure S1: The effect of temperature on leaching rates of various metals; Figure S2: (a) Plot of [1 − (1 − X)2/3] − t for Sn at different stirring speed and (b) relationship between lnk and lnR for Sn.; Figure S3: (a) Plot of [1 − (1 − X)2/3] − t for Sn at different solid–liquid ratio and (b) relationship between lnk and lnD for Sn; Figure S4: The XRD analysis of precipitation product obtained at pH = 2; Table S1: Fitting results of kinetic equations of Sn; Table S2: The concentration of Sn in solution at different pH (mol/L); Table S3: The content of the calcinating product.

Author Contributions

Conceptualization: J.H.; Methodology: J.H.; Writing—original draft preparation: J.H.; Writing—reviewing and editing: J.H., X.W., Y.W. (Yishu Wang) and Y.W. (Yufeng Wu); Supervision: F.G. All authors have read and agreed to the published version of the manuscript.

Funding

This research was funded by the National Key Research and Development Program of China (2018YFC1902501, 2018YFC1903605), the Doctoral Scientific Foundation of BJUT (048000514120548), the Fundamental Research Funds for the Central Universities (048000546320506), and International Research Cooperation Seed Fund of Beijing University of Technology (2021A13).

Institutional Review Board Statement

Not applicable.

Informed Consent Statement

Not applicable.

Data Availability Statement

Not applicable.

Conflicts of Interest

The authors declare no conflict of interest.

References

  1. Liu, G.; Xu, Y.; Tian, T.; Wang, T.; Liu, Y. The Impacts of China’s Fund Policy on Waste Electrical and Electronic Equipment Utilization. J. Clean. Prod. 2020, 251, 119582. [Google Scholar] [CrossRef]
  2. Ilankoon, I.M.S.K.; Ghorbani, Y.; Chong, M.N.; Herath, G.; Moyo, T.; Petersen, J. E-Waste in the International Context—A Review of Trade Flows, Regulations, Hazards, Waste Management Strategies and Technologies for Value Recovery. Waste Manag. 2018, 82, 258–275. [Google Scholar] [CrossRef] [PubMed]
  3. Barnwal, A.; Dhawan, N. Evaluation of Fluidization Process for Recovery of Metals from Discarded Printed Circuit Boards. J. Sustain. Metall. 2019, 5, 519–527. [Google Scholar] [CrossRef]
  4. Jian-Guang, Y.; Jie, L.; Si-Yao, P.; Yuan-Lu, L.; Wei-Qiang, S. A New Membrane Electro-Deposition Based Process for Tin Recovery from Waste Printed Circuit Boards. J. Hazard. Mater. 2016, 304, 409–416. [Google Scholar] [CrossRef] [PubMed]
  5. Diaz, F.; Flerus, B.; Nagraj, S.; Bokelmann, K.; Stauber, R.; Friedrich, B. Comparative Analysis About Degradation Mechanisms of Printed Circuit Boards (PCBs) in Slow and Fast Pyrolysis: The Influence of Heating Speed. J. Sustain. Metall. 2018, 4, 205–221. [Google Scholar] [CrossRef]
  6. Yoo, K.; Lee, J.C.; Lee, K.S.; Kim, B.S.; Kim, M.S.; Kim, S.K.; Pandey, B.D. Recovery of Sn, Ag and Cu from Waste Pb-Free Solder Using Nitric Acid Leaching. Mater. Trans. 2012, 53, 2175–2180. [Google Scholar] [CrossRef] [Green Version]
  7. Jeon, S.; Park, I.; Yoo, K.; Ryu, H. The Effects of Temperature and Agitation Speed on the Leaching Behaviors of Tin and Bismuth from Spent Lead Free Solder in Nitric Acid Leach Solution. Geosystem Eng. 2015, 18, 213–218. [Google Scholar] [CrossRef]
  8. Jha, M.K.; Kumari, A.; Choubey, P.K.; Lee, J.C.; Kumar, V.; Jeong, J. Leaching of Lead from Solder Material of Waste Printed Circuit Boards (PCBs). Hydrometallurgy 2012, 121–124, 28–34. [Google Scholar] [CrossRef]
  9. da Silva, M.S.B.; de Melo, R.A.C.; Lopes-Moriyama, A.L.; Souza, C.P. Electrochemical Extraction of Tin and Copper from Acid Leachate of Printed Circuit Boards Using Copper Electrodes. J. Environ. Manag. 2019, 246, 410–417. [Google Scholar] [CrossRef]
  10. Yang, T.; Zhu, P.; Liu, W.; Chen, L.; Zhang, D. Recovery of Tin from Metal Powders of Waste Printed Circuit Boards. Waste Manag. 2017, 68, 449–457. [Google Scholar] [CrossRef]
  11. Han, J.; Liang, C.; Liu, W.; Qin, W.; Jiao, F.; Li, W. Pretreatment of Tin Anode Slime Using Alkaline Pressure Oxidative Leaching. Sep. Purif. Technol. 2017, 174, 389–395. [Google Scholar] [CrossRef]
  12. Guo, X.; Liu, J.; Qin, H.; Liu, Y.; Tian, Q.; Li, D. Recovery of Metal Values from Waste Printed Circuit Boards Using an Alkali Fusion–Leaching–Separation Process. Hydrometallurgy 2015, 156, 199–205. [Google Scholar] [CrossRef]
  13. Lee, S.; Yoo, K.; Kumar, M.; Lee, J. Separation of Sn from Waste Pb-Free Sn—Ag—Cu Solder in Hydrochloric Acid Solution with Ferric Chloride. Hydrometallurgy 2015, 157, 184–187. [Google Scholar] [CrossRef]
  14. Kim, S.; Lee, J.; Yoo, K. Leaching of Tin from Waste Pb-Free Solder in Hydrochloric Acid Solution with Stannic Chloride. Hydrometallurgy 2016, 165, 143–147. [Google Scholar] [CrossRef]
  15. Jeon, S.; Yoo, K.; Diaz, R. Separation of Sn, Bi, Cu from Pb-Free Solder Paste by Ammonia Leaching Followed by Hydrochloric Acid Leaching. Hydrometallurgy 2017, 169, 26–30. [Google Scholar] [CrossRef]
  16. Jo, J.H.; Lee, D.S.; Park, D.; Choe, W.S.; Park, J.M. Optimization of Key Process Variables for Enhanced Hydrogen Production by Enterobacter Aerogenes Using Statistical Methods. Bioresour. Technol. 2008, 99, 2061–2066. [Google Scholar] [CrossRef]
  17. Bao, S.; Chen, Q.; Zhang, Y.; Tian, X. Optimization of Preparation Conditions of Composite Electrodes for Selective Adsorption of Vanadium in CDI by Response Surface Methodology. Chem. Eng. Res. Des. 2021, 168, 37–45. [Google Scholar] [CrossRef]
  18. Ghafarzadeh, M.; Abedini, R.; Rajabi, R. Optimization of Ultrasonic Waves Application in Municipal Wastewater Sludge Treatment Using Response Surface Method. J. Clean. Prod. 2017, 150, 361–370. [Google Scholar] [CrossRef]
  19. Rincón, J.; Camarillo, R.; Martín, A. Solubility of Aluminum Sulfate in Near-Critical and Supercritical Water. J. Chem. Eng. Data 2012, 57, 2084–2094. [Google Scholar] [CrossRef]
  20. Ha, V.H.; Lee, J.C.; Huynh, T.H.; Jeong, J.; Pandey, B.D. Optimizing the Thiosulfate Leaching of Gold from Printed Circuit Boards of Discarded Mobile Phone. Hydrometallurgy 2014, 149, 118–126. [Google Scholar] [CrossRef]
  21. Yazici, E.Y.; Deveci, H. Extraction of Metals from Waste Printed Circuit Boards (WPCBs) in H2SO4-CuSO4-NaCl Solutions. Hydrometallurgy 2013, 139, 30–38. [Google Scholar] [CrossRef]
  22. Xiao, W.; Liu, X.; Zhao, Z. Kinetics of Nickel Leaching from Low-Nickel Matte in Sulfuric Acid Solution under Atmospheric Pressure. Hydrometallurgy 2020, 194, 105353. [Google Scholar] [CrossRef]
  23. Crundwell, F.K. The Dissolution and Leaching of Minerals: Mechanisms, Myths and Misunderstandings. Hydrometallurgy 2013, 139, 132–148. [Google Scholar] [CrossRef]
  24. Luo, M.J.; Liu, C.L.; Xue, J.; Li, P.; Yu, J.G. Leaching Kinetics and Mechanism of Alunite from Alunite Tailings in Highly Concentrated KOH Solution. Hydrometallurgy 2017, 174, 10–20. [Google Scholar] [CrossRef]
  25. Moosakazemi, F.; Ghassa, S.; Mohammadi, M.R.T. Environmentally Friendly Hydrometallurgical Recovery of Tin and Lead from Waste Printed Circuit Boards: Thermodynamic and Kinetics Studies. J. Clean. Prod. 2019, 228, 185–196. [Google Scholar] [CrossRef]
  26. Saleh, S.M.; Said, S.A.; El-shahawi, M.S. Extraction and Recovery of Au, Sb and Sn from Electrorefined Solid Waste. Anal. Chim. Acta 2001, 436, 69–77. [Google Scholar] [CrossRef]
  27. Liu, S.; Yang, S.; Luo, T.; Chen, Y. Comprehensive Recovery of Sn-Cu Bearing Residue and Preparation of High Purity SnO2 and CuSO4⋅5H2O. Sep. Purif. Technol. 2021, 257, 117826. [Google Scholar] [CrossRef]
  28. Seo, E.Y.; Cheong, Y.W.; Yim, G.J.; Min, K.W.; Geroni, J.N. Recovery of Fe, Al and Mn in Acid Coal Mine Drainage by Sequential Selective Precipitation with Control of PH. Catena 2017, 148, 11–16. [Google Scholar] [CrossRef]
  29. Balladares, E.; Jerez, O.; Parada, F.; Baltierra, L.; Hernández, C.; Araneda, E.; Parra, V. Neutralization and Co-Precipitation of Heavy Metals by Lime Addition to Effluent from Acid Plant in a Copper Smelter. Miner. Eng. 2018, 122, 122–129. [Google Scholar] [CrossRef]
  30. Comel, J.; Meux, E.; Leclerc, N.; Diliberto, S. Use of Phytic Acid for Selective Precipitation of Undesirable Metals (Al, Fe, Pb) Contained in the Leachates from Hydrometallurgical Processes. J. Environ. Chem. Eng. 2021, 9, 105450. [Google Scholar] [CrossRef]
  31. Gao, J.M.; Zhang, M.; Cheng, F.; Guo, M. Process Development for Selective Precipitation of Valuable Metals and Simultaneous Synthesis of Single-Phase Spinel Ferrites from Saprolite-Limonite Laterite Leach Liquors. Hydrometallurgy 2017, 173, 98–105. [Google Scholar] [CrossRef]
  32. Matlock, M.M.; Howerton, B.S.; Atwood, D.A. Chemical Precipitation of Heavy Metals from Acid Mine Drainage. Water Res. 2002, 36, 4757–4764. [Google Scholar] [CrossRef]
  33. Wang, J.; Wan, W. Experimental Design Methods for Fermentative Hydrogen Production: A Review. Int. J. Hydrogen Energy 2009, 34, 235–244. [Google Scholar] [CrossRef]
  34. Shawabkeh, R.A. Hydrometallurgical Extraction of Zinc from Jordanian Electric Arc Furnace Dust. Hydrometallurgy 2010, 104, 61–65. [Google Scholar] [CrossRef]
  35. Yamasaki, N.; Lan, X.; Feng, Q.I. Kinetics of Hydrothermal Oxidation of Granular Pb Metal to Pbo Powder in Sodium Hydroxide Solutions. Metall. Mater. Trans. B Process Metall. Mater. Processing Sci. 1997, 28, 33–37. [Google Scholar] [CrossRef]
  36. Levenspiel, O. Experimental Search for a Simple Rate Equation to Describe Deactivating Porous Catalyst particles. J. Catal. 1972, 25, 265–272. [Google Scholar] [CrossRef]
  37. Abrantes, L.M.; Costa, M.C. Electro-Oxidation as a Pre-Treatment for Gold Recovery. Hydrometallurgy 1996, 40, 99–110. [Google Scholar] [CrossRef]
  38. Gao, G.; Li, D.; Zhou, Y.; Sun, X.; Sun, W. Kinetics of High-Sulphur and High-Arsenic Refractory Gold Concentrate Oxidation by Dilute Nitric Acid under Mild Conditions. Miner. Eng. 2009, 22, 111–115. [Google Scholar] [CrossRef]
  39. Xu, Y.; Jiang, T.; Wen, J.; Gao, H.; Wang, J.; Xue, X. Leaching Kinetics of Mechanically Activated Boron Concentrate in a NaOH Solution. Hydrometallurgy 2018, 179, 60–72. [Google Scholar] [CrossRef]
  40. Supothina, S.; Rattanakam, R.; Vichaphund, S.; Thavorniti, P. Effect of Synthesis Condition on Morphology and Yield of Hydrothermally Grown SnO2 Nanorod Clusters. J. Eur. Ceram. Soc. 2011, 31, 2453–2458. [Google Scholar] [CrossRef]
  41. Fang, B.; Yu, J.; Ge, X.; Yang, C. Ionic Liquid Assisted Hydrothermal Synthesis of Monodispersed Mesoporous SnO2 Nanospheres. Mater. Lett. 2012, 73, 229–231. [Google Scholar] [CrossRef]
  42. Yang, H. Enhanced Photoluminescence Property of SnO2 Nanoparticles Contained in Mesoporous Silica Synthesized with Leached Talc as Si Source. Microporous Mesoporous Mater. 2007, 102, 204–211. [Google Scholar] [CrossRef]
Figure 1. (a) The particle size distribution of WPCBs, (b) XRD analysis of WPCBs particles.
Metals 12 00954 g001
Figure 2. Effect of parameters on the leaching of Sn (a) temperature (4 mol/L HCl, 0.10 mg/L, 400 rpm), (b) HCl concentration (40 °C, 0.10 mg/L, 400 rpm), (c) solid–liquid ratio (40 °C, 4 mol/L HCl, 400 rpm), and (d) stirring speed (40 °C, 4 mol/L HCl, 0.10 mg/L).
Metals 12 00954 g002
Figure 3. The predicted vs. observed plots for the leaching rate of Sn.
Metals 12 00954 g003
Figure 4. Relationships between both experimental parameters and Sn leaching rates (a) temperature and stirring speed, (b) temperature and solid–liquid ratio, (c) temperature and HCl concentration, (d) solid–liquid ratio and stirring speed, (e) stirring speed and HCl concentration and (f) solid–liquid ratio and HCl concentration.
Metals 12 00954 g004
Figure 5. Relationship between lnk and 1000/T during Sn leaching (a) chemical control reaction and (b) mixed control reaction.
Metals 12 00954 g005
Figure 6. (a) Plot of [1 − (1 − X)2/3] − t for Sn at different HCl concentration and (b) relationship between lnk and lnC for Sn.
Metals 12 00954 g006
Figure 7. (a) The effect of pH values on the recovery rate of Sn and stable concentration of Sn, (b) the effect of pH values on the calcinating products at 750 °C. (c) The effect of roasting temperature on the roasting products (calcinating 3 h). (d) The effect of calcinating time on the roasting products at 750 °C.
Metals 12 00954 g007
Figure 8. Characterization of calcinating product (a) XRD, (b,c) SEM, (dh) EDS.
Metals 12 00954 g008
Figure 9. The flow sheet of Sn recovery process from WPCBs.
Metals 12 00954 g009
Table 1. The compositions of metals in WPCBs particles.
ElementsAuAgCuFeNiZnSnPbAlCrCo
Content (mg/g)0.080.62422.965.098.408.1524.92.800.76BDLBDL
BDL: Below detectable limit.
Table 2. Parameters and corresponding levels tested in the leaching studies.
ParametersLevels
LowMedianHigh
−101
ATemperature (°C)456075
BAgitation speed (rpm)300400500
CSolid–liquid ratio (g/mL)0.050.10.15
DHCl concentration (mol/L)345
Table 3. BBD design with experimental condition and recovery of Sn.
NoABCDRecovery (%)
Sn
1753000.10490
2605000.05473.27
3454000.10558.95
4603000.05473.7
5604000.05580.56
6605000.10575.3
7604000.15535.79
8605000.10362.29
9603000.15428.36
10754000.10596
11604000.05364.98
12603000.10362.8
13454000.05456.55
14455000.10453.52
15605000.15433.22
16754000.10370
17754000.05494
18754000.15460
19453000.10450.1
20454000.10346.15
21454000.15422.71
22604000.15320.64
23755000.10490
24603000.10576.95
25604000.10469.56
26604000.10472.67
27604000.10473.36
28604000.10473.25
29604000.10473.75
Table 4. ANOVA of the regression model for Sn leaching.
SourceSum of SquaresMean Quaresp-Value
Model11,543.99824.57<0.0001
A-Temperature3746.263746.26<0.0001
B-Stirring speed2.72.70.6731
C-Solid–liquid ratio4894.24894.2<0.0001
D-HCl concentration778.89778.89<0.0001
AB2.922.920.6609
AC0.00620.00620.9839
AD43.5943.590.1055
BC7.007.000.4992
BD0.32470.32470.8834
CD0.050.0460.956
A23.613.610.6264
B215.8915.890.3137
C21936.661936.66<0.0001
D2101.26101.260.0195
Error2.450.61
Residual203.7314.55
Lack of fit192.1819.220.065
Total11,747.72
R2 = 0.9827; R2 Adj. = 0.9653.
Table 5. The concentrations of various metals in the leach solution.
ElementsSnCuFeZnNiAl
Content (g/L)2.431.310.480.810.710.08
Publisher’s Note: MDPI stays neutral with regard to jurisdictional claims in published maps and institutional affiliations.

