1. Introduction
Nodular cast iron is an alternative to commercial carbon steels due to the similarity of their mechanical properties and the low production cost in relation to steel. NCI has good machinability and is approximately 10% lighter than the steel [
1]. According to [
2], the present NCI production cost varies at around 20% to 40% less than commercial steel. This type of iron has a lower production cost because of the synthetic melting process, which replaces some of the expensive pig iron with cheaper scrap iron. Normally, silicon and carbon are added with the aim of obtaining a higher nodule number.
NCI is not a single material but a class of materials offering a wide range of properties obtained through microstructure control [
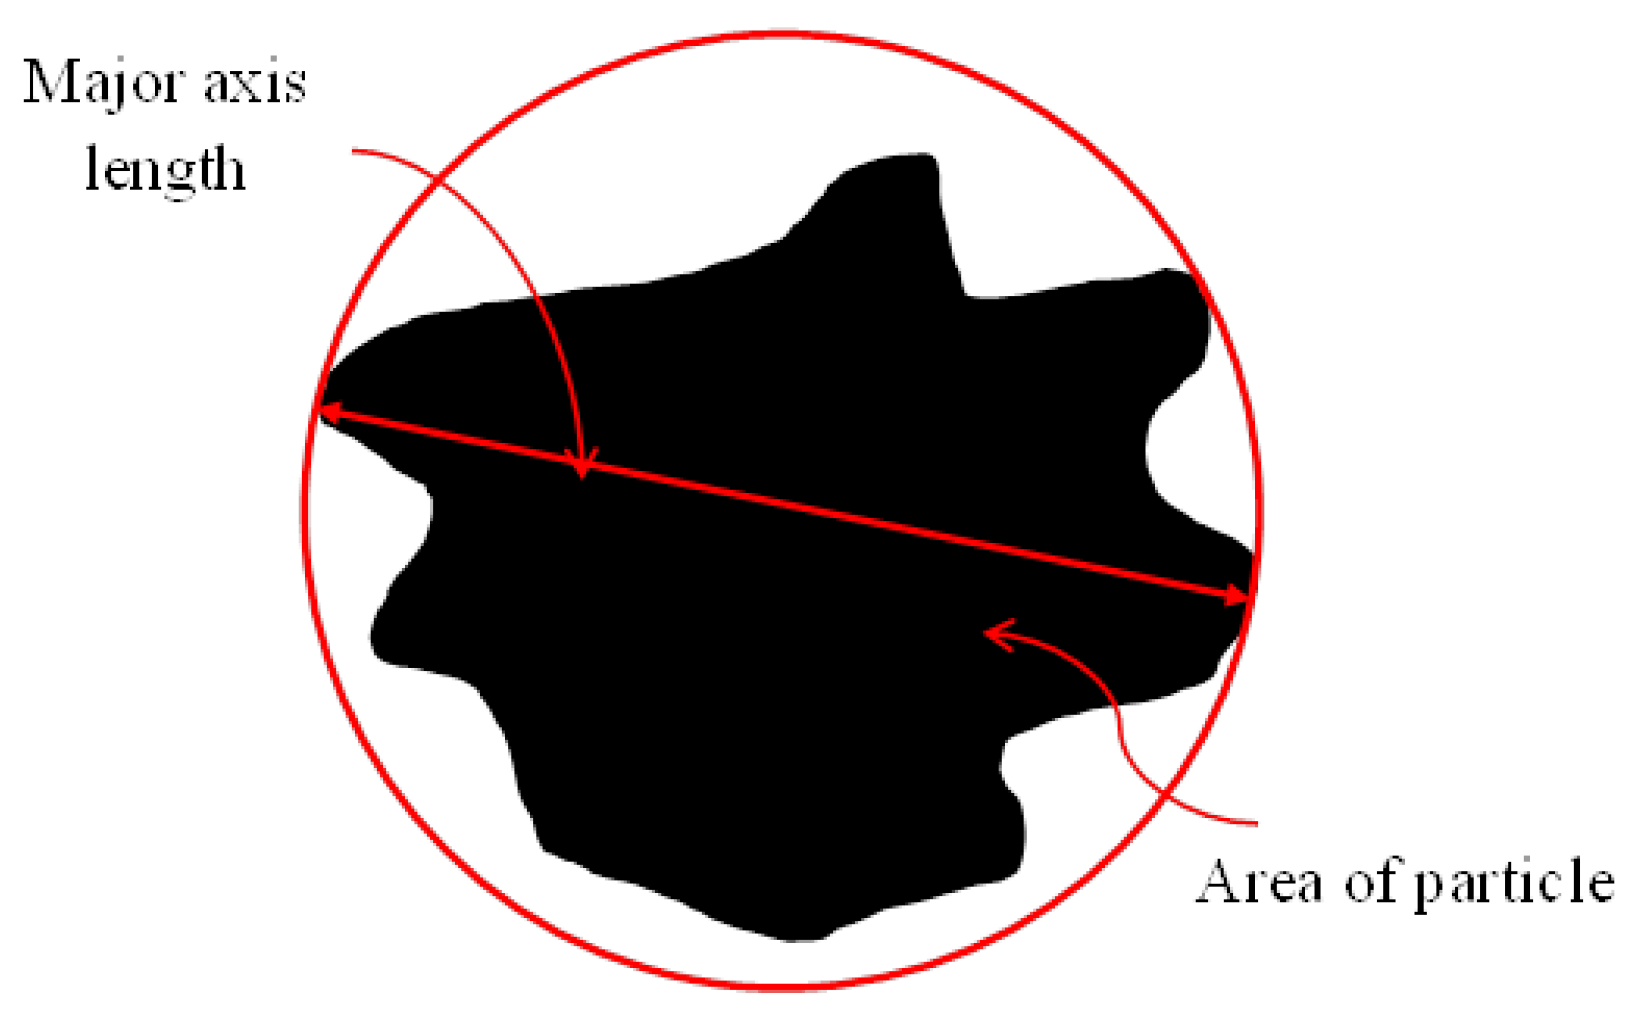
3]. NCI presents the graphite in a crack-arresting nodule shape, making it ductile. The spherical shape tends to have a lower stress concentration (
= 1.7), while lamellar and flake graphite results in higher stress (
= 5.4) [
4].
The mechanical properties of NCI are strongly dependent on its microstructure [
5,
6,
7]. The metal matrix can be composed mainly of ferrite, resulting in low strength values associated with high ductility and toughness values. In a ferritic matrix, NCI presents a strength limit of 350–450 MPa, associated with 10–22% elongation. Another composition is that the matrix is constituted by pearlite, which implies good mechanical strength values associated with relatively low ductility values. In a pearlitic matrix, the NCI strength limit can reach 900 MPa associated with 2% elongation, and by then producing mixtures of ferrite and pearlite, different classes of cast iron are obtained, with diverse combinations of properties, each suitable for a specific application [
8].
Due to a combination of excellent properties, the nodular cast iron family has been increasingly applied in various engineering fields and has become a research material [
9]. Given the properties and machinability of this material, NCI has been replacing grey cast iron, malleable cast iron, cast and forged steel, and welded structures [
10]. Typical applications of nodular cast iron mainly include components such as pulleys, shafts, sprockets, valves, and hydraulic components, pinions, gears, bearings, brake calipers, and supports, crankshafts, camshafts, and suspension parts of vehicles, among others.
The NCI manufacturing process comprises many variables, each of which affects the final material’s mechanical properties. Graphite has low mechanical strength when compared to the metallic matrix [
11]. The presence of graphite can be regarded as a mechanical discontinuity and a stress concentration point in the matrix. In addition, the graphite shape also has a marked influence on the material’s mechanical properties. All the aforementioned characteristics intensify the search for understanding the mechanical properties of NCI and their variations. The properties of NCI are strictly dependent on its material microstructure, size, shape, and nodule distribution, and the presence of defects resulting from the manufacturing process has a direct impact on the material properties. The authors in [
12] investigated the mechanical properties depending on the cross-section thickness in GGG40 NCI, and the authors in ref. [
13] evaluated the effects of microstructure, mechanical and physical properties on machinability of graphite cast irons. Samec et al. [
14] analyzed the low cycle fatigue behaviour of NCI GGG50 subject to high temperatures of 300 °C and 400 °C, with applications in railway brake disks.
It is worth mentioning that several studies concern NCI obtained from Y-blocks or U-blocks, a different scenario from the small and medium foundries. Important engineering components are manufactured from casted materials, and with the increased use of NCI, special attention must be paid to the mechanical and microstructural properties of components cast directly in blocks, bars, or in the final shape component. As is well-known, NCI has a range of mechanical properties that vary greatly with the cast control, leakage temperature, cooling rates, chemical composition, and cast shape. The mechanical properties of nodular cast irons are intimately related to their microstructure, and parameters such as the nodule count, nodularity, and phase content are preponderant factors in the final mechanical properties [
15,
16]. Despite the mechanisms regarding the microstructure being well-known in the literature, the academic community is aware that the mechanical properties may differ widely from the usual parameters specified in the standards. These deviations in mechanical and microstructure properties ensure that NCI becomes an open research subject.
A good support that has been used in microstructural analysis is image segmentation. Image processing techniques have been widely employed (applied) in many fields, such as robot automatisation [
17], vehicle detection [
18], medical procedures and diagnosis [
19,
20], and in the and in the analysis of mechanical materials [
21] and NCI chacterization [
22].
Image segmentation allows for obtaining the measurement, count, and size of the graphite nodules. Segmentation based on thresholding of greyscale images makes it possible to binarise the image. In many cases, this is enough for evidencing the domains [
23]. Computational image analysis can be a robust tool with the capacity to define the cast iron class in the presence of dust, scratches, and measurement noise [
24].
The present work aims to present a comprehensive study concerning the mechanical behavior of commercial NCI GGG40, GGG60, and GGG70, targeting the Brazilian industrial problem of large variations in mechanical properties of the obtained cast iron. As aforementioned, the nodular cast irons present a wide variety of mechanical properties due to several factors resulting from the casting process. In this sense, the efforts rely on the material characterization of blocks and bars from the same batch. The study was carried out through mechanical tests and microstructural analysis using micrograph images with the aid of digital image segmentation.
3. Results and Discussion
First, the results regarding the mechanical tests: tensile test and hardness test. From these results, an analysis of the nodule characteristics and quantity is performed.
In the second part, the casted round bars are analyzed by computational image analysis, where the nodule density and graphite percentage on certain areas of the round bar cross-section are verified.
Finally, the third part presents the microstructure with chemical etching and computational image analysis, complementing the discussion of the results.
3.2. Round Bar Ends Analysis
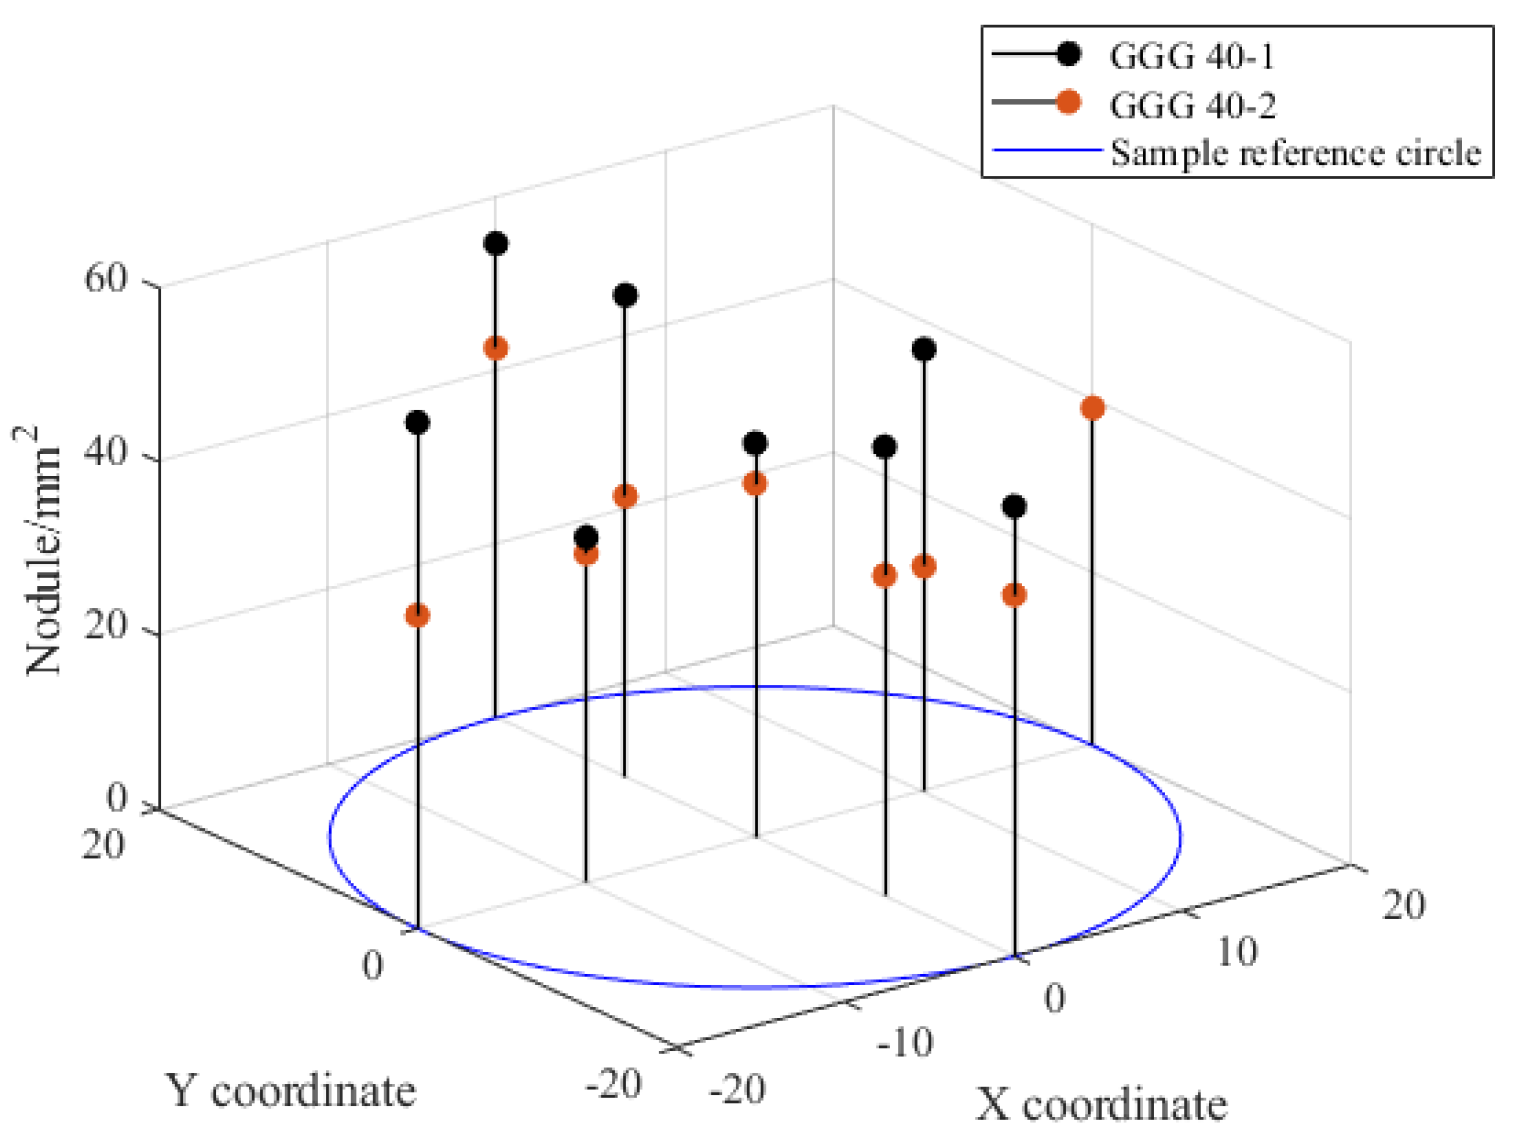
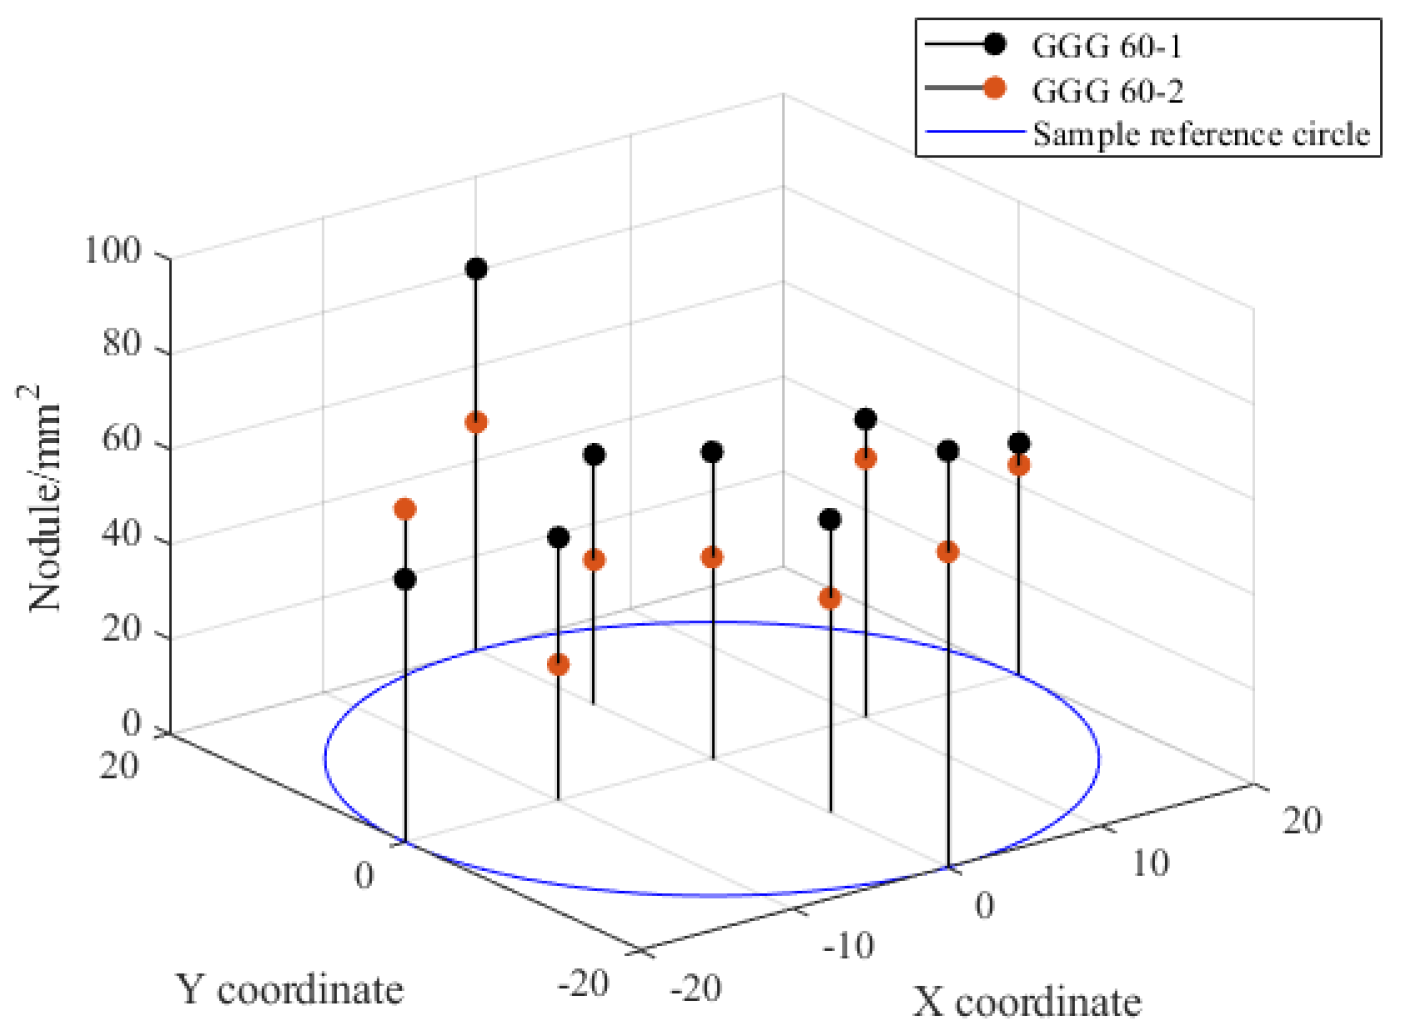
Figure 9 shows the nodule count per mm
2 at specific points in the cast iron round bar cross-section. Two samples were analyzed, one from the top and the other from the bottom, as explained in
Section 2.5.
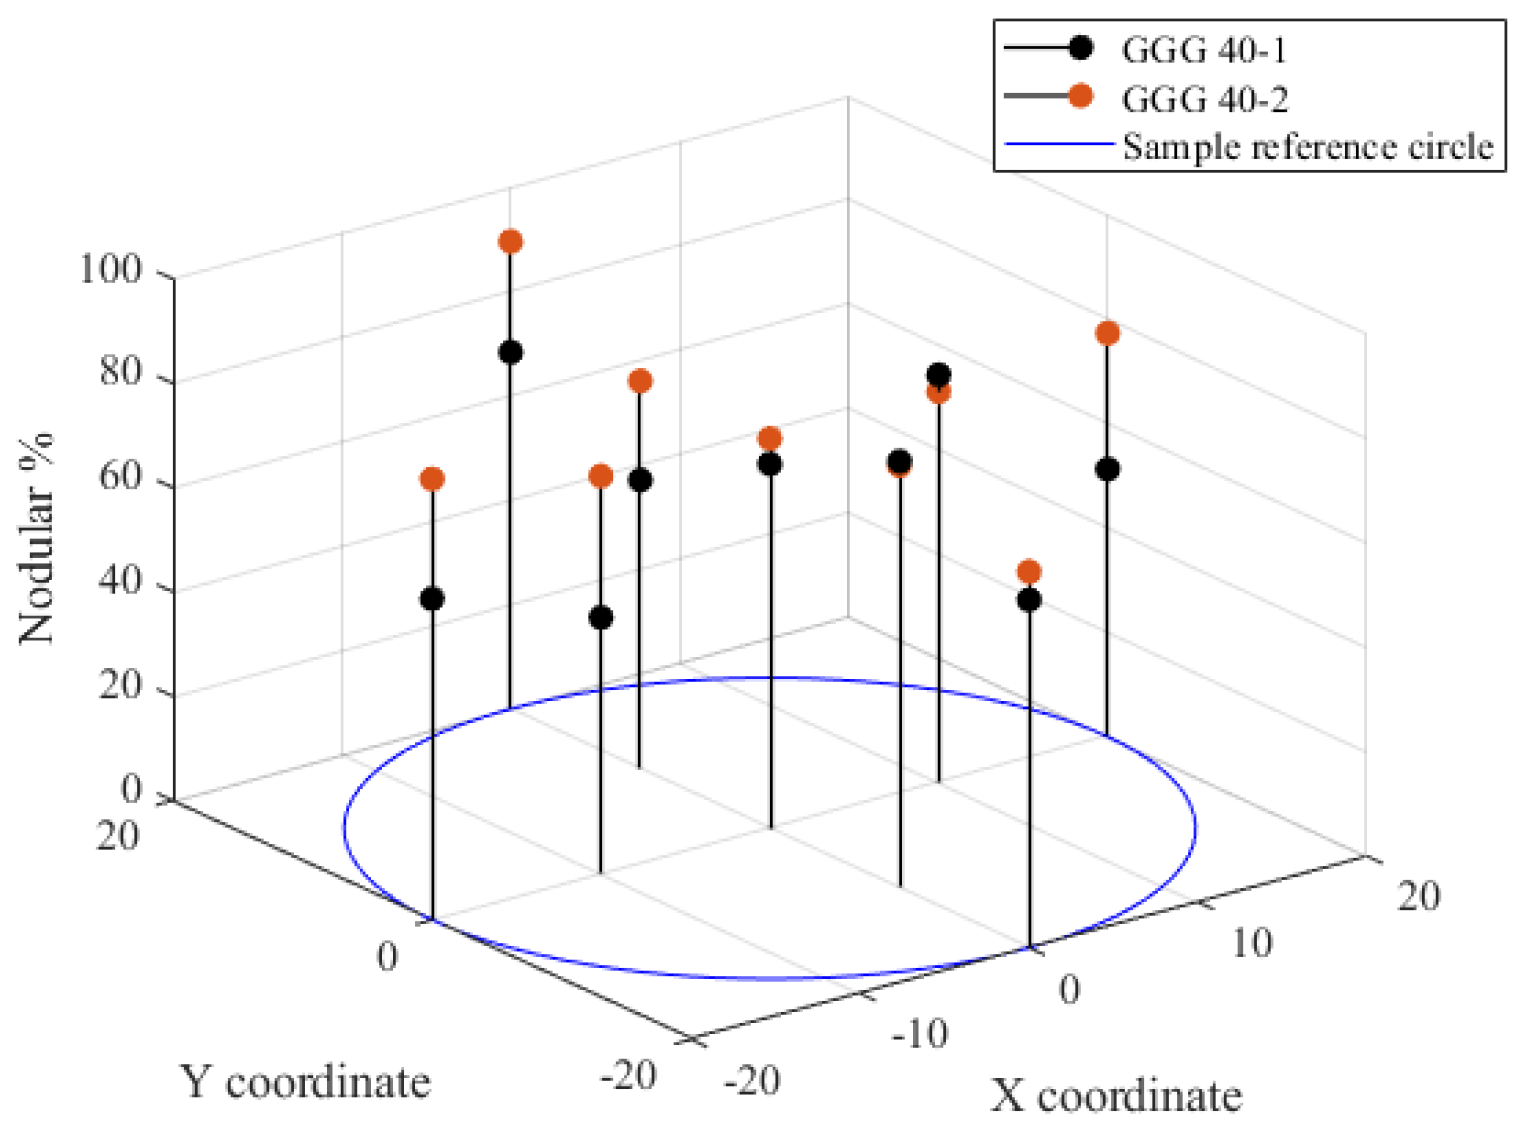
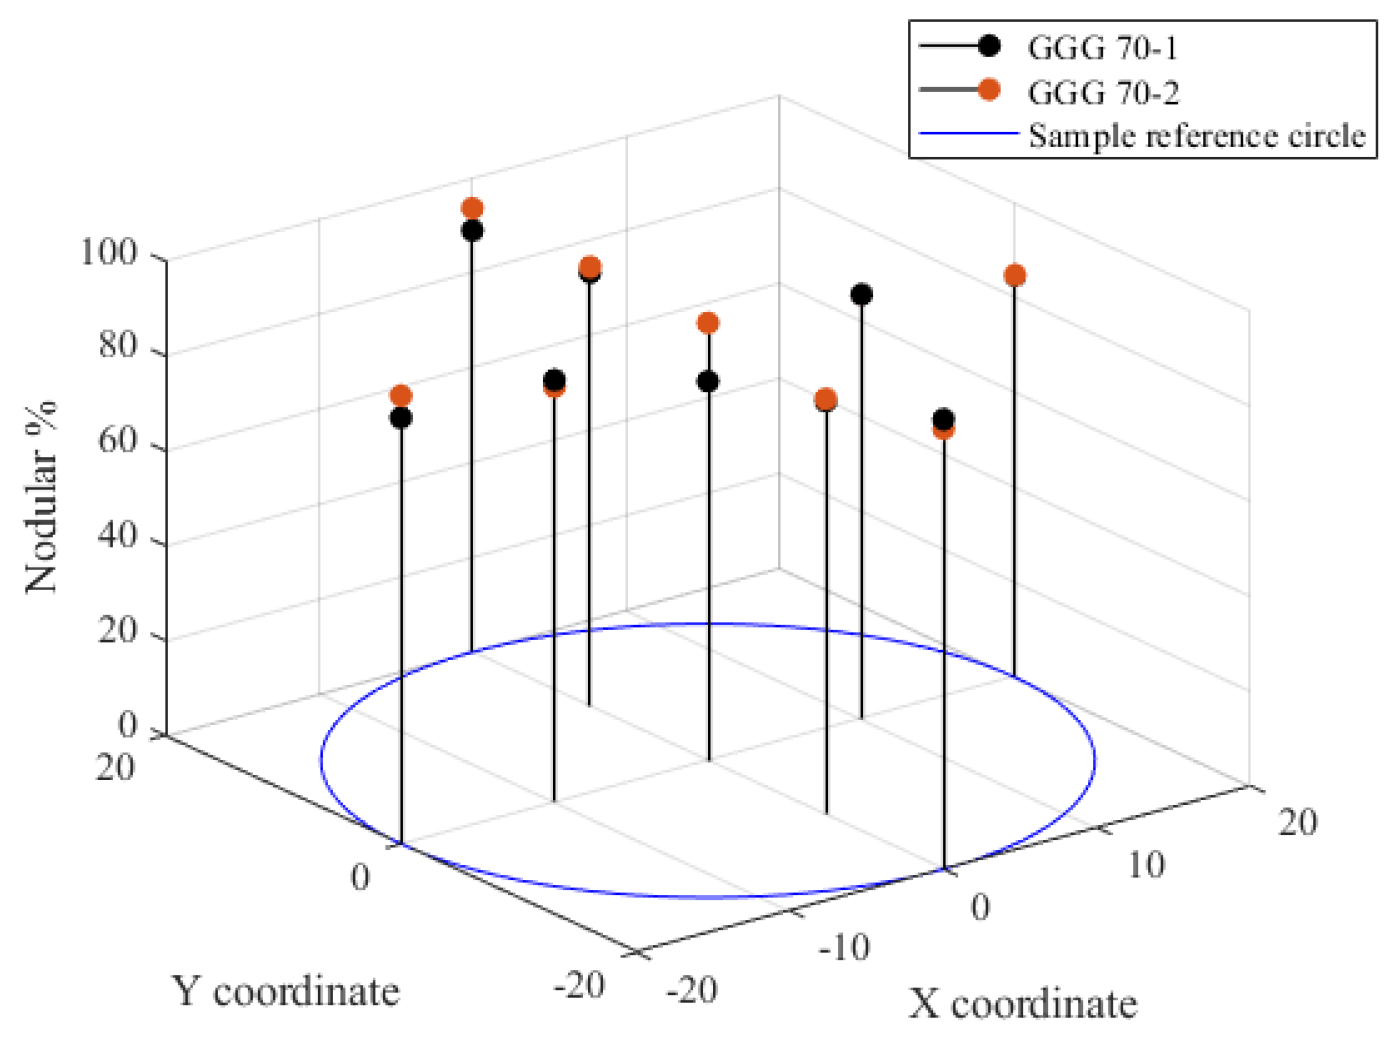
Figure 10 shows the percentage of nodular graphite in relation to all graphite particles. Both figures represent NCI GGG40 results.
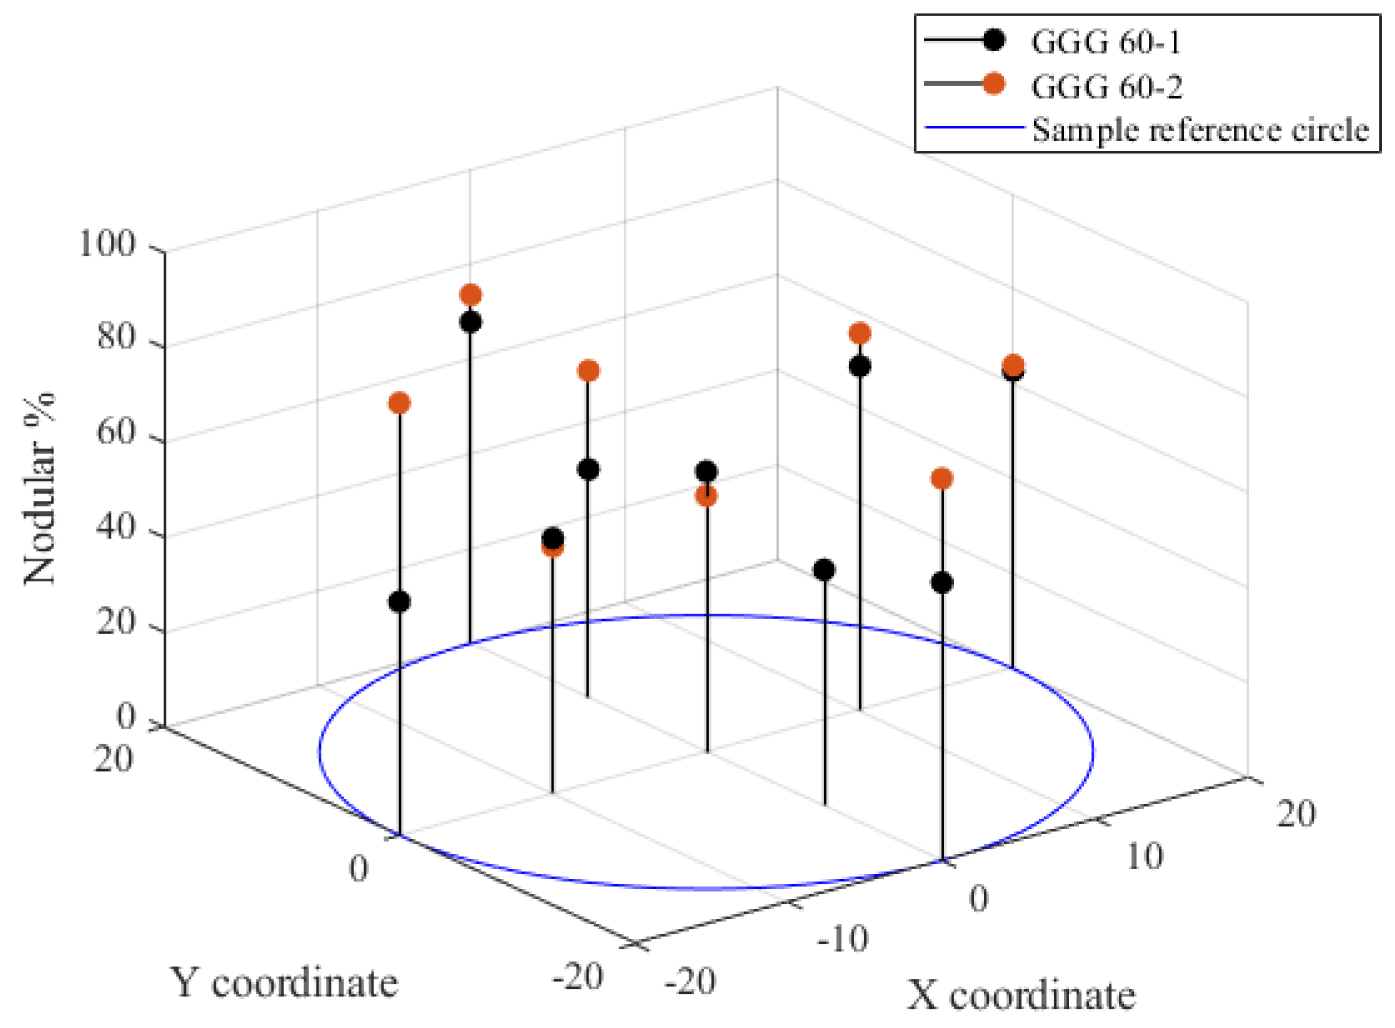
Figure 11 and
Figure 12 present the results for the nodule count and graphite percentage for NCI GGG60.
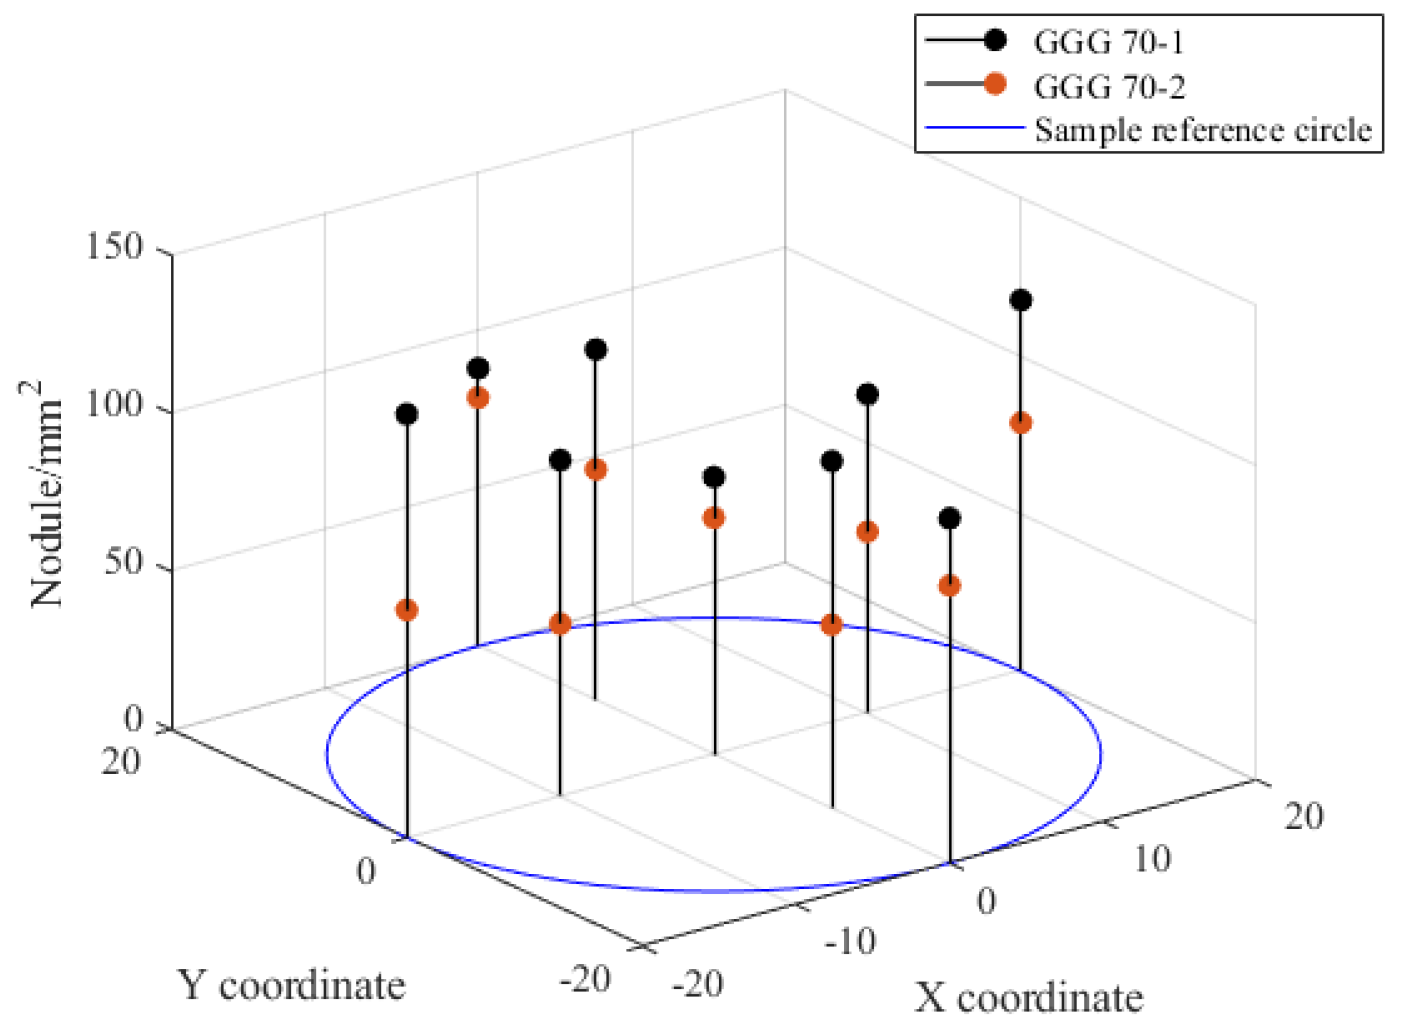
Figure 13 and
Figure 14 present the results for the nodule count and graphite percentage for NCI GGG70.
It is possible to observe a pattern of behaviour in the presented charts. The samples with index indicator −1 correspond to the specimen removed from the top of the round casted bar. This means that the graphite concentration is higher at the top of the casted material. As the graphite nodule is less dense than the material, the nodules tend to float to the surface, causing a higher nodule concentration per area unit in the sample. However, the percentage of graphite particles with a spherical shape was higher in the bottom samples.
The difference was slightly higher in the percentage of nodular graphite, and this phenomenon can be explained by the cooling rate being slightly higher than at the top (leakage of material); so, at the bottom the cooling rate is lower, which helps in the nucleation of the graphite.
Another consideration is that the density of nodules recorded in the measurement at the centre of the sample is lower than that measured near the edge of the sample. The explanation is that in the geometric edges, the cooling rate is higher than in the middle, so the time for graphite nucleation is not enough. As a logical explanation, the average graphite size tends to be greater in the sample centre because of the low cooling rates, which enable graphite nucleation. The greater the graphite nodule size, following a proportional logic, the lower will be the nodule density measured. The curious fact is that this phenomenon does not occur.
The average graphite nodule size was lower in the centre of the sample in comparison with the edges of the samples. It is possible to see that the nodular graphite percentage in the middle was lower than at the edges. The graphite nodules do not meet the circularity factors, which affects the count and the final size of the nodules of the analysis carried out in the centre of the sample. This effect can be explained by the shrinkage allowance, which is the contraction of the final volume after solidification. The analyzed samples were taken from the tops of the bar where this phenomenon is more pronounced, affecting the formation of nodules in the centre of the sample.
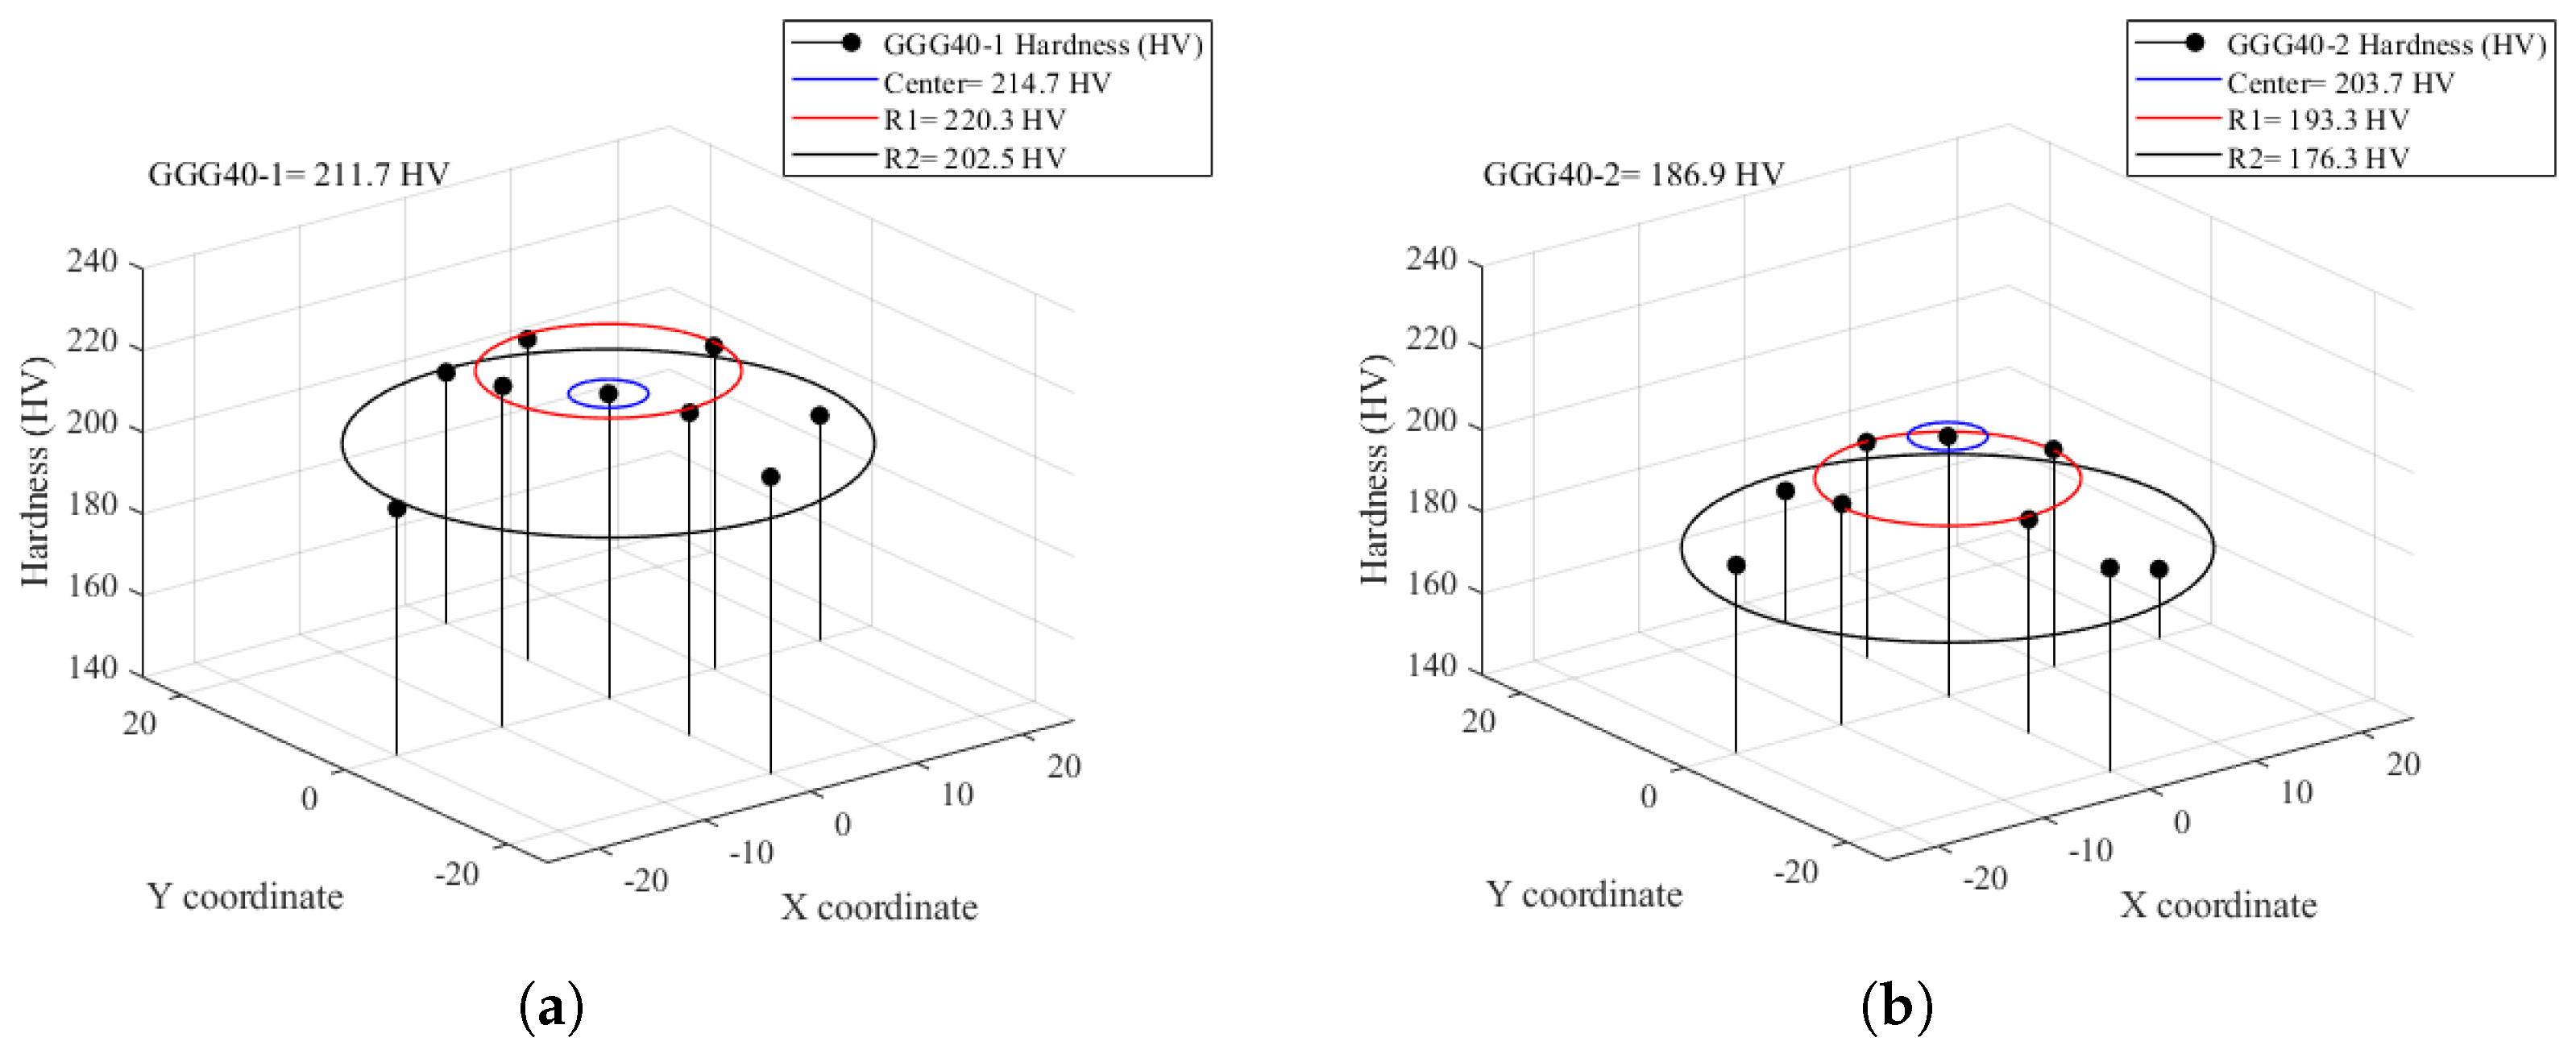
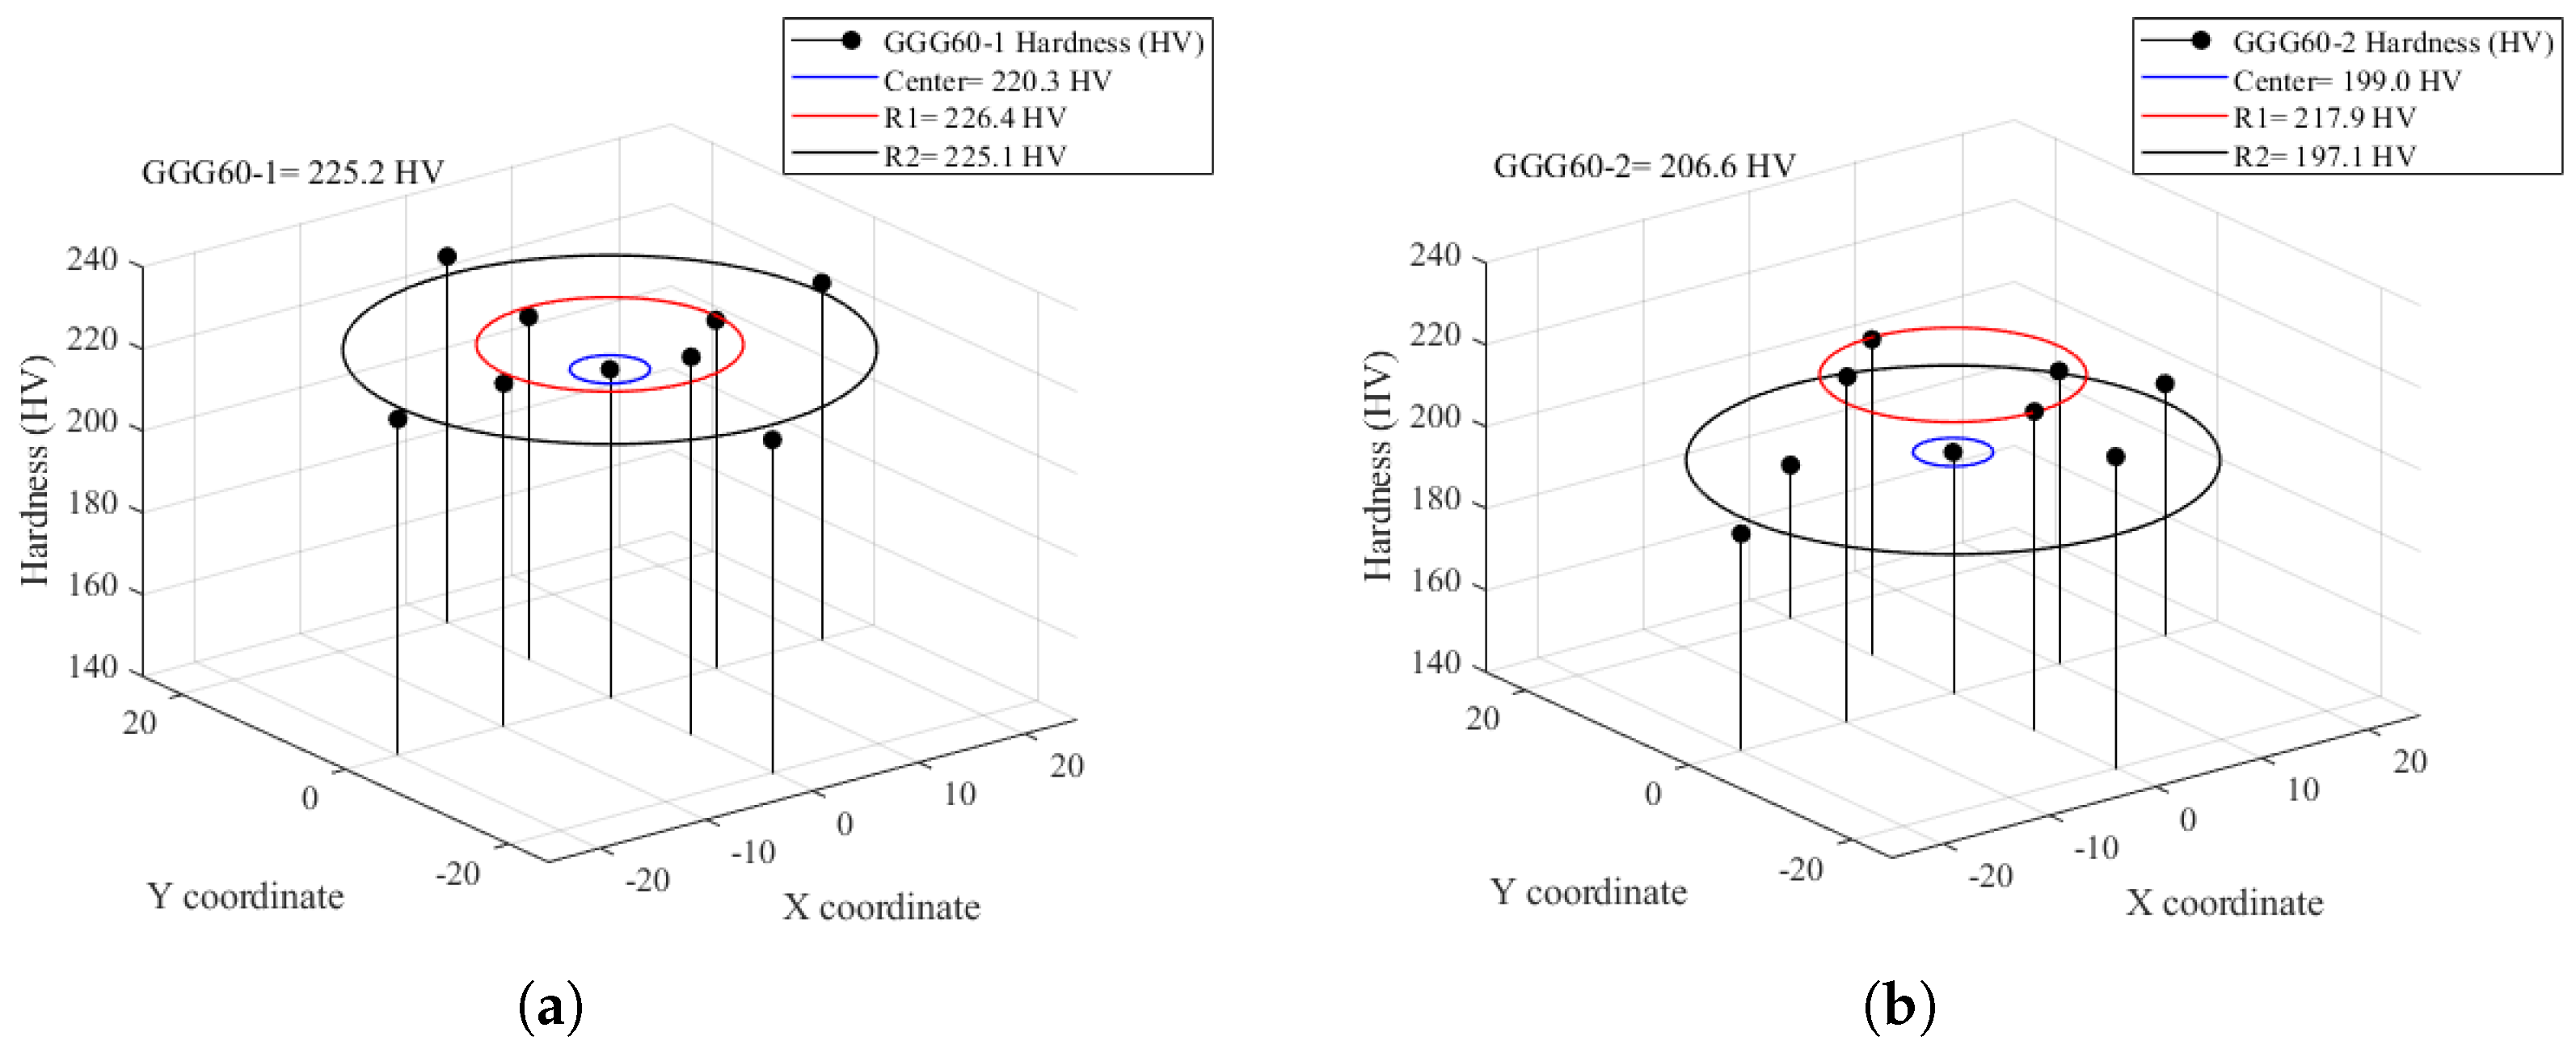
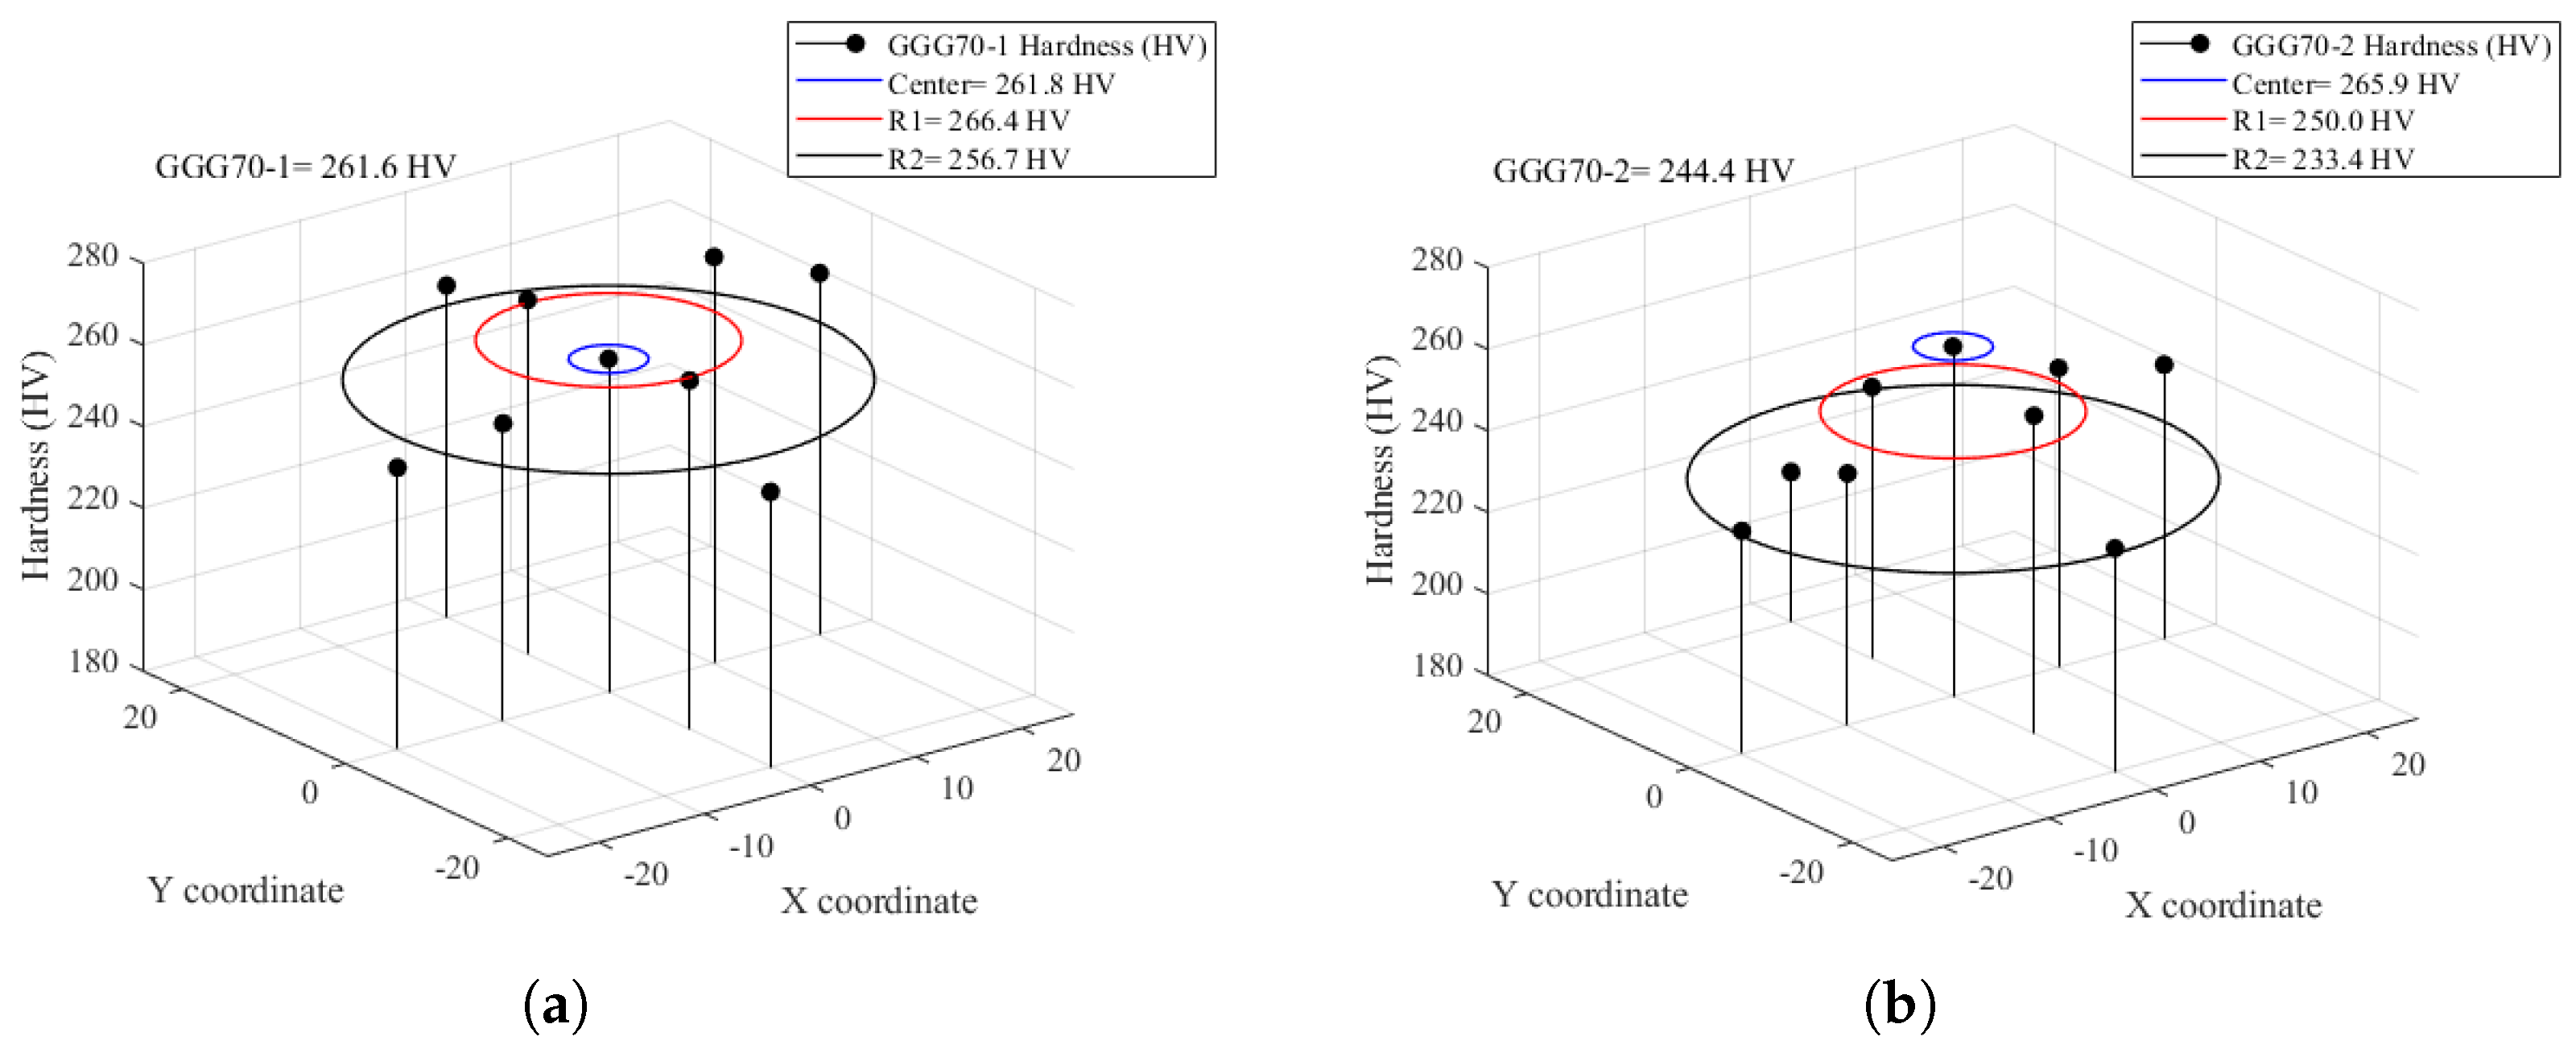
Figure 15,
Figure 16 and
Figure 17 show the hardness test results from the bar samples. The measurements were taken from the center, four points in the inner radius, and four points in the outer radius, as demonstrated in
Figure 2. Five measurements were performed at each point in order to obtain the average of the measurements and the final hardness result value at the given point.
The results show that the samples with −1 index have higher hardness compared with the −2 index samples. This could be explained by the fact that −2 index samples have higher graphite nodules in the samples. The graphite particles are much softer than the ferrite or pearlite matrix, so bigger nodules could affect the material decreasing the hardness.
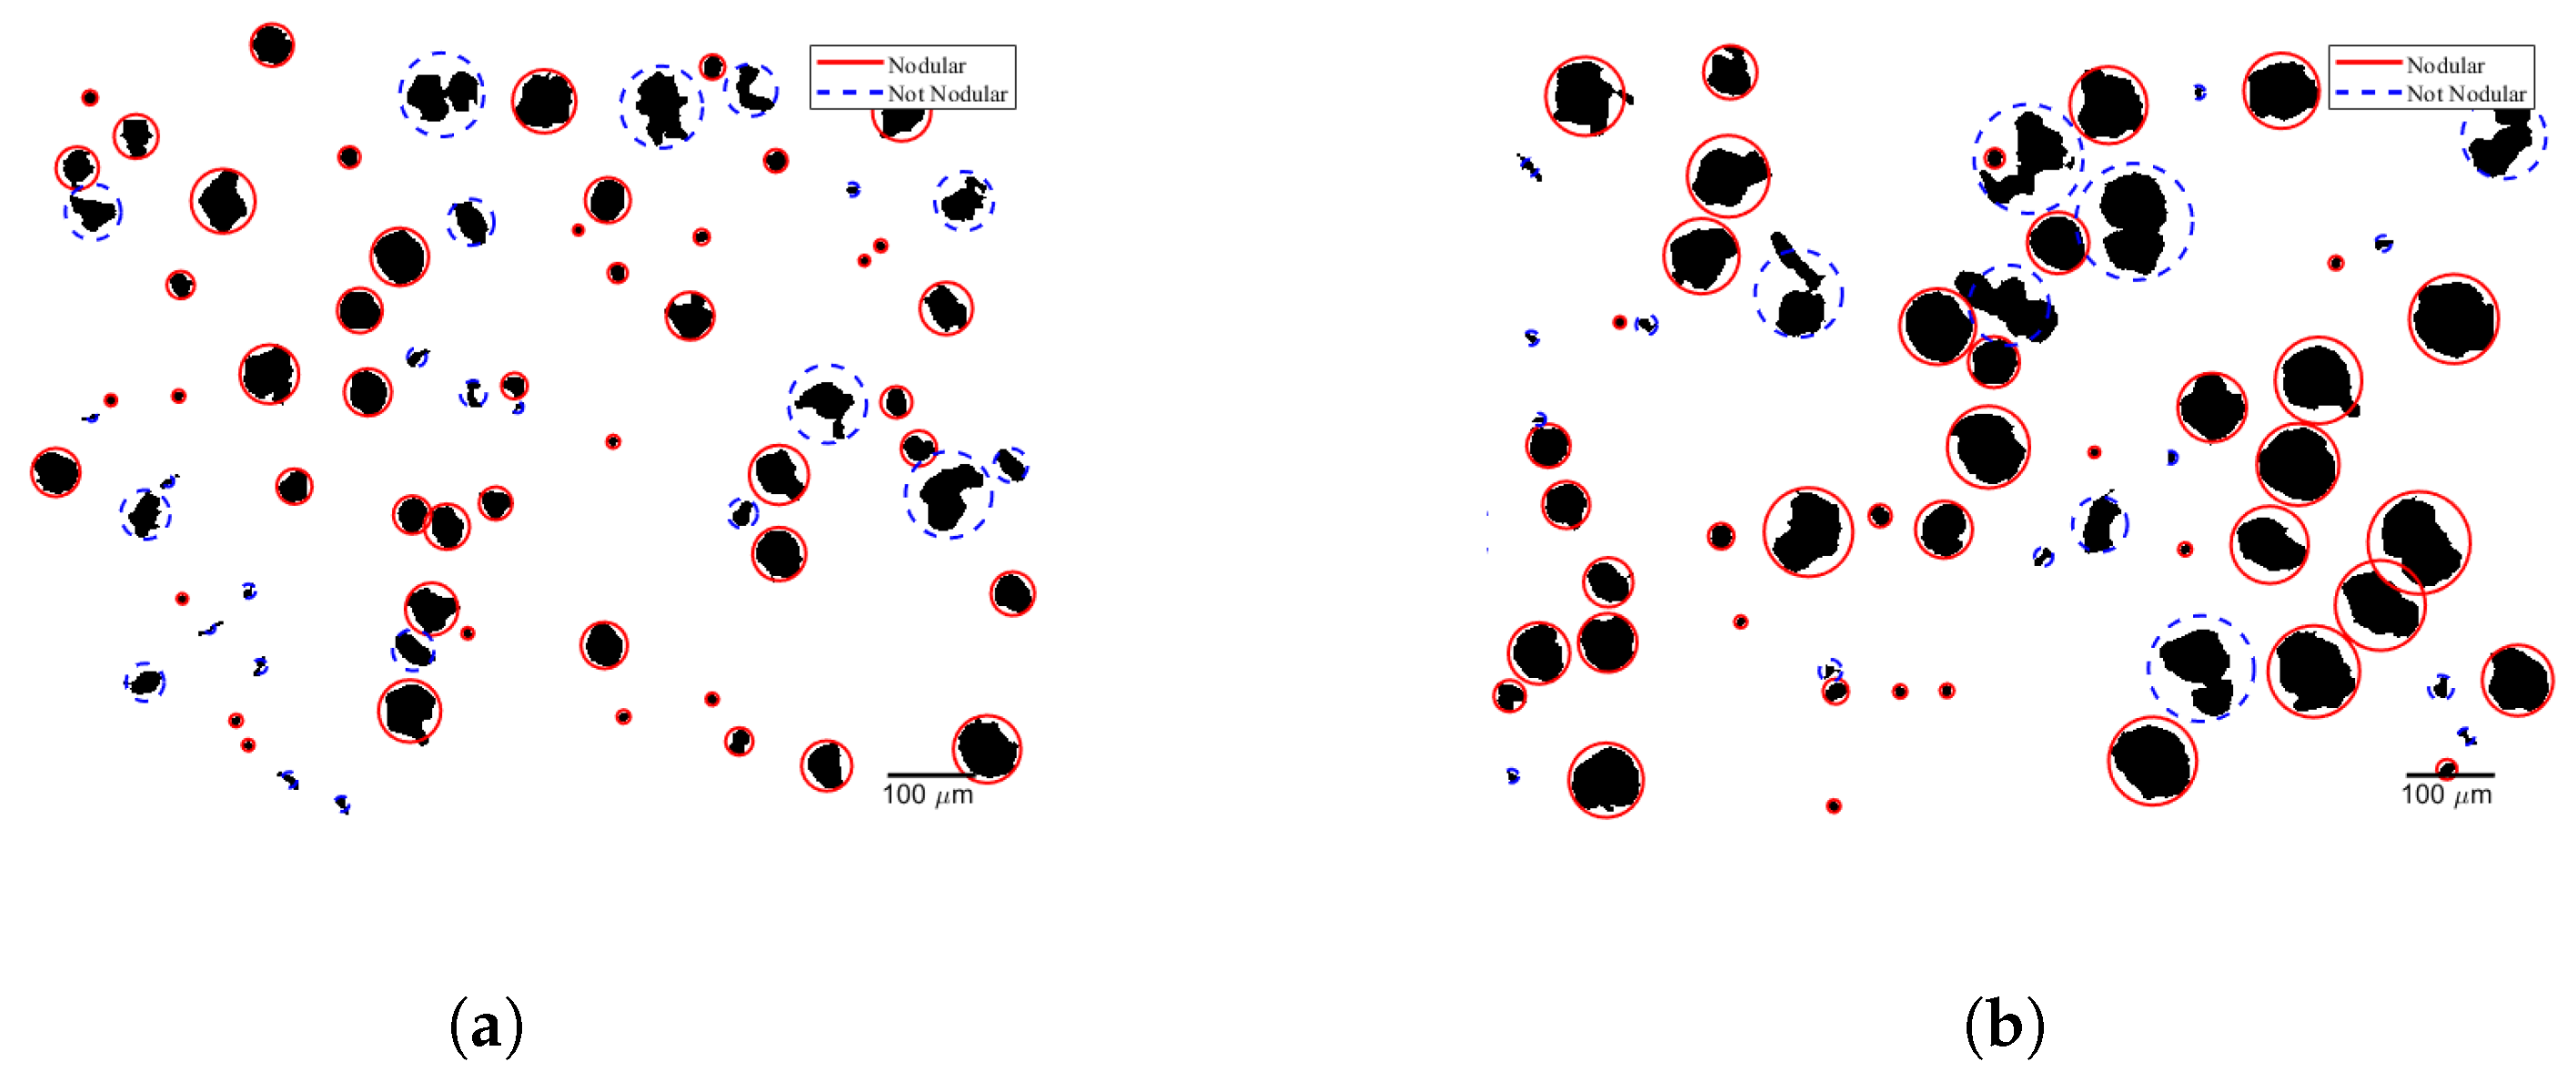
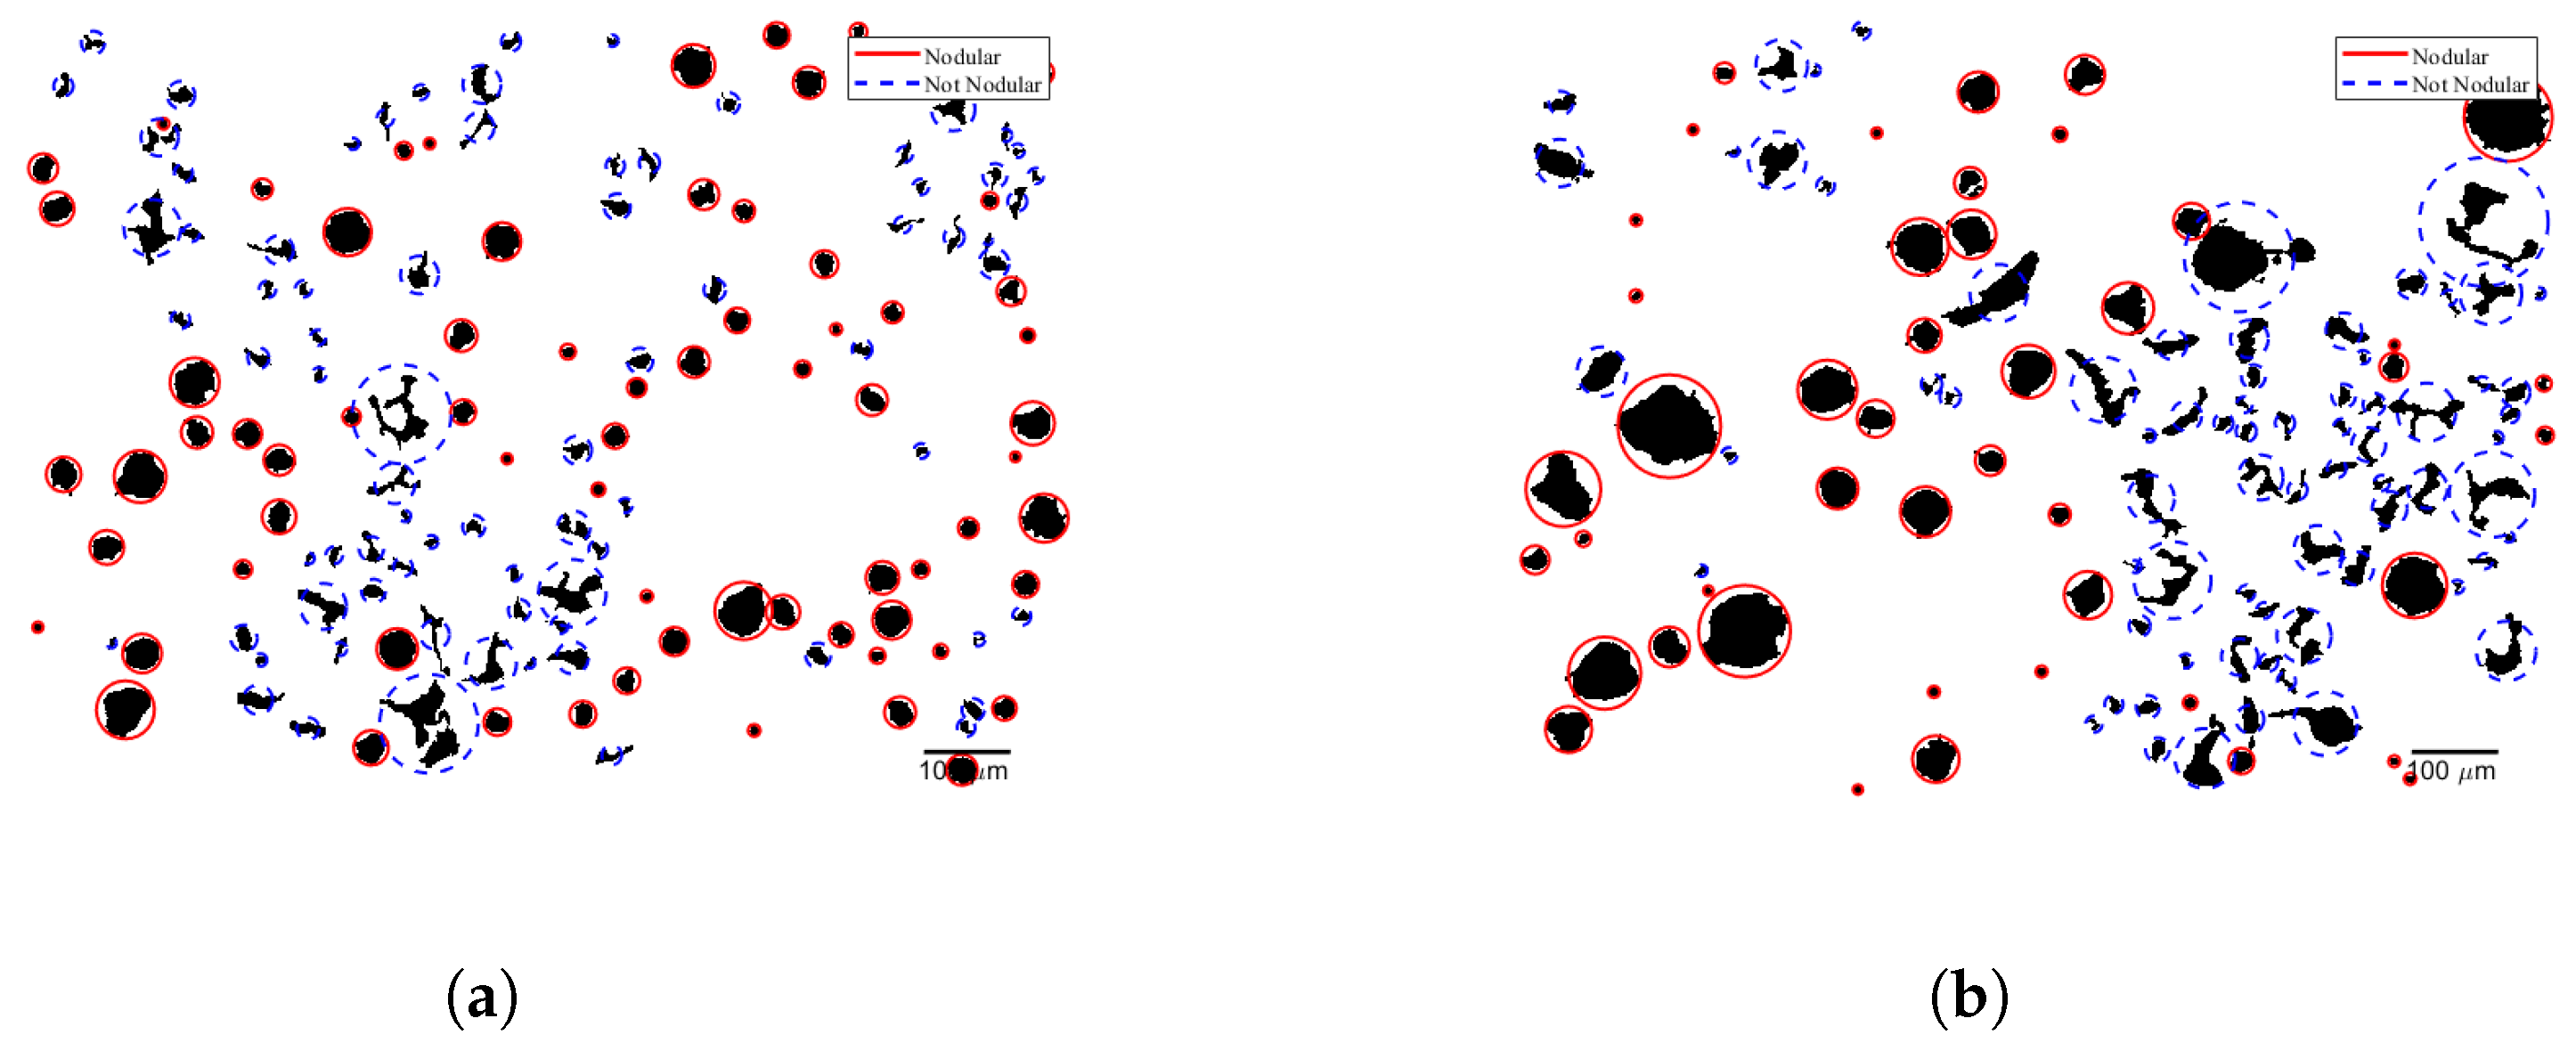
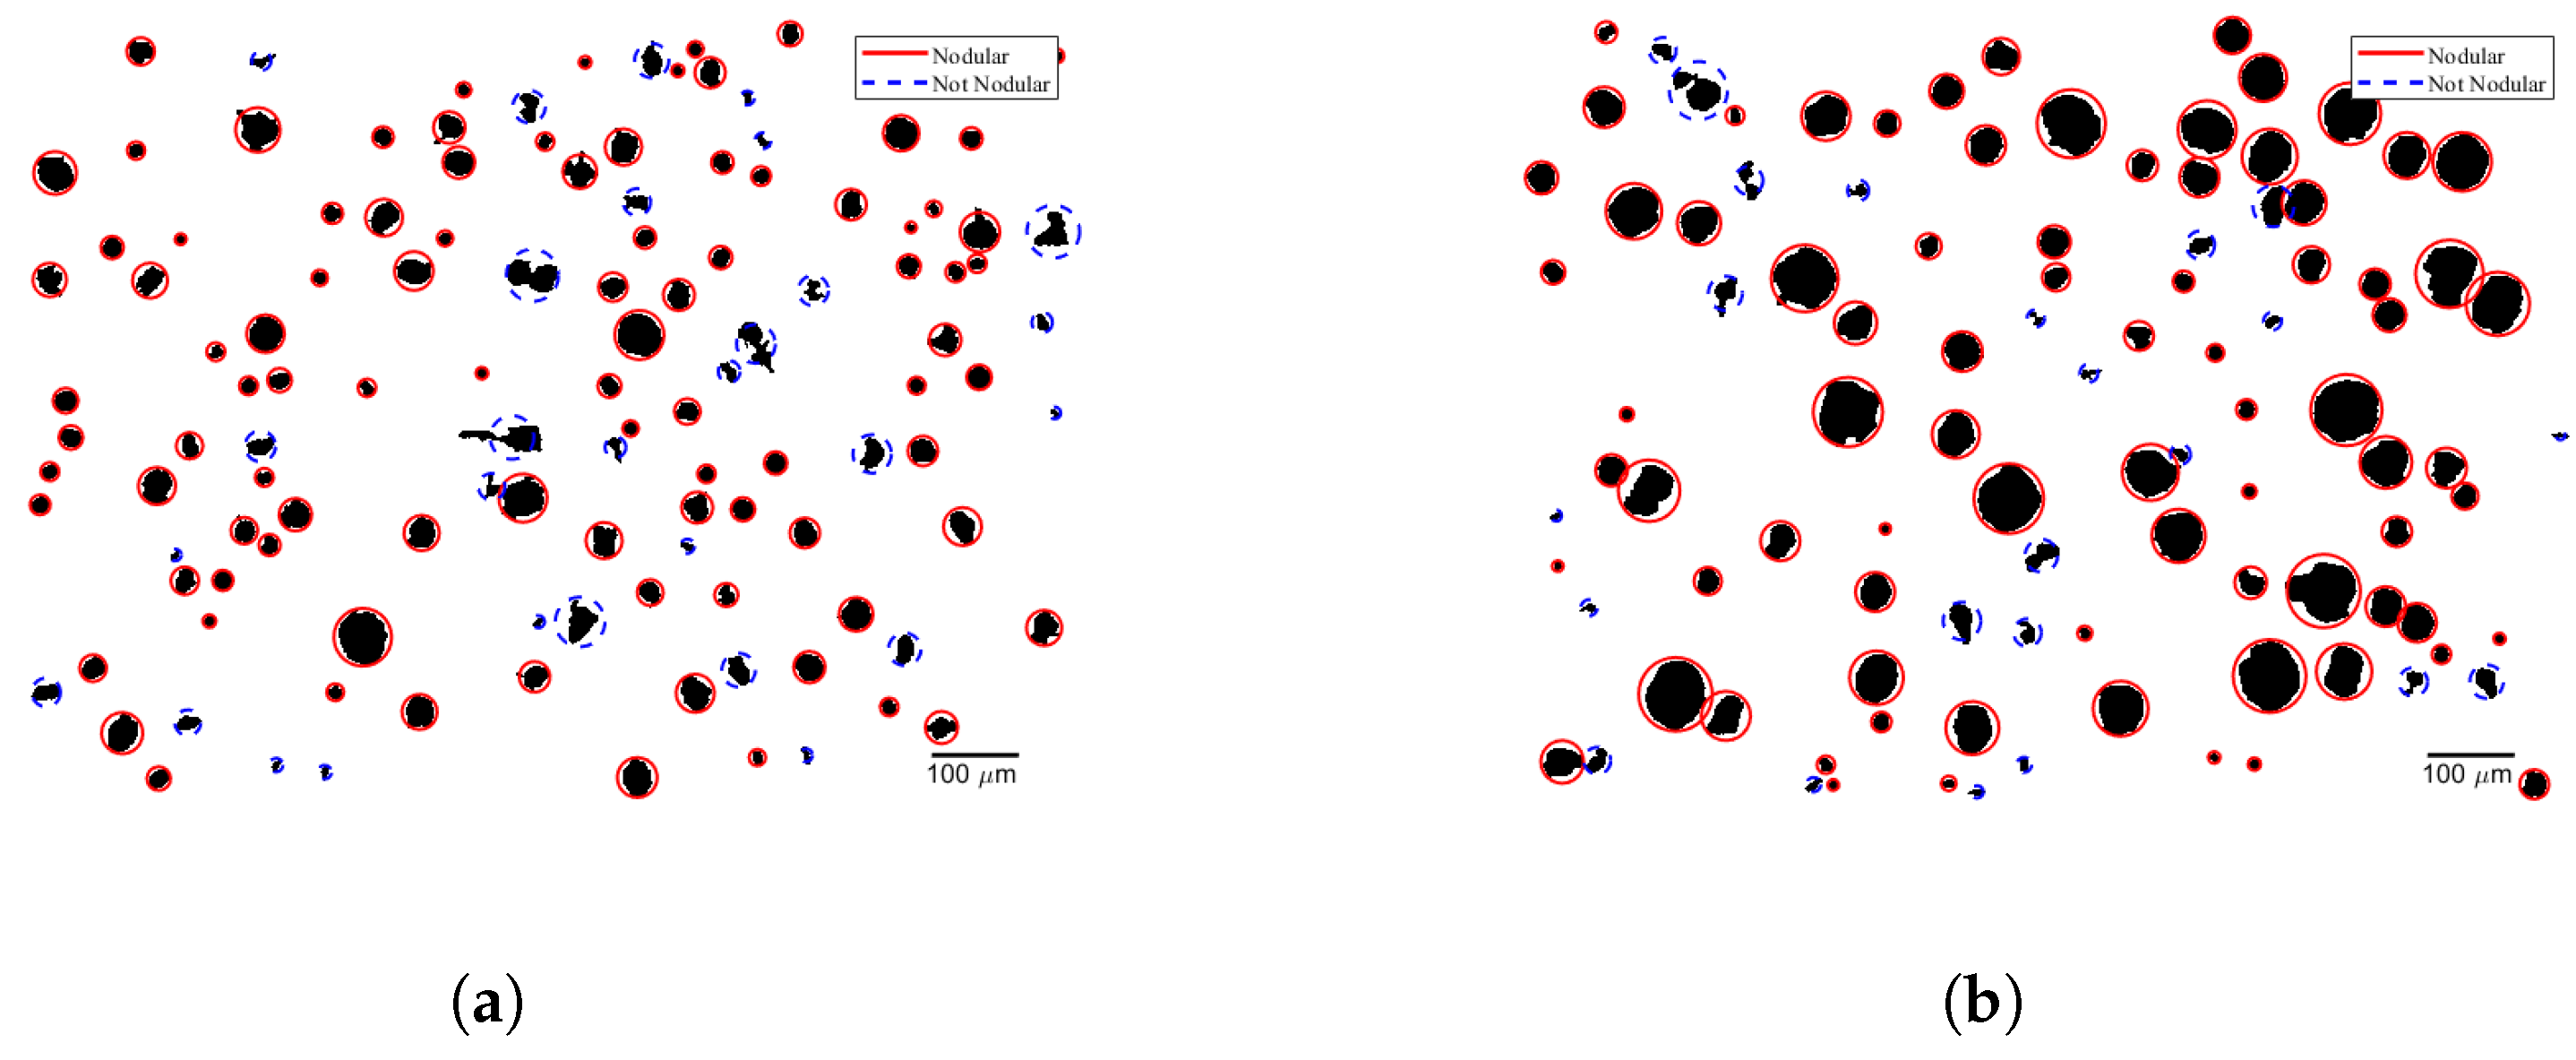
From
Figure 18,
Figure 19 and
Figure 20, it is possible to see the analyzed samples after image segmentation. The routine considered a nodular, graphite particle that fits the parameters established in
Section 2.5.
From computational image identification figures, the difference between the nodule size in −1 and −2 index samples is noticeable. For all materials, the results were repeated, and the index −2 samples have bigger graphite nodules, which affect the mechanical properties. Another fact that could be analyzed from the image identification is the casting quality of GGG60. In comparison to GGG40 and GGG70, GGG60 has a large number of vermicular particles, which indicates a possible problem in the casting procedure.
In GGG40 and GGG70, the nodules have a satisfactory percentage and shape of graphite nodules. The index −2 samples have better roundness with a slight difference in the shape quality. The number can be verified by
Table 4.
Table 4 summarises the graphite characteristics analyzed from round bar specimens.
From
Table 4 it is noticeable that the top samples have higher nodule density, although the percentage of nodular graphite in the bottom samples is higher than in the top samples. In accordance with the nodular graphite percentage, the average area of nodular graphite is higher in the bottom samples too. This behaviour is repeated in other NCI samples. The parameters that indicate nodularity, such as sphericity, compactness, roundness, and eccentricity, are slightly close in their pair samples, but when compared overall, the GGG70 specimens present a better cast quality, as can be visually confirmed in
Figure 20. The GGG60 samples present a high percentile of graphite flakes (
Figure 19), and the data from routine calculations confirm the poor quality through sphericity and eccentricity.
3.3. Metallographic and Computational Image Analysis
The developed routine helped us to analyze and quantify the microstructural characteristics of NCI, obtaining values such as nodule density, average graphite size, and roundness. The routine was also capable to quantify the material phases chemically etched with 2% nital, making it possible to obtain values of ferrite, pearlite, and graphite.
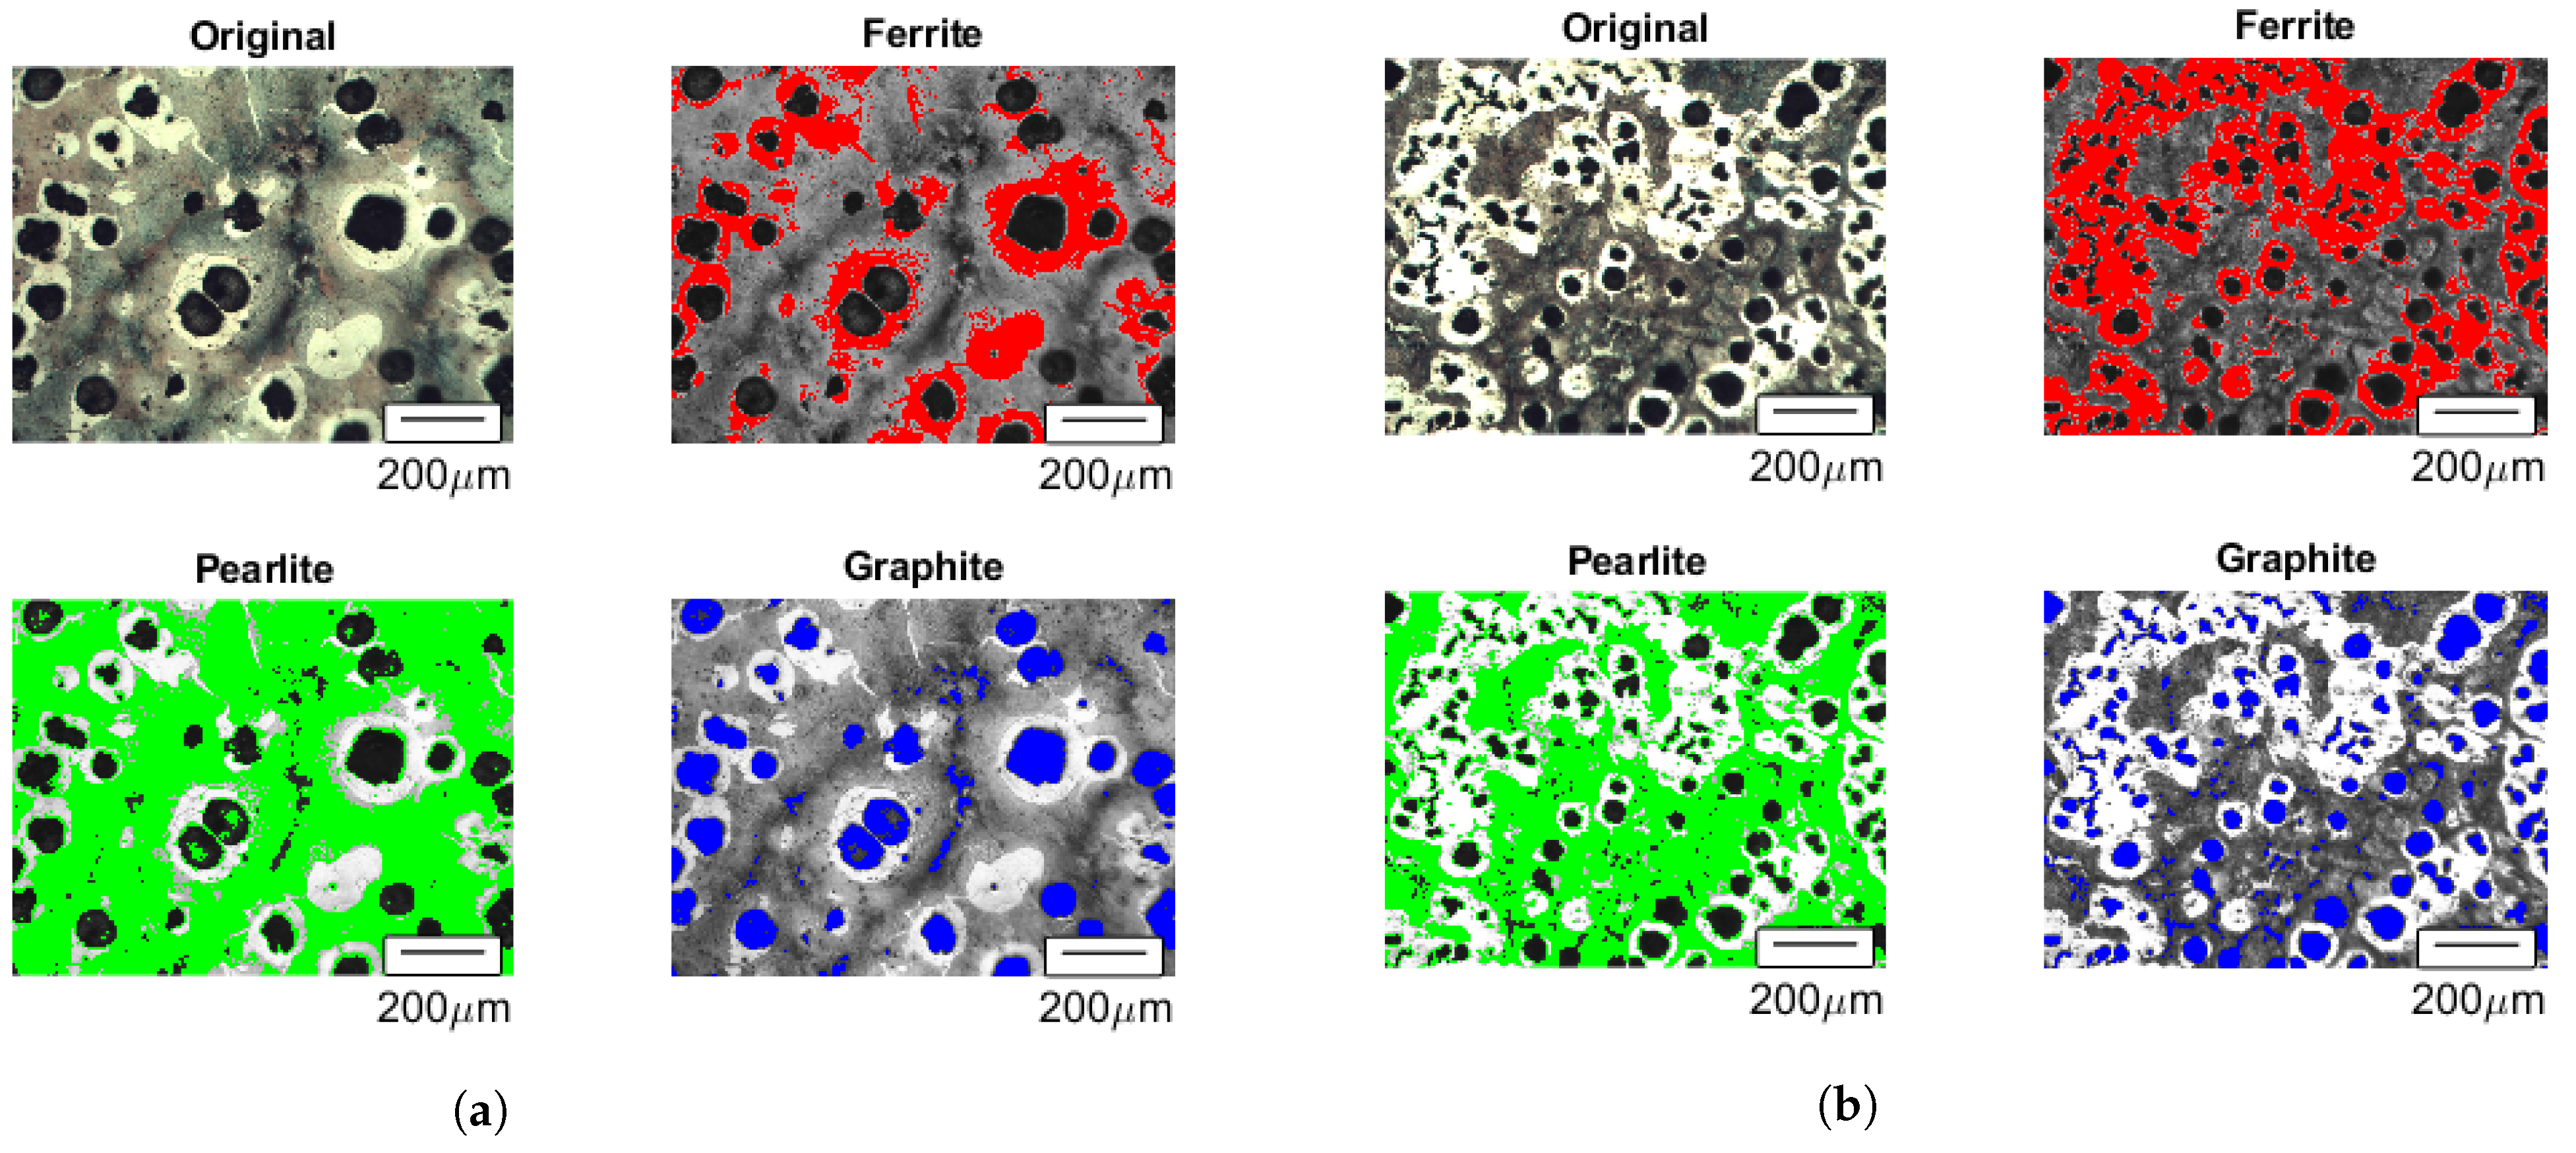
Figure 21,
Figure 22 and
Figure 23 show the computational image analysis of GGG40, 60 and 70 for block specimens and round bar specimens.
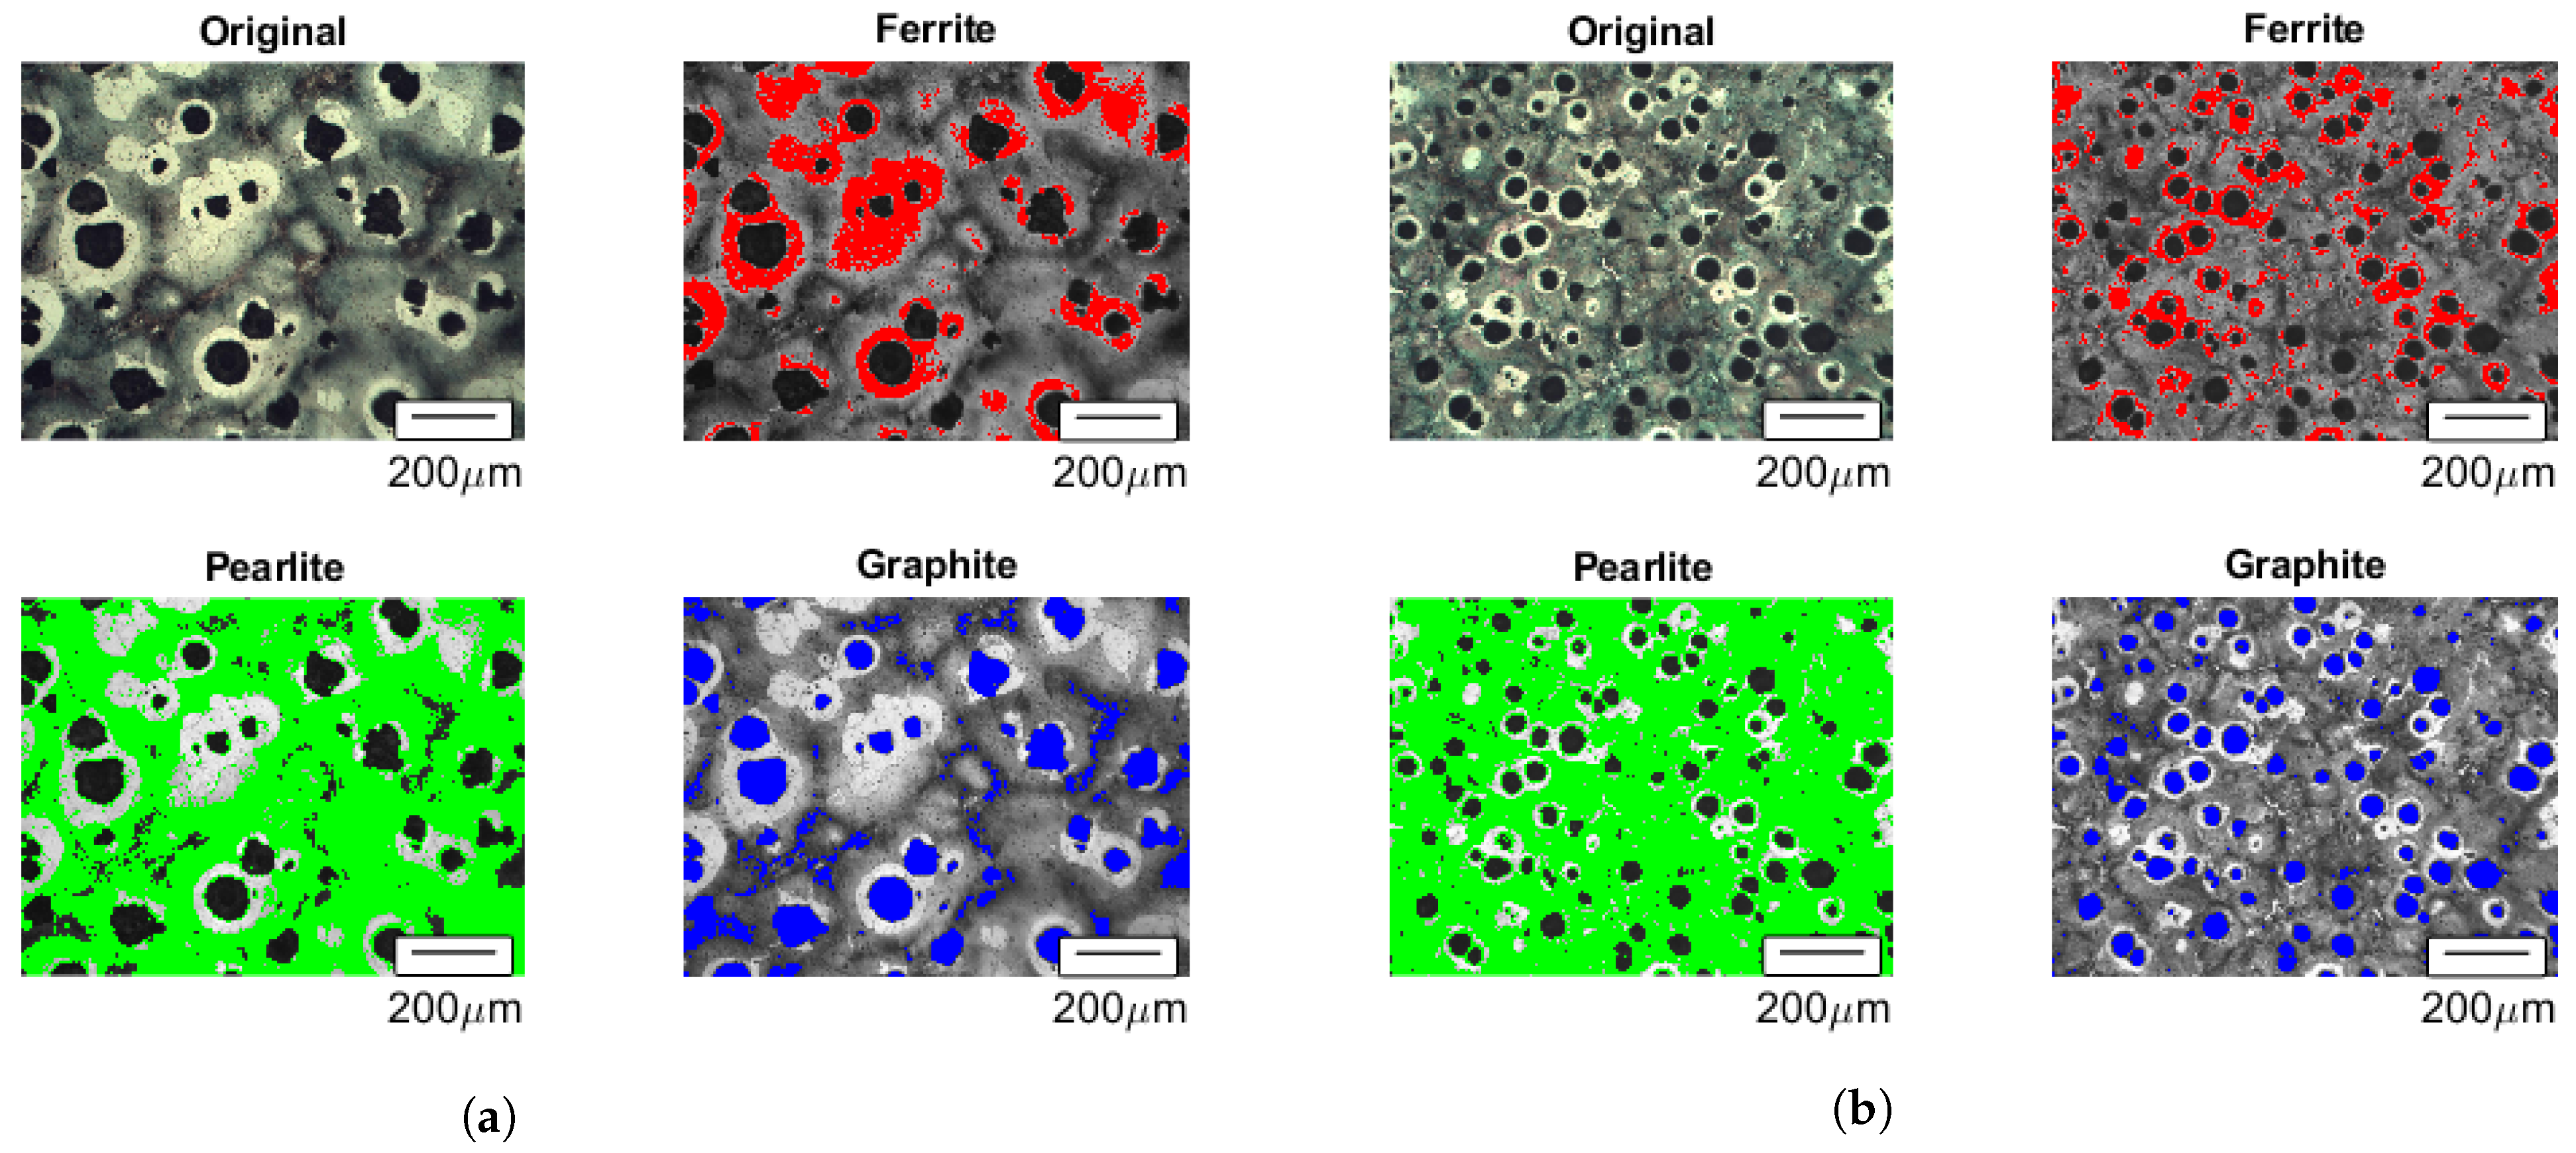
Comparing
Figure 21a,b, the microstructural differences in the samples are remarkable. Even being the same material, casting in different geometries is a significant factor in obtaining the desired microstructure and mechanical properties. The formation of nodules in the cast bar is affected by the cooling rate. The round bar has small graphite nodules but in greater quantity, while the block samples have larger graphite nodules. The amount of the pearlite identified in the circular bar samples was higher than expected. Pearlite values are around 70%.
In the specimens removed from the block, the majority of the graphite particles are considered nodular, which is different from the samples manufactured from round bars that contain a large number of vermicular graphite particles. The round bar microstructure obtained was unforeseen due to the graphite shape and the amount of pearlite in the sample.
In GGG70, the majority of the graphite particles have a nodular shape, and the ferrite content is identified around the graphite particles. The green area presents the pearlitic phase and it is clear that the presence of pearlite is greater in the sample, in agreement with the tested material. The ferrite amount in round bar samples is less than in block specimens. This behavior has been seen in other material samples. Round bar samples have more nodular particles with a large number of nodules.
Through the EDS analysis, one could note that Fe was homogeneously distributed between ferrite and pearlite. In addition, a small amount of Fe was noticeable in the center of the graphite nodules. Carbon was seen to be concentrated almost entirely on the graphite nodules. The presence of C was also perceptible on the ferrite and pearlite, but only in small amounts.
Table 5 and
Table 6 present the results obtained from the developed routine for GGG70 block specimens and round bar specimens, respectively.
According to [
16], roundness, sphericity, and compactness are shape factors that can be used as valid methods for estimating the degree of “roundness” of a graphite particle. These data can provide valid support for a standard classification and routine quality control in ductile iron production. An eccentricity parameter can also aid in the nodule characterization, together with the sphericity shape factor. The eccentricity is a property of the ellipse that best fits the spheroid, as it has values that vary between 0 and 1, describing how far the graphite element shape is from being circular. Eccentricity and sphericity are the parameters most influenced by varying magnification.
The differences between block-shaped and bar-shaped cast iron are notable, as shown in
Table 5 and
Table 6. The microstructure of bar casting classes has more circular graphite patterns than block casts because the nodules are smaller and do not have enough time to nucleate. GGG60 showed different behavior because it contained a large number of vermicular-shaped graphite particles. A major impact factor was also the percentage of pearlite found in bar-casted samples, being much higher than block samples, especially in GGG40.
A coefficient of variation was used to analyze the dispersion of the results with respect to their mean value. The largest variations found in the measurements resulting from the specimens obtained from the block occurred in the following parameters: nodule density per area, average nodule size, and the pearlite and ferrite phases. For all NCI evaluated herein, those dispersions are justifiable due to the specimen position in the casted block. The specimens located on the block edge tend to have a higher cooling rate, which affects the nodule size and promotes pearlite formation.
In the bar specimens, the largest variation occurs in the average nodule size, and also in graphite, ferrite, and pearlite amount. This phenomenon was noted in both cases, when using block samples and also when using bar samples. It is worth mentioning that the transversal section of the bar sample is thinner when compared to the transversal section of the block sample, resulting in a higher cooling rate for the case of the bar sample. This particular characteristic of the bar sample results in the fact that the shape and sizes of the nodules were more similar, regardless of the sample position on the bar. However, the samples located in the middle of the bar showed higher ferrite levels than the ones obtained at the extreme ends of the bar, as well as slightly larger sizes of the graphite nodules in these central samples.
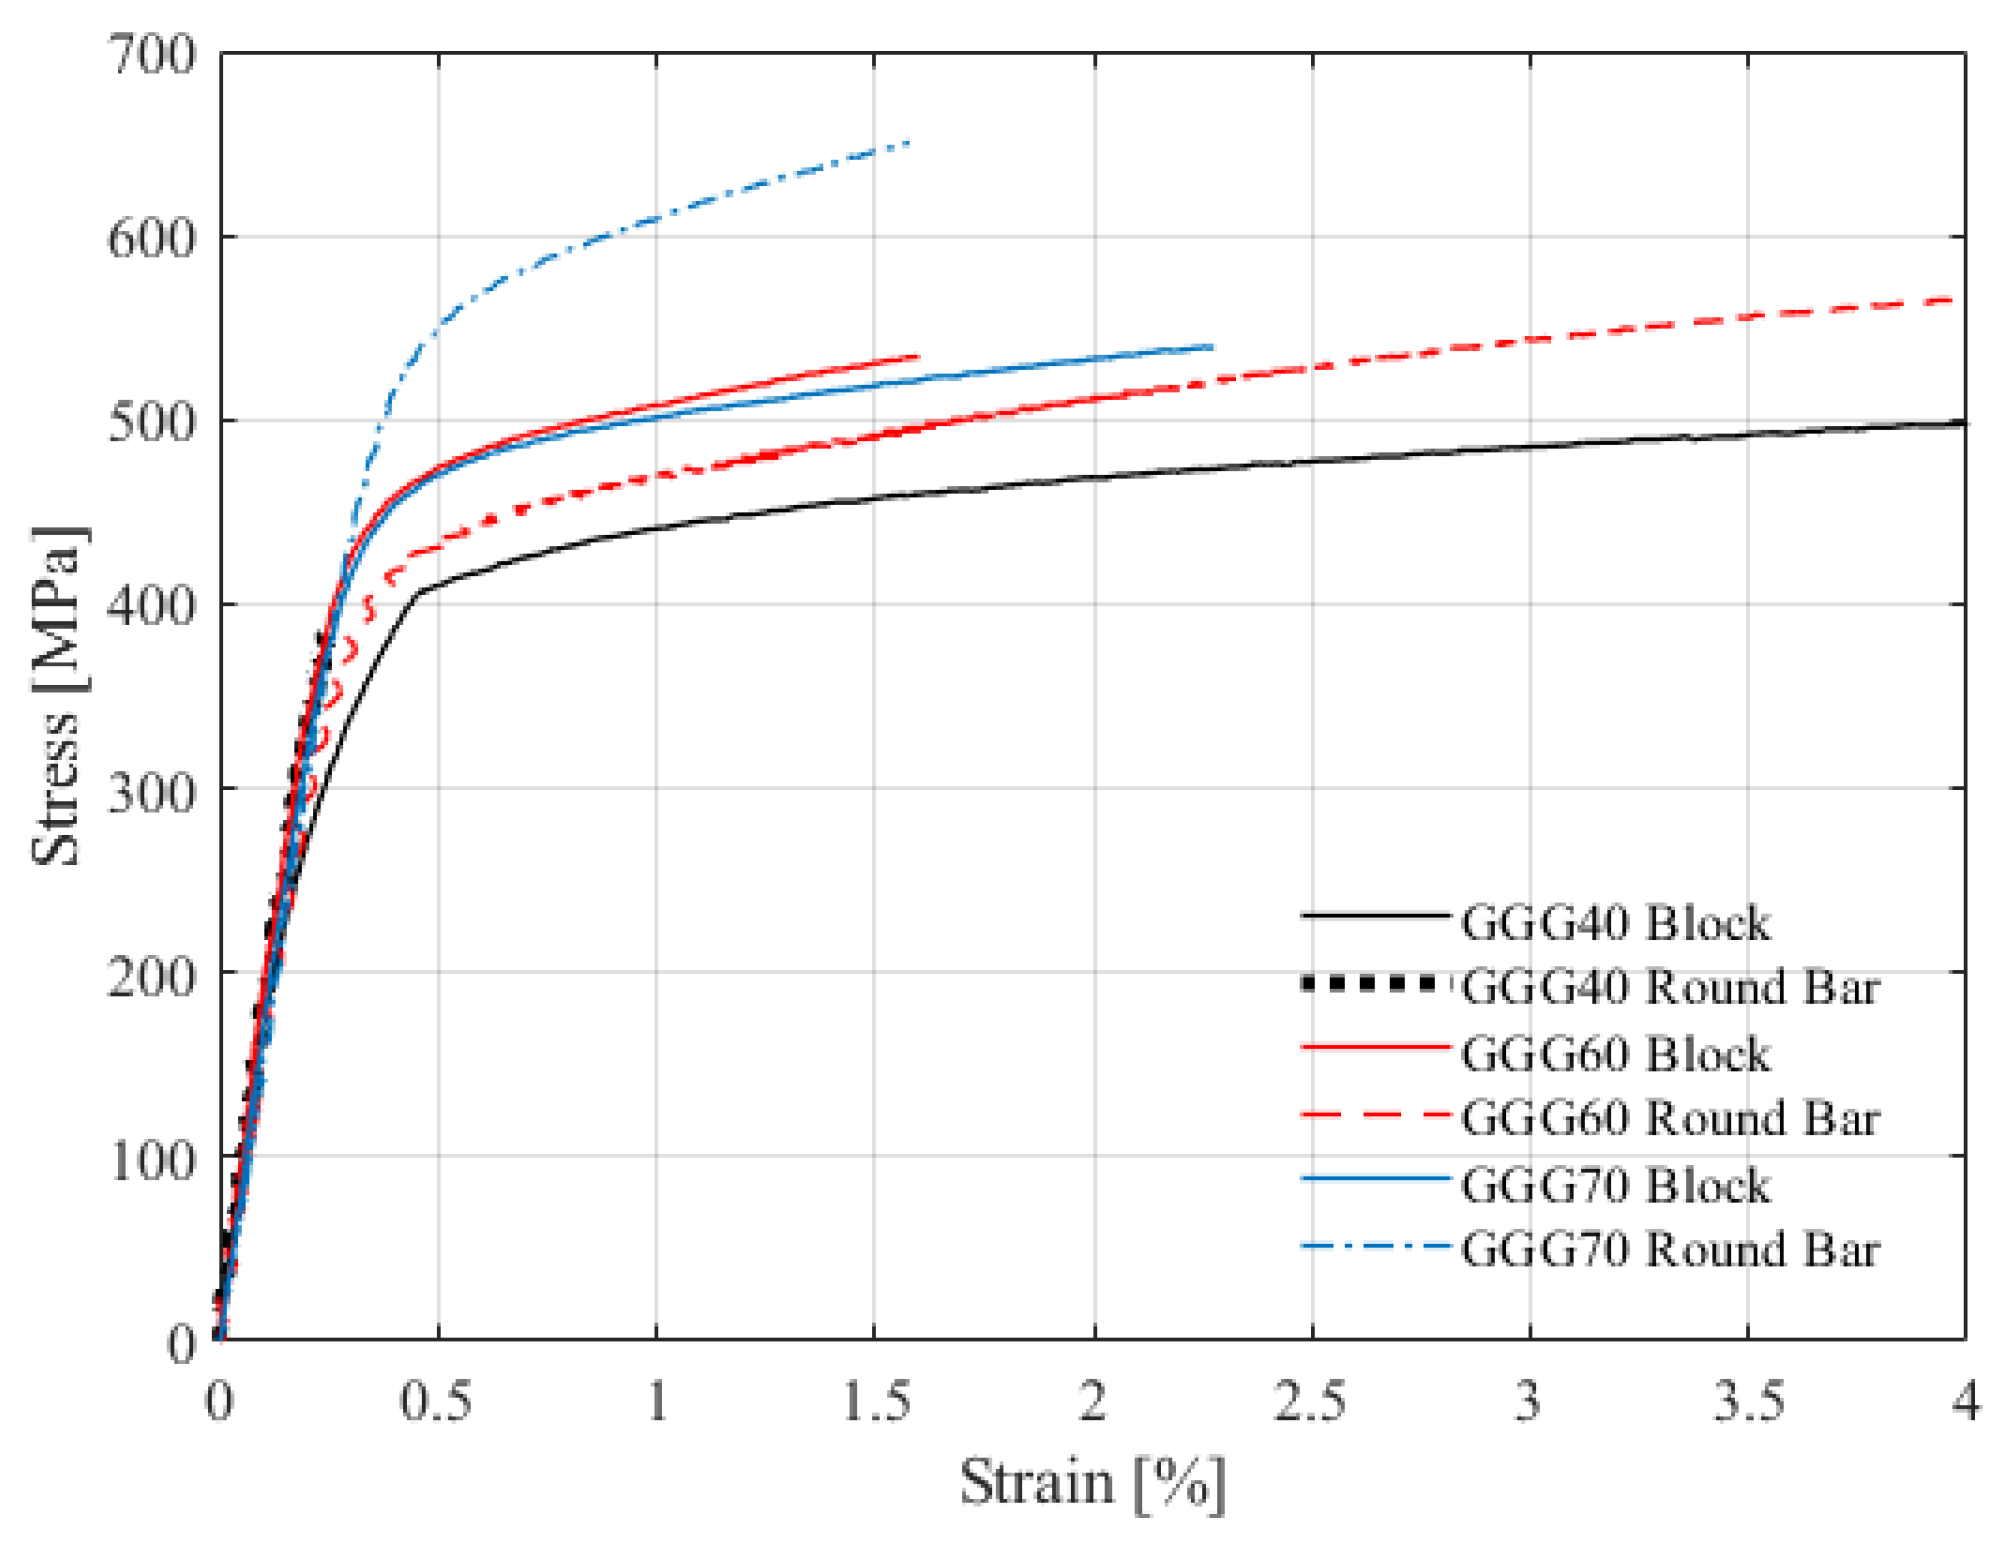
Table 7 presents the tensile test results for specimens manufactured from the block and the bar.
The differences in mechanical properties obtained in GGG40, 60, and 70 are noticeable, due to the final casting geometry. The specimens of the block presented more uniform mechanical properties when compared to the bar samples. The elasticity modulus values obtained for the block casting material showed good agreement with the literature. On the other hand, the bar samples showed increased strength behavior due to the fact that, in most of the samples, the amount of pearlite obtained was higher in the bar samples.
An important difference between the properties obtained in the tests and the standard properties was noticed in this work. The tests performed reinforce the fact that there is a difference in nodular cast iron properties when obtained from small- and medium-sized foundries, with respect to available standard data. This finding shows the importance of the present study with regard to this class of nodular cast iron materials.
Author Contributions
Conceptualization, D.d.O.F. and C.T.M.A.; Funding acquisition, C.T.M.A.; Investigation, D.d.O.F.; Methodology, D.d.O.F.; Project administration, C.T.M.A.; Resources, C.T.M.A. and J.N.V.G.; Software, D.d.O.F.; Supervision, C.T.M.A. and B.B.; Validation, C.T.M.A., J.N.V.G. and B.B.; Writing—original draft, D.d.O.F.; Writing—review and editing, D.d.O.F., C.T.M.A., J.N.V.G. and B.B. All authors have read and agreed to the published version of the manuscript.
Funding
This research was funded by National Council for Scientific and Technological Development (CNPQ) grant (n° 314602/2021-6).
Institutional Review Board Statement
Not applicable.
Informed Consent Statement
Not applicable.
Data Availability Statement
The datasets generated during and/or analysed during the current study are available from the corresponding author on reasonable request.
Acknowledgments
This study was financed in part by the Coordination for the Improvement of Higher Education Personnel—Brazil (CAPES), Brazilian Council for Scientific and Technological Development (CNPq) and Research Support Foundation of Federal District (FAPDF). The authors are grateful to Group of Experimental and Computational Mechanics (UnB/FGA/GMEC) for providing computational resources and making this work possible. The second author thanks the National Council for Scientific and Technological Development (CNPq).
Conflicts of Interest
The authors declare no conflict of interest.
References
- Karaca, B.; Şimşir, M. The effects of heat treatment on the tensile properties of camshaft made of GGG70 series spherical graphite cast iron. Acta Phys. Pol. A 2019, 135, 811–818. [Google Scholar] [CrossRef]
- Karaman, S.; Çetinarslan, C.S. Manufacturing Process of GGG40 Nodular Cast Iron. Unitech 10 2010, 27, 117–122. [Google Scholar]
- Al-Ghonamy, A.I.; Ramadan, M.; Fathy, N.; Hafez, K.M.; El-Wakil, A.A. Effect of Graphite Nodularity on Mechanical Properties of Ductile Iron for Waterworks Fittings and Accessories. Int. J. Civ. Environ. Eng. 2008, 10, 1–5. [Google Scholar]
- Kohout, J. A simple relation for deviation of grey and nodular cast irons from Hooke’s law. Mater. Sci. Eng. A 2001, 313, 16–23. [Google Scholar] [CrossRef]
- Vaško, A.; Belan, J.; Tillová, E. Static and dynamic mechanical properties of nodular cast irons. Arch. Metall. Mater. 2019, 64, 185–190. [Google Scholar] [CrossRef]
- De Santis, A.; Di Bartolomeo, O.; Iacoviello, D.; Iacoviello, F. Quantitative shape evaluation of graphite particles in ductile iron. J. Mater. Process. Technol. 2008, 196, 292–302. [Google Scholar] [CrossRef]
- Górny, M.; Kawalec, M.; Gracz, B.; Tupaj, M. Influence of Cooling Rate on Microstructure Formation of Si–Mo Ductile Iron Castings. Metals 2021, 11, 1634. [Google Scholar] [CrossRef]
- Chiaverini, V. Aços e Ferros Fundidos, 7th ed.; Abm: São Paulo, Brazil, 2008. [Google Scholar]
- Meena, A.; El Mansori, M. Drilling performance of green austempered ductile iron (ADI) grade produced by novel manufacturing technology. Int. J. Adv. Manuf. Technol. 2012, 59, 9–19. [Google Scholar] [CrossRef]
- Guesser, W.L. Mechanical Properties of the Cast Iron, 2nd ed.; Blucher: São Paulo, Brazil, 2019; Volume 335. [Google Scholar]
- Goodrich, G. Metallurgy of cast irons. In Iron Castings Engineering Handbook, American Foundry Society (AFS), Prited in the United States of America; AFS: Des Plaines, IL, USA, 2003; pp. 47–61. [Google Scholar]
- Çetinarslan, C.S.; Karaman Genç, S. Study in the variation of mechanical properties of nodular cast iron depending upon section thickness. Mater. Und Werkst. 2014, 45, 106–113. [Google Scholar] [CrossRef]
- Ren, J.; Ren, F.; Li, F.; Cui, L.; Xiong, Y.; Volinsky, A.A. Effects of Microstructure, Mechanical and Physical Properties on Machinability of Graphite Cast Irons. Metals 2020, 10, 285. [Google Scholar] [CrossRef] [Green Version]
- Šamec, B.; Potrč, I.; Šraml, M. Low cycle fatigue of nodular cast iron used for railway brake discs. Eng. Fail. Anal. 2011, 18, 1424–1434. [Google Scholar] [CrossRef]
- Betancur, A.; Anflor, C.; Pereira, A.; Leiderman, R. Determination of the effective elastic modulus for nodular cast iron using the boundary element method. Metals 2018, 8, 641. [Google Scholar] [CrossRef] [Green Version]
- Grenier, S.; Labrecque, C.; Bhattacharjee, A.; Gundlach, R.; Kroka, B.; Riabov, M. Inter-laboratory study of nodularity and nodule count of ductile iron by image analysis. Int. J. Met. 2014, 8, 51–63. [Google Scholar] [CrossRef]
- Greggio, N.; Bernardino, A.; Santos-Victor, J. Image segmentation for robots: Fast self-adapting Gaussian mixture model. In Lecture Notes in Computer Science (Including Subseries Lecture Notes in Artificial Intelligence and Lecture Notes in Bioinformatics); Springer: Berlin/Heidelberg, Germany, 2010; Volume 6111 LNCS, pp. 105–116. [Google Scholar] [CrossRef]
- Audebert, N.; Le Saux, B.; Lefèvre, S. Segment-before-detect: Vehicle detection and classification through semantic segmentation of aerial images. Remote Sens. 2017, 9, 368. [Google Scholar] [CrossRef] [Green Version]
- Sund, T.; Eilertsen, K. An algorithm for fast adaptive image binarization with applications in radiotherapy imaging. IEEE Trans. Med. Imaging 2003, 22, 22–28. [Google Scholar] [CrossRef]
- Filho, P.P.; da Silva Barros, A.C.; Almeida, J.S.; Rodrigues, J.P.; de Albuquerque, V.H.C. A new effective and powerful medical image segmentation algorithm based on optimum path snakes. Appl. Soft Comput. J. 2019, 76, 649–670. [Google Scholar] [CrossRef]
- Bulgarevich, D.S.; Tsukamoto, S.; Kasuya, T.; Demura, M.; Watanabe, M. Pattern recognition with machine learning on optical microscopy images of typical metallurgical microstructures. Sci. Rep. 2018, 8, 2078. [Google Scholar] [CrossRef]
- de Albuquerque, V.H.C.; de Alexandria, A.R.; Cortez, P.C.; Tavares, J.M.R. Evaluation of multilayer perceptron and self-organizing map neural network topologies applied on microstructure segmentation from metallographic images. NDT E Int. 2009, 42, 644–651. [Google Scholar] [CrossRef]
- Sparavigna, A. An image segmentation for the measurement of microstructures in ductile cast iron. Philica 2017, 2017, hal-01635665. [Google Scholar]
- De Santis, A.; Iacoviello, D.; Di Cocco, V.; Iacoviello, F. Classification of ductile cast iron specimens: A machine learning approach. Frat. Integrita Strutt. 2017, 11, 231–238. [Google Scholar] [CrossRef]
- ASTM E1508; Standard Guide for Quantitative Analysis by Energy-Dispersive Spectroscopy. ASTM International: West Conshohocken, PA, USA, 2003; Volume 98, pp. 1–8. [CrossRef]
- ASTM E766; Standard Practice for Calibrating the Magnification of a Scanning Electron Microscope. ASTM International: West Conshohocken, PA, USA, 1995; Volume i, pp. 1–6. [CrossRef]
- Vokál, V.; Nilsson, K.F.; Minnebo, P. Characterization of defects and graphite types in ductile cast iron by image processing and its relation to mechanical properties. Kov. Mater. 2008, 46, 39–49. [Google Scholar]
- ASTM E8; ASTM E8/E8M Standard Test Methods for Tension Testing of Metallic Materials 1; Annual Book of ASTM Standards 4. ASTM International: West Conshohocken, PA, USA, 2010; pp. 1–27. [CrossRef]
- ASTM E92; Standard Test Methods for Vickers Hardness and Knoop Hardness of Metallic Materials BT—Standard Test Methods for Vickers Hardness and Knoop Hardness of Metallic Materials. ASTM International: West Conshohocken, PA, USA, 2017; Volume i, pp. 1–27. [CrossRef]
- ASTM E394; Standard Test Method for Microindentation Hardness of Materials; Annual Book of ASTM Standard. ASTM International: West Conshohocken, PA, USA, 2017; Volume 14, pp. 1–24. [CrossRef]
- ASTM E606; Strain-Controlled Fatigue Testing 1; ASTM Standards, E606. ASTM International: West Conshohocken, PA, USA, 2013; Volume 92, pp. 1–16. [CrossRef]
- ASTM E3 A.S; Standard Guide for Preparation of Metallographic Specimens Standard Guide for Preparation of Metallographic Specimens. ASTM International: West Conshohocken, PA, USA, 2012; Volume 03.01, pp. 1–12. [CrossRef]
- ASTM E2567; ASTM E2567—Standard Test Method for Determining Nodularity and Nodule Count In Ductile Iron. ASTM International: West Conshohocken, PA, USA, 2015; Volume i, pp. 4–7.
- ASTM A247; ASTM A247—17 Standard Test Method for Evaluating the Microstructure of Graphite in Iron Castings. ASTM International: West Conshohocken, PA, USA, 2020; pp. 1–13. [CrossRef]
- Fernandes, D.O. Nodule Counter. MATLAB Central File Exchange. 2022. Available online: https://www.mathworks.com/matlabcentral/fileexchange/107654-nodule-counter (accessed on 10 March 2022).
- Fernandes, D.O. NCI Phase Counter. MATLAB Central File Exchange. 2022. Available online: https://www.mathworks.com/matlabcentral/fileexchange/107659-nci-phase-counter (accessed on 10 March 2022).
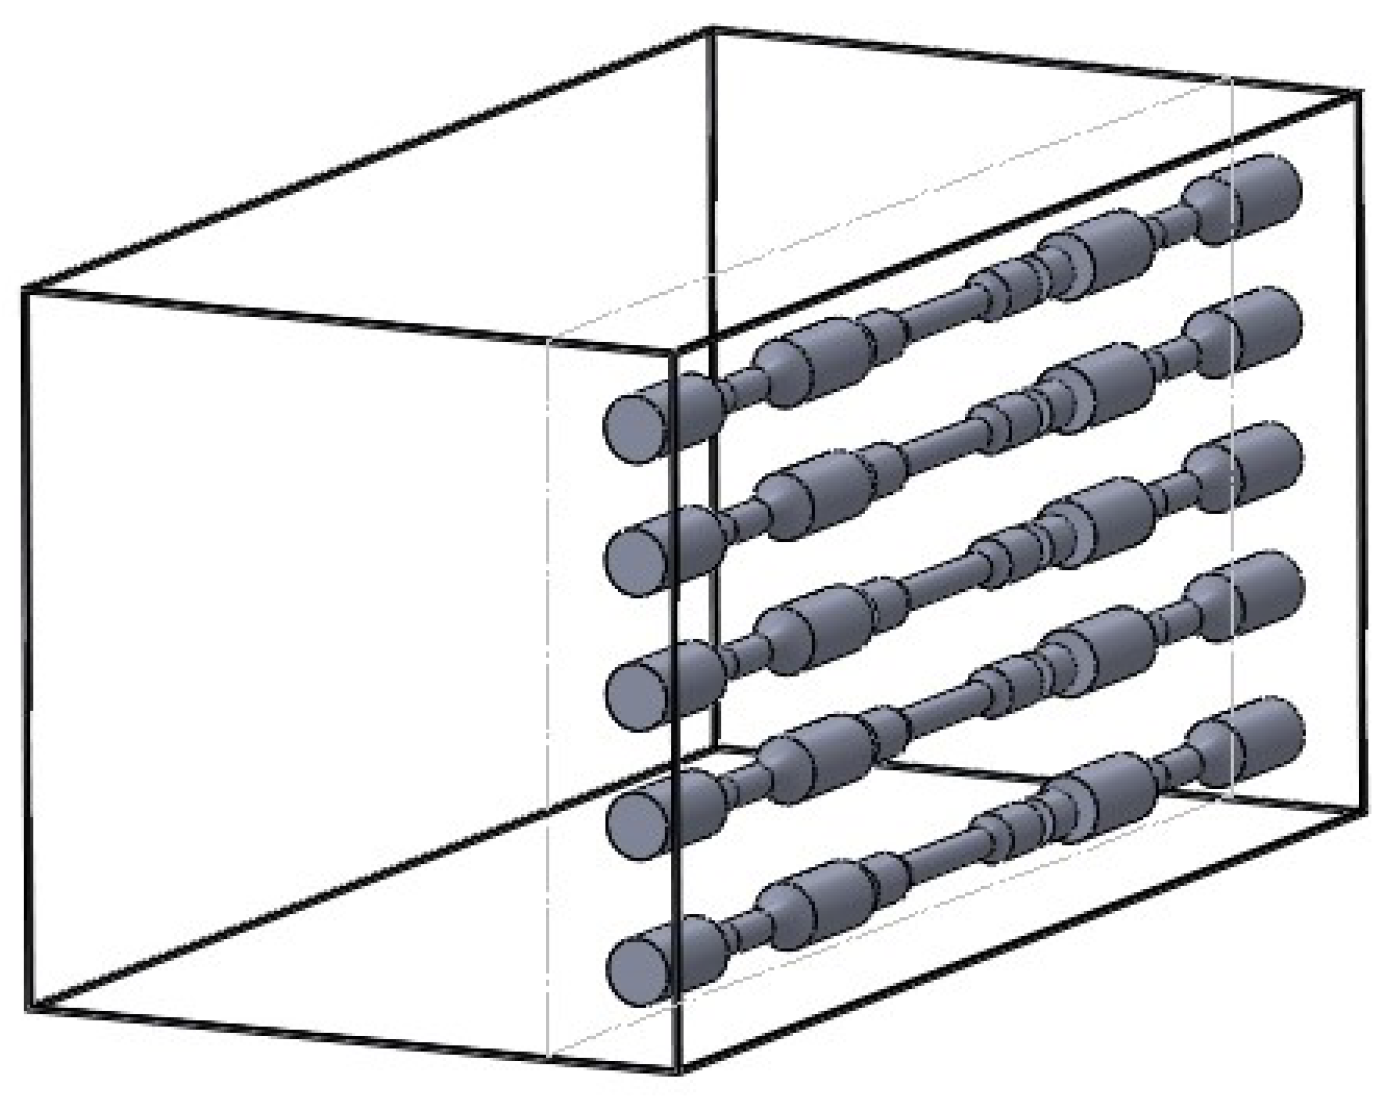
Figure 1.
Isometric view of the arrangement of the specimens in the solid material block.
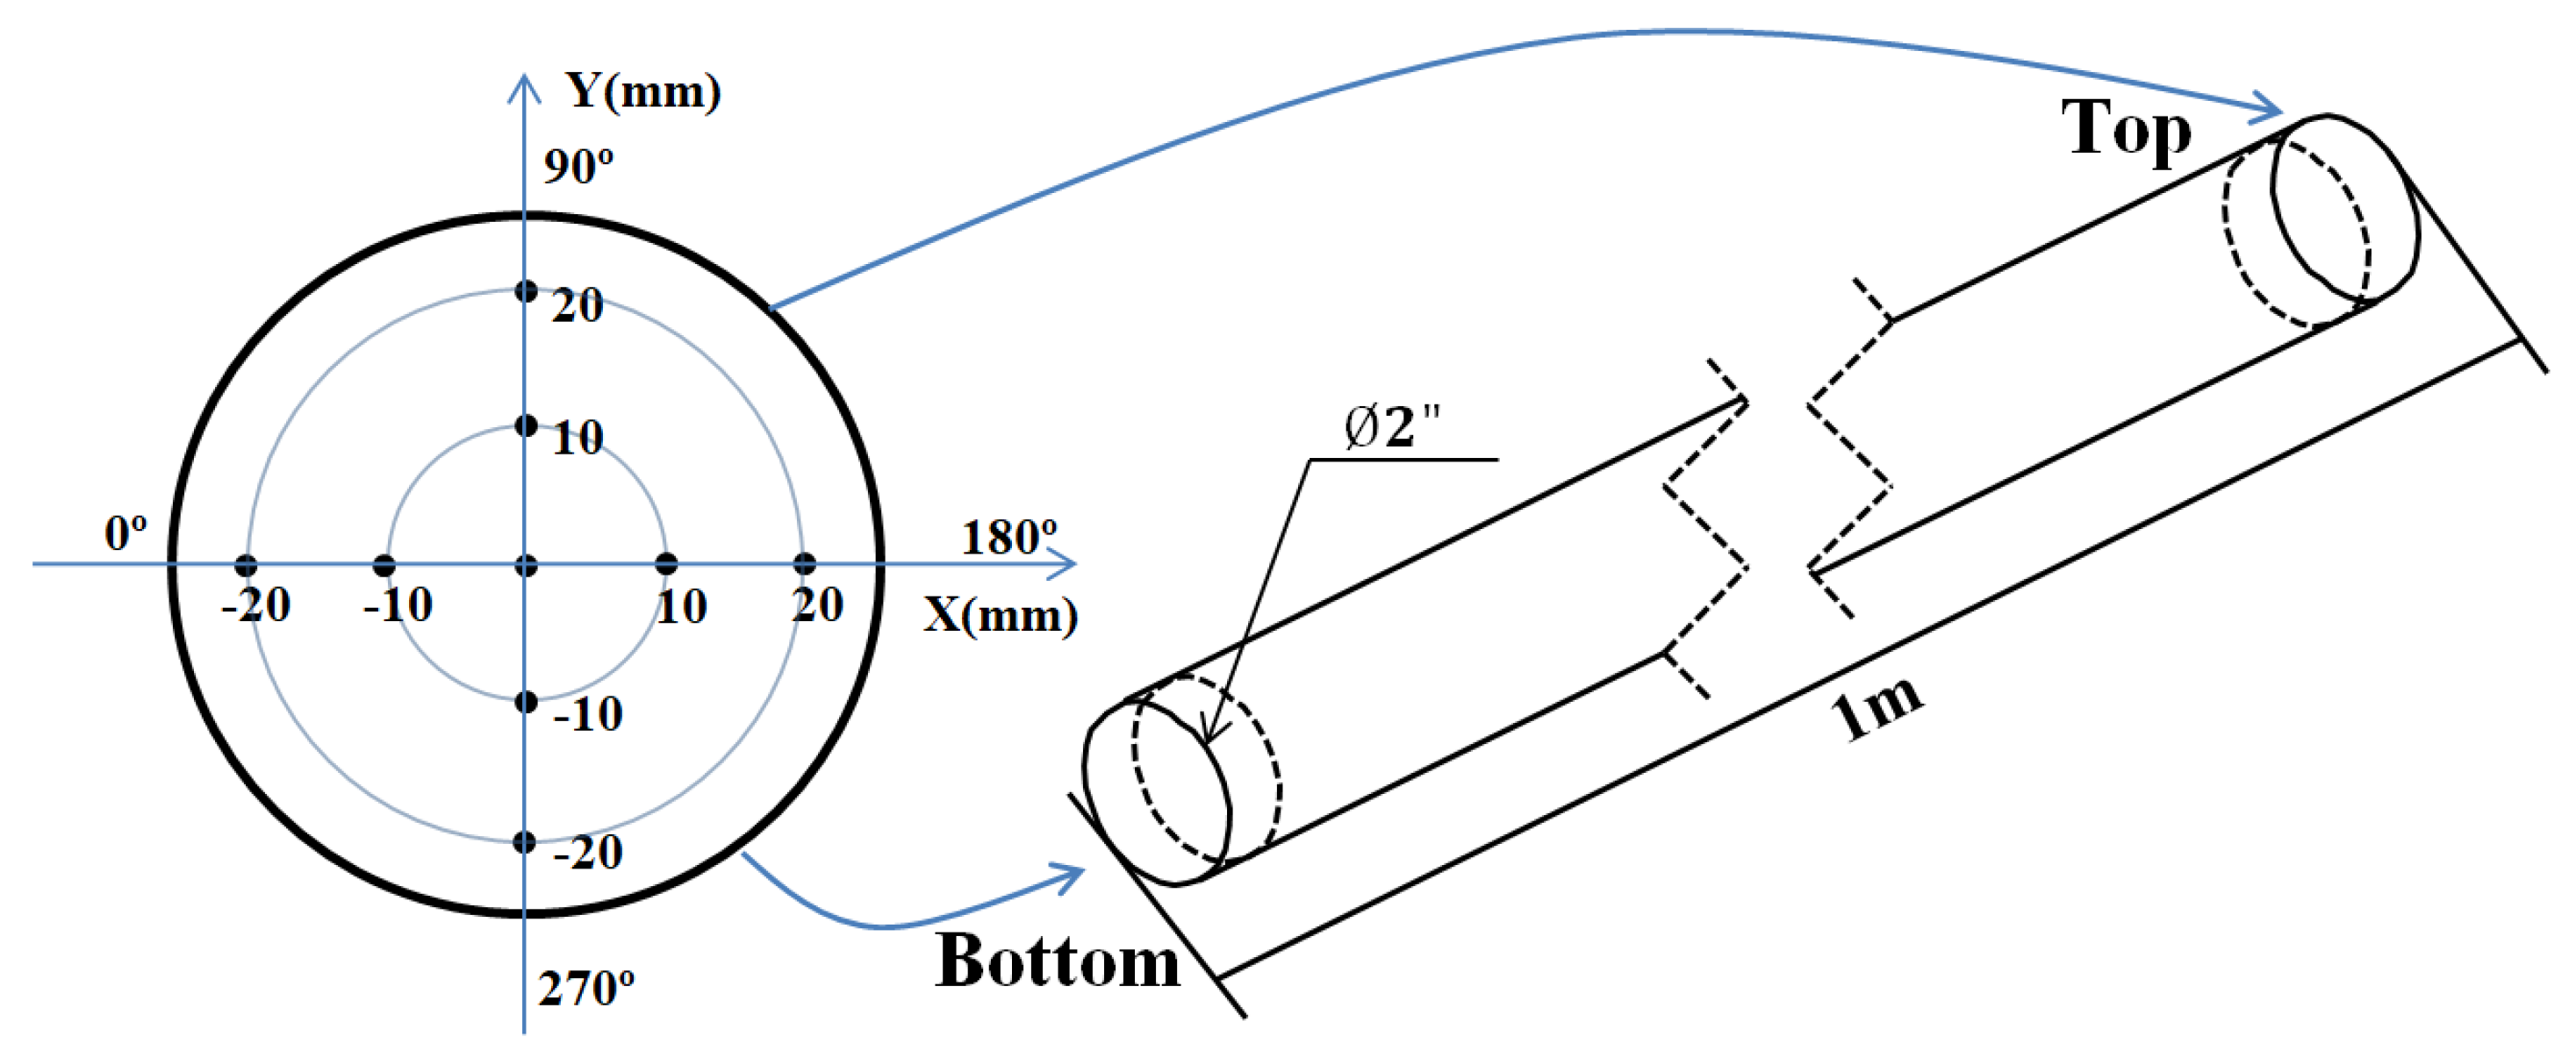
Figure 2.
Round bar end metalographic sample marking demonstration.
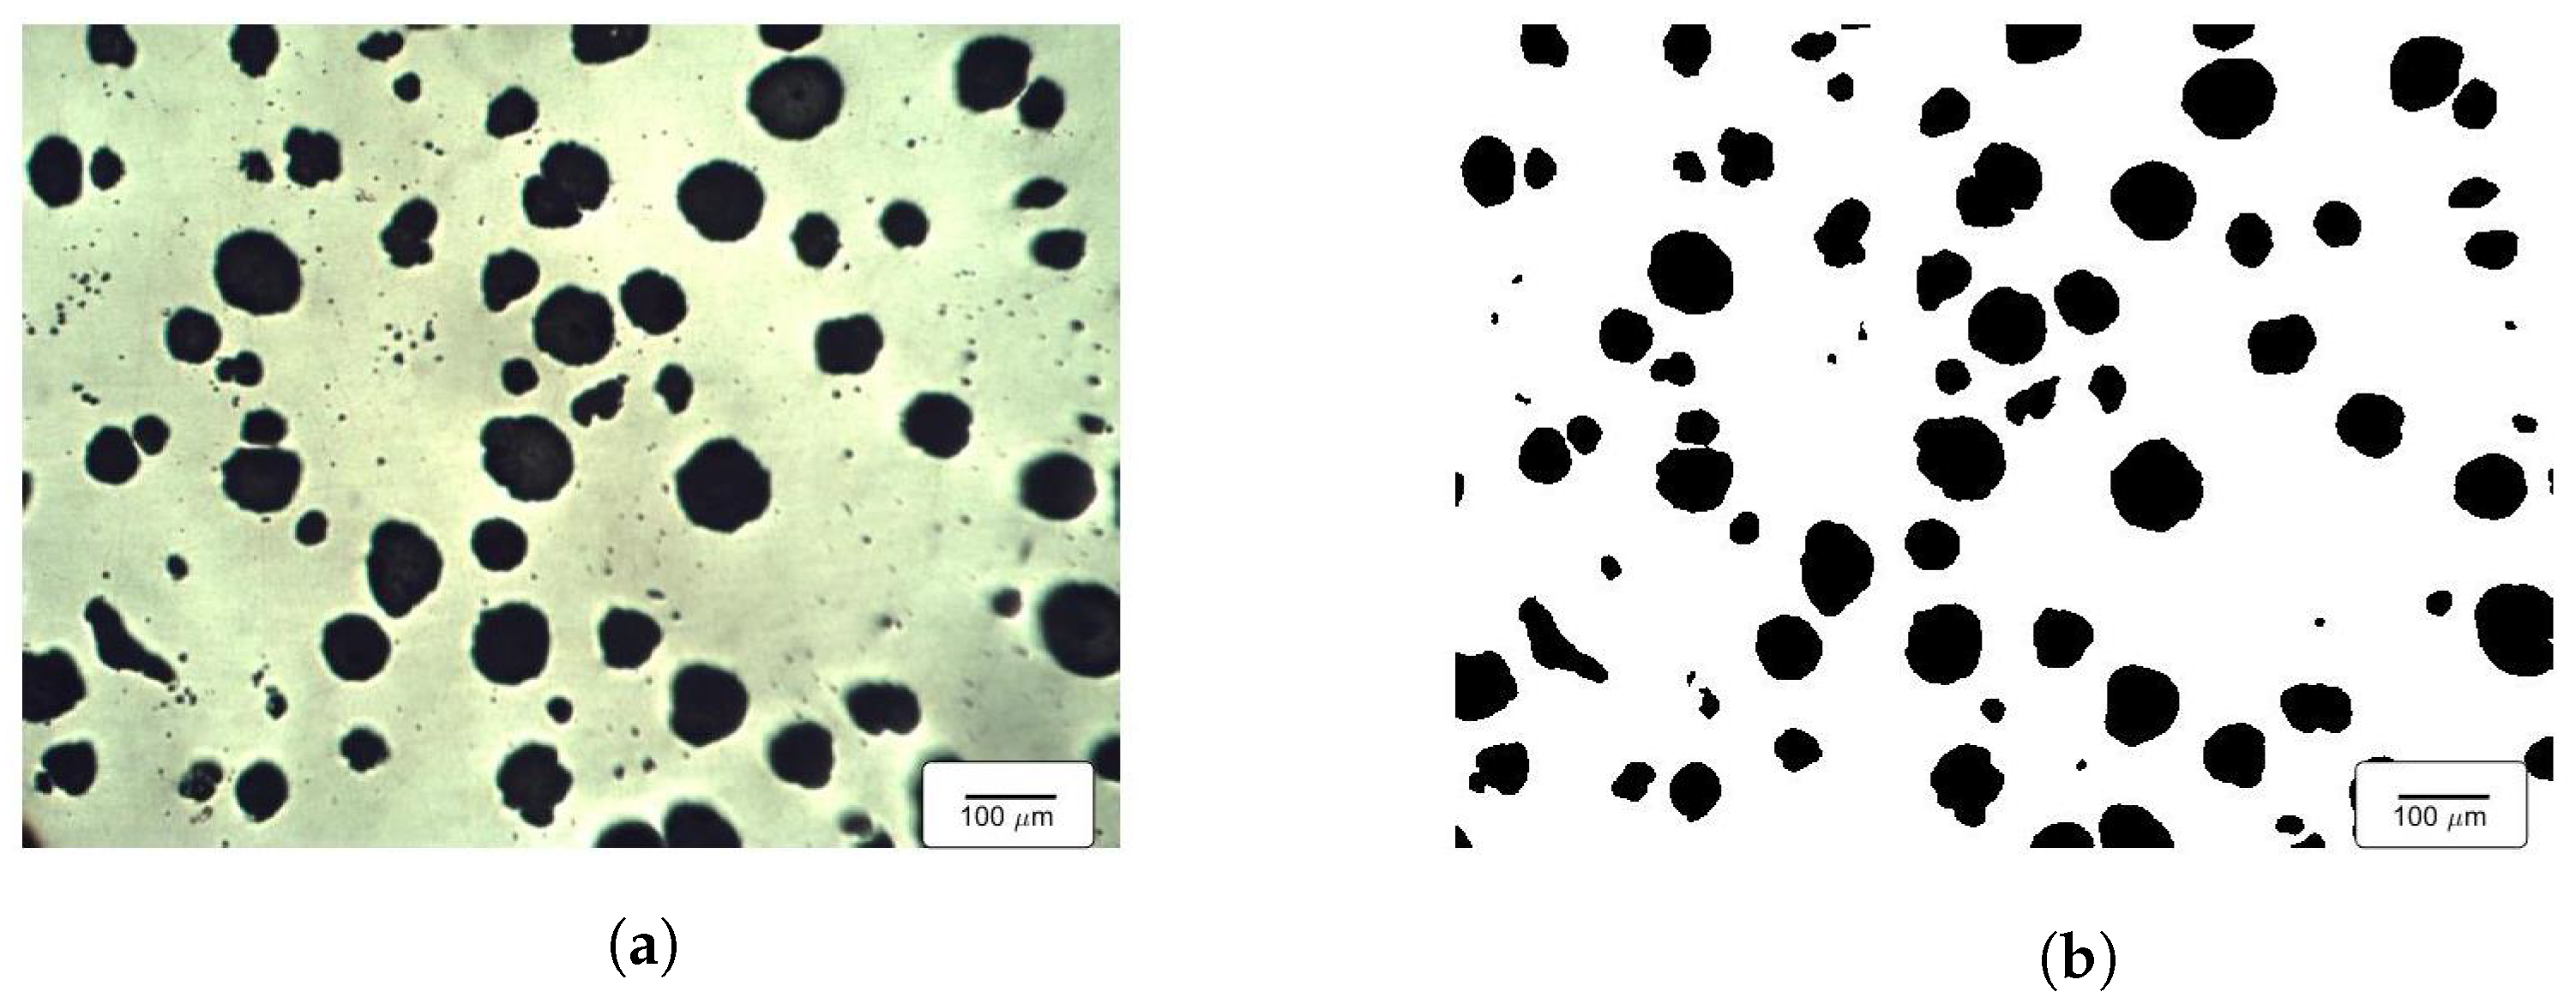
Figure 3.
Sample microstructure image of nodular cast iron. 100× magnification. (a) Input image. (b) Image segmentation.
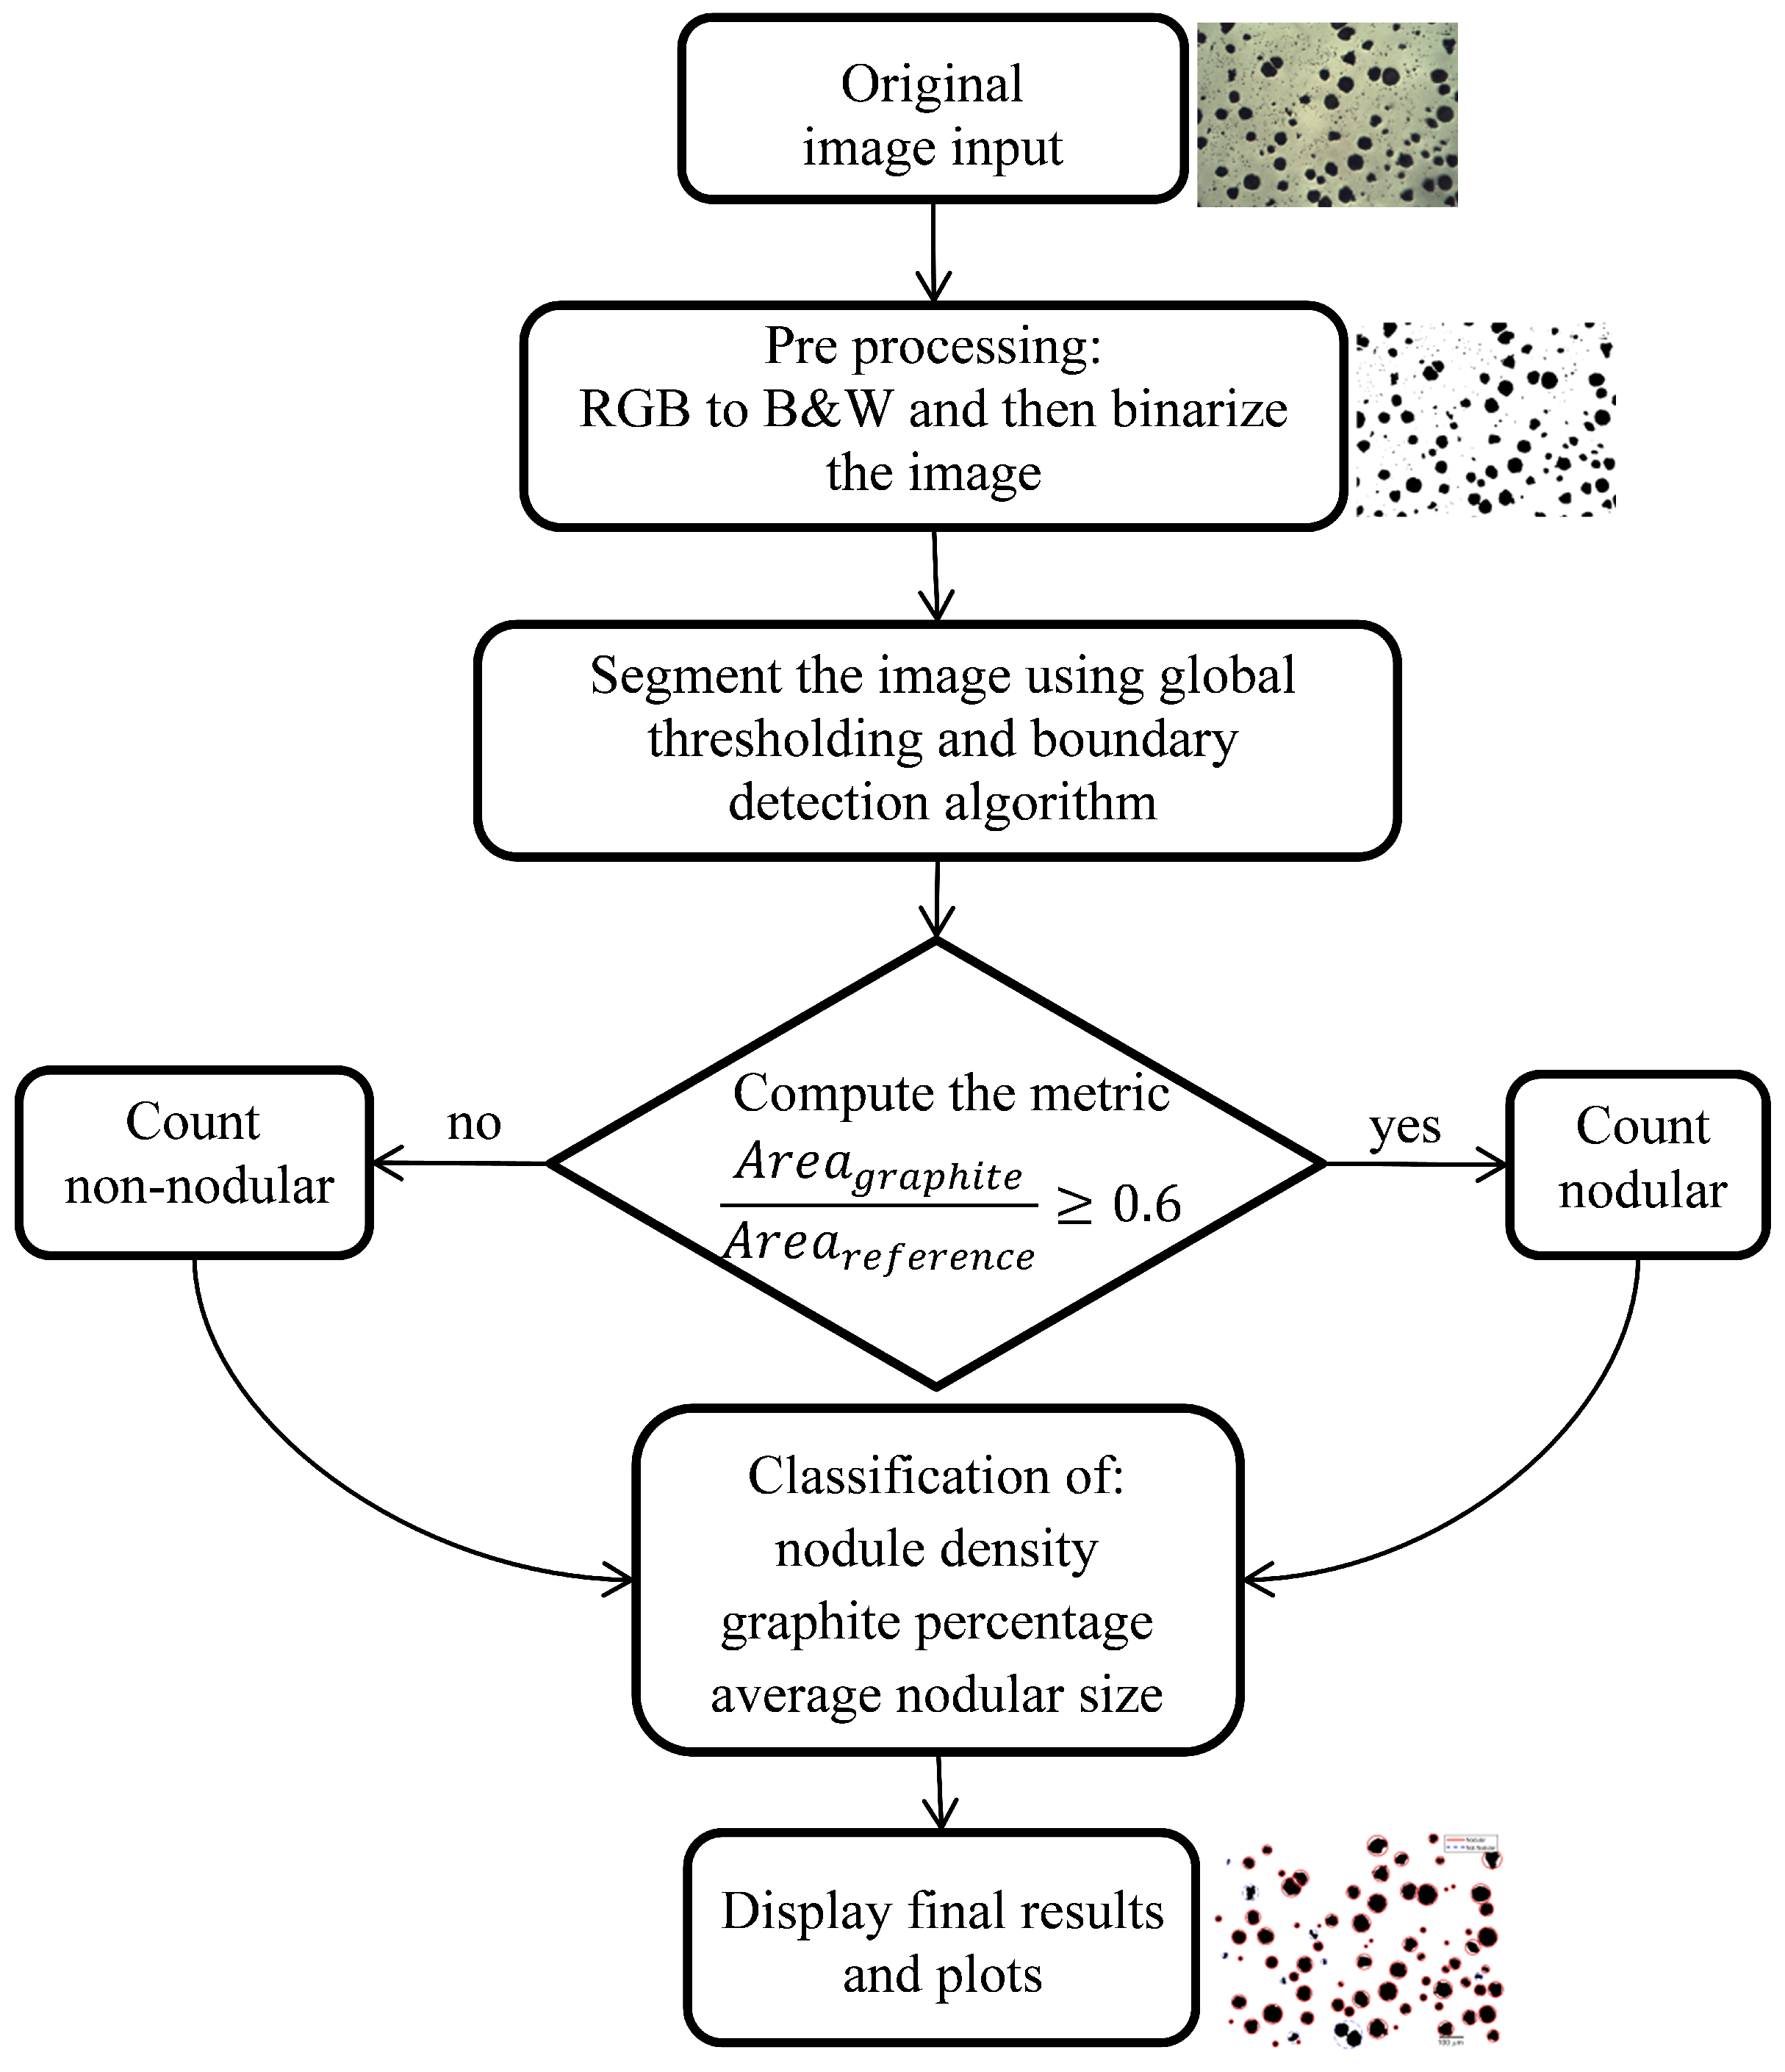
Figure 4.
Nodule count algorithm flowchart.
Figure 5.
Schematic representation of the roundness shape factor.
Figure 6.
Tensile test comparison.
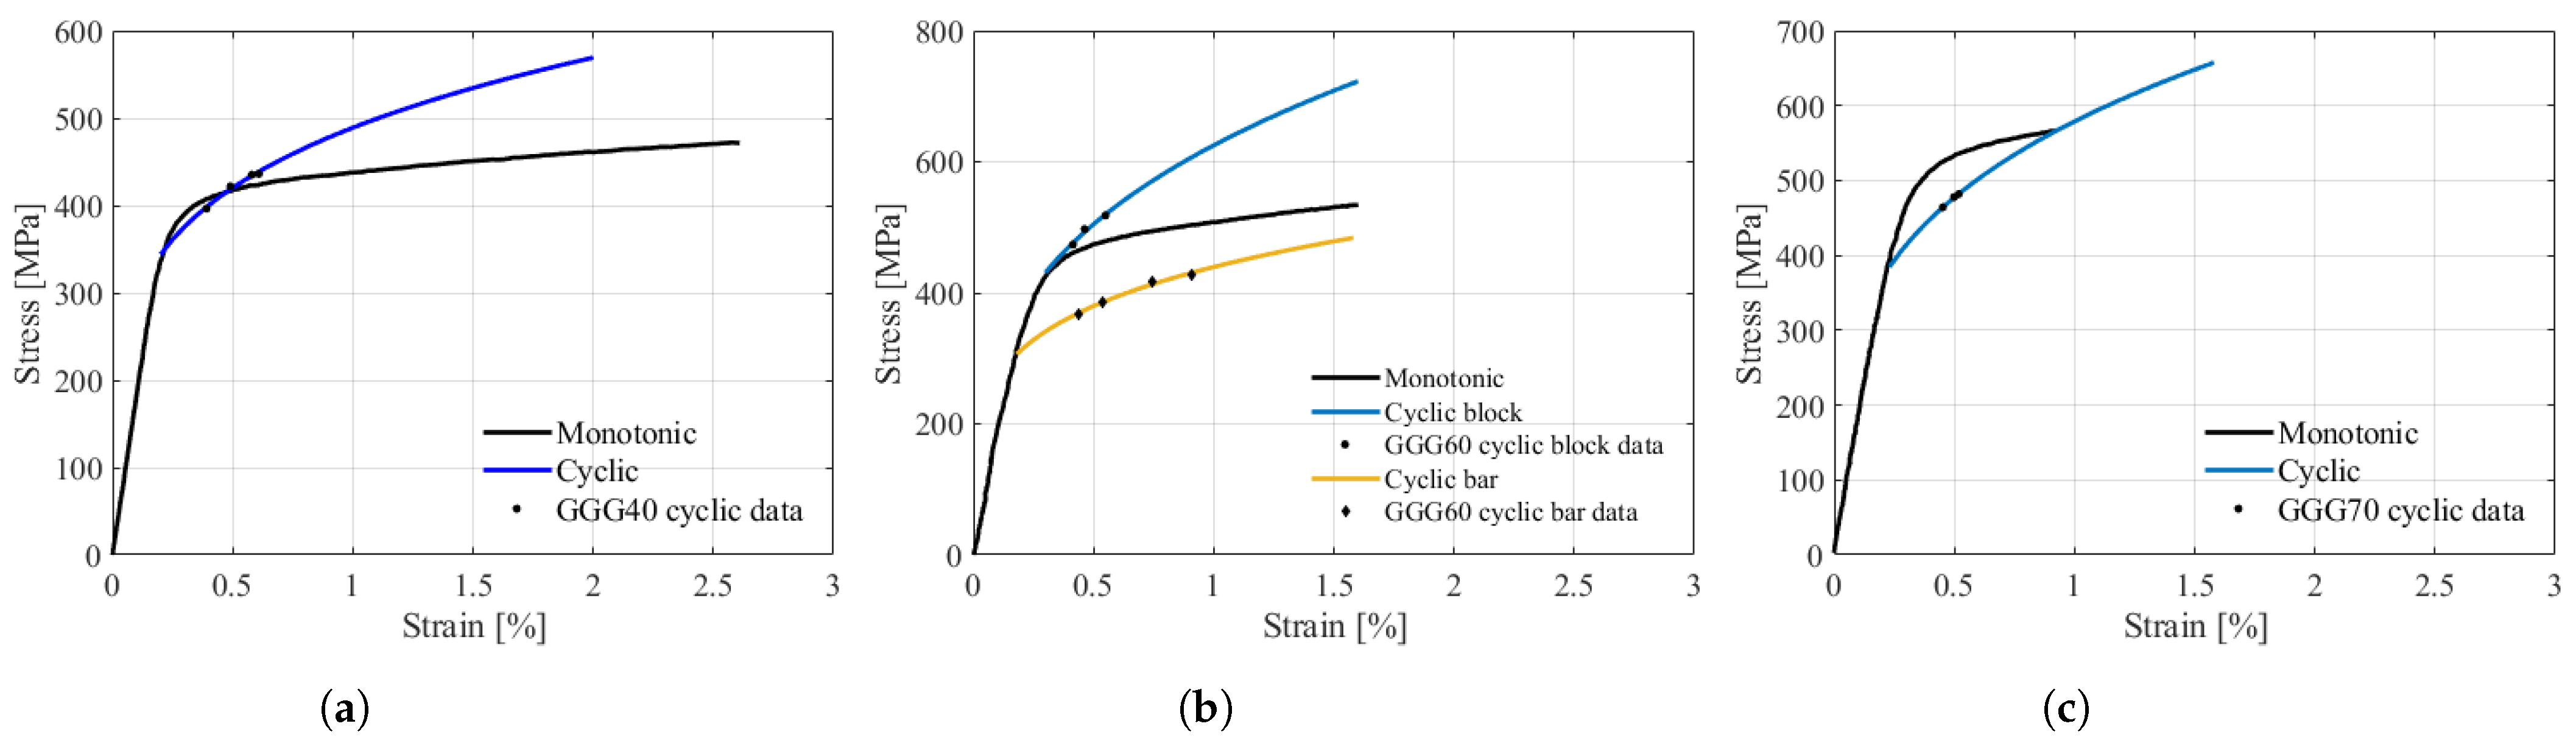
Figure 7.
Cyclic and monotonic stress-strain curve for (a) GGG40 (b) GGG60 (c) GGG70.
Figure 8.
Relation between nodule density and maximum stress in GGG40, 60 and 70.
Figure 9.
Nodule count in GGG40.
Figure 10.
Graphite percentage in GGG40.
Figure 11.
Nodule count in GGG60.
Figure 12.
Graphite percentage in GGG60.
Figure 13.
Nodule count in GGG70.
Figure 14.
Graphite percentage in GGG70.
Figure 15.
Hardness test round bar sample. (a) GGG40-1. (b) GGG40-2.
Figure 16.
Hardness test round bar sample. (a) GGG60-1. (b) GGG60-2.
Figure 17.
Hardness test round bar sample. (a) GGG70-1. (b) GGG70-2.
Figure 18.
Computational image identification on GGG40. (a) GGG40-1. (b) GGG40-2.
Figure 19.
Computational image identification on GGG60. (a) GGG60-1. (b) GGG60-2.
Figure 20.
Computational image identification on GGG70. (a) GGG70-1. (b) GGG70-2.
Figure 21.
Computational image analysis of NCI GGG40 with graphite, ferrite and pearlite identification for round bar specimens. (a) Block specimens. (b) Round bar specimens.
Figure 22.
Computational image analysis of NCI GGG60 with graphite, ferrite and pearlite identification for round bar specimens. (a) Block specimens. (b) Round bar specimens.
Figure 23.
Computational image analysis of NCI GGG70 with graphite, ferrite and pearlite identification for round bar specimens. (a) Block specimens. (b) Round bar specimens.
Table 1.
Chemical composition of GGG40, 60 and 70.
| Chemical Composition (%) | C | Mn | Si | S | P | Mg | Cu | Cr |
|---|
| GGG40 | 3.54 | 0.20 | 2.30 | 0.011 | 0.060 | 0.038 | 0.090 | - |
| GGG60 | 3.68 | 0.30 | 2.39 | 0.022 | 0.070 | 0.045 | 0.055 | 0.080 |
| GGG70 | 3.45 | 0.31 | 2.88 | 0.030 | 0.075 | 0.045 | 0.75 | 0.010 |
Table 2.
Ramberg–Osgood curve-fitting results for GGG40, 60 and 70.
| | Ramberg–Osgood Coef. |
|---|
| | | | |
|---|
| GGG40 | 489.0 | 0.2190 | 0.9617 |
| GGG60 block | 625.1 | 0.3090 | 0.9617 |
| GGG60 bar | 439.4 | 0.2106 | 0.9776 |
| GGG70 | 578.9 | 0.2782 | 0.9921 |
Table 3.
Microindentation test results.
| | | Hardness (HV) |
|---|
| | | Ferrite | Pearlite | Graphite |
| GGG40 | Block | 212 ± 2.1% | 306 ± 7.6% | 114 ± 4.0% |
| Bar | 222 ± 3.5% | 383 ± 2.8% | 94 ± 7.5% |
| GGG60 | Block | 230 ± 6.7% | 339 ± 5.3% | 69 ± 4.1% |
| Bar | 226 ± 3.0% | 386 ± 2.2% | 87 ± 8.1% |
| GGG70 | Block | 246 ± 4.3% | 372 ± 5.9% | 65 ± 4.4% |
| Bar | 224 ± 3.1% | 444 ± 6.2% | 100 ± 7.6% |
Table 4.
Round bar specimens graphite characteristics.
| | GGG40-1 | GGG40-2 | GGG60-1 | GGG60-2 | GGG70-1 | GGG70-2 |
|---|
| Nodule/mm2 | 49.63 ± 12.5% | 36.99 ± 12.9% | 63.40 ± 19.7% | 47.88 ± 29.6% | 107.17 ± 12.4% | 70.59 ± 14.7% |
| Nod. Graphite (%) | 64.71 ± 7.6% | 78.33 ± 8.0% | 58.03 ± 17.0% | 68.21 ± 29.2% | 88.39 ± 5.0% | 90.62 ± 6.1% |
| Avg. Area () | 1196.4 ± 17.3% | 2576.2 ± 17.9% | 752.1 ± 19.8% | 1331.2 ± 19.1% | 751.0 ± 30.3% | 1388.1 ± 12.9% |
| Sphericity | 0.7991 ± 3.6% | 0.8000 ± 3.0% | 0.7534 ± 5.4% | 0.7194 ± 10.1% | 0.9027 ± 1.8% | 0.9057 ± 3.3% |
| Compactness | 0.8678 ± 2.1% | 0.8762 ± 1.6% | 0.8100 ± 4.2% | 0.7920 ± 7.8% | 0.9341 ± 1.1% | 0.9356 ± 2.0% |
| Roundness | 0.6543 ± 2.2% | 0.6900 ± 1.9% | 0.5926 ± 6.6% | 0.5832 ± 11.9% | 0.7454 ± 2.4% | 0.7578 ± 2.4% |
| Eccentricity | 0.6720 ± 2.0% | 0.6396 ± 1.7% | 0.7069 ±3.9% | 0.7083 ± 7.2% | 0.5927 ± 3.8% | 0.5776 ± 3.5% |
Table 5.
Final results averages for NCI GGG40, 60 and 70 block specimens.
| | GGG40 | GGG60 | GGG70 |
|---|
| Hardness (HV) | 197.9 ± 3.0% | 240.7 ± 5.1% | 254.7 ± 4.8% |
| Nodule/mm2 | 46.53 ± 23.5% | 30.89 ± 27.7% | 40.99 ± 42.2% |
| Nod. Graphite (%) | 83.03 ± 2.9% | 93.74 ± 2.7% | 92.09 ± 2.3% |
| Avg. Area (μm2) | 2813.85 ± 21.5% | 4294.90 ± 29.8% | 2870.84 ± 33.6% |
| Sphericity | 0.8825 ± 3.9% | 0.8911 ± 1.3% | 0.8736 ± 3.2% |
| Compactness | 0.9325 ± 1.7% | 0.9343 ± 0.4% | 0.9305 ± 0.6% |
| Roundness | 0.7059 ± 4.2% | 0.7529 ± 1.6% | 0.7491 ± 2.7% |
| Eccentricity | 0.6356 ± 3.0% | 0.5890 ± 2.1% | 0.5875 ± 3.2% |
| Graphite (%) | 13.37 ± 7.0% | 14.26 ± 4.2% | 16.27 ± 11.0% |
| Ferrite (%) | 67.71 ± 7.7% | 27.18 ± 19.8% | 18.50 ± 26.8% |
| Pearlite (%) | 18.91 ± 27.0% | 58.54 ± 9.5% | 65.22 ± 9.8% |
Table 6.
Final results averages for NCI GGG40, 60 and 70 bar specimens.
| | GGG40 | GGG60 | GGG70 |
|---|
| Hardness (HV) | 272.4 ± 3.0% | 239.4 ± 10.2% | 275.0 ± 0.7% |
| Nodule/mm2 | 76.88 ± 8.3% | 69.85 ± 12.2% | 71.33 ± 1.4% |
| Nod. Graphite (%) | 90.90 ± 0.7% | 73.30 ± 14.5% | 90.89 ± 1.9% |
| Avg. Area (μm2) | 1551.11 ± 8.6% | 1289.65 ± 20.8% | 1562.91 ± 3.1% |
| Sphericity | 0.9495 ± 1.1% | 0.8371 ± 3.4% | 0.9563 ± 0.9% |
| Compactness | 0.9705 ± 0.7% | 0.8863 ± 2.6% | 0.9749 ± 0.6% |
| Roundness | 0.7738 ± 1.5% | 0.6799 ± 6.2% | 0.7910 ± 0.9% |
| Eccentricity | 0.5678 ± 2.1% | 0.6433 ± 5.5% | 0.5486 ± 1.2% |
| Graphite % | 13.94 ± 9.5% | 13.92 ± 2.7% | 12.95 ± 10.1% |
| Ferrite % | 17.21 ± 21.3% | 24.08 ± 52.1% | 12.44 ± 20.9% |
| Perlite % | 68.85 ± 5.2% | 62.00 ± 20.6% | 74.61 ± 5.1% |
Table 7.
Final tensile test results averages for NCI GGG40, 60 and 70 bar and block specimens.
| | | (MPa) | (MPa) | E (GPa) | Max. Elong. (%) | |
|---|
| GGG40 | Block | 413.8 ± 1.8% | 483.3 ± 3.6% | 161.3 ± 5.8% | 3.30 | 0.22 |
| Bar | - | 364.5 ± 5.3% | 159.1 ± 10.4% | 0.26 | 0.20 |
| GGG60 | Block | 471.7 ± 1.5% | 506.1 ± 5.2% | 163.5 ± 3.7% | 1.00 | 0.23 |
| Bar | 478.5 ± 8.8% | 552.1 ± 2.7% | 146.5 ± 2.1% | 1.84 | 0.21 |
| GGG70 | Block | 488.3 ± 6.5% | 534.5 ± 6.1% | 165.2 ± 5.2% | 1.44 | 0.23 |
| Bar | 562.0 ± 2.4% | 650.2 ± 3.8% | 151.0 ± 7.2% | 0.69 | 0.23 |
| Publisher’s Note: MDPI stays neutral with regard to jurisdictional claims in published maps and institutional affiliations. |
© 2022 by the authors. Licensee MDPI, Basel, Switzerland. This article is an open access article distributed under the terms and conditions of the Creative Commons Attribution (CC BY) license (https://creativecommons.org/licenses/by/4.0/).


 ,
, 


