Article

Characterization of the Isothermal and Thermomechanical Fatigue Behavior of a Duplex Steel Considering the Alloy Microstructure

1
Institut für Werktstofftechnik, Universitiät Siegen, Paul-Bonatz-Str. 9-11, 57076 Siegen, Germany
2
Lehrstuhl für Mikro- und Nanoanalytik und -Tomographie, Universität Siegen, Paul-Bonatz-Str. 9-11, 57076 Siegen, Germany
3
Institut für Angewandte Materialien (IAM), Karlsruher Institut für Technologie (KIT), Hermann-von-Helmholtz-Platz 1, 76344 Eggenstein-Leopoldshafen, Germany
*
Author to whom correspondence should be addressed.
Metals 2022, 12(7), 1161; https://doi.org/10.3390/met12071161
Submission received: 27 May 2022 / Revised: 1 July 2022 / Accepted: 5 July 2022 / Published: 7 July 2022

Abstract

:
Isothermal and thermomechanical fatigue behavior of duplex stainless steel (DSS) X2CrNiMoN22-5-3 was investigated. The aim of this work was to understand the fatigue behavior by correlation of the isothermal and thermomechanical fatigue behavior with microstructural observations. Fatigue tests at plastic-strain-amplitude of 0.2% were carried out at 20, 300 and 600 °C, while in-phase (IP) and out-of-phase (OP) thermomechanical fatigue (TMF) experiments were performed between 300 and 600 °C. During the 20 °C fatigue test, a continuous softening was observed. Transmission electron microscopy examinations reveal pronounced planar slip behavior in austenite. At 300 °C, deformation concentrates in the ferrite, where strong interactions between CrxN and dislocations were observed that explain the pronounced cyclic hardening. DSS studied exhibits softening throughout the whole isothermal fatigue test at 600 °C. In ferrite, during the 600 °C fatigue test, the G phase, γ′ austenite precipitated, and an unordered dislocation arrangement was observed. The stress responses of the TMF tests can be correlated to those of the isothermal fatigue tests. In IP mode, a positive mean stress resulted in premature failure. No γ′ austenite but the formation of subgrains in the ferrite phase was observed after TMF tests. The plastic deformation of the austenite at high temperatures results in an unordered dislocation arrangement.

1. Introduction

The duplex stainless steel (DSS) X2CrNiMoN22-5-3 (SAF 2205, German designation 1.4662) represents a two-phase material primarily consisting of a ferritic (α) and an austenitic (γ) phase. Generally, the ferrite phase ensures remarkably high mechanical strength, while the austenite phase provides sufficient ductility. DSS possesses high chemical resistance owing to the high chromium content in both phases. Due to its attractive properties, DSS offers a broad range of applications. DSS is widely used in, e.g., shipbuilding, the food industry and the chemical industry. Furthermore, DSS is also used in high temperature applications such as heat exchangers in power plants. If DSS is exposed to high temperatures, the material properties deteriorate dramatically. In particular, it was found that the load-bearing capacity of the ferrite phase is continually reduced with increasing temperature [1]. Other phenomena such as dynamic strain ageing (DSA) have been investigated for both ferritic steels (temperature range: 200–400 °C) [2,3,4] and austenitic steels (temperature range: 400–600 °C) [4,5] but also for DSS in the temperature range between 250 and 500 °C [4,6]. Further, detrimental microstructural changes take place at elevated temperatures. Especially in the temperature range 350–550 °C, duplex steels suffer a spinodal decomposition of the ferrite into a chromium-rich α’ and an iron-rich α phase [7,8,9,10,11]. This spinodal decomposition results in embrittlement, which is most pronounced at 475 °C. The 475 °C embrittlement leads to a deterioration of the mechanical properties, such as an increase in tensile strength, an increase in hardness and a decrease in fracture toughness and fracture strain [12,13,14]. The effect of the so-called 475 °C embrittlement has already been studied in detail [7,8,9,10,11]. Above this temperature, precipitation of intermetallic phases is reported in the literature [15]. As a consequence of the spinodal decomposition of the ferrite, in the temperature range of 350 to 500 °C, an intermetallic Mo- and Si-rich G phase with a crystal structure F 4/m 3 ¯ 2/m and with a lattice parameter four times larger than that of the ferrite matrix becomes stable [16,17]. Moreover, the Cr- and Mo-rich intermetallic tetragonal sigma phase can occur between 550 and 1050 °C [18,19]. Other precipitation processes, such as the formation of carbides (M23C6), nitrides (Cr2N) or γ′ secondary austenite, are reported to occur at higher temperatures [15,16]. Mateo et al. [16] concluded that spinodal decomposition, formation of Cr2N as well as dislocations act as further lattice disturbing elements accelerating the nucleation of new phases due to preferential diffusion paths.
When DDS is utilized, e.g., in heat exchangers as pipes or boilers, high temperatures of up to 600 °C can occur in combination with mechanical loads due to start-up and shut-down processes. The so-called thermomechanical fatigue (TMF) can lead to premature component failure. The behavior of DSS 1.4662 under low cycle fatigue (LCF) and TMF has been studied at temperatures between room temperature and 600 °C [4,7]. In the ferrite steel AISI 430F [3], which resembles the ferrite phase of DSS with respect to the chemical composition, and also in other steels [20], DSA was found to be significantly dependent on the strain rate [4]. The effect of the 475 °C embrittlement and the corresponding spinodal decomposition on the isothermal fatigue properties was extensively studied [7,8,21]. Several investigations deal with the thermomechanical fatigue behavior of DSS 1.4662 in the temperature range between 350 and 600 °C with a mechanical strain amplitude of 0.4% or 0.8% and a test frequency of 0.008 Hz [1,22]. It is reported that cyclic heating above 550 °C during the TMF test counteracts the negative effects of spinodal decomposition; hence, no negative influence on the fatigue behavior is observed [1]. In addition, it was demonstrated that the austenite phase possesses sufficient strength even at high temperatures to compensate for the low strength of the ferrite phase [1,22]. However, there is no link between TMF and the corresponding isothermal fatigue tests under the same conditions. Further, the relevant microstructural aspects/evolution and the phase formations such as plasticity (i.e., dislocation formation, evolution, arrangement, interaction) under isothermal and TMF conditions were not discussed.
The aim of the present work is to characterize TMF behavior of a DSS 1.4662 in the temperature range between 300 and 600 °C in plastic-strain control and to link the mechanical behavior to the microstructural properties. In order to understand the damage behavior as a result of TMF, isothermal fatigue tests at 20, 300 and 600 °C were additionally performed and serve as basis for a sound interpretation of TMF particularities.

2. Materials and Methods

The duplex stainless steel X2CrNiMoN22-5-3 (1.4662) was produced by Santo Tomas de las Ollas (León, Spain). The material was delivered in rods with a diameter of 20 mm in hot-rolled condition. The chemical composition of the material in the as-delivered condition was verified by spark spectroscopy analysis (Table 1). The measured chemical composition corresponds well to the SAF 2205® AISI 318 LN specifications.
For direct comparison with the literature, the material was annealed at 1250 °C in a muffle furnace for 4 h prior to testing as proposed in References [7,8,21,23]. This heat treatment was followed by continuous furnace cooling for 3 h down to 1050 °C and final water quenching. The cylindrical fatigue specimens with a gauge length of 15 mm and a diameter of 5 mm were machined from the rod material. Before fatigue testing, all specimens were mechanically polished to P4000 and finally electrochemically polished (90 vol.% perchloric acid, 10 vol.% acetic acid, at 20 V/res. current 0.1 A). A servo-hydraulic testing machine of type MTS 810 (MTS Systems Corporation, Eden Prairie, MN, USA) (maximum load 100 kN) equipped with hydraulic clamping jaws and a controller of type MTS TestStar IIs (MTS Systems Corporation, Eden Prairie, MN, USA) was used. A high frequency induction heating system Huettinger TIG 5/300 (TRUMPF Hüttinger GmbH + Co. KG, Baden-Württemberg, Freiburg im Breisgau, Germany) with an Eurotherm temperature controller of type 2704 (EURO-THERM GmbH, Worthing, UK) and a self-made induction coil was applied for heating. The strain was measured with a vacuum-resistant high-temperature rod extensometer of type MTS 632.51F-74 (MTS Systems Corporation, Eden Prairie, MN, USA). All experiments were performed at a test frequency of 0.0059 Hz, which results from the attainable cooling rate of the sample from 600 to 300 °C during air cooling. Thermal and mechanical cycles had a triangular wave shape. Prior to isothermal fatigue testing, the specimens were heated up to the testing temperature at zero load under load control and the strain setpoint was adjusted to a value of zero. To establish true plastic-strain control, the elastic strain was subtracted from the mechanical strain signal by adjusting the stiffness 1/EA (E means the Young’s modulus, and A denotes the cross-sectional area of the sample) during a preliminary load-controlled test in the pure elastic region. All subsequent tests were performed at a plastic-strain amplitude of 0.2%. For the isothermal and thermomechanical fatigue tests, one sample was tested under respective conditions. In TMF tests, the thermal expansion and the temperature dependence of the Young’s modulus were additionally considered in the plastic-strain calculation using results of preliminary tests and a 3rd degree polynomial function. Details on the method of controlling thermomechanical fatigue tests in plastic-strain control can be found elsewhere [24]. In-phase (IP) TMF is defined as temperature and mechanical cycling being in phase, where out-of-phase (OP) TMF is characterized by a phase difference of 180°. The fatigue tests were stopped at a maximum number of 2555 cycles (in the saturation regime), which corresponds to a test duration of five days.
A Lext OLS4000 optical microscope (Olympus Corporation, Tokyo, Shinjuku, Japan) (OM) as well as a focused ion beam-scanning electron microscope (FIB-SEM) DualBeam system of type FEI Helios Nanolab 600 (FEI Company, Hillsboro, OR, USA), equipped with backscatter electron (BSE) imaging and electron backscatter diffraction (EBSD), were utilized to investigate the coarse ferrite/austenite microstructure. The average grain sizes were automatically evaluated based on the EBSD measurements using the TEAMTM V4.5.1 software (Version 4.5.1, Ametek, Berwyn, PA, USA). Thin foils for transmission electron microscopy (TEM) were prepared from the fatigue specimens parallel to the stress direction, i.e., the normal foil is perpendicular to the stress direction. The platelets were extracted by diamond wire sawing and mechanically ground to a thickness of about 100 µm using SiC paper. For the final thinning down to electron transparency, the foils were jet-polished with a Struers TenuPol-5 (Struers GmbH, Nordrhein-Westfalen, Willlich, Germany) at 287 K at a voltage of 20 V until perforation. For this purpose, the same electrolyte was applied as used for the electrochemical surface polishing of the fatigue specimens. TEM investigation was conducted with a Thermo Fisher FEI Talos F200X (FEI Company, Hillsboro, OR, USA) operated at 200 kV acceleration voltage. For scanning TEM (STEM) the high-angle annular dark-field (HAADF) detector (FEI Company, Hillsboro, OR, USA) was applied. To enhance chemical contrast, a small camera length of 77 mm was chosen (called HAADF-STEM). In order to clearly depict dislocations, an intermediate camera length of 205 mm was selected (ADF-STEM) to allow Bragg reflection to hit the detector. To identify the crystal structure of the individual phases, selected area diffraction (SAD) patterns were recorded. The chemical composition of the phases was measured using energy dispersive X-ray spectroscopy (STEM-EDX). The quantification was performed with the standard analysis procedure of the Velox software V3.1.0 (Version 3.1.0, FEI Company, Hillsboro, OR, USA).

3. Results and Discussion

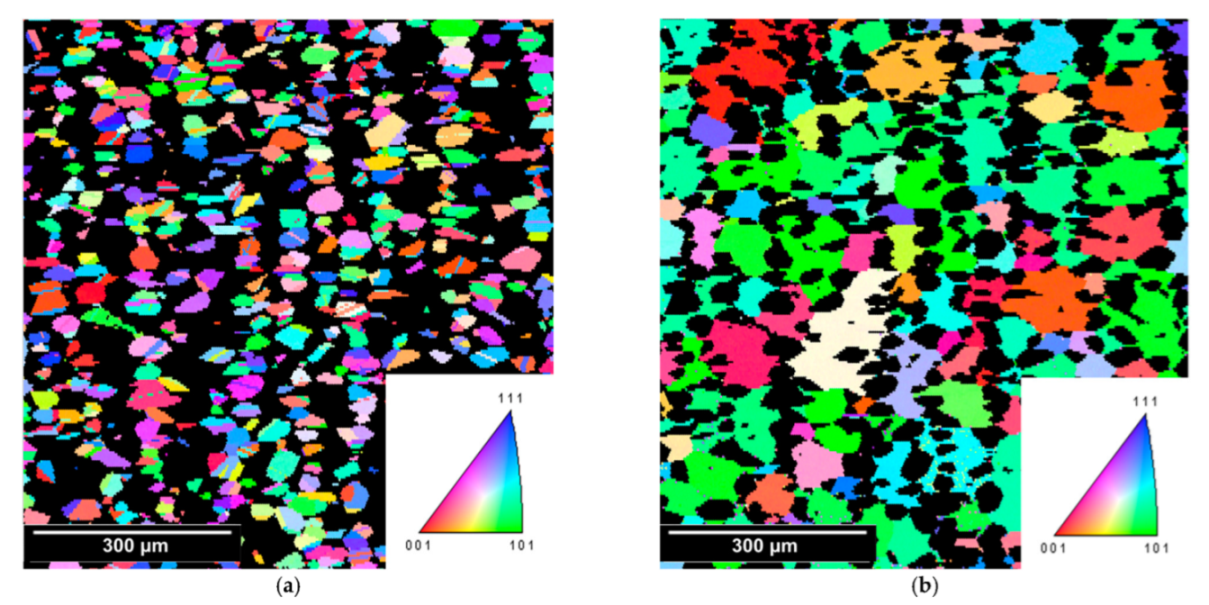
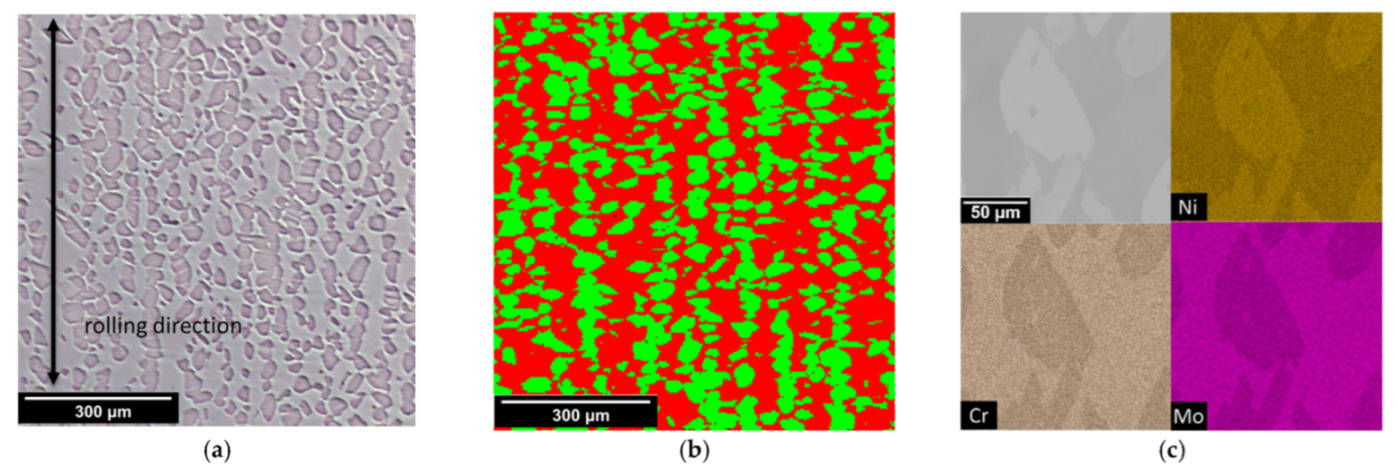
3.1. Initial Microstructure

Figure 1 displays the microstructure of the DSS after initial heat treatment. In the optical micrograph in Figure 1a the austenitic grains appear dark gray, whereas the ferrite phase is brighter. The rolling direction of the hot-rolled material is reflected in the vertical chain-like arrangement of the austenitic grains. Figure 1b depicts a EBSD mapping of the DSS. The red color represents the ferrite, while the green color represents the austenite phases. Based on the EBSD analysis, a phase fraction ratio of about 50% austenite and 50% ferrite was determined. The average grain sizes of the ferrite and the austenitic grains yield were 60 and 20 µm, respectively (see Figure A1). Figure 1c provides a BSE-SEM micrograph with the corresponding EDX mapping of the elements Ni, Cr and Mo. It reveals that the ferritic phase is rich in the elements Cr and Mo, while the austenitic phase is enriched in the austenitic stabilizing elements Ni. The EDX analysis of the other elements (Mn, Fe, Si) yielded no visible differences between the phases in the EDX mapping; thus, the visualization was omitted.
A detailed image of the precipitates within a ferritic grain is depicted in Figure 2a Precipitates of CrN appearing as fine needles in cloud-like clusters and Cr2N as larger needle-shaped precipitates were identified by chemical composition using STEM-EDX mappings. The results are in good agreement with nitrides reported in References [25,26,27]. A closer look at the ferritic grains reveals the beginning decomposition into Fe-rich α ferrite and Cr-rich α′ ferrite (Figure 2b). By tilting from the zone axis, even dots splitting can be recognized in the diffraction pattern. This is clearly illustrated by the inset in Figure 2c. The decomposed structure in the ferrite phase (Figure 2b) has been proven both experimentally and by phase-field simulation as a key factor of phase separation kinetics in Fe-Cr-based alloys [28]. Obviously, the spinodal decomposition of the ferrite phase could not be prevented by the applied heat treatment. In contrast to ferrite, the austenitic grains exhibit no peculiarities and are single phase (results not shown here).

3.2. Isothermal Fatigue

In Figure 3a, the cyclic stress response of the DSS during the isothermal fatigue tests at 20, 300 and 600 °C at a plastic-strain amplitude of 0.2% is depicted. The ordinate displays the maximum and minimum stress response of a hysteresis. The abscissa represents the respective number of the cycle. The resulting stress response during the room temperature test (black curve) yields a slight initial hardening at the beginning (within the first 10 cycles by approximately ±20 MPa). During the remaining test period, the DSS reveals only a slight softening, which is visible by the decreasing stress amplitude (from approximately ±570 to ±520 MPa). In contrast, the orange curve, which represents the isothermal fatigue behavior at 300 °C, exhibits a pronounced primary hardening up to about 100 cycles (from approximately ±400 to ±600 MPa) followed by a plateau (±600 MPa). Significant deviations in the stress response at 300 °C are explained by serrated flow of the stress signal as depicted in the exemplarily stress–total strain hysteresis loop in Figure 3b. Those rapid stress drops followed by reloading can be attributed to DSA. The occurrence of DSA is additionally indicated by the higher saturation stress amplitude at 300 °C as compared to room temperature. The cyclic deformation curve of the isothermal fatigue test at 600 °C (red curve) exhibits slight softening until failure (from approximately ±290 to ±200 MPa). The results of the fatigue test at 600 °C reveal lower values of the stress amplitude compared to the stress response at the other test temperatures. The drop of the stress response at the end (approximately 2000th cycle) of the test period is most likely caused by crack initiation. In addition, Table A1 gives the yield strength R0.2, max. tensile strength Rm and the elongation at fracture A recorded from Kolmorgen during isothermal monotonic tensile tests at 20, 300 and 600 °C for the interested reader [29].
To understand the material behavior and the role of constituting phases, TEM analysis was carried out on the samples after isothermal fatigue testing. After the fatigue test at room temperature, dislocations (white lines, e.g., in Figure 4a) occur in preferred orientations (two directions) in the selected austenitic grain, documenting planar slip in two active slip systems. Furthermore, a higher dislocation density can be observed at the boundaries between neighboring austenite and ferritic grains, indicating the pileup of defects. Obviously, phase boundaries act as barriers to dislocation glide [30,31]. Only individual dislocation loops are visible in the ferritic grain. Detailed micrographs of the dislocation arrangements are given Figure A2. The results of the TEM investigations (Figure 4a) reveal that the plastic deformation is concentrated in the softer austenitic grains. These stress responses are in accordance with the findings of Wackermann et al. [13] who tested the same material at RT with a plastic-strain amplitude of 0.25%. Because of the slightly higher plastic-strain amplitude as compared to the value of 0.20% used in the study presented, the resulting stress response was slightly increased to a stress amplitude of about 610 MPa. The authors also observed softening behavior after initial hardening in the cyclic deformation curves. Initial hardening was attributed to dislocation formation in both phases. Wackermann et al. correlated the extent of softening to the deformation-induced dissolution of spinodal decomposition domains. Moreover, based on the yield strength distribution function, they attributed the global deformation behavior of the DSS at higher plastic strain to the ferrite phase [13]. Whether austenite also contributes to the softening behavior but could not be determined by the yield strength distribution function analysis beyond doubt, as planar sliding in austenitic grain was detected after all stress controlled tests (Δσ/2 = 375 MPa or 400 MPa at 475 °C) independent of the embrittlement state and the stress level [13].
In contrast to the sample tested at room temperature, the microstructure after isothermal fatigue testing at 300 °C reveals a high dislocation density nearby the CrxN precipitates in the ferritic grains (Figure 4b and Figure A3a). Detailed micrographs of the microstructure indicate that the cluster-like structure in the ferrite remains unchanged in size (Figure A3b). Apparently, planar gliding is also the predominant glide behavior in austenitic grains during isothermal fatigue at 300 °C (Figure 4b). It can be concluded that in contrast to the room temperature experiment, the plastic response is now governed by the dislocation arrangement in the ferritic grain in accordance with previous studies by Kolmorgens et al. [1,30]. The CrxN precipitates act as obstacles for the dislocation movement (Figure A3) explaining the massive hardening in the stress response curves (Figure 3a orange curve). The sawtooth-like stress response in the stress–strain hysteresis loops (Figure 3b) is consequently material-related and can be rationalized by the dislocation motion and pinning at CrxN precipitates within the ferritic grains (Figure A3a). The DSA in ferrite at intermediate temperatures is a well-known phenomenon [6,32].
Interestingly, new precipitates were identified in ferrite (Figure 4c).
Figure 5a depicts the details of the changed microstructure in the ferrite matrix, after isothermal fatigue testing at 600 °C. Two new phases with bright and dark contrast and with irregular shape preferably form nearby Cr2N precipitates. Furthermore, it can be observed that the spinodal α/α’ microstructure of the ferrite dissolves in the vicinity of the new phases, and these areas become iron-rich, which is indicative of the Fe-rich α ferrite. In combination with STEM-EDX (Figure 5a and Table 2) and SAD analysis (Figure 5a,b), the γ′ austenite (Ni-type, dark contrast) and the G phase (Ni16Si7Mn6-type, bright contrast) were identified. The STEM-EDX measurements of the individual phases reveal that the G phase is rich in the elements Si, Ni and Mo as compared to the ferritic grain. Figure 5b displays the diffraction spots of the G phase as well as the ferrite matrix (red circles) which are visible due to their crystallographic <111>α/<111>G relation. This observation is in agreement with results of Mateo et al. who observed that the G phase exhibits a cube-on-cube orientation relationship with the ferrite matrix [16]. Further, the transformation of ferrite to γ′ austenite takes place during isothermal fatigue at 600 °C. This is evidenced by the presence of the fcc structure in the diffraction pattern in Figure 5c and the enrichment of Ni and Mn, similar to primary austenite (Table 2). Weidner et al. also observed the formation of the γ′ austenite in addition to the G phase even during a TMF experiment in the temperature range of 350 to 600 °C [22]. Only a slight depletion in Cr and Mo in the γ′ austenite was identified after aging at 850 °C for few hours, which was also reported by Villanueva et al. in DSS X2CrNiMoN22-5-3 [33].
Clearly, several microstructural transformations occur simultaneously during the isothermal fatigue test at 600 °C. It is stated by Weidner et al. [22] and Meteo et al. [10,16] that CrxN precipitates as well as dislocations act as nucleation sites for the formation of the G phase, while the precipitation of the γ′ austenite (Figure 5a) occurs due to the lattice distortion in the vicinity of CrxN precipitates. Alternatively, the gradient in the chemical composition, in particular the Cr gradient between the matrix and the CrxN, acts as the driving force for precipitation [10,16]. In the vicinity of the new phases, no spinodal decomposition of the ferrite phase was observed, most likely because the elements Si, Mo and Ni, which facilitate the process of spinodal decomposition, segregate to the new phases [16,22]. Mateo et al. discussed that the spinodal decomposition of ferrite is often accompanied by CrxN precipitation. This assumption is confirmed by the experimental findings in this work (Figure 2) [16]. Tavares et al. also observed the formation of γ′ austenite in the decomposed interdomains of the ferrite during ageing treatment of the DSS UNS S31803 at 800 °C [11]. Thus, it can be concluded that the precipitation of CrxN and the spinodal decomposition, along with lattice distortion and the establishment of gradients in the chemical composition of corresponding phases, give rise to the formation of secondary phases, namely G phase and γ′ austenite.
Less dislocations were found in the ferrite as compared to the austenite phase after 600 °C fatigue testing (Figure 4c). It is well-known that diffusion determines the dislocation movement at high temperatures [34]. Further, the diffusion processes are generally faster in bcc than in fcc materials [35]. Therefore, the faster dislocation climbing in the ferrite phase and, in turn, the more pronounced dislocation annihilation may explain the low dislocation density within the ferritic grains at high temperature [36]. The hard intermetallic G phase acts as an obstacle to dislocation motion, but due to the high temperature (thermal energy) the dislocations can climb and eventually overcome the G phase. Such a behavior is typical for bcc materials at elevated temperatures [34]. In addition to planar glide behavior in austenitic grains at room temperature and 300 °C testing, further dislocation arrangements with an irregular appearance were found in the austenitic grains after fatigue at 600 °C (Figure 4c and Figure A4a). In the austenitic grain (Figure 4c and Figure A4b) the more irregular dislocation arrangement can be explained by cross slip or climbing, as these processes are favored at high temperatures, making the overall dislocation structure more complex compared to lower temperature fatigue tests (Figure 4a,b). Kolmorgen et al. reported that due to the higher temperature, the ferritic grains take up more of the plastic deformation relative to the austenite. In addition, it was demonstrated that the austenite phase possesses sufficient strength even at high temperatures to compensate for the low strength of the ferrite phase [1]. Both the higher temperature and the high plastic deformation in the ferrite facilitate precipitation of secondary phases. As reported elsewhere, the ferritic phases can only take over part of the load due to the formation of new phases and the consequent strengthening, thus providing a relatively constant level in the stress response [16,22].

3.3. Thermomechanical Fatigue

Figure 6 displays the stress responses during TMF tests under IP and OP conditions in the temperature range of 300 to 600 °C. The purple curve represents the stress response of the DSS during TMF IP fatigue testing, while the dark red curve corresponds to the stress amplitude during TMF OP testing. The stress at the upper load reversal point (εpl = +0.2%, T = 600 °C) in the tensile stress regime during the IP TMF test loading exhibits a gradual softening. In contrast, the cyclic deformation curve at the lower load reversal point in the compressive stress regime (εpl = −0.2%, T = 300 °C) reveals initial hardening followed by a plateau. Under OP TMF conditions, the behavior is inverse. Considering the minimum and maximum stress response curves for IP TMF, compressive mean stress evolves. Comparing the results of mean stresses of the two thermomechanical fatigue tests shown in Figure 6, it is visible that the stress response during the OP loading shifts towards a higher tensile stress level. At the end of the TMF OP curve for maximum stress, a rapid drop of the stress amplitude appears. As a result of the high tensile mean stress, the fatigue life during OP testing yields a value of only 1743 cycles, whereas the test in the IP mode was stopped after 2555 cycles without any visible signs of damage.
The results of the TEM analysis after TMF tests in IP and OP mode are presented in Figure 7a,b, respectively. A phase boundary can be seen diagonally in both micrographs. In the upper left half of the figures, ferritic grains in dark contrast can be recognized. The G phase precipitates and the formation of subgrains (visible in Figure A5 and Figure A6) in the ferrite phase were found for both the IP (Figure 7a) and OP (Figure 7b) TMF tests. It should be noted that larger and less frequent G phase precipitates are observable after the TMF test in the IP mode (IP TMF: G phase size 107 ± 24), while in the OP experiment the G phase is slightly smaller but the density is higher (OP TMF: G phase size 67 ± 27 nm). Few dislocations can be identified in the ferritic grain next to the precipitates (Figure A5b). In contrast, a high dislocation density is found in the austenitic grains (Figure 7a,b). In addition to the planar sliding behavior of dislocations, irregular dislocation structures appear in the austenitic grain. Detailed micrographs of the dislocation arrangement and the precipitates are given in Figure A4 (IP condition) and Figure A5 (OP condition).
Considering these findings, a correlation between the mechanical behavior during isothermal and thermomechanical fatigue is drawn. In TMF tests, a hardening at 300 °C and a softening at 600 °C is observed. This correlates well to the isothermal fatigue tests at these temperatures leading to cyclic deformation curves that possess a similar shape. This suggests that the stress response of the thermomechanical IP fatigue test at the upper load reversal point (εpl = +0.2%, T = 600 °C) is governed by the softening typical of the isothermal fatigue at 600 °C, whereas the hardening of the stress response at the lower load reversal point (εpl = −0.2%, T = 300 °C) corresponds to the 300 °C isothermal fatigue test. The initial strain hardening can be attributed to the interaction between nitrides and dislocations (see isothermal fatigue at 300 °C). For the TMF test in the OP mode, the opposite behavior occurs, as the high temperature regime coincides with the compressive stresses and the low temperature regime with the tensile stresses. The different fatigue life of the IP and OP TMF tests can be explained by the different sign of the mean stress (i.e., IP: negative, and OP: positive) as discussed above. Obviously, the mean compressive stress in the IP mode has a positive influence on the fatigue life of the material studied, while the reduced material strength at higher temperature (compression) results in a tensile mean stress in the OP TMF test and therefore decreases the life due to earlier crack initiation.
Taking into account the results from isothermal 300 and 600 °C fatigue tests, it can be concluded that in the low temperature regime of TMF tests, dislocations are created that pile up at precipitates or phase boundaries (Figure 4b), while at higher temperatures recovery processes take place (dislocation reactions and annihilation) (Figure 4c) resulting in a reduction in the dislocation density in ferrite. Due to the high cyclic plastic deformation of the ferrite phase at alternating temperatures of TMF cycling (300–600 °C), a dislocation rearrangement to subgrain forms (cf. Figure A5 and Figure A6). Kolmorgen et al. reported a similar experimental finding and concluded that the fragmentation of ferrite grains into subgrains during TMF experiments results from the superposition of cyclic mechanical and thermal loading [1]. Furthermore, Mateo et al. found that the subgrain formation during thermal cycles is accompanied by spinodal decomposition, which further promotes the formation of the G phase at the subgrains [16]. The formation of the G phase at the subgrain boundaries was also identified in this study (Figure A6b). Similar to the 600 °C isothermal tests, G phase precipitation was also observed in TMF testing, indicating that the temperature range applied lay sufficiently high to allow G phase formation. These observations are in agreement with those in other works [1,16]. It should be noted that the G phase precipitates found after TMF testing were significantly finer as compared to those formed during the isothermal fatigue test at 600 °C (G phase size 434 nm ± 178 nm) (compare Figure 4c and Figure 7) as the average temperature of TMF is lower. A direct comparison of the G phase size formed during TMF in IP and OP TMF modes demonstrates that the larger G phase precipitates were observed after the IP TMF test (compare Figure 7a,b). The G phase precipitates have a longer time to grow due to the longer test duration of the IP TMF experiment in comparison to the corresponding OP test. The time period at high temperatures during TMF testing seems to be not sufficient to form the γ′ austenite that occurs only in the isothermal 600 °C fatigue test (Figure 4c). Finally, the phenomenon of the 475 °C embrittlement was not detected during the TMF tests (in stress responses) in the temperature range between 300 and 600 °C. However, the decomposed structure in the ferrite phase was still present after the TMF experiments (Figure A6). It should be noted that results demonstrated in this work represent post-mortem studies, and the cluster-like ferrite segregation probably occurs during cooling down to room temperature. It should further be stressed that even quenching after the standard heat treatment cannot prevent the spinodal decomposition. These results are consistent with those of Weidner et al. [22] who also did not observe the 475 °C embrittlement during TMF tests of the DSS in the temperature range between 350 and 600 °C as the temporary heating to temperatures above 550 °C counteracts 475 °C embrittlement.

4. Summary

Isothermal (20, 300 and 600 °C) and thermomechanical fatigue tests using the temperature range 300–600 °C were performed on the duplex steel X2CrNiMoN22-5-3 with a plastic-strain amplitude Δεpl/2 = 0.2% and a testing frequency f = 0.0059 Hz. The main results can be summarized as follows:
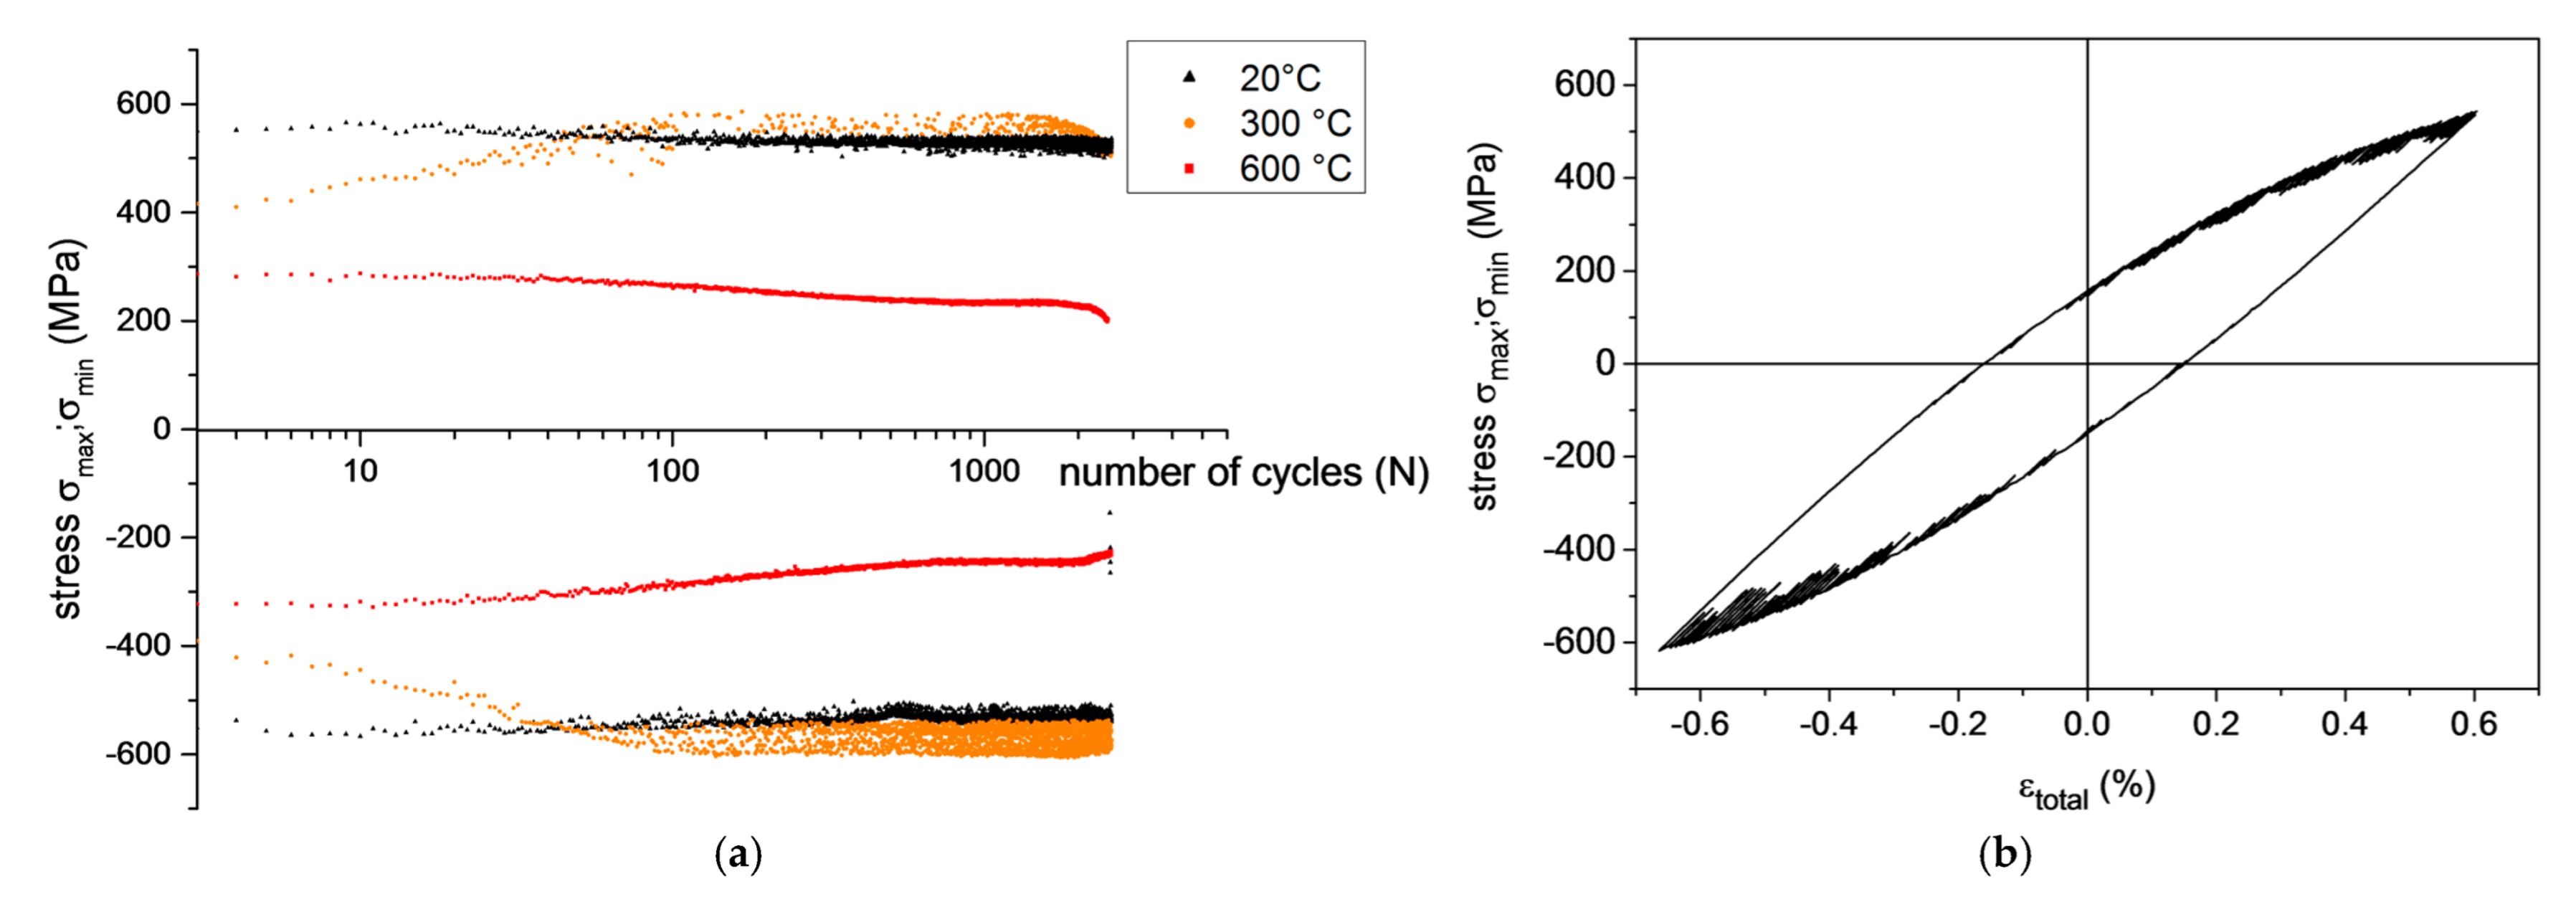
  • Isothermal Fatigue tests at 20 °C: A continuous softening of the duplex steel was observed during room temperature fatigue test. The austenite phase exhibits a pronounced planar slip behavior.
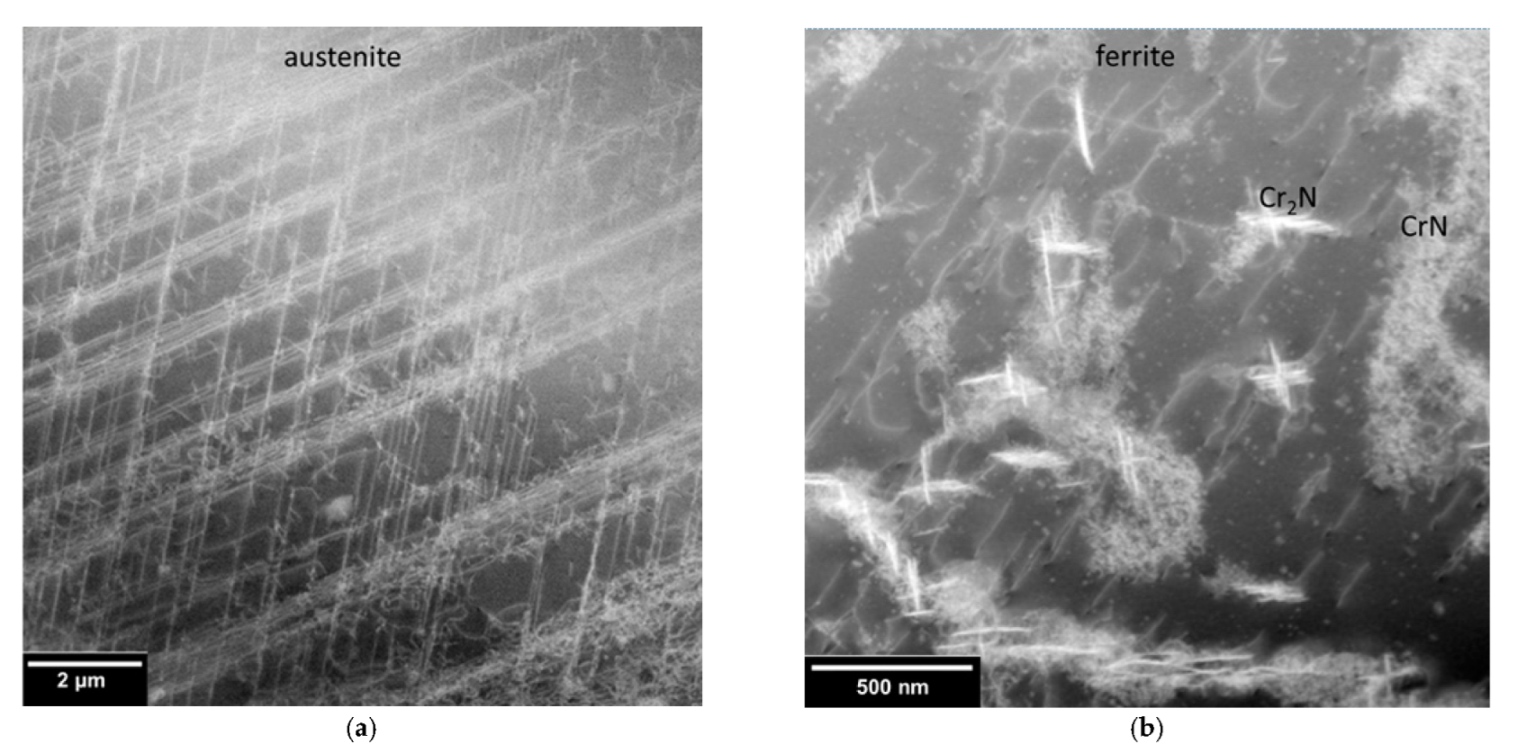
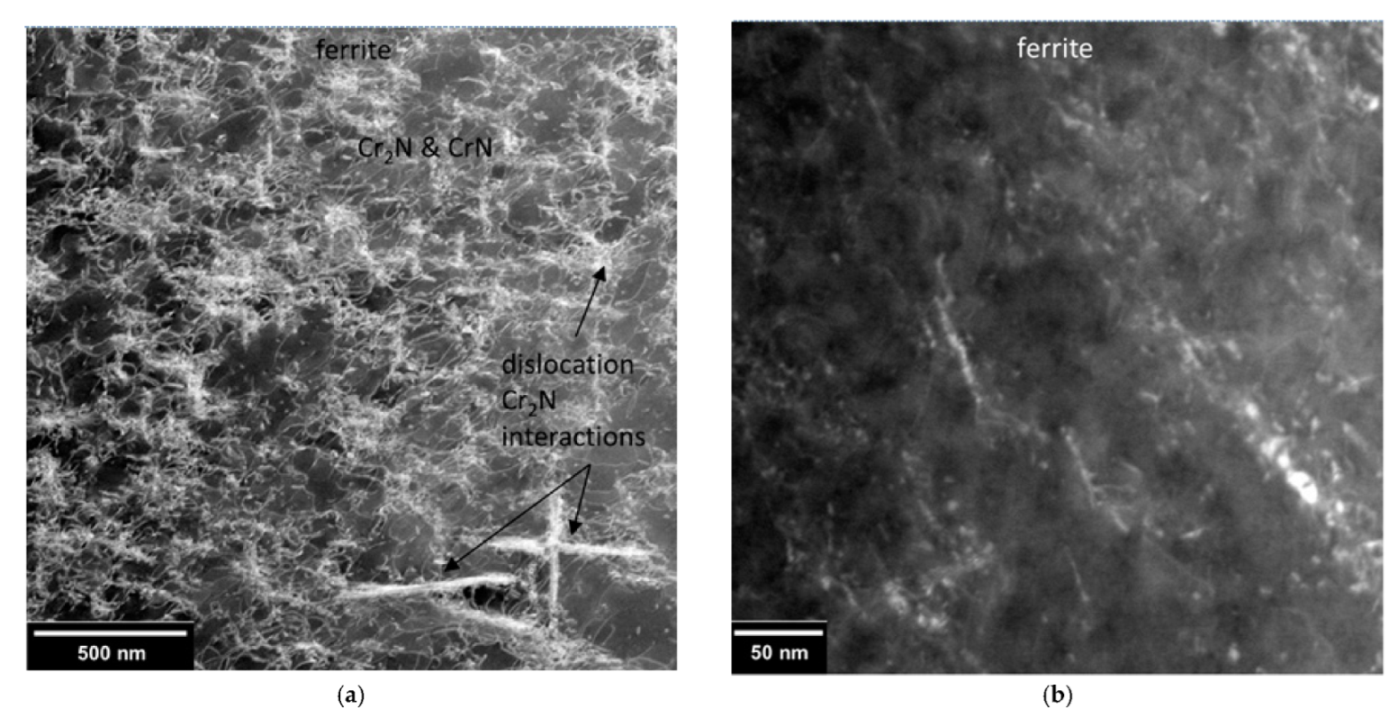
  • Isothermal Fatigue tests at 300 °C: A pronounced primary hardening was observed, which is caused by the interaction between dislocations and nitrides. Planer slip prevails in the austenitic grains.
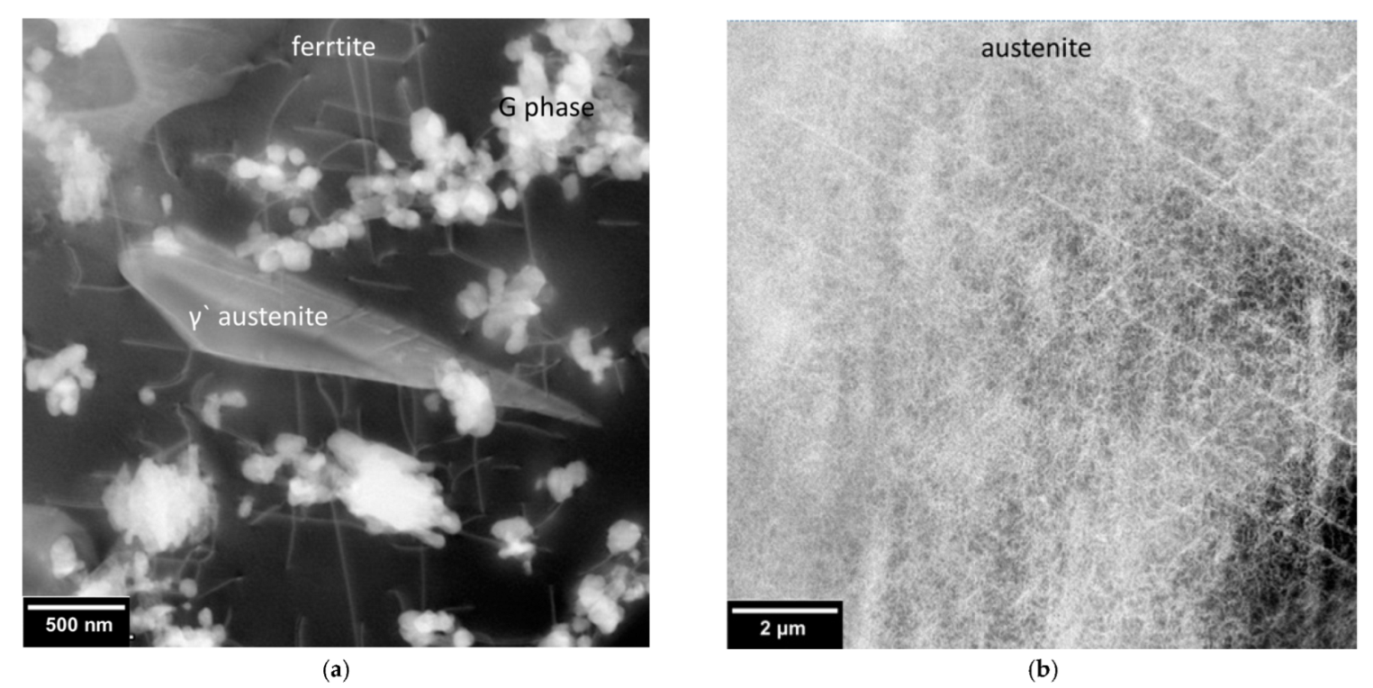
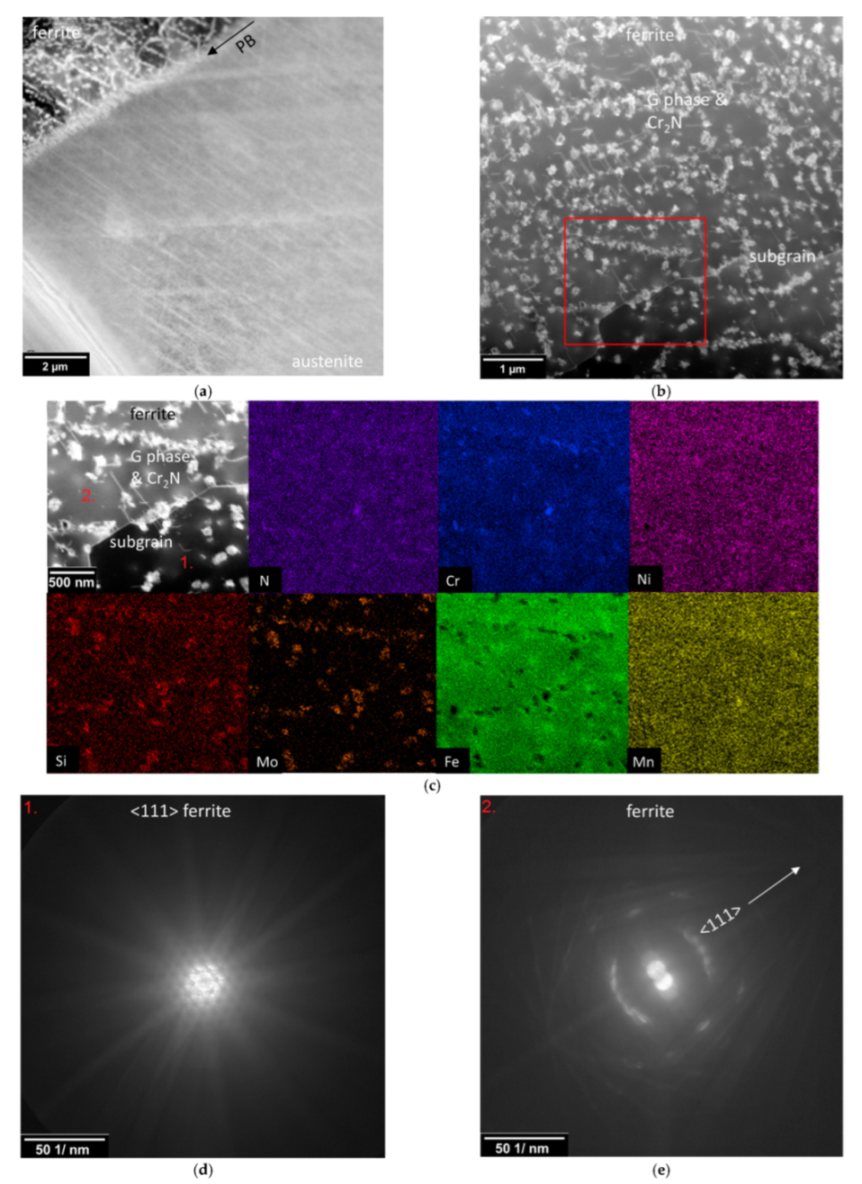
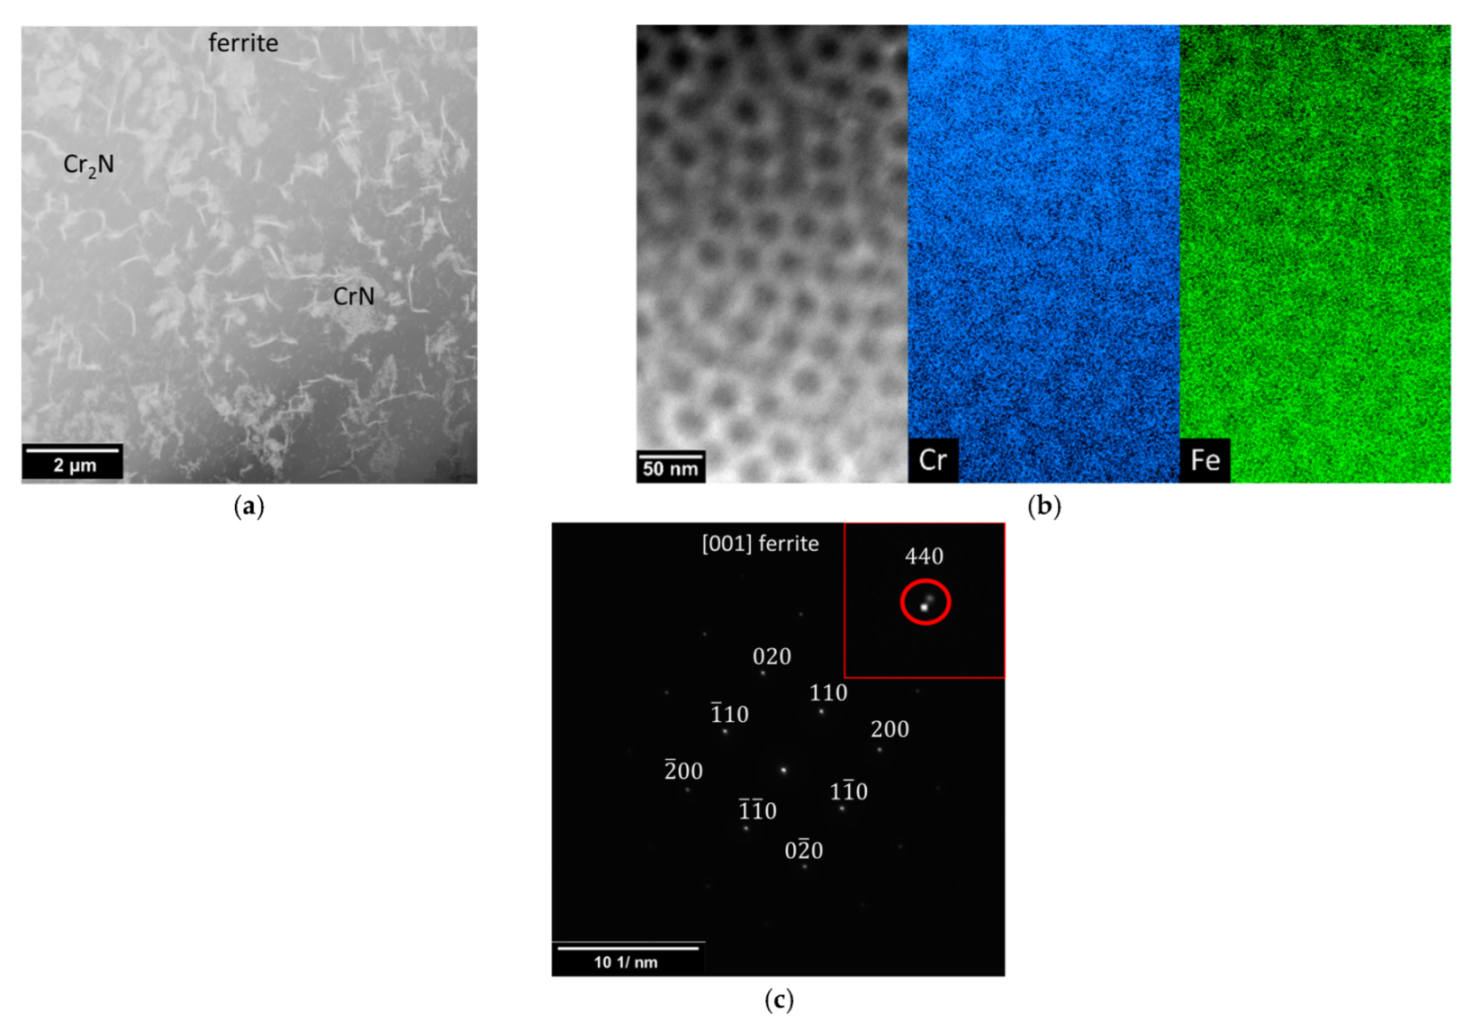
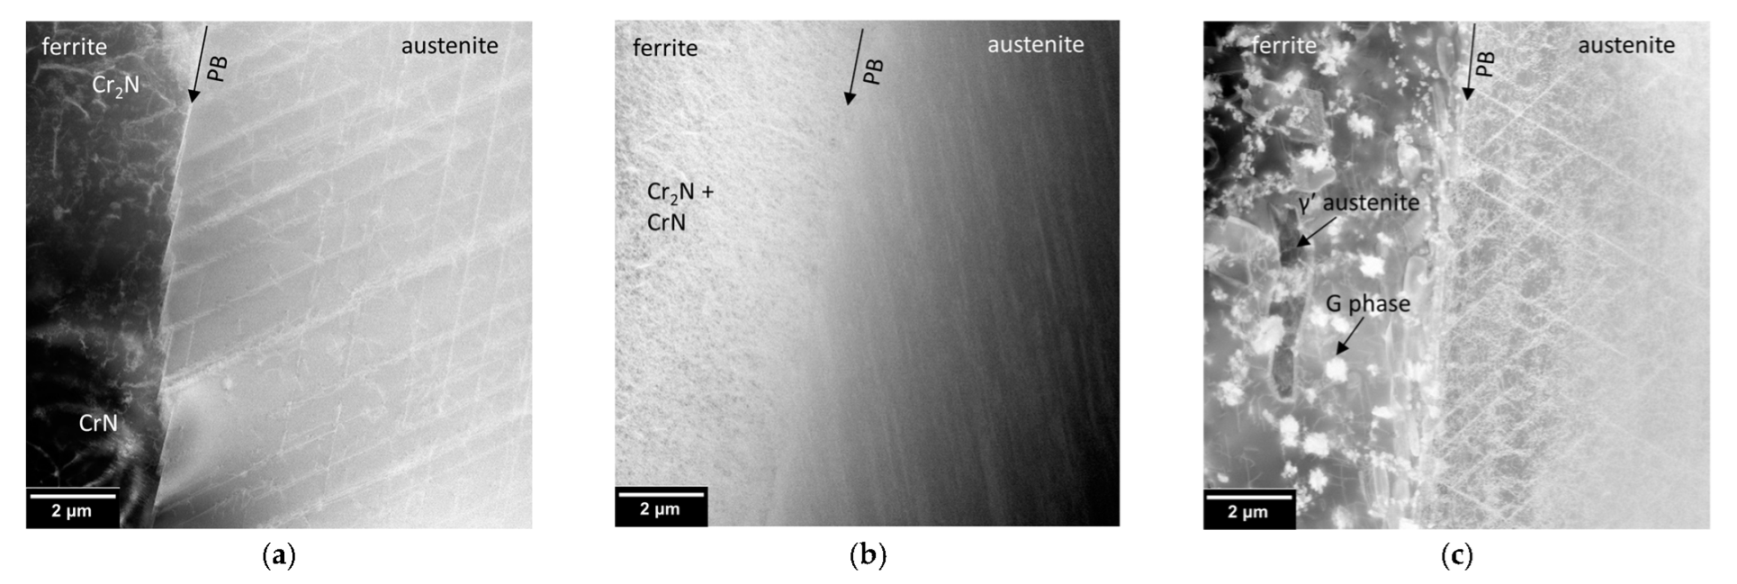
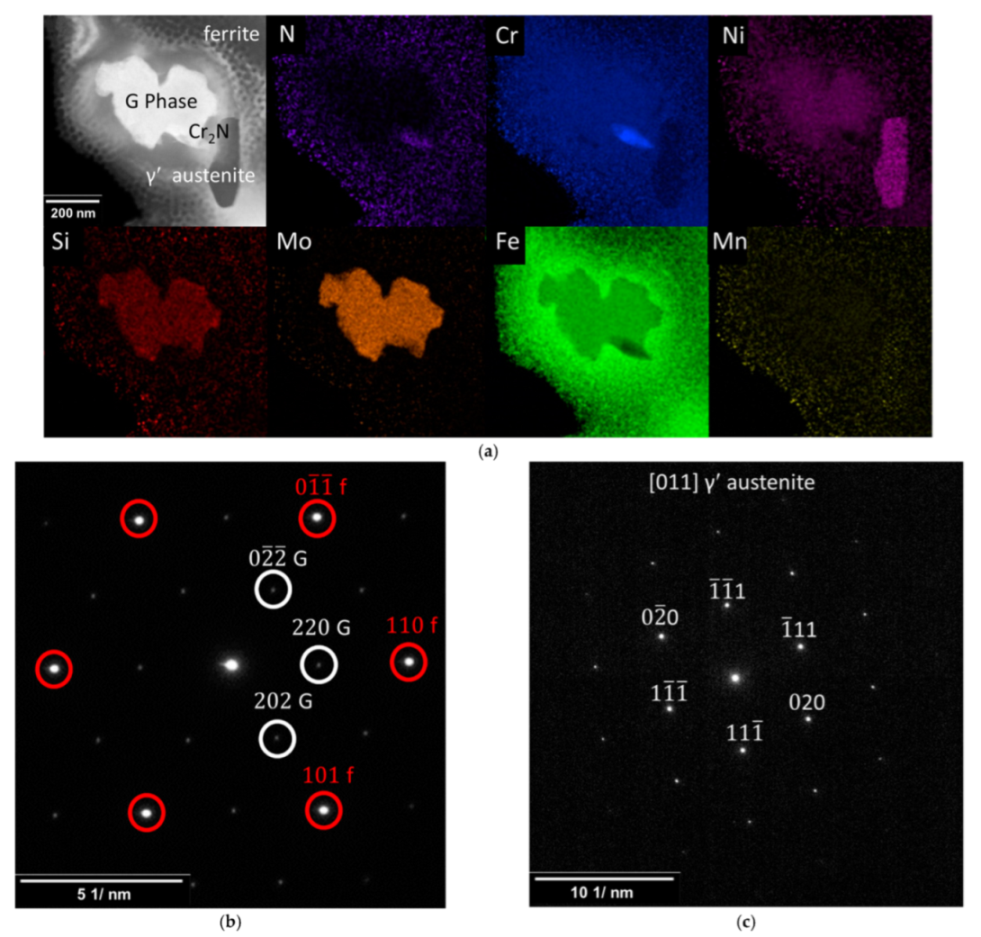
  • Isothermal Fatigue tests at 600 °C: The cyclic stress amplitude during the isothermal fatigue test is at a low level. The material studied exhibits softening throughout the whole fatigue test. A further precipitation of chromium nitrides as well as the formation of the G phase and secondary γ′ austenite leads to a significant change in the microstructure of the ferritic grains. The low dislocation density observed in the ferrite phase is attributed to pronounced recovery processes. In the austenitic grains, a more irregular and wavy dislocation arrangement prevails.
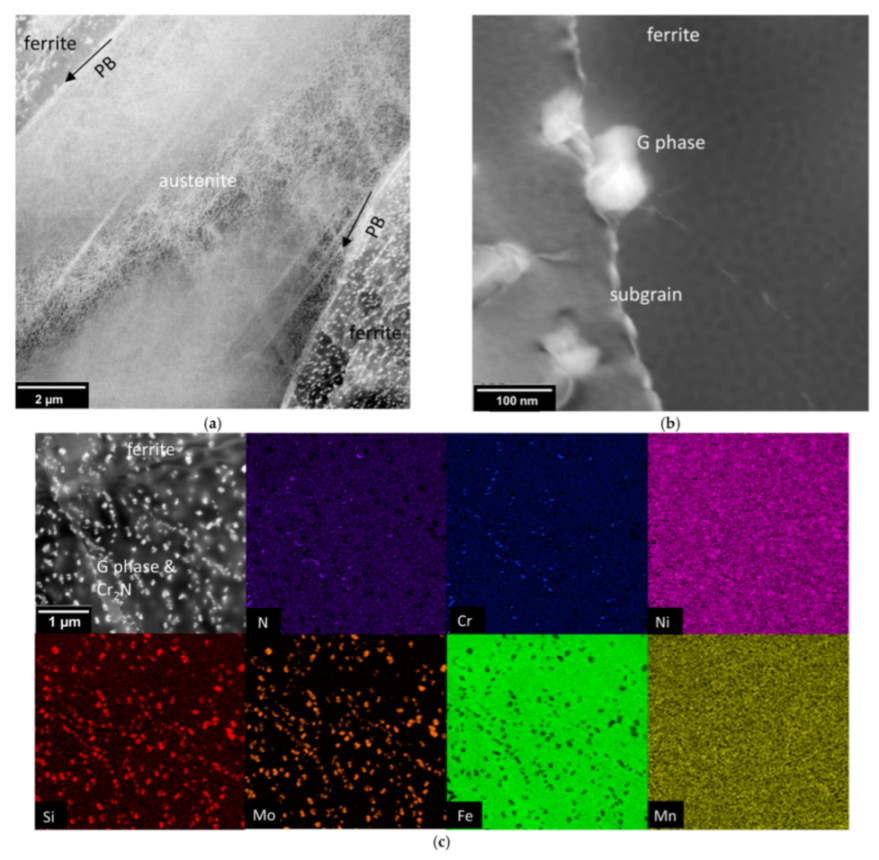
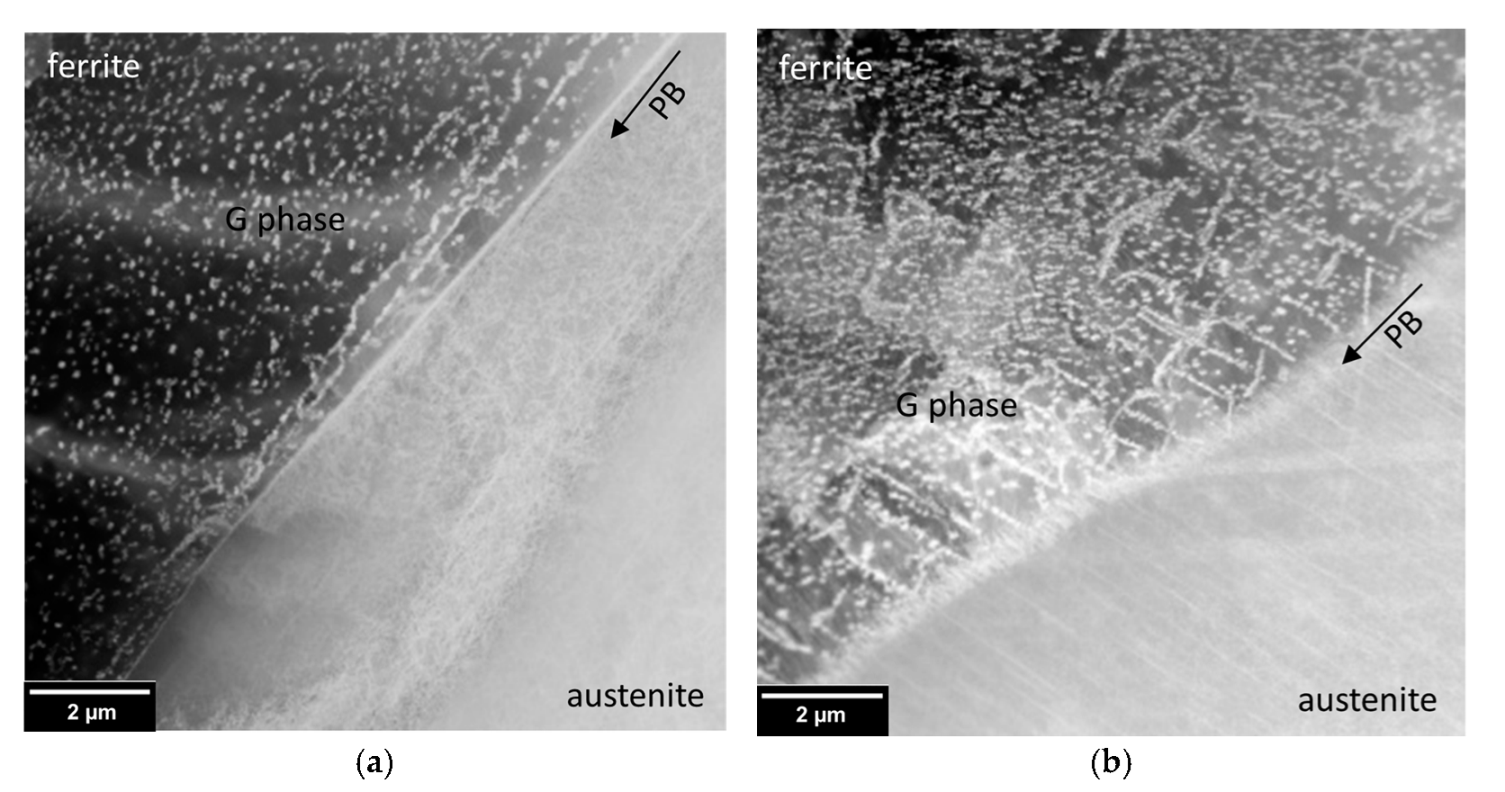
  • IP TMF: During TMF loading in the IP mode a negative mean stress results, which has a positive effect on fatigue life. The cyclic behavior in the stress response of the TMF test can be correlated with the corresponding stress responses of the isothermal fatigue tests at 300 and 600 °C. Furthermore, initial cyclic hardening (300 °C) can be attributed to interaction between nitrides and dislocations (DSA). While a significant amount of the G phase was found in ferrite, no secondary γ′ austenite was observed. Additionally, the formation of subgrains in the ferrite was observed. The plastic deformation of the austenitic grains results in an unordered dislocation arrangement.
  • OP TMF: TMF in the OP mode results in a tensile mean stress, which leads to premature failure. A comparison of the stress response of OP and IP TMF clearly shows a very similar behavior. Analogously to the corresponding TMF test in IP mode, secondary γ′ austenite does also not form under OP conditions. The main microstructural difference caused by the T-εpl-phasing seem to be the finer morphology of the G phase precipitates.

Author Contributions

Conceptualization, A.O. and H.-J.C.; methodology, S.S., J.M. and A.O.; validation, A.O., H.-J.C. and B.B.; investigation, S.S., J.M. and A.O.; resources, H.-J.C., A.O. and B.G.; data curation, S.S. and A.O.; writing—original draft preparation, S.S.; writing—review and editing, S.S., J.M., A.O., B.G., B.B. and H.-J.C.; visualization, S.S. and J.M.; supervision, H.-J.C., A.O. and B.G.; project administration, H.-J.C. and A.O.; All authors have read and agreed to the published version of the manuscript.

Funding

This research received no external funding. Internal funding was received by Universität Siegen (UoS).

Institutional Review Board Statement

Not applicable.

Informed Consent Statement

Not applicable.

Data Availability Statement

The data that support the finding of this study are available from the corresponding author upon reasonable request.

Acknowledgments

Part of this work was performed at the Micro- and Nanoanalytics Facility (MNaF) of the University of Siegen. We acknowledge support by the KIT-Publication Fund of the Karlsruhe Institute of Technology.

Conflicts of Interest

The funder (UoS) had no role in the design of the study; in the collection, analyses, or interpretation of data; in the writing of the manuscript or in the decision to publish the results. The authors declare no conflict of interest.

Appendix A

Figure A1. EBSD Crystallographic orientation—inverse pole figure coloring map for austenite (a) and ferrite (b) of the hot-rolled DSS X2CrNIMoN22-5-3 after heat treatment.
Metals 12 01161 g0a1
Figure A2. Detailed STEM images of the dislocation arrangement in an austenitic (a) and a ferritic grain (b) after isothermal fatigue at 20 °C.
Metals 12 01161 g0a2
Figure A3. (a,b) detailed STEM images of the dislocation arrangement and precipitates in the ferrite after isothermal fatigue at 300 °C.
Metals 12 01161 g0a3
Figure A4. Detailed STEM images of the dislocation arrangement in a ferritic (a) and an austenitic grain (b) after isothermal fatigue at 600 °C.
Metals 12 01161 g0a4
Figure A5. Detailed STEM images of the dislocation arrangement in austenite (a) and ferrite (b) and STEM-ADF image of precipitates in ferrite and (c) the corresponding EDX mapping of the highlighted area in (b) of the elements N, Cr, Ni, Si, Mo, Fe and Mn after thermomechanical fatigue in IP condition. (d,e): Diffraction pattern on the CETA camera in STEM mode of the marked locations in (c) (1. corresponds to (d), 2. corresponds to (e)). Serval degrees of tilt difference between (d) in ferrite <111> ZA and (e).
Metals 12 01161 g0a5
Figure A6. Detailed STEM images of the dislocation arrangement in austenite (a), and precipitates in ferritic grain (b,c) STEM-ADF image of precipitates in ferrite and the corresponding EDX mapping of the elements N, Cr, Ni, Si, Mo, Fe and Mn after thermomechanical fatigue in OP condition.
Metals 12 01161 g0a6
Table A1. Yield strength R0.2, max. tensile strength Rm and the elongation at fracture A of isothermal monotonic tensile tests at a strain rate of 1 × 10⁻⁴ s−1 of DSS 1.4462 at 20, 300 and 600 °C [29].
Temperature (°C)20300600
R0.2 (MPa)490330250
Rm (MPa)730680350
A (%)422827

References

  1. Kolmorgen, R.; Biermann, H. Thermo mechanical fatigue behaviour of a duplex stainless steel in the range of 350–600 °C. Int. J. Fatigue 2014, 65, 2–8. [Google Scholar] [CrossRef]
  2. Nani Babu, M.; Sasikala, G.; Shashank Dutt, B.; Venugopal, S.; Albert, S.K.; Bhaduri, A.K.; Jayakumar, T. Investigation on influence of dynamic strain ageing on fatigue crack growth behaviour of modified 9Cr–1Mo steel. Int. J. Fatigue 2012, 43, 242–245. [Google Scholar] [CrossRef]
  3. Avalos, M.; Alvarez-Armas, I.; Armas, A.F. Dynamic strain aging effects on low-cycle fatigue of AISI 430F. Mater. Sci. Eng. A 2009, 513–514, 1–7. [Google Scholar] [CrossRef]
  4. Kolmorgen, R.; Biermann, H. Thermo-mechanical fatigue behaviour of a duplex stainless steel. Int. J. Fatigue 2012, 37, 86–91. [Google Scholar] [CrossRef]
  5. Tsuzaki, K.; Hori, T.; Maki, T.; Tamura, I. Dynamic strain aging during fatigue deformation in type 304 austenitic stainless steel. Mater. Sci. Eng. 1983, 61, 247–260. [Google Scholar] [CrossRef]
  6. Gironès, A.; Llanes, L.; Anglada, M.; Mateo, A. Dynamic strain ageing effects on superduplex stainless steels at intermediate temperatures. Mater. Sci. Eng. A 2004, 367, 322–328. [Google Scholar] [CrossRef]
  7. Wackermann, K.; Christ, H.-J. Identifying the effect of 475 °C embrittlement on the cyclic stress-strain response of duplex stainless steel by means of the change in the yield stress distribution. Adv. Mater. Res. 2014, 891–892, 458–463. [Google Scholar] [CrossRef]
  8. Sahu, J.K.; Krupp, U.; Ghosh, R.N.; Christ, H.-J. Effect of 475 °C embrittlement on the mechanical properties of duplex stainless steel. Mater. Sci. Eng. A 2009, 508, 1–14. [Google Scholar] [CrossRef]
  9. Cortie, M.B.; Pollak, H. Embrittlement and aging at 475 °C in an experimental ferritic stainless steel containing 38 wt.% chromium. Mater. Sci. Eng. A 1995, 199, 153–163. [Google Scholar] [CrossRef]
  10. Llanes, L.; Mateo, A.; Violan, P.; Méndez, J.; Anglada, M. On the high cycle fatigue behavior of duplex stainless steels: Influence of thermal aging. Mater. Sci. Eng. A 1997, 234–236, 850–852. [Google Scholar] [CrossRef]
  11. Tavares, S.S.M.; de Noronha, R.F.; da Silva, M.R.; Neto, J.M.; Pairis, S. 475 °C Embrittlement in a duplex stainless steel UNS S31803. Materials Res. 2001, 4, 237–240. [Google Scholar] [CrossRef] [Green Version]
  12. Weng, K.L.; Chen, H.R.; Yang, J.R. The low-temperature aging embrittlement in a 2205 duplex stainless steel. Mater. Sci. Eng. A 2004, 379, 119–132. [Google Scholar] [CrossRef]
  13. Wackermann, K. Einfluss einer zyklischen Belastung auf die Versprödungskinetik von Legierungen am Beispiel der 475 °C-Versprödung von Duplexstahl und der Dynamischen Versprödung einer Nickelbasislegierung. Ph.D. Thesis, University of Siegen, Siegener Werkstoffkundliche Berichte, Siegen, Germany, July 2015. Available online: https://nbn-resolving.org/urn:nbn:de:hbz:467-9717 (accessed on 19 May 2022).
  14. Sahu, J.K. Effect of 475 °C Embrittlement on the Fatigue Behaviour of a Duplex Stainless Steel. Ph.D. Thesis, University of Siegen, Siegener Werkstoffkundliche Berichte, Siegen, Germany, October 2008. Available online: Https://nbn-resolving.org/urn:nbn:de:hbz:467-3774 (accessed on 19 May 2022).
  15. Gunn, R. Duplex Stainless Steels: Microstructure, Properties and Applications, 1st ed.; Woodhead Publishing Series in Metals and Surface Engineering: Cambridge, UK, 1997; pp. 94–104. [Google Scholar]
  16. Mateo, A.; Llanes, L.; Anglada, M.; Redjaimia, A.; Metauer, G. Characterization of the intermetallic G-phase in an AISI 329 duplex stainless steel. J. Mater. Sci. 1997, 32, 4533–4540. [Google Scholar] [CrossRef]
  17. Matsukawa, Y.; Takeuchi, T.; Kakubo, Y.; Suzudo, T.; Watanabe, H.; Abe, H.; Toyama, T.; Nagai, Y. The two-step nucleation of G-phase in ferrite. Acta Mater. 2016, 116, 104–113. [Google Scholar] [CrossRef]
  18. Tang, X. Sigma Phase Characterization in AISI 316 Stainless Steel. Microsc. Microanal. 2005, 11, 78–79. [Google Scholar] [CrossRef] [Green Version]
  19. Magnabosco, R. Kinetics of sigma phase formation in a Duplex Stainless Steel. Mater. Res. 2009, 12, 321–327. [Google Scholar] [CrossRef] [Green Version]
  20. Armas, A.F.; Petersen, C.; Schmitt, R.; Avalos, M.; Alvarez-Armas, I. Mechanical and microstructural behaviour of isothermally and thermally fatigued ferritic/martensitic steels. J. Nucl. Mater. 2002, 307–311, 509–513. [Google Scholar] [CrossRef]
  21. Krupp, U.; Söker, M.; Giertler, A.; Dönges, B.; Christ, H.-J.; Wackermann, K.; Boll, T.; Thuvander, M.; Marinelli, M.C. The potential of spinodal ferrite decomposition for increasing the very high cycle fatigue strength of duplex stainless steel. Int. J. Fatigue 2016, 93, 363–371. [Google Scholar] [CrossRef]
  22. Weidner, A.; Kolmorgen, R.; Kubena, I.; Kulawinski, D.; Kruml, T.; Biermann, H. Decomposition and precipitation process during thermo-mechanical fatigue of duplex stainless steel. Metall. Mater. Trans. A 2016, 47, 2112–2124. [Google Scholar] [CrossRef]
  23. Dönges, B.; Fritzen, C.P.; Christ, H.J. Experimental Investigation and Simulation of the Fatigue Mechanisms of a Duplex Stainless Steel under HCF and VHCF Loading Conditions. Key Eng. Mater. 2015, 664, 267–274. [Google Scholar] [CrossRef]
  24. Bauer, V. Verhalten Metallischer Konstruktionswerkstoffe unter Thermomechanischer Belastung—Experimentelle Charakterisierung und Modellmäßige Beschreibung. Ph.D. Thesis, University of Siegen, Berichte aus der Werkstofftechnik, Shaker Verlag, Aachen, Germany, July 2007. [Google Scholar]
  25. Chan, K.W.; Tjong, S.C. Effect of secondary phase precipitation on the corrosion behavior of duplex stainless steels. Materials 2014, 7, 5268–5304. [Google Scholar] [CrossRef] [PubMed] [Green Version]
  26. Sicupira, D.C.; Cardoso Junior, R.; Bracarense, A.Q.; Frankel, G.S.; Lins, V.d.F.C. Cyclic polarization study of thick welded joints of lean duplex stainless steel for application in biodiesel industry. Mater. Res. 2017, 20, 161–167. [Google Scholar] [CrossRef] [Green Version]
  27. Holländer Pettersson, N.; Lindell, D.; Lindberg, F.; Borgenstam, A. Formation of chromium nitride and intragranular austenite in a super duplex stainless steel. Metall. Mater. Trans. A 2019, 50, 5594–5601. [Google Scholar] [CrossRef] [Green Version]
  28. Zhou, J.; Odqvist, J.; Höglund, L.; Thuvander, M.; Barkar, T.; Hedström, P. Initial clustering—A key factor for phase separation kinetics in Fe–Cr-based alloys. Scr. Mater. 2014, 75, 62–65. [Google Scholar] [CrossRef]
  29. Kolmorgen, R. Das Thermomechanische Ermüdungsverhalten eines Ferritisch-Austenitischen Duplexstahls im Temperaturbereich 100 °C bis 600 °C. Ph.D. Thesis, Technische Universität Bergakademie Freiberg Papierflieger Verlag GmbH, Clausthal-Zellerfeld, Germany, November 2020. [Google Scholar]
  30. Kolmorgen, R.; Weidner, A.; Biermann, H. Deformation and microstructure evolution of a duplex stainless steel under out-of-phase thermo-mechanical fatigue. Mater. High Temp. 2013, 30, 77–82. [Google Scholar] [CrossRef]
  31. Duber, O.; Kunkler, B.; Krupp, U.; Christ, H.-J.; Fritzen, C. Experimental characterization and two-dimensional simulation of short-crack propagation in an austenitic–ferritic duplex steel. Int. J. Fatigue 2006, 28, 983–992. [Google Scholar] [CrossRef]
  32. Hereñú, S.; Alvarez-Armas, I.; Armas, A.F. The influence of dynamic strain aging on the low cycle fatigue of duplex stainless steel. Scr. Mater. 2001, 45, 739–745. [Google Scholar] [CrossRef]
  33. Villanueva, D.M.E.; Junior, F.C.P.; Plaut, R.L.; Padilha, A.F. Comparative study on sigma phase precipitation of three types of stainless steels: Austenitic, superferritic and duplex. Mater. Sci. Technol. 2006, 22, 1098–1104. [Google Scholar] [CrossRef]
  34. Zhang, J.-S. High Temperature Deformation and Fracture of Materials, 1st ed.; Elsevier: Sawston, Cambridge, UK, 2010; pp. 359–365. [Google Scholar]
  35. Heumann, T. Diffusion in Metallen: Grundlagen, Theorie, Vorgänge in Reinmetallen und Legierungen, 1st ed.; Springer: Berlin/Heidelberg, Germany, 1992; pp. 128–135. [Google Scholar]
  36. Miller, M.K.; Bentley, J. APFIM and AEM investigation of CF8 and CF8M primary coolant pipe steels. Mater. Sci. Technol. 1990, 6, 285–292. [Google Scholar] [CrossRef]
Figure 1. Microstructure of the hot-rolled DSS X2CrNiMoN22-5-3 after heat treatment. (a) Optical microscope image (bright gray: ferrite, dark gray: austenite), (b) EBSD phase map (red: ferrite austenite, green: austenite), (c) BSE-SEM image and the corresponding EDX mapping of the elements Ni, Cr and Mo. (bright gray: austenite; dark gray: ferrite).
Metals 12 01161 g001
Figure 2. TEM analyses of the ferrite phase of the DSS after heat treatment. (a) HAADF-STEM image of a ferritic grain showing Cr2N and CrN phases that appear as bright contrast. (b) HAADF-STEM image of ferrite and the corresponding EDX mapping of the elements Fe and Cr, (c) SAD pattern taken close to the [001] zone axis. The inset indicates the splitting of the diffraction spot [440] due to spinodal decomposition.
Metals 12 01161 g002
Figure 3. (a) Cyclic stress response curves of isothermal fatigue tests (20, 300 and 600 °C) carried out under plastic-strain control at a plastic-strain amplitude of 0.2% (f = 0.0059 Hz); (b) exemplary single stress–total strain hysteresis loop of the 800th cycle of the isothermal test at 300 °C.
Metals 12 01161 g003
Figure 4. ADF-STEM images of the DSS after isothermal fatigue at (a) 20, (b) 300 and (c) 600 °C (PB marks the phase boundaries).
Metals 12 01161 g004
Figure 5. Detailed STEM images of the ferritic grain after isothermal fatigue at 600 °C. (a) HAADF-STEM image of the G phase, Cr2N and γ′ austenite in a ferritic grain and the corresponding EDX mapping of the elements N, Cr, Ni, Si, Mo, Fe and Mn. Point EDX analysis data of the phases are given in Table 2. (b) SAD image of the G phase and the ferrite matrix along [ 1 ¯ 11 ] G/ [ 1 ¯ 11 ] α zone axis. (c) SAD image of γ′ austenite at [011] zone axis.
Metals 12 01161 g005
Figure 6. Cyclic stress response curves during thermomechanical fatigue tests (IP TMF and OP TMF) under plastic-strain control at Δεpl/2 = 0.2% (f = 0.059 Hz) in the temperature range of 300 to 600 °C.
Metals 12 01161 g006
Figure 7. ADF-STEM images of the microstructure and the dislocation arrangement after thermomechanical fatigue in the temperature range from 300 to 600 °C in (a) IP condition and (b) OP condition. G phase appears in small white particles.
Metals 12 01161 g007
Table 1. Chemical composition of the DSS X2CrNiMoN22-5-3 determined by spark spectroscopy analyses (wt.%) and the nominal composition according to SAF 2205® AISI 318 LN.
CompositionChemical Composition (wt.%)
CSiMnPSCrNiMoNFe
nominal≤0.03≤1.0≤2.0≤0.035≤0.01521–234.5–6.52.5–3.50.1–0.22Bal.
measured0.029 ± 0.010.403 ± 0.081.68 ± 0.030.013 ± 0.0010.0035 ± 0.000221.88 ± 0.314.65 ± 0.063.34 ± 0.020.163 ± 0.08Bal.
Table 2. Chemical composition of the phases after isothermal fatigue at 600 °C determined by STEM-EDX analyses (wt.%).
ElementSiCrMnFeNiMo
γ austenite0.22 ± 0.0220.08 ± 3.411.8 ± 0.368.4 ± 11.26.26 ± 1.032.51 ± 0.4
γ′ austenite0.18 ± 0.0217.94 ± 2.962.03 ± 0.1770.66 ± 11.669.11 ± 1.511.09 ± 0.18
α/α′ ferrite0.28 ± 0.0323.79 ± 3.881.55 ± 0.2566.41 ± 10.824.05 ± 0.663.92 ± 0.62
G phase1.10 ± 0.0820.08 ± 3.161.66 ± 0.2540.36 ± 6.134.85 ± 0.5131.24 ± 4.8
Publisher’s Note: MDPI stays neutral with regard to jurisdictional claims in published maps and institutional affiliations.

