Abstract
The CO2 emissions of electric arc furnaces (EAFs) can be reduced by decreasing the electrical energy consumed in the melting of iron scraps by utilizing chemical energy. In general, the chemical energy efficiency of the EAF process can be improved using oxidation reaction heat and carbon combustion. When carbon is added to molten steel, it is not completely dissolved because of its high melting point, and it floats to the slag layer, owing to its low density. Al dross is a byproduct of aluminum smelting, and it contains over 27 mass% metallic aluminum. As the exothermic heat of aluminum oxidation is larger than that of carbon oxidation, the Al dross is a useful source of exothermic heat in the EAF process. In this study, to utilize the mixtures of cokes and Al dross as chemical energy sources in the EAF process, we investigated the dissolution concentrations, dissolution ratios, and dissolution rate constants of carbon and aluminum in molten steel. The improvement in the molten steel temperature was investigated by blowing dry air into the melt after the dissolution of the mixtures of cokes and Al dross.
1. Introduction
It is important to reduce CO2 emissions in order to achieve a sustainable society. Numerous studies have investigated eco-friendly energy resources to reduce the consumption of fossil fuels [1,2]. Among domestic industries in Korea, the steel industry generated approximately 23% of CO2 emissions in 2017 [3]. In the global steel industry, ~65% of steel is produced using blast furnaces and converters, and blast furnaces account for ~70% of CO2 emissions. A process that uses hydrogen resources and direct reduced iron (DRI) has been proposed to reduce CO2 emissions in the steel industry. The electric arc furnace (EAF) process is required to produce high-grade steel products using DRI [4].
The CO2 emissions of the EAF process can be decreased by reducing the use of electric energy and improving the efficiency of chemical energy. In Korea, domestic EAF companies produce steel products using ~63% electrical energy, ~30% chemical energy, and ~3% burner combustion heat. Electrical energy is primarily consumed for melting the scrap in the EAF process, and over 50% of it is produced using coal and oil in Korea, which causes CO2 emissions [5]. Therefore, it is necessary to improve the efficiency of chemical energy consumption by utilizing raw materials that contain high thermal energy and oxidation reaction heat by blowing oxygen.
Generally, coke added to the EAF process contains more than ~80% carbon, which is used as a slag-forming material through its reaction with oxygen. Carbon generates more energy in the second combustion compared to the first combustion. However, most of the carbon material floats in a slag layer, owing to its low density. In addition, carbon cannot be dissolved over a relatively short operation time, owing to its high melting point.
Over the past several decades, the dissolution behaviors and thermodynamic data of carbon-based materials have been extensively investigated to improve the steelmaking technology using carbon materials. Matoba et al. investigated the equilibrium of carbon and oxygen in a liquid Fe-C alloy using a graphite crucible and CO gas at 1573–1873 K. Based on the Boudouard equilibrium, they obtained an empirical formula for the activity coefficients of C and O in molten steel [6]. Kim et al. investigated the carbon solubility in various liquid iron alloys, including V, Mo, and Ni, under an Ar atmosphere at 1873 K. They determined the effect of the interaction parameters of V, Mo, and Ni on the activity coefficient of carbon in carbon-saturated iron alloys [7]. Furthermore, the effect of the sulfur content in molten iron alloys on the solubility of graphite was investigated at 1473–1973 K [8,9]. As temperature increased, the solubility of carbon in steel increased and the sulfur content decreased. Cham et al. investigated the dissolution behaviors of two Australian cokes in molten steel at 1723–1823 K. They found that temperature had a significant effect on the dissolution rates of cokes. In addition, the difference between the dissolution rates of cokes was attributed to the different compositions of mineral matter in the coke, which limited the interfacial contact area between the carbon source and molten iron [10]. Jang et al. found that an ash layer that accumulated on the surface of cokes considerably reduced the contact area between cokes and molten steel, thereby decreasing the dissolution rates of carbon [11]. Even though the use of the carbon technology in the steel industry provides superior results, the considerable amounts of carbon materials used in the steelmaking process cause CO2 emissions. Thus, it is necessary to find appropriate materials to partly replace carbon and reduce CO2 emissions in the steel industry.
Al dross, which is a by-product of Al smelting, contains approximately 27 mass% metallic aluminum, whose oxidation heat is approximately 3 times higher than that of carbon. Approximately 60,000 tons of Al dross is produced annually in Korea and 800,000 tons in the United States [12,13,14]. Al dross is almost entirely landfilled because practical recycling methods have not been established [15]. One of the recycling methods for Al dross is the use of additives for reduction and heating resources in the steelmaking process because of the metallic aluminum content in Al dross. Kim et al. investigated the effect of a mixture of Al dross and graphite powder on iron reduction in EAF slag. When Al dross was added at 5% of the slag weight, the reduction rate of iron in the slag was 2.5 times higher than that obtained using only the graphite powder [16]. Even though the Al dross is useful for the reduction of FeO from slag, the sources of oxidation heat in the dissolution of Al dross in molten steel have not been investigated.
In this study, the dissolution of Al dross was investigated in order to improve the molten steel temperature using the oxidation heat of metallic aluminum to utilize an Al dross as a chemical energy source in the EAF process. The coke and the Al dross were mixed, and the effect of the mixing ratio and molten steel temperature on the concentration, dissolution ratio, and dissolution rate constants of carbon and aluminum in molten steel were investigated. Furthermore, the temperature changes in molten steel due to blowing dry air into the melt were examined after the dissolution of the mixture of coke and the Al dross.
2. Experimental Method
2.1. Dissolution of Al Dross and Cokes in Molten Steel
The components of coke particles and Al dross were obtained using proximate and ICP analyses. Table 1 and Table 2 list the compositions of the cokes and Al dross, respectively. The metallurgical cokes contained 86.06 mass% C and 10.91 mass% ash. The Al dross contained approximately 27 mass% metallic Al, 7 mass% SiO2, and 65 mass% Al2O3. As the amount of the coke and Al dross mixture increases, the ash, SiO2, and Al2O3 can affect the slag composition. This effect was reduced by setting the amount of the mixture as 5 mass% of the total iron mass. The particle sizes of the coke and Al dross were less than 150 μm, and the total weight of iron was approximately 90 g.

Table 1.
Coke components obtained using proximate analysis (mass%).

Table 2.
Composition of Al dross obtained using ICP analysis (mass%).
Figure 1 shows a schematic of the induction furnace used for the dissolution of Al dross and cokes in molten steel. First, flake-type electrolytic iron was charged into an Al2O3 crucible with a diameter of 35 mm. The mixture of the coke and Al dross was charged into an iron crucible with a diameter of 20 mm, and then, electrolytic iron was placed in the prepared iron crucible. Table 3 shows the mass ratio of the coke and Al dross mixtures. C/Al represents the ratio of carbon to aluminum in the mixture. The prepared Al2O3 crucible with the samples was covered with a graphite crucible and protection crucible. The oxidation of iron, carbon, and aluminum during the dissolution experiments was prevented through deoxidized Ar gas flow at 500 mL/min. The deoxidation treatment with Ar gas was carried out at 773 K using Mg chips.
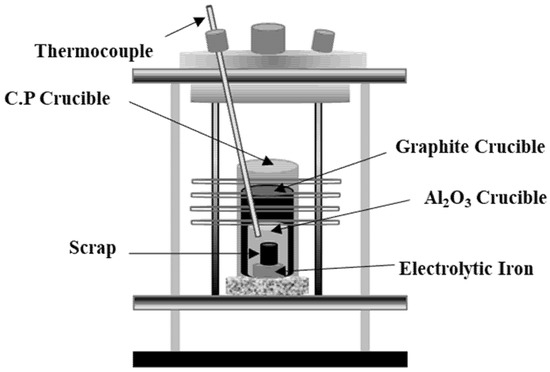
Figure 1.
Schematic of induction furnace.

Table 3.
Mass ratio of coke and Al dross mixtures.
The temperature of the molten steel was measured using a B-type thermocouple, and the reaction temperatures were 1823 K, 1873 K, and 1973 K. The time required to achieve the target temperature was maintained as constant at 1 h. The initial time immediately after achieving the target temperature was set as “0”. The reaction times were 600 s, 1800 s, 3600 s, and 7200 s, and the crucible with the sample was removed and water quenched at each time stamp. The concentrations of carbon and aluminum in the obtained metal were measured using C/S analysis (CS-2000, ELTRA, Haan, Germany) and ICP-OES (Inductively Coupled Plasma Optical Emission Spectroscopy, since here, regarding as ICP) analysis (Optima 5300 DV, Perkin Elmer Ltd., Waltham, MA, USA), respectively. The pretreatment for ICP analysis was as follows: First, 2 g of metal specimens were obtained from the upper, middle, and lower portions of the metal sample. Subsequently, the metal specimens were dissolved using nitric acid, hydrochloric acid, and perchloric acid. Iron was separated from the sample solution using MIBK (Methyl isobutyl ketone). The separation process was performed five times because the concentration of aluminum in the metal was significantly lower than that of Fe. The concentrations of carbon and aluminum obtained in each analysis were used to calculate the dissolution ratio.
2.2. Measurement of Molten Steel Temperature by Blowing Dry Air
After the complete dissolution of the Al dross and coke mixtures, the temperature change in the molten steel was measured by blowing dry air. The mixture ratio of the Al dross and coke mixtures was 0.2, according to the dissolution experiments. Figure 2 and Table 4 show the schematic of the experimental method and the experimental conditions, respectively. The temperature of the melt and the atmosphere in the furnace was maintained at 1873 K under N2 gas (500 mL/min). Subsequently, the Al dross and coke mixture was dissolved for 1 h. Thereafter, dry air was blown into the melt. The concentrations of aluminum and carbon in the metal sample before and after blowing dry air were measured using the methods described in Section 2.1.
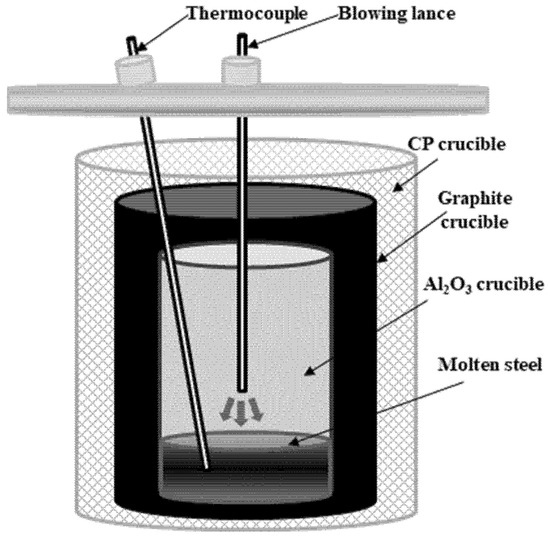
Figure 2.
Schematic of experimental method.

Table 4.
Experimental conditions.
3. Results and Discussion
3.1. Dissolution of Al Dross and Coke in Molten Steel
Figure 3, Figure 4 and Figure 5 show the change in the dissolution concentrations of carbon and aluminum in molten steel according to the mixing ratio (C/Al) and reaction time at 1823 K, 1873 K, and 1973 K. At 1823 K and 1873 K, the dissolution concentrations of C and Al were constant at 3600 s and 1800 s or more, respectively. At 1973 K, the dissolution concentrations of carbon and aluminum were constant over 1800 s. At a constant molten steel temperature, the effect of the mixing ratio on the time required to reach the maximum dissolution concentrations was not significant. The maximum dissolution concentrations increased with the molten steel temperature. In addition, as the mixing ratio increased, the maximum dissolution concentration of carbon increased and that of aluminum decreased.
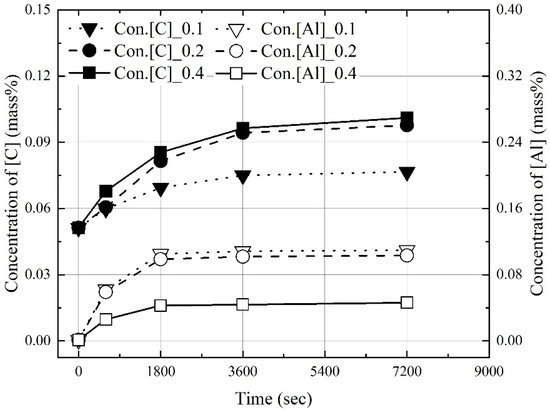
Figure 3.
Change in concentrations of C and Al at 1823 K.
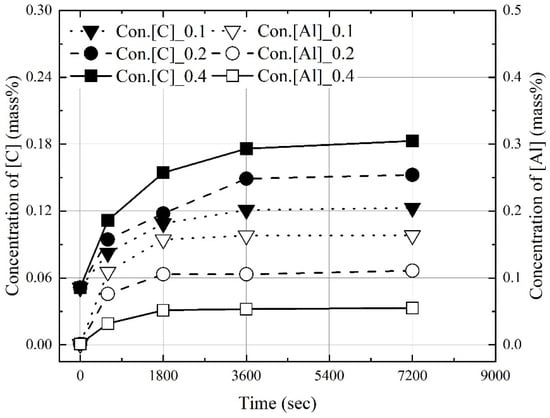
Figure 4.
Change in concentrations of C and Al at 1873 K.
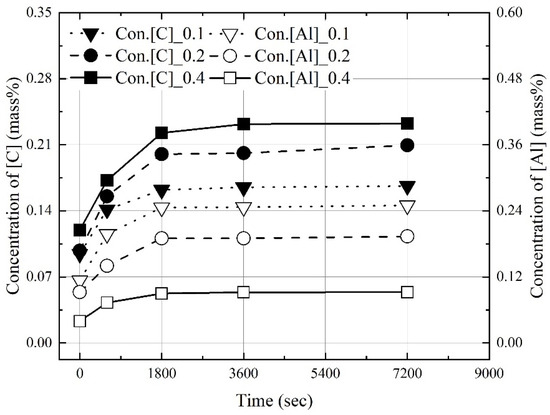
Figure 5.
Change in concentrations of C and Al at 1973 K.
Figure 6 shows the theoretical oxidation reaction heat, as calculated using the maximum dissolution concentrations of carbon and aluminum at each molten steel temperature and the concentration of impurities generated in molten steel by changing the mixing ratio. The impurities were ash, SiO2, and Al2O3. The oxidation heat of aluminum was assumed to be ~30,868 J/g, which is the heat of combustion of aluminum [17], and the oxidation heat of carbon was assumed to be ~9211 J/g, which is the enthalpy of formation of CO gas [18].
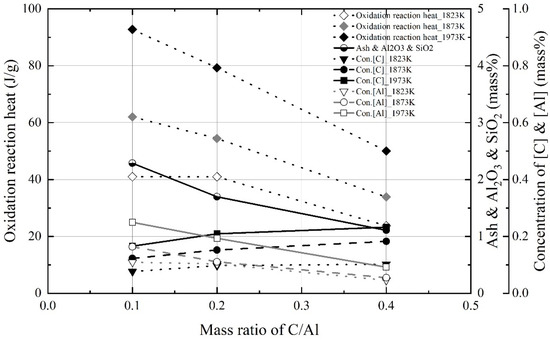
Figure 6.
Theorical oxidation reaction heats and concentrations of impurities, C, and Al in molten steel as function of mass ratio of C/Al.
At a constant molten steel temperature, the theoretical oxidation reaction heat and concentration of impurities decreased as the mixing ratio increased. The theoretical oxidation reaction heat was calculated using the following equation:
In Equation (1), wt.% C and wt.% Al denote the maximum dissolution concentrations of carbon and aluminum in molten steel, respectively, as shown in Figure 4, Figure 5 and Figure 6. The mass of iron is assumed to be the initial mass of Fe. As shown in Figure 6, the theoretical oxidation heats of the Al dross and coke mixture decreased with the mixing ratio because the maximum concentration of aluminum in molten steel decreased. At 1823 K and 1873 K, the oxidation reaction heats at mixing ratios of 0.1 and 0.2 were not significantly different. However, the concentration of impurities in molten steel increased as the mass ratio decreased. High concentrations of impurities, including Al2O3 and SiO2, decrease slag basicity. Therefore, on the basis of the theoretical oxidation reaction heats and the concentration of impurities in the Al dross and coke mixture, the appropriate mixing ratio was assumed to be 0.2.
Figure 7 and Figure 8 show the effect of the molten steel temperature on the maximum dissolution ratios of carbon and aluminum in molten steel. The maximum dissolution ratios were calculated using Equation (2). wt.% M is the dissolution concentration of carbon or aluminum in molten steel. The weight of iron and the initial weight of M are the initial mass of iron and the weight of carbon or aluminum, as calculated before the dissolution experiments, respectively.
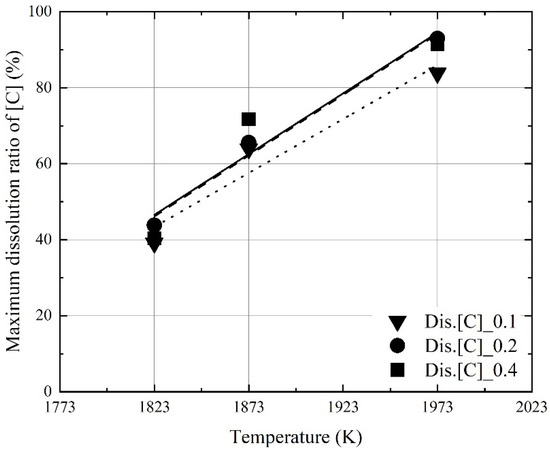
Figure 7.
Effect of the molten steel temperature on the maximum dissolution ratio of C in molten steel.
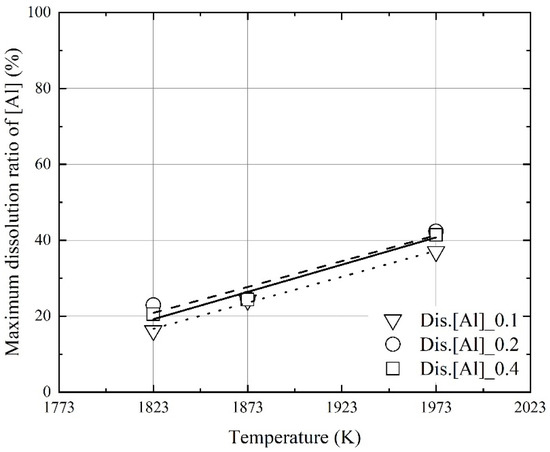
Figure 8.
Effect of the molten steel temperature on the maximum dissolution ratio of Al in molten steel.
At a constant mixing ratio, the maximum dissolution ratios increased with the molten steel temperature. This indicates that the dissolution of aluminum and carbon in the mixture can be improved when the molten steel temperature is increased because of the oxidation heat of the dissolved aluminum and carbon by blowing oxygen. However, the influence of the mixing ratio on the maximum dissolution ratios was not significant, as shown in Figure 7 and Figure 8. The relationship between the molten steel temperature and the maximum dissolution ratios is expressed as follows:
Figure 9 and Figure 10 show the influence of the mixing ratio on the maximum dissolution ratios at a constant molten steel temperature. The average values of the maximum dissolution ratios at a constant molten steel temperature are represented by each line in Figure 9 and Figure 10. At a molten steel temperature of 1973 K, the maximum dissolution ratios were ~90% and ~40%, respectively. However, at a given temperature, the maximum dissolution ratios were similar at mixing ratios of 0.1–0.4. Therefore, the molten steel temperature had a stronger effect on the dissolution behaviors of carbon and aluminum compared to the mixing ratio.
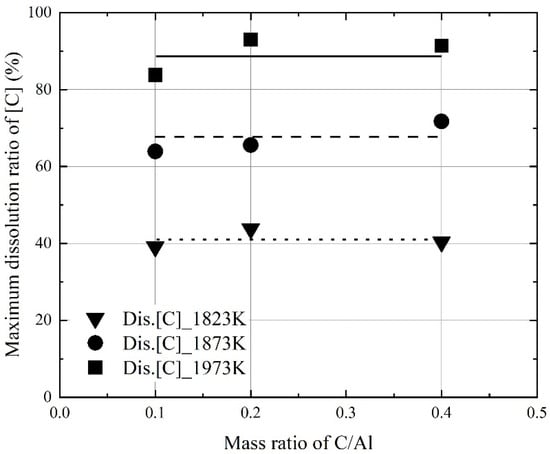
Figure 9.
Changes in the maximum dissolution ratio of C in molten steel as a function of mixing ratio of C/Al in the Al dross and coke mixtures.
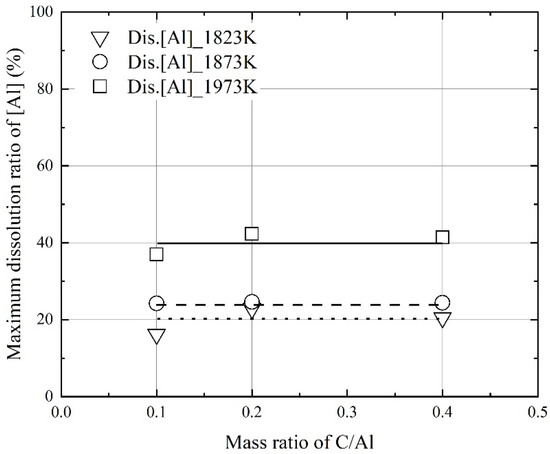
Figure 10.
Changes in the maximum dissolution ratio of Al in molten steel as a function of mixing ratio of C/Al in the Al dross and coke mixtures.
3.2. Kinetics for Dissolution of Al and C from Al Dross and Coke Mixture in Molten Steel
Based on the data shown in Figure 4, Figure 5 and Figure 6, the dissolution rate constants of carbon and aluminum were obtained using the following equations:
In Equation (5), ‘A’ is the interface area (m2) between the molten steel and the Al dross and coke mixture charged in the iron crucible. ‘k’ is the dissolution rate constant (m/s), and ‘V’ is the volume of molten steel (m3). Equation (6) can be obtained from Equation (5), and ‘K’ denotes the apparent dissolution rate constant (K = Ak/V). In Equation (6), ‘[%M]sat.’ and ‘[%M]Init.’ are the maximum and initial dissolution concentrations of carbon or aluminum in molten steel, respectively. ‘[%M]time’ is the dissolution concentration of carbon or aluminum in molten steel at each reaction time.
Figure 11 and Figure 12 show the change in ‘αC‘ and ‘αAl‘ obtained using Equation (6) and the present experimental results as a function of reaction time. The slope between the ‘α’ and the reaction time is ‘K’. As shown in Figure 11, the apparent dissolution rate constant of carbon (αC) increased with the molten steel temperature, even though the maximum dissolution concentration of carbon at 1973 K was saturated for 1800 s, as shown in Figure 5. In contrast, the apparent dissolution rate constant of aluminum (αAl) was weakly influenced by the molten steel temperature, as shown in Figure 12. Therefore, the influence of the molten steel temperature on the dissolution rate constant of carbon was stronger than that on the dissolution rate constant of aluminum.
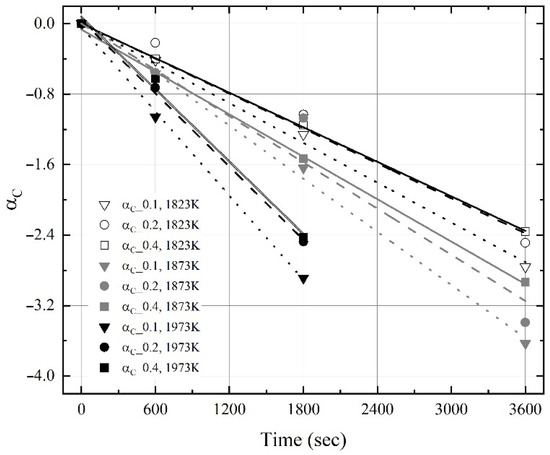
Figure 11.
Changes in αCoke obtained using Equation (6) as a function of reaction time.
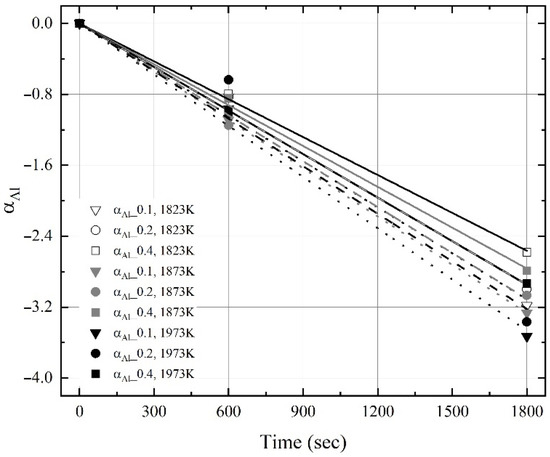
Figure 12.
Changes in αAl obtained using Equation (6) as a function of reaction time.
Figure 13 shows the influence of the molten steel temperature on the apparent dissolution rate constant of the Al dross and coke mixtures, obtained in the present study, and the dissolution rate constant of carbon, obtained in a previous study [11]. The dissolution rate constant of carbon obtained in the present study was lower than that obtained in the previous study. The previous study used carbon-saturated conditions with a compressed board of coke on the surface of molten steel. Conversely, in the present study, the mixture was prepared by charging Al dross powder and coke in an iron crucible. As the reaction area could not be accurately determined in the present study, the apparent dissolution rate constant of carbon was assumed to be different from that of the previous study. Furthermore, it was assumed that the shape of the carbon source was related to the dissolution behavior of carbon. As shown in Figure 13, the apparent dissolution rate constant of aluminum in the mixture increased slightly with the molten steel temperature, compared to carbon.
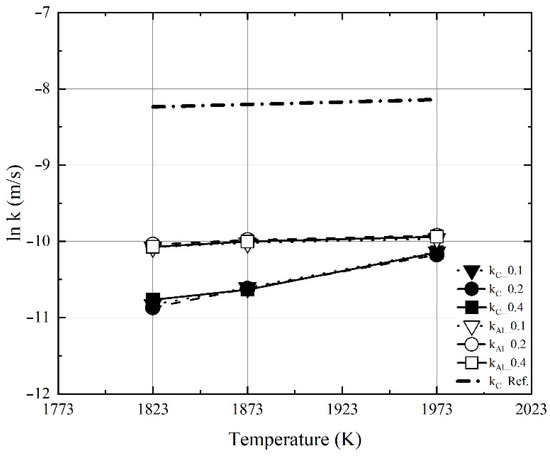
Figure 13.
Influence of molten steel temperature on the apparent dissolution rate constant of the Al dross and coke mixtures obtained in the present study, and the dissolution rate constant of carbon obtained in a previous study [11].
Figure 14, Figure 15 and Figure 16 show the experimental and calculated values of the changes in the dissolution concentrations of carbon and aluminum in molten steel. The dissolution rate constants of carbon and aluminum shown in Figure 13 were used to calculate the dissolution concentrations at different molten steel temperatures and mixing ratios. At 1823 K, 1873 K, and 1973 K, the calculated dissolution concentrations showed good agreement with the experimental data. The dissolution concentration and dissolution efficiency of the Al dross and coke mixtures could be predicted using the equations proposed this study.
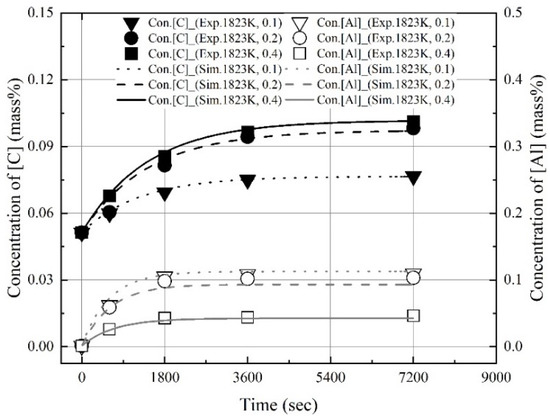
Figure 14.
Comparison of experimental values with values calculated using kap at 1823 K shown in Figure 13.
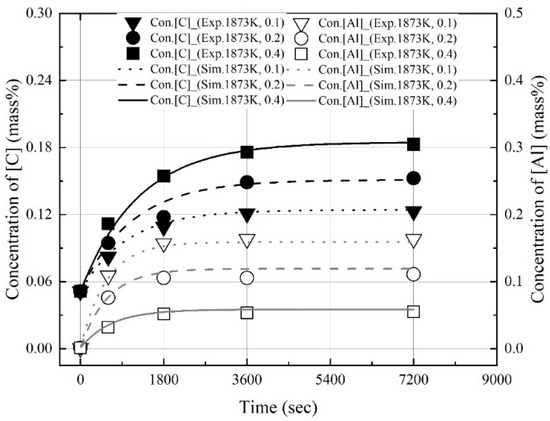
Figure 15.
Comparison of experimental values with values calculated using kap at 1873 K shown in Figure 13.
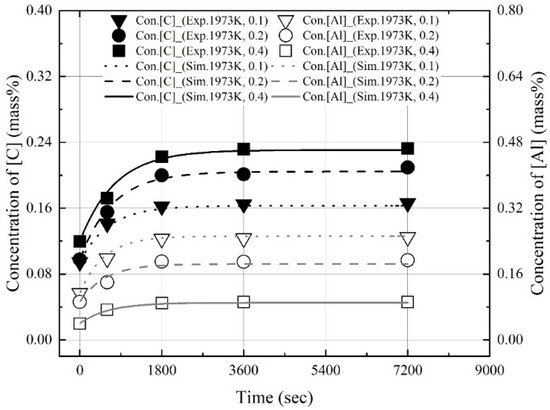
Figure 16.
Comparison of experimental values with and values calculated using kap at 1973 K shown in Figure 13.
3.3. Changes in Molten Steel Temperature by Blowing Dry Air after Dissolution of Al Dross and Coke Mixture
The improvement in the molten steel temperature due to the Al dross and coke mixture was verified by measuring the molten steel temperature by blowing dry air gas after the dissolution of the mixture. The mixing ratio was 0.2 and the mixture was completely dissolved at 1873 K for 1 h. Then, dry air was blown for 1 h at a starting temperature of 1873 K. Furthermore, the coupled reaction model of the BOF process was used to simulate the changes in molten steel temperature. The details of this model have been reported elsewhere [19]. The model can simulate the changes in the temperature and composition of molten steel and slag during top and bottom blowing. The mass transfer coefficient of the components in the metal phase was calculated using the stirring energies of top and bottom blowing. In the present study, the stirring energy of bottom blowing was fixed at unity, and the mass transfer coefficient of the components in the metal phase (km) was calculated using the stirring energies of top blowing, as follows:
In Equation (7), ‘’ is the stirring energy of top blowing (Watt/ton) and ‘’ is the flow rate of the top blowing gas (Nm3/min). ‘’ and ‘’ are the number and diameter (m) of nozzles, respectively. ‘h’ is the height of the nozzle tip from the surface of the molten steel (m). ‘M’ and ‘W’ are the molecular weight of the top blowing gas and the total weight of the metal, respectively. In Equation (8), ‘hV’ and ‘dV’ are the height and diameter of the vessel (m), respectively. The mass transfer coefficients of the components in the slag phase were 10 times lower than those in the metal phase. Table 5 presents the input data for the simulations.

Table 5.
Input data for simulations.
Figure 17 shows the images of molten steel with the dissolved Al dross and coke mixtures and after blowing dried air. In Figure 17a, residue particles from the dissolved mixtures were observed on the surface of the molten steel. As shown in Figure 17b, a slag film was formed on the surface of the molten steel after approximately 1600 s blowing of dried air. The slag film became thicker during blowing and the temperature decreased, as shown in Figure 17c.

Figure 17.
Images of molten steel with dissolution of the Al dross and coke mixtures and blowing of dry air: (a) Before blowing; (b) Blowing at 1600 s; (c) After blowing.
Figure 18 shows the changes in the composition and temperature of molten steel caused by blowing dry air and the simulation results. The black and red lines represent the measured and simulated temperatures of molten steel, respectively. The blue symbols and line indicate the measured and simulated compositions of carbon in molten steel, respectively. The green symbols and line denote the measured and simulated compositions of aluminum in molten steel, respectively. The measured temperature increased significantly for approximately 700 s when the aluminum in molten steel was primarily oxidized, and the aluminum content decreased. The molten steel temperature gradually increased as the carbon content in the molten steel gradually decreased. At approximately 1600 s, the measured temperature decreased slightly because a thin film of slag was formed. Finally, as the slag phase became thicker with the blowing of dry air, the measured temperature decreased after 2200 s. Figure 19 shows the results of the X-ray diffraction (XRD) analysis of the slag. The slag phase was composed of Fe3O4 and Al2O3, and it was generated by the oxidation of aluminum and iron caused by blowing air. The simulated and measured results of the changes in the molten steel temperature and the aluminum and carbon contents of molten steel were in good agreement. In conclusion, the molten steel temperature can be improved by the oxidation of the aluminum dissolved from the Al dross. In the future, the electrical energy consumed in the EAF process may be reduced using Al dross and coke mixtures.
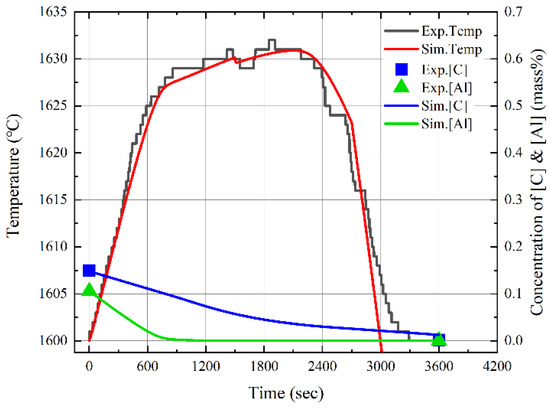
Figure 18.
Comparison of experimental and simulation results of changes in composition and temperature of the molten steel by blowing dry air.
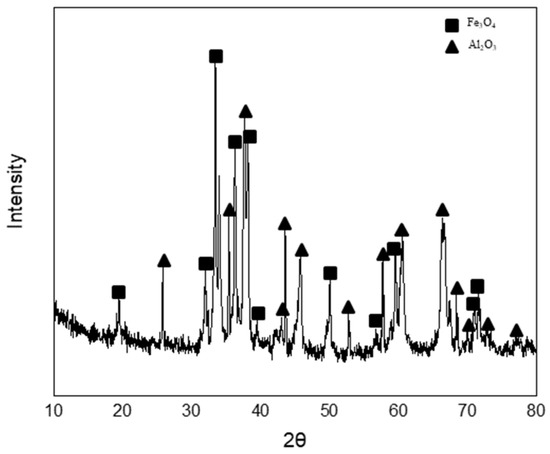
Figure 19.
X-ray diffraction analysis for slag.
4. Conclusions
We investigated the dissolution concentrations, dissolution ratios, and dissolution rate constants of carbon and aluminum in molten steel to utilize coke and Al dross mixed fuels as chemical energy sources in the EAF process. Furthermore, the changes in the molten steel temperature were investigated by blowing dry air into the melt after the dissolution of the coke and Al dross mixtures. The following results were obtained:
- (1)
- The dissolution experiments of the coke and Al dross mixtures were conducted at 1823–1973 K. The dissolution concentrations of carbon and aluminum in molten steel increased with the reaction time and molten steel temperature. The dissolution concentration of aluminum in molten steel was constant after 1800 s. At 1823 K and 1873 K, the dissolution concentration of carbon in molten steel was constant after 3600 s. At 1973 K, and the dissolution concentration of carbon in molten steel remained constant after 1800 s. The theoretical oxidation heat was calculated using the maximum dissolution concentrations of carbon and aluminum in molten steel.
- (2)
- At a constant mixing ratio of coke and Al dross, the maximum dissolution ratio of carbon and aluminum in molten steel increased with the molten steel temperature. At a constant molten steel temperature, the effect of the mixing ratio on the maximum dissolution ratio of carbon and aluminum was not significant. The relationship between the maximum dissolution ratio of carbon and aluminum in molten steel and the molten steel temperature was obtained.
- (3)
- The dissolution rate constants of carbon and aluminum increased with the molten steel temperature. The dissolution concentrations of the coke and Al dross were calculated using the dissolution rate constants of carbon and aluminum, and the calculated values were in good agreement with the experimental data.
- (4)
- After the dissolution of the coke and Al dross mixtures, the molten steel temperature was measured and simulated by blowing dry air into the melt at a starting temperature of 1873 K. The molten steel temperature increased significantly immediately after the blowing of dry air started, owing to the oxidation of aluminum. Subsequently, the molten steel temperature increased gradually, due to the combustion of carbon. A slag phase was formed at approximately 1600 s after the start of the blowing of dry air, and it became thicker with the continued blowing of dry air. The slag phase was composed of Fe3O4 and Al2O3, as determined using XRD. The simulation results for the changes in the temperature and composition of molten steel showed good agreement with the measured results.
Funding
This research was funded by the Korea Institute of Energy Technology Evaluation and Planning and the Ministry of Trade, Industry, and Energy of the Republic of Korea, grant number 20212010100060. This research was funded by a research fund from Chosun University, 2017.
Conflicts of Interest
The authors declare no conflict of interest.
References
- Hansen, J.; Sato, M.; Hearty, P.; Ruedy, R.; Kelley, M.; Masson-Delmotte, V.; Russell, G.; Tselioudis, G.; Cao, J.; Rignot, E.; et al. Ice melt, sea level rise and superstorms: Evidence from paleoclimate data, climate modeling, and modern observations that 2 °C global warming could be dangerous. Atmos. Chem. Phys. 2016, 16, 3761–3812. [Google Scholar] [CrossRef]
- Figueres, C.; Quere, C.L.; Mahindra, A.; Bäte, O.; Whiteman, G.; Peters, G.; Guan, D. Emissions are still rising: Ramp up the cuts. Nature 2018, 564, 27–30. [Google Scholar] [CrossRef] [PubMed]
- Jin, T.Y.; Choi, G.Y.; Lee, E.M.; Lee, S.K. A Decomposition Analysis of Domestic Carbon Dioxide Emissions Related to Industry Structure and Energy Mix in Korea. J. Environ. Policy Adm. 2020, 28, 153–182. [Google Scholar]
- Xu, C.; Cang, D. A Brief Overview of Low CO2 Emission Technologies for Iron and Steel Making. J. Iron Steel Res. Int. 2010, 17, 1–7. [Google Scholar] [CrossRef]
- Oh, D.W.; Park, H.-k.; Park, T.-j.; Im, S.K. New Energy Technology of Electric Arc Furnace in Steel Making Industry. In Proceedings of the KIEE Conference 2003, Kwangwon-do, Korea, 21–23 July 2003; pp. 71–73. [Google Scholar]
- Matoba, S.; Banya, S. Equilibrium of carbon and oxygen in molten iron saturated with carbon. Testu-to-Hagane 1957, 43, 790–796. [Google Scholar] [CrossRef]
- Kim, D.-H.; Paek, M.-K.; Kim, T.-J.; Won, S.-Y.; Pak, J.-J. Carbon Solubility in Liquid Iron Containing V, Mo and Ni. Mater. Trans. 2014, 55, 610–615. [Google Scholar] [CrossRef]
- Kitchener, J.A.; Bockris, J.O.M.; Spratt, D.A. The influence of sulphur on the solubility and activity coefficient of carbon. Trans. Faraday Soc. 1952, 48, 608–617. [Google Scholar] [CrossRef]
- Wu, C.; Sahajwalla, V. Dissolution Rates of Coals and Graphite in Fe-C-S Melts in Direct Ironmaking: Influence of Melt Carbon and Sulfur on Carbon Dissolution. Metall. Mater. Trans. B 2000, 31B, 243–251. [Google Scholar] [CrossRef]
- Cham, S.T.; Sakurovs, R.; Sun, H.; Sahajwalla, V. Influence of Temperature on Carbon Dissolution of Cokes in Molten Iron. ISIJ Int. 2006, 46, 652–659. [Google Scholar] [CrossRef][Green Version]
- Jang, D.; Kim, T.; Shin, M.; Lee, J. Kinetics of Carbon Dissolution of Coke in Molten Iron. Metall. Mater. Trans. B 2012, 43B, 1308–1314. [Google Scholar] [CrossRef]
- Kulik, G.J.; Daley, J.C. Aluminum Dross Processing in the 90’s. In Proceedings of the Second International Symposium-Recycling of Metals and Engineered Materials, Williamsburg, VA, USA, 28–31 October 1990; pp. 427–438. [Google Scholar]
- Cassells, J.M.; Rusin, P.A.; Young, T.L.; Greene, M.G. Removal and reuse of aluminum dross solid waste. In Proceedings of the Technical Sessions Presented by the TMS Light Metals Committee at the 122nd TMS Annual Meeting, Denver, CO, USA, 21–25 February 1993; pp. 1075–1081. [Google Scholar]
- Park, H.; Lee, H.; Lee, J. Preparation of Castable Refractories by Recycling of Aluminum Dross. J. Korean Inst. Resour. Recycl. 2003, 12, 46–53. [Google Scholar]
- Park, H.; Lee, H.; Kim, J.; Yoon, E. Pretreatment for Recycling of Domestic Aluminum Dross. J. Korean Inst. Resour. Recycl. 1996, 5, 14–20. [Google Scholar]
- Kim, Y.-H.; Yoo, J.-M. A study on Reduction of Iron oxide from slag in the EAF Process. J. Korean Inst. Resour. Recycl. 2016, 25, 54–59. [Google Scholar] [CrossRef][Green Version]
- Snyder, P.E.; Seltz, H. The Heat of Formation of Aluminum oxide. J. Am. Chem. Soc. 1945, 67, 683–685. [Google Scholar] [CrossRef]
- Chase, M.W., Jr. NIST-JANAF Themochemical Tables, 4th ed.; American Institute of Physics: Washington, DC, USA, 1998; p. 641. [Google Scholar]
- Kitamura, S.; Kitamura, T.; Shibata, K.; Mizukami, Y.; Mukawa, S.; Nakagawa, J. Effect of Stirring Energy, Temperature and Flux Composition on Hot Metal Dephosphorization Kinetics. ISIJ Int. 1991, 31, 1322–1328. [Google Scholar] [CrossRef]
Publisher’s Note: MDPI stays neutral with regard to jurisdictional claims in published maps and institutional affiliations. |
© 2022 by the author. Licensee MDPI, Basel, Switzerland. This article is an open access article distributed under the terms and conditions of the Creative Commons Attribution (CC BY) license (https://creativecommons.org/licenses/by/4.0/).