
Microstructural Evolution in Large-Section Plastic Mould Steel during Multi-Directional Forging


Abstract
:1. Introduction
2. Materials and Methods
2.1. Material
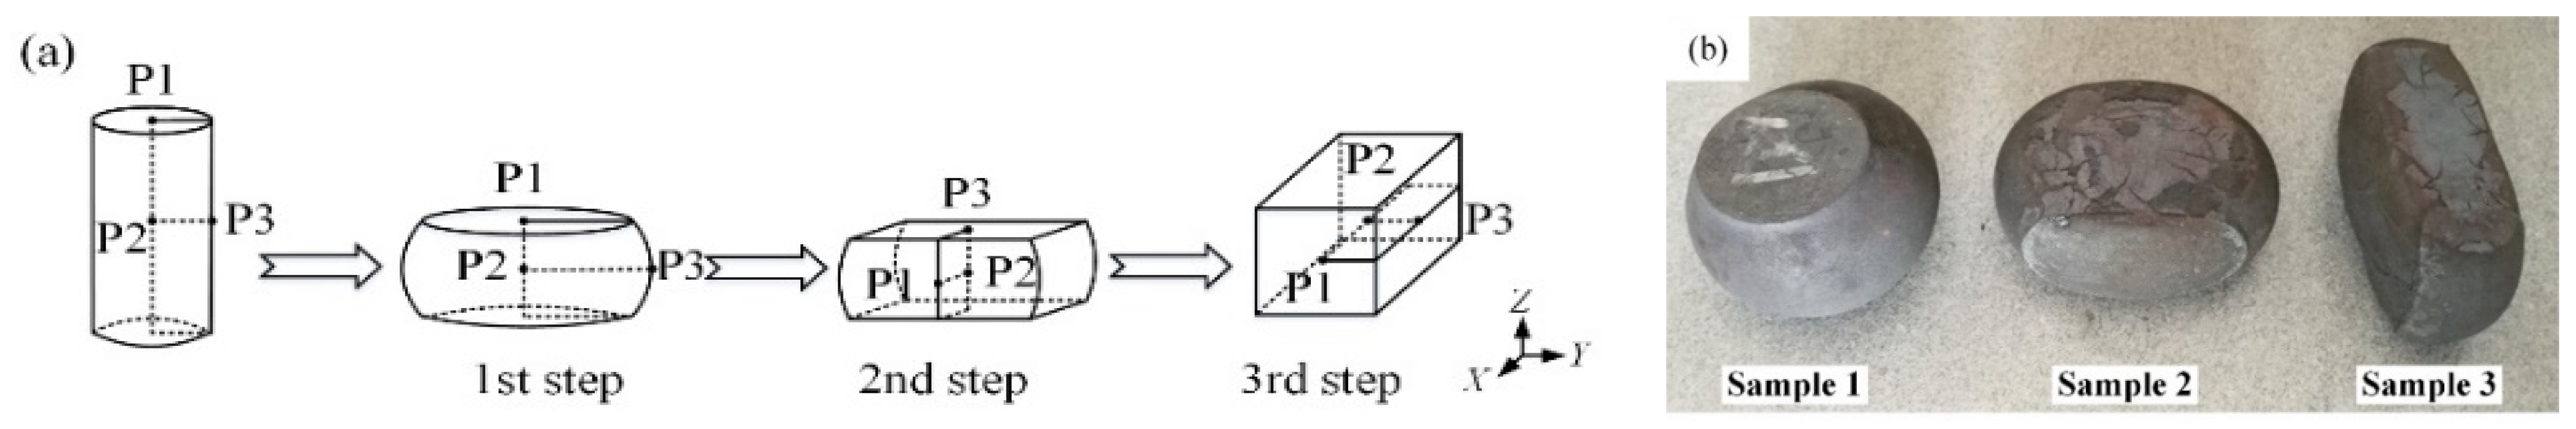
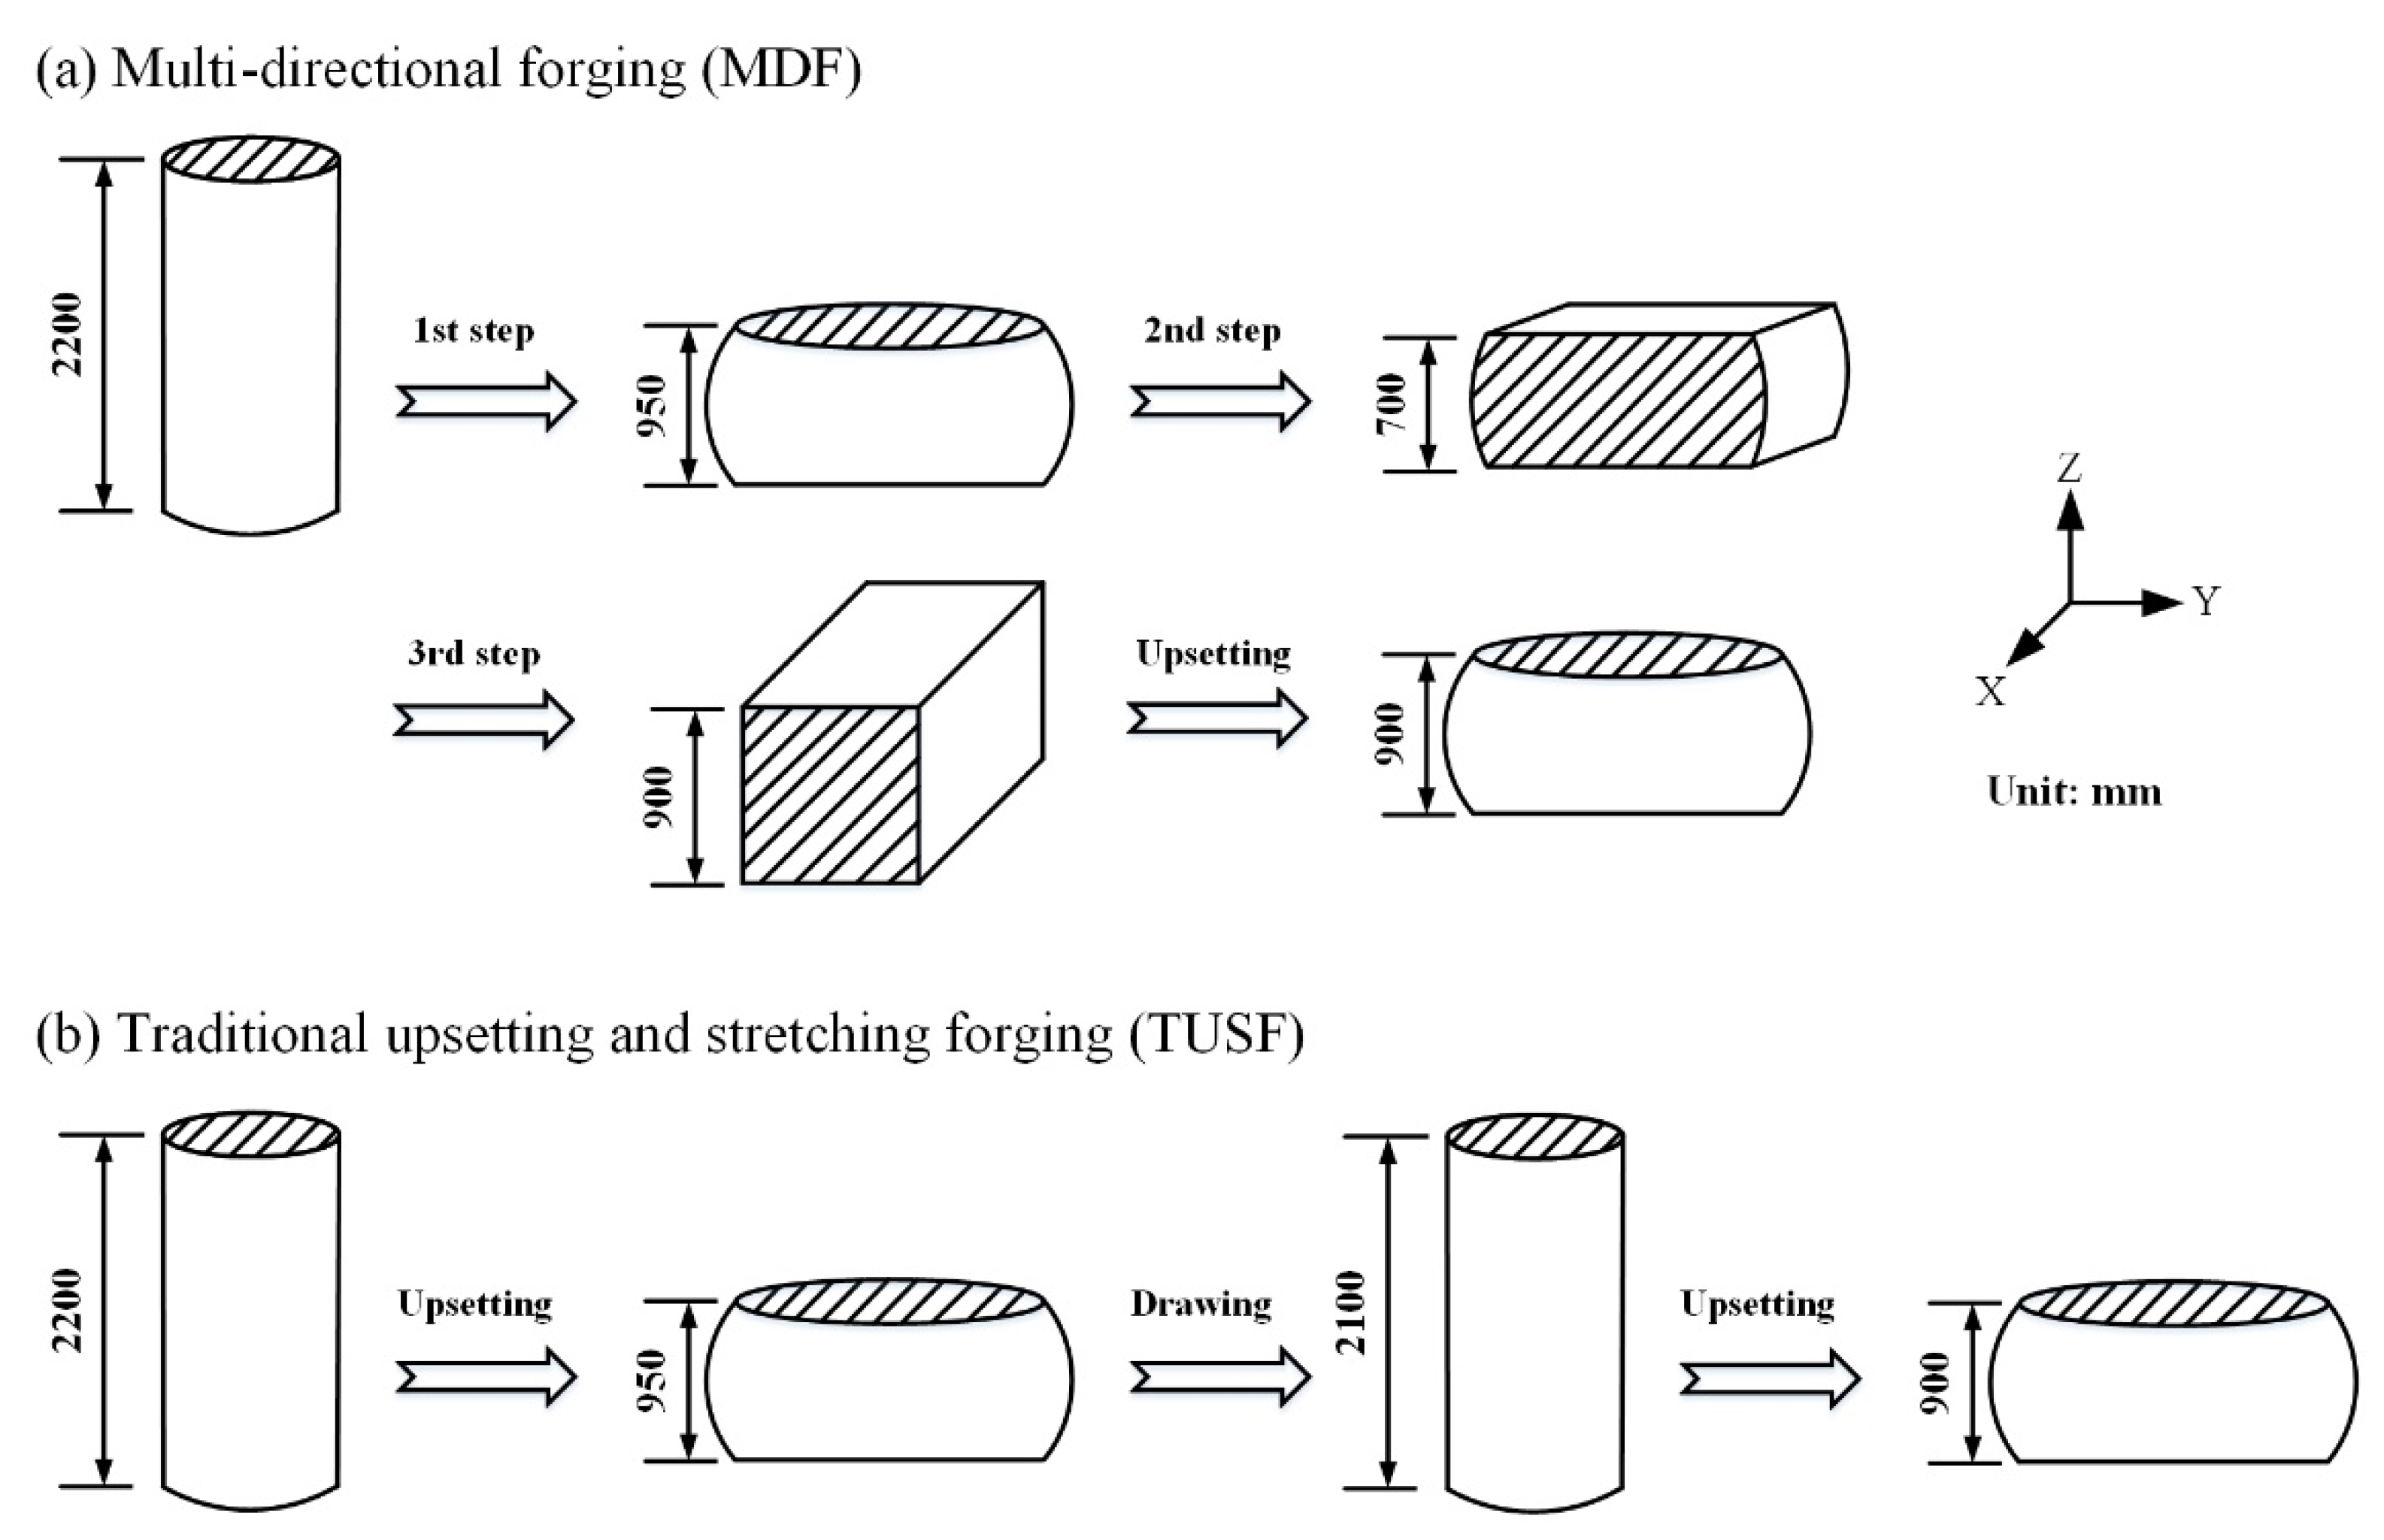
2.2. MDF Procedure
3. Experimental Results and Analysis
4. Numerical Procedure
4.1. Microstructural Evolution Model
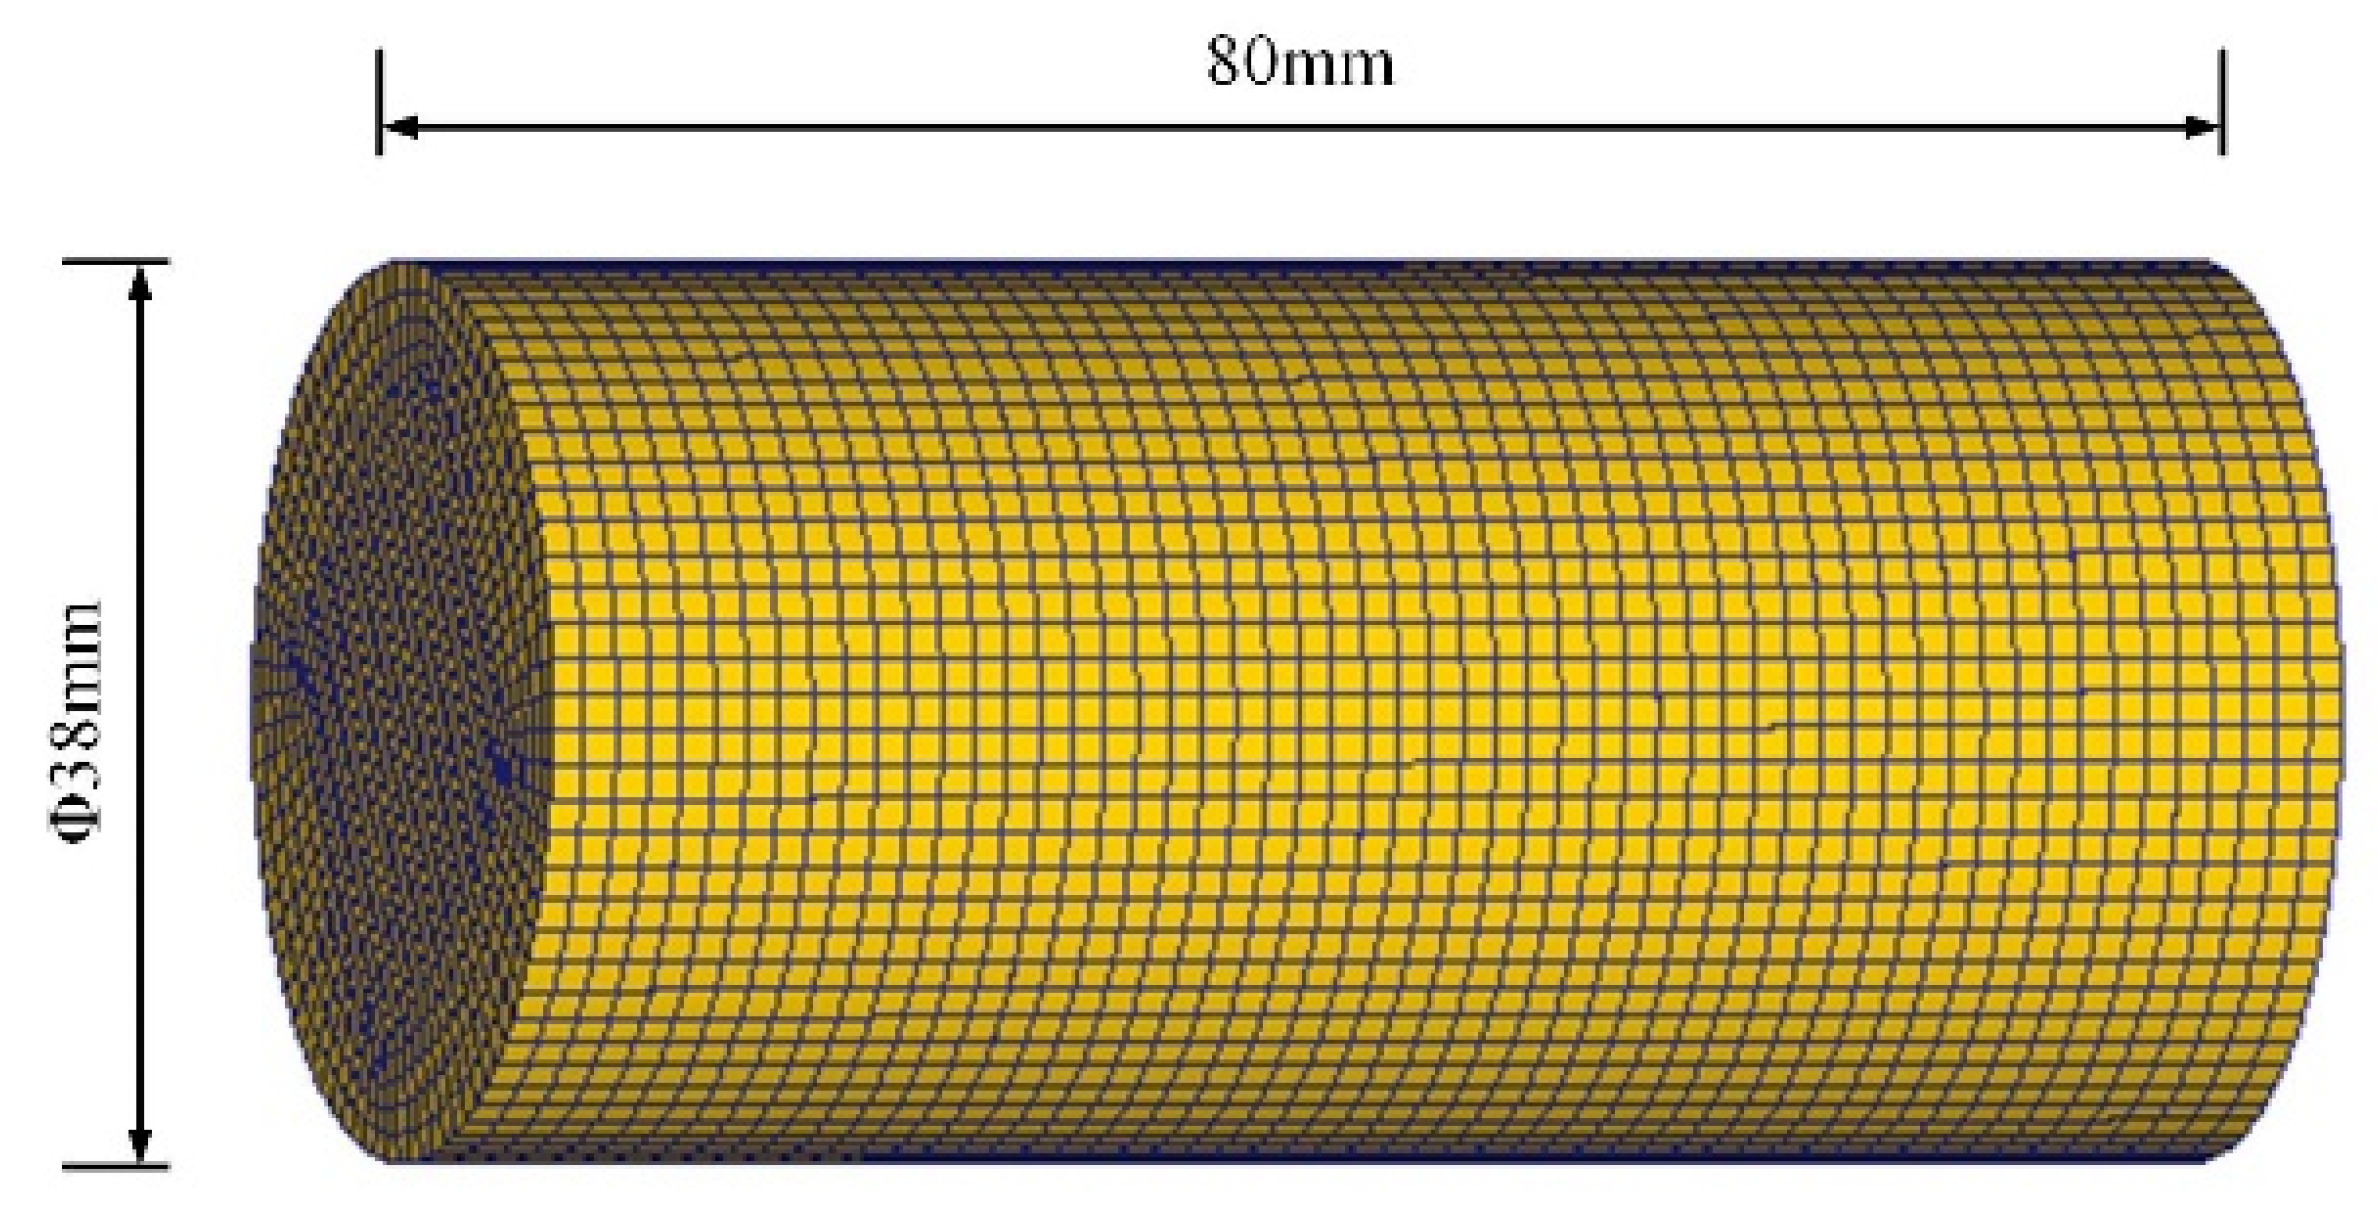
4.2. FEM Model
5. Results and Discussion
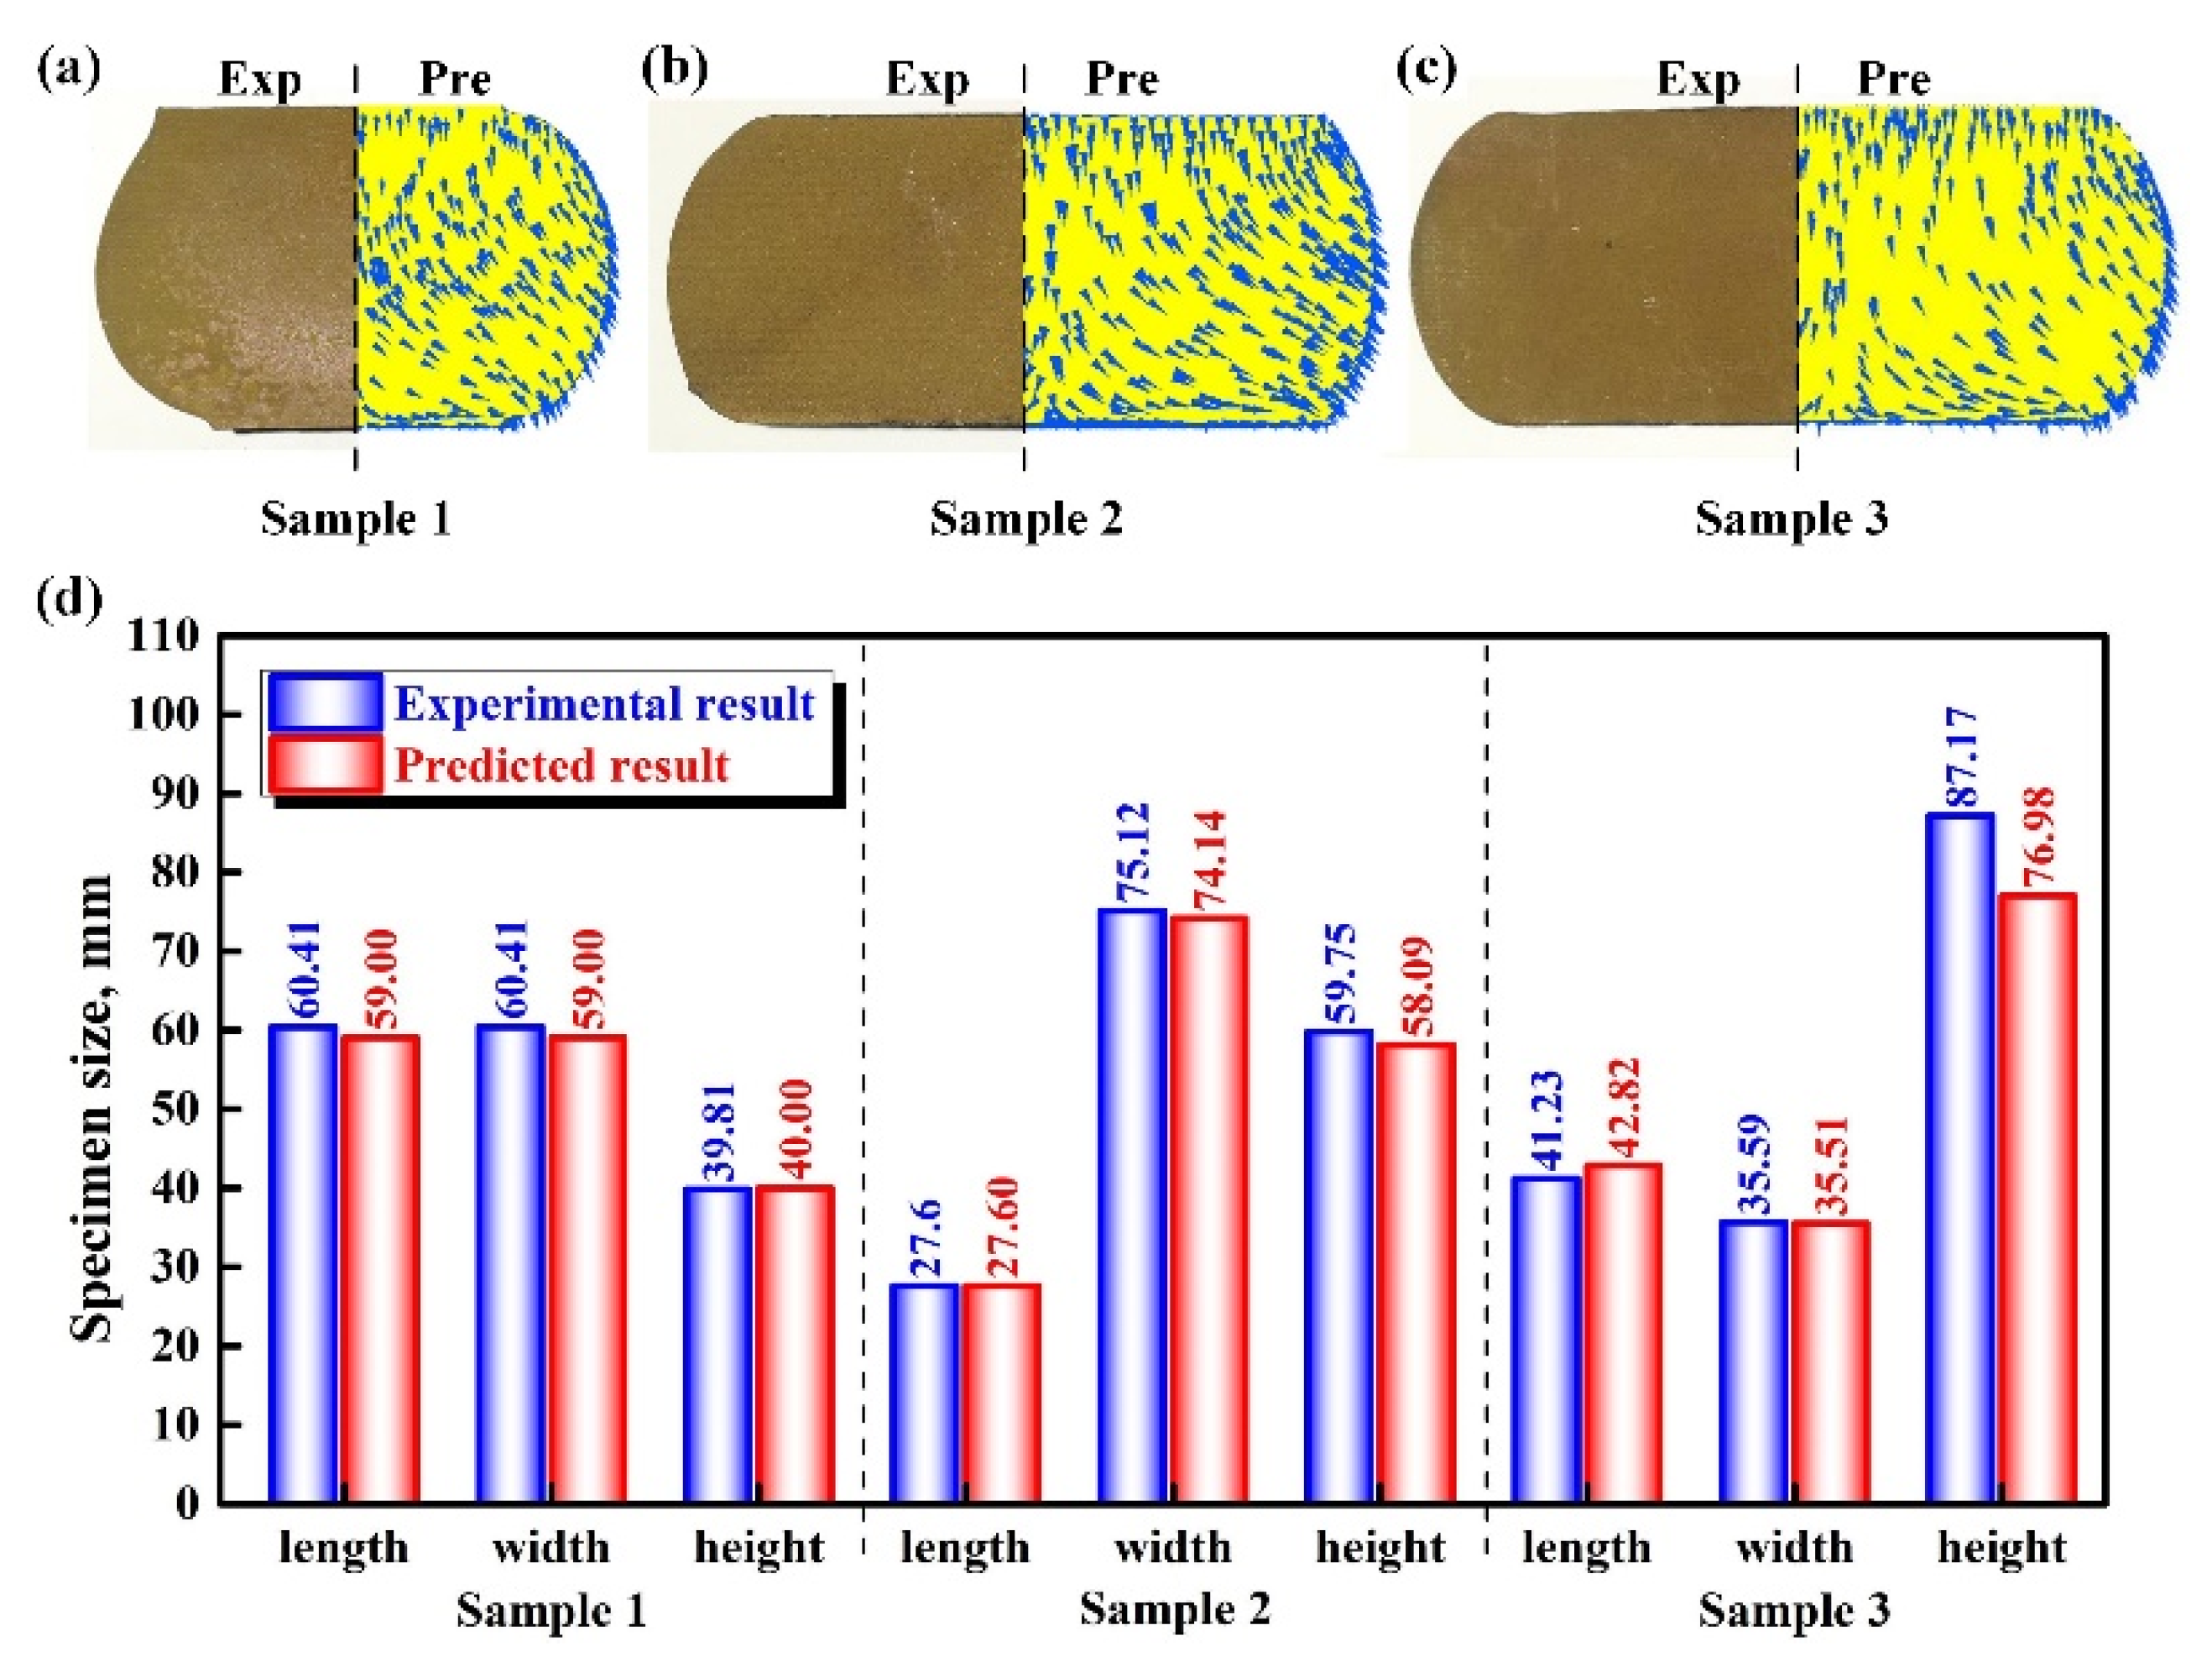
5.1. Comparative Analysis of Experimental and Simulation Results
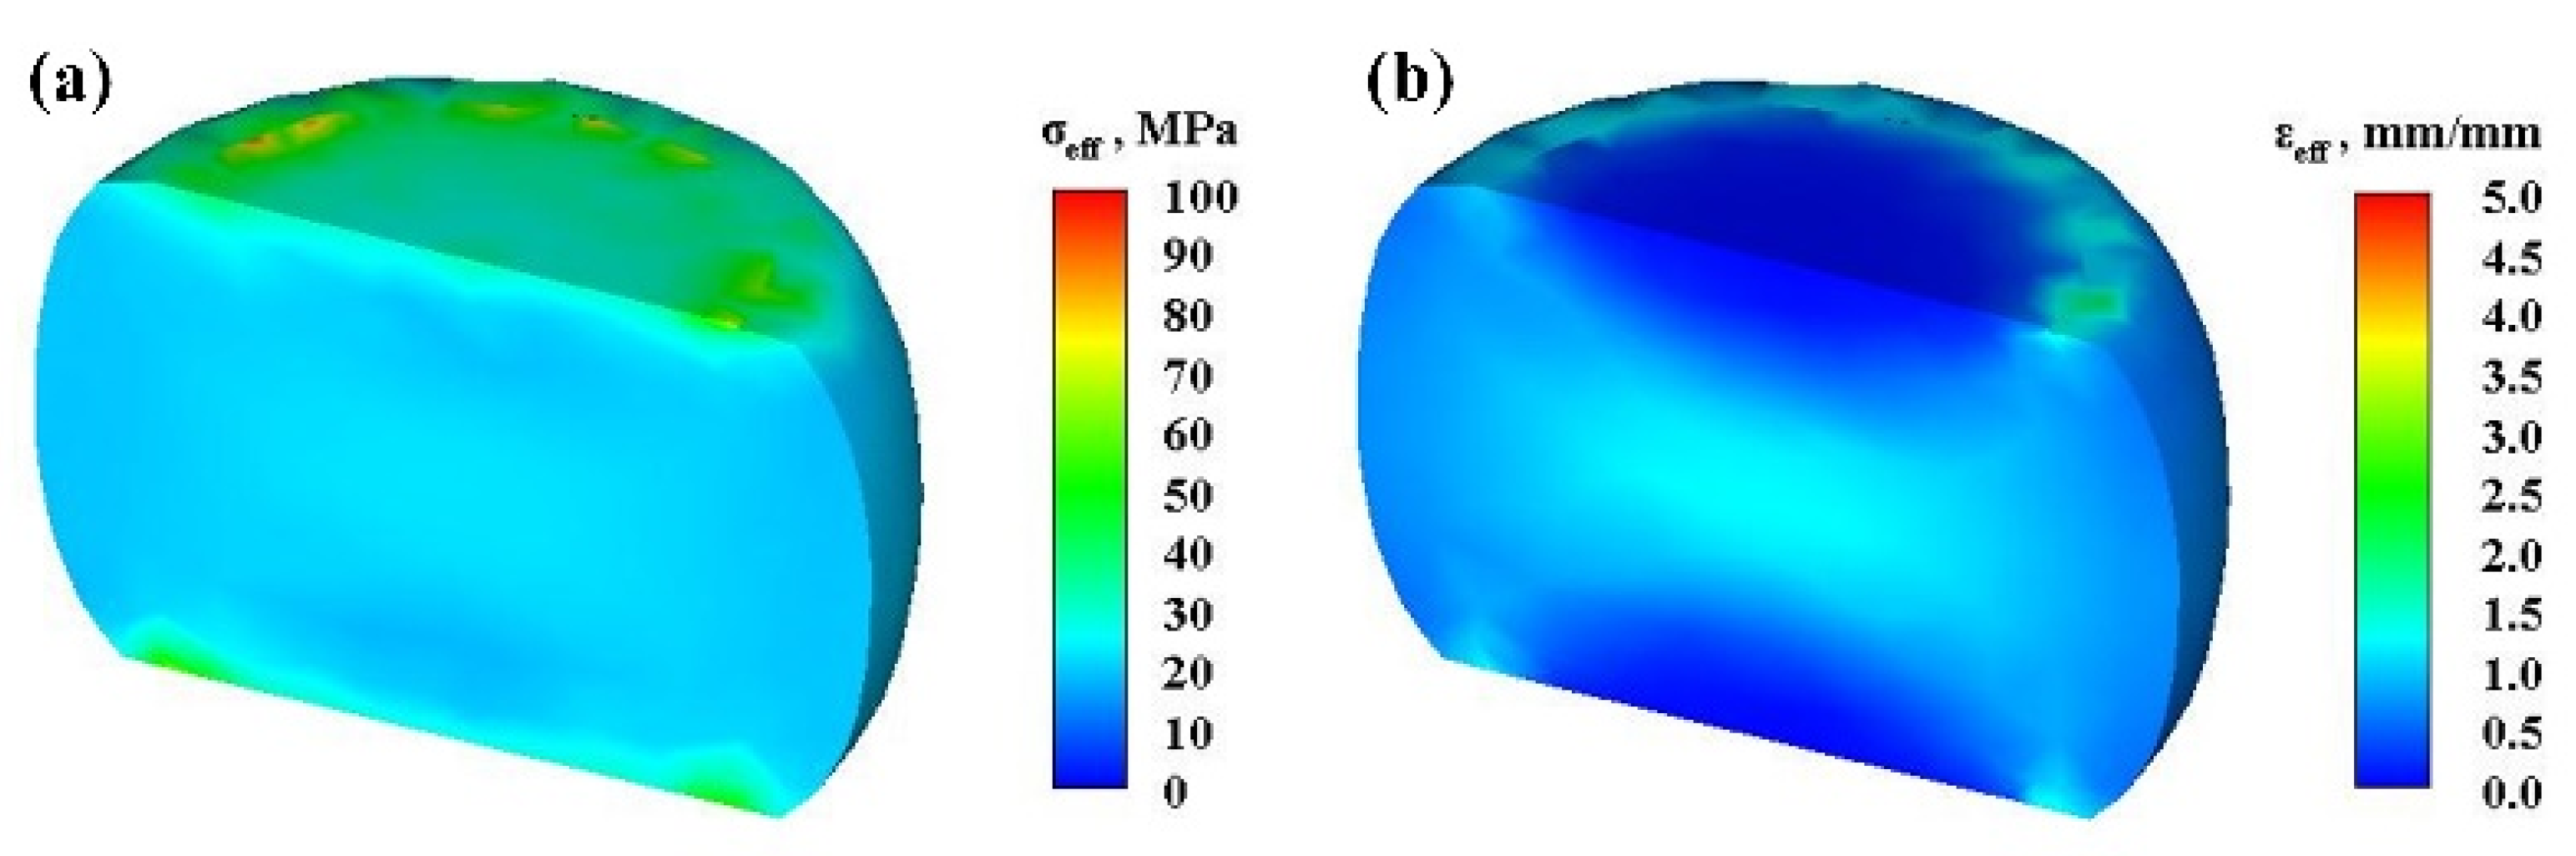
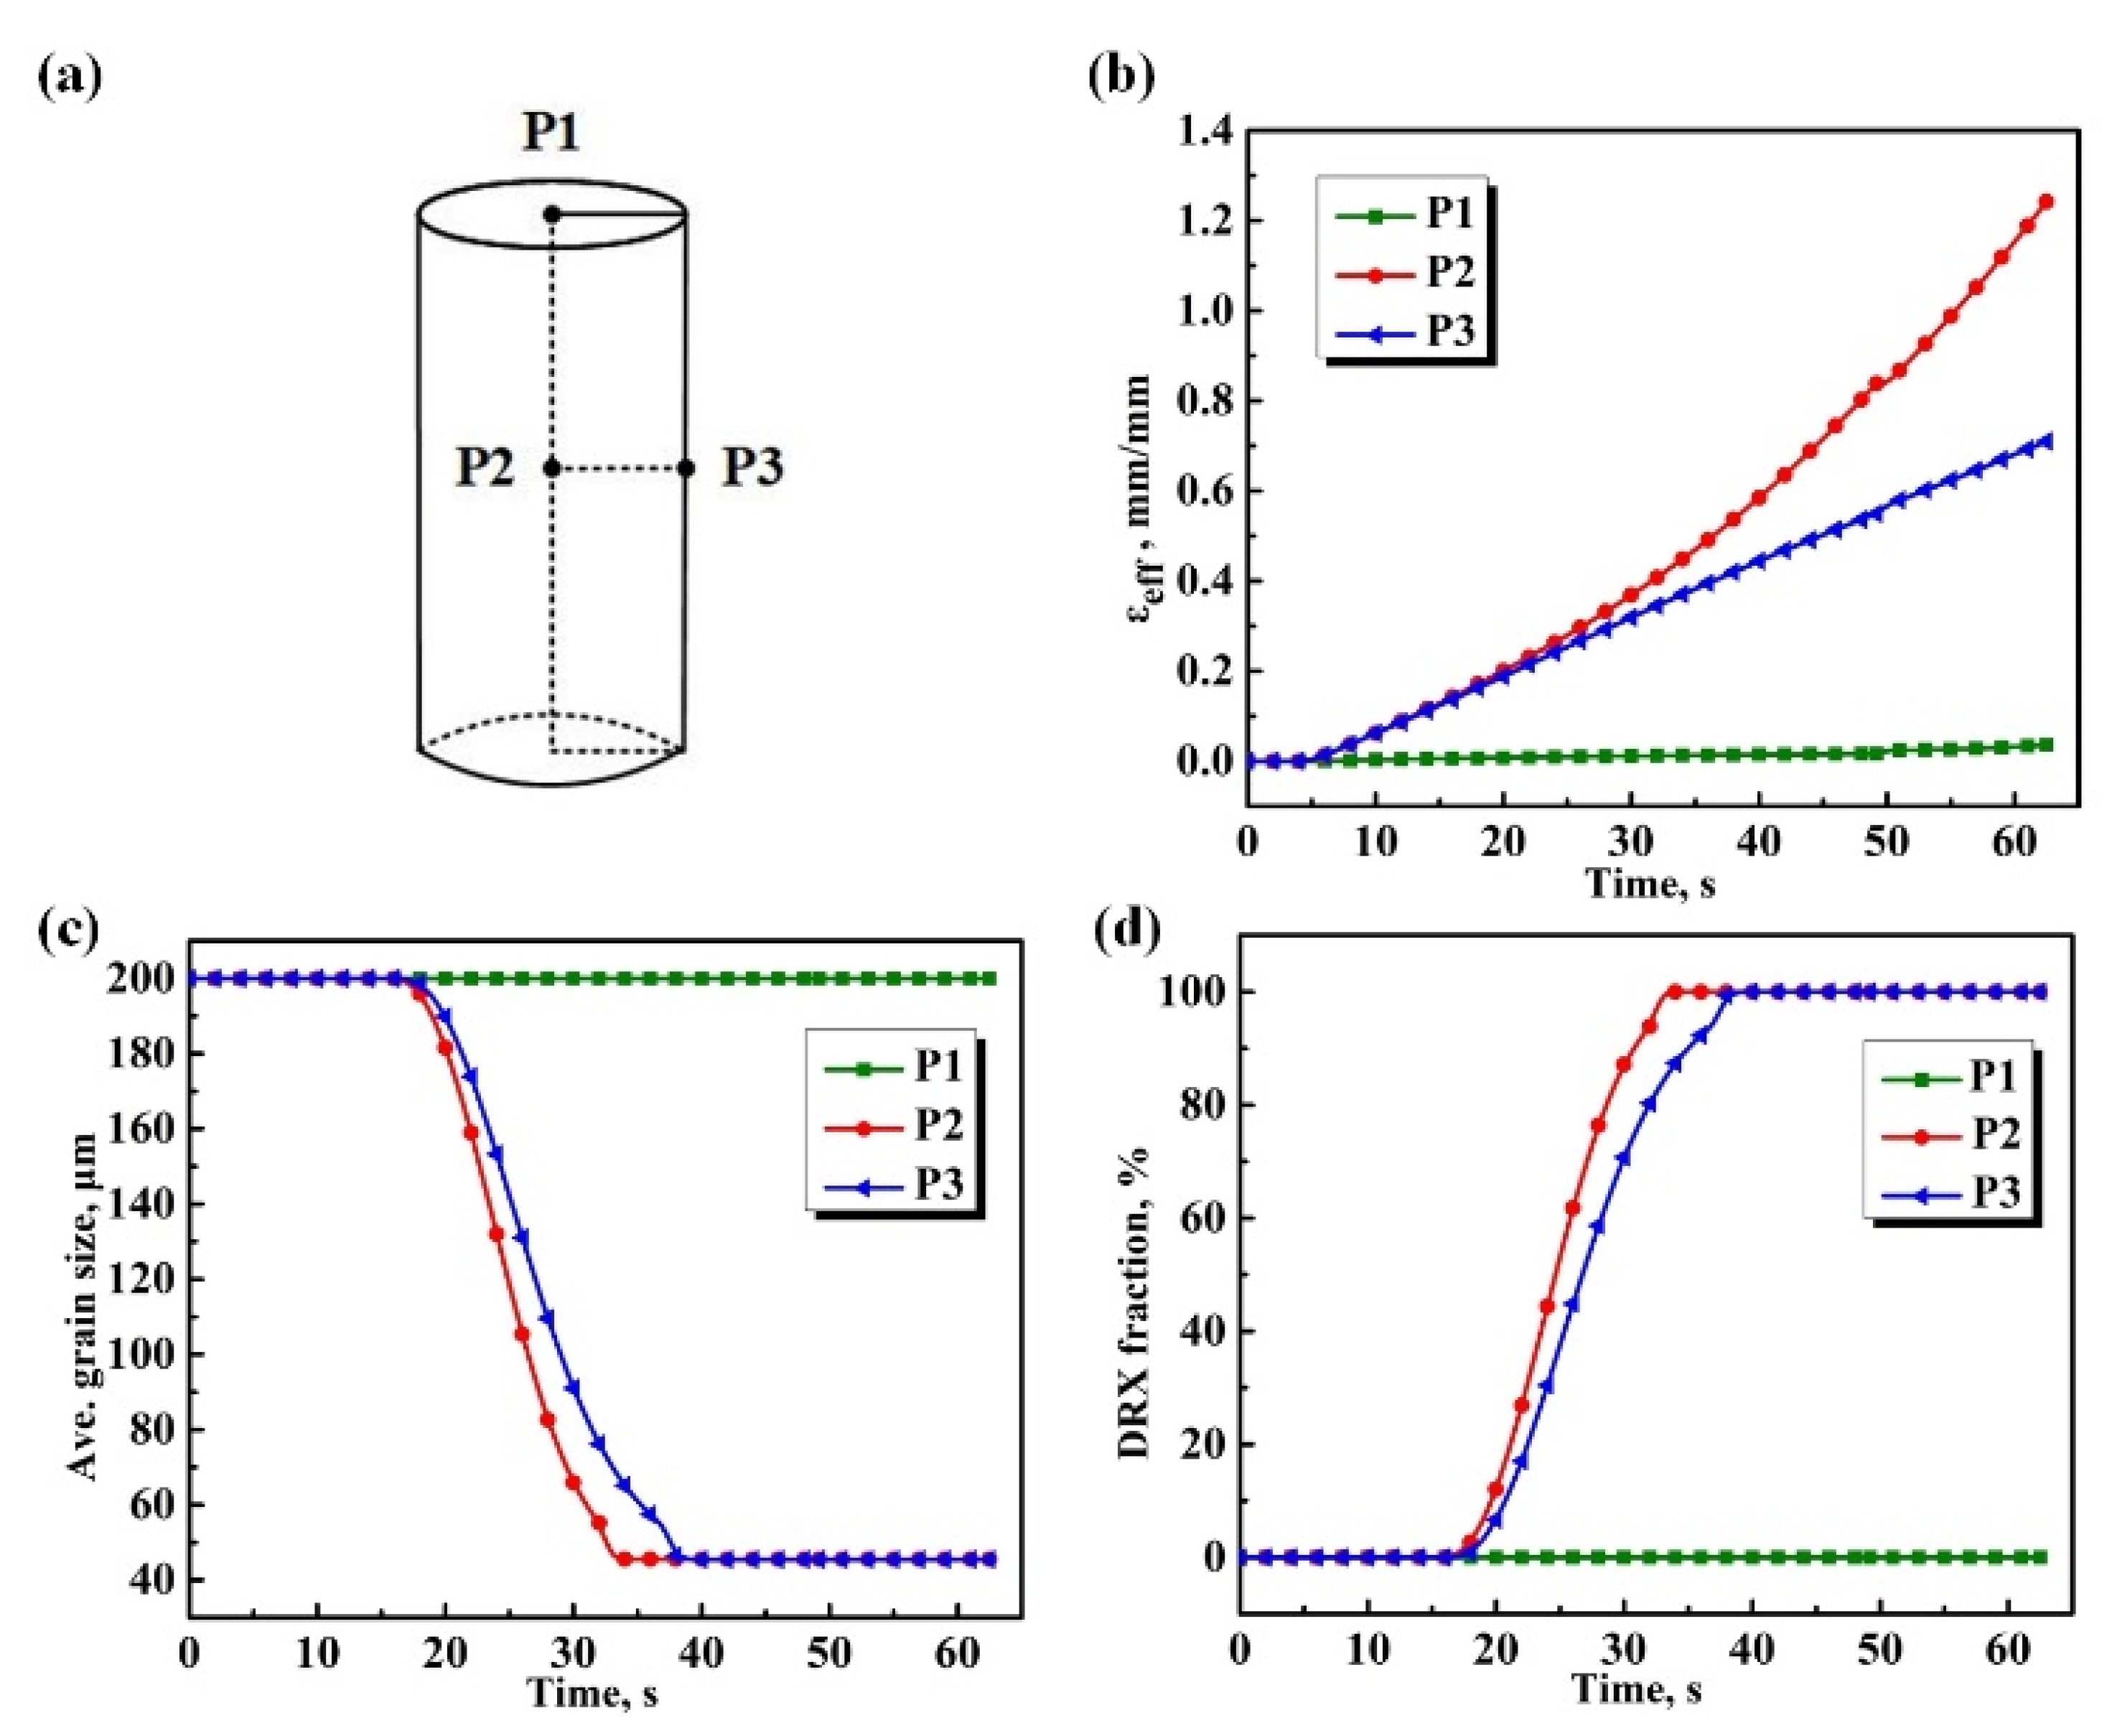
5.2. Microstructural Evolution during the First MDF Step
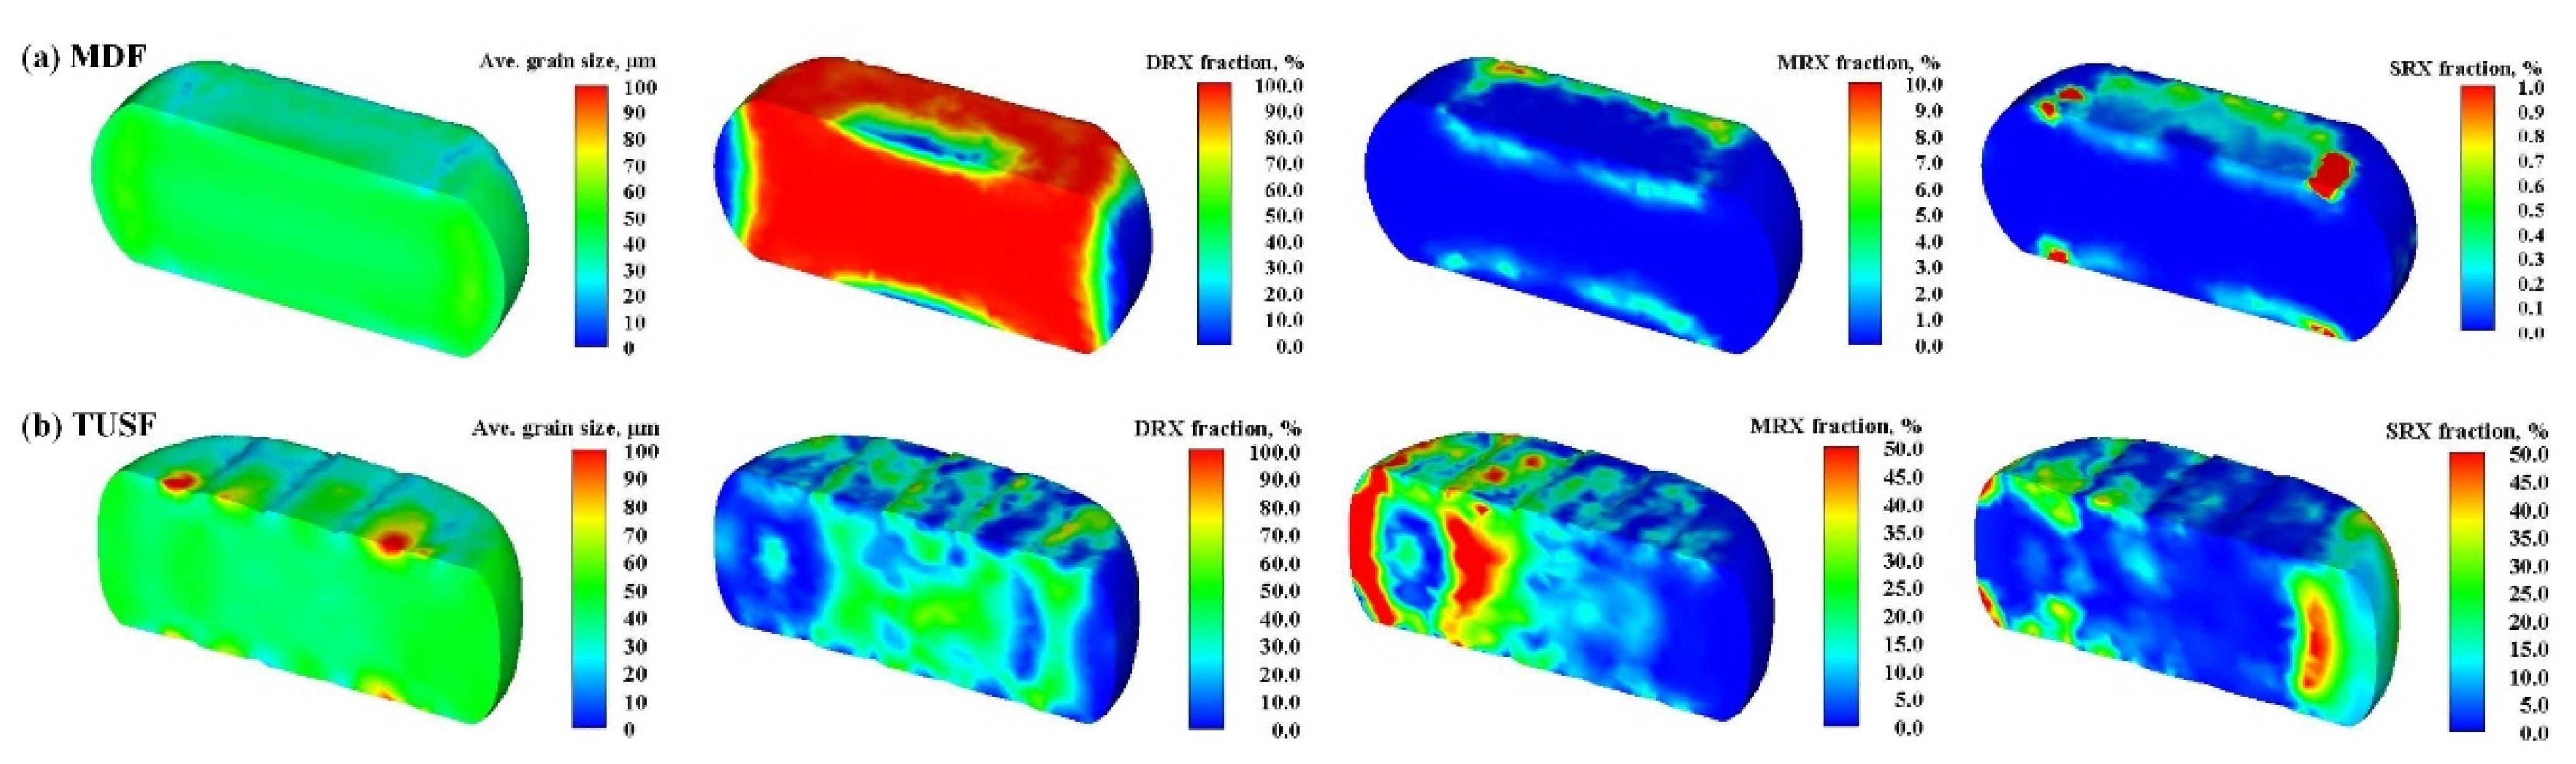
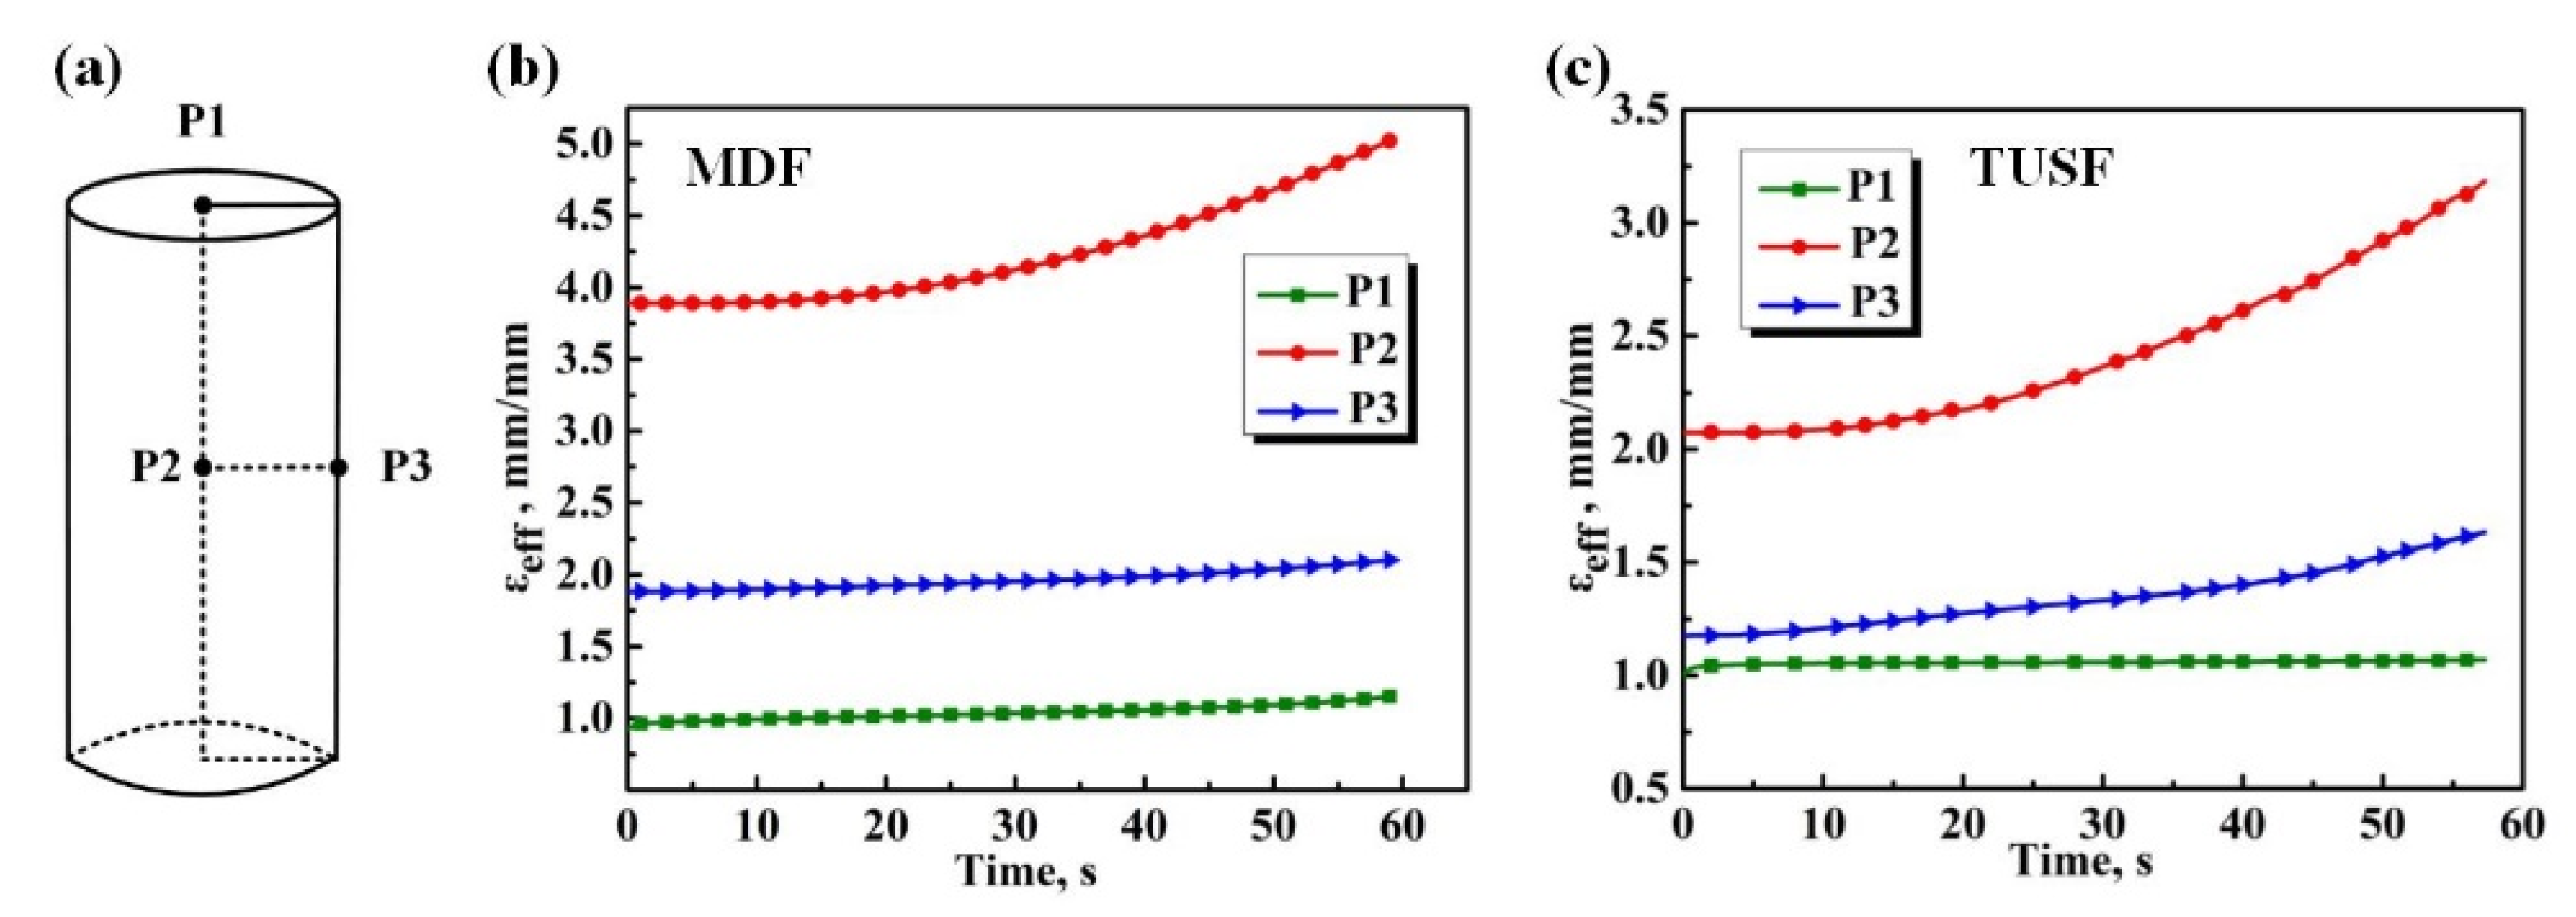
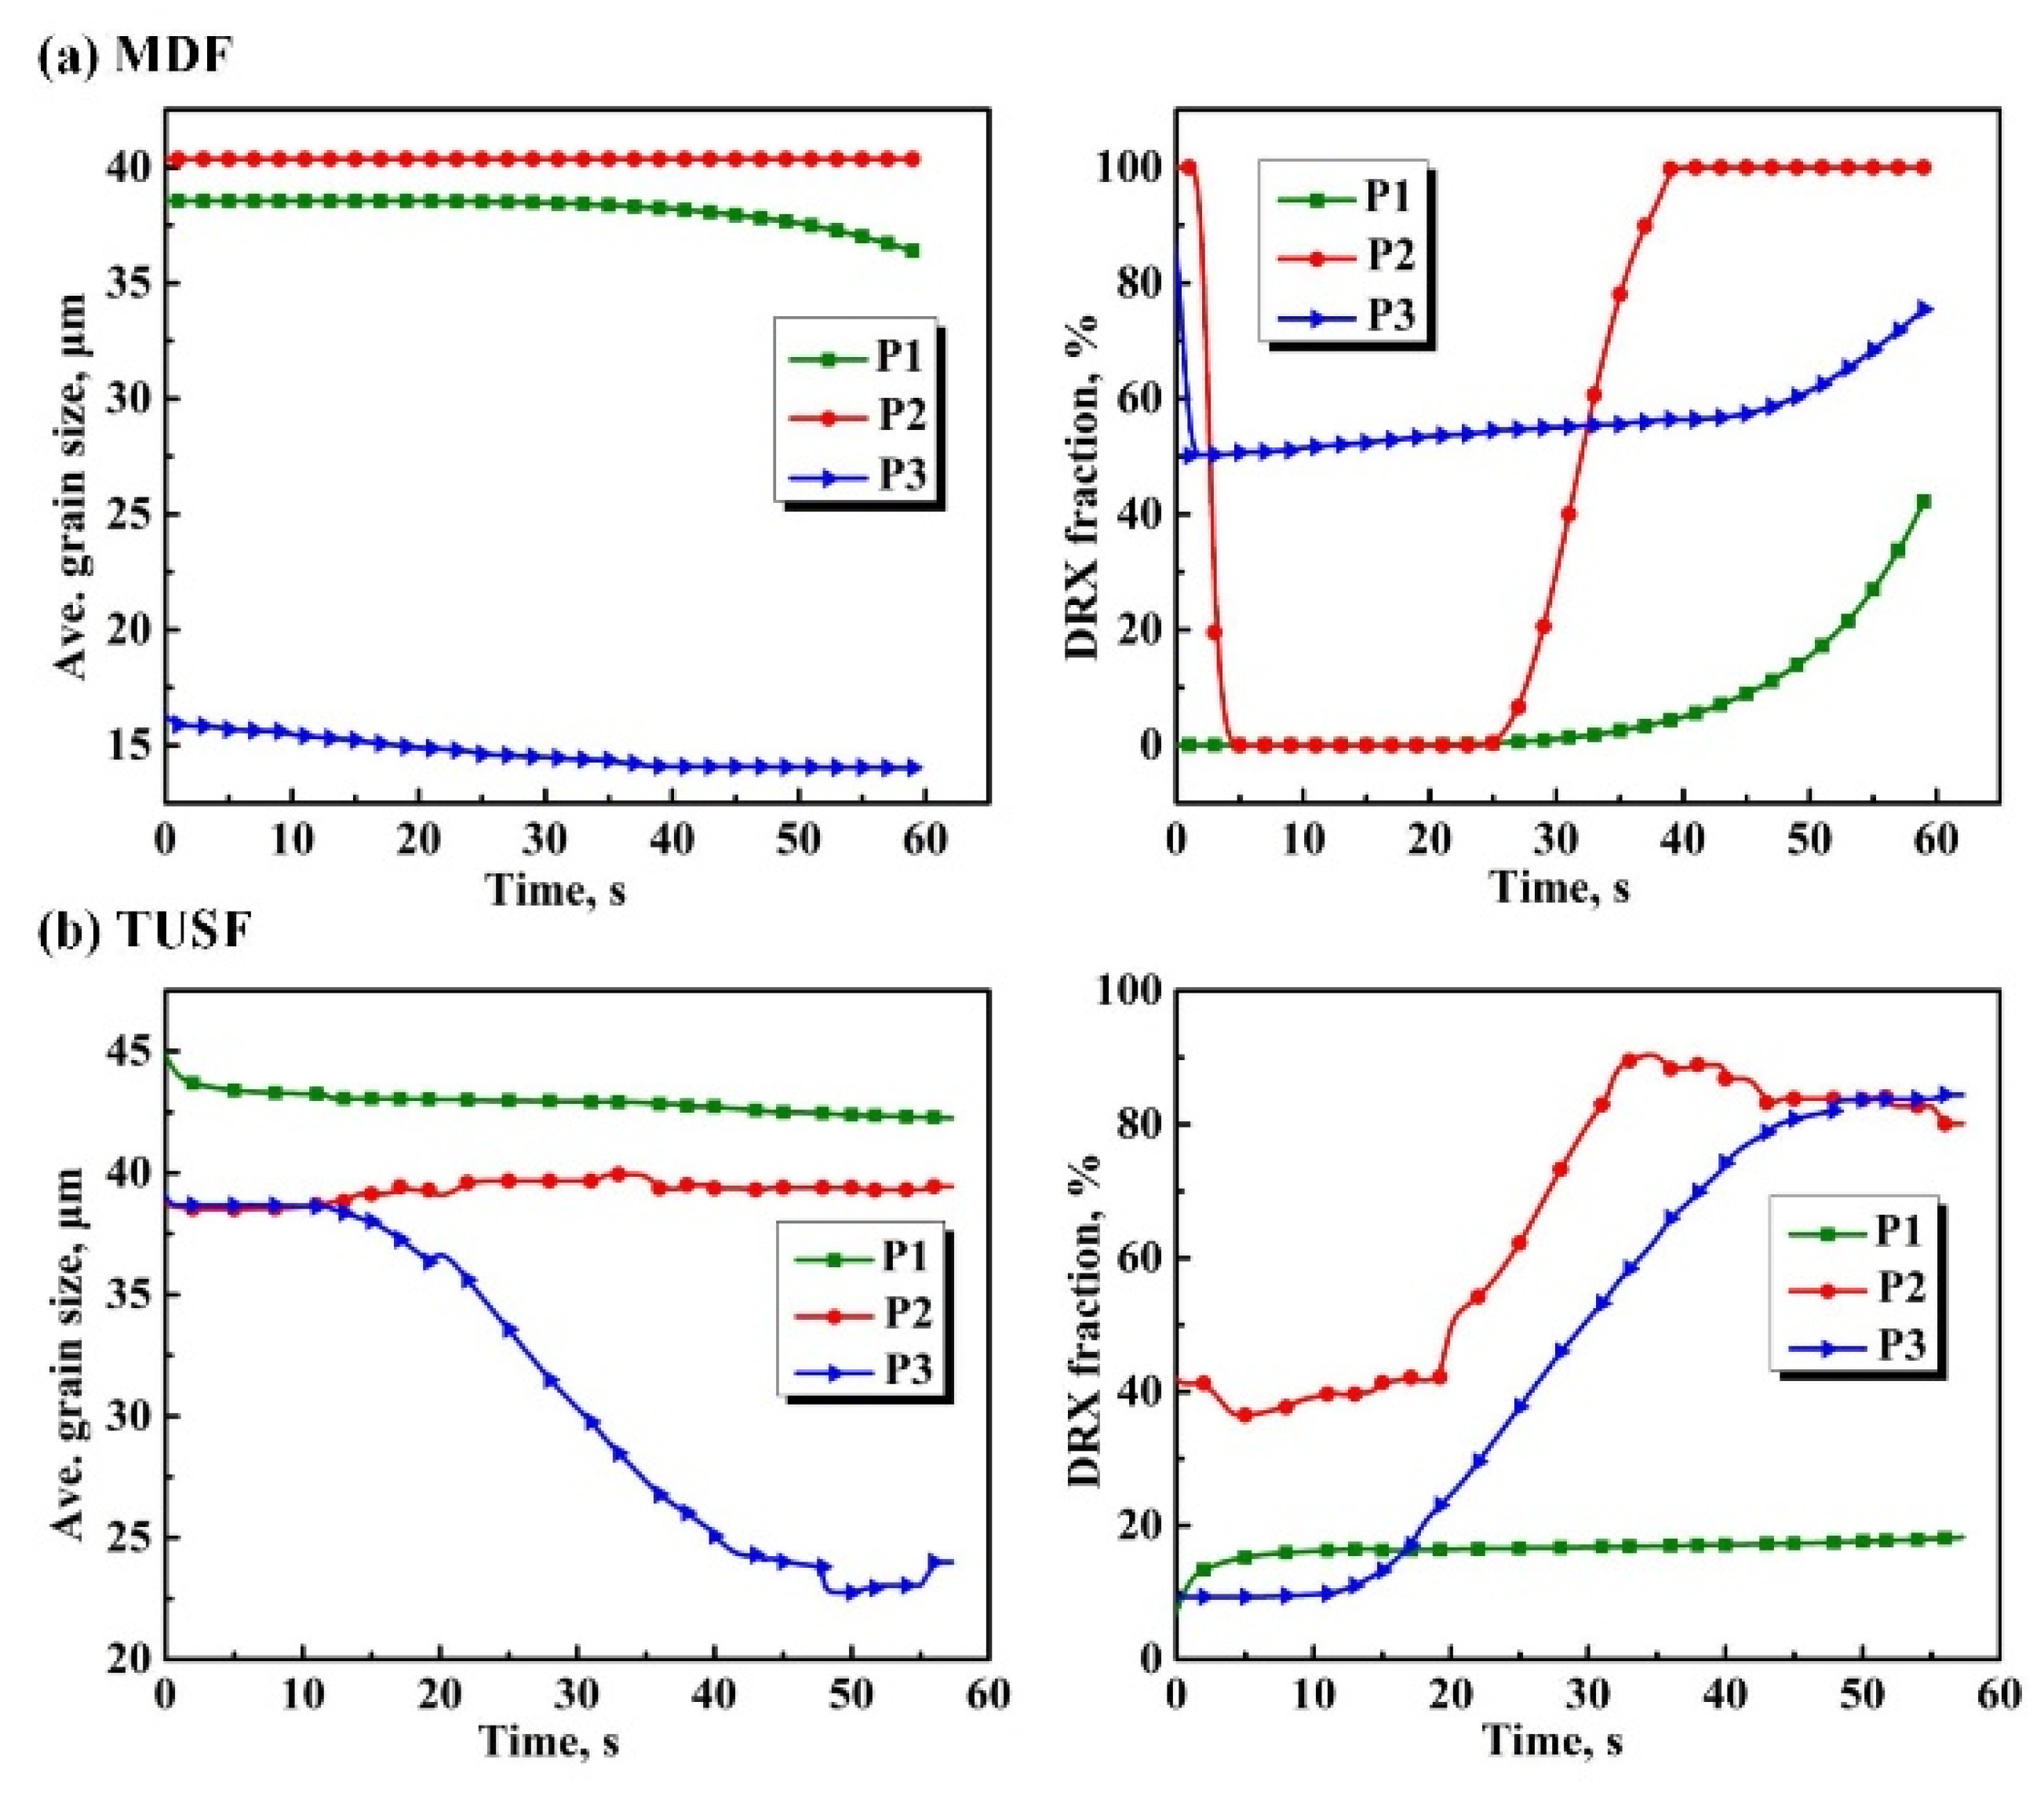
5.3. Comparison of Microstructural Evolution between MDF and TUSF
6. Conclusions
- (1)
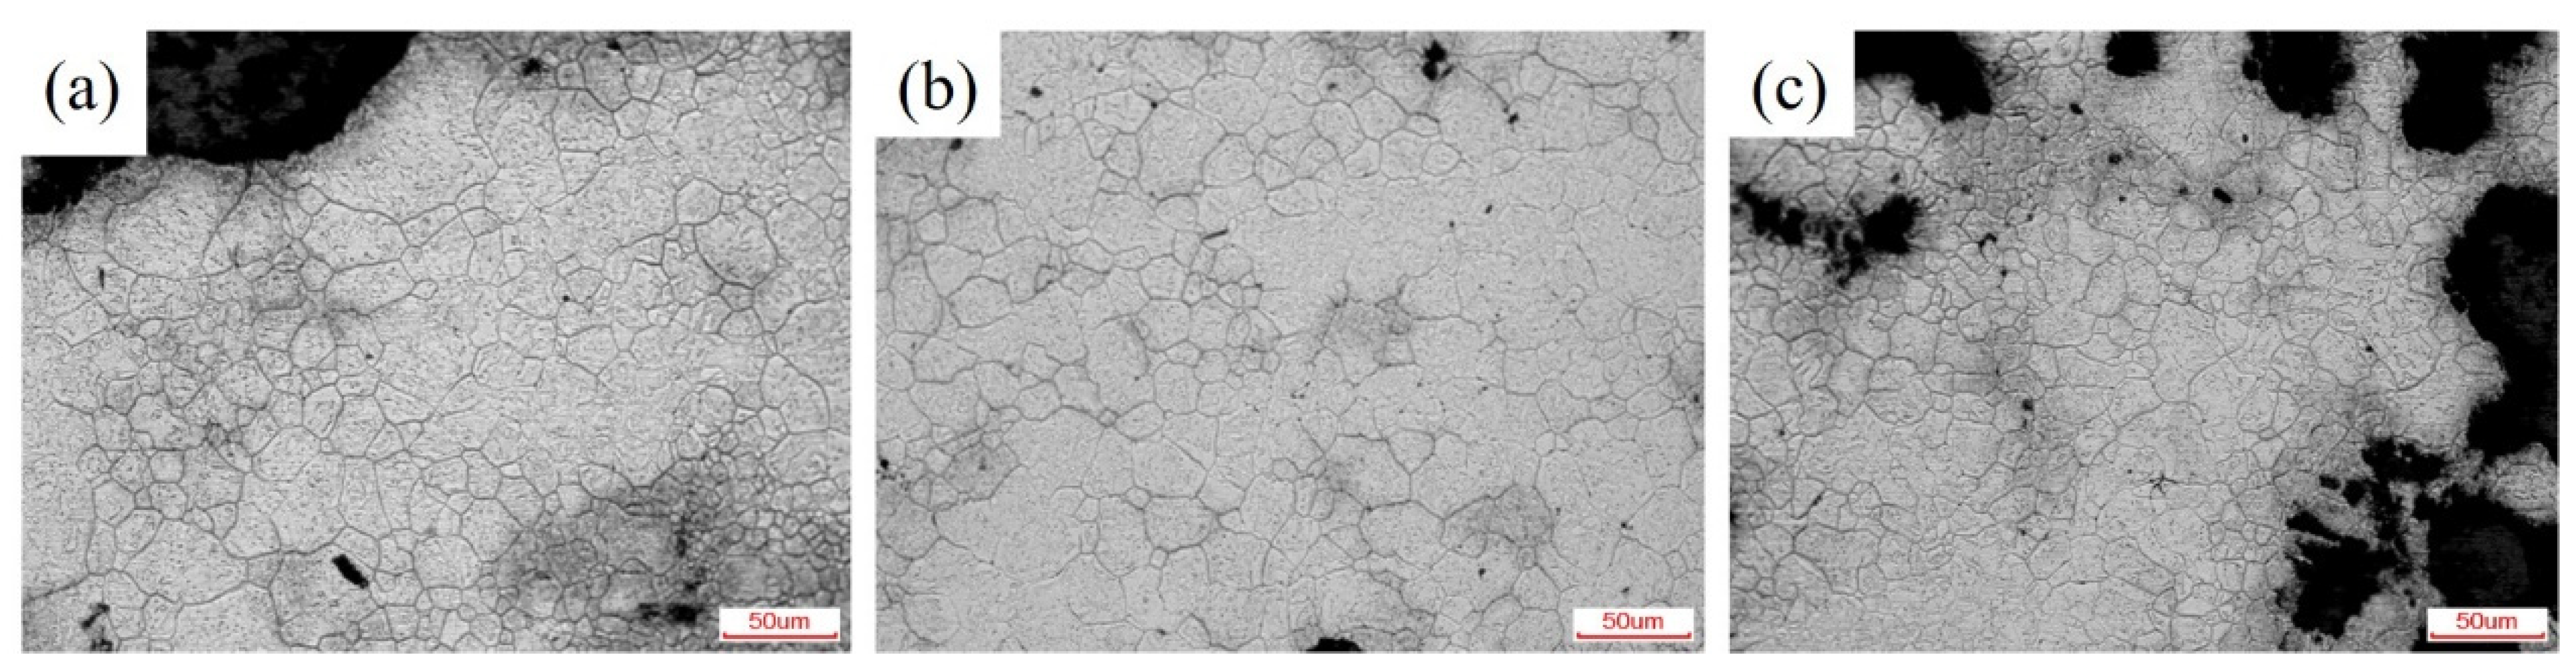
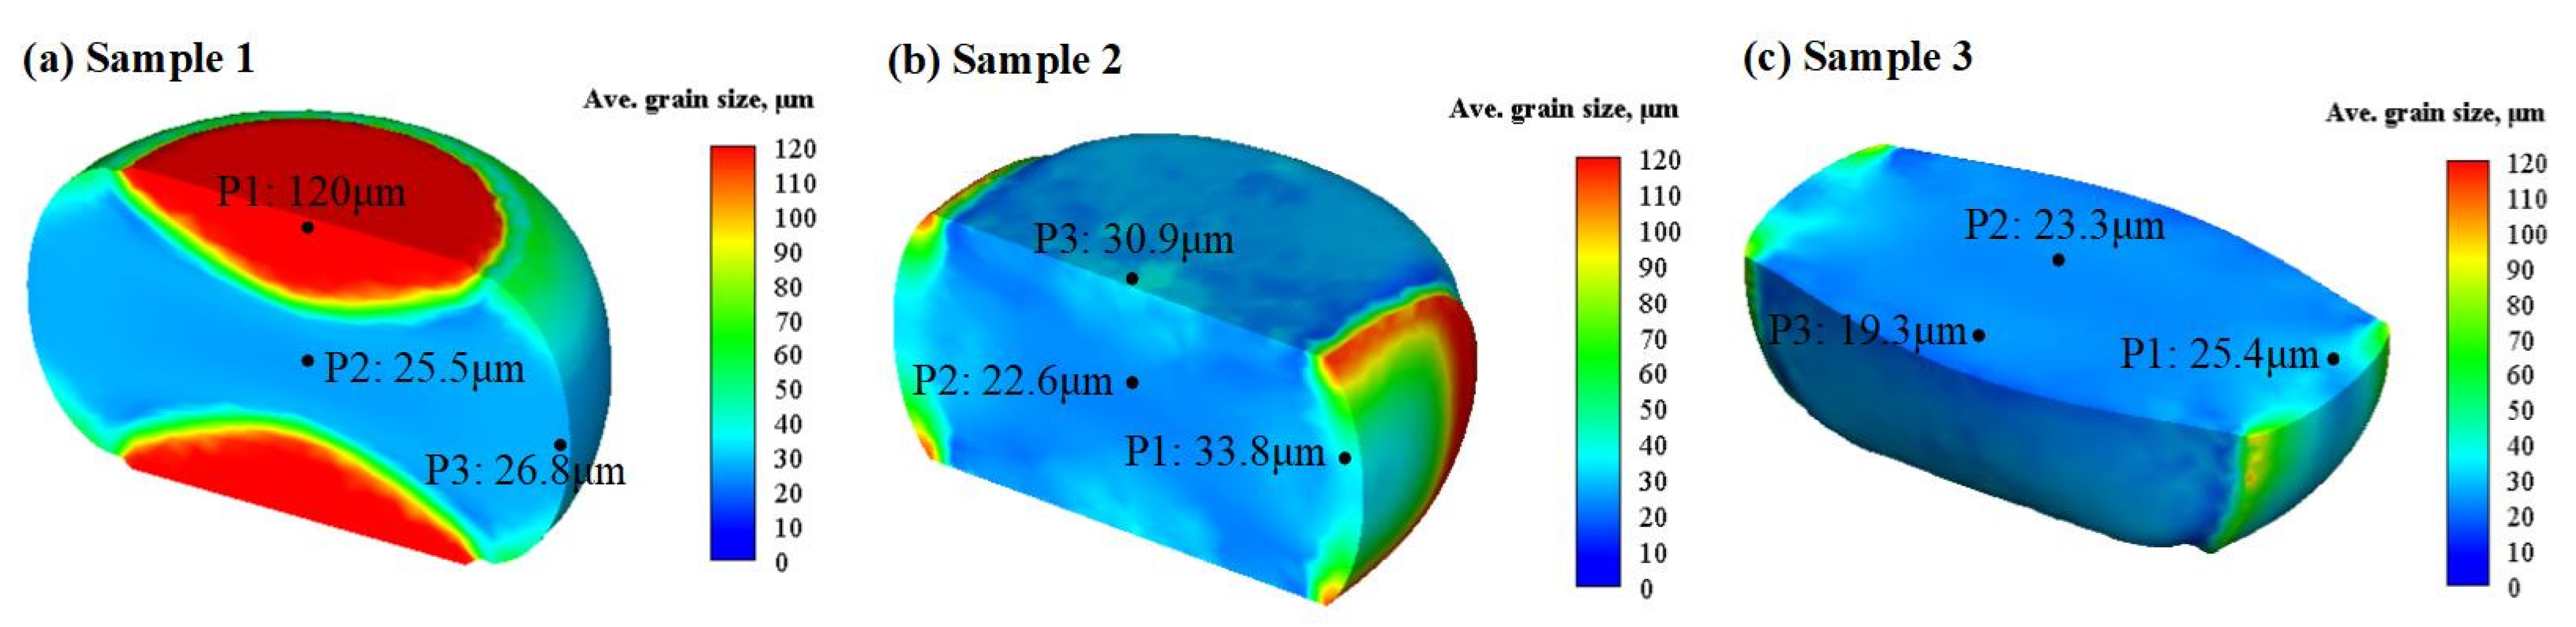
- The grain size distribution in the MDF specimen was inhomogeneous. During the first step of MDF, the microstructure undergoes significant grain refinement, but an inhomogeneous grain structure was obtained due to the inhomogeneous strain distribution at the centre and edge regions. Finer grains developed at the centre region during forging. Based on experimental results, the microstructural evolutionary model used in this study is reliable;
- (2)
- The forged ingot had an inhomogeneous grain distribution, and the average grain size at the core of the SDP1 steel sample after MDF was approximately 40.6–43.3 μm. Although this was slightly greater than the post-TUSF grain size (35.7–46.0 μm), the microstructure of the SDP1 steel sample after MDF was more uniform than that after TUSF;
- (3)
- After MDF, the grains at the core of the sample were completely recrystallised (a recrystallisation volume fraction of 100%). In contrast, after TUSF, the grains at the centre of the sample were completely recrystallised, resulting in a nonuniform grain structure. Insufficient recrystallisation can result in mixed crystals;
- (4)
- The average grain size of the SDP1 steel sample after MDF was 11.0–60.0 μm, which was smaller than that of the post-TUSF sample (12.0–132.0 μm). In addition, the surface of the sample after TUSF was not smooth, which can affect the overall performance of the sample and subsequent processing.
Author Contributions
Funding
Data Availability Statement
Acknowledgments
Conflicts of Interest
References
- Zheng, Y.-F.; Wu, R.-M.; Li, X.-C.; Wu, X.-C. Continuous cooling transformation behaviour and bainite formation kinetics of new bainitic steel. Mater. Sci. Technol. 2016, 33, 454–463. [Google Scholar] [CrossRef]
- Wu, R.M.; Zheng, Y.; Wu, X.C.; Li, X.C. Effect of titanium on the microstructure and hardness uniformity of non-quenched and tempered prehardened steel for large-section plastic mould. Ironmak. Steelmak. 2016, 44, 17–22. [Google Scholar] [CrossRef]
- Xiaoxiao, Z.; Xuan, C.; Xiaocheng, L.; Yushu, H.; Junwan, L.; Xiaochun, W. Numerical Study on Microstructure Evolution of Large Cross-section SDP1 Plastic Die Steel during Multi-directional Forging. Shanghai Metals 2020, 42, 57–62. [Google Scholar] [CrossRef]
- Xiao, Z.; Yang, X.; Wang, J.; Fang, Z.; Guo, C.; Zhang, D.; Yang, Y.; Zhang, X. Influence of Fe addition on annealing behav-iors of a phosphorus containing brass. J. Alloys. Compd. 2017, 712, 268–276. [Google Scholar] [CrossRef] [Green Version]
- Tang, L.; Liu, C.; Chen, Z.; Ji, D.; Xiao, H. Microstructures and tensile properties of Mg–Gd–Y–Zr alloy during multidirec-tional forging at 773K. Mater Des. 2013, 50, 587–596. [Google Scholar] [CrossRef]
- Bahmani, A.; Arthanari, S.; Shin, K.S. Achieving a high corrosion resistant and high strength magnesium alloy using multi directional forging. J. Alloys Compd. 2020, 856, 158077. [Google Scholar] [CrossRef]
- Heidarzadeh, A.; Saeid, T.; Klemm, V. Microstructure, texture, and mechanical properties of friction stir welded commer-cial brass alloy. Mater. Charact. 2016, 119, 84–91. [Google Scholar] [CrossRef]
- Miura, H.; Yu, G.; Yang, X. Multi-directional forging of AZ61Mg alloy under decreasing temperature conditions and im-provement of its mechanical properties. Mat. Sci. Eng. A-Struct. 2011, 528, 6981–6992. [Google Scholar] [CrossRef]
- Zherebtsov, S.V.; Salishchev, G.A.; Galeyev, R.M.; Valiakhmetov, O.R.; Mironov, S.Y.; Semiatin, S.L. Production of submi-crocrystalline structure in large-scale Ti–6Al–4V billet by warm severe deformation processing. Scripta Mater. 2004, 51, 1147–1151. [Google Scholar] [CrossRef]
- Miura, H.; Maruoka, T.; Yang, X.; Jonas, J.J. Microstructure and mechanical properties of multi-directionally forged Mg–Al–Zn alloy. Scripta Mater. 2012, 66, 49–51. [Google Scholar] [CrossRef]
- Gubicza, J.; Dobatkin, S.; Khosravi, E.; Kuznetsov, A.; Lábár, J.L. Microstructural stability of Cu processed by different routes of severe plastic deformation. Mater. Sci. Eng. A 2011, 528, 1828–1832. [Google Scholar] [CrossRef]
- Sitdikov, O.; Sakai, T.; Miura, H.; Hama, C. Temperature effect on fine-grained structure formation in high-strength Al alloy 7475 during hot severe deformation. Mater. Sci. Eng. A 2009, 516, 180–188. [Google Scholar] [CrossRef]
- Nunes, L.G.d.S.; Machado, M.L.P. Simulation of the Accumulative Roll-Bonding process through warm torsion test. J. Mater. Res. Technol. 2018, 7, 326–330. [Google Scholar] [CrossRef]
- Wang, H.; Su, L.; Yu, H.; Lu, C.; Tieu, A.K.; Liu, Y.; Zhang, J. A new finite element model for multi-cycle accumulative roll-bonding process and experiment verification. Mater. Sci. Eng. A-Struct. 2018, 726, 93–101. [Google Scholar] [CrossRef] [Green Version]
- Kulagin, R.; Beygelzimer, Y.; Ivanisenko, Y.; Mazilkin, A.; Straumal, B.; Hahn, H. Instabilities of interfaces between dissim-ilar metals induced by high pressure torsion. Mater. Lett. 2018, 222, 172–175. [Google Scholar] [CrossRef]
- Li, P.; Lin, Q.; Wang, X.; Tian, Y.; Xue, K.-M. Recrystallization behavior of pure molybdenum powder processed by high-pressure torsion. Int. J. Refract. Met. Hard Mater. 2018, 72, 367–372. [Google Scholar] [CrossRef]
- Martynenko, N.; Lukyanova, E.; Serebryany, V.; Gorshenkov, M.; Shchetinin, I.; Raab, G.; Dobatkin, S.; Estrin, Y. Increasing strength and ductility of magnesium alloy WE43 by equal-channel angular pressing. Mater. Sci. Eng. A-Struct. 2018, 712, 625–629. [Google Scholar] [CrossRef]
- Wei, J.; You, J.; Zhang, D.; Jiang, S.; Chen, Z.; Liu, C. Reducing yield asymmetry in a wrought Mg–9Al alloy by random-ized texture achieved via multi-directional forging. Mat. Sci. Eng. A-Struct. 2020, 796, 140003. [Google Scholar] [CrossRef]
- Manjunath, G.A.; Shivakumar, S.; Fernandez, R.; Nikhil, R.; Sharath, P.C. A review on effect of multi-directional forg-ing/multi-axial forging on mechanical and microstructural properties of aluminum alloy. Mater. Today. Proc. 2021, 47, 2565–2569. [Google Scholar] [CrossRef]
- Bagherpour, E.; Pardis, N.; Reihanian, M.; Ebrahimi, R. An overview on severe plastic deformation: Research status, techniques classification, microstructure evolution, and applications. Int. J. Adv. Manuf. Technol. 2018, 100, 1647–1694. [Google Scholar] [CrossRef] [Green Version]
- Xing, J.; Yang, X.; Miura, H.; Sakai, T. Mechanical Properties of Magnesium Alloy AZ31 after Severe Plastic Deformation. Mater. Trans. 2008, 49, 69–75. [Google Scholar] [CrossRef] [Green Version]
- Zhang, R.; Wang, D.; Yuan, S. Effect of multi-directional forging on the microstructure and mechanical properties of TiBw/TA15 composite with network architecture. Mater. Des. 2017, 134, 250–258. [Google Scholar] [CrossRef]
- Zhang, Z.; Qu, S.; Feng, A.; Shen, J. Achieving grain refinement and enhanced mechanical properties in Ti–6Al–4V alloy produced by multidirectional isothermal forging. Mater. Sci. Eng. A-Struct. 2017, 692, 127–138. [Google Scholar] [CrossRef]
- Khani Moghanaki, S.; Kazeminezhad, M.; Logé, R. Mechanical behavior and texture development of over-aged and solu-tion treated Al-Cu-Mg alloy during multi-directional forging. Mater. Charact. 2018, 135, 221–227. [Google Scholar] [CrossRef]
- Huang, H.; Zhang, J. Microstructure and mechanical properties of AZ31 magnesium alloy processed by multi-directional forging at different temperatures. Mater. Sci. Eng. A-Struct. 2016, 674, 52–58. [Google Scholar] [CrossRef]
- Seshacharyulu, T.; Medeiros, S.; Morgan, J.; Malas, J.; Frazier, W.; Prasad, Y. Hot deformation mechanisms in ELI Grade Ti-6a1-4V. Scr. Mater. 1999, 41, 283–288. [Google Scholar] [CrossRef]
- Nakao, Y.; Miura, H. Nano-grain evolution in austenitic stainless steel during multi-directional forging. Mater. Sci. Eng. A-Struct. 2011, 528, 1310–1317. [Google Scholar] [CrossRef]
- Zherebtsov, S.; Murzinova, M.; Salishchev, G.; Semiatin, S. Spheroidization of the lamellar microstructure in Ti–6Al–4V alloy during warm deformation and annealing. Acta Mater. 2011, 59, 4138–4150. [Google Scholar] [CrossRef]
- Soleymani, V.; Eghbali, B. Grain Refinement in a Low Carbon Steel Through Multidirectional Forging. J. Iron Steel Res. Int. 2012, 19, 74–78. [Google Scholar] [CrossRef]
- Li, X.; Duan, L.; Li, J.; Wu, X. Experimental study and numerical simulation of dynamic recrystallization behavior of a mi-cro-alloyed plastic mold steel. Mater. Des. 2015, 66, 309–320. [Google Scholar] [CrossRef]
- Kim, W.J.; Hong, S.I.; Kim, Y.S.; Min, S.H.; Jeong, H.T.; Lee, J.D. Texture development and its effect on mechanical proper-ties of an AZ61 Mg alloy fabricated by equal channel angular pressing. Acta Mater. 2003, 51, 3293–3307. [Google Scholar] [CrossRef]
- Sakai, T.; Belyakov, A.; Kaibyshev, R.; Miura, H.; Jonas, J.J. Dynamic and post-dynamic recrystallization under hot, cold and severe plastic deformation conditions. Prog. Mater. Sci. 2014, 60, 130–207. [Google Scholar] [CrossRef] [Green Version]
- Lu, Y.; Ma, R.; Wang, Y.-n. Texture evolution and recrystallization behaviors of Cu–Ag alloys subjected to cryogenic roll-ing. T. Nonferr. Metal. Soc. 2015, 25, 2948–2957. [Google Scholar] [CrossRef]
- Dehghan-Manshadi, A.; Barnett, M.R.; Hodgson, P.D. Recrystallization in AISI 304 austenitic stainless steel during and af-ter hot deformation. Mat. Sci. Eng. A-Struct. 2008, 485, 664–672. [Google Scholar] [CrossRef]
- Montheillet, F.; Lurdos, O.; Damamme, G. A grain scale approach for modeling steady-state discontinuous dynamic re-crystallization. Acta Mater. 2009, 57, 1602–1612. [Google Scholar] [CrossRef]
- Eghbali, B. Effect of strain rate on the microstructural development through continuous dynamic recrystallization in a microalloyed steel. Mater. Sci. Eng. A-Struct. 2010, 527, 3402–3406. [Google Scholar] [CrossRef]
- Li, D.; Guo, Q.; Guo, S.; Peng, H.; Wu, Z. The microstructure evolution and nucleation mechanisms of dynamic recrystalli-zation in hot-deformed Inconel 625 superalloy. Mater. Des. 2011, 32, 696–705. [Google Scholar] [CrossRef]
- Vervynckt, S.; Verbeken, K.; Thibaux, P.; Houbaert, Y. Recrystallization–precipitation interaction during austenite hot de-formation of a Nb microalloyed steel. Mat. Sci. Eng. A-Struct. 2011, 528, 5519–5528. [Google Scholar] [CrossRef]
- BadJena, S.; Park, J. Effect of particles on the dynamic recrystallization behavior of Al–V–N micro-alloyed medium carbon steel. Mater. Sci. Eng. A-Struct. 2012, 548, 126–133. [Google Scholar] [CrossRef]
- Mehtonen, S.; Karjalainen, L.; Porter, D. Hot deformation behavior and microstructure evolution of a stabilized high-Cr ferritic stainless steel. Mater. Sci. Eng. A-Struct. 2013, 571, 1–12. [Google Scholar] [CrossRef]


| Element | C | Cr | Mn | Mo | Si | N | Nb | S | P | Fe |
|---|---|---|---|---|---|---|---|---|---|---|
| Wt.% | 0.30 | 1.40 | 2.00 | 0.30 | 0.20 | 0.008 | 0.035 | ≤0.003 | ≤0.015 | Bal. |
| Quantity | Equation |
|---|---|
| Zener–Holloman parameter | |
| DRX grain size evolution | |
| DRX rate | |
| Peak strain | |
| DRX fraction | |
| Time for 50% SRX | |
| SRX volume fraction | |
| Time for 50% MRX | |
| MRX volume fraction | |
| Grain growth |
Publisher’s Note: MDPI stays neutral with regard to jurisdictional claims in published maps and institutional affiliations. |
© 2022 by the authors. Licensee MDPI, Basel, Switzerland. This article is an open access article distributed under the terms and conditions of the Creative Commons Attribution (CC BY) license (https://creativecommons.org/licenses/by/4.0/).
Share and Cite
Chen, X.; Wu, B.; Li, J.; Zhang, X.; Zuo, P.; Wu, X.; Li, J. Microstructural Evolution in Large-Section Plastic Mould Steel during Multi-Directional Forging. Metals 2022, 12, 1175. https://doi.org/10.3390/met12071175
Chen X, Wu B, Li J, Zhang X, Zuo P, Wu X, Li J. Microstructural Evolution in Large-Section Plastic Mould Steel during Multi-Directional Forging. Metals. 2022; 12(7):1175. https://doi.org/10.3390/met12071175
Chicago/Turabian StyleChen, Xuan, Boya Wu, Jiayuan Li, Xiaoxiao Zhang, Pengpeng Zuo, Xiaochun Wu, and Junwan Li. 2022. "Microstructural Evolution in Large-Section Plastic Mould Steel during Multi-Directional Forging" Metals 12, no. 7: 1175. https://doi.org/10.3390/met12071175