Article

Phase-Field Simulation of Spinodal Decomposition in Mn-Cu Alloys

by
Darío A. Sigala-García
*,
Víctor M. López-Hirata
,
Maribel L. Saucedo-Muñoz
,
Héctor J. Dorantes-Rosales
and
José D. Villegas-Cárdenas
Higher Education School of Chemical Engineering and Extractive Industries, National Polytechnic Institute, Mexico City 07300, Mexico
*
Author to whom correspondence should be addressed.
Metals 2022, 12(7), 1220; https://doi.org/10.3390/met12071220
Submission received: 16 June 2022 / Revised: 12 July 2022 / Accepted: 14 July 2022 / Published: 19 July 2022
(This article belongs to the Special Issue Computer Methods in Metallic Materials)

Abstract

:
The spinodal decomposition was studied in the aged Mn-40 at. %Cu, Mn-30 at. %Cu, Mn-20 at. %Cu alloys using a phase-field model based on the Cahn–Hillard equation, considering a subregular solution model and the energy contribution of the magnetic behavior. The simulations were performed at aging temperatures of 300, 400, and 500 °C for times from 1 to 240 min. The growth kinetics of the Mn concentration profiles with time indicated clearly that the phase decomposition of the supersaturated solid solution γ into a mixture of Mn-rich γ′ and Cu-rich γ phases occurred by the spinodal decomposition mechanism. Moreover, the phase decomposition at the early stages of aging exhibited the characteristic morphology of spinodal decomposition, an interconnected and percolated microstructure of the decomposed phases. The most rapid growth kinetics of spinodal decomposition occurred for the aging of Mn-20 and 30 at. %Cu alloys because of the higher driving force. The presence of the phase decomposition is responsible for the increase in hardness, as well as the improvement of the damping capacity of Mn-Cu alloys.

1. Introduction

The Mn-rich Mn-Cu-based alloys have attracted interest for their use in some vehicles and high-precision instruments to diminish vibration and noise because of the high damping capacity [1]. This property has been associated with the martensitic transformation of this type of alloy [1,2]. These alloys present an excellent combination of mechanical properties, high damping capacity, and shape memory effect [1,2,3,4,5,6,7,8,9]. Additionally, Mn-Cu alloys exhibit good workability at casting, machining, forging, and rolling [4].
The equilibrium Mn-Cu phase diagram exhibits a wide solubility in the liquid state. Likewise, there is only a solid solution of Cu in γMn at high temperatures. On the Mn-rich side, a eutectoid reaction is present at about 727 °C, which produces a mixture of fcc γCu-rich and fcc γ′Mn-rich. Moreover, a metastable miscibility gap is located at temperatures lower than 600 °C on the Mn-rich side [3,4,9,10,11,12,13,14,15,16].
Several works [5,9,14] indicated that the spinodal decomposition is essential for improving the strength of Mn-Cu alloys. An aging treatment at temperatures located in the miscibility gap region promotes the phase decomposition of the γMn-based solid solution into a mixture of the fcc Cu-rich and fcc Mn-rich phases by the spinodal decomposition mechanism. This microstructure was designated as the “tweed structure” [6].
Several investigations [2,6,9,14,16] found a relation of the mechanical damping capacity to the spinodally decomposed microstructure, Cu-rich and Mn-rich phases, in Mn-Cu alloys. That is, the fcc Mn-rich phase preceded the formation of the fct phase formed during the cooling to room temperature after the aging treatment.
Therefore, an appropriate heat treatment of Mn-Cu alloys is essential [2,3,6,9,10,11,12] to develop the spinodal decomposition of the solid supersaturated solution into fcc γCu-rich and fcc γ′Mn-rich phases, which may favor good mechanical properties. Thus, it is crucial to study the alloys phase decomposition in more detail at the early stages.
A helpful tool for the simulation of microstructural evolution in alloys is the phase-field method. Saito et al. [17] developed one of the earliest phase-field formulism based on the Cahn–Hilliard equation to study the phase separation kinetics. From the Saito model, numerous simulations of the kinetics of phase separation for different alloys have been proposed and showed an acceptable fit with experimental results [18,19,20,21,22,23,24,25,26,27,28,29,30]. The results of the phase-field method enable one to follow the microstructure evolution and growth kinetics of polymers, fracture, grain growth, phase decomposition, etc. [20,21,22,23,24], not only in binary alloys, but also in ternary and quaternary alloys [18,19,25,26,27,28,29,30]. Therefore, it seems to be a good alternative for analyzing the phase decomposition in aged Mn-rich Mn-Cu alloys, since no phase-field simulation results are reported in the literature.
Thus, this work aims to carry out the growth kinetics and microstructural simulation of the spinodal decomposition for the Mn-rich Mn-Cu alloys to analyze in more detail the spinodal decomposition process in this alloy system.

2. Numerical Formulation

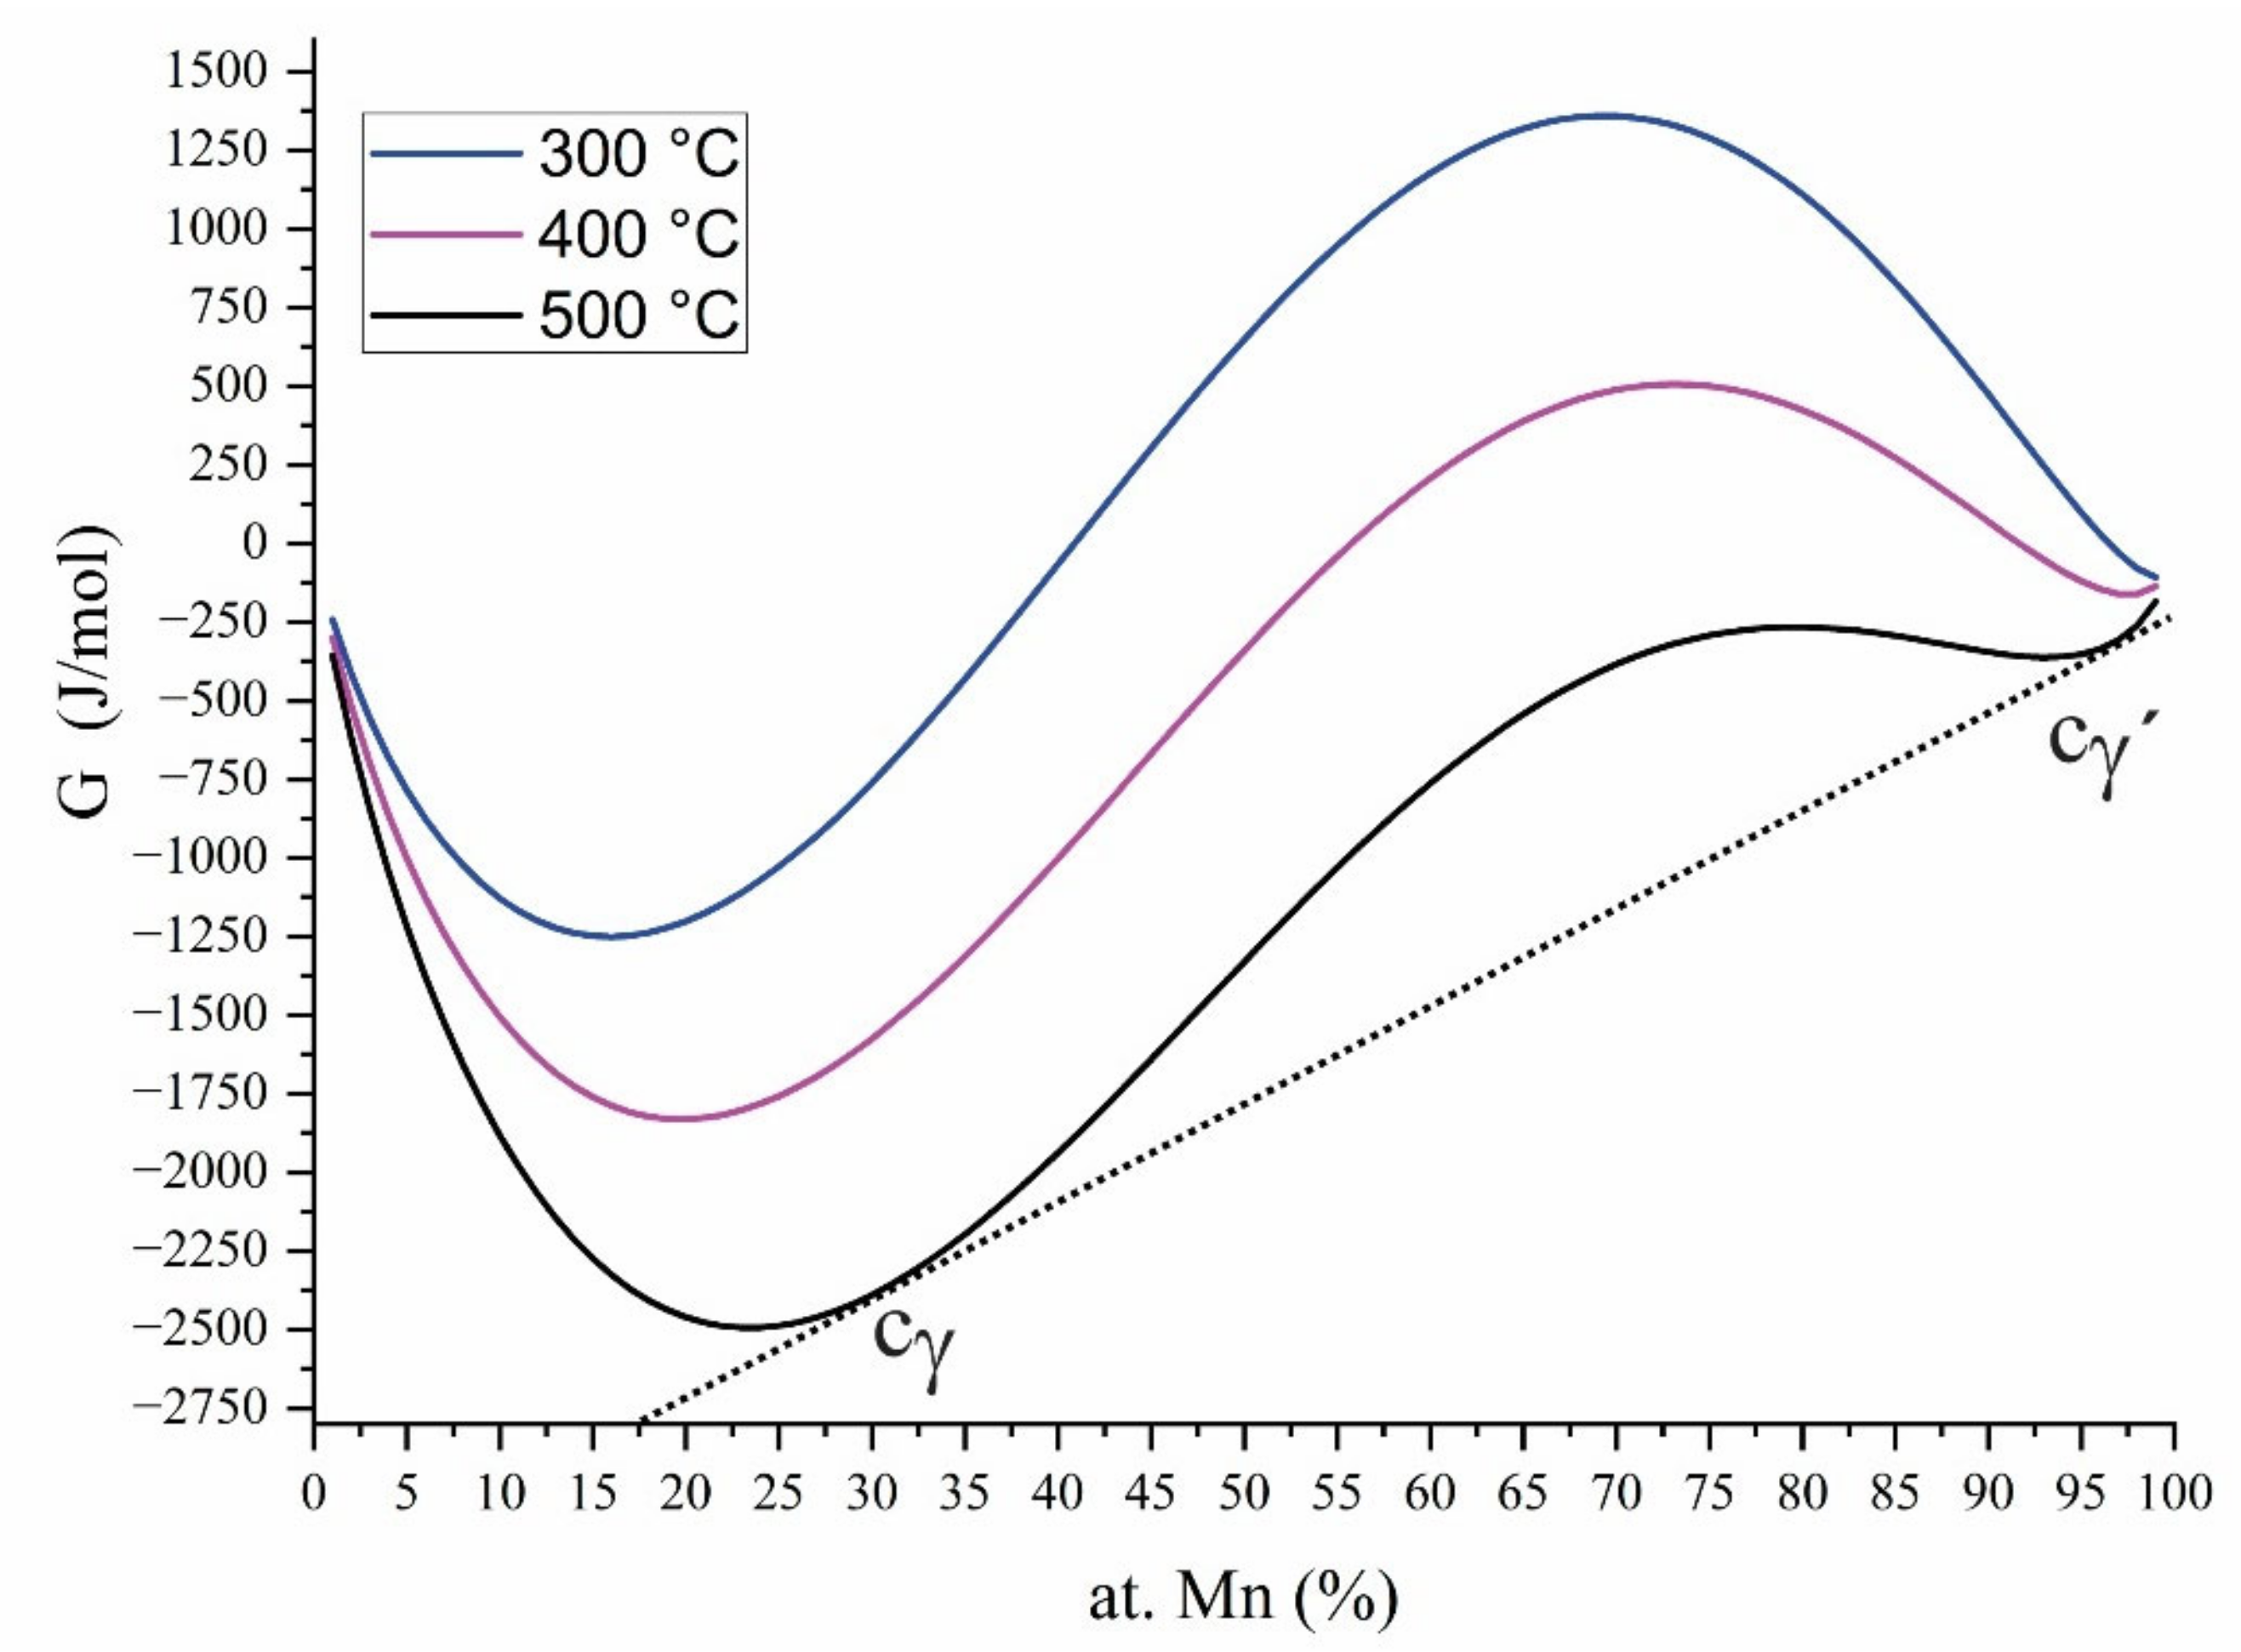
2.1. Thermodynamic Equilibrium

The Gibbs free energy of a binary alloy in the fcc γ-phase is described by [28,31,32]:
G γ = c C u ° G C u γ + c M n ° G M n γ + R T c C u ln c C u + c M n ln c M n + G C u M n E + G m a g
where ° G C u γ and ° G M n γ are the Gibbs free energies of pure Cu and Mn, respectively, in the γ-phase reference state, R is the gas constant, T is the absolute temperature, and c i is the mole fraction of component. The Gibbs free energy of pure component i is taken for the different phases from the SGTE compilation [33]. Finally, G C u M n E is the excess Gibbs free energy of the alloy; if G C u M n E is positive as in this case, a concave-down region can develop, which leads to phase separation and can be defined as:
G C u M n E = c C u   c M n   L C u   M n   γ
L C u M n γ is the binary composition–temperature-dependent interaction energy of the combination of Cu and Mn fcc γ-phases [4,34] and is usually expressed by the Redlich–Kister equation:
m L i j γ = L 0 C u M n γ + L 1 C u M n γ + L 2 C u M n γ   ln   T
G m a g of Equation (1) is the magnetic contribution to the Gibbs free energy and was described by Hillert and Jarl [35] as:
G m a g = R T ln β + 1 g τ  
where β is the average magnetic moment per atom, τ is T/TN, and TN is the Neel temperature. The values of β and TN can be obtained experimentally, and their values would be negative when they are theoretically obtained. To obtain the real value of β and TN, they must be divided by −3 for phases with fcc and hcp crystalline structures and −1 for phases with a bcc crystalline structure [28]. g τ is a function of the value of τ and given by:
g τ = 1 1 D   79 τ 1 140   p + 474 497 1 p 1 τ 3 6 + τ 9 135 + τ 15 600   τ 1
g τ = 1 D   τ 5 10 + τ 15 315 + τ 25 1500   τ > 1  
with
D = 518 1125 + 11692 15975 1 p 1  
The value of p is intended as the structure-dependent fraction of the magnetic enthalpy absorbed above the critical temperature. The value of p = 0.4 for the bcc phase and p = 0.28 for all other phases [28,36].
The thermodynamic parameters used in the calculation of the chemical equilibrium, are listed in Table 1. As an important remark, the parameters with energy units (J/mol) are normalized to RT.
Equation (1) defines the free-energy curve, which is double-well-shaped as a function of the composition of the alloy at different temperatures, as shown in Figure 1.
The spinodal region inside the miscibility gap was determined at different temperatures according to the condition [36,37]:
2 G γ c M n 2 = 0  
The equation for the second derivative with respect to composition is defined by [38]:
2 G γ c M n 2 = R T 1 1 c M n + 1 c M n 2 L 0 C u M n γ 6 1 2 c M n L 1 C u M n γ  
The second-order partial derivative of the free energy curve at different temperatures as a function of the composition is shown in Figure 2. According to the calculations, the metastable miscibility gap presents the highest critical temperature at 703 °C at 78% Mn and with a good fitting with the critical temperature of Wang and He [5,37].
Based on a thermodynamic analysis, the metastable spinodal region was calculated and is represented in the phase diagram of Figure 3. This figure also shows the calculated miscibility gap by Wang and Lui [5]. The spinodal curve is located inside the miscibility gap as expected [31,32].

2.2. Elastic Strain Energy

The contribution of the elastic energy is described as [25,26,28]:
f e l = 1 2 V σ i j ε i j e l d v  
where σ i j and ε i j e l are the stresses and elastic strains, respectively. The elastic strains are expressed as:
ε i j e l = ε i j ε i j 0
The term ε i j 0 is the magnitude of the eigenstrains. The position- and composition-dependent eigenstrain ε i j is the total strain and taken as:
ε i j = 1 2 u i x j + u j x i
in which u and x are the displacement and position vectors, respectively.
Both fcc Cu-rich and Mn-rich phases are assumed to behave with linear elasticity, as predicted by Hooke’s law. The stresses are calculated as:
σ i j = C i j k l ε k l e l
where C i j k l is the elastic modulus tensor, which is dependence on the position and composition. Substituting the stress strain σ i j   in Equation (10), the contribution of the elastic energy is calculated as follows:
f e l = 1 2 V C i j k l ε i j e l d V  
Substituting the components of the elastic modulus tensor in a cubic lattice and only considering first-order elastic interactions, the elastic function can be reduced as:
f e l = 1 2 V C 11 ε 11 e l ε 11 e l + C 11 ε 22 e l ε 22 e l + 2 C 12 ε 11 e l ε 22 e l + 4 C 44 ε 12 e l ε 12 e l d V
With the Green function, the deformation field can be calculated from the values of the eigenstrains as:
Γ i j k l = 1 4 G j k k l k i + G i k k l k j + G j l k k k i + G i l k k k j
ε i j k = Γ i j k l τ k l k
where k i is the Fourier vector, τ k l k is the Fourier transform of the stress field, and the Green’s function ( G j k ) represents the displacement component in the x k direction. In a crystal with cubic anisotropy, the Green’s function in two dimensions is given by:
ω i i = C 44 + C 11 C 44 k j 2 + k k 2 + ξ C 11 C 12   k j 2 k k 2 C 44 D
ω i j = C 12 + C 44 1 + C 11 k k 2 C 44 D k i k j  
and
ξ = C 11 C 12 2 C 44 C 44
D = C 11 + ξ C 11 + C 12 k j 2 k k 2
G j k = 1 k 2 ω i j
The term k in Equation (22) is the magnitude of the Fourier vector, and can be calculated as follows:
n = k k = k i , k j k i 2 + k j 2  
The used elastic constants and lattice parameters are found in Table 2.

2.3. Phase-Field Model

The phase transformation in the Cu-Mn alloys can be studied by the Cahn–Hilliard diffusion equation considering local chemical energy f c h and the elastic strain energy f e l . The conserved concentration field c i can be calculated with constant mobility as follows [25,26,42].
c i ( x , t t = 2 M i 2 G c i x i 2 + 2 f e l c i 2 k 2 c i
where c i ( x , t is the concentration as a function of distance ( x ) and time ( t ), k is the gradient energy coefficient, and M is the atomic mobility of the system as defined by Darken’s equation [18,19,25,26,28]:
M i = D C u c C u + 1 c M n D M n
The atomic diffusion of each element in the corresponding phase, D i , is calculated with the following equation [28,31]:
D i = D 0 × exp Q i R T ,   i = C u ,   M n
where Q i is the activation energy and D 0 the frequency factor.
The concentration dependence of the gradient energy coefficient k was defined by Hilliard [18,19,26,31]:
k = 2 3 h 0.5 M r 0 2  
where h 0.5 M is the heat of mixing per unit volume at c = 0.5 and r 0 is the nearest-neighbor distance. The heat of mixing h M is determined according to the following equation [18,19,25,26,31]:
h M = c C u c M n L C u M n φ  

2.4. Simulation Conditions

The spinodal decomposition in Mn-Cu alloys was studied using the Cahn–Hilliard equation considering the chemical, magnetic, and elastic energies. Subsequently, a Python 3.8 programing language code was developed to solve the partial differential equations (PDEs) using the Fourier spectral method, and the microstructural evolution was exported as VTK files to open with the Paraview 5.9.1 open-source software program (National Technology & Engineering Solutions of Sandia, LLC (NTESS), Kitware Inc., Clifton Park, NY, USA, 2005–2017). The simulations are presented as a square domain of 100 nm × 100 nm. For time integration, the time step of 0.01 s was used for times of 1–240 min. Lastly, the effect of the Cu concentration and the aging temperature was studied on the morphology, volume percent, and average radius of precipitates on the spinodal decomposition for the Mn-40 at. %Cu, Mn-30 at. %Cu, and Mn-20 at. %Cu alloys aged at temperatures of 300 °C, 400 °C, and 500 °C, which are indicated with green circles inside the chemical spinodal of the equilibrium Cu-Mn phase diagram, as shown in Figure 3.

3. Results

3.1. Evolution of Calculated Profiles

To analyze the calculated profiles for the alloys aged at 500 °C for times from 1 to 240 min, Figure 4a–c present the calculated Mn concentration profile of the Mn-40 at. %Cu, Mn-30 at. %Cu, and Mn-20 at. %Cu alloys, respectively, showing the decomposition of the supersaturated γ phase into a mixture of Cu-rich γ and Mn-rich γ′ phases. As shown in Figure 1, at the early stages of aging, at 1 min, the γ-supersaturated solid solution is unstable, and the changes correspond to homophase fluctuations. These composition fluctuations guide a reduction of the free energy, and an uphill diffusion takes place. After 60 min of aging, the modulation amplitude increases with time, and the concentration profile exhibits a heterophase fluctuation [31,32], as can be seen in Figure 1 and Figure 3. This fact suggests that the spinodal decomposition takes place at the early stages of aging to produce Mn-rich γ′ and Cu-rich γ phases, which agrees with several experimental works for this alloy system in the literature [3,4,9,10,12]. Thus, the spinodal decomposition reaction can be expressed by the following reaction:
γ Mn rich γ + Cu rich   γ
Figure 4 also indicate that the amplitude of modulation fluctuations reaches a value of about 34 at. %Mn and 97 at. %Mn for the γ and γ′ phases, respectively, which are close to the equilibrium, Figure 1.
The difference between the equilibrium composition, presented in Figure 1, and that of concentration profiles in Figure 4, can be due to the interfacial energy of the nanometric decomposed phases. The measured wavelength of phase decomposition was about 5 and 8 nm after aging of 20 and 60 min, respectively. The growth kinetics of modulation wavelength with time was generally slow for the early stages of phase decomposition, as expected according to the spinodal decomposition theory [43]. The fastest growth kinetics of modulation compositions is about the same for the Mn-30 and 20 at. %Cu alloys, since the maximum of the spinodal curve is located at about 22 at. %Cu in Figure 1, and the most negative value of the second derivative in Figure 2. This fact can be noted for the fastest coarsening process of modulations for these compositions in Figure 4.
Figure 5a–c show the concentration profiles of the Mn-30 at. %Cu alloy aged at 300, 400, and 500 °C for different times. Aging at 300 °C clearly shows an increase in amplitude modulation, which confirms the spinodal decomposition mechanism of the phase decomposition. The coarsening of modulation composition is more evident as the temperature increases. This aging temperature also presents the slowest growth kinetics because of the slowest atomic mobility despite the highest driving force [32], the most negative value in Figure 2. In contrast, the aging at 500 °C exhibits the fastest kinetics, as indicated in Figure 5 by the fastest coarsening of composition fluctuations due to the fastest atomic mobility. The chemical composition of the decomposed Mn-rich γ′ and Cu-rich γ phases is close to that of the equilibrium values for the γ and α phases, Figure 3.

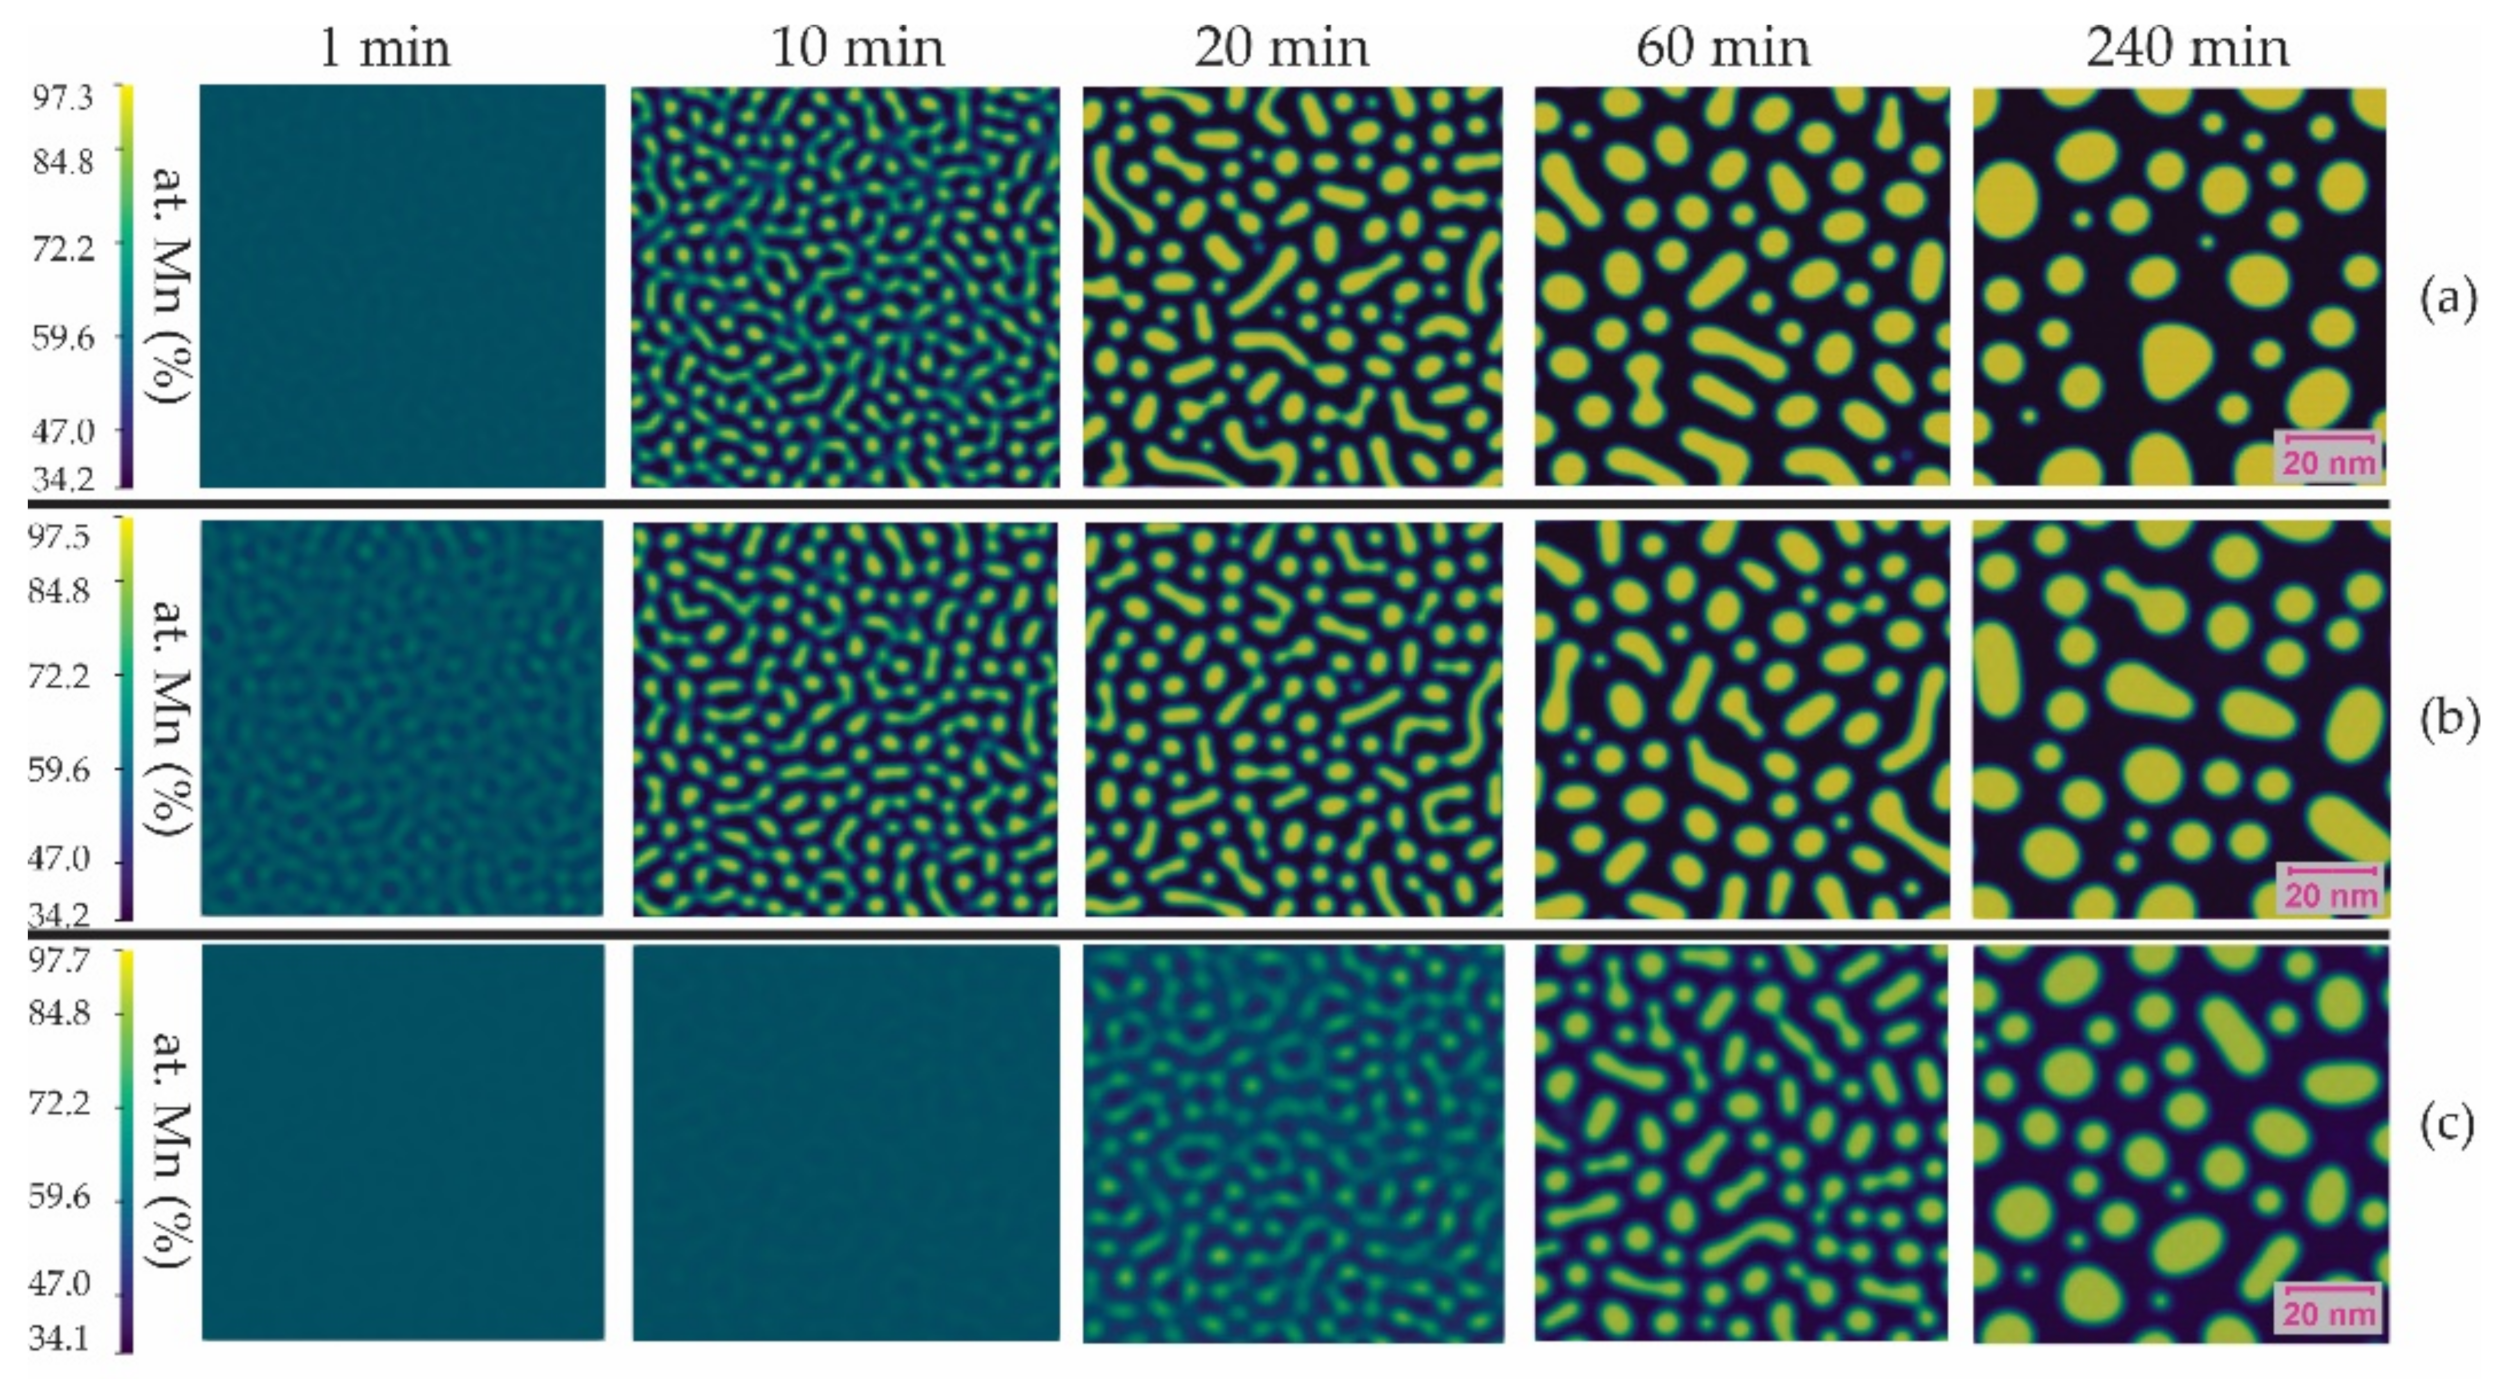
3.2. Microstructural Evolution

The calculated microstructural evolution is shown in Figure 6a–c for the Mn-40 at. %Cu, Mn-30 at. %Cu, and Mn-20 at. %Cu alloys, respectively, aged at 500 °C for times between 1 and 240 min. The Cu-rich γ and Mn-rich γ′ phases are colored in purple and yellow, respectively.
The microstructure evolution of the Mn-30 at. % Cu and Mn-20 at. %Cu alloys present a percolated structure, which is characteristic of the spinodal decomposition [32]. That is, there is an interconnection between the Mn-rich γ′ and Cu-rich γ phases. Figure 6c indicates that the spinodal decomposition occurs more slowly for the Mn-20 at. %Cu alloy than for the other composition. The coarsening process of the decomposed phases is more evident in the case of the former alloy composition than in that of the Mn-30 at. %Cu alloy. The morphology of the Cu-rich γ phase becomes like cuboids and plates. In contrast, the microstructure evolution of the Mn-40 at. %Cu alloy resembles more a precipitation process of Cu-rich γ phase cuboids. The volume fraction of the Cu-rich γ phase is consistent with the Cu content of the alloy.
Figure 7a–c illustrate the microstructure evolution of the Mn-30 at. %Cu alloy aged at 300, 400, and 500 °C, respectively, for different times. These figures illustrate that the phase decomposition takes place more slowly at 500 °C than for the other two compositions, which is attributable to the lowest driving force for spinodal decomposition despite having the fastest diffusion process at this temperature. The growth kinetics of the phase decomposition was faster for aging at 300 °C due to the higher driving force. This morphology of the decomposed phases is similar to that reported in [6] for the Mn-30 at. %Cu alloy aged at 500 °C.

4. Discussion

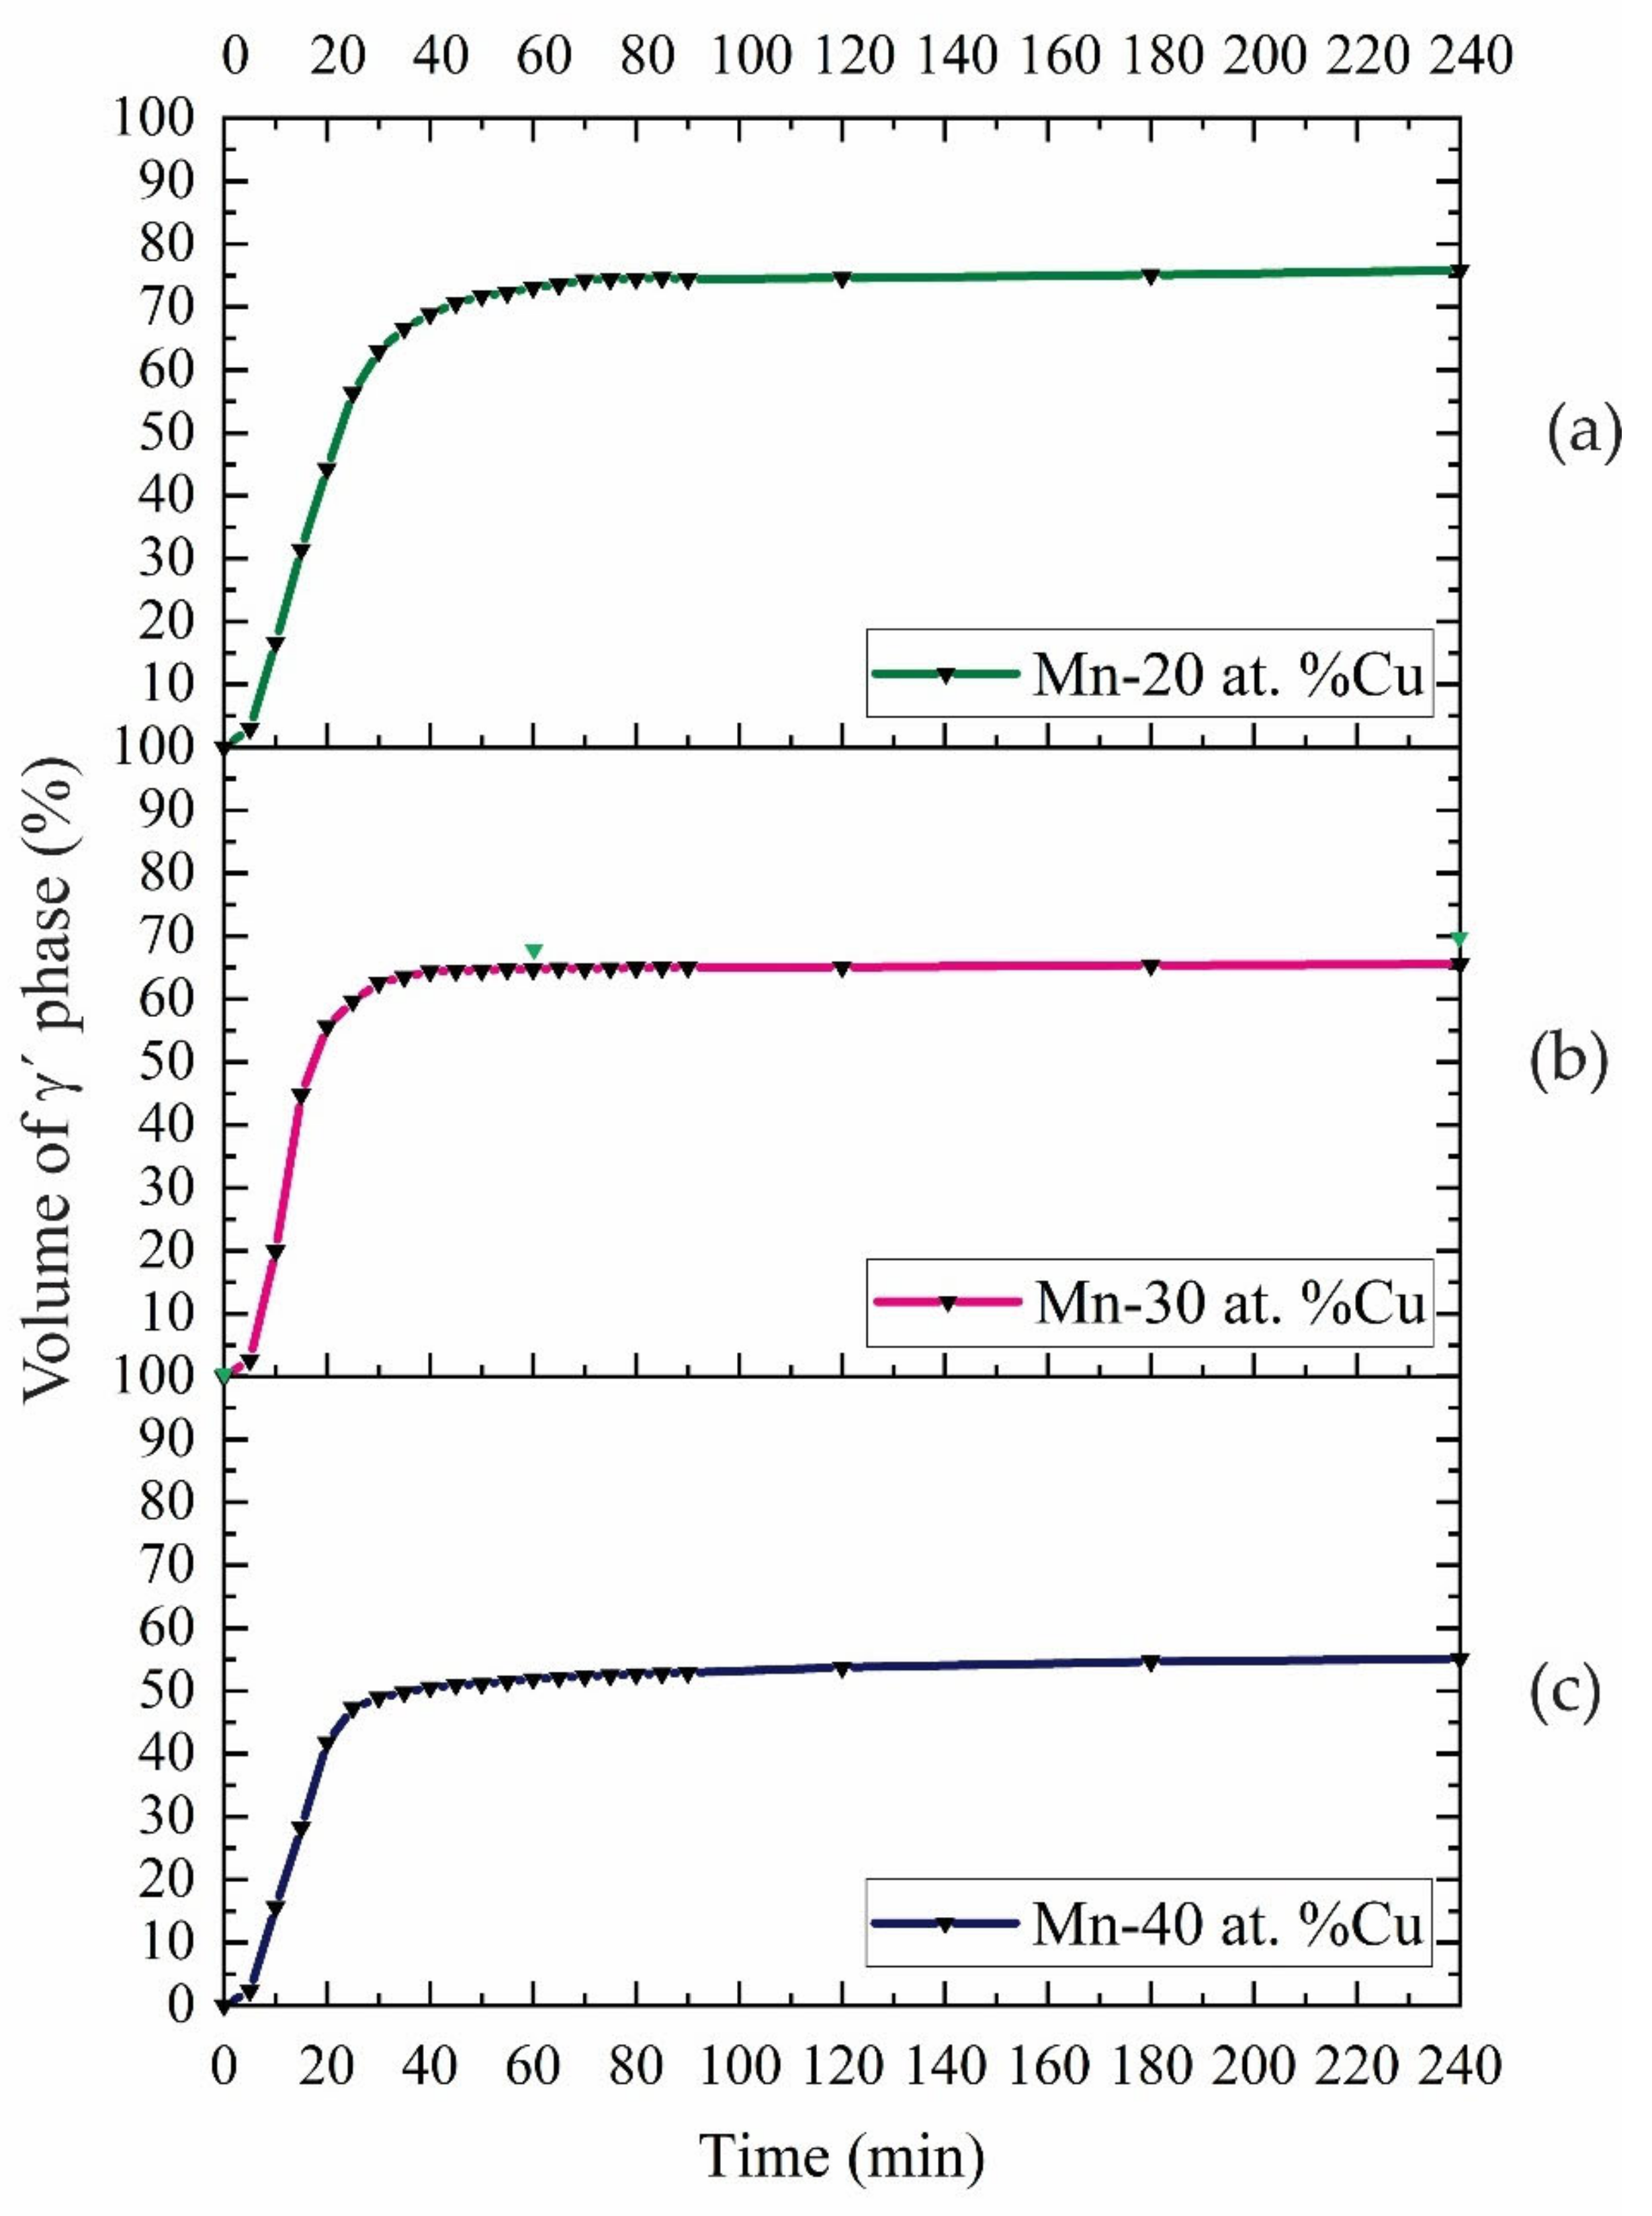
4.1. Growth Kinetics

The plot of the volume fraction of Mn-rich γ′ phase is presented as a function of time in Figure 8a–c for the Mn-20 at. %Cu, Mn-30 at. %Cu and Mn-40 at. %Cu alloys, respectively, aged at 500 °C. These plots show an increase in volume fraction with time up to about 40 min. Then, the growth kinetic rate is deaccelerated, and subsequently the volume fraction remains almost constant. This fact indicates that the phase decomposition finishes, and the coarsening of the decomposed phases begins at about 60 min. This stage is characterized by the growth of precipitated droplets at the expense of the smaller ones [32,43], as can be seen in Figure 6. The maximum volume fraction of the γ′ phase is consistent with the alloy composition.
Figure 9 presents the plot of a mean equivalent radius of the γ′ Mn-rich phase against time for the Mn-30 at. %Cu alloy aged at 300, 400, and 500 °C. This plot suggests that the coarsening process of the decomposed phases occurs for times longer than 60 min since the exponent time is equal to about 1/3, which indicates a diffusion-controlled coarsening [43]. That is, the data analysis of Figure 9 was analyzed using a log–log scale to determine the exponent of time n for the following ratio, r = k t n . The n values were between 0.29 and 0.39, confirming the diffusion-controlled coarsening of the decomposed phases. It is important to note that the experimental values from the literature [6] are consistent with the calculated ones.
The other important factor for estimating the degree of strengthening resulting from the second phase is the interparticle spacing λ . Figure 10 presents the plot of the interparticle spacing λ against the time for the Mn-30 at. %Cu alloy aged at 500 °C; the expression used to calculate λ for the linear mean free path was:
λ = 4 1 f v o l   r ¯ 3   f v o l
where f v o l is the volume fraction and r ¯ is the mean radius of phase [44,45].
At the beginning of the decomposition, between 0 and 40 min of aging, the particles of γ′ are small, leading to the smallest distance between particles and this fact may cause an increase in the alloy strength because a higher opposition to the dislocation movement exists [44,45]. As the aging time progress and the coarsening occurs, the particles of γ′ grow and the interparticle distance increases, resulting in a loss of hardness in times above 60 min of aging, as reported in the literature [6,44]. The experimental values [6] presented in Figure 10 show a good agreement with the calculated ones.

4.2. Contribution of the Spinodal Decomposition to Mn-Cu Alloys

The Mn-30 at. %Cu alloy, after aging at 500 °C showed a change in Vickers hardness from 134 to 178 VHN [6]. This change in hardness was the highest for alloy compositions between 20 and 60 at. %Cu. This fact is attributable to a faster growth kinetics for the spinodal decomposition. Additionally, the percolated structure size was of nanometric order, Figure 9, and involved coherent decomposed phases. This fact is usually associated with an increase in hardness [9,15]. These authors also reported a poor increase in hardness when the aging temperature was located outside the spinodal curve. The formation of the decomposed phases is also related to the high damping capacity of Mn-Cu alloys. The coarsening of decomposed phases is expected to reduce the hardness, which is associated with a decrease in damping capacity [1,4,6,7,8,9,15].

5. Conclusions

The spinodal decomposition was studied during the aging of Mn-Cu alloys, using the phase-field method with a subregular solution model for solving the nonlinear Cahn–Hilliard partial differential equation, which leads to the following conclusions:
  • The calculated Cu concentration profile confirmed the presence of spinodal decomposition at the early stages of aging because of the increase in the amplitude of modulation composition.
  • The morphology of the decomposed phases was interconnected and of irregular shape, designated as percolated in the Cahn–Hilliard theory of spinodal decomposition. The growth kinetics of spinodal decomposition was slow at the early stages of aging.
  • The rate of growth of spinodal decomposition was faster for the Mn-20 and 30 at. %Cu alloys than for Mn-40 at. %Cu during aging at 500 °C because of its higher driving force.
  • The growth kinetics of phase decomposition increased with the decrease in aging temperature because of a reduction in driving force.
  • The size of the decomposed phases increased with the aging temperature. The coarsening of the decomposed phases was a diffusion-controlled process despite the nanometric size.

Author Contributions

Conceptualization, D.A.S.-G., V.M.L.-H., M.L.S.-M., H.J.D.-R. and J.D.V.-C.; methodology, D.A.S.-G.; software, V.M.L.-H.; formal analysis, V.M.L.-H. and D.A.S.-G.; investigation, D.A.S.-G.; writing—original draft preparation, D.A.S.-G., V.M.L.-H., M.L.S.-M., H.J.D.-R. and J.D.V.-C. All authors have read and agreed to the published version of the manuscript.

Funding

This research was funded by National Council of Science and Technology, grant number A1-S-9682.

Institutional Review Board Statement

Not applicable.

Informed Consent Statement

Not applicable.

Data Availability Statement

The data that support the findings of this study are available from the corresponding author upon request.

Acknowledgments

The authors acknowledge the financial support from PIFI-IPN, SIP and Conacyt A1-S-9682.

Conflicts of Interest

The authors declare no conflict of interest.

References

  1. James, D. High Damping Metals for Engineering Applications. Mater. Sci. Eng. 1969, 4, 1–8. [Google Scholar] [CrossRef]
  2. Zuo, S.; Xiao, F.; Fukuda, T. Orientation dependence of damping behavior in a Mn-Cu shape memory alloy. Scr. Mater. 2019, 170, 95–98. [Google Scholar] [CrossRef]
  3. Sun, L.; Vasin, R.; Islamov, A.; Bobrikov, I.; Cifre, J.; Golovin, I.; Balagurov, A. Influence of spinodal decomposition on structure and thermoelastic martensitic transition in MnCuAlNi alloy. Mater. Lett. 2020, 275, 128069. [Google Scholar] [CrossRef]
  4. Lewin, K.; Sichen, D. Thermodynamic Study of the Cu-Mn system. Scand. J. Metall. 1993, 22, 310–316. [Google Scholar]
  5. Wang, C.; Liu, X.; Ohnuma, I.; Kainuma, R.; Ishida, K. Thermodynamic assessments of the Cu-Mn-X (X:Fe, Co) systems. J. Alloy. Compd. 2007, 438, 129–141. [Google Scholar] [CrossRef]
  6. Vitek, J.M.; Warlimont, H. On a metastable miscibility gap in γ-Mn-Cu alloys and the origin of their high damping capacity. Mater. Sci. 1976, 10, 7–13. [Google Scholar] [CrossRef]
  7. Smith, J.H.; Vance, E.R. Decomposition of Gamma-Phase Manganese Copper Alloys. J. Appl. Phys. 1969, 40, 4853–4858. [Google Scholar] [CrossRef]
  8. Gokcen, N.A. The Cu-Mn (Copper-Manganese) System. J. Phase Equilibria 1993, 14, 76–83. [Google Scholar] [CrossRef]
  9. Cowlam, N. Structural aspect of decomposition of metastable γ-Mn-Cu alloys. Met. Sci. 1978, 12, 483–489. [Google Scholar] [CrossRef]
  10. Zhang, Z.-Y.; Peng, L.-M.; Zeng, X.-Q.; Ding, W.-J. Effects of Cu and Mn on mechanical properties and damping capacity of Mg-Cu-Mn alloy. Trans. Nonferrous Met. Soc. China 2008, 18, s55–s58. [Google Scholar] [CrossRef]
  11. Findik, F. Improvements in spinodal alloys from past to present. Mater. Des. 2012, 42, 131–146. [Google Scholar] [CrossRef]
  12. Shi, S.; Liu, C.; Wan, J.; Rong, Y.; Zhang, J. Thermodynamics of fcc-fct martensitic transformation in Mn-X(X=Cu,Fe) alloys. Mater. Des. 2016, 92, 960–970. [Google Scholar] [CrossRef]
  13. Turchanin, M.; Nikolaenko, I.V. Entalpies of Formation of Liquid (Copper+Manganese) Alloys. Metall. Mater. Trans. B 1977, 28, 470–473. [Google Scholar] [CrossRef]
  14. Velazquez, D.; Romero, R. Spinodal decomposition and martensitic transformation in Cu-Al-Mn Shape memory alloy. J. Therm. Anal. Calorim. 2017, 130, 2007–2013. [Google Scholar] [CrossRef]
  15. Jiazhen, Y.; Ning, L.; Xu, F.; Ying, Z. The strengthening effect of spinodal decomposition and twinning structure in MnCu-based alloy. Mater. Sci. Eng. A 2014, 618, 205–209. [Google Scholar] [CrossRef]
  16. Sato, K.; Stobbs, W.M. Quantification of the spinodal wave in Cu2.5Mn0.5Al by dark-field image analysis. Philos. Mag. A 1994, 69, 349–377. [Google Scholar] [CrossRef]
  17. Saito, Y.; Suwa, Y.; Ochi, K.; Aoki, T.; Goto, K.; Abe, K. Kinetics of Phase Separation in Ternary Alloys. J. Phys. Soc. Jpn. 2022, 71, 808–812. [Google Scholar] [CrossRef]
  18. Soriano-Vargas, O.; Avila-Davila, E.O.; Lopez-Hirata, V.M.; Cayetano-Castro, N.; Gonzalez-Velazquez, J.L. Effect of Spinodal decomposition on the mechanical behavior of Fe-Cr alloys. Mater. Sci. Eng. A 2010, 527, 2910–2914. [Google Scholar] [CrossRef]
  19. Avila-Davila, E.O.; Lopez-Hirata, V.; Saucedo-Muñoz, M.L.; Gonzalez-Velazquez, J.L. Microstructural simulation of phase decomposition in Cu–Ni alloys. J. Alloy. Compd. 2008, 460, 206–212. [Google Scholar] [CrossRef]
  20. Zhang, S.; Kumar, R. Effects of the local order parameter dependent transport coefficient in deblock copolymers under applied electric fields. J. Chem. Phys. 2022, 156, 174903. [Google Scholar] [CrossRef]
  21. Zhang, S.; Jiang, W.; Tonks, M.R. Assessment of four strain energy decomposition methods for phase field fracture models using quasi-static and dynamic benchmark cases. Mater. Theory 2022, 6, 6. [Google Scholar] [CrossRef]
  22. Zhang, S.; Kim, D.-U.; Jiang, W.; Tonk, M.R. A phase field model of crack propagation in anisotropic brittle materials with preferred fracture planes. Comput. Mater. Sci. 2021, 193, 1104000. [Google Scholar] [CrossRef]
  23. Rezaei, Y.; Jafari, M.; Jamshidian, M. Phase-field modeling of magnetic field-induced grain growth in polycrystalline metals. Comput. Mater. Sci. 2021, 200, 110786. [Google Scholar] [CrossRef]
  24. Miyoshi, E.; Takaki, T.; Sakane, S.; Ohno, M.; Shibuta, Y.; Aoki, T. Large-scale phase-field study of anisotropic grain growth: Effects of misorientation-dependent grain boundary energy and mobility. Comput. Mater. Sci. 2021, 186, 109992. [Google Scholar] [CrossRef]
  25. Wang, Y.H.; Zhang, D.C.; Pi, Z.P.; Lin, J.G.; Wen, C. Phase field simulation of spinodal decomposition in Zr–Nb alloys for implant materials. J. Appl. Phys. 2019, 126, 085102. [Google Scholar] [CrossRef]
  26. Avila-Davila, E.O.; Lopez-Hirata, V.M.; Saucedo-Muñoz, M.L. Application of Phase-Field Method to the Analysis of Phase Decomposition of Alloys. In Modeling and Simulation in Engineering Sciences; InTechOpen: Vienna, Austria, 2015; pp. 221–242. [Google Scholar] [CrossRef] [Green Version]
  27. Chen, L.-Q. Computer Simulation of Spinodal Decomposition in Ternary Systems. Acta Met. Mater. 1994, 42, 3503–3513. [Google Scholar] [CrossRef]
  28. Koyama, T.; Hashimoto, K.; Onodera, H. Phase-Field Simulation of Phase Transformation in Fe-Cu-Mn-Ni Quaternary Alloy. Mater. Trans. 2006, 47, 2765–2772. [Google Scholar] [CrossRef] [Green Version]
  29. Zhang, R.; Jing, T.; Jie, W.; Liu, B. Phase-field simulation of solidification in multicomponent alloys coupled with thermodynamic and diffusion mobility. Acta Mater. 2006, 54, 2235–2239. [Google Scholar] [CrossRef]
  30. Kim, D.-C.; Ogura, T.; Hamada, R.; Yamashita, S.; Saida, K. Establishment of a theoretical model on the phase-field method for predicting the γ phase precipitation in Fe-Cr-Ni ternary alloys. Mater. Today Commun. 2021, 26, 101932. [Google Scholar] [CrossRef]
  31. Aaronson, H.I.; Enomoto, M.; Lee, J.K. Mechanisms of Diffusional Phase Transformations in Metals and Alloys; CRC Press: Boca Raton, FL, USA, 2010; pp. 1–47. [Google Scholar]
  32. Kostorz, G. Phase Transformations in Materials; Wiley-VCH: Weinheim, Germany, 2001; pp. 409–480. [Google Scholar]
  33. Dinsdale, A. SGTE Data for pure elements. CALPHAD 1991, 15, 317–425. [Google Scholar] [CrossRef]
  34. Redlich, O.; Kister, A.T. Algebraic Representation of Thermodynamic properties and the classification of solutions. Ind. Eng. Chem. 1948, 40, 345–348. [Google Scholar] [CrossRef]
  35. Hillert, M.; Jarl, M. A model for alloying effects in ferromagnetic metals. CALPHAD 1978, 2, 227–238. [Google Scholar] [CrossRef]
  36. Lukas, H.; Fries, S.; Sundman, B. Computational Thermodynamics: The Calphad Method; Cambridge University Press: Cambridge, UK, 2007; pp. 79–160. [Google Scholar]
  37. He, C.; Du, Y.; Chen, H.-L.; Liu, S.; Xu, H.; Ouyang, Y.; Liu, Z.-K. Thermodynamic modeling of the Cu-Mn system supported by key experiments. J. Alloy. Compd. 2008, 457, 233–238. [Google Scholar] [CrossRef]
  38. Kim, S.; Sanders, T.H. Thermodynamic Modeling of the Miscibility Gaps and the Metastable Liquid in the Zn–Bi, Zn–Pb, and Zn–Tl systems. Z. Met. 2003, 94, 390–395. [Google Scholar] [CrossRef]
  39. Neumann, G. Self-Difussion and Impurity Difussion in Pure Metals: Handbook of Experimental Data, 1st ed.; Elsevier: Amsterdam, The Netherlands, 2009; pp. 37–91. [Google Scholar]
  40. Pearson, W. A Handbook of Lattice Spacings and Structures of Metals and Alloys, 2nd ed.; Pergamon Press: Oxford, UK, 1958; Volume 4, pp. 3–113. [Google Scholar]
  41. Simmons, G.; Wang, H. Single Crystal Elastic Constants and Calculated Aggregate Properties: A Handbook, 1st ed.; The Massachusetts Institute of Technology: Cambridge, MA, USA, 1971. [Google Scholar]
  42. Cahn, J.W.; Hilliard, J.E. Free Energy of a Nonuniform System. I. Interfacial Free Energy. J. Chem. Phys. 1958, 28, 258–267. [Google Scholar] [CrossRef]
  43. Lifshitz, I.; Slyozov, V. The kinetics of precipitation from supersaturated solid solutions. J. Phys. Chem. Solids J. Phys. Chem. Solids. 1961, 19, 35–50. [Google Scholar] [CrossRef]
  44. Dieter, G. Mechanical Metallurgy, 3rd ed.; McGraw-Hill: New York, NY, USA, 1986; pp. 212–219. [Google Scholar]
  45. Corti, C. The evaluation of the Interparticle Spacing in Dispersion Alloys. Int. Metall. Rev. 1974, 19, 77–88. [Google Scholar] [CrossRef]
Figure 1. Composition-dependence of the free energy curves at 300 °C, 400 °C and 500 °C. Where cγ and cγ’ are the equilibrium compositions of γ and γ’ phases respectively.
Metals 12 01220 g001
Figure 2. Calculated second-order partial derivative of free energy at 300 °C, 400 °C, and 500 °C corresponding to Figure 1.
Metals 12 01220 g002
Figure 3. Equilibrium phase diagram of Mn-Cu calculated with Thermo-Calc. The blue line and marks represent the calculated miscibility gap by Wang and Lui (2007).
Metals 12 01220 g003
Figure 4. Calculated concentration profiles of (a) Mn-40 at. %Cu, (b) Mn-30 at. %Cu, and (c) Mn-20 at.%Cu alloys aged at 400 °C for different times.
Metals 12 01220 g004
Figure 5. Calculated concentration profiles of Mn-30 at. %Cu alloys aged at (a) 300 °C, (b) 400 °C, and (c) 500 °C for different times.
Metals 12 01220 g005
Figure 6. Microstructural evolution of (a) Mn-40 at. %Cu, (b) Mn-30 at. %Cu, and (c) Mn-20 at. %Cu alloys aged at 500 °C for different times.
Metals 12 01220 g006
Figure 7. Microstructural evolution of Mn-30 at. %Cu alloy aged at (a) 300 °C, (b) 400 °C, and (c) 500 °C for different times.
Metals 12 01220 g007
Figure 8. Volume fraction of γ′ phase for (a) Mn-20 at. %Cu, (b) Mn-30 at. %Cu, and (c) Mn-40 at. %Cu alloys aged at 500 °C. The green marks in (b) represent the experimental results of Vitek and Warlimont (1976).
Metals 12 01220 g008
Figure 9. Plot of average equivalent radius of γ′ phase versus time for the Mn-30 at. %Cu alloy aged at 300, 400, and 500 °C. The green marks represent the experimental results of Vitek and Warlimont (1976).
Metals 12 01220 g009
Figure 10. Plot of interparticle spacing λ in γ′ phase versus time for the Mn-30 at. %Cu alloy aged at 500 °C. The green marks represent the experimental results of Vitek and Warlimont (1976).
Metals 12 01220 g010
Table 1. Thermodynamic parameters for the calculation of chemical equilibrium.
ParameterFCC_A1 γ-PhaseReference
° G C u γ
J/mol
−7770.458 + 130.485235 T − 24.112392 T ln(T) − 2.65684 × 10⁻³ T2 + 0.129223 × 10⁶ T3 + 52,478 T−1[33]
° G M n γ
J/mol
−3439.3 + 131.884 T − 24.5177 T ln (T) − 6 × 10⁻³ T2 + 69,600 T−1 + G m a g
T N C u M n γ 540/(−3)
β C u M n γ 0.62/(−3)
L 0 C u M n γ 20,235.508 − 13.2437 T[37]
L 1 C u M n γ −12,154.853 + 2.9399 T
Diffusion coefficient
m2s−1
D 0   C u γ = 4.3 × 10 5 [28,39]
D 0   M n γ = 1.78 × 10 5
Q
J/mol
Q C u γ = 2.80 × 10 5
Q M n γ = 2.64 × 10 5
Table 2. Elastic parameters for the calculation of mechanical equilibrium.
ParameterFCC_A1 γ-PhaseReference
Lattice   parameter   ( a i )
i = C u ,   M n
(nm)
0.36074
0.38546
[40]
Elastic constants
J × m 3
Cu/Mn
C 11 = 168.400 × 10 10 C 11 = 223.000 × 10 10 [41]
C 12 = 121.400 × 10 10 C 12 = 120.000 × 10 10
C 44 = 75.400 × 10 10 C 44 = 79.000 × 10 10
Lattice mismatch
ε i = a M n a C u / a C u
0.06835[40]
Publisher’s Note: MDPI stays neutral with regard to jurisdictional claims in published maps and institutional affiliations.

