Article

Time-Domain Inversion Method of Impact Loads Based on Strain Monitoring Data

1
Marine Design & Research Institute of China, Shanghai 200011, China
2
School of Naval Architecture and Ocean Engineering, Jiangsu University of Science and Technology, Zhenjiang 212003, China
*
Author to whom correspondence should be addressed.
Metals 2022, 12(8), 1279; https://doi.org/10.3390/met12081279
Submission received: 18 May 2022 / Revised: 19 July 2022 / Accepted: 20 July 2022 / Published: 29 July 2022
(This article belongs to the Special Issue Special Materials for Shipbuilding)

Abstract

:
A helicopter deck is the main load-bearing component under the emergency landing conditions for helicopters. However, it is generally difficult to directly obtain the landing load from measurements due to the high randomness of the landing position. As the main design load of the helicopter deck, the emergency landing load is very important to its structural design. A large design load value leads to an overly conservative structural design and affects the control of the ship’s weight and center of gravity, while a small design load may lead to a lack of security and affect the safety of the helicopter and the ship. As a result, the time domain inversion method, which is based on strain monitoring data, is an important and effective method for obtaining the helicopter emergency landing load. In this study, a grillage model experiment was conducted to study the time domain inversion method. The helicopter impact load was simulated by falling body impact, and the impact load history and structural strain response were recorded by sensors. The grillage model impact load was calculated with different inversion methods, including the direct inverse, truncated singular value decomposition (TSVD), and Tikhonov regularization methods. The solution accuracy of different methods and number of sensors needed were compared. The results demonstrated that the Tikhonov regularization method based on four measurement points along with the L-curve determination criterion showed a better performance for capturing the impact load time history features.

1. Introduction

Currently, increasing numbers of ships and offshore platforms are equipped with aircraft such as helicopters. However, helicopter emergency landings may damage the mechanical properties of deck structures. It is vital to precisely obtain the load distribution during helicopter landing to optimize the structural design of the helideck and monitor the structural safety in real time. However, the location of impact loads is stochastic, and the force is instant. It is difficult to directly measure dynamic loads in engineering practice. Therefore, strain monitoring data can be used to invert impact loads [1].
Load inversion based on the structural response is a complex problem, and the difficulty in solving the problem may lead to a deviation of the results from the true value. To date, many scholars have explored methods for solving such ill-posed problems. Tikhonov, an academician of the former Soviet Union, proposed a regularization method with wide applicability. With the development of the field, additional different reconstruction techniques have been developed [2], such as two-norm regularization [3], Tikhonov regularization [4], and truncated singular value decomposition (TSVD) [5]. Extensive research has been carried out on how to select the optimal regularization parameters, and the results have been used for load identification [6], such as the Morozov deviation principle [7,8], quasi-optimality criterion [9,10], generalized cross-validation (GCV) [11,12], and L-curve methods [13,14,15,16].
In the domain of impact load inversion techniques, Liu et al. conducted a comprehensive study of inversion techniques for dynamic load identification [17]. Liu et al. proposed an external load inversion technique with multiple sources of information and fusion between simulations and real measurements, which can be used to solve problems involving mechanical structures under complex boundary conditions [18]. Nan et al. proposed a new data-driven method of ice load inversion, and an effective ice load inversion model based on the long and short-term memory (LSTM) network was trained by an improved gray wolf optimization algorithm [19]. Kong et al. carried out a far-field inversion analysis of sea ice loads on ship structures based on a parameter identification model with the support vector machine method, which extended the traditional sea ice load identification method for ship structures [20]. To estimate the forces exerted on ship propellers during ice navigation, three regularization methods, namely, TSVD, truncated generalized singular value decomposition (TGSVD), and Tikhonov, were validated by Waal et al. [21]. Bayesian inversion was studied by Koker et al. [22] to determine the optimal regularization parameters and explore the contributions to uncertainty in the inverted ice loading values due to the linear inversion model. Apart from using different methods, propulsion machinery modes are modeled with different numbers of submodels [23]. Jin Xin et al. proposed a load inversion method driven by refined finite element simulation data, which was validated by structural load inversion results based on deep learning and FEM methods. It can invert and reconstruct the load distribution of whole airfoil structure in real time with a small amount of strain sensor data [24].
However, the abovementioned methods have limited application, with the stability and accuracy being limited to their respective research objects. As a result, more research into the issues of helicopter impact load inversion should be conducted.

2. Inversion Method

The inverse equation of the impact load may be ill-posed due to the deviation of the load position and strain responses along with the signal noise. Therefore, different inversion methods of the helicopter impact load are studied and compared in this paper.

2.1. Basic Theory

Provided that the hull structure information is known, the strain response of the hull structure can be expressed as shown in Equation (1):
0 t g ( t τ ) p ( t ) d t = y ( t )
where y(t) is the strain response information of the impacted structure, g(t) is the Green function between the helicopter landing point and the strain measurement point, and p(t) is the impact load time history.
The impact load can be replaced by the unit rectangular pulse superposition, and Equation (1) can be discretized into matrix form in the time calendar as shown in Equation (2), where Δt is the sampling point time interval, and N is the number of sampling points.
[ y ( t 1 ) y ( t 2 ) y ( t N ) ] = [ g ( t 1 ) g ( t 2 ) g ( t 1 ) g ( t N ) g ( t N 1 ) g ( t 1 ) ] [ p ( t 0 ) p ( t 1 ) p ( t N 1 ) ] Δ t
The inversion equation for the impact load can be obtained using Equation (3):
y = G P
in which y ( t i ) , g ( t i ) , and p ( t i ) are the response, Green’s function, and load to be identified at t = n Δ t , ( n = 0 , 1 , , N ) , respectively.
Considering the obvious structural response at multiple measurement points when the hull structure is impacted, the multipoint load identification control equation is as shown in Equation (4):
[ y 1 y 2 y M ] = [ G 11 G 12 G 1 S G 21 G 22 G 2 S G M 1 G M 1 G M S ] [ p 1 p 2 p S ]
where M is the number of measured responses, and S is the number of unknown loads. y m ( m = 0 , 1 , , M ) and p s ( s = 0 , 1 , , S ) are column vectors that denote the mth measured response and the sth load that will be identified, respectively. Additionally, G m s is Green’s function matrix from the sth load source to the mth response measurement point.
Considering the deviation of the load position and the measuring error along with the signal noise, a regularization technique must be used to improve the inverse results and solve the ill-posed problems of the identification of dynamic loads.

2.2. Regularization Method

2.2.1. Truncated Singular Value Decomposition

The TSVD method may be used to improve the stability of the solution and eliminate the ill effects of disturbance information by rounding off vectors of small singular values. The impact load under the direct least squares solution may be modified with Equation (5):
P T S V D = i = 1 S T u i T Y σ i v i
where ST is the number of singular values after omitting the small singular values, namely the truncation order; Y is the measured response; σ i is the singular value of Green’s function matrix; and u i and v i are mutually orthogonal unitary matrices.

2.2.2. Tikhonov Regularization

Unlike the TSVD method, the Tikhonov regularization method can retain all the information by adding damping or filtering to small singular values, which may also solve the ill-posed problem. The impact load under the direct least squares solution may be modified as shown in Equation (6):
m i n G P Y 2 2 + α 2 P 2 2
where α is the regularization parameter and satisfies α > 0 ; 2 2 is the square of the two-parametric number taking the matrix ‘ ’. The Tikhonov regularized solution of the impact load can be obtained from Equation (4), which is shown in Equation (7):
P T i k = i = 1 s σ i 2 σ i 2 + α 2 u i T Y σ i v i

2.3. Selection Method of Regularization Parameters

From Equations (5) and (7), it can be seen that the selection of the regularization parameters is related to the error between the calculated results and the actual loads, so it is crucial to select the appropriate regularization parameters when using regularization techniques to deal with the difficulties of inverse problems. In this paper, we mainly use the following two methods for the selection of regularization parameters.

2.3.1. L-Curve Criterion

The L-curve criterion is a distinct L curve describing the regularization solution P α 2 2 and the residuals G P α Y 2 2 on a log-log scale, as shown below (Figure 1). The expression of the regularization parameter can be obtained with Equation (8) through the curve at the point of maximum curvature.
L ( α ) = | ρ θ ρ θ | / [ ( ρ ) 2 + ( θ ) 2 ] 3 / 2
where ρ = G P α Y 2 2 , θ = P α 2 2 , and the parameters are ρ . θ and θ are the first derivative and the second derivative of the regularization parameter α , respectively.
The optimal regularization parameters are selected by the L-curve criterion method in Equation (9):
α = arg max { L ( α ) }

2.3.2. Generalized Cross Validation Criterion (GCV)

An optimal regularization parameter can be provided by the GCV method, which is shown in the following equation.
GCV ( a ) = ( I A ( α ) y δ ) 2 2 ( T r ( I A ( α ) ) ) 2
where A ( α ) = G ( G T G + α I ) 1 G T , and T r is the trace of the matrix.
According to the Scherman–Morrison–Woodburg theorem, the following equation is available
α ( G T G + α I ) 1 = I G ( G T G + α I ) 1 G T
Then, Equation (10) can be simplified and organized as
GCV ( a p ) = ( G T G + α I ) 1 Y δ 2 2 T r ( ( G T G + α I ) 1 )
Thus, the optimal regularization parameter is selected by the GVC method as
α = arg min { GCV ( α ) }

3. Impact Load Model Test

3.1. Test Scheme

3.1.1. Test Model

As the key component to bearing the landing impact loads of A helicopter, a flight deck plate was made into an impact test model of 3.655 m × 2.1 m × 0.133 m to verify the accuracy of the impact load inversion method. The test model consisted of two parts: the test area and the redundant area. The size of the test area was 1 m × 0.9 m, and the horizontal length and longitudinal length of the redundant were about one and two times the test area, respectively. The test grillage is shown in Figure 2 and Figure 3.
The test grillage model was connected to the fixed base through 40 bolt holes of Φ32 mm, and elbow plates were designed around the bolt holes to ensure that the two long sides met the rigid boundary conditions requirement.

3.1.2. Sensors

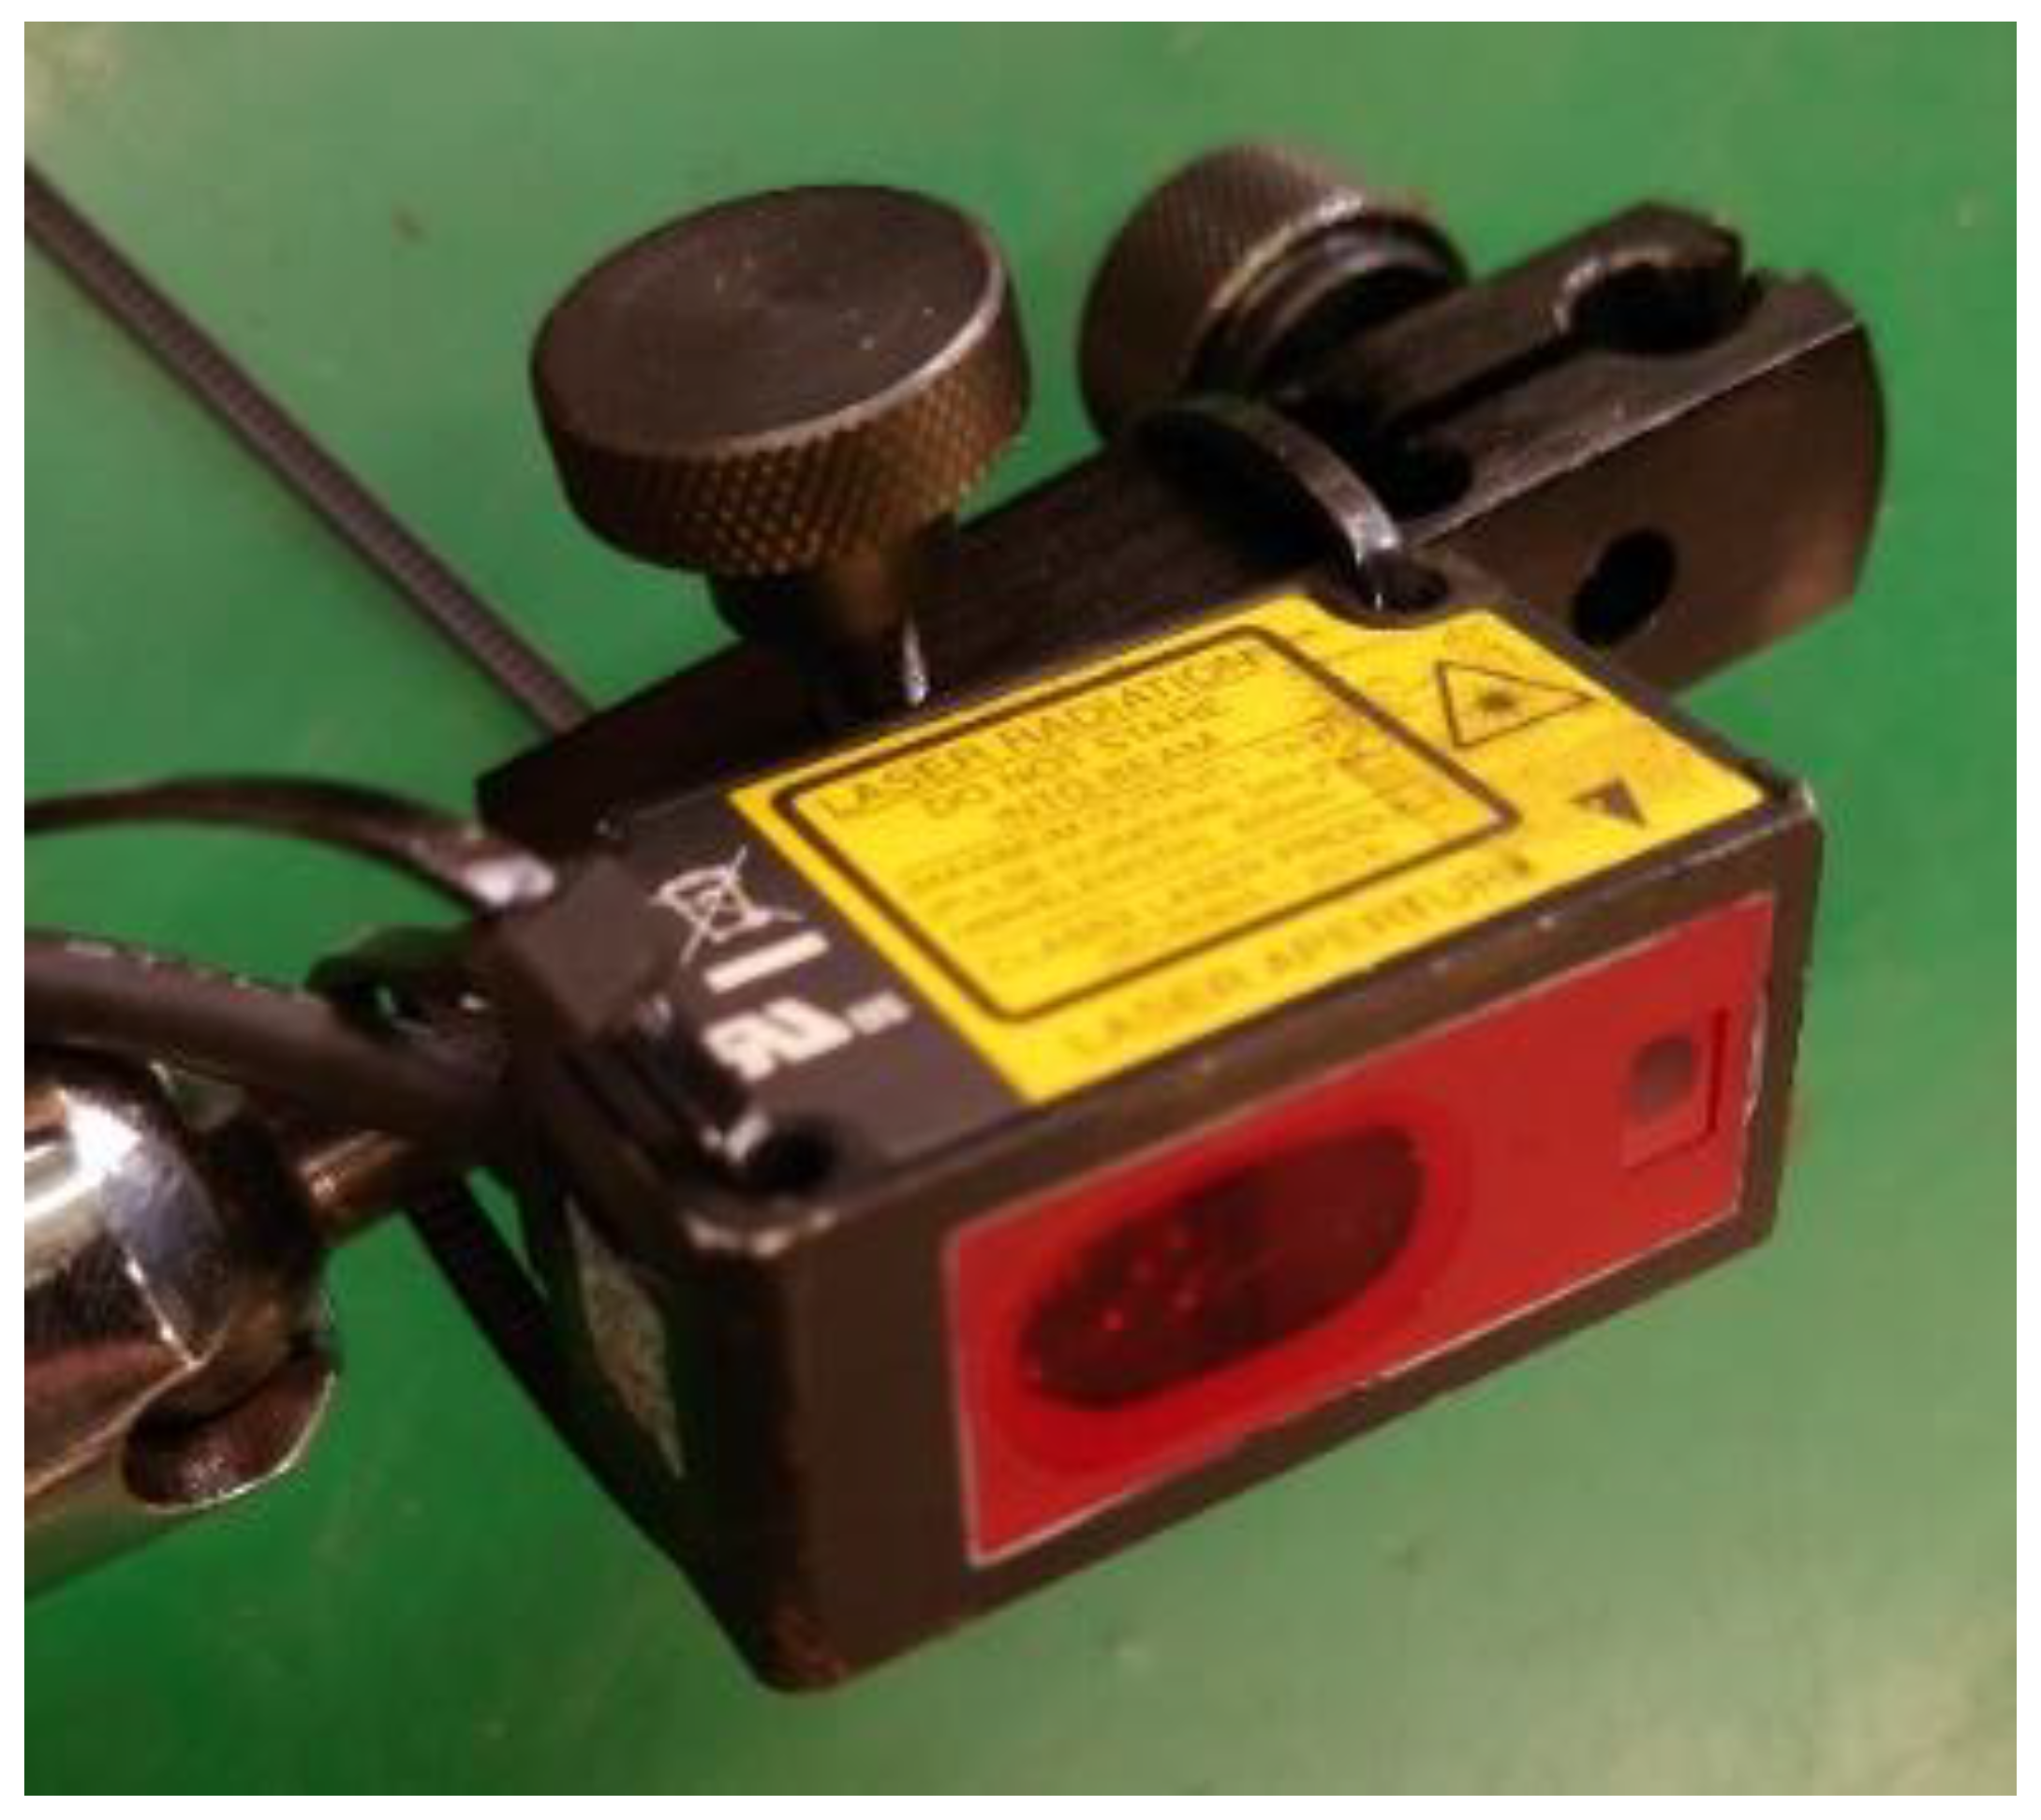
In the impact load model test, the force mapping sensor (Figure 4), photoelectric velocity sensor (Figure 5), and strain sensors were configured to obtain the impact load, impact velocity, and strain response of the grillage structure, respectively.
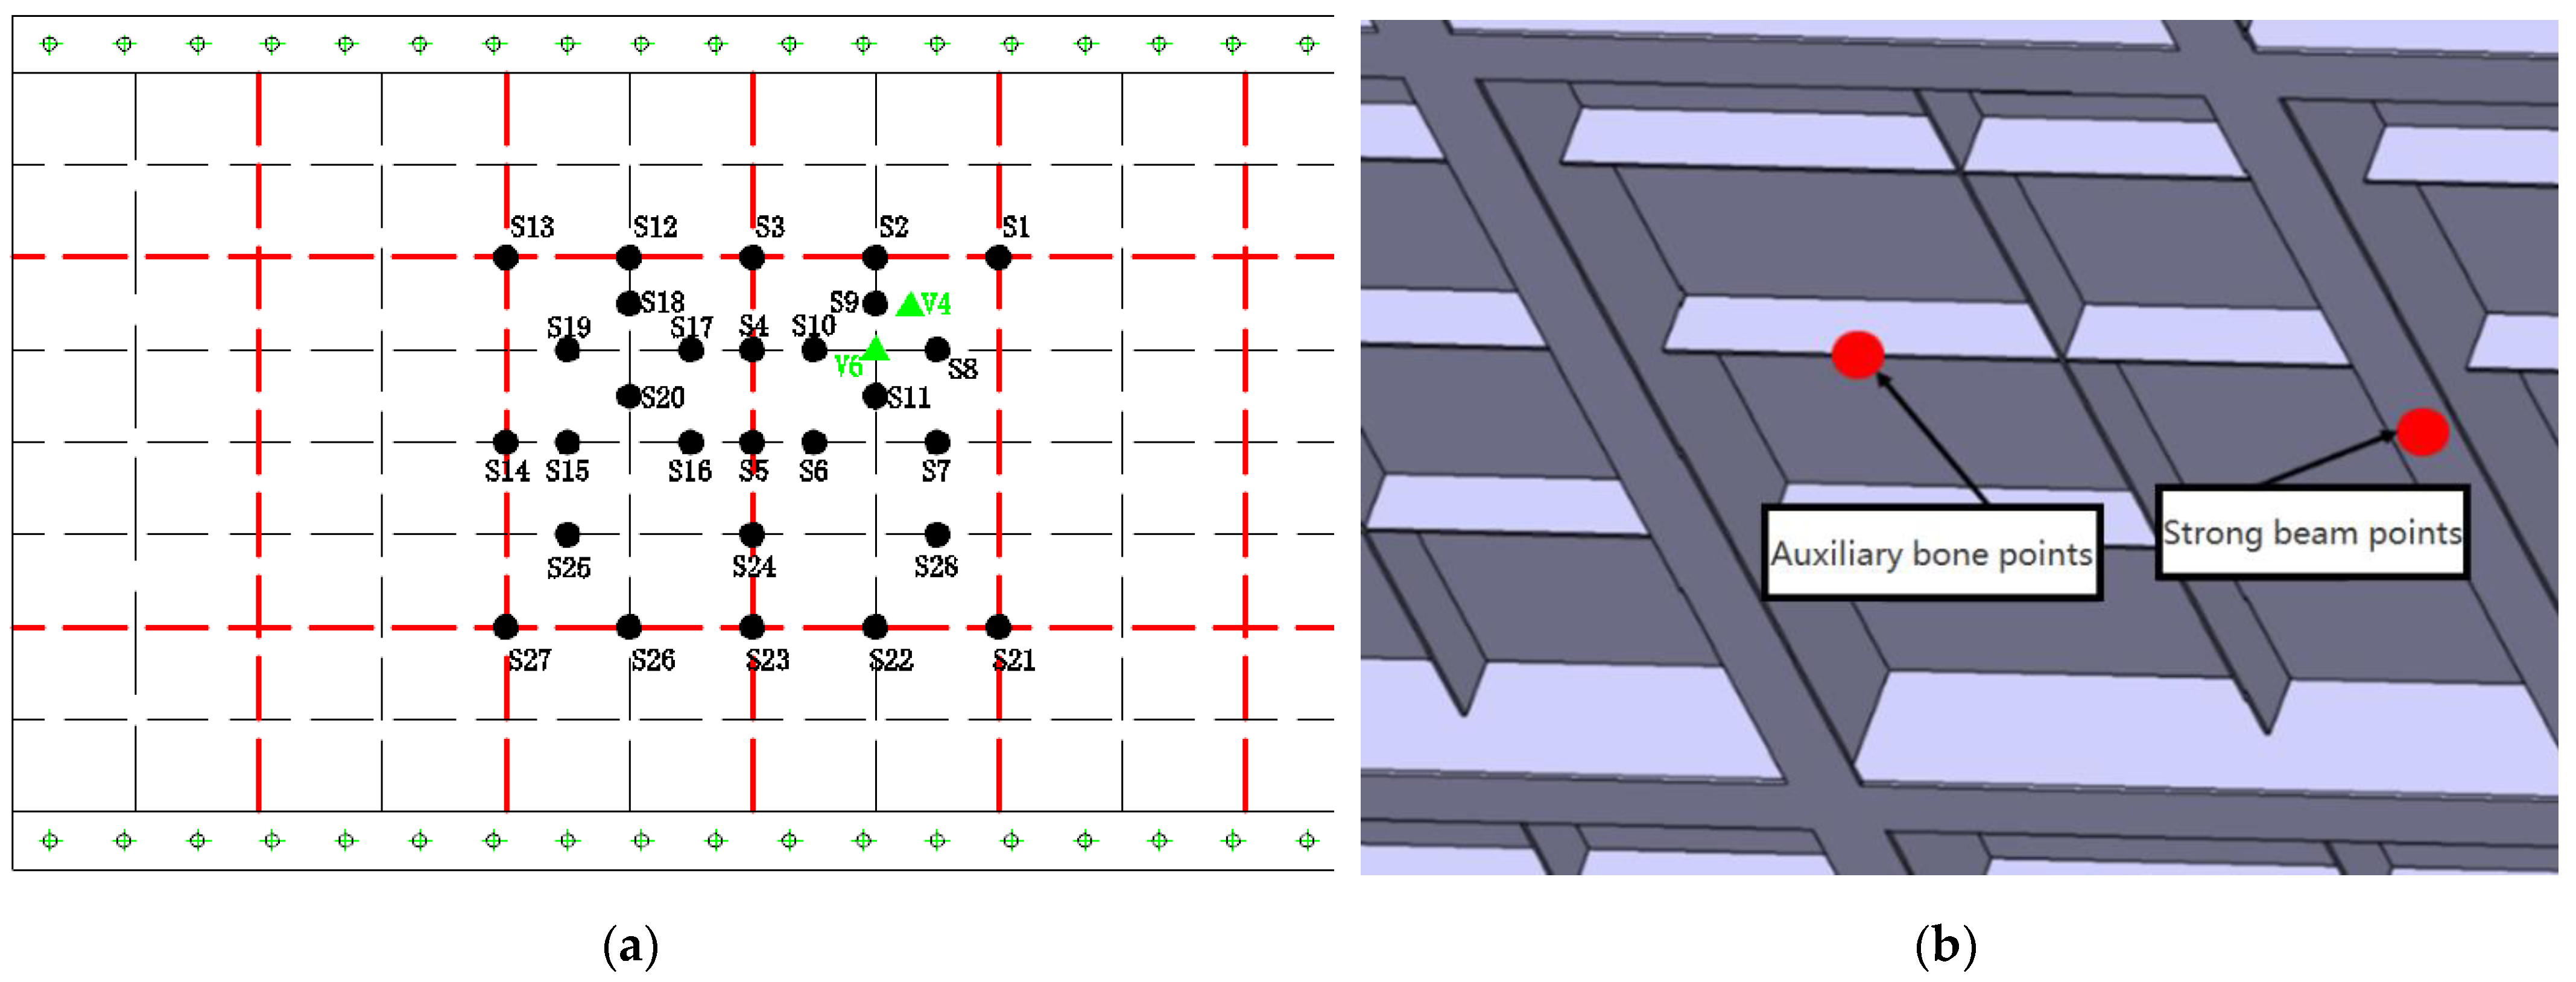
Considering the symmetry of the test grillage and the complexity of the strain distribution under impact load action, a total of 28 strain sensors (S1–S28) were used in the test area for measurement, of which 14 measurement points were located at the auxiliary bone webs, and 14 measurement points were at the longitudinal or transverse strong beam panels. The layout of the strain measuring points is shown in Figure 6, where the red dotted line represents the strong beam, and the black dotted line represents the auxiliary beam. The strain signal data were recorded by a Donghua 5902 data acquisition instrument (Donghua Testing Technology Co., Jingjiang, China) with a sampling frequency of 10 kHz.

3.1.3. Test Conditions

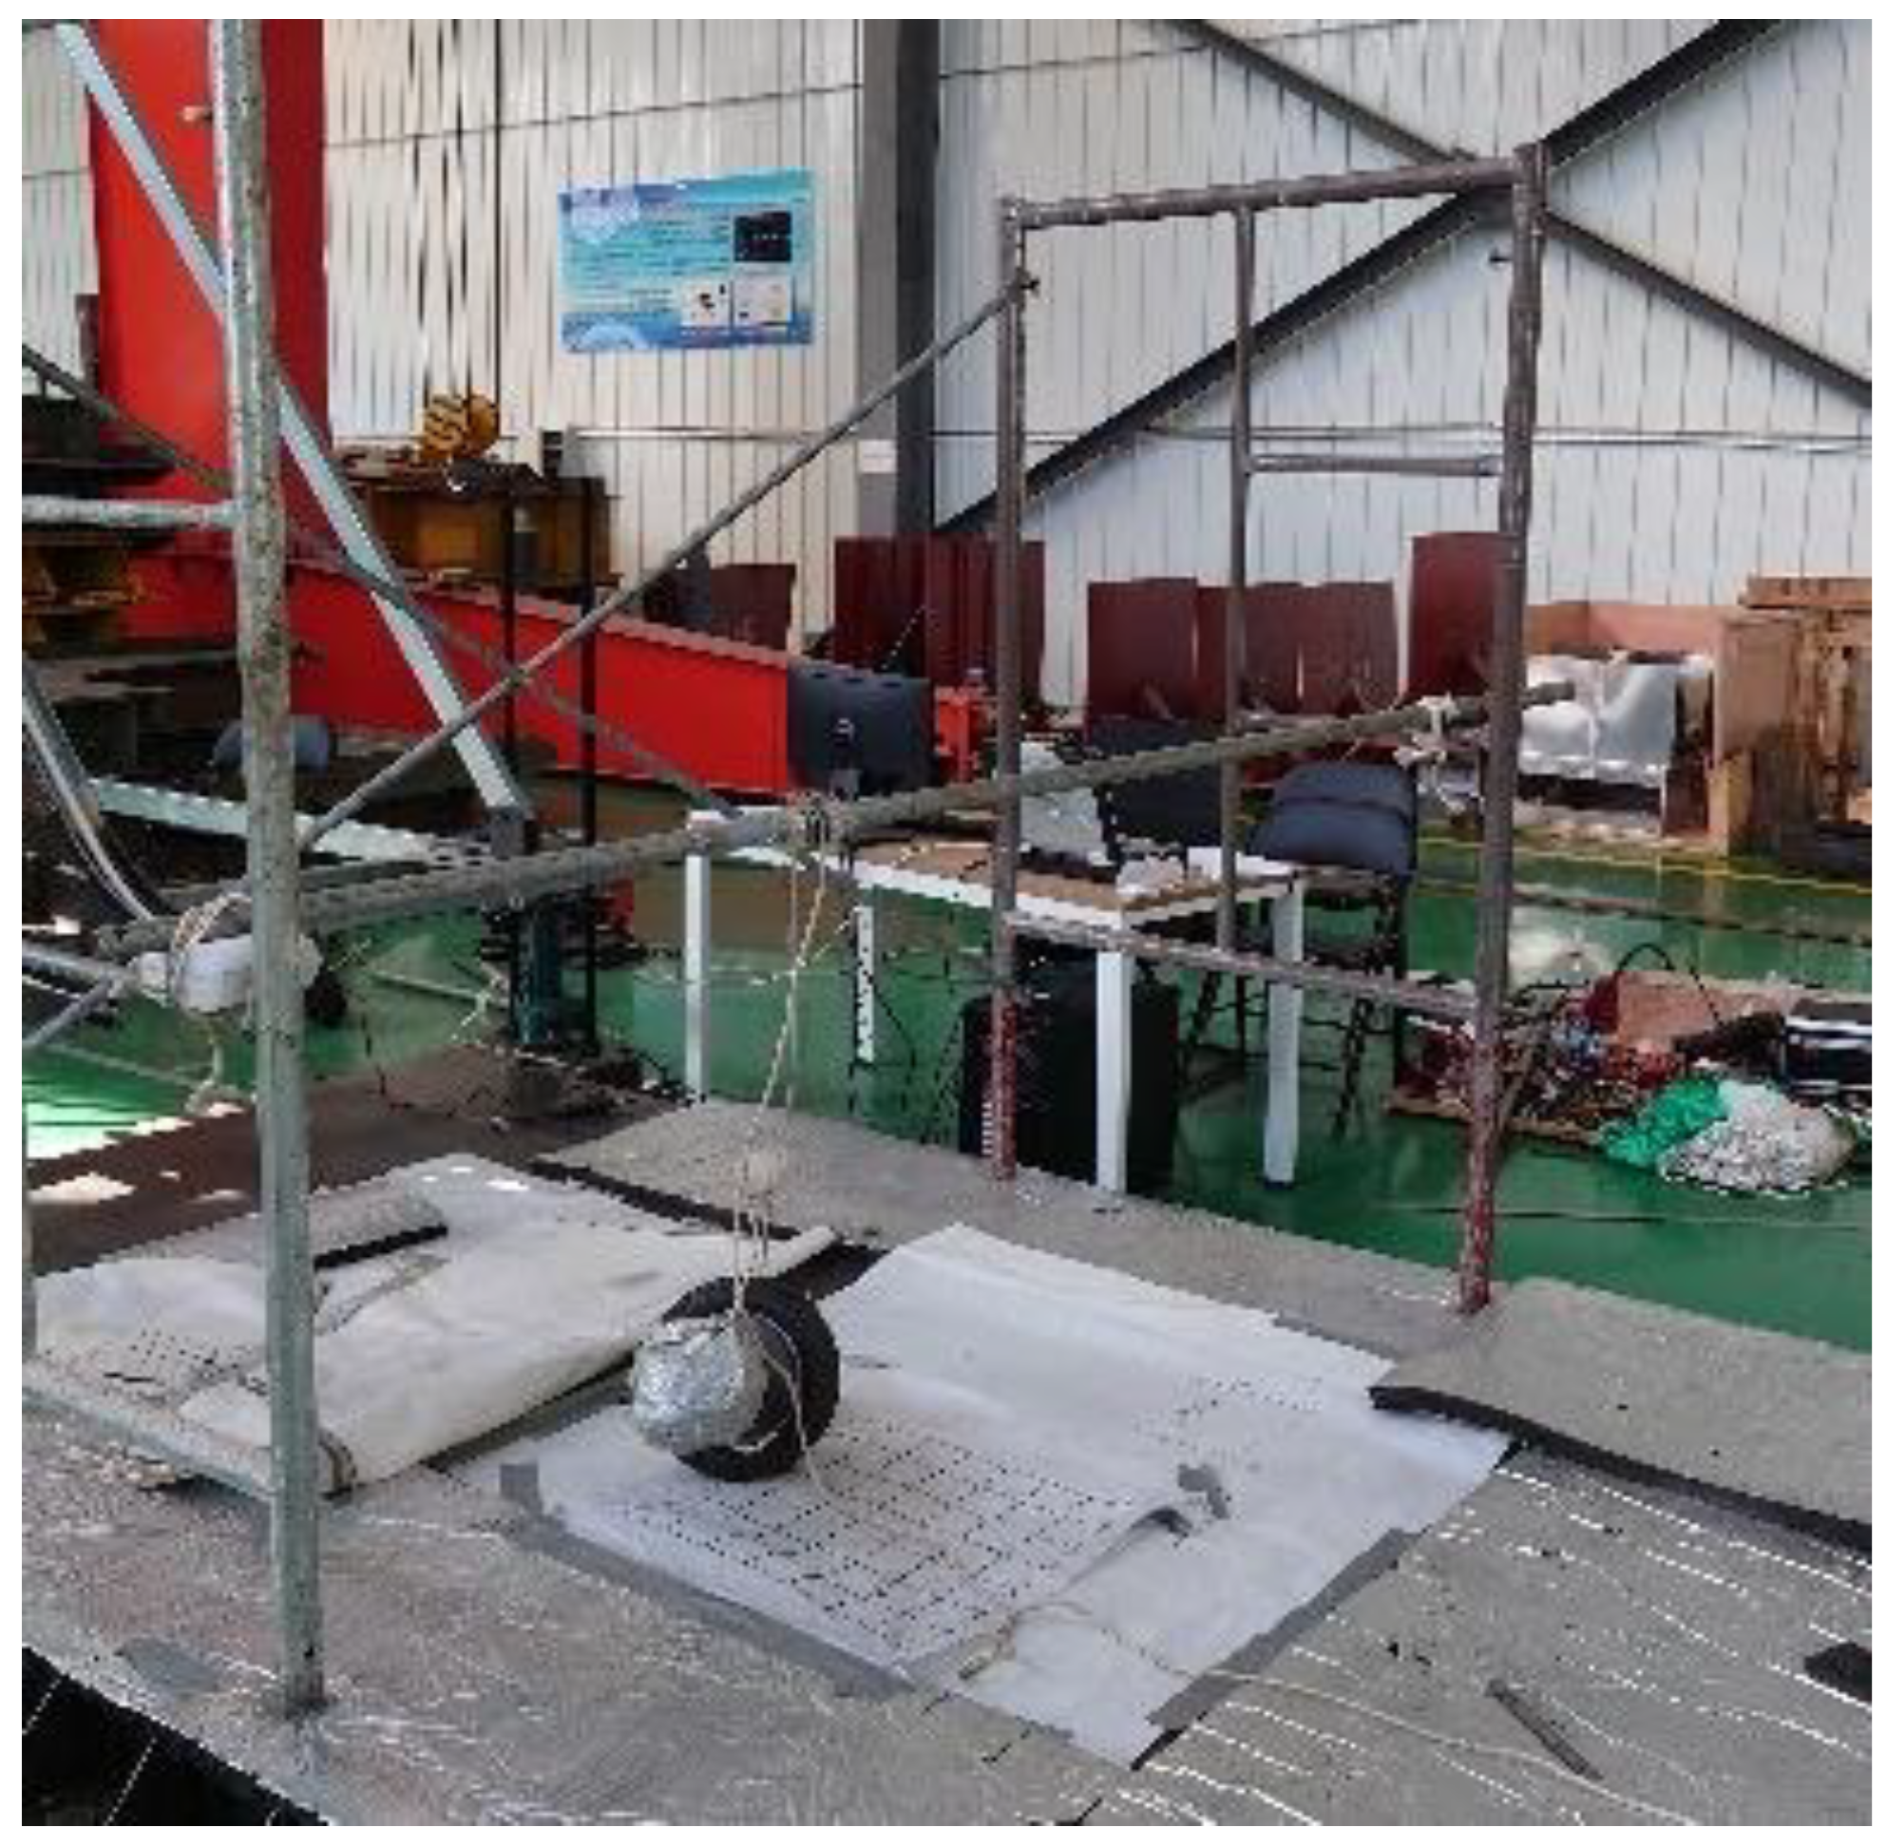
  • A test bench for a falling wheel was set up on the test grillage, as shown in Figure 7, and the force mapping sensor and photoelectric speed sensor were positioned at the expected impact area.
  • According to the test conditions (Table 1), the weight, tire pressure, and other parameters of the falling wheel were adjusted.
  • First, a pretest was conducted in the other positions of the test grillage, ensuring the safety of the test equipment and test personnel.
  • By lifting the falling wheel to a certain height, the wheel was released to complete the impact load model test.
  • We collected the data recorded by the sensors.

3.2. Reproducibility Validation

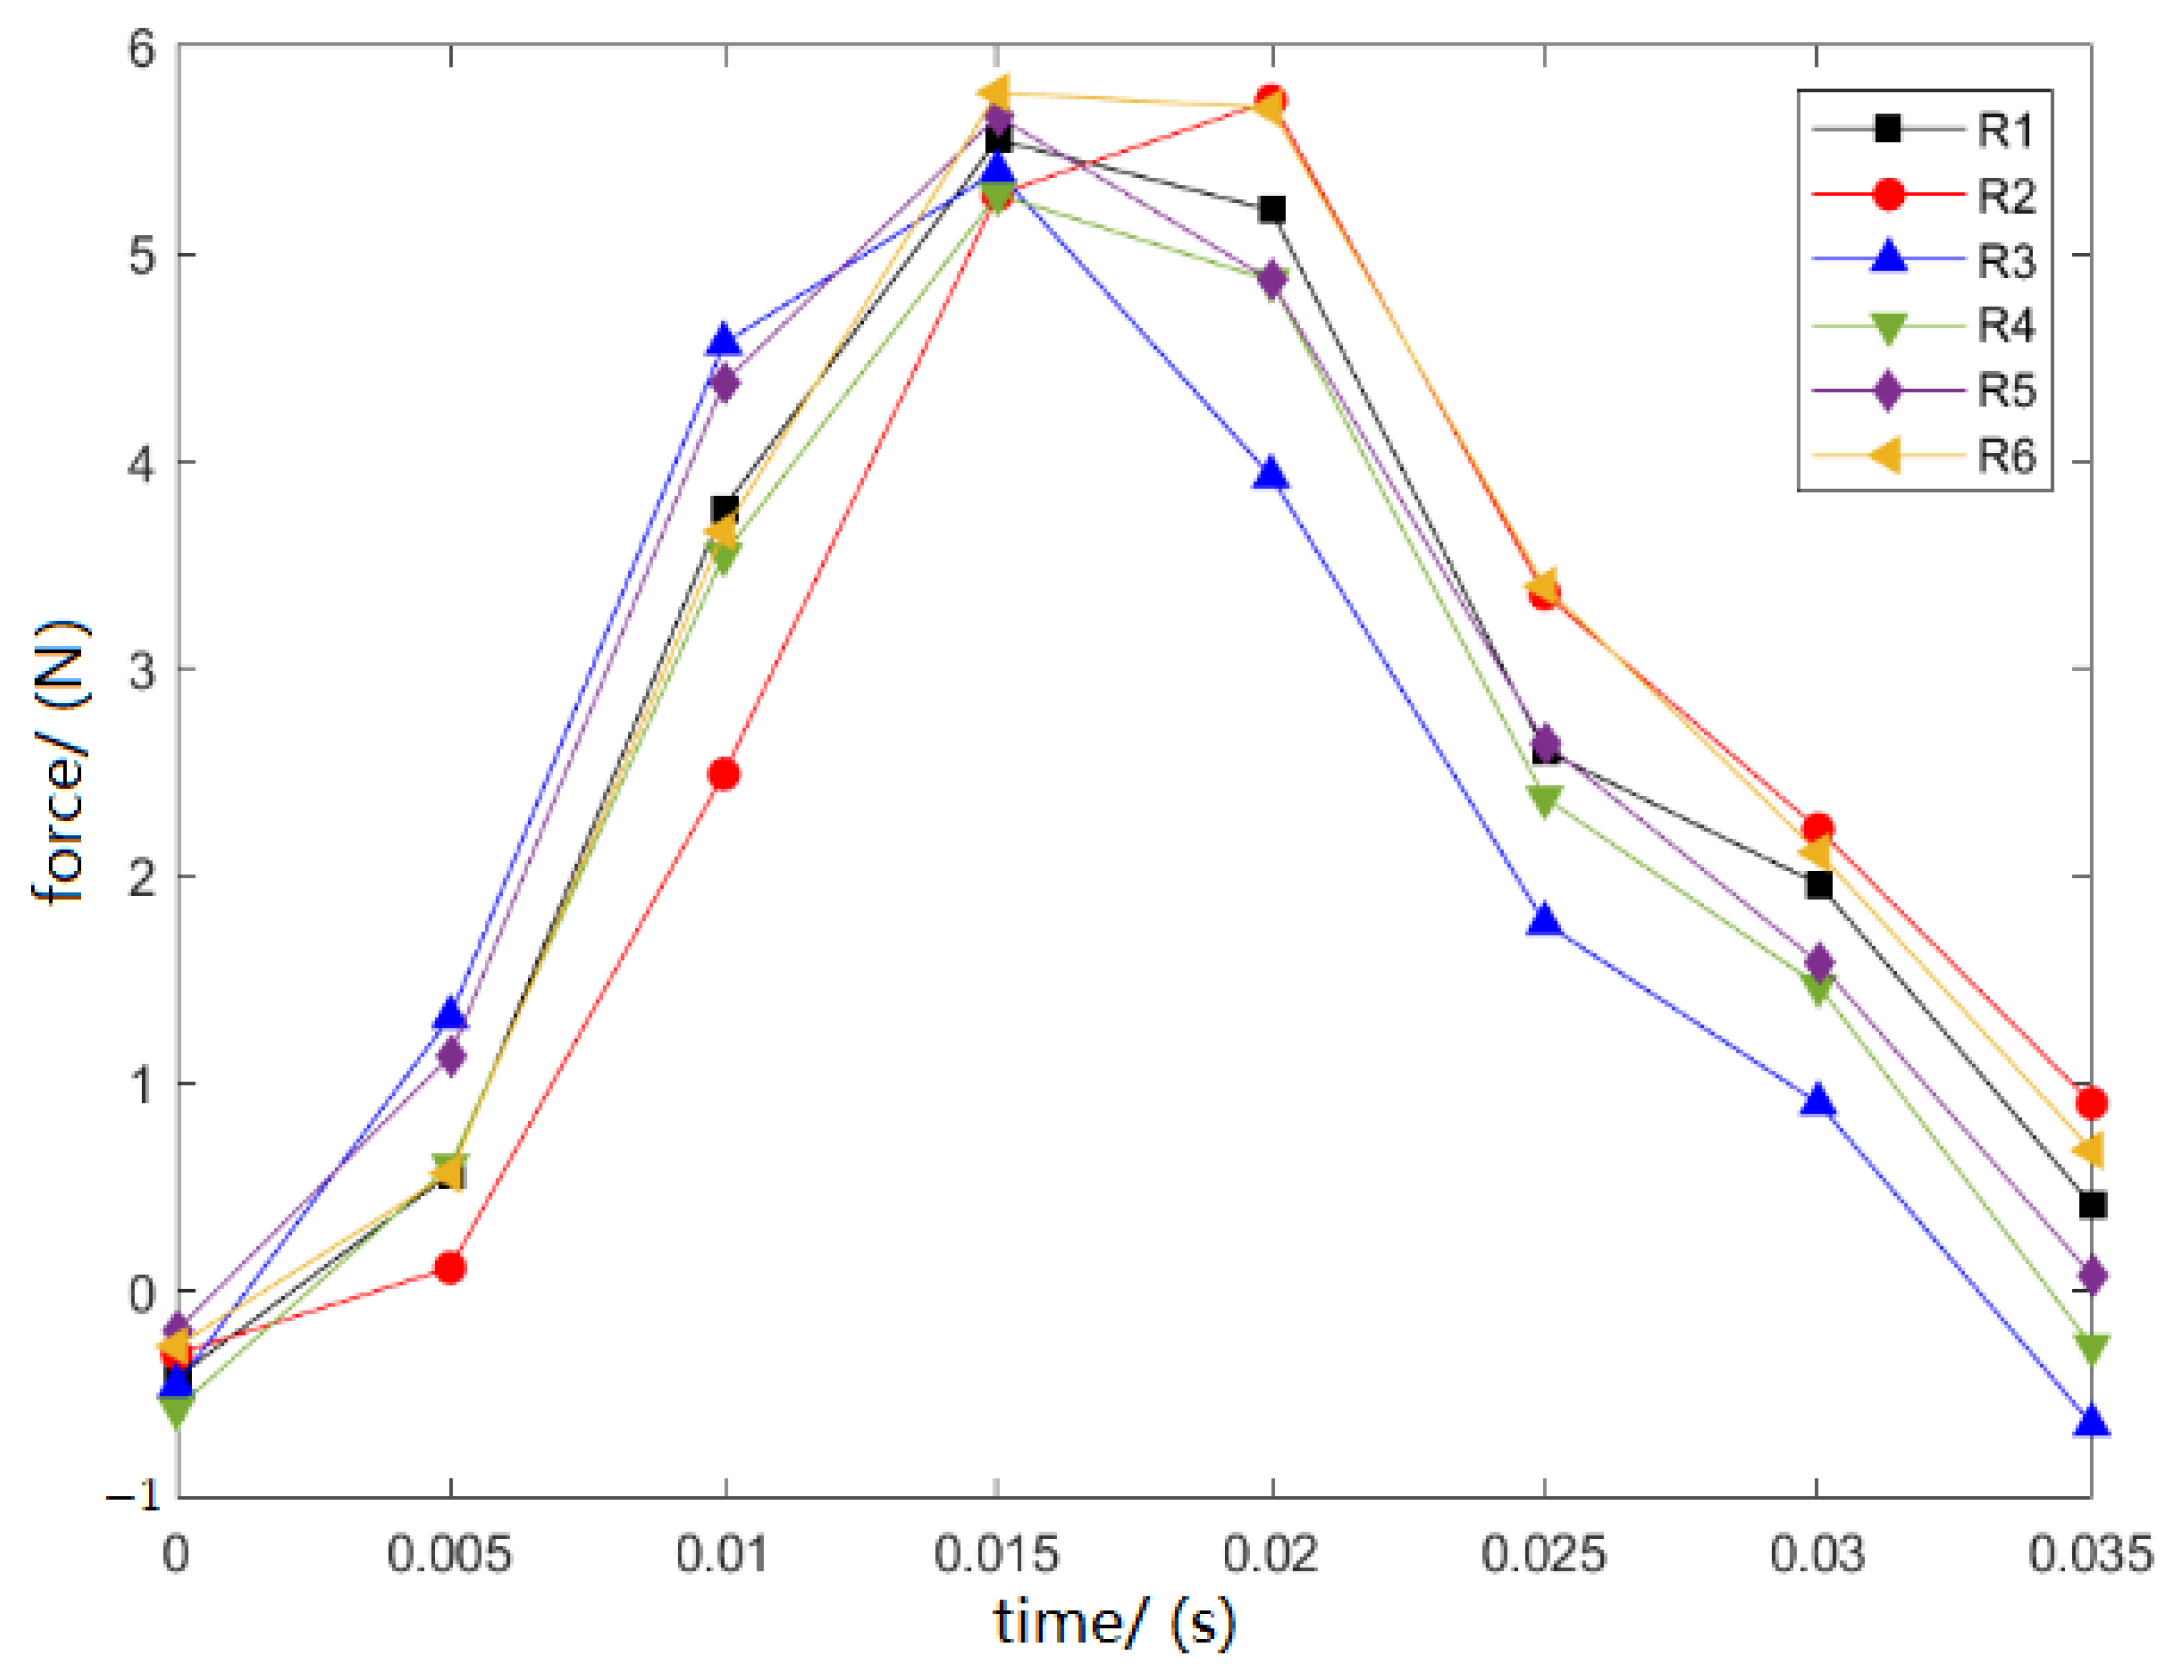
Wheel-print impact load is characterized by a small effect area, short duration, transient, and obvious dynamic response. It was necessary to perform a reproducibility validation study for different conditions through 6 independent repeated experiments. Figure 8 shows a total of 30 impact force peaks. The deviation of the impact load amplitude for each condition under the 6 repeated experiments was small, with an average error of less than 15%. In addition, the strain responses of the structure at the typical locations (strain sensors No. 2 and 4) are shown in Figure 9 and Figure 10. The amplitude and trend of the dynamic response under different tests also show good consistency. Thus, it is considered that the impact load model test method is realizable, and the results are reliable.

3.3. Characterization of Impact Load and Structure Responses

The impact force peaks of Conditions 1–5 in Figure 8 show that the impact load is positively correlated with the weight and vertical impact speed of the falling wheel. The larger the mass and the faster the vertical impact speed, the greater the impact load. As a result, rational control of landing and vertical landing speed in the process of flight is vital to the security of helicopters and ships.
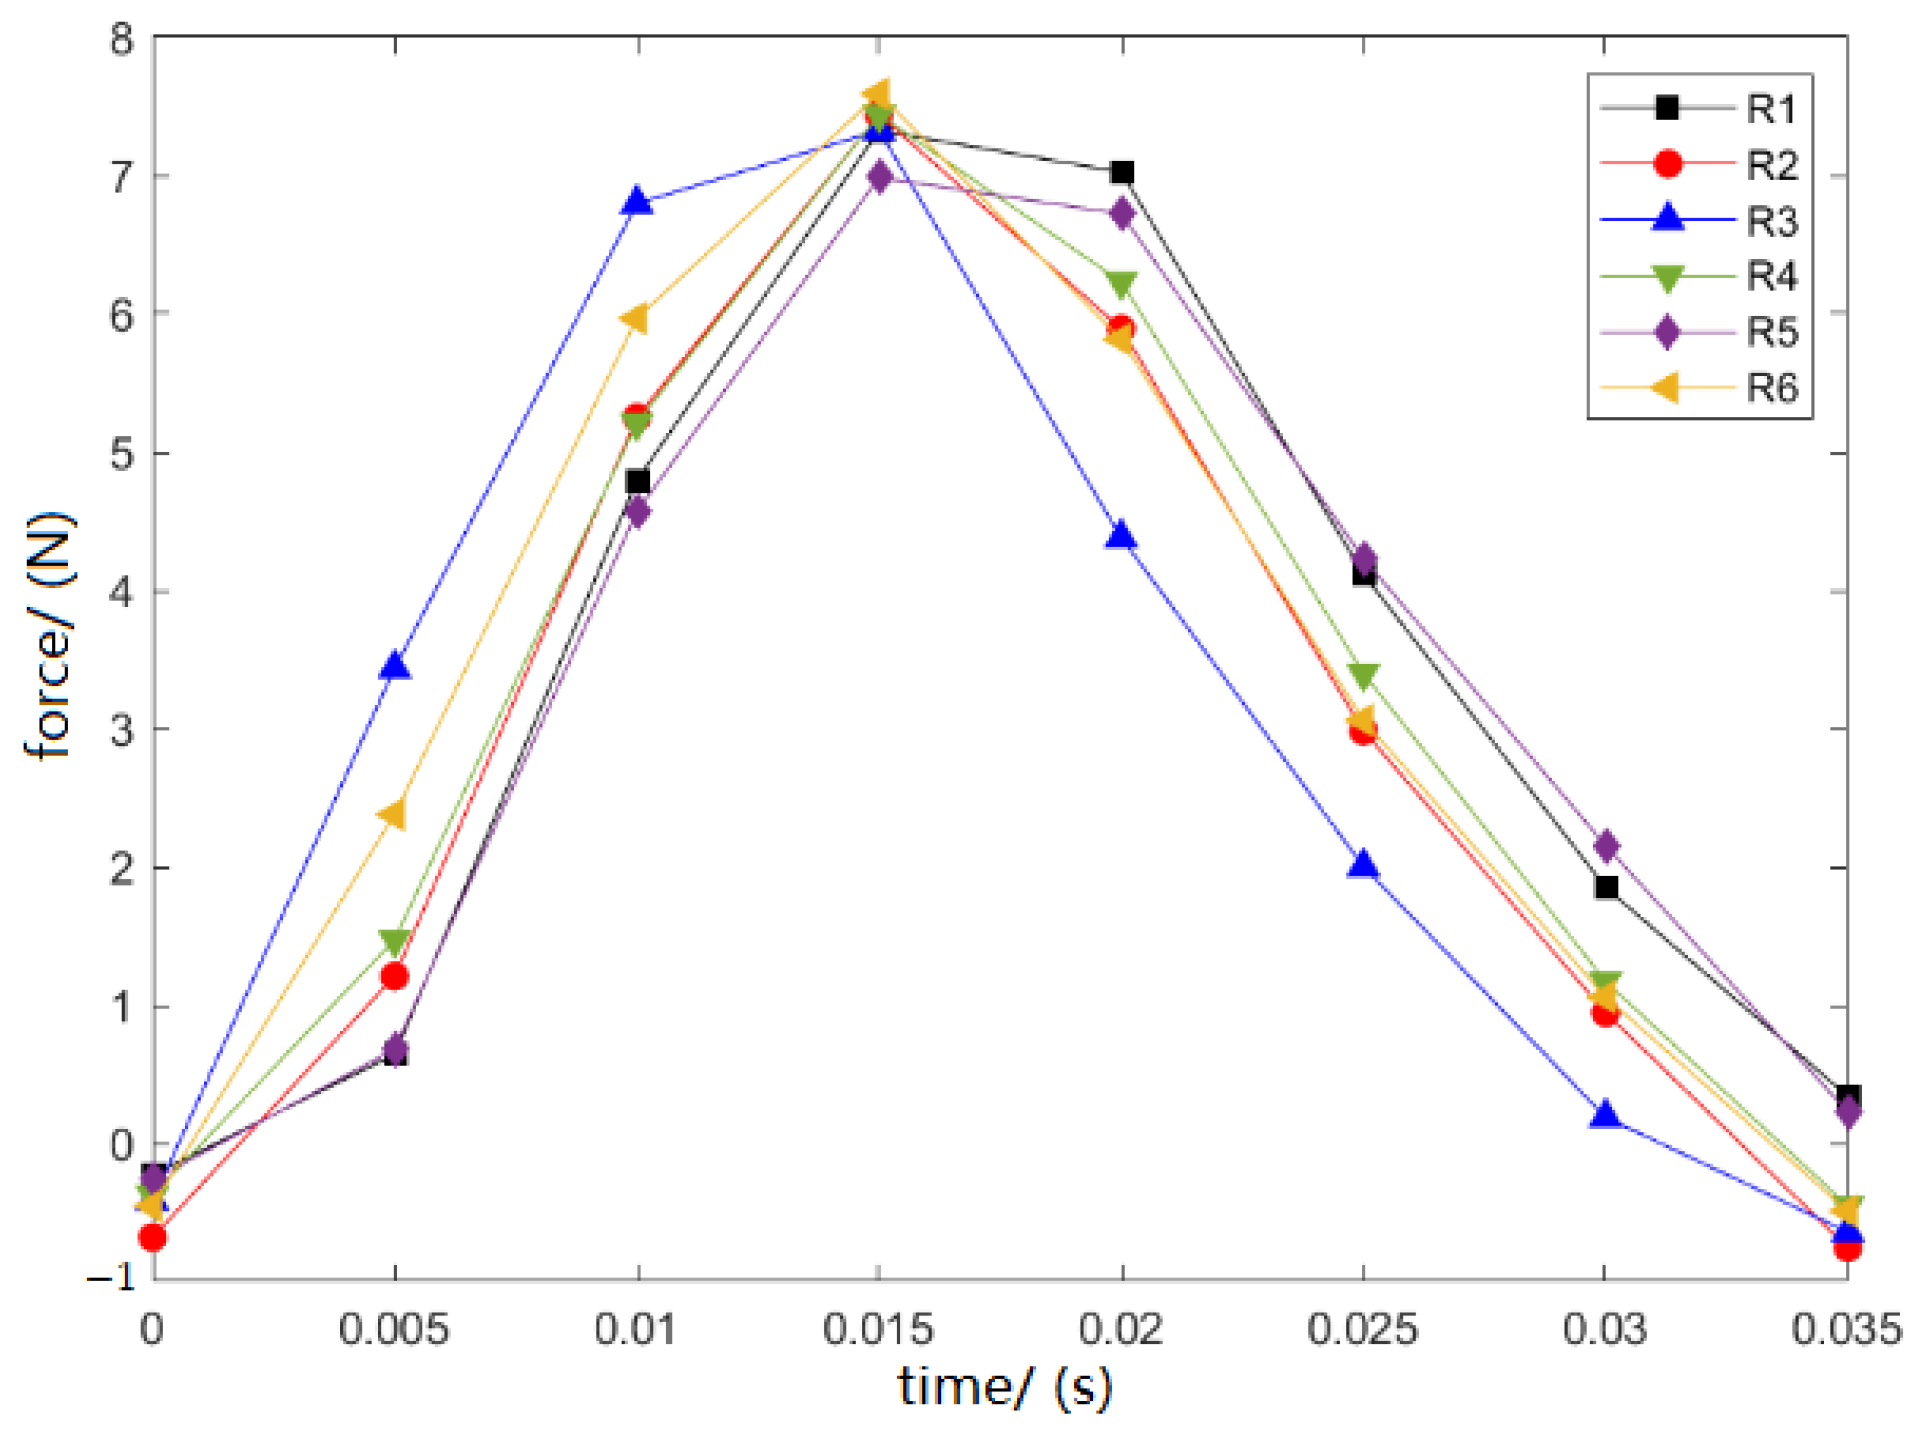
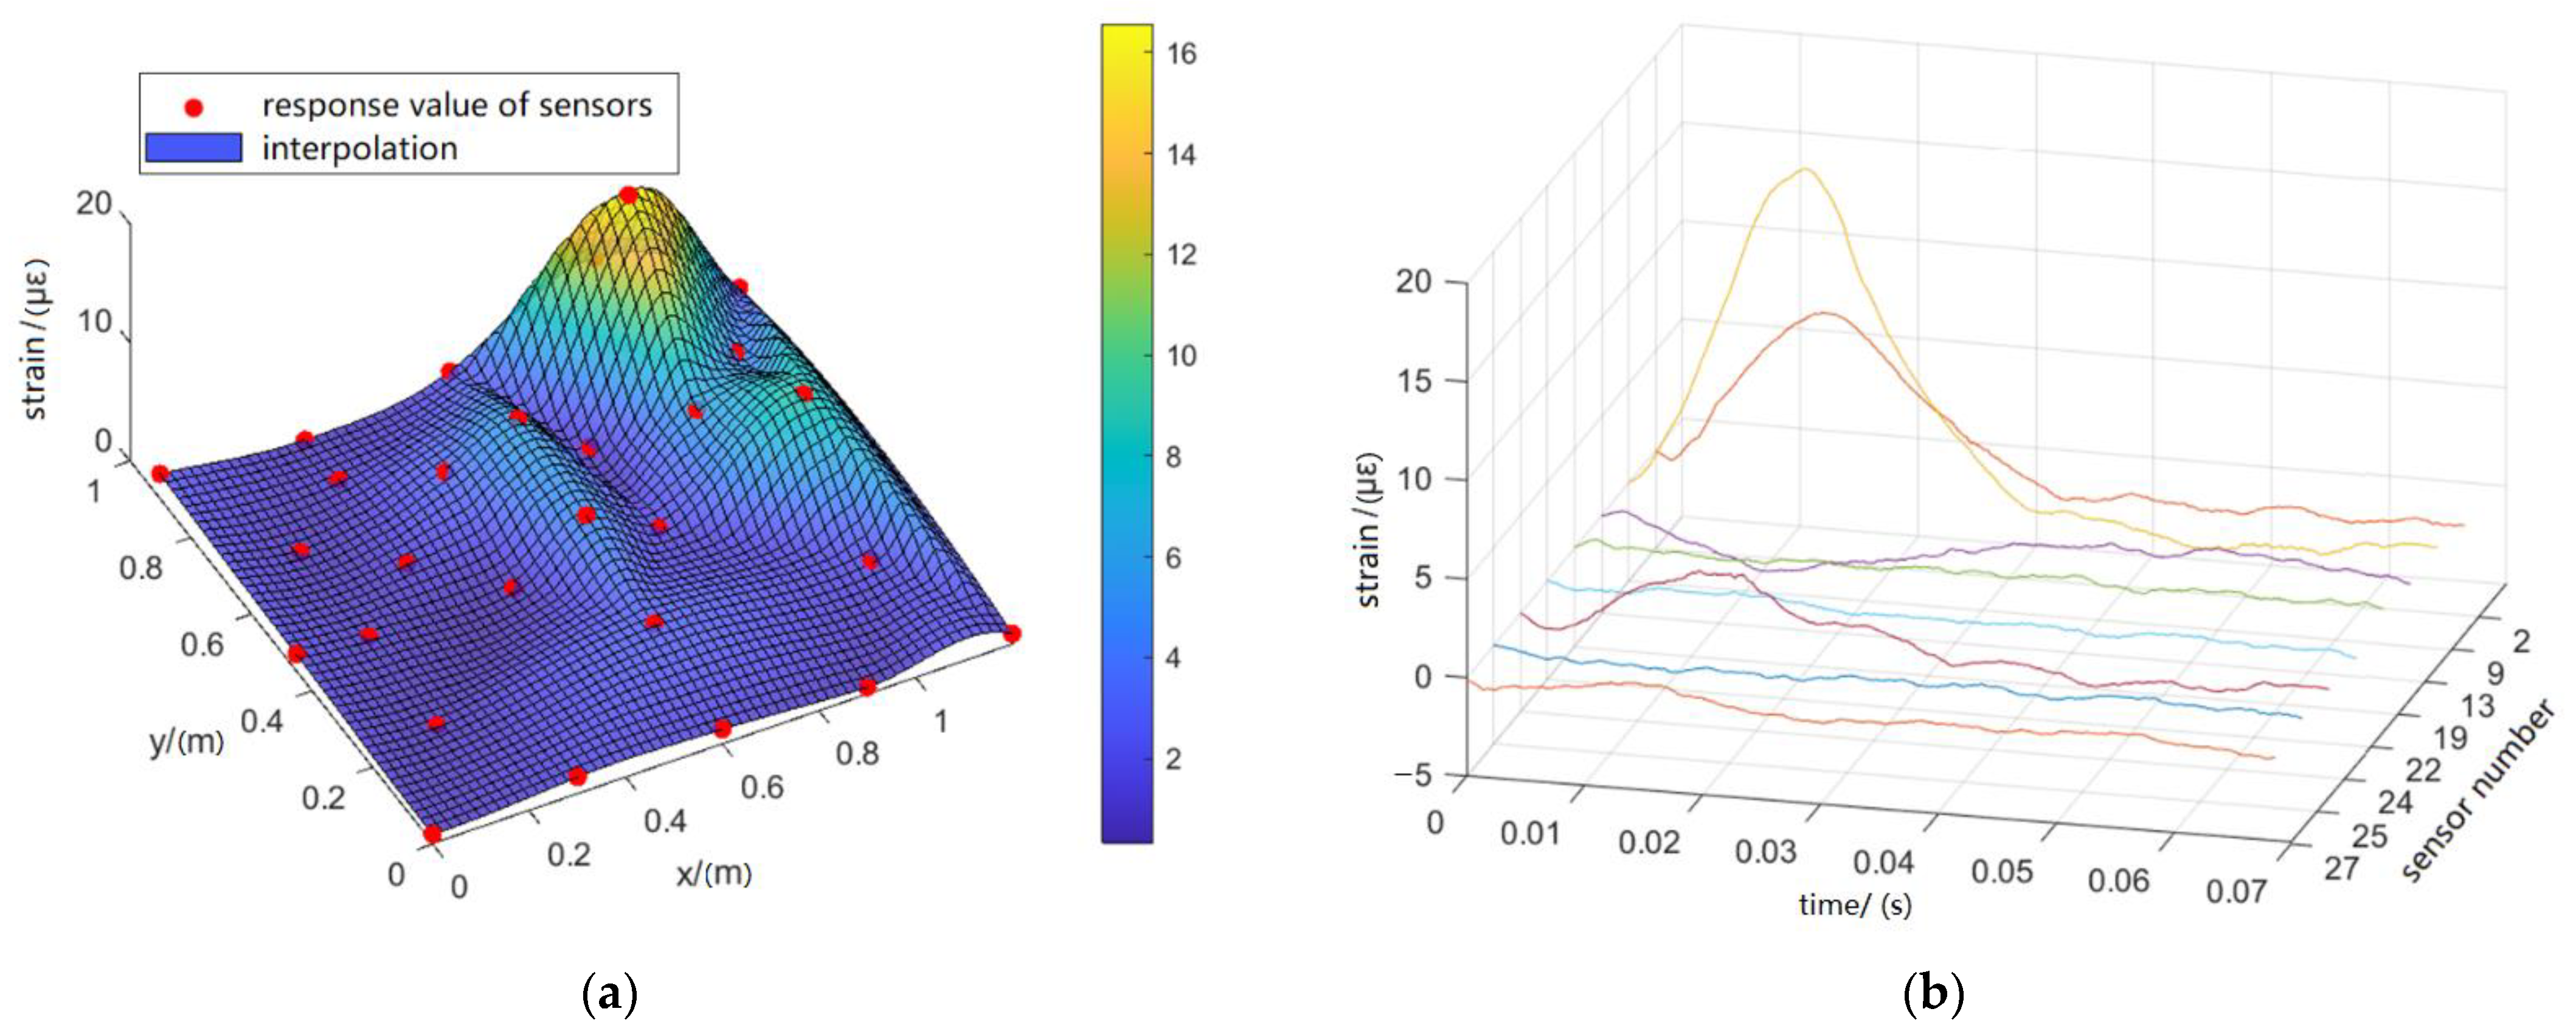
Taking Condition 1 as an example, the spatial and temporal distributions of strain responses under impact landing are shown in Figure 11.
The spatial distribution shows that the strain signals of the measuring points close to the impact position, such as S8, S9, S10, and S11, were the strongest; and the points farther away, such as S8, S9, S10 and S11, came next. However, the signal strength of the other measuring points was very small. This shows that the structural dynamic response under the impact load quickly extends around the impact position, and the strain wave strength steadily reduces as the spreading distance increases. When the strain wave spreads to a certain range (approximately one strong frame spacing), the strain response decays to the structural vibration response.
From the temporal distribution, it can be seen that the structural response near the impact area shows an obvious triangle distribution. The effective response duration is approximately 0.035 s, and the response reaches its peak at 0.015 s. In addition, the other points primarily show the structural vibration response.

4. Impact Load Inversion Calculation

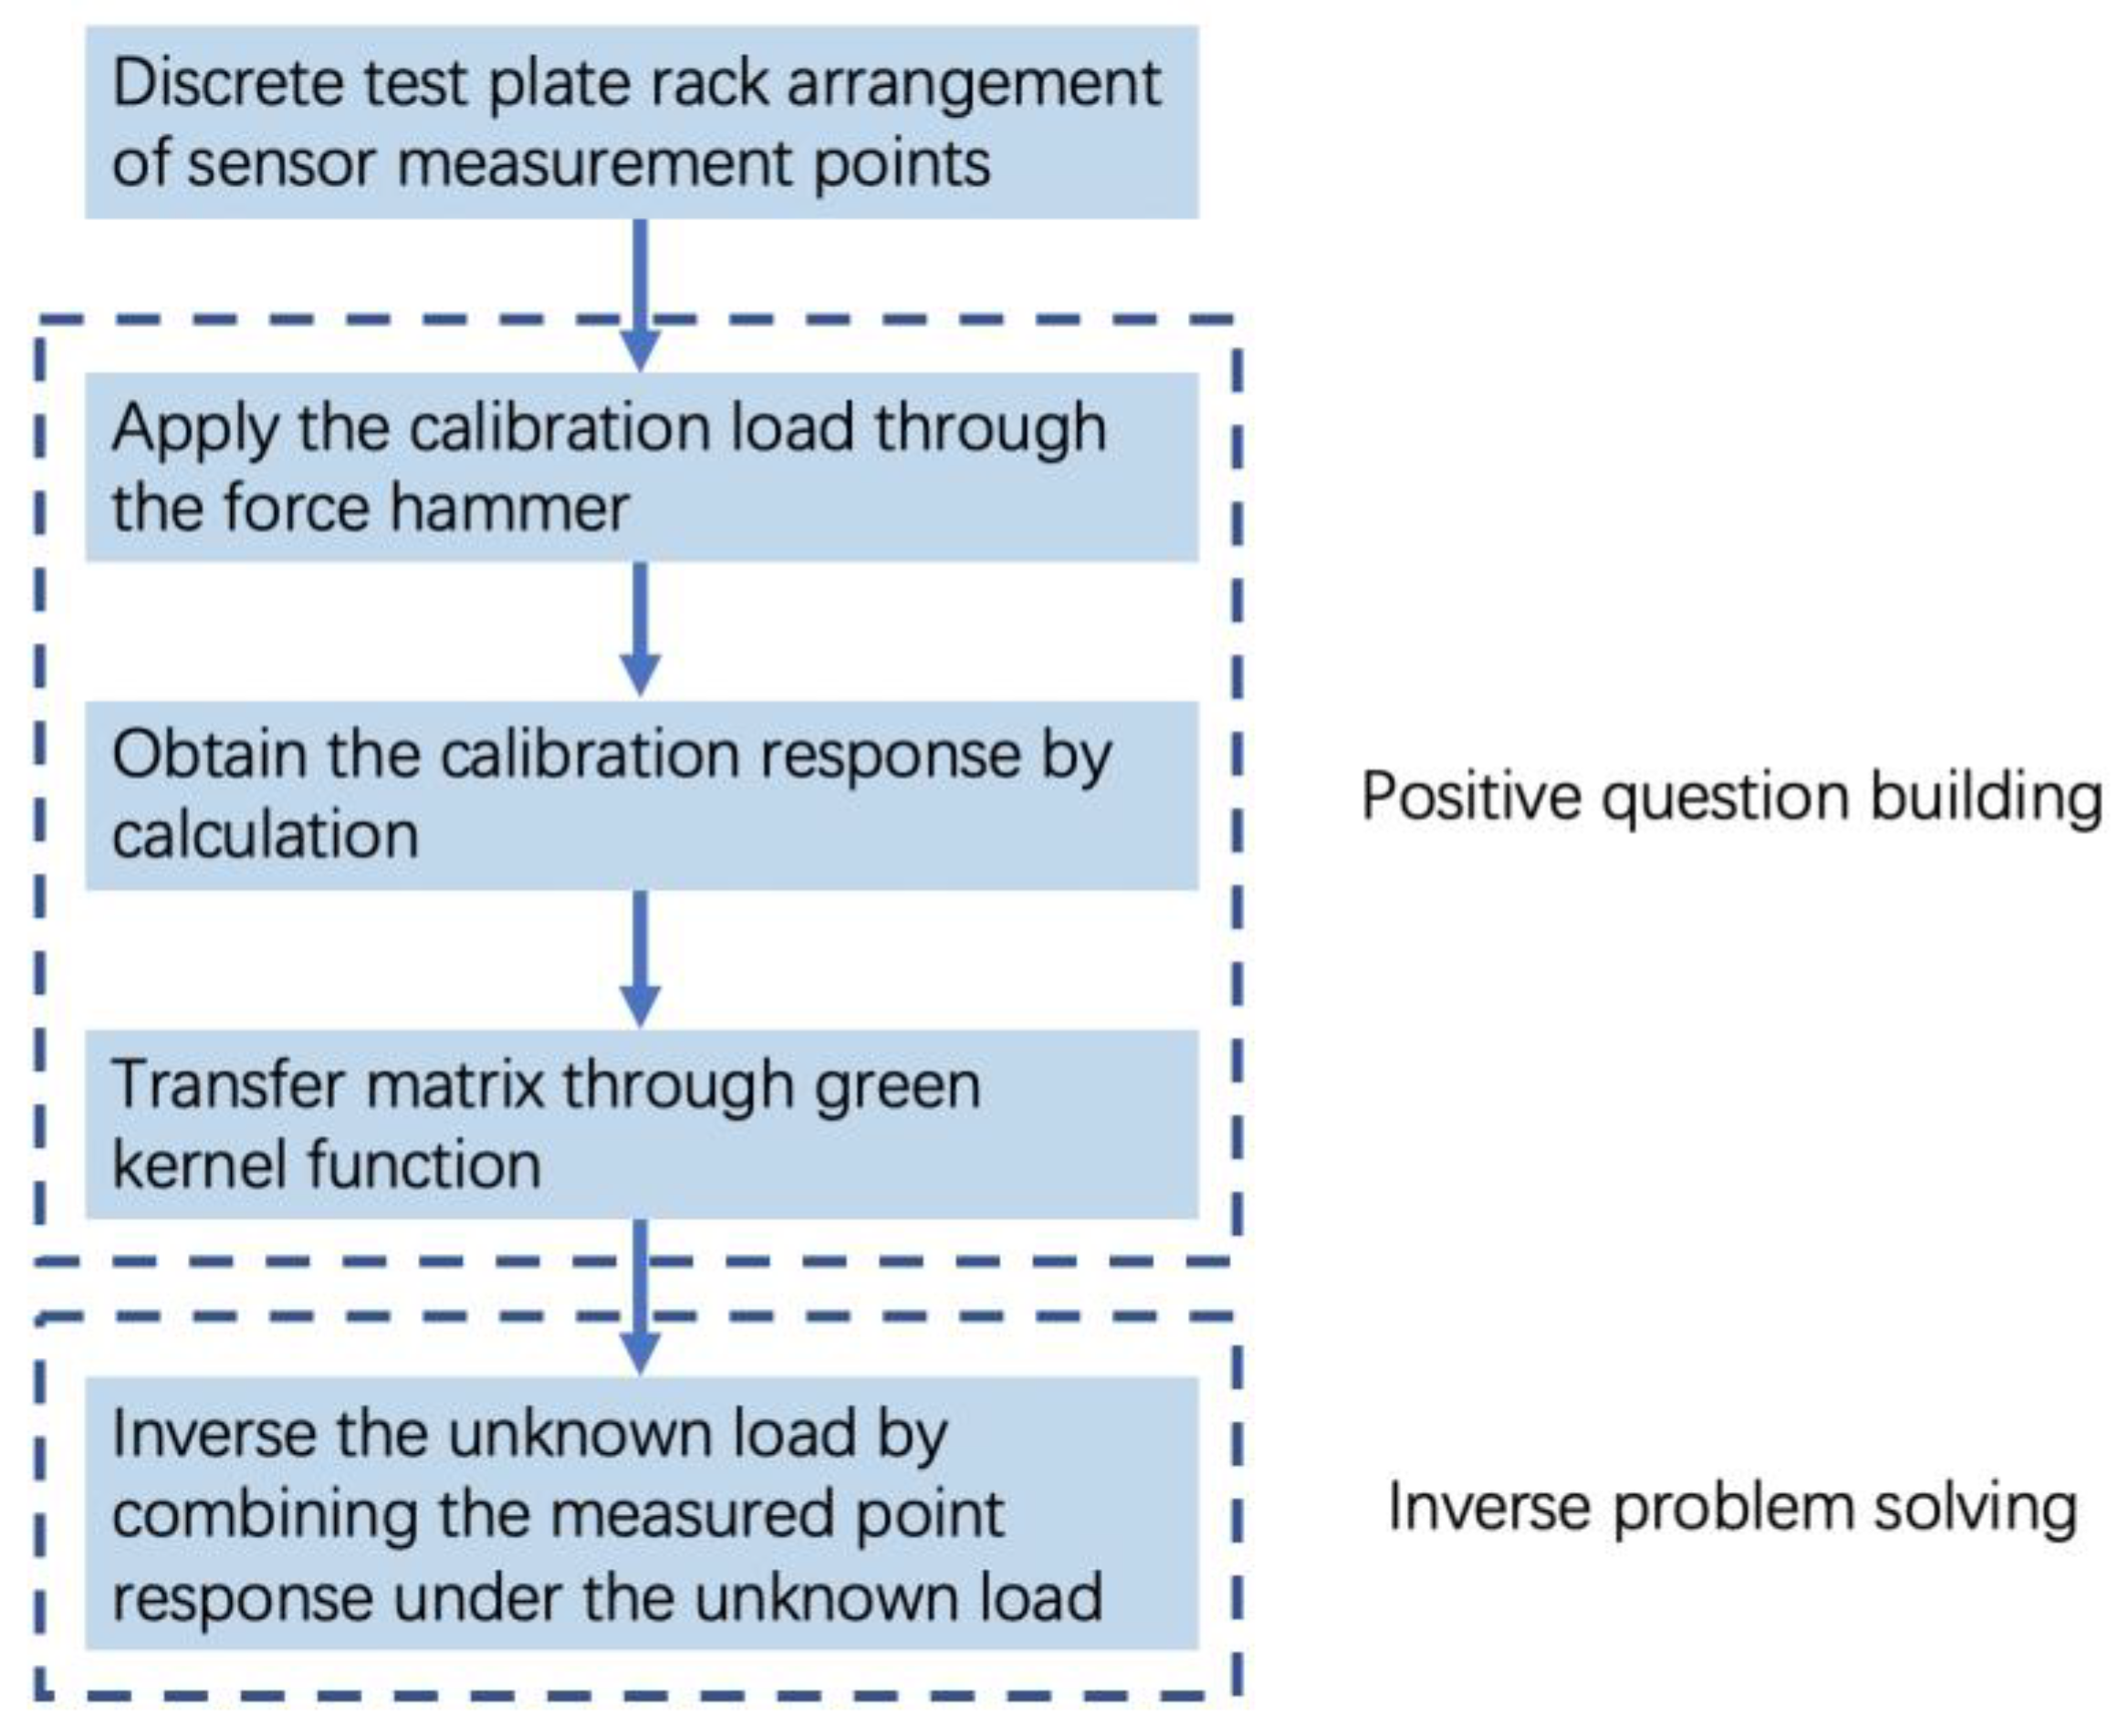
The procedures of impact load inversion are shown in Figure 12. First, the test area is divided into a co discrete grid by longitudinal and transverse structural members. Second, the calibration load is applied to all possible impact positions by the force hammer. Then, the calibration of the transfer matrix through the green kernel function is completed according to the strain response at the sensor and the impact load value recorded by the force hammer.
Based on the impact load model test, the responses of strain sensors close to the impact position (such as S8, S9, S10, and S11 under Condition 1) were extracted. Different impact load inversion methods were carried out for the validation study.
  • Direct inverse method: direct matrix inversion in inverse matrix operations.
  • TSVD-L method: The TSVD regularization technique is applied in the inverse matrix operation, and the regularization parameters are selected by the L-curve criterion method.
  • TSVD-GCV method: The TSVD regularization technique is applied in the inverse matrix operation, and the regularization parameters are selected by the GCV determination criterion method.
  • Tik-L method: The Tikhonov regularization technique is applied in the inverse matrix operation, and the regularization parameters are selected by the L-curve criterion method.
  • Tik-GCV method: The Tikhonov regularization technique is applied in the inverse matrix operation, and the regularization parameters are selected using the GCV determination criterion method.
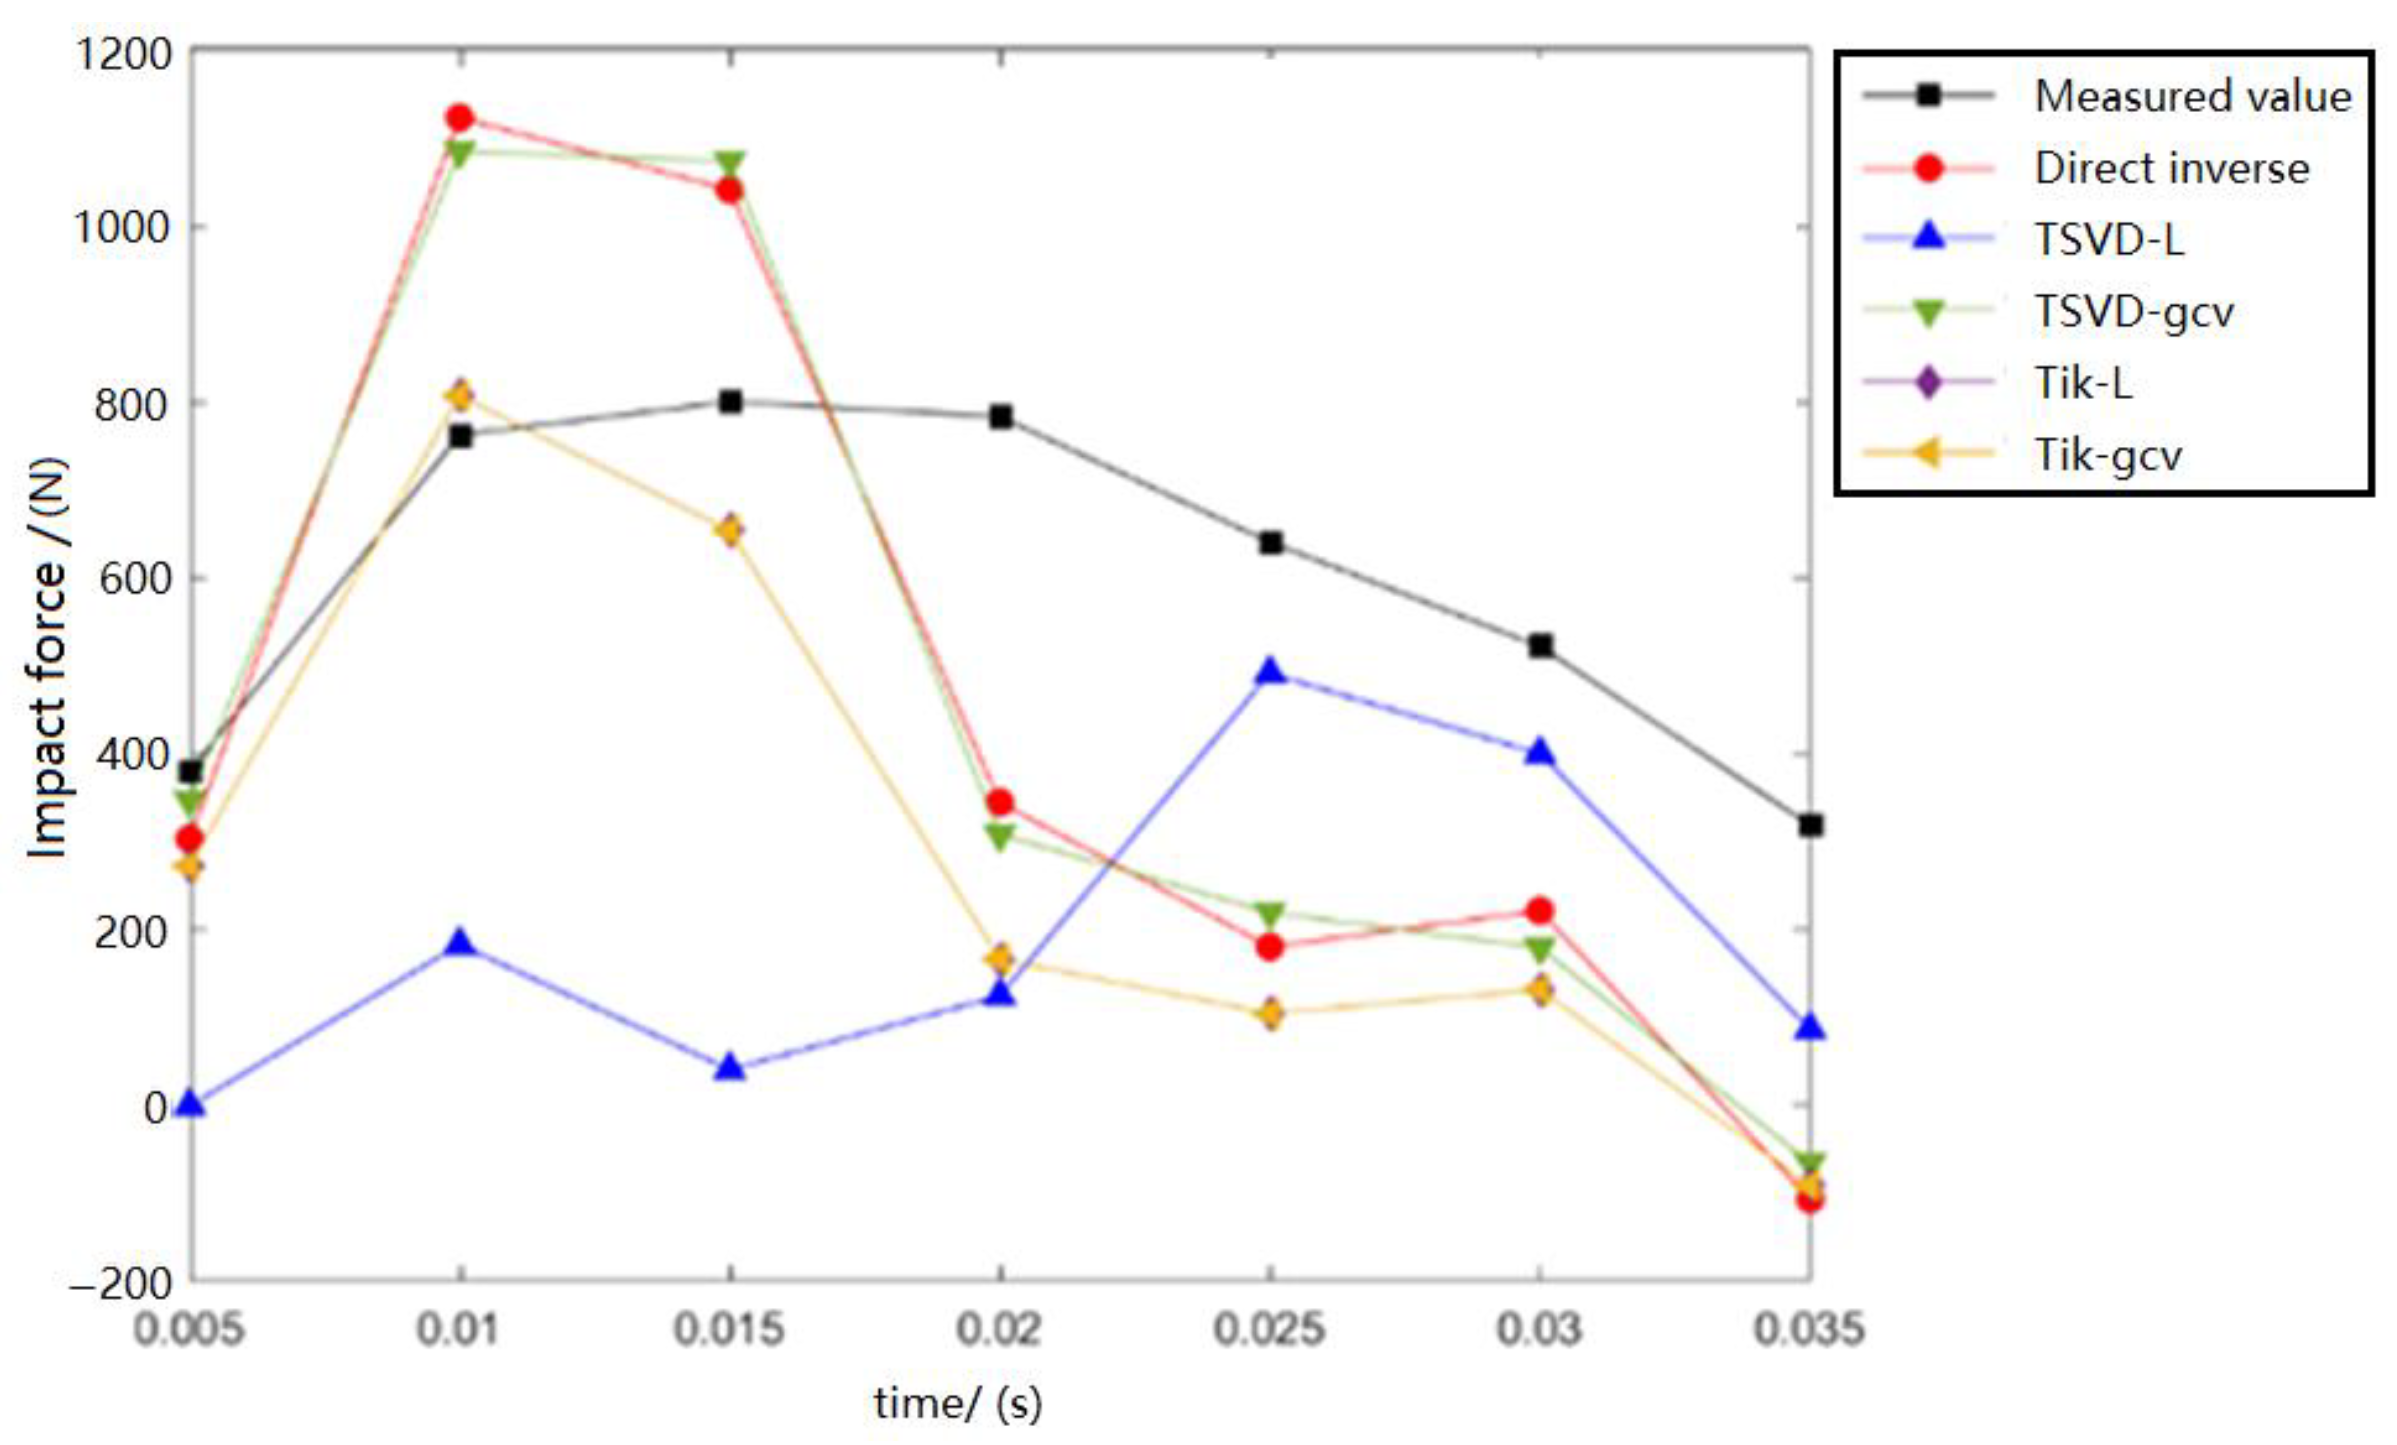
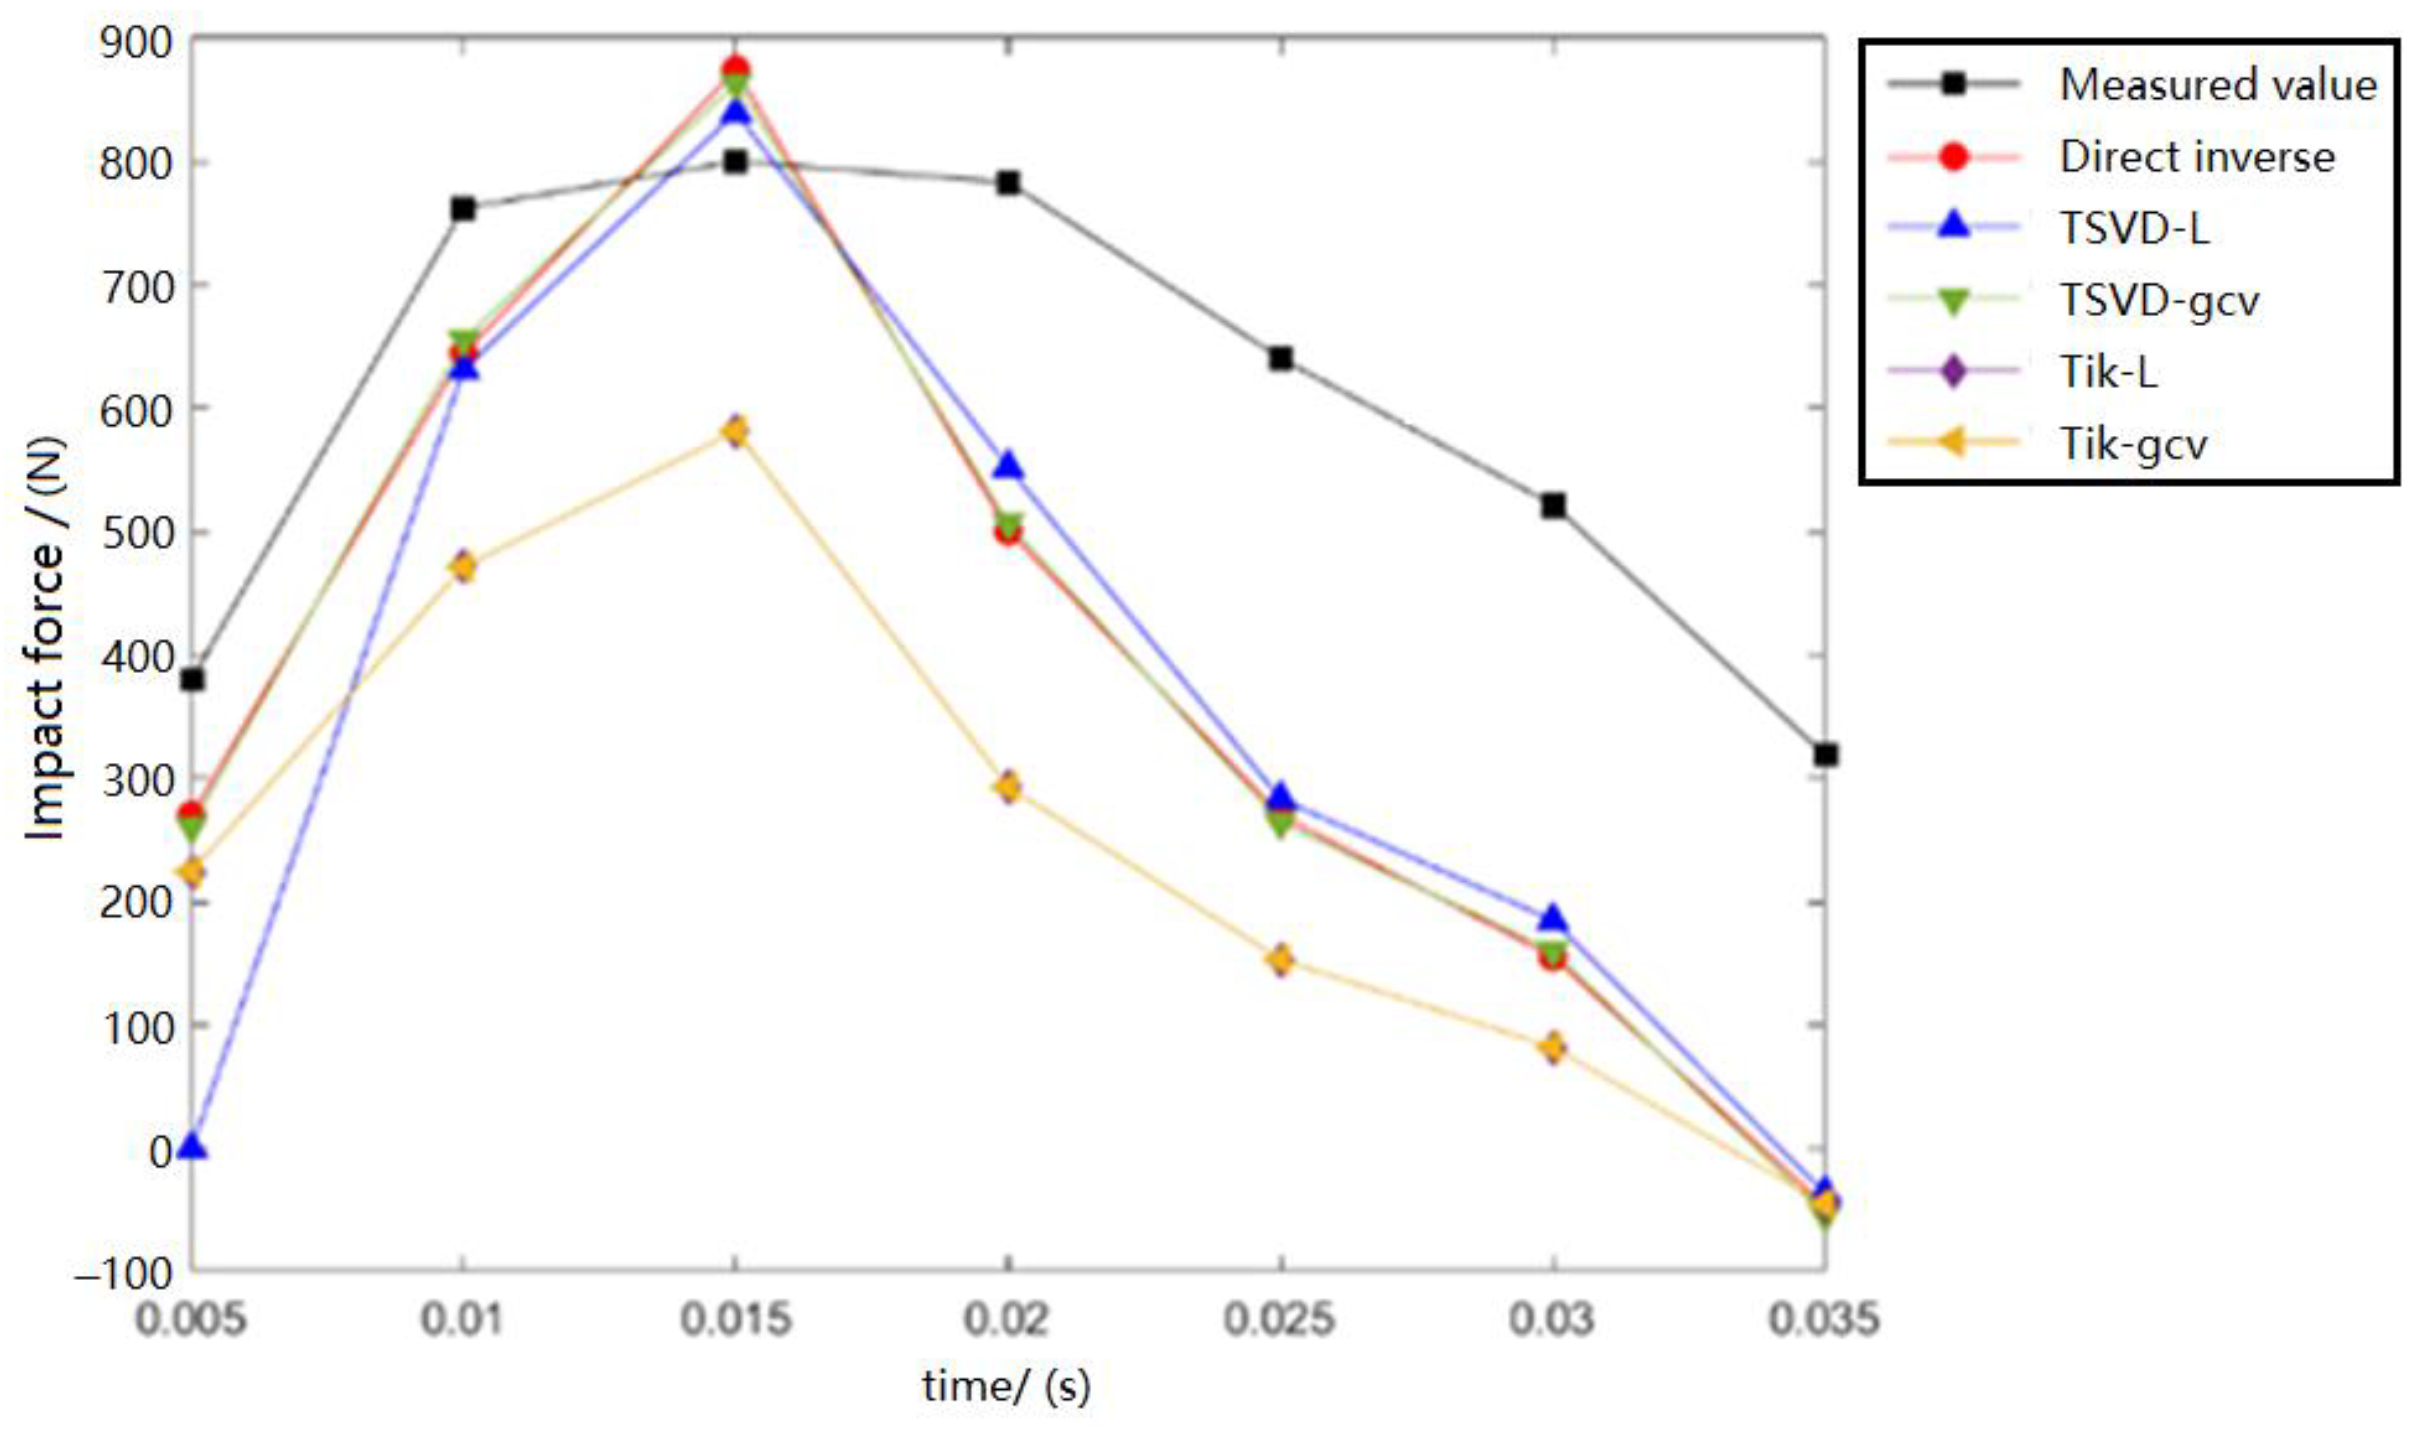
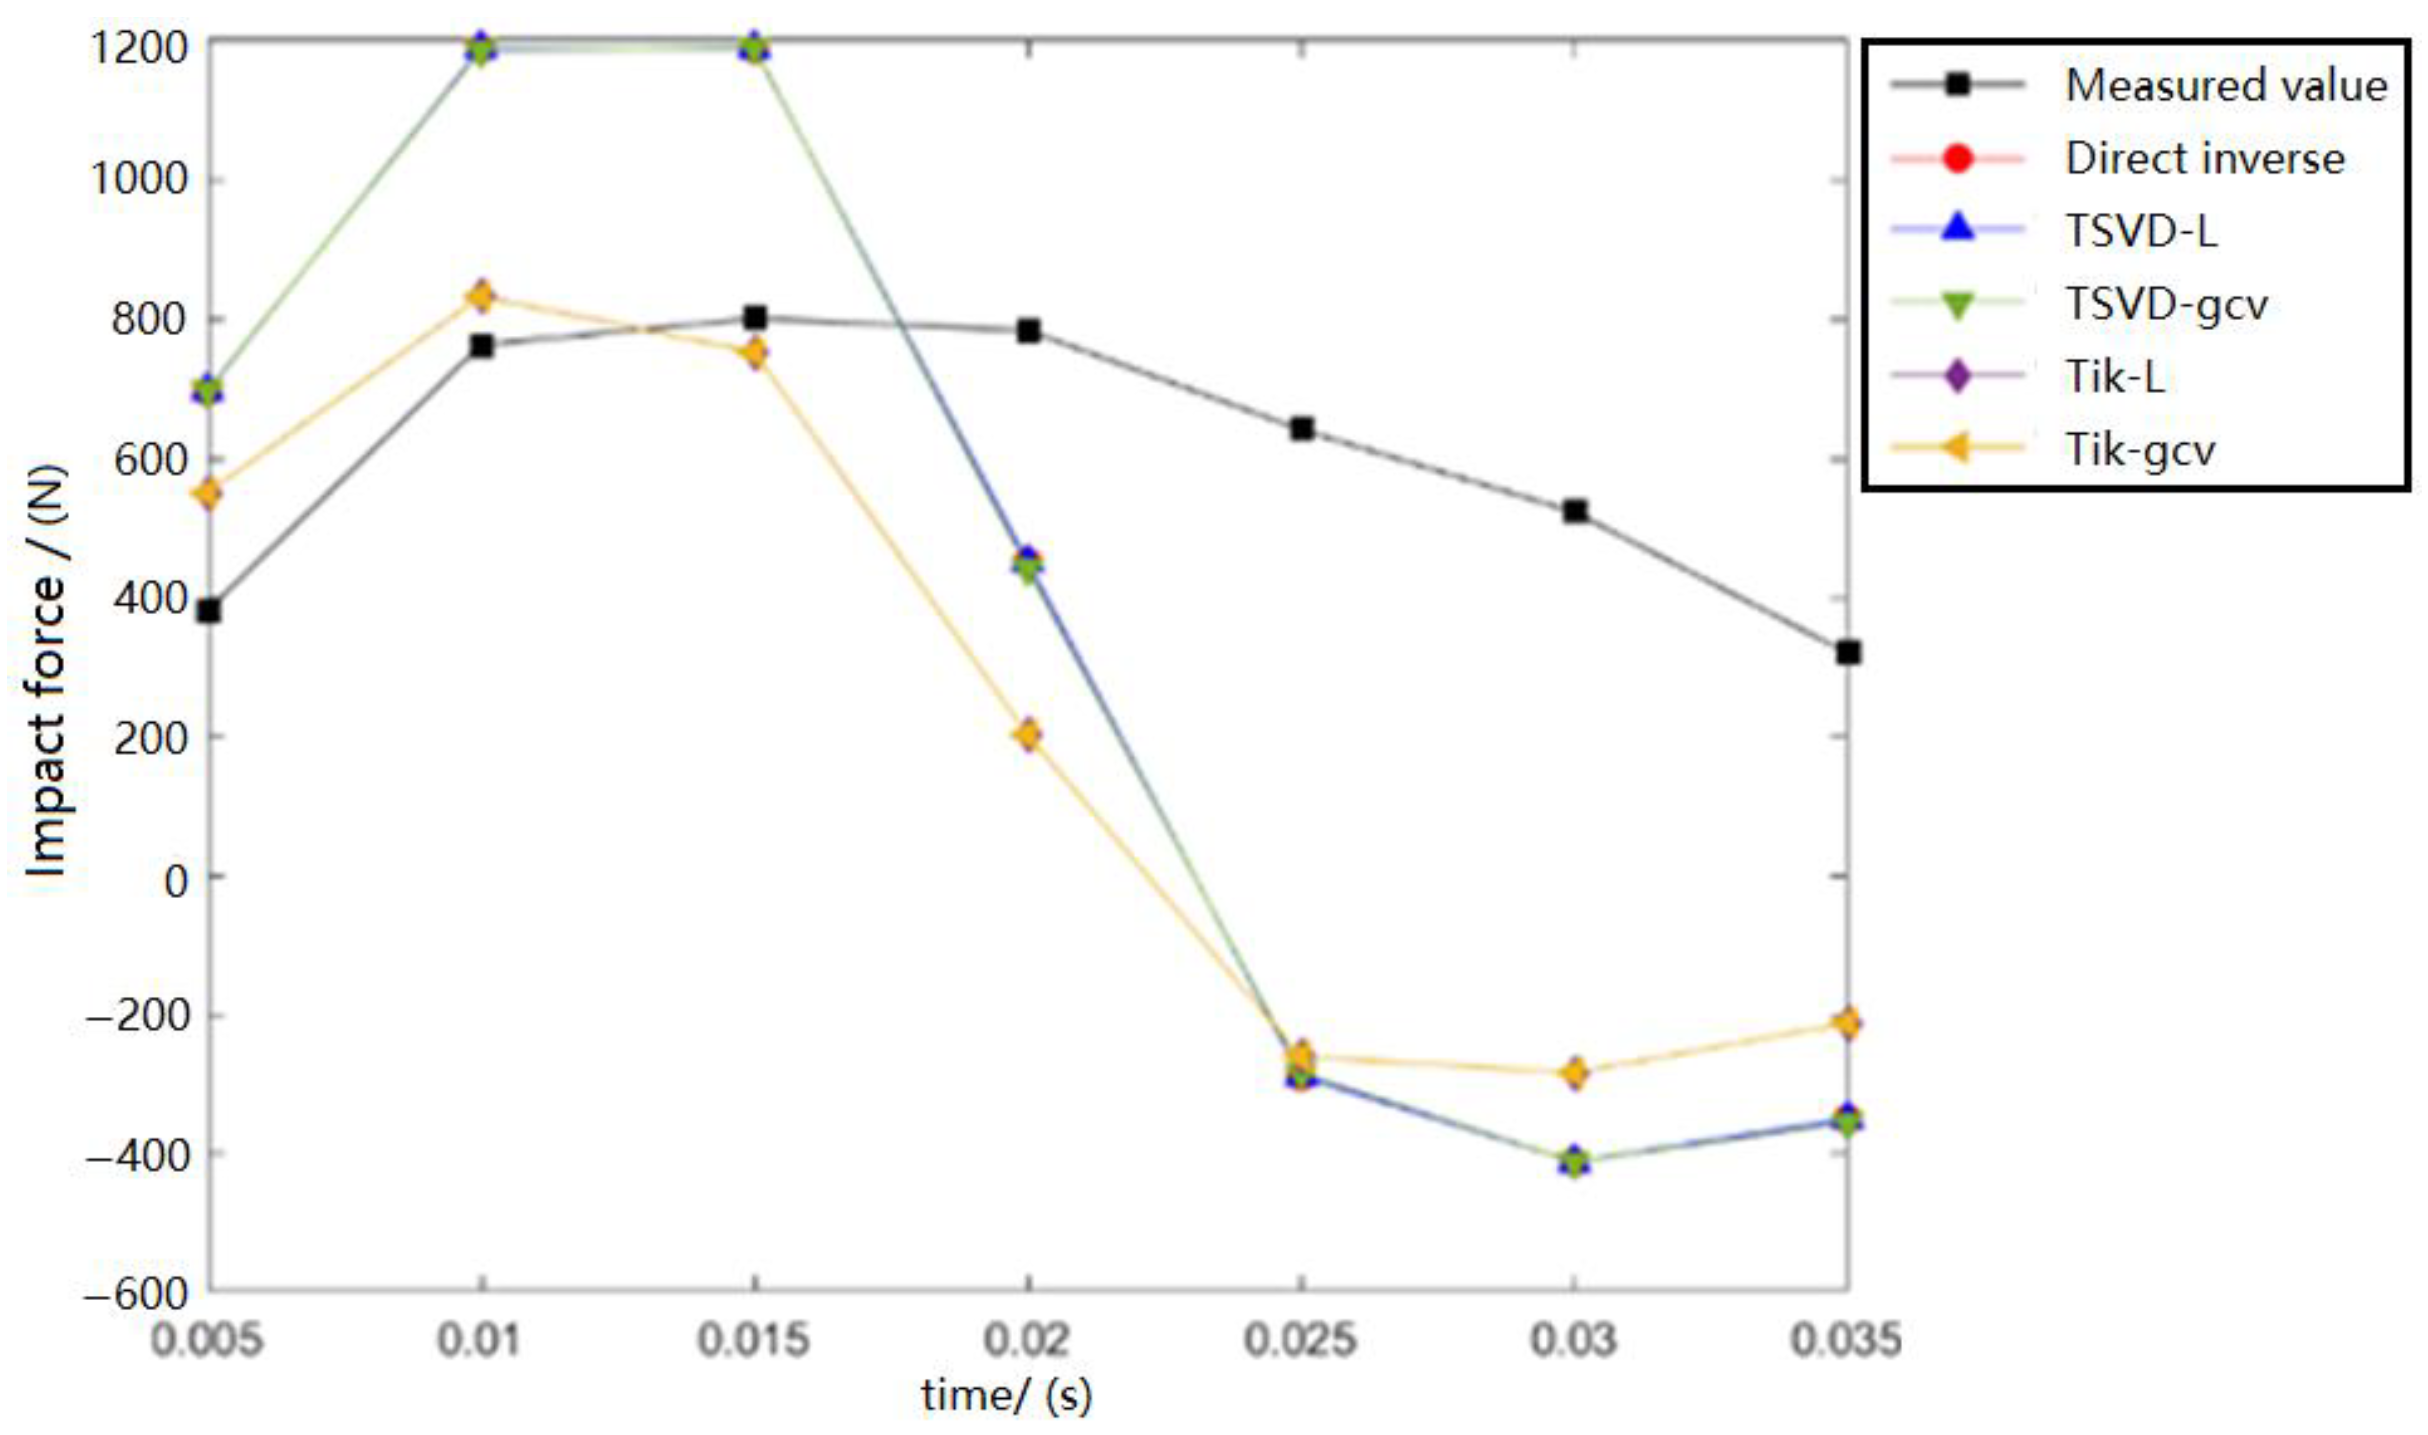
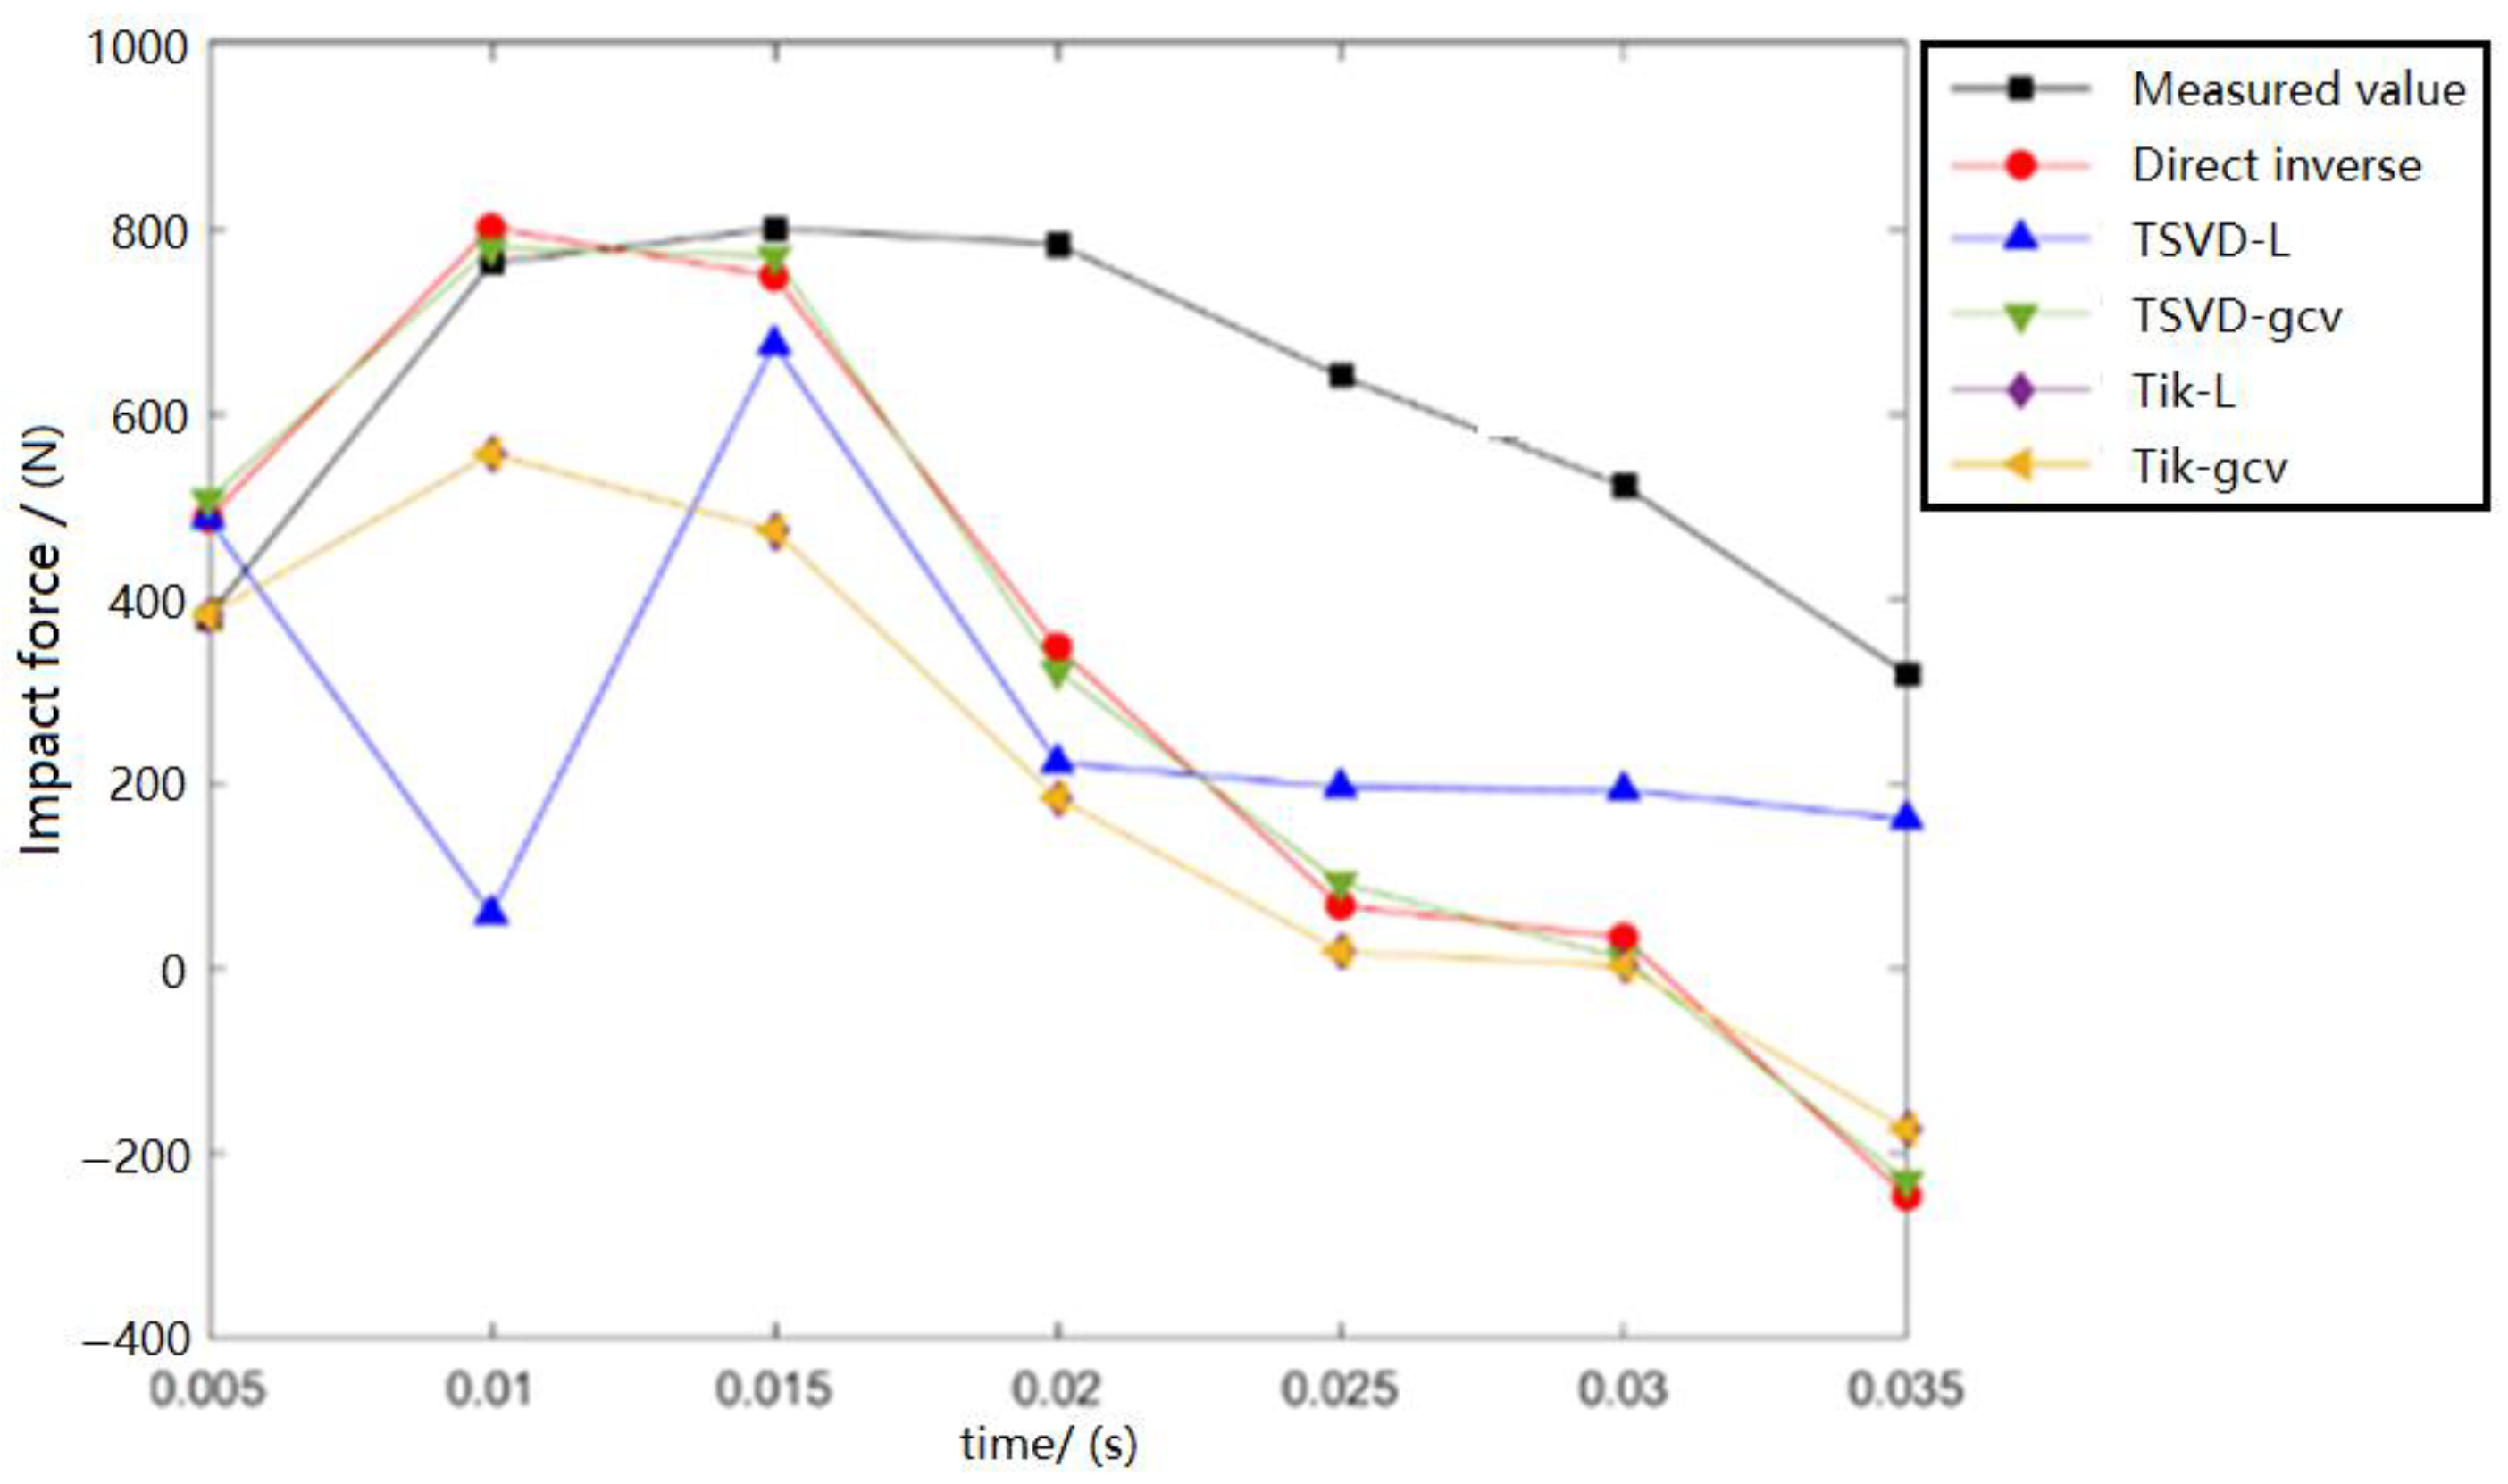
The inversion methods included the direct inverse, TSVD-L, TSVD-GCV, Tik-L, and Tik-GCV method, as shown above. The results of the above methods are compared with the measured values in Figure 13, Figure 14, Figure 15 and Figure 16.
Using the impact force measured by the force mapping sensor as the reference value, the peak errors of the inversion results under different methods were calculated, as listed in Table 2. Overall, the Tikhonov method showed the highest accuracy with an average error of approximately 21%. More than 70% of the inversion results were guaranteed to be within 30%, with only one case of error exceeding 50%. The direct inversion method was the second most accurate, with an average inversion error of approximately 26%, which is slightly higher than that of the Tikhonov method. The TSVD method showed the largest error compared with the first two methods. Furthermore, the L-curve determination criterion was generally better than the GCV determination criterion in the selection of regularization parameters.
Based on the Tik-L method, a comparative verification analysis of load inversion under different numbers of strain sensors was carried out separately, and the results are listed in Table 3. As the number of sensors increased, the prediction accuracy increased, and the average error could be controlled within 10% when the number of sensors reached four.
In summary, the Tikhonov regularization method with the L-curve determination criterion based on the four sensors shows a high inversion accuracy of the impact load at the determined position.

5. Conclusions

In this study, the characteristics of both the impact load and the spatial and temporal distribution of the strain response were investigated through the impact load model test. The solution accuracy of different inversion methods and different numbers of sensors needed were compared. The main conclusions are as follows:
  • The impact load value is related to the impact speed and weight of the impact wheel, and the impact load is positively correlated to the weight and vertical impact speed of the wheel.
  • The structural strain response shows an obvious triangular distribution in the time history. In space, the structural dynamic response quickly extends around the impact position, and the strain wave strength steadily decreases as the spreading distance increases. When the strain wave spreads to a certain range (approximately one strong frame spacing), the strain response decays to the structural vibration response.
  • Compared with the other inversion methods used in this study, the Tik-L method shows the highest accuracy, and the accuracy of the results is proportional to the number of strain sensors. When the number of strain sensors reaches four or more, the Tik-L method can reach a high accuracy within 10%, which meets the requirements of engineering applications.

Author Contributions

Conceptualization, F.W.; formal analysis, F.W.; investigation, K.Z.; validation, B.C.; writing—original draft, K.Z.; writing—review and editing, F.W., K.L., D.T. and Y.P. All authors have read and agreed to the published version of the manuscript.

Funding

This research received no external funding.

Informed Consent Statement

Not applicable.

Data Availability Statement

Not applicable.

Conflicts of Interest

The authors declare no conflict of interest.

References

  1. Yang, Z.C.; Jia, Y. Dynamic load identification method. Adv. Mech. 2015, 45, 29–54. [Google Scholar]
  2. Sanchez, J.; Benaroya, H. Review of force reconstruction techniques. J. Sound Vib. 2014, 333, 2999–3018. [Google Scholar] [CrossRef]
  3. Candes, E.J.; Romberg, J.; Tao, T. Rubust uncertainty principles: Exact signal reconstruction from highly incomplete frequency information. IEEE Trans. Inf. Theory 2006, 52, 489–509. [Google Scholar] [CrossRef] [Green Version]
  4. Tikhonov, A.N.; Arsenin, V.Y. Solutions of Ill-Posed Problems; Winston & Sons: Washington, DC, USA, 1977. [Google Scholar]
  5. Hansen, P.C. Truncated SVD solutions to discrete ill-posed problems with ill-determined numerical rank. SIAM J. Sci. Comput. 1990, 11, 503–518. [Google Scholar] [CrossRef]
  6. Jacquelin, E.; Bennani, A.; Hamelin, P. Force reconstruction: Analysis and regularization of a deconvolution problem. J. Sound Vib. 2003, 265, 81–107. [Google Scholar] [CrossRef]
  7. Morozov, V.A. Methods for Solving Incorrectly Posed Problems; Springer: New York, NY, USA, 1984. [Google Scholar]
  8. Bonesky, T. Morozov’s discrepancy principle and Tikhonov type functionals. Inverse Probl. 2009, 25, 015015. [Google Scholar] [CrossRef]
  9. Hansen, P.C. Analysis of discrete ill-posed problems by means of the L-curve. SIAM Rev. 1992, 34, 561–580. [Google Scholar] [CrossRef]
  10. Kindermann, S.; Neubauer, A. On the convergence of the quasi-optimality criterion for (iterated) Tikhonov regularization. Inverse Probl. Imaging 2008, 2, 291–299. [Google Scholar] [CrossRef]
  11. Golub, G.H.; Heath, M.; Wahba, G. Generalized cross-validation as a method for choosing a good ridge parameter. Technometrics 1979, 21, 215–223. [Google Scholar] [CrossRef]
  12. Wahba, G. Spline models for observational data. In Proceedings of the Cbms-Nsf Regional Conference Series in Applied Mathematics, Based on A Series of 10 Lectures at Ohio State University at Columbus, Columbus, OH, USA, 23–27 March 1987; pp. 113–114. [Google Scholar]
  13. Lawson, C.L.; Hanson, R.J. Solving Least Squares Problems; Prentice-Hall: Hoboken, NJ, USA, 1974. [Google Scholar]
  14. Hansen, P.C.; O’Leary, D.P. The use of the L-curve in the regularization of discrete ill-posed problems. SIAM J. Sci. Comput. 2006, 14, 1487–1503. [Google Scholar] [CrossRef]
  15. Lourens, E.; Reynders, E.; Roeck, G.D.; Degrande, G.; Lombaert, G. An augmented Kalman filter for force identification in structural dynamics. Mech. Syst. Signal Process. 2012, 27, 446–460. [Google Scholar] [CrossRef]
  16. Hansen, P.C.; Jensen, T.K.; Rodriguez, G. An adaptive pruning algorithm for the discrete L-curve criterion. J. Comput. Appl. Math. 2007, 198, 483–492. [Google Scholar] [CrossRef]
  17. Liu, J. Research on Computational Inverse Technique for Dynamic Load Identification. Ph.D. Thesis, Hunan University, Changsha, China, 2011. [Google Scholar]
  18. Liu, C.-K.; Ding, X.-H.; Ni, W.-Y.; Li, G.-Y. Inversion technique of external load of mechanical structure with multi-information fusion of simulation and real measurement. China Mech. Eng. 2022, 33, 639–646. [Google Scholar]
  19. Nan, M.-Y.; Hu, J.-J.; Wang, X.-L.; Yakimov, V. A study of ice load inversion based on long and short-term memory networks. J. Ship Mech. 2021, 25, 1675–1684. [Google Scholar]
  20. Kong, S.; Cui, H.-Y.; Ji, S.-Y. Study on real ship measurement and inversion method of sea ice load on ship structure. Vib. Shock. 2020, 39, 8–16. [Google Scholar]
  21. De Waal, R.; Bekker, A.; Heyns, P. Indirect load case estimation for propeller-ice moments from shaft line torque measurements. Cold Reg. Sci. Technol. 2018, 151, 237–248. [Google Scholar] [CrossRef] [Green Version]
  22. De Koker, N.; Bekker, A. Assessment of ice impact load threshold exceedance in the propulsion shaft of an ice-faring vessel via Bayesian inversion. Struct. Health Monit. 2022, 21, 757–769. [Google Scholar] [CrossRef]
  23. Ikonen, T.; Peltokorpi, O.; Karhunen, J. Inverse ice-induced moment determination on the propeller of an ice-going vessel. Cold Reg. Sci. Technol. 2015, 112, 1–13. [Google Scholar] [CrossRef]
  24. Jin, X.; Yin, J.-Z.; Wang, J.-Z. Research on flight load testing and inversion method based on deep learning. Adv. Aeronaut. Eng. 2020, 11, 887–893. [Google Scholar]
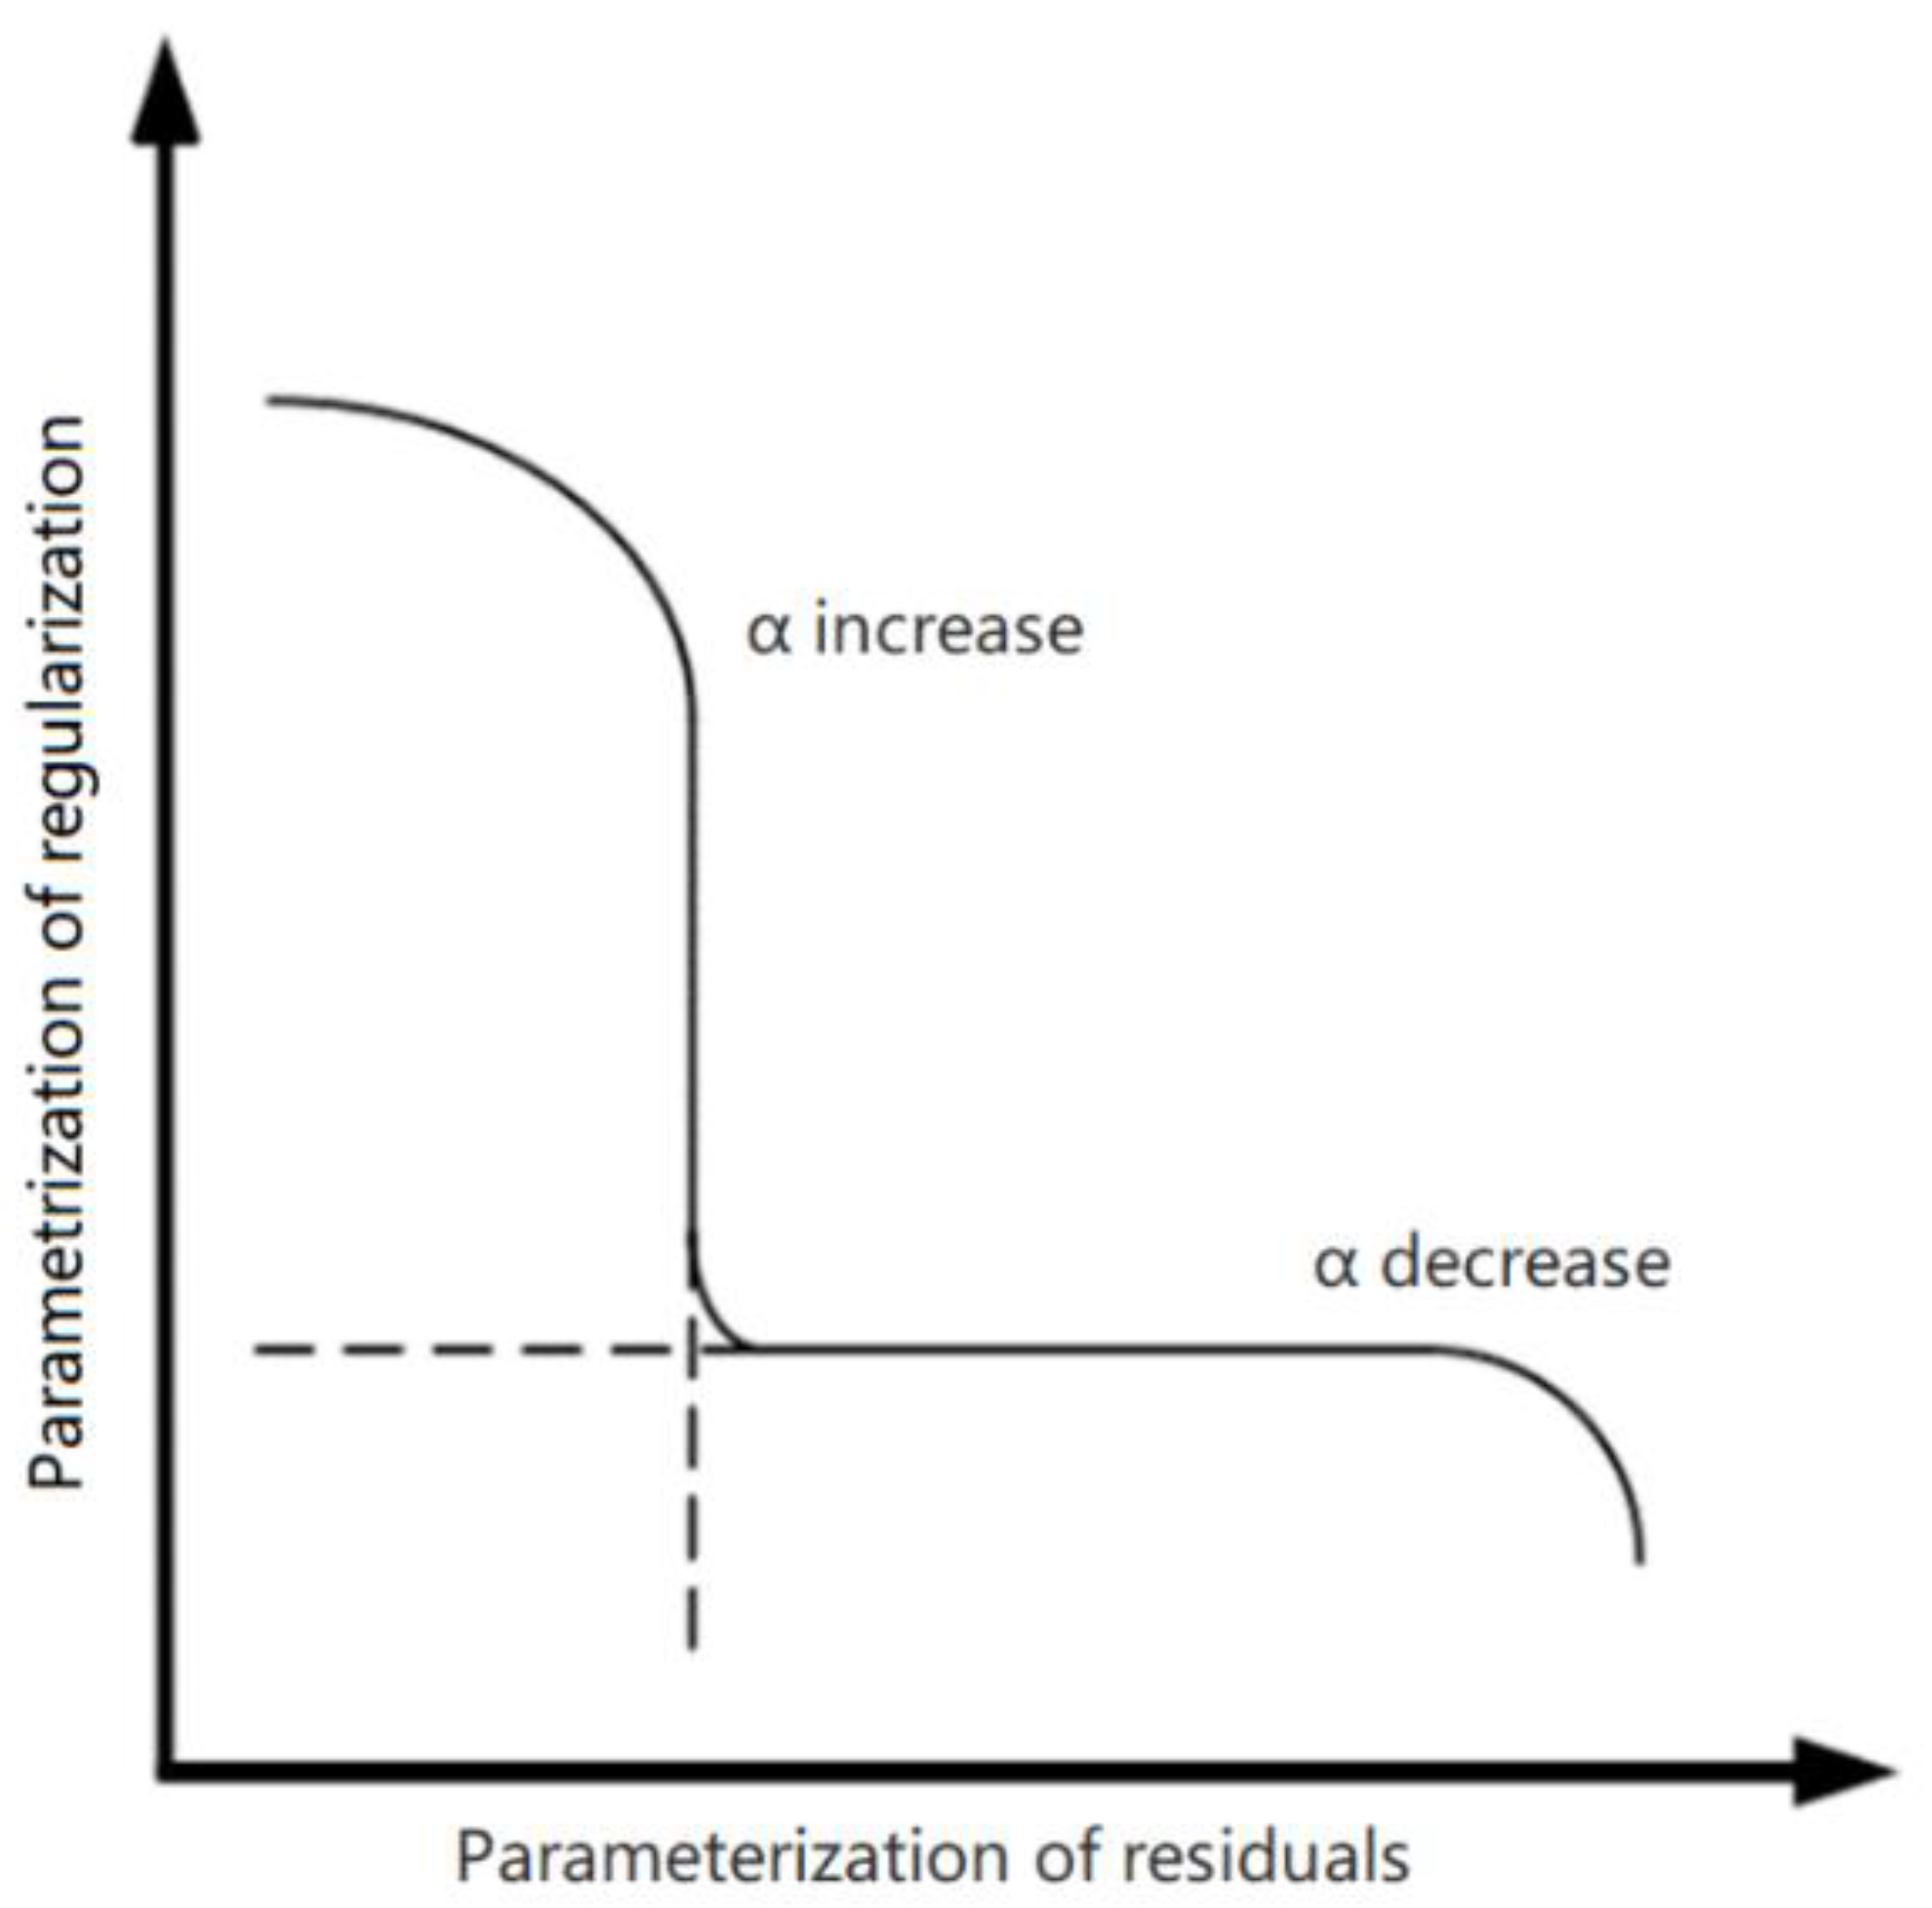
Figure 1. L-curve chart.
Metals 12 01279 g001
Figure 2. A 3D solid model of the test grillage.
Metals 12 01279 g002
Figure 3. Pictures of test grillage.
Metals 12 01279 g003
Figure 4. Force mapping sensor.
Metals 12 01279 g004
Figure 5. Photoelectric speed sensor.
Metals 12 01279 g005
Figure 6. Layout of strain measuring points. (a) Auxiliary bone points (b) Strong beam points.
Metals 12 01279 g006
Figure 7. A test bench set upon the test grillage for the impact load test.
Metals 12 01279 g007
Figure 8. Peak values of impact force with 6 repeated experiments under 5 conditions.
Metals 12 01279 g008
Figure 9. Strain responses at measurement point 2 with 6 repeated experiments under Condition 1.
Metals 12 01279 g009
Figure 10. Strain responses at measurement point 4 with 6 repeated experiments under Condition 1.
Metals 12 01279 g010
Figure 11. The structural responses recorded by strain gauges under Condition 1: (a) spatial distribution; (b) temporal distribution.
Metals 12 01279 g011
Figure 12. Load inversion procedure.
Metals 12 01279 g012
Figure 13. Comparison of the measured impact force with the value obtained by the direct inverse, TSVD-L, TSVD-GCV, Tik-L, and Tik-GCV methods with point S8 under Condition 1.
Metals 12 01279 g013
Figure 14. Comparison of the measured impact force with the value obtained by the direct inverse, TSVD-L, TSVD-GCV, Tik-L, and Tik-GCV methods with point S9 under Condition 1.
Metals 12 01279 g014
Figure 15. Comparison of the measured impact force with the value obtained by the direct inverse, TSVD-L, TSVD-GCV, Tik-L, and Tik-GCV methods with point S10 under Condition 1.
Metals 12 01279 g015
Figure 16. Comparison of the measured impact force with the value obtained by the direct inverse, TSVD-L, TSVD-GCV, Tik-L, and Tik-GCV methods with point S11 under Condition 1.
Metals 12 01279 g016
Table 1. Fixed point impact test conditions.
Work Condition NumberLanding PositionWeightVertical Speed
Condition 1V46.27 kg3.30 m/s
Condition 2V69.19 kg3.30 m/s
Condition 3V612.11 kg1.87 m/s
Condition 4V612.11 kg2.68 m/s
Condition 5V612.11 kg3.30 m/s
Table 2. Calculation errors of different inverse methods compared with the practical value.
Inversion MethodDirect InverseTSVD-LTSVD-GCVTik-LTik-gcv
Total number of times20 times20 times20 times20 times20 times
Average error26.60%29.77%35.86%20.99%21.82%
Error < 10%6 times5 times5 times5 times5 times
10% < Error < 30%6 times7 times4 times9 times9 times
30% < Error < 50%5 times5 times7 times5 times5 times
Error < 50%3 times3 times4 times1 time1 time
Table 3. Statistics of inversion results under different numbers of sensors.
Inversion MethodSingle SensorTwo SensorsThree SensorsFour Sensors
Average error of extreme value20.99%18.06%14.93%9.41%
Maximum error of extreme value51.27%42.65%37.64%26.24%
Publisher’s Note: MDPI stays neutral with regard to jurisdictional claims in published maps and institutional affiliations.