Article

Development of Recycled Expanded Polystyrene Nanofibers Modified by Chitosan for the Removal of Lead(II) from Water

by
Thiago R. Martins
1,
Patrick S. Costa
1,
Daniel A. Bertuol
1,
Mônica L. Aguiar
2 and
Eduardo H. Tanabe
1,*
1
Environmental Processes Laboratory (LAPAM), Chemical Engineering Department, Federal University of Santa Maria—UFSM, Santa Maria 97105-900, RS, Brazil
2
Department of Chemical Engineering, Federal University of São Carlos—UFSCar, São Carlos 13565-905, SP, Brazil
*
Author to whom correspondence should be addressed.
Metals 2022, 12(8), 1334; https://doi.org/10.3390/met12081334
Submission received: 1 July 2022 / Revised: 2 August 2022 / Accepted: 4 August 2022 / Published: 10 August 2022
(This article belongs to the Section Extractive Metallurgy)

Abstract

:
Water contamination by potentially toxic metals and the generation of polymeric wastes are major world concerns. Therefore, novel recycled expanded polystyrene nanofibers modified by chitosan were successfully developed by centrifugal spinning and applied as adsorbents on the removal of lead(II) from water. Expanded polystyrene was obtained from waste food packaging. Characterization of the nanofibers presented diameters of 806 nm and functional groups suitable for the adsorption of lead(II). Under the experimental conditions used, lead(II) adsorption was favored at pH 6, at a temperature of 303 K, presenting an adsorption capacity of 28.86 mg g−1 and a removal percentage of 61.19%. The pseudo-second-order model was the most suitable to describe the kinetic data. The equilibrium data could be fitted by the Aranovich–Donohue model. The maximum adsorption capacity under the experimental conditions used was 137.35 mg g−1. The thermodynamics parameters presented the adsorption as spontaneous, favorable, and endothermic. After four cycles of desorption and reuse, the nanofibers maintained 63.04% of their original adsorption capacity. The findings indicated that these recycled modified nanofibers present great potential as lead(II)- (as well as other similar metals) adsorbent, with significant environmental relevance due to the recycling of a waste polymer into a notable toxic metal adsorbent.

1. Introduction

Water resource contamination is a major world concern. Industrial discharge contains various organic and inorganic contaminants, including potentially toxic metals (previously known as heavy metals) [1,2]. Lead (Pb), one of these metals, may cause severe impacts on the environment and human health when inadequately disposed in water, posing a serious threat to most living beings [3,4,5]. Thus, methods to effectively treat and remove this pollutant from water are necessary [6].
Some of the main techniques employed to remove Pb from water include widely known hydrometallurgical operations such as chemical precipitation, ion exchange, and adsorption [2]. Among these, adsorption is an attractive technique because of its high efficiency, low cost, simple operation, and versatility [7]. Carbon-based materials, mainly activated carbon, are among the most used adsorbents due to properties such as high surface area and abundant pore structure [7]. However, the search for alternative adsorbents that present higher adsorption capacity, lower cost of production, or greater potential for large-scale production is recurring in the literature [8]. As an essential part of the nanohydrometallurgy, polymer nanofibers stand out in these contexts [9].
Generally, polymer nanofibers are most commonly produced by the electrospinning method. In this technique, a jet of polymer solution (obtained from the dissolution of a polymer into a solvent) is thrown through an electric field after reaching a critical voltage. During the electric-charged jet trajectory, the solvent is rapidly evaporated, forming the nanofibers [10].
Over the last decade, an alternative method named centrifugal spinning has attracted more attention from the literature [11,12]. In this technique, centrifugal forces are used instead of the electric field forces from the electrospinning. Syringes loaded with polymer solution are rotated at high speed, generating polymer solution jets [13,14]. The solvent in the jets is evaporated, resulting in the nanofibers [11,13]. This technique presents great potential for high-scale production, flexibility, and cost-effective production of a wide variety of polymeric materials, all of which are desirable characteristics of adsorbents [12,14].
Polyacrylonitrile (PAN) is one of the most used polymers in nanofiber production due to its relatively high stability and mechanical properties [15]. However, the use of recycled polymers has been increasingly discussed in the literature, with examples such as polystyrene (PS) and polyethylene terephthalate (PET) [16,17,18,19]. Thus, the disposal of polymers in the environment is avoided (another major concern in modern society), besides value is added to a product that otherwise would be a waste. This is valid, especially for PS, whose recycling is challenging and costly, worldwide, and nationally [17,20]. Consequently, the reuse of waste PS into nanofibers is of great value.
In addition to that, when the purpose of the nanofibers is adsorption, as previously stated, it is possible to functionalize the material, modifying it so that the affinity between adsorbent and adsorbate is increased, enhancing the removal of contaminants from water [8]. In regard to Pb removal, some examples of functionalizing agents include metallic oxides, silicon oxide, and biopolymers such as chitosan [21,22,23].
Chitosan is a polysaccharide resulting from the deacetylation of chitin, which is obtained from insects and crustaceans. Therefore, it presents abundance and a relatively low cost of obtention [24]. Since chitosan contains in its structure functional groups such as amine (-NH2) and hydroxyl (-OH), that strongly interact with metal ions, it is extensively applied in the adsorption of these contaminants [8,23].
The use of chitosan as a functionalizing agent on different polymer nanofibers for the removal of potentially toxic metals (including Pb) is recurring in the literature [23]. Phan et al. developed a cellulose nanofiber modified with chitosan for the removal of Pb from water, attaining an adsorption capacity of 57.3 mg g−1 [25]. Fan et al. developed PVA nanofibers modified with β-cyclodextrin and chitosan, which resulted in an adsorption capacity of 82.54 mg g−1 [26]. Additionally, Liu et al. developed chitosan nanofibers, achieving an adsorption capacity of 118 mg g−1 [27].
Although the use of chitosan-modified nanofibers is recurring in the adsorption of Pb and metals in general, the development and application of chitosan-modified nanofibers from recycled polymers is still novel for this purpose and presents great potential [8]. This way, the disposal of polymer wastes is reduced and the removal of hazardous material from the environment is accomplished. To the best of our knowledge, no work has been previously performed on recycled EPS nanofibers towards metal adsorption.
Therefore, this work aims to develop recycled expanded polystyrene (EPS) nanofibers functionalized with chitosan for the removal of Pb from aqueous solutions. The nanofibers were produced by centrifugal spinning and characterized by scanning electron microscopy (SEM), Fourier-transform infrared spectroscopy (FT-IR), and thermogravimetric analysis (TGA). The developed nanofibers were evaluated in studies of pH, kinetics, equilibrium, and thermodynamics, in addition to adsorption-desorption steps to verify the reuse potential of the nanofibers.

2. Materials and Methods

2.1. Materials

In this study, EPS waste was obtained from food packaging. The packages used were of the same brand to ensure standardization of nanofibers preparation. Chitosan powder was purchased from Sigma-Aldrich (deacetylation degree ≥ 75%, St. Louis, MO, USA). N,N-dimethylacetamide (DMAc) was purchased from Dinâmica (analytical grade, São Paulo, Brazil). Acetic acid was purchased from Dinâmica (analytical grade, São Paulo, Brazil). Lead nitrate (Pb(NO3)2) (analytical grade, Vetec, Duque de Caxias, Brazil) was dissolved in deionized water to obtain an aqueous solution containing lead(II) (Pb(II)) ions. The Pb(II) solution was synthetic and contained only this metal ion to investigate its interaction with the nanofibers without interference of other metals. NaOH was purchased from Synth (99%, Diadema, Brazil), whereas HNO3 was purchased from Synth (65%, Diadema, Brazil).

2.2. Preparation of EPS/CS Nanofibers

Initially, EPS waste food packages were collected, washed, dried, and cut into pieces of approximately 1 cm × 1 cm. The EPS samples were dissolved in DMAc to obtain a homogeneous solution of polymer concentration of 18 wt.% [17]. The resulting solution was stirred for 6 h at 333 K [28].
The EPS nanofibers were produced by centrifugal spinning in Forcespinning® equipment (L1000, FibeRio, McAllen, TX, USA), as shown in Figure 1. The spinneret was filled with 2 mL of the polymer solution, with 30-gauge ½” needles connected within every end. The rotational speed was set at 10,000 rpm, according to preliminary assays and previous studies [14,29]. The equipment was operated for 3 min per batch at room temperature. Sixteen collectors were placed around the spinneret to collect the nanofibers.
After the centrifugal spinning step, the EPS nanofibers were immersed during 10 min into chitosan (CS) solutions. The chitosan concentration of these solutions varied between 0.5–2.0 wt.% and was obtained by dissolving the desired amount of chitosan into an acetic acid solution (0.5% v/v). After immersion, EPS/CS nanofibers were vacuumed for 15 min, kept still for 1 h, and vacuumed again for 3 min [30].

2.3. Characterization of EPS/CS Nanofibers

The morphological characteristics of the EPS/CS nanofibers were observed by scanning electron microscopy (SEM), using an acceleration voltage of 5 kV (Tescan, VEGA–3G, Brno, Czech Republic). SEM micrographs were used to determine the mean diameter of the EPS/CS nanofibers using ImageJ software (NIH, Montgomery County, MD, USA).
Thermogravimetric analysis (TGA-50, Shimadzu, Kyoto, Japan) was performed on the nanofibers, with 5 mg of the nanofiber samples sealed in a platinum crucible. These samples were heated up to 1073 K, with scan rate of 10 K min−1 and nitrogen flow rate of 50 mL min−1.
The functional groups of the nanofibers were identified by Fourier transform infrared spectroscopy (FTIR) (Prestige, 21210045, Shimadzu, Kyoto, Japan) and operated in the range of 500–4000 cm−1.

2.4. Batch Adsorption Experiments

The adsorption assays were performed in batch mode on a thermostated shaker (SL-222, Solab, Piracicaba, Brazil) using 50 mL of Pb(II) solution and 50 mg of EPS/CS nanofibers. Firstly, the influence of chitosan content in the solution used during the production of nanofibers was evaluated from 0.5% to 2.0%. In this step, the solution was stirred for 4 h at 303 K, with initial Pb(II) concentration of 50 mg L−1 and pH 5, following previous literature [28]. The nanofibers with the best results were selected for the subsequent experiments.
Secondly, pH effect on the adsorption was investigated from 2 to 6. The pH was adjusted with HNO3 0.01 M and NaOH 0.01 M, and the experiments were performed for 4 h, at 303 K, with initial Pb(II) concentration of 50 mg L−1 [31]. Then, in the best pH for Pb(II) adsorption, kinetic curves were obtained, with stirring time from 0 to 240 min at 303 K, with initial Pb(II) concentration of 50 mg L−1 and pH 6. Finally, equilibrium curves were constructed at different temperatures (303, 313, 323, and 333 K), with initial Pb(II) concentration ranging from 25 mg L−1 to 500 mg L−1 and pH 6. The experiments were performed in triplicate to ensure data reproducibility.
After each experiment, the samples were filtered and the remaining Pb(II) concentration was determined by flame atomic absorption spectrometry (Model 240 FS AA, Agilent, Santa Clara, CA, USA). Each value was reported as the average of three readings.
The Pb(II) removal percentage (R%) and the adsorption capacity (qe) were calculated by Equations (1) and (2), respectively:
R% = (C0 − Ce)/C0 × 100
qe = (C0 − Ce)/m × V
where C0 is the initial concentration of Pb(II) in the aqueous solution (mg L−1), Ce is the concentration of Pb(II) at equilibrium (mg L−1), m is the mass of adsorbent (g), and V is the volume of the solution (L).

2.5. Kinetic Models

The adsorption kinetics of Pb(II) on the EPS/CS nanofibers was investigated by the pseudo-first-order (PFO) and pseudo-second-order (PSO) models (Equations (3) and (4), respectively) [32,33]:
qt = q1(1 − exp (−k1 t))
qt = t/(1/(k2 q22) + (t/q2))
where k1 (min−1) and k2 (g mg−1 min−1) are the PFO and PSO rate constants, respectively, and q1 and q2 (mg g−1) are the PFO and PSO theoretical adsorption capacities, respectively.

2.6. Equilibrium and Thermodynamic Analysis

The equilibrium curves for the adsorption of Pb(II) on the EPS/CS nanofibers were fitted using Freundlich, BET, and Aranovich–Donohue models (Equations (5)–(7), respectively) [34,35,36]:
qe = KF Ce1/nF
qe = (qBET KBET1 Ce)/((1 − KBET2 Ce) × (1 − KBET2 Ce + KBET1 Ce))
qe = (qAD KL-AD Ce)/((1 + KL Ce) × (1 − KAD Ce)n)
where KF is the Freundlich constant ((mg g−1) (mg L−1)−1/nF), 1/nF is the heterogeneity factor, qBET is the monolayer adsorption capacity (mg g−1), KBET1 and KBET2 are the BET constants (L mg−1), qAD is the monolayer adsorption capacity (mg g−1), KL-AD and KAD are the Aranovich–Donohue constants (L mg−1), and n is the Aranovich–Donohue coefficient. The Aranovich–Donohue model employed in the isotherms was the Langmuir variant [37].
The thermodynamic parameters for the adsorption of Pb(II) were evaluated according to the changes in the Gibbs free energy (ΔG0, kJ mol−1), the enthalpy (ΔH0, kJ mol−1), and the entropy (ΔS0, kJ mol−1 K−1), described by Equations (8)–(10), respectively [38]:
ΔG0 = −R T ln(ρKe)
ΔG0 = ΔH0 − TΔS0
ln(ρKe) = ΔS0/R − ΔH0/RT
where Ke is the equilibrium constant (L g−1) based on the parameters of the isotherm model that provided the best fit, T is the temperature (K), R is 8.31 × 10⁻³ kJ mol−1 K−1, and ρ is the density of the solution (g L−1).

2.7. Parameters Estimation

The kinetic, equilibrium, and thermodynamic parameters were estimated by nonlinear regression using the original form of the models. The estimation was performed on Statistica 9.1 software (Statsoft, Tulsa, OK, USA), by minimization of the least squares function using the Quasi-Newton method. The fit quality obtained on the regression was measured by means of the determination coefficient (R2) and average relative error (ARE).

2.8. Adsorption and Desorption Cycles: Reuse Experiments

The reuse potential of the EPS/CS nanofibers was evaluated by consecutive tests of adsorption-desorption. In the desorption assays, 50 mg of Pb(II)-loaded nanofibers were mixed with 100 mL of NaOH 1.0 M and stirred for 240 min at 303 K, followed by washing with deionized water [29]. This procedure was repeated for four cycles.

3. Results and Discussion

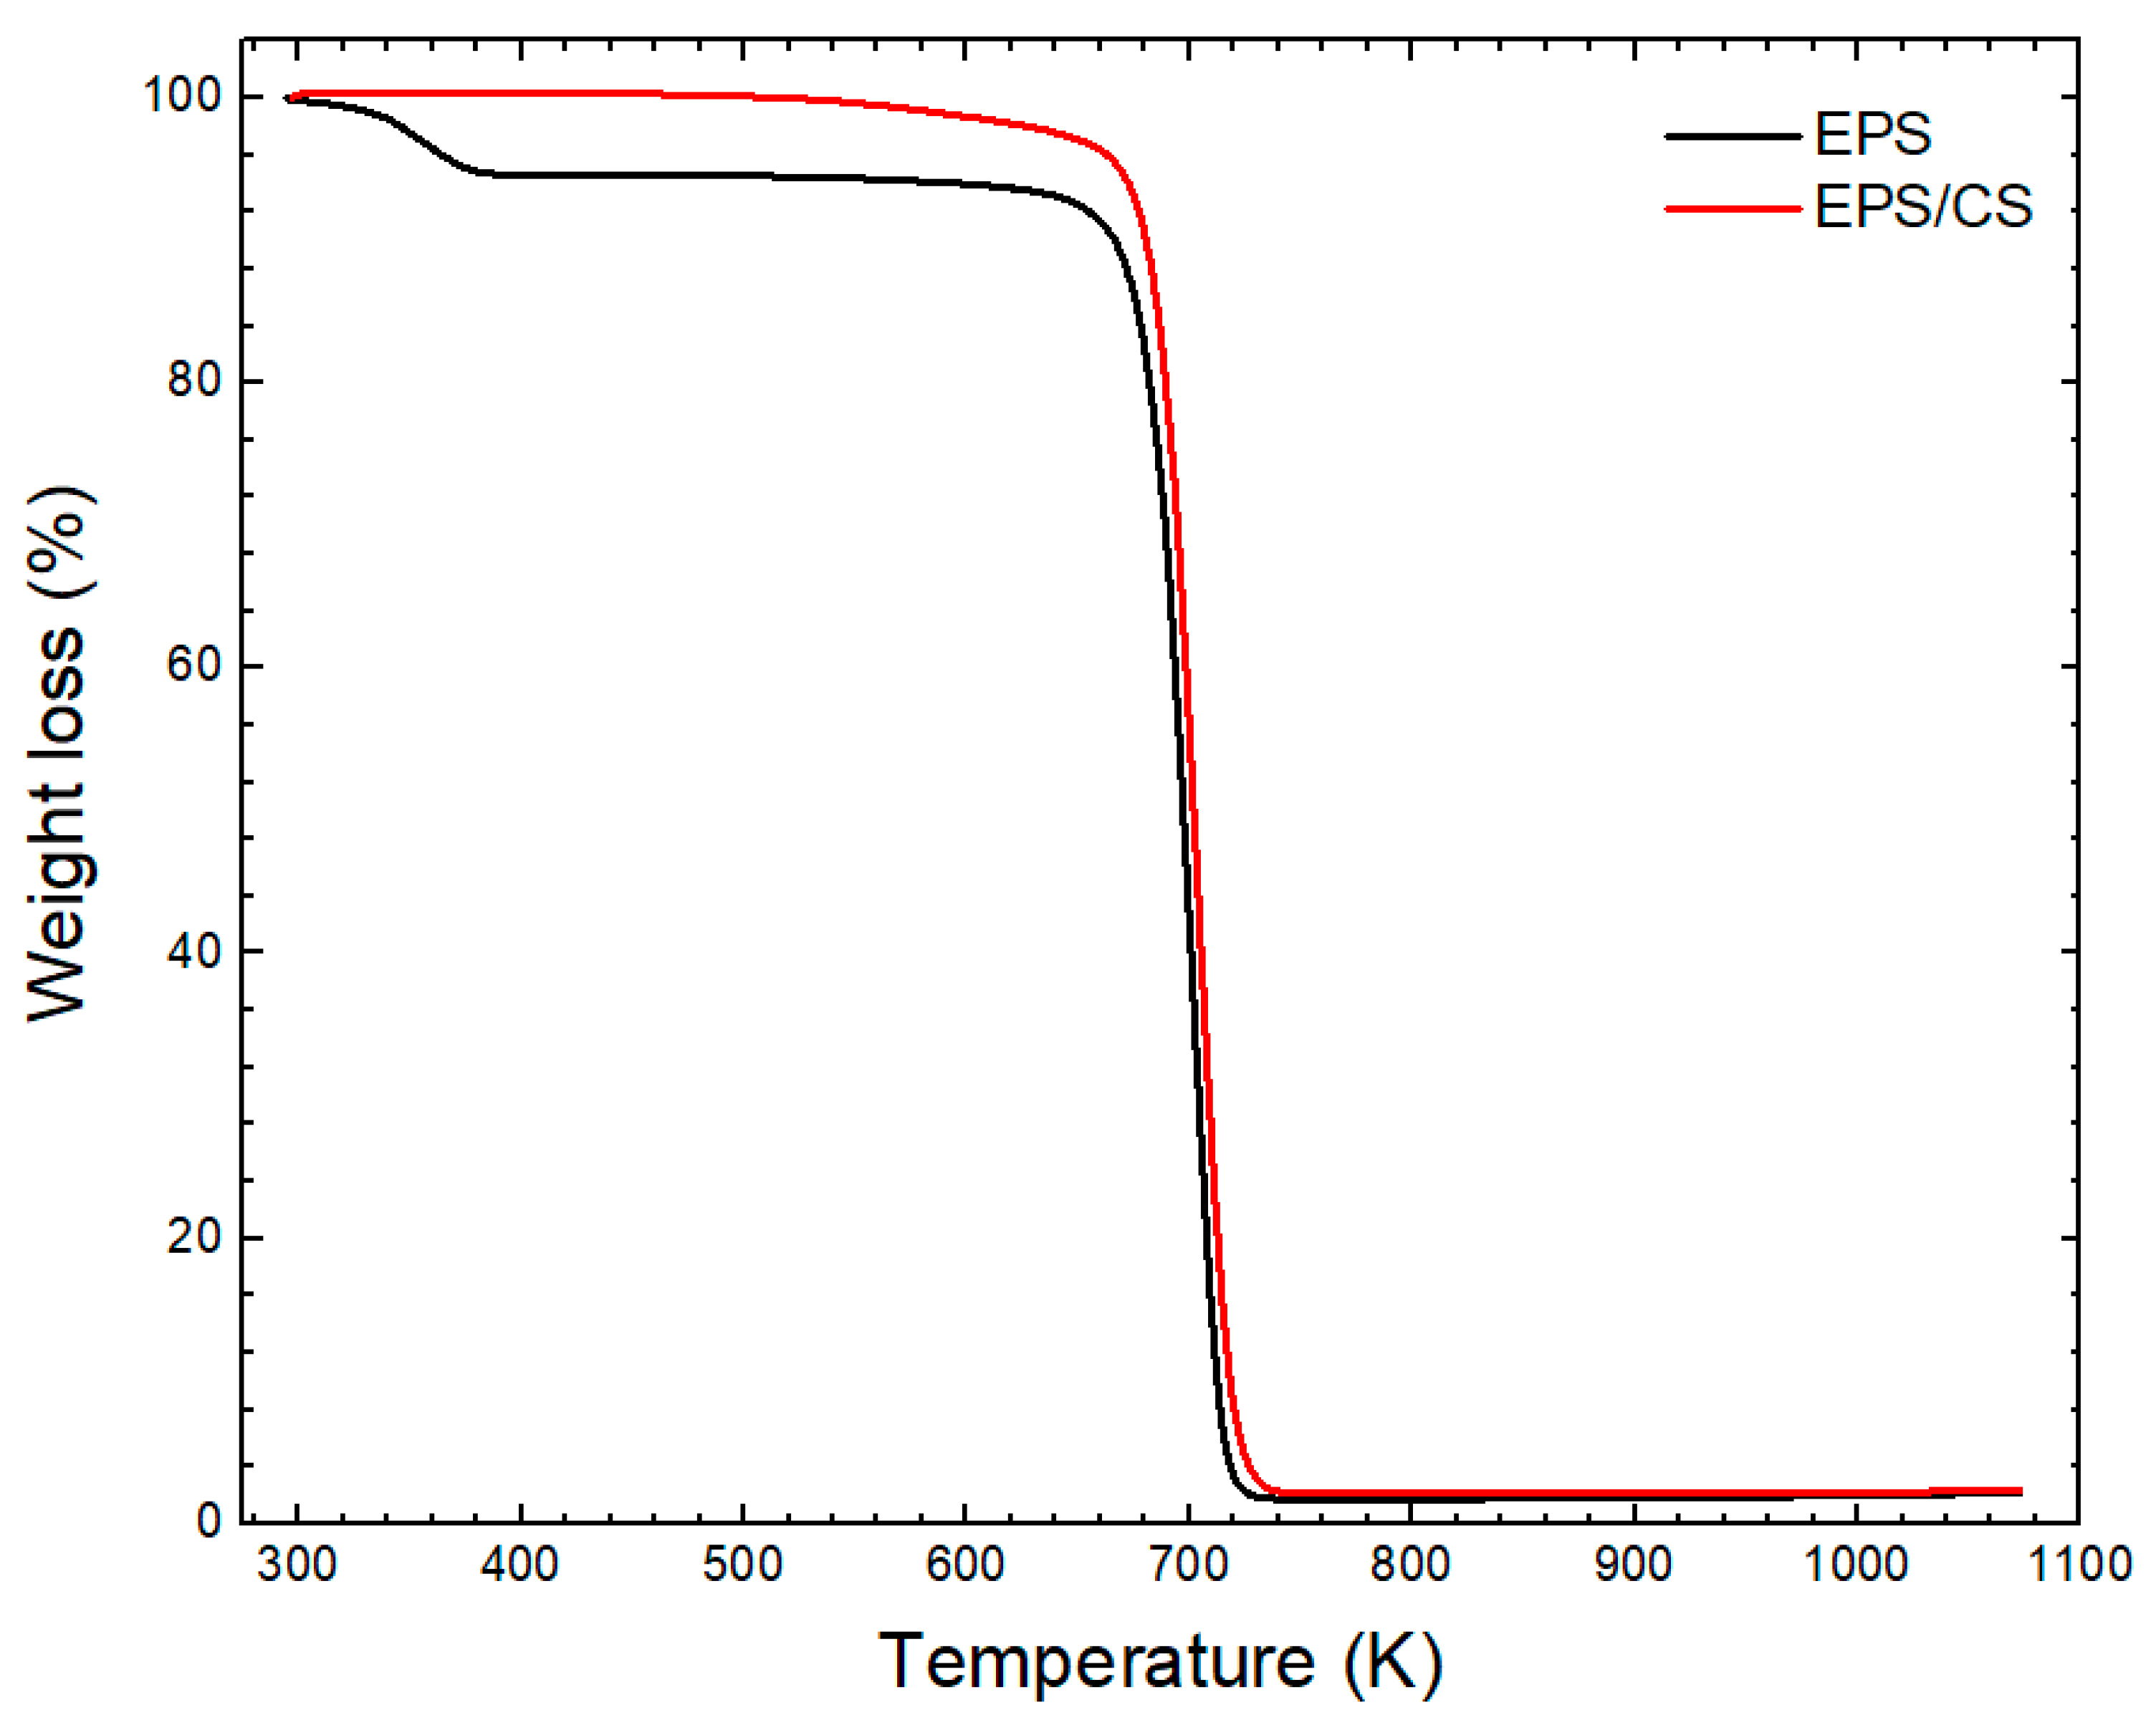
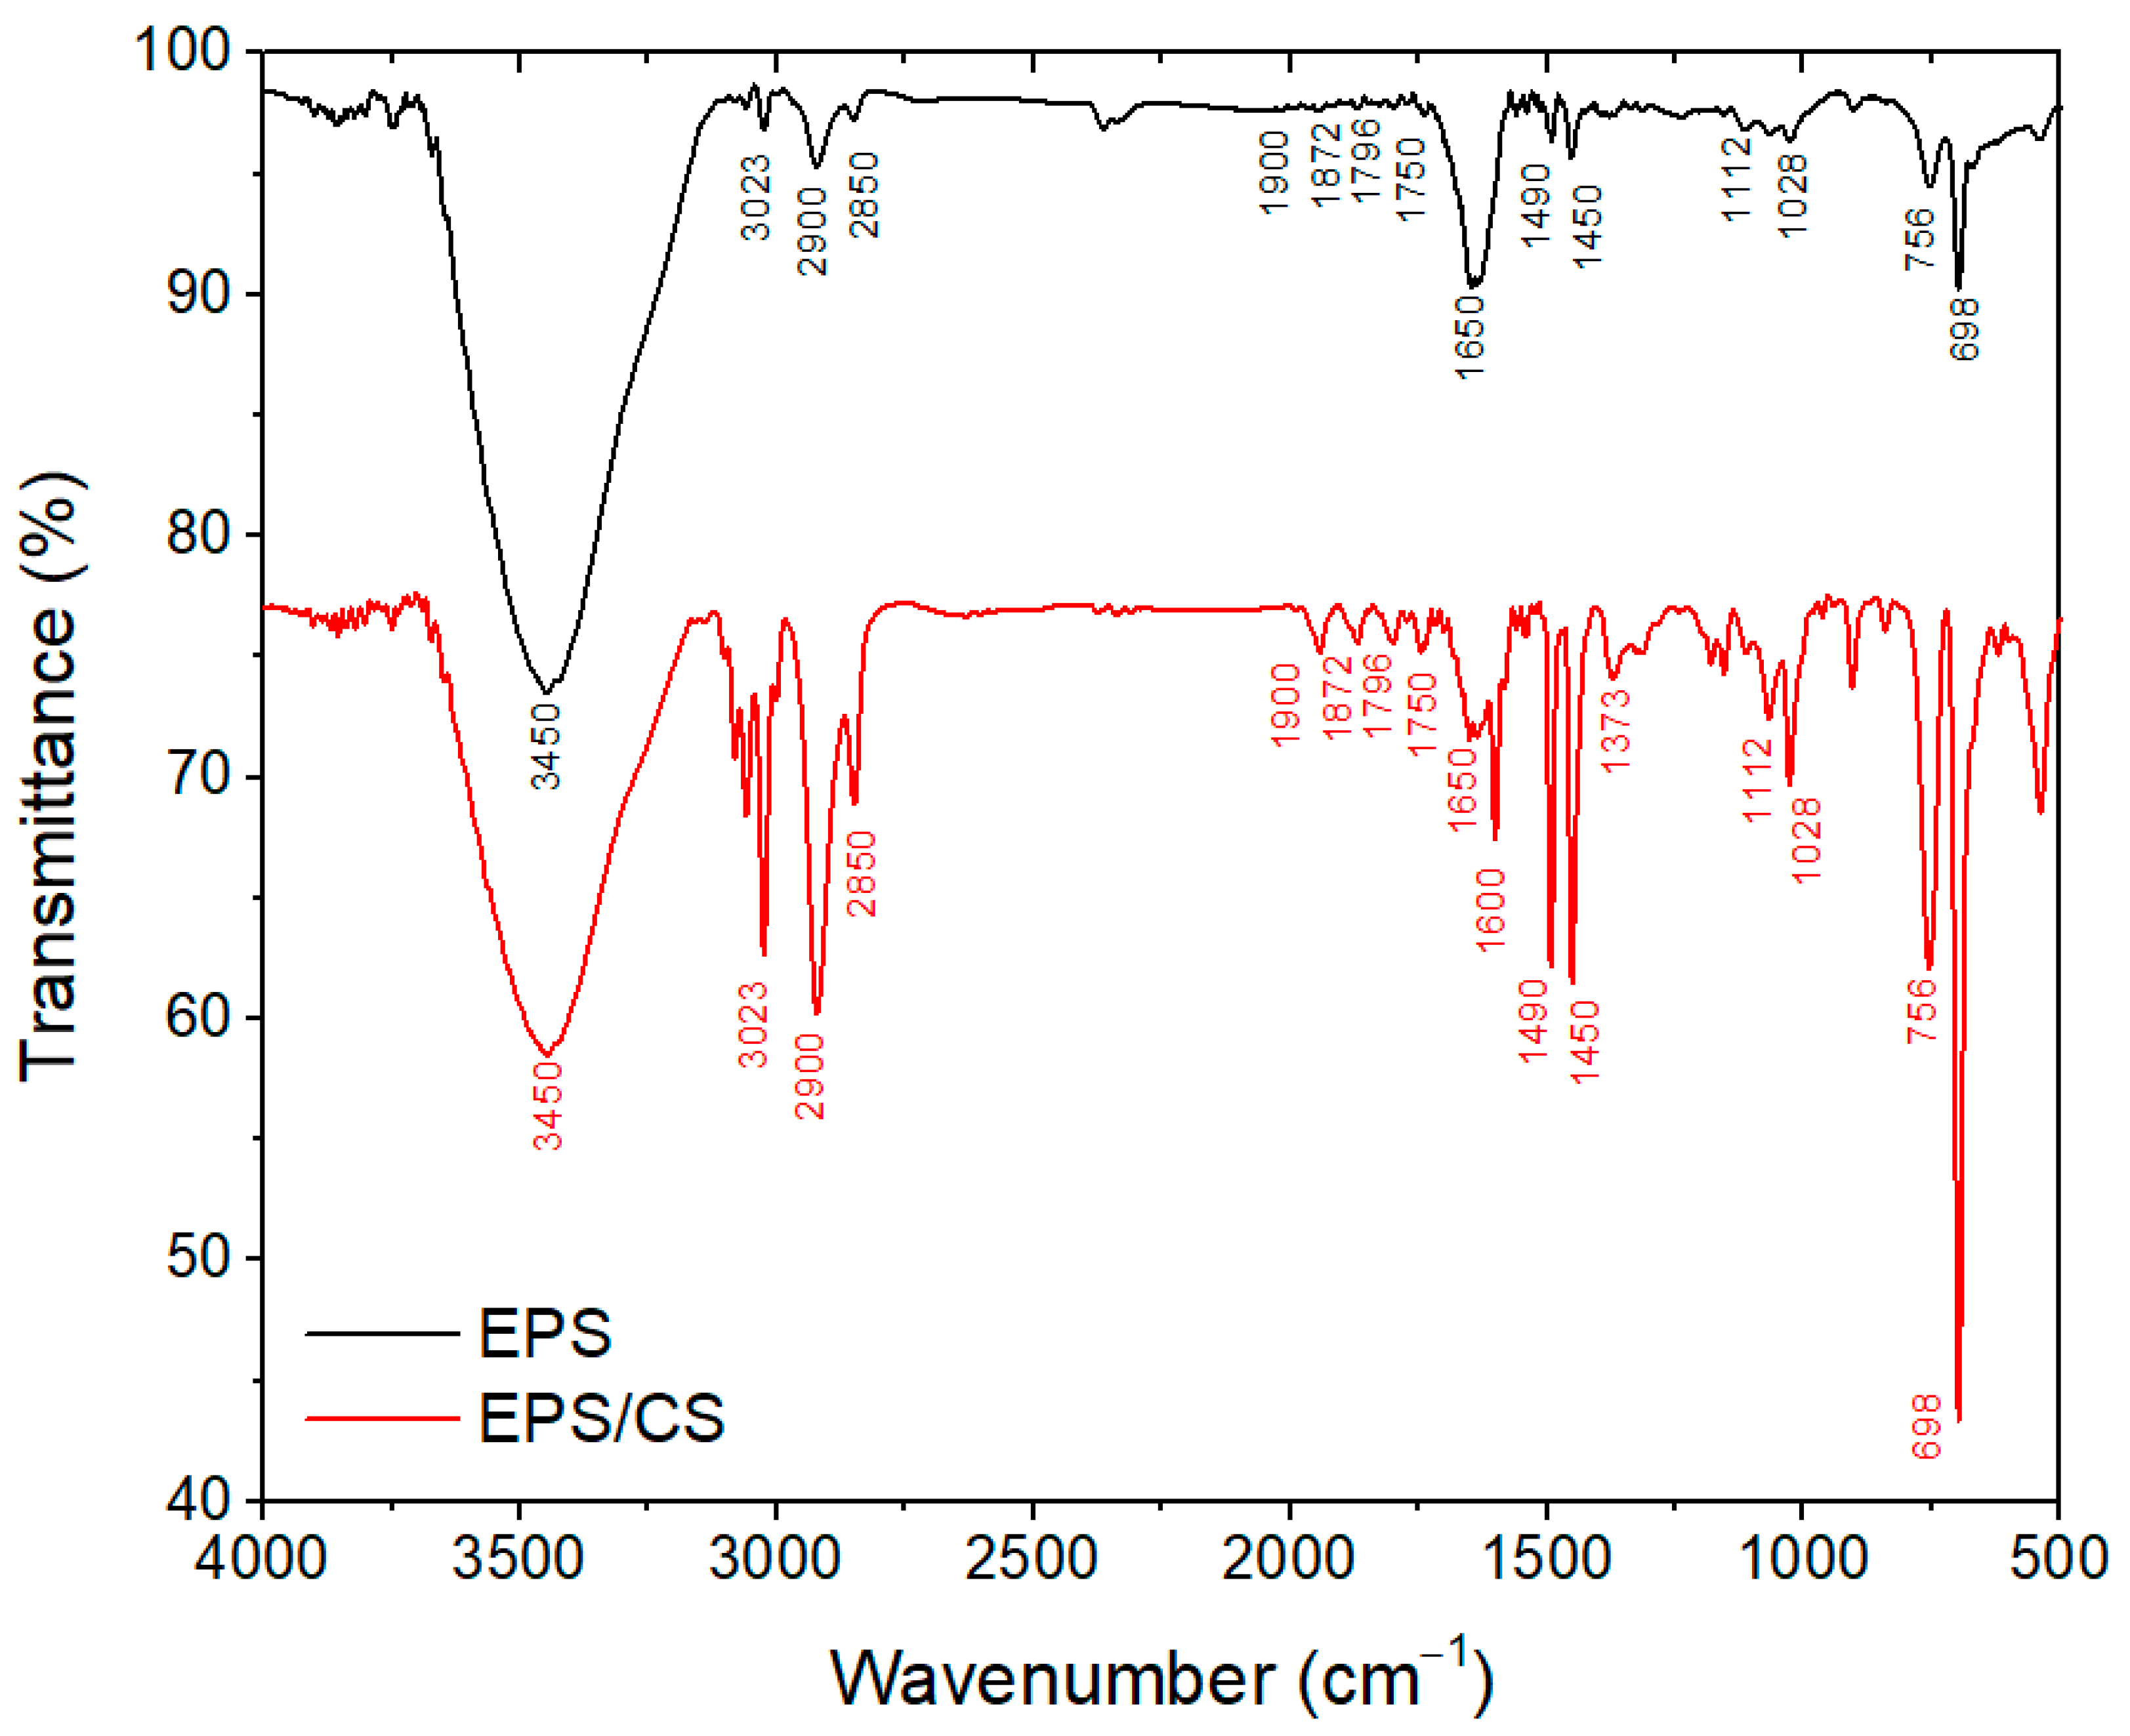
3.1. Characterization of EPS/CS Nanofibers

Figure 2 shows the SEM images of the EPS and EPS/CS nanofibers. The EPS nanofibers (Figure 2a) presented a homogeneous and smooth surface, with no beads in their structure, showing a diameter of 746 ± 30 nm. The EPS/CS nanofibers (Figure 2b) also presented a homogeneous and smooth structure overall, with no beads in their structure, showing a diameter of 806 ± 20 nm, higher than the EPS nanofibers.
The morphology and diameter values found for the nanofibers are in agreement with the literature. Rajak et al. found similar characteristics and values for EPS nanofibers produced from food packaging, according to the polymer concentration used [17]. In addition to that, Lou et al. also found that the chitosan-incorporated nanofibers presented higher diameters when compared to the chitosan-free nanofibers, which was attributed to the chitosan layer formed on the nanofiber surface [30]. These features suggest that the EPS/CS nanofibers present adequate morphological characteristics.
The results of the TGA analyses for the EPS and EPS/CS nanofibers are shown in Figure 3. The EPS nanofibers presented an initial weight loss zone ranging from 313 K to 373 K. This weight loss can be attributed to the release of water molecules physisorbed inside the material [39]. The following weight loss of the EPS nanofibers occurred approximately from 633 K to 723 K. This behavior may be attributed to the degradation of PS and was in agreement with the literature, where the degradation temperature of PS is reported to be situated from 623 K to 723 K [40].
The thermal degradation of the EPS/CS nanofibers presented two major differences regarding the EPS nanofibers. The first major difference is the absence of the weight loss zone ranging from 313 K to 373 K. This could be attributed to the additional drying steps applied during chitosan incorporation, which probably removed all water molecules from the EPS/CS nanofibers [30]. The second major difference is the start of the second weight loss, which started approximately at 513 K, before the start of the weight loss previously reported for the EPS nanofibers, around 633 K. This behavior can be explained by the chitosan incorporation. According to the literature, chitosan presents a thermal degradation ranging from 523 K to 723 K [39]. Thus, the chitosan of the EPS/CS nanofibers contributed to minimally decreasing the initial degradation temperature of the nanofibers, while the final degradation temperature of chitosan overlaps with the final degradation temperature of EPS, therefore presenting no major changes in the final stages of the analysis [40].
The FTIR spectra of the EPS and EPS/CS nanofibers are presented in Figure 4. The band located at 3450 cm−1 could be assigned to the stretching of O-H groups, resulting from the presence of adsorbed water in the EPS nanofiber and the hydroxyl groups from chitosan in the EPS/CS nanofiber [41]. Additionally, for the EPS/CS nanofibers, this band is situated over a band corresponding to NH2 groups, resulting from the chitosan incorporation [42]. The band located at 3023 cm−1 is corresponding to the C-H stretch of the aromatic ring in the EPS structure, while the bands located at 2900 cm−1 and 2850 cm−1 in both EPS and EPS/CS nanofibers are corresponding to the symmetric and asymmetric stretching of CH2 groups, respectively [43]. The absorption bands in the range of 1900–1750 cm−1 are characteristic of benzene rings, from the EPS structure [44]. The bands located around 1650 cm−1 are corresponding to the presence of C=C bonds in aromatic rings in the EPS and EPS/CS nanofibers [45]. Notably, the peak located only in the EPS/CS nanofibers at 1600 cm−1 is assigned to the stretching vibration of NH2 groups, which originated from the chitosan [42]. The bands located in the EPS and EPS/CS nanofibers at 1490 cm−1 and 1450 cm−1 are assigned to the stretching of C=C from benzene rings and the symmetrical bending of CH3, respectively [46,47]. The vibrational band located at 1373 cm−1 in the EPS/CS is corresponding to the symmetrical deformation of CH3 in the amide group, resulting from the chitosan incorporation [48]. The vibrational bands located at 1112–1028 cm−1 can be attributed to residual DMAc used to produce the polymer solution [49]. The bands located at 756 cm−1 and 698 cm−1 are corresponding to the out-of-plane C-H bending from benzene rings and benzene rings bending, respectively [44,50]. These findings show that the EPS/CS nanofibers prepared by centrifugal spinning present adequate functional groups for the adsorption of Pb(II).

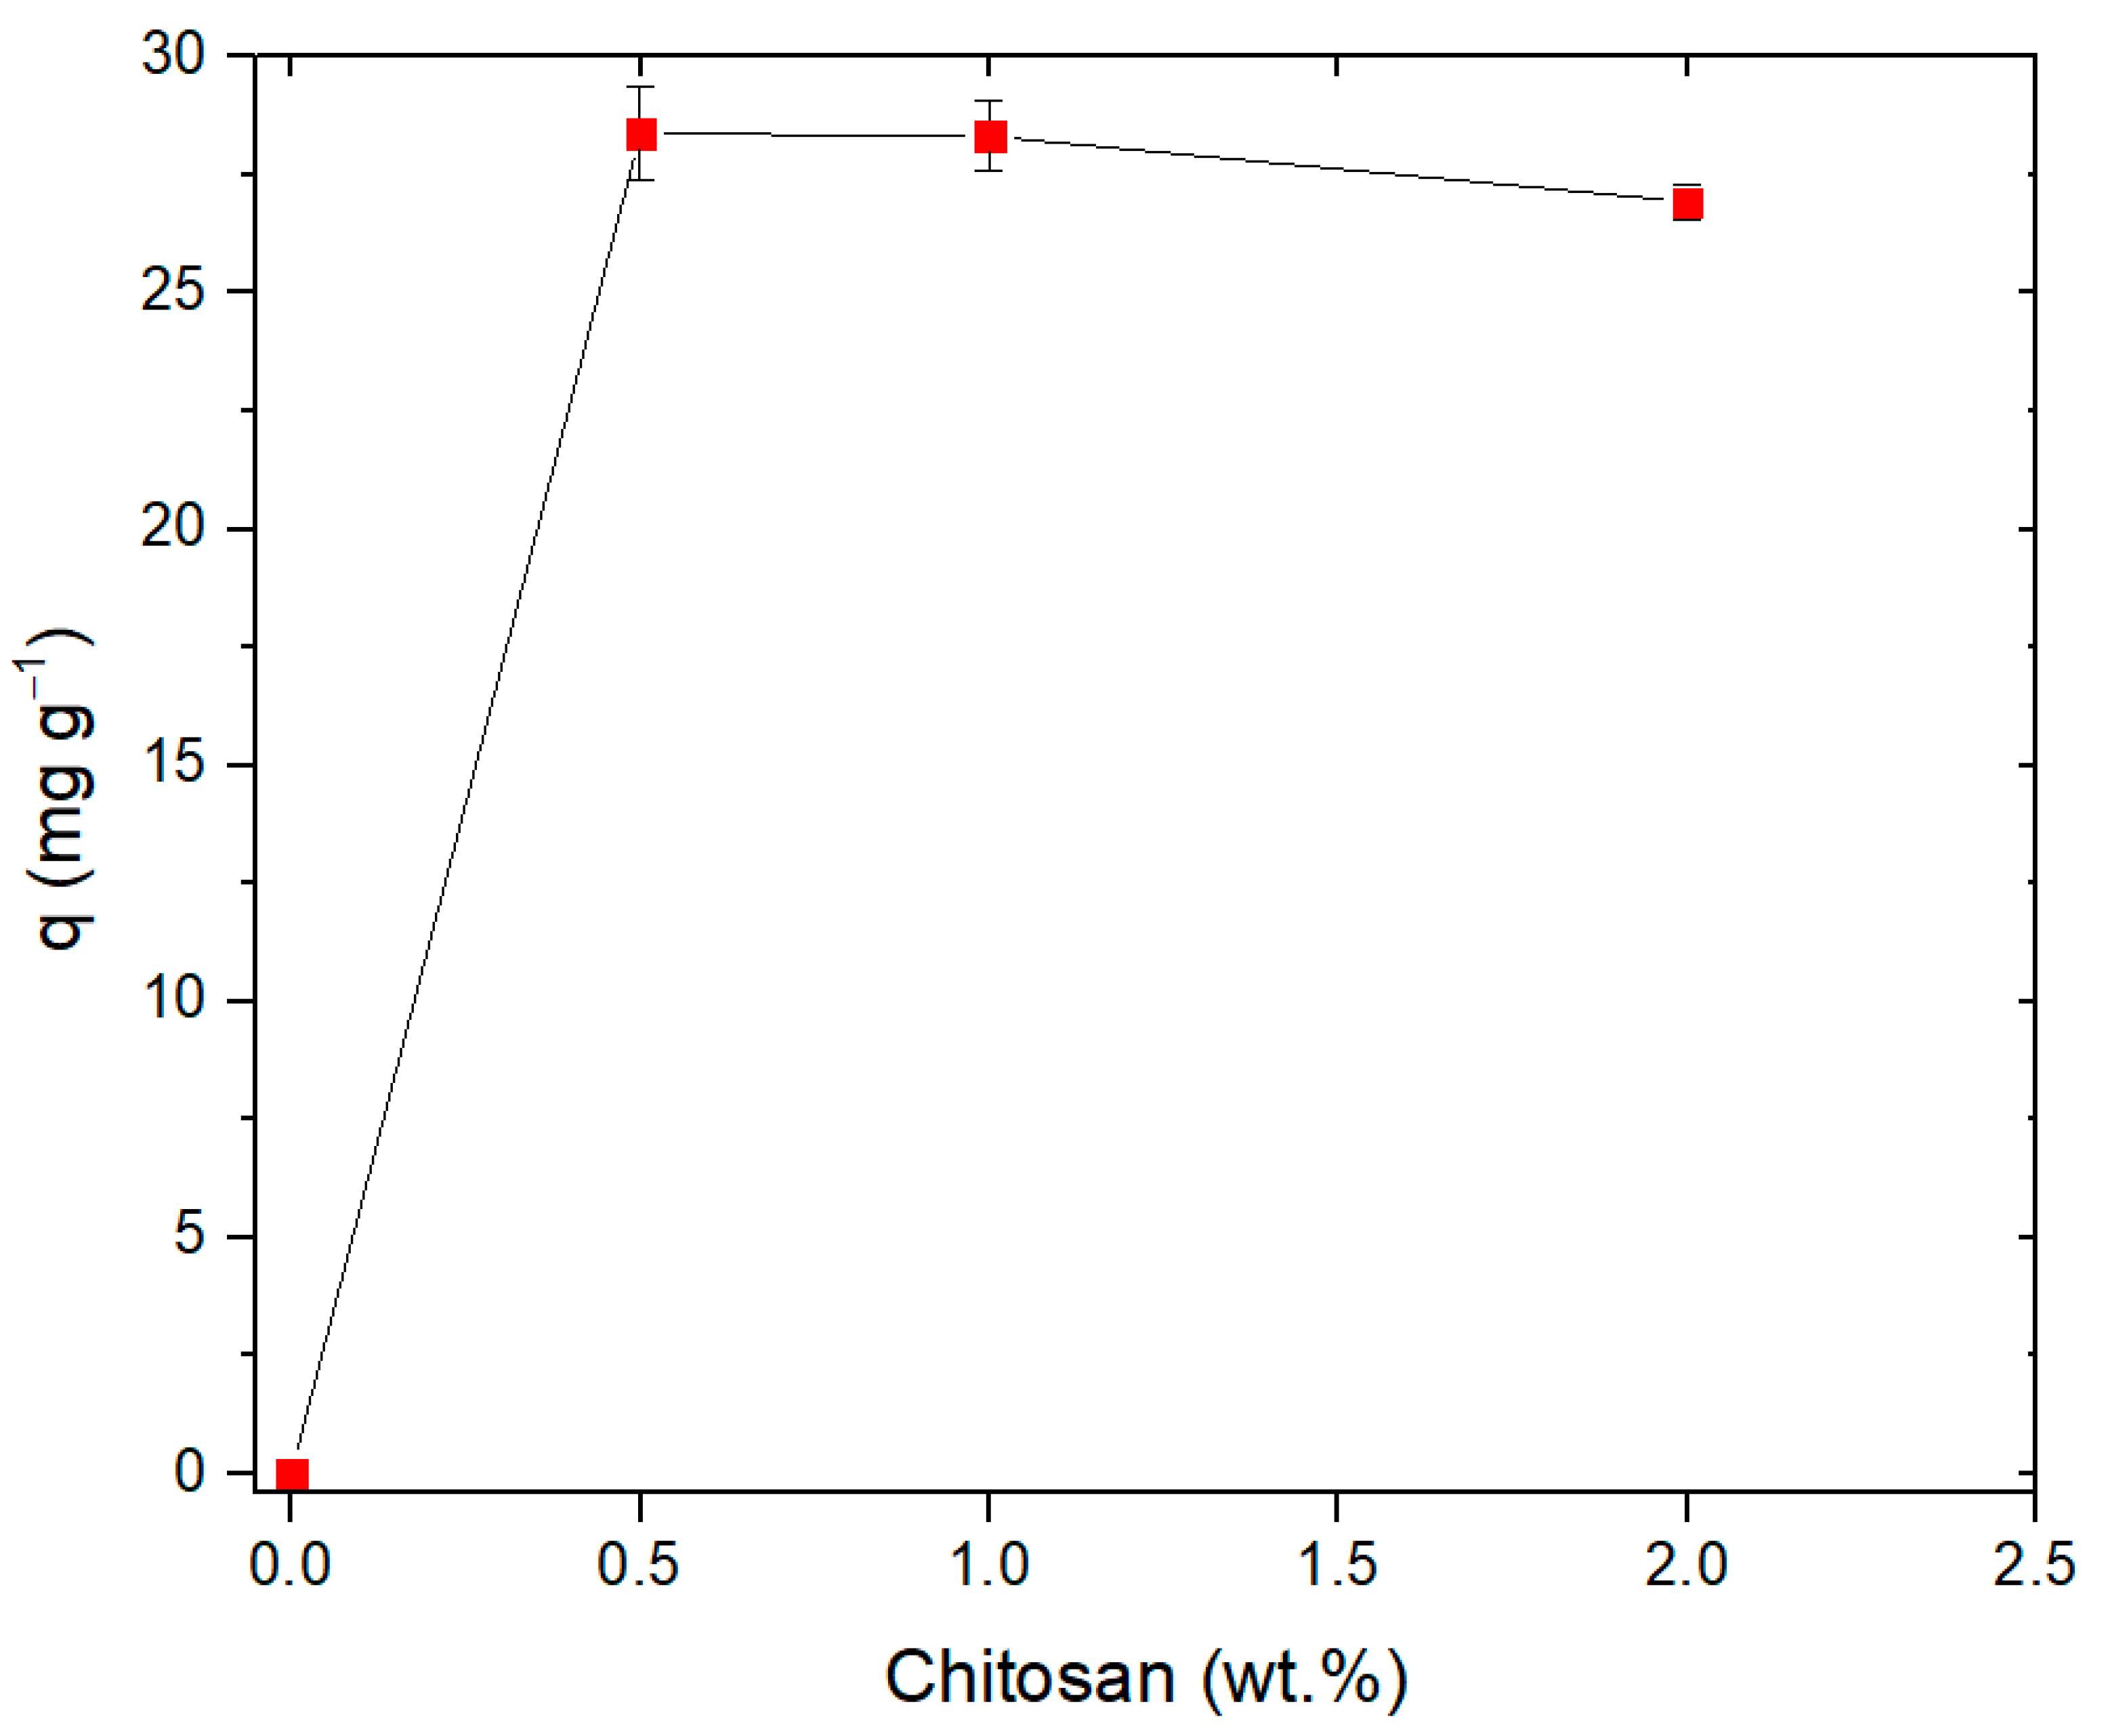
3.2. Effect of Chitosan Content on the Adsorption of Pb(II) by EPS/CS Nanofibers

EPS nanofibers were immersed on a chitosan solution for incorporation of chitosan on their surface. The influence of chitosan content used in the solution was investigated for the adsorption of Pb(II) by the EPS/CS nanofibers. The values tested for chitosan content in solution were 0.5 wt.%, 1.0 wt.% and 2.0 wt.%. Additionally, EPS nanofibers without chitosan incorporation were tested (Chitosan = 0.0 wt.%).
Figure 5 shows the adsorption capacity in regard to the chitosan content in the solutions. The values obtained for all of the concentrations were in a similar range, with the greatest value found for a chitosan content in a solution of 0.5 wt.% at 28.37 ± 0.98 mg g−1. The EPS nanofibers without chitosan incorporation presented no adsorption properties.
These results are in accordance with the previous findings of Lou et al. [30]. In their work, the authors developed the methodology of immerging PAN nanofibers in a chitosan solution of 0.5 wt.%. According to them, higher values of chitosan content contributed to the formation of thick chitosan films on the surface of the nanofibers. Hence, the drying steps used in the methodology were essential to remove excessive chitosan from the surface of their material, which could interfere with the adsorption process [30]. Moreover, from an economical point of view, the use of lower quantities of chitosan in the development of the EPS/CS nanofibers is beneficial, since less chitosan is used and similar results are achieved, reducing the production cost.
It is worth noting that the EPS nanofibers without chitosan presented no adsorption properties. This could be attributed to the lack of functional groups capable of adsorbing Pb(II) ions in the structure of the EPS nanofiber, as previously described by the FTIR spectra results (Figure 4). When chitosan incorporation occurred, it contributed to the addition of these functional groups to the structure of the EPS/CS nanofibers, resulting in the adsorption of Pb(II) ions [42,48].
Therefore, the value of 0.5 wt.% was chosen for the chitosan concentration in the solution during the production of the nanofibers. This value is technically better, due to the similar adsorption capacities obtained in regard to 1.0 wt.% and 2.0 wt.% and also to avoid excessive chitosan (which could interfere in the adsorption). In addition to that, this value is economically better due to the decrease in the chitosan content, which reduces the cost of the production process.

3.3. Effect of pH on the Adsorption of Pb(II) by EPS/CS Nanofibers

The results concerning the effect of pH on the adsorption of Pb(II) by EPS/CS nanofibers are shown in Figure 6. The pH was evaluated in the range 2–6 since at pH > 7 the precipitation of lead as Pb(OH)2 occurs [31]. It is possible to visualize that the adsorption capacity and removal percentage were favored by the increase of pH, with the highest values reached at pH 6 (28.86 ± 0.92 mg g−1 and 61.19 ± 0.89%, respectively).
This behavior is in agreement with the literature for the adsorption of Pb(II) [31,51]. Lower pH values resulted in higher concentration of H+ ions, which competed with Pb(II) for the adsorption sites. As the pH was increased, the H+ concentration decreased, favoring the adsorption of Pb(II) ions by the negative adsorption sites, which originated from the amino and hydroxyl functional groups of chitosan [51,52]. Therefore, the subsequent experiments were performed at pH 6, which favors the adsorption of Pb(II) by the EPS/CS nanofiber.

3.4. Adsorption Kinetics

The kinetic curves obtained for the Pb(II) adsorption by the EPS/CS nanofibers are presented in Figure 7. The nanofibers showed a higher adsorption rate in the first 15 min (q = 26.26 ± 0.54 mg g−1) until the equilibrium was reached after 90 min (q = 27.74 ± 0.72 mg g−1). Thus, in the first 15 min adsorption capacity reached 94.66% of its maximum value. The kinetic parameters for the adsorption of Pb(II) by the EPS/CS nanofibers are provided in Table 1. Pseudo-second order (PSO) showed a higher determination coefficient (R2) and lower average relative error (ARE), indicating that it was the most suitable to represent the adsorption of Pb(II).
Previously, Zhang et al. also found a fast adsorption for Pb(II), with most of the adsorption occurring in the first 20 min, until equilibrium was reached at 60 min, with a better fit for their adsorption kinetics by pseudo-second-order model [53]. Phan et al. achieved fast adsorption of Pb(II) up to 5 min, with equilibrium completely reached at 30 min using cellulose nanofibers modified with chitosan, with a better fit for their adsorption kinetics by the pseudo-second-order model [25]. These authors attributed the fast adsorption rates in the initial stages of the process to the large availability of active sites such as amines and hydroxyl groups provided by chitosan, while the slower adsorption stages are attributed to the diffusion of metal ions into the porous and interstitial structure of the adsorbent, which occurs more slowly. Similarly, the adsorption kinetics of Pb(II) by EPS/CS nanofibers occurred mostly in the initial stages of the process, and pseudo-second-order was more adequate to represent the kinetic data.

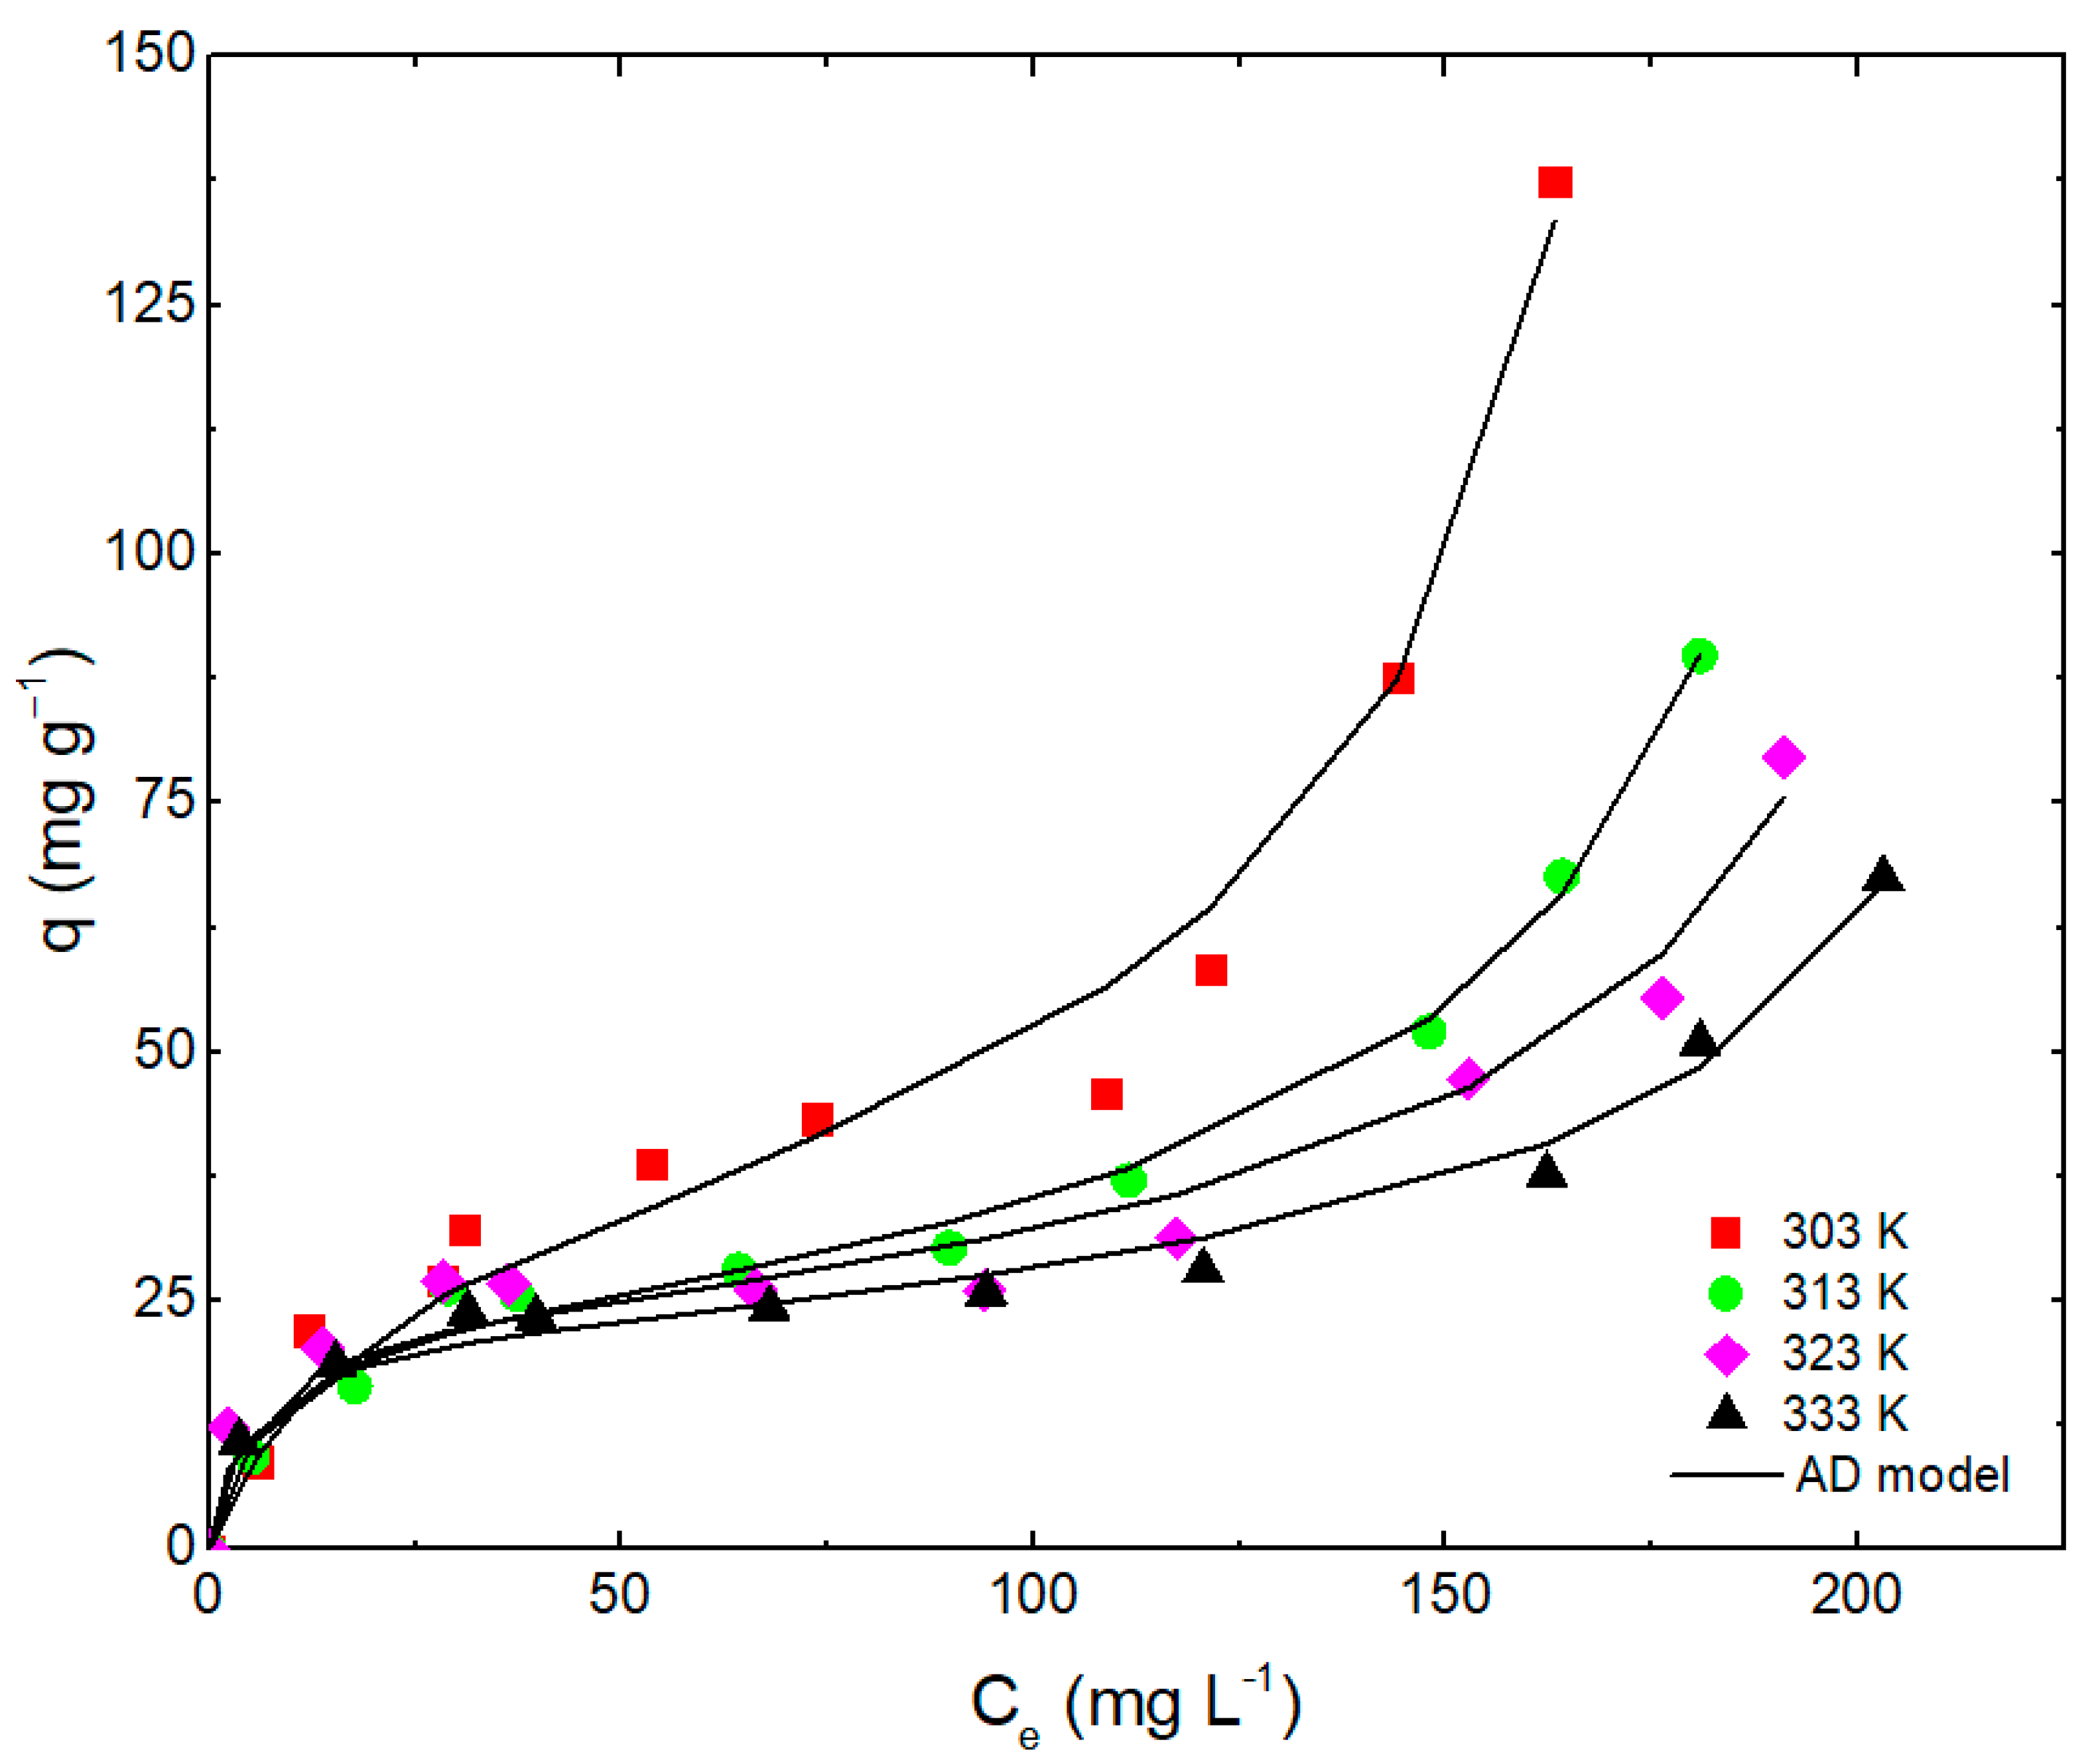
3.5. Adsorption Isotherms

The isotherm curves of Pb(II) adsorption on the EPS/CS nanofibers were obtained at four different temperatures (303 K, 313 K, 323 K, 333 K) and are shown in Figure 8. It is possible to visualize that the curves presented a type II behavior according to the IUPAC classification, characterizing multilayer adsorption [54]. In this type of isotherm, low equilibrium concentrations result in an inclined portion of the curve. As the equilibrium concentrations are increased, the curve presents a plateau, representing the occupation of the adsorbent active sites, or monolayer adsorption. When the equilibrium concentrations are increased even further, the curve presents another inclination, attributed to the multilayer adsorption, in which more than one layer of ions is accommodated, resulting in an increase in adsorption capacity, similarly to Figure 8 [54]. A similar isotherm shape was found in the adsorption of Pb(II) and Cd(II) ions by iron-organic frameworks [55]. In their study, the authors attributed the multilayer phenomenon to the electrostatic interactions between adsorbed and non-adsorbed ions in solution. These features show the great adsorption potential of Pb(II) ions by the EPS/CS nanofibers, credited to the high affinity between the active sites of the adsorbent and the metal ions in conjunction with the interactions between adsorbed and non-adsorbed metal ions responsible for increasing the adsorption capacity through multilayer mechanism.
Additionally, it is also possible to visualize in Figure 8 that the adsorption was favored by the temperature decrease. This might be attributed to the tendency of the metal ion to escape from the adsorbent surface to the solution phase when the temperature is increased, resulting in lower adsorption capacities overall, as previously found for Pb(II) ions by Horsfall and Spiff [56].
The adsorption isotherm curves were modeled by Freundlich, BET, and Aranovich–Donohue models. The equilibrium parameters for the adsorption of Pb(II) by the EPS/CS nanofibers are provided in Table 2. According to the higher values of determination coefficient (R2) and lower values of average relative error (ARE), the Aranovich–Donohue model was the most suitable to represent the equilibrium data and was selected to calculate the thermodynamic parameters. The KL-AD parameter is related to the Langmuir KL parameter [57]. Therefore, the separation factor (RL) used on the Langmuir isotherm analysis (RL-AD = 1/(1 + KL-AD C0)) might be applied in this study to confirm whether the monolayer stage of the process was favorable. Since it was verified that 0 < RL-AD < 1, it is possible to conclude that this stage was favorable [58].
The increasing magnitude of the KAD values observed as temperature decreases indicate that the multilayer phenomenon was more expressive when the temperature was lower. In addition to that, the monolayer adsorption capacity (qAD) obtained by the Aranovich–Donohue model was also higher at the temperature of 303 K (37.22 mg g−1), confirming the tendency of increased adsorption at lower temperatures [56]. Finally, as previously stated by Aranovich and Donohue, the values of “n” must be situated between 0 and 1, so that the thermodynamics of their correlation is respected, which occurred in this study [36].
The Aranovich–Donohue isotherm is derived from the BET model, and as such, is applied in type II adsorption isotherms [36]. One of the major advantages of this model is that one of its terms is based on models that predict type I isotherms. Thus, this term assists in the representation of the monolayer stage in type II isotherms, increasing the accuracy of the model [37]. This contributed to a better adjustment of the data regarding Pb(II) adsorption by EPS/CS nanofibers.
The maximum Pb(II) adsorption capacity of the EPS/CS nanofiber under the experimental conditions used was 137.35 mg g−1. Table 3 shows the comparison between this value and the values previously reported in the literature for other nanofiber adsorbents. It is possible to visualize that the EPS/CS nanofibers presented comparable results in regard to the other adsorbents. Therefore, they consist of viable alternatives for the removal of Pb(II) ions from water, since their production requires the use of polymer waste and an abundant biopolymer (EPS and chitosan, respectively), being environmentally friendly while still achieving a great value of adsorption capacity. These advantages are supported by the advantages of adsorption as a metal removing technique when compared to other hydrometallurgical techniques, including simple operation, low cost, high efficiency, and reusability of the adsorbent, as previously reported by the literature [7,59].
Table 3. Pb(II) adsorption capacities of the EPS/CS nanofibers compared to other nanofiber adsorbents in the literature.
AdsorbentMetalpHT (K)qm (mg g−1)References
EPS/CS nanofibersPb (II)6.0303137.35This work
CS nanofiberPb (II)7.0298110.20[60]
CS nanofiberPb (II)5.0298118.00[38]
Cellulose/CS nanofiberPb (II)6.029857.30[25]
PEO/DTPA-CS nanofibersPb (II)5.0298142.00[61]
β-CD/CS/PVAPb (II)7.030382.54[26]

3.6. Adsorption Thermodynamic Results

The thermodynamic parameters for the adsorption of Pb(II) by the EPS/CS nanofibers are shown in Table 4. The negative values of ΔG0 indicated that the adsorption was spontaneous and favorable. The positive values of ΔH0 showed that the process was endothermic. According to the magnitude of ΔH0 (<80 kJ mol−1), the process involved physical interactions [62]. The positive values of ΔS0 showed an increase in the randomness of the adsorptive system, related to rearrangements at the nanofiber-solution interface.

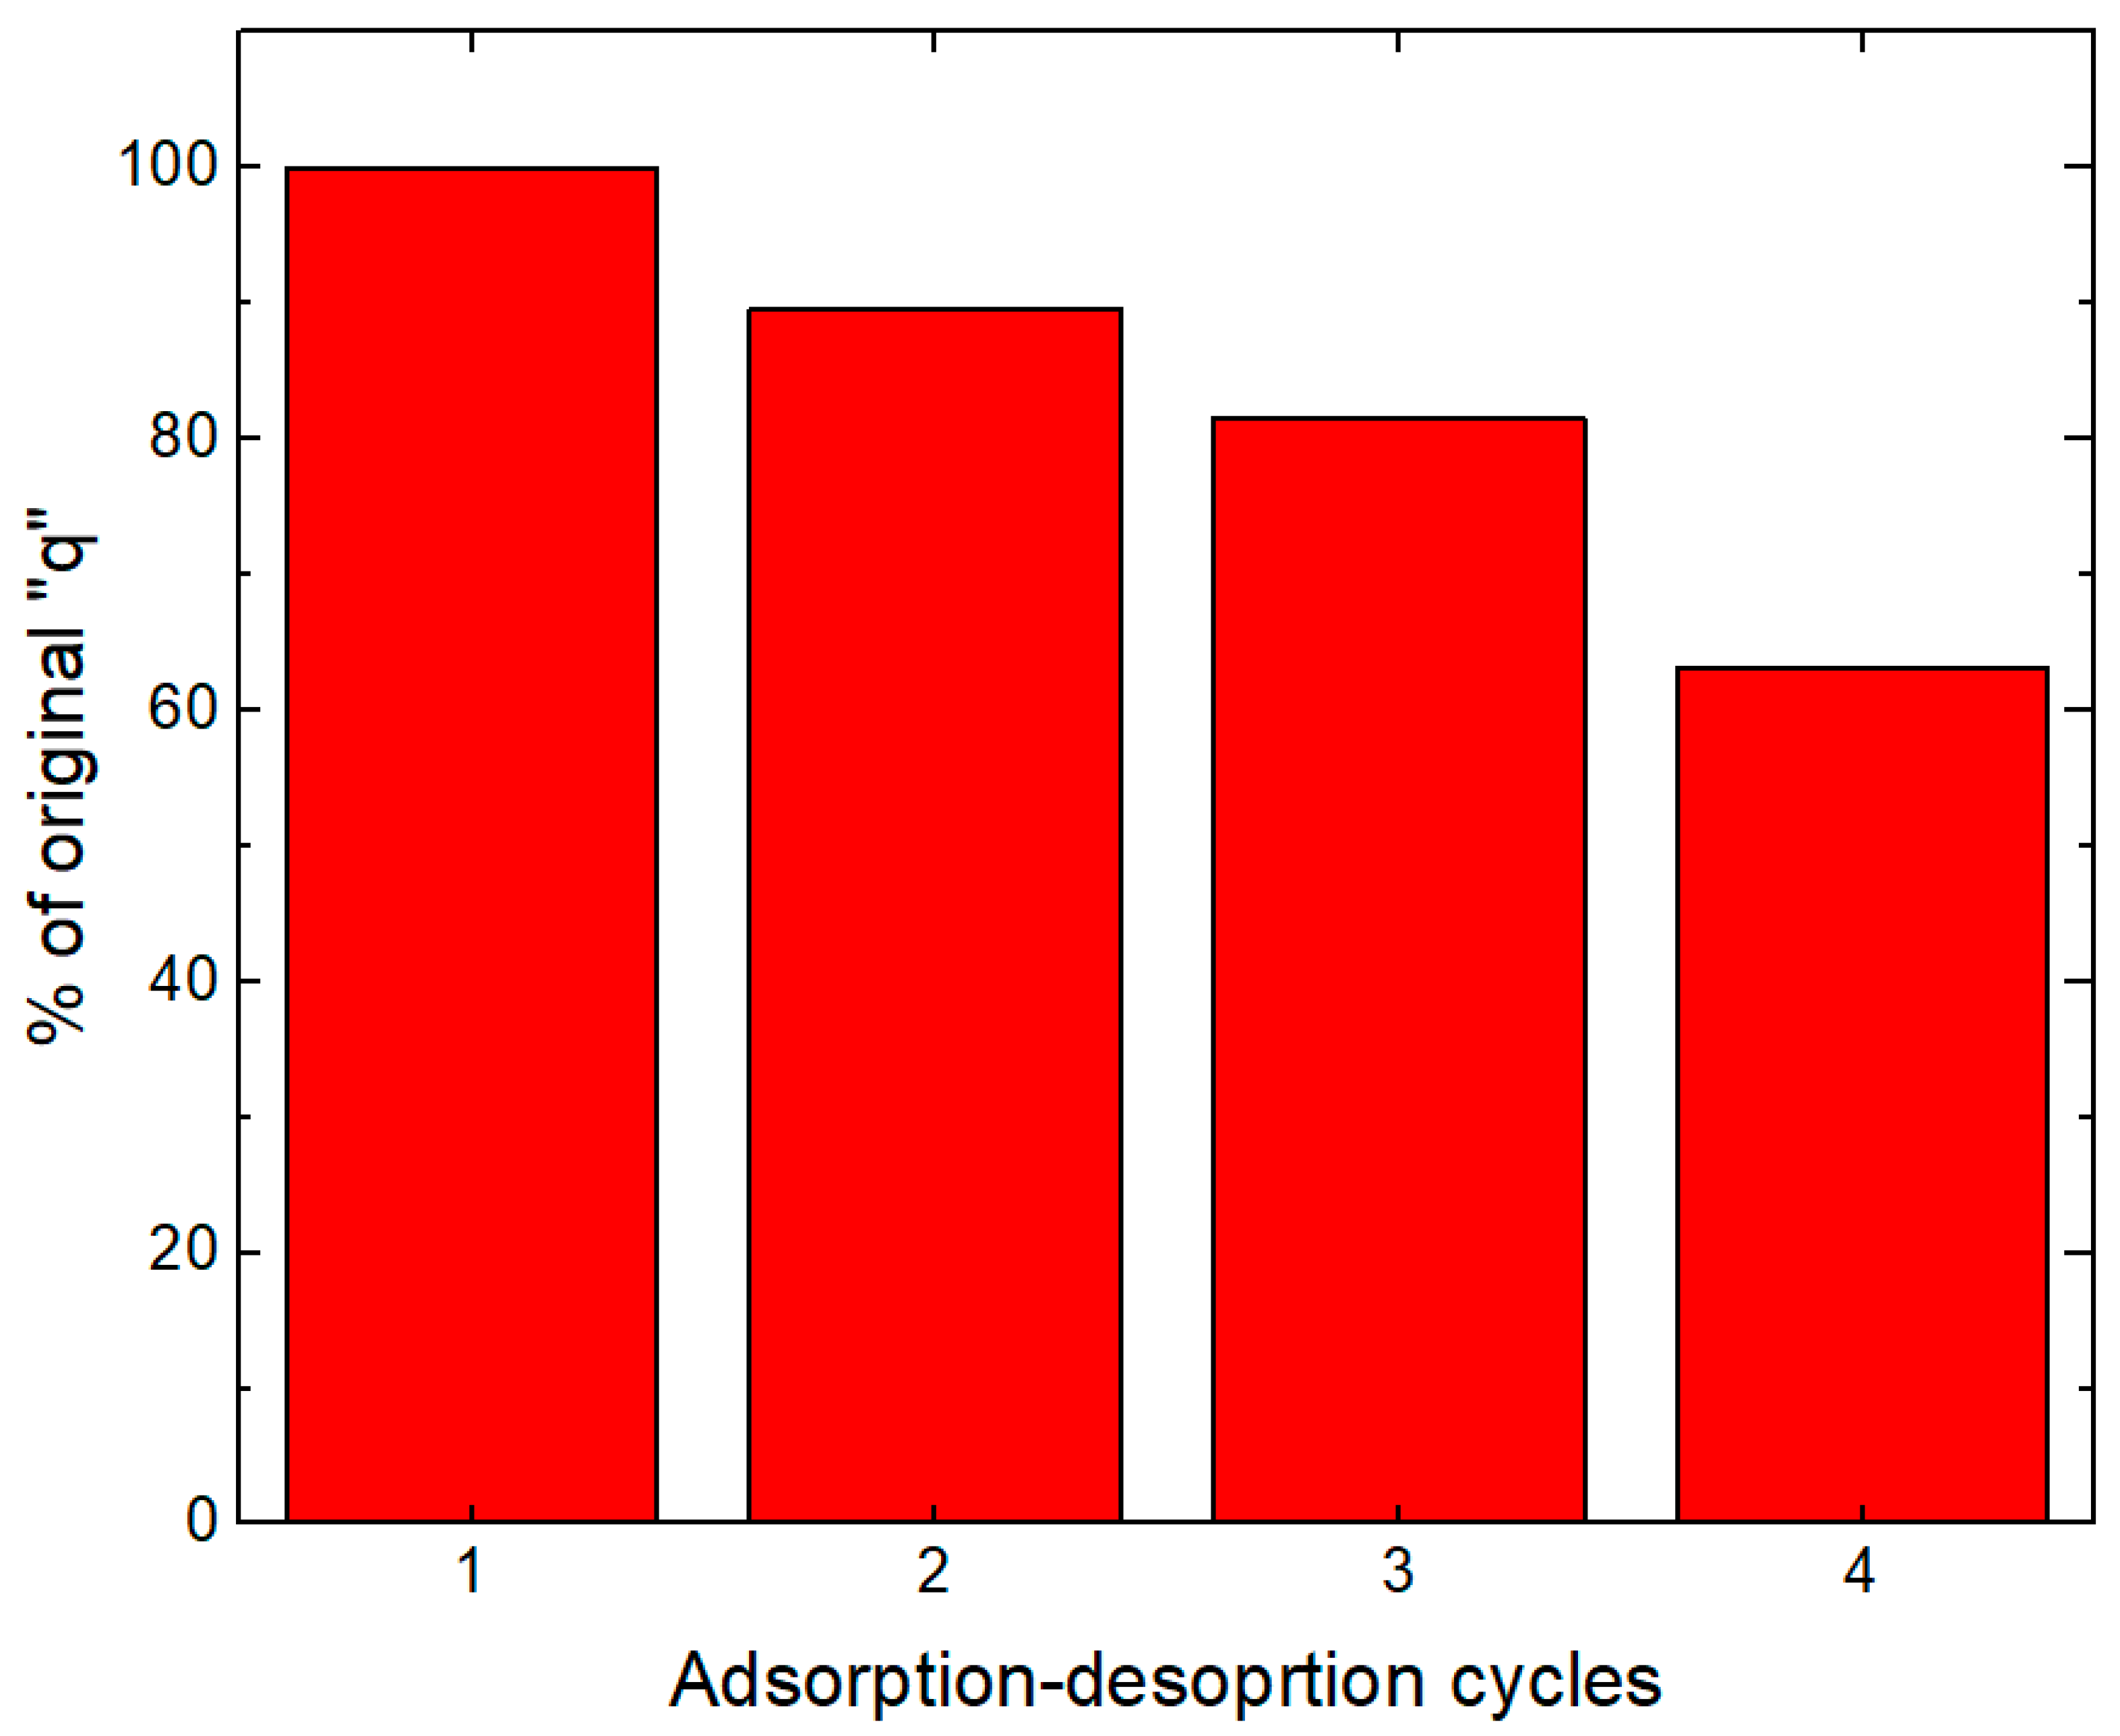
3.7. Adsorption and Desorption Cycles: Reuse Experiments

Figure 9 presents the adsorption capacity of the EPS/CS nanofibers after four cycles of adsorption-desorption. It is possible to visualize that the nanofibers maintained 63.04% of their original adsorption capacity after the cycles were performed (from 137.35 mg g−1 to 86.58 mg g−1).
The decrease in adsorption capacity may be credited to the incomplete desorption of Pb(II) and saturation of the adsorbent active sites, as previously reported in the literature [63]. To enhance the adsorbent reusability, another method of regeneration could be applied, including acid treatment [63]. These results indicated that the EPS/CS nanofibers could be successfully regenerated and reused for Pb(II) adsorption, presenting a reasonable percentage of their original adsorption capacity even after four cycles of adsorption-desorption (63.04%).
Moreover, the results of the desorption in conjunction with the previous results of this study show even further the great potential of the EPS/CS nanofibers developed. From the recycling of a waste polymer into a novel material (which reduces the disposal of wastes to the environment) capable of removing a hazardous, potentially toxic metal from aqueous solutions with great adsorption capacity and reuse properties, this study showed a viable option for the current adsorbents presented on the literature, enabling the exploration of this nanomaterial on the removal and recovery of other similar metals.

4. Conclusions

Novel recycled expanded polystyrene (EPS) nanofibers were developed using the centrifugal spinning technique. These nanofibers were subjected to functionalization with chitosan (CS) and EPS/CS nanofibers were successfully obtained. The EPS/CS nanofibers were highly effective for the removal of Pb(II) from aqueous solutions.
Characterization of the EPS/CS nanofibers presented nanofiber diameters of 806 nm, in addition to adequate thermal properties and functional groups compatible for Pb(II) adsorption. The adsorption of Pb(II) on the nanofibers was favored at pH 6.0 at 303 K. Pseudo-second-order was the most adequate model to represent the kinetic data. The Aranovich–Donohue model was the most adequate model to represent the equilibrium data. The maximum adsorption capacity of Pb(II) achieved by the EPS/CS nanofibers was 137.35 mg g−1. The adsorptive process was spontaneous, favorable, and endothermic. The EPS/CS nanofibers presented 63.04% of their original adsorption capacity after 4 cycles of adsorption-desorption.
According to the findings obtained in this study, it can be concluded that the EPS/CS nanofibers present great potential for the treatment of wastewater containing Pb(II) ions, with additional environmental relevance due to the use of a recycled polymer in its production, reducing the disposal of wastes to the environment.

Author Contributions

Study concept and design: T.R.M., P.S.C., D.A.B., M.L.A. and E.H.T. Material preparation and data acquisition: T.R.M. and P.S.C. Analysis and interpretation of data: T.R.M. Drafting of the manuscript: T.R.M. Critical revision of the manuscript for important intellectual content: D.A.B., M.L.A. and E.H.T. Statistical analysis: T.R.M. Study supervision: D.A.B., M.L.A. and E.H.T. All authors have read and agreed to the published version of the manuscript.

Funding

This work was financially supported by CNPq (National Council of Science and Technological Development), CAPES (Coordination for the Improvement of Higher Education Personnel), FAPERGS (Research Support Foundation of the State of Rio Grande do Sul), and SDECT (Secretary of Economic Development, Science and Technology of the State of Rio Grande do Sul) for financial support.

Institutional Review Board Statement

Not applicable.

Informed Consent Statement

Not applicable.

Data Availability Statement

Not applicable.

Conflicts of Interest

The authors declare no conflict of interest.

References

  1. Perumal, S.; Atchudan, R.; Edison, T.; Babu, R.; Karpagavinayagam, P.; Vedhi, C. A Short Review on Recent Advances of Hydrogel-Based Adsorbents for Heavy Metal Ions. Metals 2021, 11, 864. [Google Scholar] [CrossRef]
  2. Fu, F.; Wang, Q. Removal of heavy metal ions from wastewaters: A review. J. Environ. Manag. 2011, 92, 407–418. [Google Scholar] [CrossRef]
  3. Abdulla, M. Lead. In Essential and Toxic Trace Elements and Vitamins in Human Health; Elsevier: Amsterdam, The Netherlands, 2020; pp. 181–191. [Google Scholar] [CrossRef]
  4. Balali-Mood, M.; Naseri, K.; Tahergorabi, Z.; Khazdair, M.R.; Sadeghi, M. Toxic Mechanisms of Five Heavy Metals: Mercury, Lead, Chromium, Cadmium, and Arsenic. Front. Pharmacol. 2021, 12, 643972. [Google Scholar] [CrossRef] [PubMed]
  5. Raychaudhuri, S.S.; Pramanick, P.; Talukder, P.; Basak, A. Polyamines, metallothioneins, and phytochelatins—Natural defense of plants to mitigate heavy metals. Stud. Nat. Prod. Chem. 2021, 69, 227–261. [Google Scholar] [CrossRef]
  6. Kumar, V.; Dwivedi, S.; Oh, S. A critical review on lead removal from industrial wastewater: Recent advances and future outlook. J. Water Process Eng. 2022, 45, 102518. [Google Scholar] [CrossRef]
  7. Alguacil, F.J.; Alcaraz, L.; García-Díaz, I.; López, F.A. Removal of Pb2+ in Wastewater via Adsorption onto an Activated Carbon Produced from Winemaking Waste. Metals 2018, 8, 697. [Google Scholar] [CrossRef] [Green Version]
  8. Zhu, F.; Zheng, Y.-M.; Zhang, B.-G.; Dai, Y.-R. A critical review on the electrospun nanofibrous membranes for the adsorption of heavy metals in water treatment. J. Hazard. Mater. 2021, 401, 123608. [Google Scholar] [CrossRef]
  9. Mehrotra, T.; Sinha, S.; Singh, R. Application of nanotechnology in the remediation of heavy metal toxicity. Nanotechnol. Food Agric. Environ. 2021, 359–373. [Google Scholar] [CrossRef]
  10. Rivero, P.J.; Redin, D.M.; Rodríguez, R.J. Electrospinning: A Powerful Tool to Improve the Corrosion Resistance of Metallic Surfaces Using Nanofibrous Coatings. Metals 2020, 10, 350. [Google Scholar] [CrossRef] [Green Version]
  11. Sarkar, K.; Gomez, C.; Zambrano, S.; Ramirez, M.; de Hoyos, E.; Vasquez, H.; Lozano, K. Electrospinning to Forcespinning™. Mater. Today 2010, 13, 12–14. [Google Scholar] [CrossRef]
  12. Zhang, Z.-M.; Duan, Y.-S.; Xu, Q.; Zhang, B. A review on nanofiber fabrication with the effect of high-speed centrifugal force field. J. Eng. Fibers Fabr. 2019, 14. [Google Scholar] [CrossRef] [Green Version]
  13. Zhang, X.; Lu, Y. Centrifugal Spinning: An Alternative Approach to Fabricate Nanofibers at High Speed and Low Cost. Polym. Rev. 2014, 54, 677–701. [Google Scholar] [CrossRef]
  14. Segala, B.N.; Bertuol, D.A.; Tanabe, E.H. Production of polyacrylonitrile nanofibres modified with Cyanex 272 for recovery of gallium from solution. Environ. Technol. 2022, 43, 737–750. [Google Scholar] [CrossRef]
  15. Nataraj, S.; Yang, K.; Aminabhavi, T. Polyacrylonitrile-based nanofibers—A state-of-the-art review. Prog. Polym. Sci. 2012, 37, 487–513. [Google Scholar] [CrossRef]
  16. Shin, C.; Chase, G.; Reneker, D. Recycled expanded polystyrene nanofibers applied in filter media. Colloids Surf. A Physicochem. Eng. Asp. 2005, 262, 211–215. [Google Scholar] [CrossRef]
  17. Rajak, A.; Hapidin, D.A.; Iskandar, F.; Munir, M.M.; Khairurrijal, K. Electrospun nanofiber from various source of expanded polystyrene (EPS) waste and their characterization as potential air filter media. Waste Manag. 2020, 103, 76–86. [Google Scholar] [CrossRef]
  18. Chinchillas-Chinchillas, M.J.; Orozco-Carmona, V.M.; Alvarado-Beltrán, C.G.; Almaral-Sánchez, J.L.; Sepulveda-Guzman, S.; Jasso-Ramos, L.E.; Castro-Beltrán, A. Synthesis of Recycled Poly(ethylene terephthalate)/Polyacrylonitrile/Styrene Composite Nanofibers by Electrospinning and Their Mechanical Properties Evaluation. J. Polym. Environ. 2019, 27, 659–669. [Google Scholar] [CrossRef]
  19. Bonfim, D.; Cruz, F.; Guerra, V.; Aguiar, M. Development of Filter Media by Electrospinning for Air Filtration of Nanoparticles from PET Bottles. Membranes 2021, 11, 293. [Google Scholar] [CrossRef]
  20. de Oliveira, C.T.; Luna, M.M.; Campos, L.M. Understanding the Brazilian expanded polystyrene supply chain and its reverse logistics towards circular economy. J. Clean. Prod. 2019, 235, 562–573. [Google Scholar] [CrossRef]
  21. Alharbi, H.F.; Haddad, M.Y.; Aijaz, M.O.; Assaifan, A.K.; Karim, M.R. Electrospun Bilayer PAN/Chitosan Nanofiber Membranes Incorporated with Metal Oxide Nanoparticles for Heavy Metal Ion Adsorption. Coatings 2020, 10, 285. [Google Scholar] [CrossRef] [Green Version]
  22. Keshtkar, A.R.; Tabatabaeefar, A.; Vaneghi, A.S.; Moosavian, M.A. Electrospun polyvinylpyrrolidone/silica/3-aminopropyltriethoxysilane composite nanofiber adsorbent: Preparation, characterization and its application for heavy metal ions removal from aqueous solution. J. Environ. Chem. Eng. 2016, 4, 1248–1258. [Google Scholar] [CrossRef]
  23. Sakib, M.N.; Mallik, A.K.; Rahman, M.M. Update on chitosan-based electrospun nanofibers for wastewater treatment: A review. Carbohydr. Polym. Technol. Appl. 2021, 2, 100064. [Google Scholar] [CrossRef]
  24. Elieh-Ali-Komi, D.; Hamblin, M.R. Chitin and Chitosan: Production and Application of Versatile Biomedical Nanomaterials. Int. J. Adv. Res. 2016, 4, 411–427. [Google Scholar]
  25. Phan, D.-N.; Lee, H.; Huang, B.; Mukai, Y.; Kim, I.-S. Fabrication of electrospun chitosan/cellulose nanofibers having adsorption property with enhanced mechanical property. Cellulose 2019, 26, 1781–1793. [Google Scholar] [CrossRef]
  26. Fan, J.-P.; Luo, J.-J.; Zhang, X.-H.; Zhen, B.; Dong, C.-Y.; Li, Y.-C.; Shen, J.; Cheng, Y.-T.; Chen, H.-P. A novel electrospun β-CD/CS/PVA nanofiber membrane for simultaneous and rapid removal of organic micropollutants and heavy metal ions from water. Chem. Eng. J. 2019, 378, 122232. [Google Scholar] [CrossRef]
  27. Liu, D.; Li, Z.; Zhu, Y.; Li, Z.; Kumar, R. Recycled chitosan nanofibril as an effective Cu(II), Pb(II) and Cd(II) ionic chelating agent: Adsorption and desorption performance. Carbohydr. Polym. 2014, 111, 469–476. [Google Scholar] [CrossRef]
  28. Jamshidifard, S.; Koushkbaghi, S.; Hosseini, S.; Rezaei, S.; Karamipour, A.; Jafarirad, A.; Irani, M. Incorporation of UiO-66-NH2 MOF into the PAN/chitosan nanofibers for adsorption and membrane filtration of Pb(II), Cd(II) and Cr(VI) ions from aqueous solutions. J. Hazard. Mater. 2019, 368, 10–20. [Google Scholar] [CrossRef]
  29. Kummer, G.; Schonhart, C.; Fernandes, M.G.; Dotto, G.L.; Missio, A.L.; Bertuol, D.A.; Tanabe, E.H. Development of Nanofibers Composed of Chitosan/Nylon 6 and Tannin/Nylon 6 for Effective Adsorption of Cr(VI). J. Polym. Environ. 2018, 26, 4073–4084. [Google Scholar] [CrossRef]
  30. Lou, T.; Yan, X.; Wang, X. Chitosan coated polyacrylonitrile nanofibrous mat for dye adsorption. Int. J. Biol. Macromol. 2019, 135, 919–925. [Google Scholar] [CrossRef]
  31. Thamer, B.M.; Aldalbahi, A.; Moydeen, A.M.; Al-Enizi, A.M.; El-Hamshary, H.; El-Newehy, M.H. Fabrication of functionalized electrospun carbon nanofibers for enhancing lead-ion adsorption from aqueous solutions. Sci. Rep. 2019, 9, 19467. [Google Scholar] [CrossRef]
  32. Ho, Y.; Mckay, G. Kinetic Models for the Sorption of Dye from Aqueous Solution by Wood. Process Saf. Environ. Prot. 1998, 76, 183–191. [Google Scholar] [CrossRef] [Green Version]
  33. Lagergren, S. Zur theorie der sogenannten adsorption geloster stoffe. Kungliga Svenska Vetenskapsakademiens Handlingar 1898, 24, 1–39. [Google Scholar]
  34. Freundlich, H. Over the Adsorption in Solution. J. Phys. Chem. 1907, 57, 385–470. [Google Scholar]
  35. Wang, J.; Huang, C.; Allen, H.E.; Cha, D.K.; Kim, D.W. Adsorption Characteristics of Dye onto Sludge Particulates. J. Colloid Interface Sci. 1998, 208, 518–528. [Google Scholar] [CrossRef] [PubMed]
  36. Aranovich, G.L.; Donohue, M.D. A New Approach to Analysis of Multilayer Adsorption. J. Colloid Interface Sci. 1995, 173, 515–520. [Google Scholar] [CrossRef]
  37. Brião, G.D.V.; da Silva, M.G.C.; Vieira, M.G.A.; Chu, K.H. Correlation of type II adsorption isotherms of water contaminants using modified BET equations. Colloids Interface Sci. Commun. 2022, 46, 100557. [Google Scholar] [CrossRef]
  38. Liu, Y. Is the Free Energy Change of Adsorption Correctly Calculated? J. Chem. Eng. Data 2009, 54, 1981–1985. [Google Scholar] [CrossRef]
  39. Corazzari, I.; Nisticò, R.; Turci, F.; Faga, M.G.; Franzoso, F.; Tabasso, S.; Magnacca, G. Advanced physico-chemical characterization of chitosan by means of TGA coupled on-line with FTIR and GCMS: Thermal degradation and water adsorption capacity. Polym. Degrad. Stab. 2015, 112, 1–9. [Google Scholar] [CrossRef]
  40. Eldin, M.M.; Abu-Saied, M.; Tamer, T.; Youssef, M.; Hashem, A.; Sabet, M. Development of polystyrene based nanoparticles ions exchange resin for water purification applications. Desalin. Water Treat. 2016, 57, 14810–14823. [Google Scholar] [CrossRef]
  41. Dotto, G.; Rodrigues, F.; Tanabe, E.; Fröhlich, R.; Bertuol, D.; Martins, T.; Foletto, E. Development of chitosan/bentonite hybrid composite to remove hazardous anionic and cationic dyes from colored effluents. J. Environ. Chem. Eng. 2016, 4, 3230–3239. [Google Scholar] [CrossRef]
  42. Lou, T.; Cui, G.; Xun, J.; Wang, X.; Feng, N.; Zhang, J. Synthesis of a terpolymer based on chitosan and lignin as an effective flocculant for dye removal. Colloids Surf. A Physicochem. Eng. Asp. 2018, 537, 149–154. [Google Scholar] [CrossRef]
  43. Ma, Y.; Zhou, T.; Zhao, C. Preparation of chitosan–nylon-6 blended membranes containing silver ions as antibacterial materials. Carbohydr. Res. 2008, 343, 230–237. [Google Scholar] [CrossRef] [PubMed]
  44. Young, C.W.; DuVall, R.B.; Wright, N. Characterization of Benzene Ring Substitution by Infrared Spectra. Anal. Chem. 1951, 23, 709–714. [Google Scholar] [CrossRef]
  45. Luo, Q.; Zeng, S.; Shu, Y.; Fu, Z.; Zhao, H.; Su, S. A novel green process for tannic acid hydrolysis using an internally sulfonated hollow polystyrene sphere as catalyst. RSC Adv. 2018, 8, 17151–17158. [Google Scholar] [CrossRef] [Green Version]
  46. He, J.; Chen, S.; Huang, H.; Chen, B.; Xiao, X.; Lin, J.; Chen, Q. Novel Anisotropic Janus Composite Particles Based on Urushiol-erbium Chelate Polymer/Polystyrene. Soft Mater. 2015, 13, 237–242. [Google Scholar] [CrossRef]
  47. Fang, J.; Zhang, L.; Sutton, D.; Wang, X.; Lin, T. Needleless Melt-Electrospinning of Polypropylene Nanofibres. J. Nanomater. 2012, 2012, 1–9. [Google Scholar] [CrossRef]
  48. Adibzadeh, S.; Bazgir, S.; Katbab, A.A. Fabrication and characterization of chitosan/poly(vinyl alcohol) electrospun nanofibrous membranes containing silver nanoparticles for antibacterial water filtration. Iran. Polym. J. 2014, 23, 645–654. [Google Scholar] [CrossRef]
  49. Li, W.; Zhang, F.; Wang, W.; Li, Y.; Liu, Y.; Lu, C.; Zhang, Z. Rheological transitions and in-situ IR characterizations of cellulose/LiCl·DMAc solution as a function of temperature. Cellulose 2018, 25, 4955–4968. [Google Scholar] [CrossRef]
  50. Margoshes, M.; Fassel, V. The infrared spectra of aromatic compounds: I. The out-of-plane C-H bending vibrations in the region 625–900 cm−1. Spectrochim. Acta 1955, 7, 14–24. [Google Scholar] [CrossRef]
  51. Karim, M.R.; Aijaz, M.O.; Alharth, N.H.; Alharbi, H.F.; Al-Mubaddel, F.S.; Awual, M.R. Composite nanofibers membranes of poly(vinyl alcohol)/chitosan for selective lead(II) and cadmium(II) ions removal from wastewater. Ecotoxicol. Environ. Saf. 2019, 169, 479–486. [Google Scholar] [CrossRef]
  52. Dewage, N.B.; Fowler, R.E.; Pittman, C.U.; Mohan, D.; Mlsna, T. Lead (Pb2+) sorptive removal using chitosan-modified biochar: Batch and fixed-bed studies. RSC Adv. 2018, 8, 25368–25377. [Google Scholar] [CrossRef] [PubMed] [Green Version]
  53. Zhang, M.; Yin, Q.; Ji, X.; Wang, F.; Gao, X.; Zhao, M. High and fast adsorption of Cd(II) and Pb(II) ions from aqueous solutions by a waste biomass based hydrogel. Sci. Rep. 2020, 10, 3285. [Google Scholar] [CrossRef] [PubMed]
  54. Thommes, M.; Kaneko, K.; Neimark, A.V.; Olivier, J.P.; Rodriguez-Reinoso, F.; Rouquerol, J.; Sing, K.S.W. Physisorption of gases, with special reference to the evaluation of surface area and pore size distribution (IUPAC Technical Report). Pure Appl. Chem. 2015, 87, 1051–1069. [Google Scholar] [CrossRef] [Green Version]
  55. Zhang, B.-L.; Qiu, W.; Wang, P.-P.; Liu, Y.-L.; Zou, J.; Wang, L.; Ma, J. Mechanism study about the adsorption of Pb(II) and Cd(II) with iron-trimesic metal-organic frameworks. Chem. Eng. J. 2020, 385, 123507. [Google Scholar] [CrossRef]
  56. Jnr, M.H.; Spiff, A.I. Effects of temperature on the sorption of Pb2+ and Cd2+ from aqueous solution by Caladium bicolor (Wild Cocoyam) biomass. Electron. J. Biotechnol. 2005, 8, 162–169. [Google Scholar] [CrossRef] [Green Version]
  57. Langmuir, I. The Adsorption of Gases on Plane Surfaces of Glass, Mica and Platinum. J. Am. Chem. Soc. 1918, 40, 1361–1403. [Google Scholar] [CrossRef] [Green Version]
  58. Dong, X.; Yan, Y.; Sun, X.; Li, J.; Han, W.; Shen, J.; Liu, X.; Wang, L.; Zheng, F. Recycling Phosphated Residue for Pb2+ Removal from Wastewater. Environ. Eng. Sci. 2016, 33, 207–214. [Google Scholar] [CrossRef]
  59. Perez, J.P.H.; Folens, K.; Leus, K.; Vanhaecke, F.; Van Der Voort, P.; Du Laing, G. Progress in hydrometallurgical technologies to recover critical raw materials and precious metals from low-concentrated streams. Resour. Conserv. Recycl. 2019, 142, 177–188. [Google Scholar] [CrossRef]
  60. Li, Y.; Zhang, J.; Xu, C.; Zhou, Y. Crosslinked chitosan nanofiber mats fabricated by one-step electrospinning and ion-imprinting methods for metal ions adsorption. Sci. China Ser. B Chem. 2016, 59, 95–105. [Google Scholar] [CrossRef]
  61. Surgutskaia, N.S.; Di Martino, A.; Zednik, J.; Ozaltin, K.; Lovecká, L.; Bergerová, E.D.; Kimmer, D.; Svoboda, J.; Sedlarik, V. Efficient Cu2+, Pb2+ and Ni2+ ion removal from wastewater using electrospun DTPA-modified chitosan/polyethylene oxide nanofibers. Sep. Purif. Technol. 2020, 247, 116914. [Google Scholar] [CrossRef]
  62. Singh, R.; Bhateria, R. Experimental and Modeling Process Optimization of Lead Adsorption on Magnetite Nanoparticles via Isothermal, Kinetics, and Thermodynamic Studies. ACS Omega 2020, 5, 10826–10837. [Google Scholar] [CrossRef] [PubMed]
  63. Zhao, H.; Ouyang, X.-K.; Yang, L.-Y. Adsorption of lead ions from aqueous solutions by porous cellulose nanofiber–sodium alginate hydrogel beads. J. Mol. Liq. 2021, 324, 115122. [Google Scholar] [CrossRef]
Figure 1. Schematic representation of the centrifugal spinning equipment.
Metals 12 01334 g001
Figure 2. SEM images of (a) the EPS nanofibers and (b) the EPS/CS nanofibers produced by centrifugal spinning.
Metals 12 01334 g002
Figure 3. Thermogravimetric analyses for the EPS and EPS/CS nanofibers.
Metals 12 01334 g003
Figure 4. FTIR spectra of the EPS and EPS/CS nanofibers.
Metals 12 01334 g004
Figure 5. Effect of chitosan content in solution on the adsorption of Pb(II). Experimental conditions: t = 240 min, T = 303 K, C0 = 50 mg L−1, pH 5, m = 50 mg and V = 50 mL.
Metals 12 01334 g005
Figure 6. Effect of pH on the adsorption of Pb(II). Experimental conditions: t = 240 min, T = 303 K, C0 = 50 mg L−1, m = 50 mg and V = 50 mL.
Metals 12 01334 g006
Figure 7. Kinetic curves for the adsorption of Pb(II) by EPS/CS nanofibers. Experimental conditions: pH 6, T = 303 K, C0 = 50 mg L−1, m = 50 mg and V = 50 mL.
Metals 12 01334 g007
Figure 8. Isotherm curves for the adsorption of Pb(II) by EPS/CS nanofibers. Experimental conditions: pH 6, m = 50 mg and V = 50 mL.
Metals 12 01334 g008
Figure 9. Reuse potential of the EPS/CS nanofibers for the adsorption of Pb(II). Experimental conditions: T = 303 K, pH 6, m = 50 mg and V = 50 mL.
Metals 12 01334 g009
Table 1. Kinetic parameters for the adsorption of Pb(II) by the EPS/CS nanofibers.
Pseudo First-Order Model (PFO)Pseudo Second Order Model (PSO)
q1 (mg g−1)26.87q2 (mg g−1)27.33
k1 (min−1)0.7925k2 (g mg−1 min−1)0.1001
R2 (%)99.02R2 (%)99.49
ARE (%)2.73ARE (%)1.89
Table 2. Equilibrium parameters for the adsorption of Pb(II) on the EPS/CS nanofibers.
Isotherm ModelTemperature (K)
303313323333
Freundlich
KF ((mg g−1) (mg L−1)−1/nF)0.50040.85772.4592.56
1/nF1.05340.85550.60720.5674
R282.8287.6978.6681.91
ARE (%)35.6127.7430.4125.51
BET
qBET (mg g−1)25.0420.5418.8617.78
KBET1 (L mg−1)0.23650.22621.12460.6508
KBET2 (L mg−1) × 1034.9984.2553.9273.592
R298.2599.0196.8797.76
ARE (%)16.258.8610.869.37
Aranovich-Donohue
qAD (mg g−1)37.3324.0523.1221.72
KL-AD (L mg−1)0.05570.14910.22770.2401
KAD (L mg−1) × 1035.4244.7424.4484.337
n0.63610.69490.63640.5378
RL-AD0.05650.02190.01440.0137
R299.0599.6898.4799.37
ARE (%)11.35857.1720512.8016.42509
Table 4. Thermodynamic parameters for the adsorption of Pb(II) on the EPS/CS nanofibers.
Temperature (K)ΔG0 (kJ mol−1)ΔH0 (kJ mol−1)ΔS0 (kJ mol−1 K−1)
303−27.7538.750.22
313−31.07
323−33.16
333−34.33
Publisher’s Note: MDPI stays neutral with regard to jurisdictional claims in published maps and institutional affiliations.

