Article

Temperature Dependence of Fracture Behavior and Mechanical Properties of AISI 316 Austenitic Stainless Steel

1
CAS Key Laboratory of Nuclear Materials and Safety Assessment Institute of Metal Research, Chinese Academy of Sciences, 72 Wenhua Road, Shenyang 110016, China
2
School of Materials Science and Engineering, University of Science and Technology of China, Shenyang 110016, China
3
Shandong Key Laboratory of Advanced Aluminum Materials and Technology, Binzhou 256606, China
*
Authors to whom correspondence should be addressed.
Metals 2022, 12(9), 1421; https://doi.org/10.3390/met12091421
Submission received: 13 July 2022 / Revised: 20 August 2022 / Accepted: 23 August 2022 / Published: 28 August 2022

Abstract

:
A combination of fractographic and metallographic analysis during tensile tests over the temperature ranging from 20 °C to 750 °C were carried out to investigate the fracture behaviors and deformation modes so as to clarify the temperature dependence of mechanical properties of AISI 316 austenitic stainless steel. Planar slip mode of deformation was observed during tensile tests at 20 °C due to a relatively low SFE (stacking fault energies). Pronounced planar slip characteristics were observed in the range of 350–550 °C, and the resultant localized deformation led to the formation of shear bands. The dislocation cross-slip was much easier above 550 °C, leading to the formation of cell/subgrain structures. The preferential microvoid initiation and subsequent anisotropic growth behavior in the shear bands led to large-size and shallow dimples on the fracture surfaces in the range of 350–550 °C. However, the microvoid tended to elongate along the tensile direction in the localized necking region above 550 °C, resulting in small-size and deep dimples. The shear localization reduced the uniform deformation ability and accelerated the fracture process along shear bands, leading to a plateau in uniform elongation and total elongation in the range of 350–550 °C. The higher capability to tolerate the localized deformation through sustained necking resulted in a significant increase in the total elongation above 550 °C.

1. Introduction

Austenitic stainless steels such as AISI types 304 and 316 steels are widely used in the light water nuclear reactors including the pressure boundary piping of boiling water reactors and the primary circuit of pressurized water reactors due to their superior mechanical properties and excellent corrosion resistance [1,2,3]. Since 2000s, the advanced fourth-generation nuclear reactors with the additional improvements in safety and reliability, sustainability, proliferation resistance, and profitability are under development in many countries [4,5,6,7,8], which in turn presents challenges to the material selection. Austenitic stainless steels are also the candidate structural materials for the out-of-core components in the fourth-generation nuclear reactors because of their good industrial feedback, and decades of experience and data in the light water reactors [9,10,11,12,13,14,15,16]. However, the harsh operating environment including higher operating temperature and long time operation leads to the degradation of mechanical properties [17], which will ultimately affect the safe operation of the fourth-generation nuclear reactors.
For the commercial light water reactors with operation temperatures below 350 °C, a stable austenitic microstructure without phase precipitation is maintained in the austenitic stainless steel during the current 30 years of design lifetime expectancy [18]. Upon exposure at higher operating temperature (above 550 °C under normal conditions) in the fourth-generation nuclear reactors, carbides (M23C6 and M6C) tend to precipitate in the matrix and along grain boundaries, and additional precipitation of intermetallic phases (σ, χ, and η) takes place for the prolonged exposure to 60 years of design lifetime expectancy [18,19,20,21,22]. The precipitated carbides and intermetallic phases are usually considered as the obstacles to the dislocations motion during deformation so as to change the deformation behaviors. Furthermore, dislocation evolution during deformation is directly correlated with the stacking fault energies (SFE) [23]. Studies found that the higher operating temperature usually resulted in a higher value of SFE according to experimental measurements and first principles calculations [24,25,26]. Researchers try to explain the observed/calculated temperature dependence of SFE based on thermodynamic consideration and electron theory [26,27], but the mechanism has not been firmly established. In addition, the diffusivity of interstitial and substitutional atoms is enhanced with an increase in the operating temperature. As a result, the interaction between solute atoms and dislocations could affect the dislocation motion, which might be responsible for the dynamic strain ageing (DSA) phenomenon. DSA is reported to appear within a specific temperature range in the austenitic stainless steel, which corresponds with the service temperature of the advanced fourth-generation nuclear reactors. Studies generally focus on the mechanism of DSA based on the serrated flow characteristic [28,29,30,31] and effective activation energy calculation [29,30,31,32,33,34,35,36,37]. A distinct change in the tensile properties is found in the DSA temperature range, as manifested by the tensile strength plateau and the ductility minima [38,39,40,41,42,43,44]. However, the fracture behavior and deformation mode in the temperature range are still controversial [38,45,46,47,48]. S.L. Mannan et al. [49] found that the occurrence of intergranular fracture was responsible for the ductility minima in the DSA temperature range. However, B.K. Choudhary [34] found that the fracture mode remained transgranular in the range of 27 °C to 850 °C in type 316L (N) steel, which was attributed to the fact that the presence of nitrogen reduced the tendency of grain boundary sliding. Besides, transgranular fractures are observed in the DSA temperature range in 316L steel [46]. Michel [45] found that the deformation mode was dominated by a wavy slip in the range of 204–593 °C in the 316 stainless steels. However, Hong [46] and Karlsen [38] found that the deformation mode of 316 stainless steel was dominated by planar slip from 250 °C to 550 °C under the influence of DSA.
In the present study, tensile tests in the temperature range of 20–750 °C of the AISI 316 austenitic stainless steel were carried out. The temperature dependence of fracture behavior was studied in detail to reveal its relation with the mechanical properties.

2. Experimental

2.1. Material

The experimental material was the AISI 316 austenitic stainless steel, which was supplied as a 40 mm thick hot-rolled plate. The plate was subjected to the final solution treatment at 1080 °C for 50 min followed by water quenching. The chemical compositions are given in Table 1.

2.2. Mechanical Test

Tensile specimens with the gauge section of 5 mm in diameter and 25 mm in length were machined out from the center of the 40 mm-thick plate perpendicular to the rolling direction. Tensile tests were carried out on an RDL-50 mechanical testing machine (Changchun Research Institute for Mechanical Science) with a constant cross-head speed of 2 mm/min at 20, 350, 450, 550, and 750 °C, respectively. A three-zone resistance-type furnace which controlled temperature within a range of 1 °C at steady state was used. Before starting the tensile tests, specimens were held at each test temperature in the furnace for 15 min to achieve a steady-state temperature distribution. After rupturing, the tensile specimen was quickly cooled to prevent the dislocation recovery during subsequent cooling. What is more, dog-bone shaped tensile specimens with the gauge dimension of 22 mm × 4 mm × 2 mm were prepared for the surface slip morphology observation. The specimens were mechanically polished before the tensile tests, and each test was deliberately interrupted at the pre-selected strain to observe the surface morphology.

2.3. Microstructural Characterization

Microstructures of the samples before and after tensile tests were characterized by optical microscopy (Olympus GX51, Tokyo, Japan) and FEI XL30 (Hillsboro, OR, USA) scanning electron microscopy (SEM). The dimple depth was evaluated by laser scanning confocal microscope (LSCM) via the topographical and linear measurements in a Zeiss LSM 700 (Oberkochen, Germany) with the step height of 1 μm. Thin foils for transmission electron microscopy (TEM) observations were cut from the cross section of the fractured samples and prepared by twin-jet electro-chemical polishing in a 10 vol% perchlorate alcohol solution at 20 V and −20 °C, then examined on a FEI Technai G220 (Hillsboro, OR, USA) TEM operated at 200 kV. The samples for the electron backscatter diffraction (EBSD) experiment were vibratory polished to remove the deformation layer on the top surface. EBSD maps were obtained using a Zeiss FE-SEM (Oberkochen, Germany) with the step size of 0.1 µm, and EBSD data were analyzed with the HKL Channel 5 (Oxford Instruments, Abingdon, Oxfordshire) software.

2.4. Calculation

The SFE of AISI 316 austenitic stainless steel was calculated by the empirical formula [50]:
SFE (mJ∙m−2) = 2.2 + 1.9Ni − 2.9Si + 0.77Mo + 0.5Mn + 40C − 0.016Cr − 3.6N,
The strain hardening exponent (n) used to describe the work hardening behavior was calculated according the following equation:
n = d ( ln σ ) d ( ln ε )
The instantaneous hardening exponent remained nearly stable during the uniform deformation in the strain range of 0.1–0.4, and the average strain hardening exponent was obtained.

3. Results

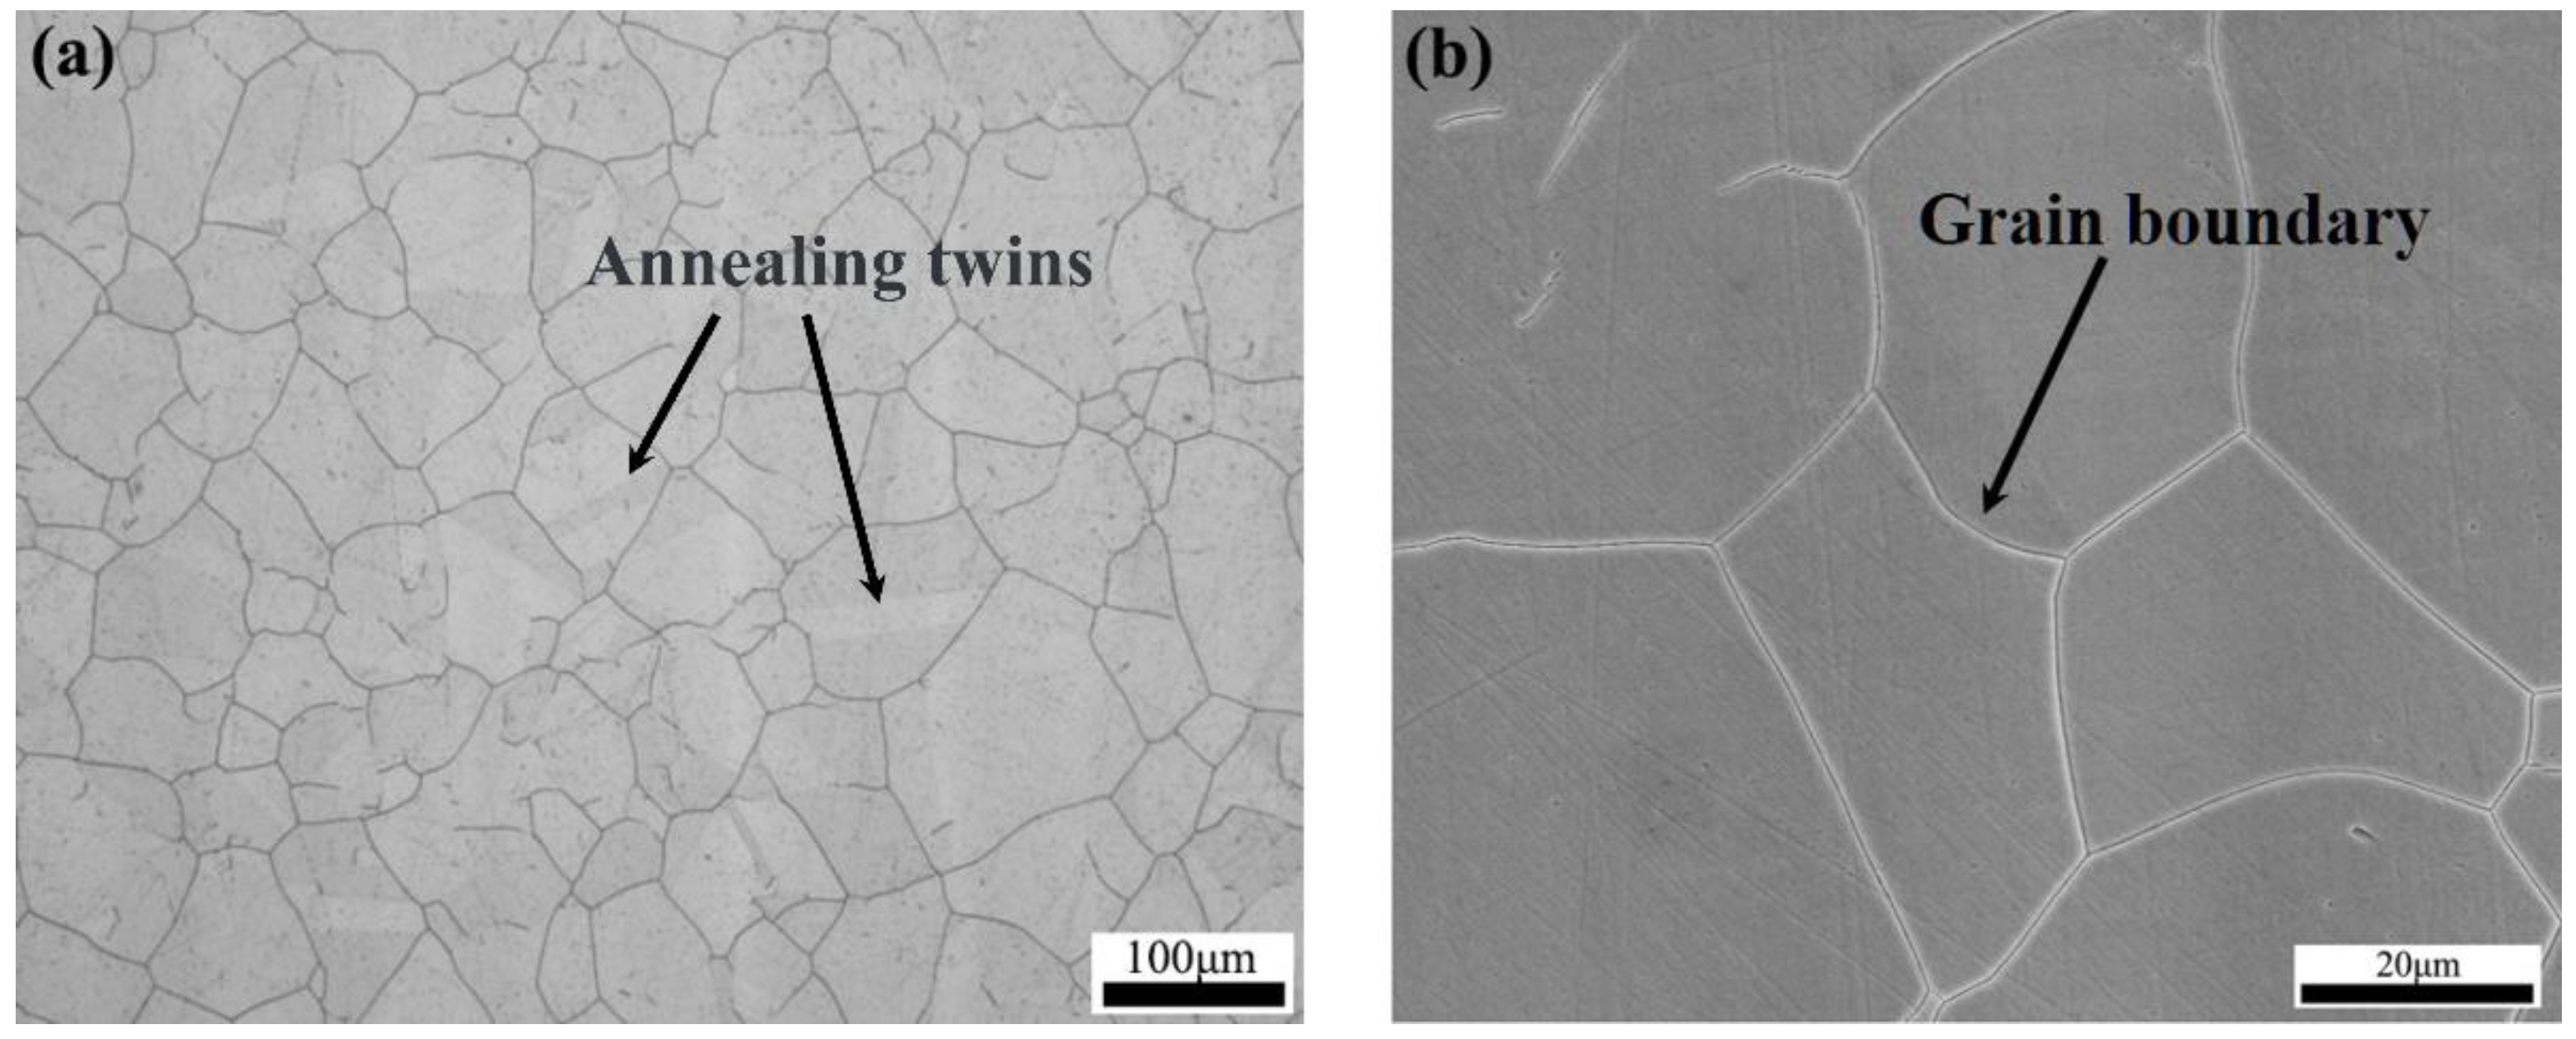
3.1. Initial Microstructures

Figure 1 shows the microstructure of the solution-treated AISI 316 plate. As shown in the optical micrograph of Figure 1a, the typical austenitic microstructures consisting of equiaxed grains and a large number of annealing twins inside many grains were observed. The average grain size measured by the linear intercept method was ~95 μm. The solution-treated plate was nearly free of δ-ferrite (<1%). Further SEM micrographs showed that precipitates were not observed at the grain boundaries and inside grains in the solution-treated condition (Figure 1b).

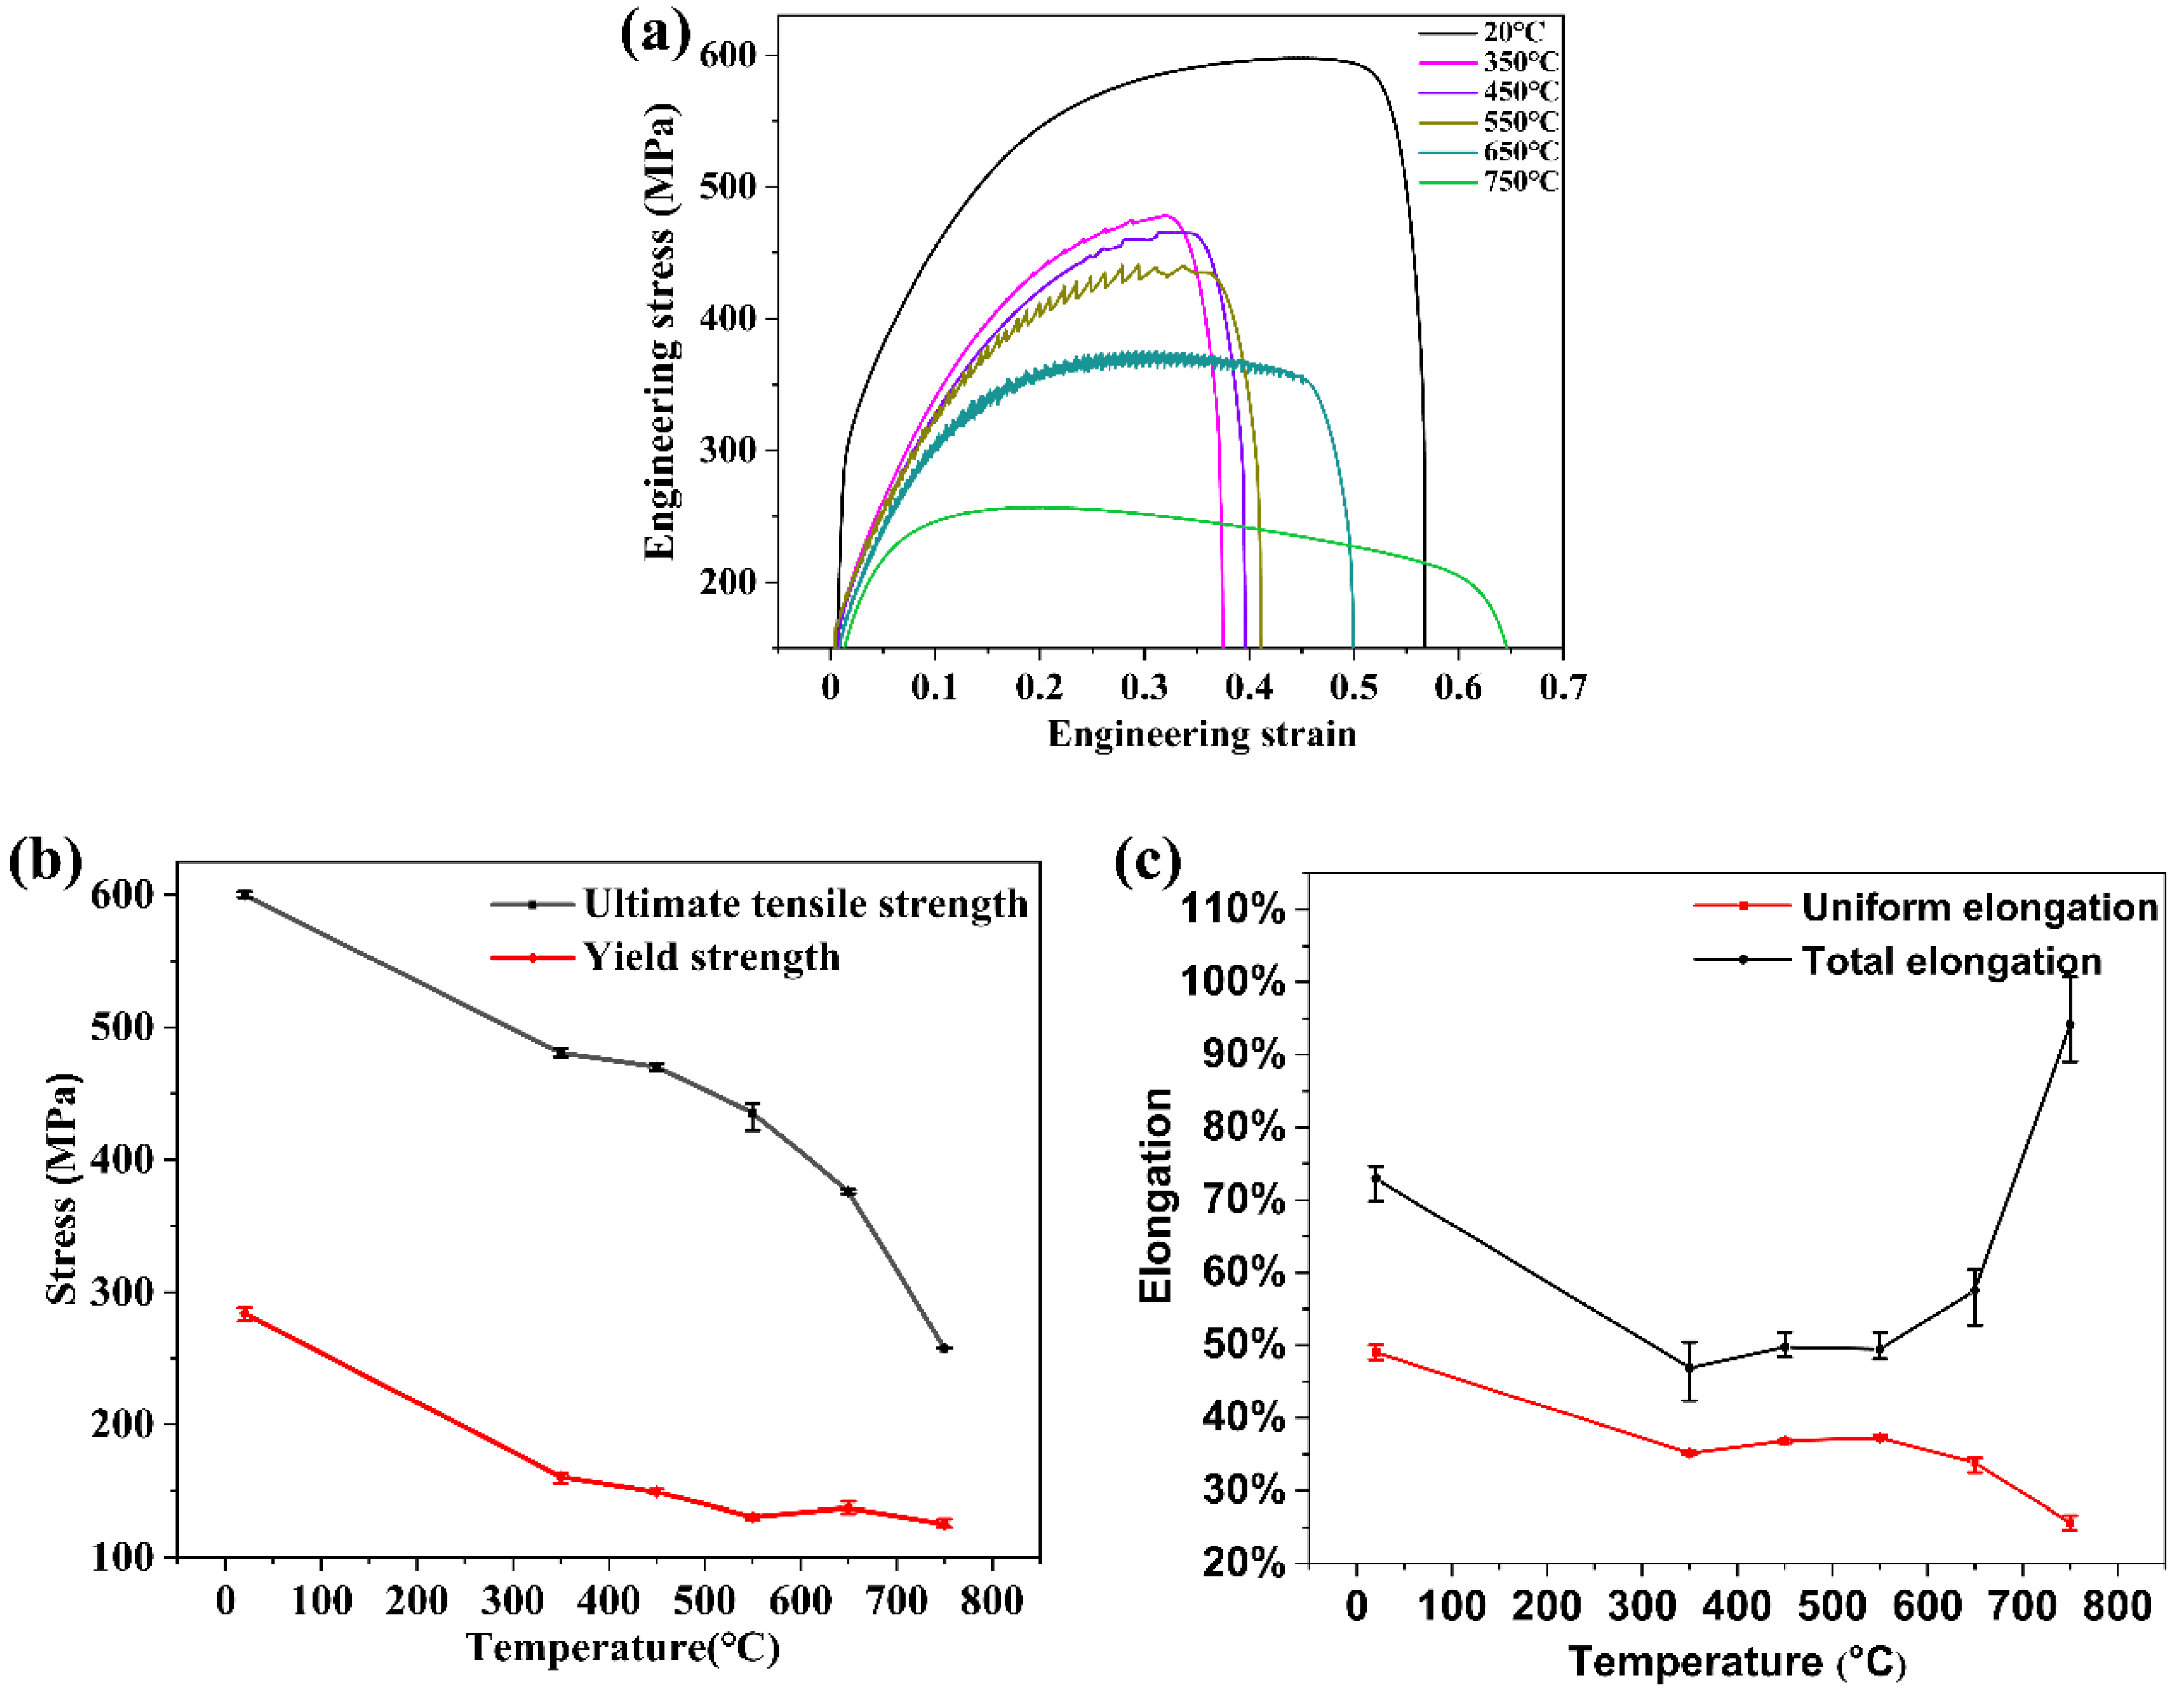
3.2. Tensile Properties
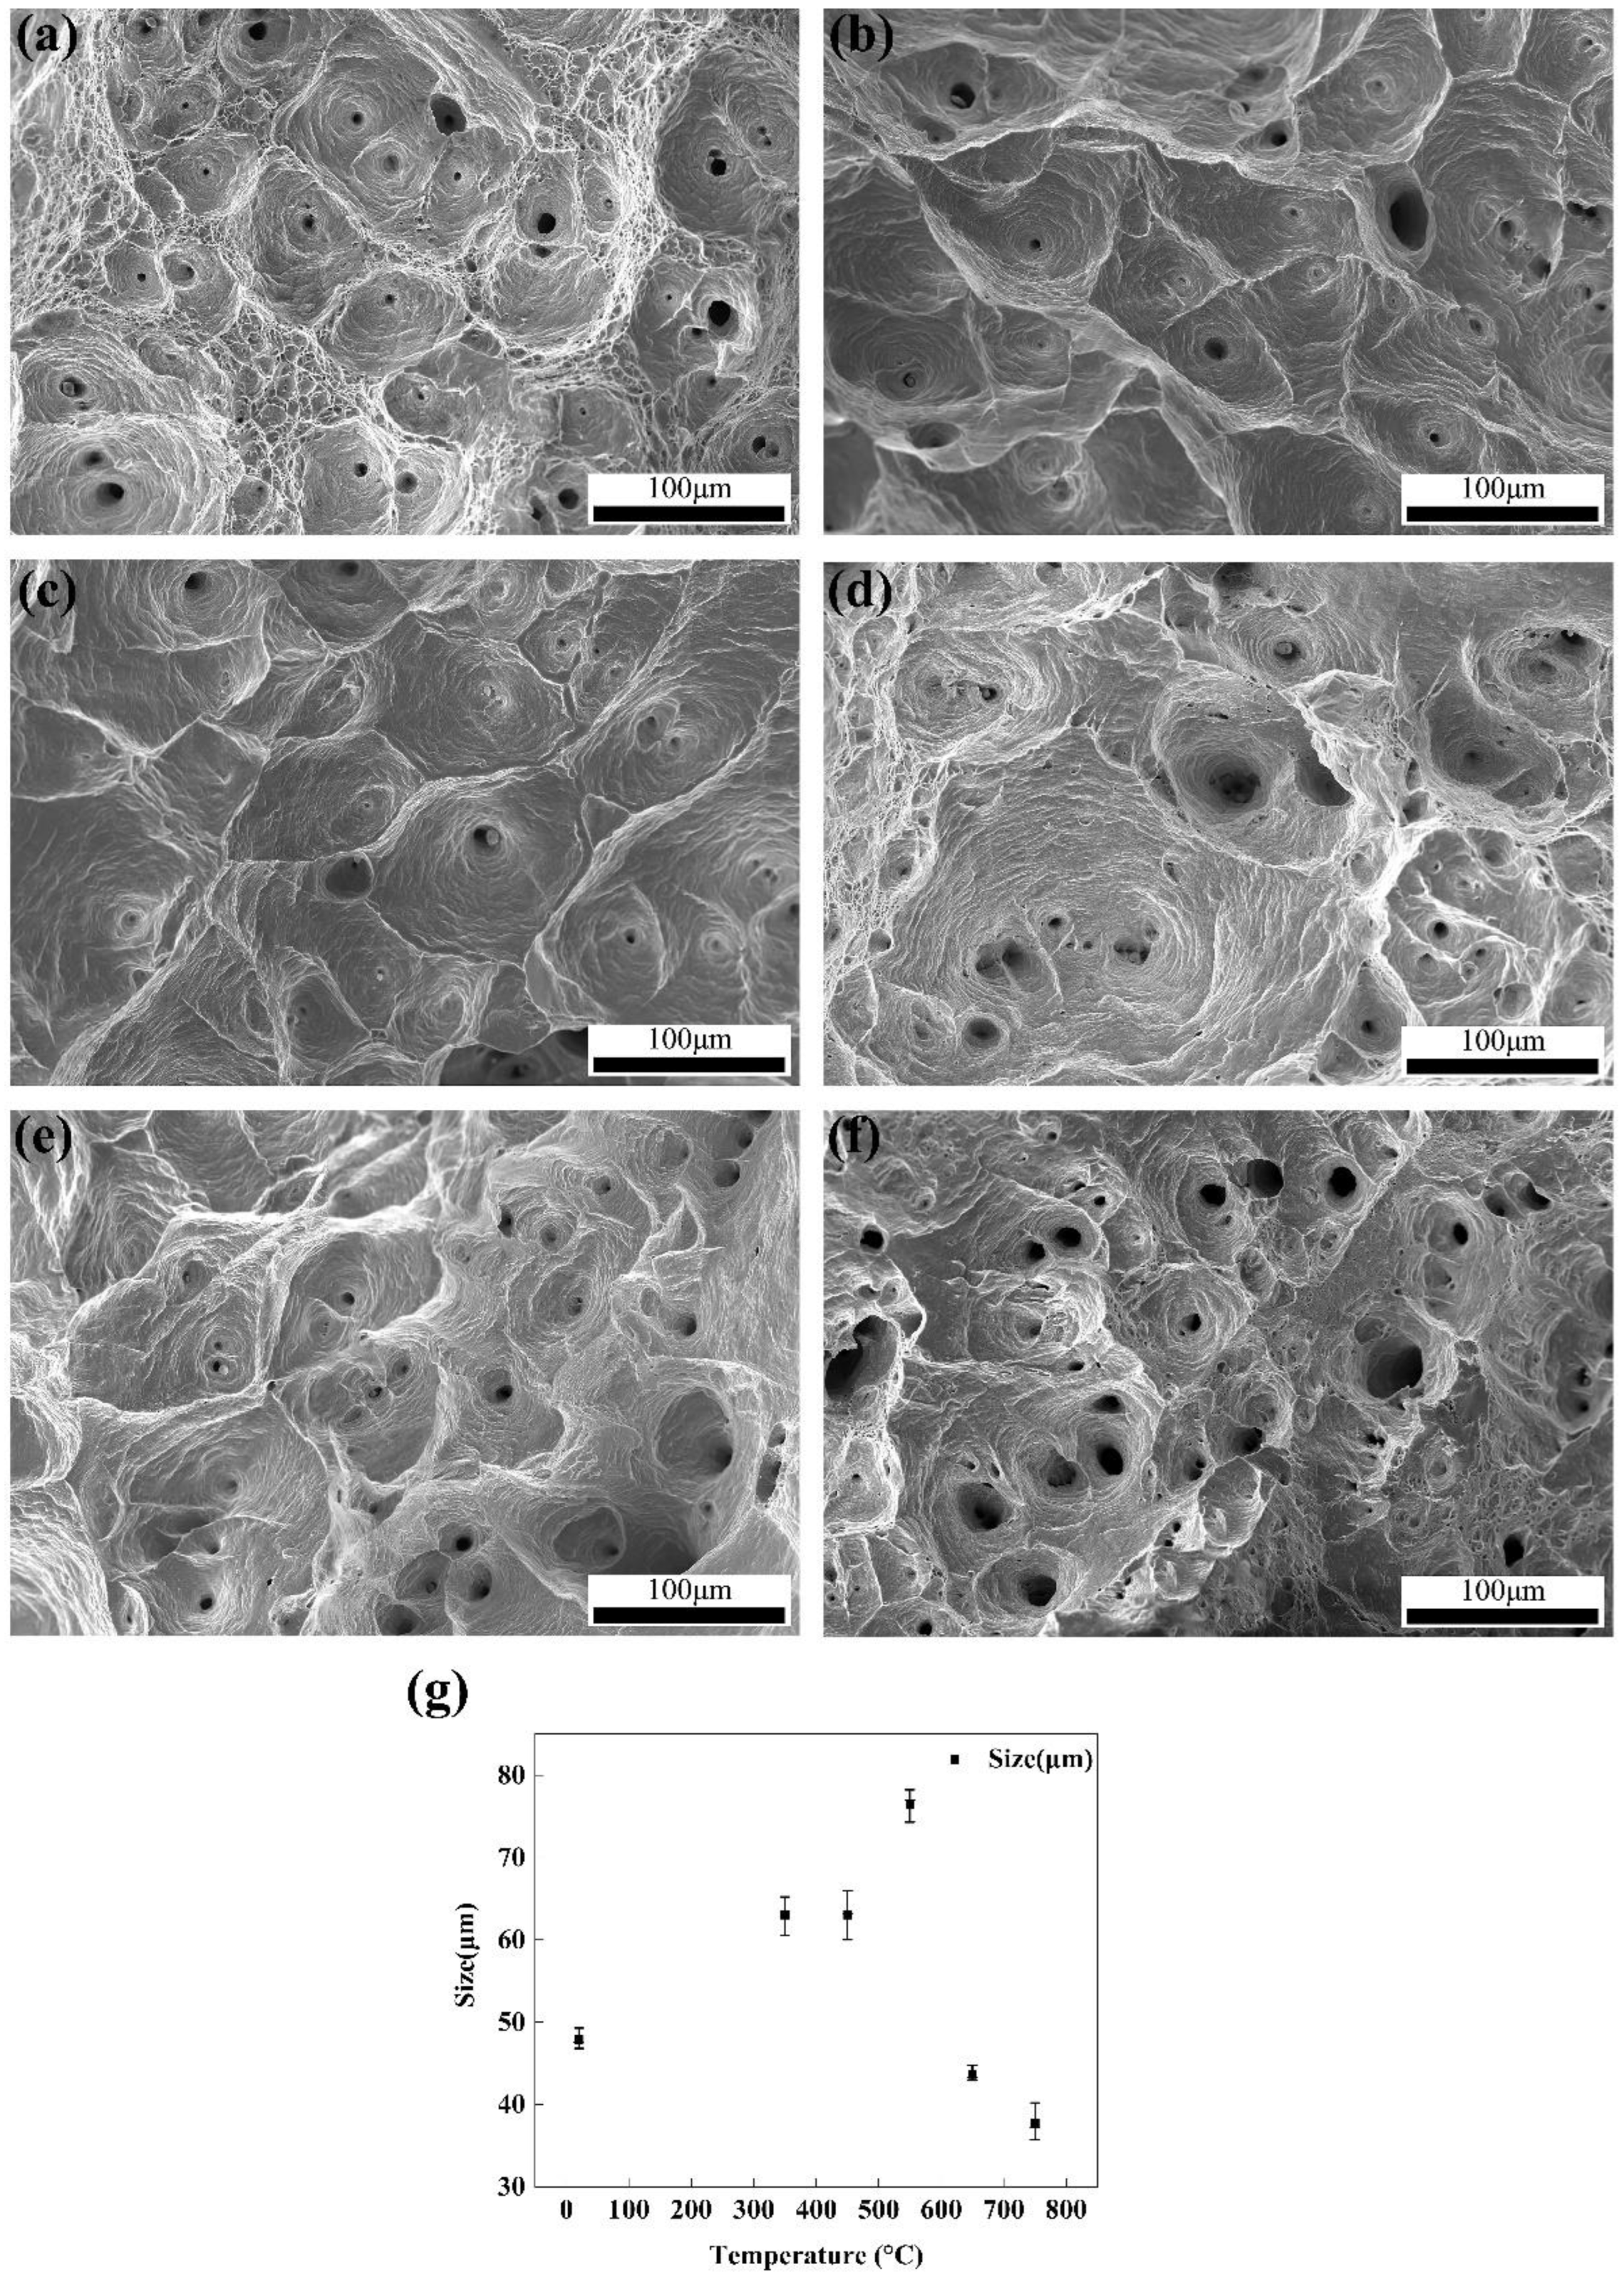
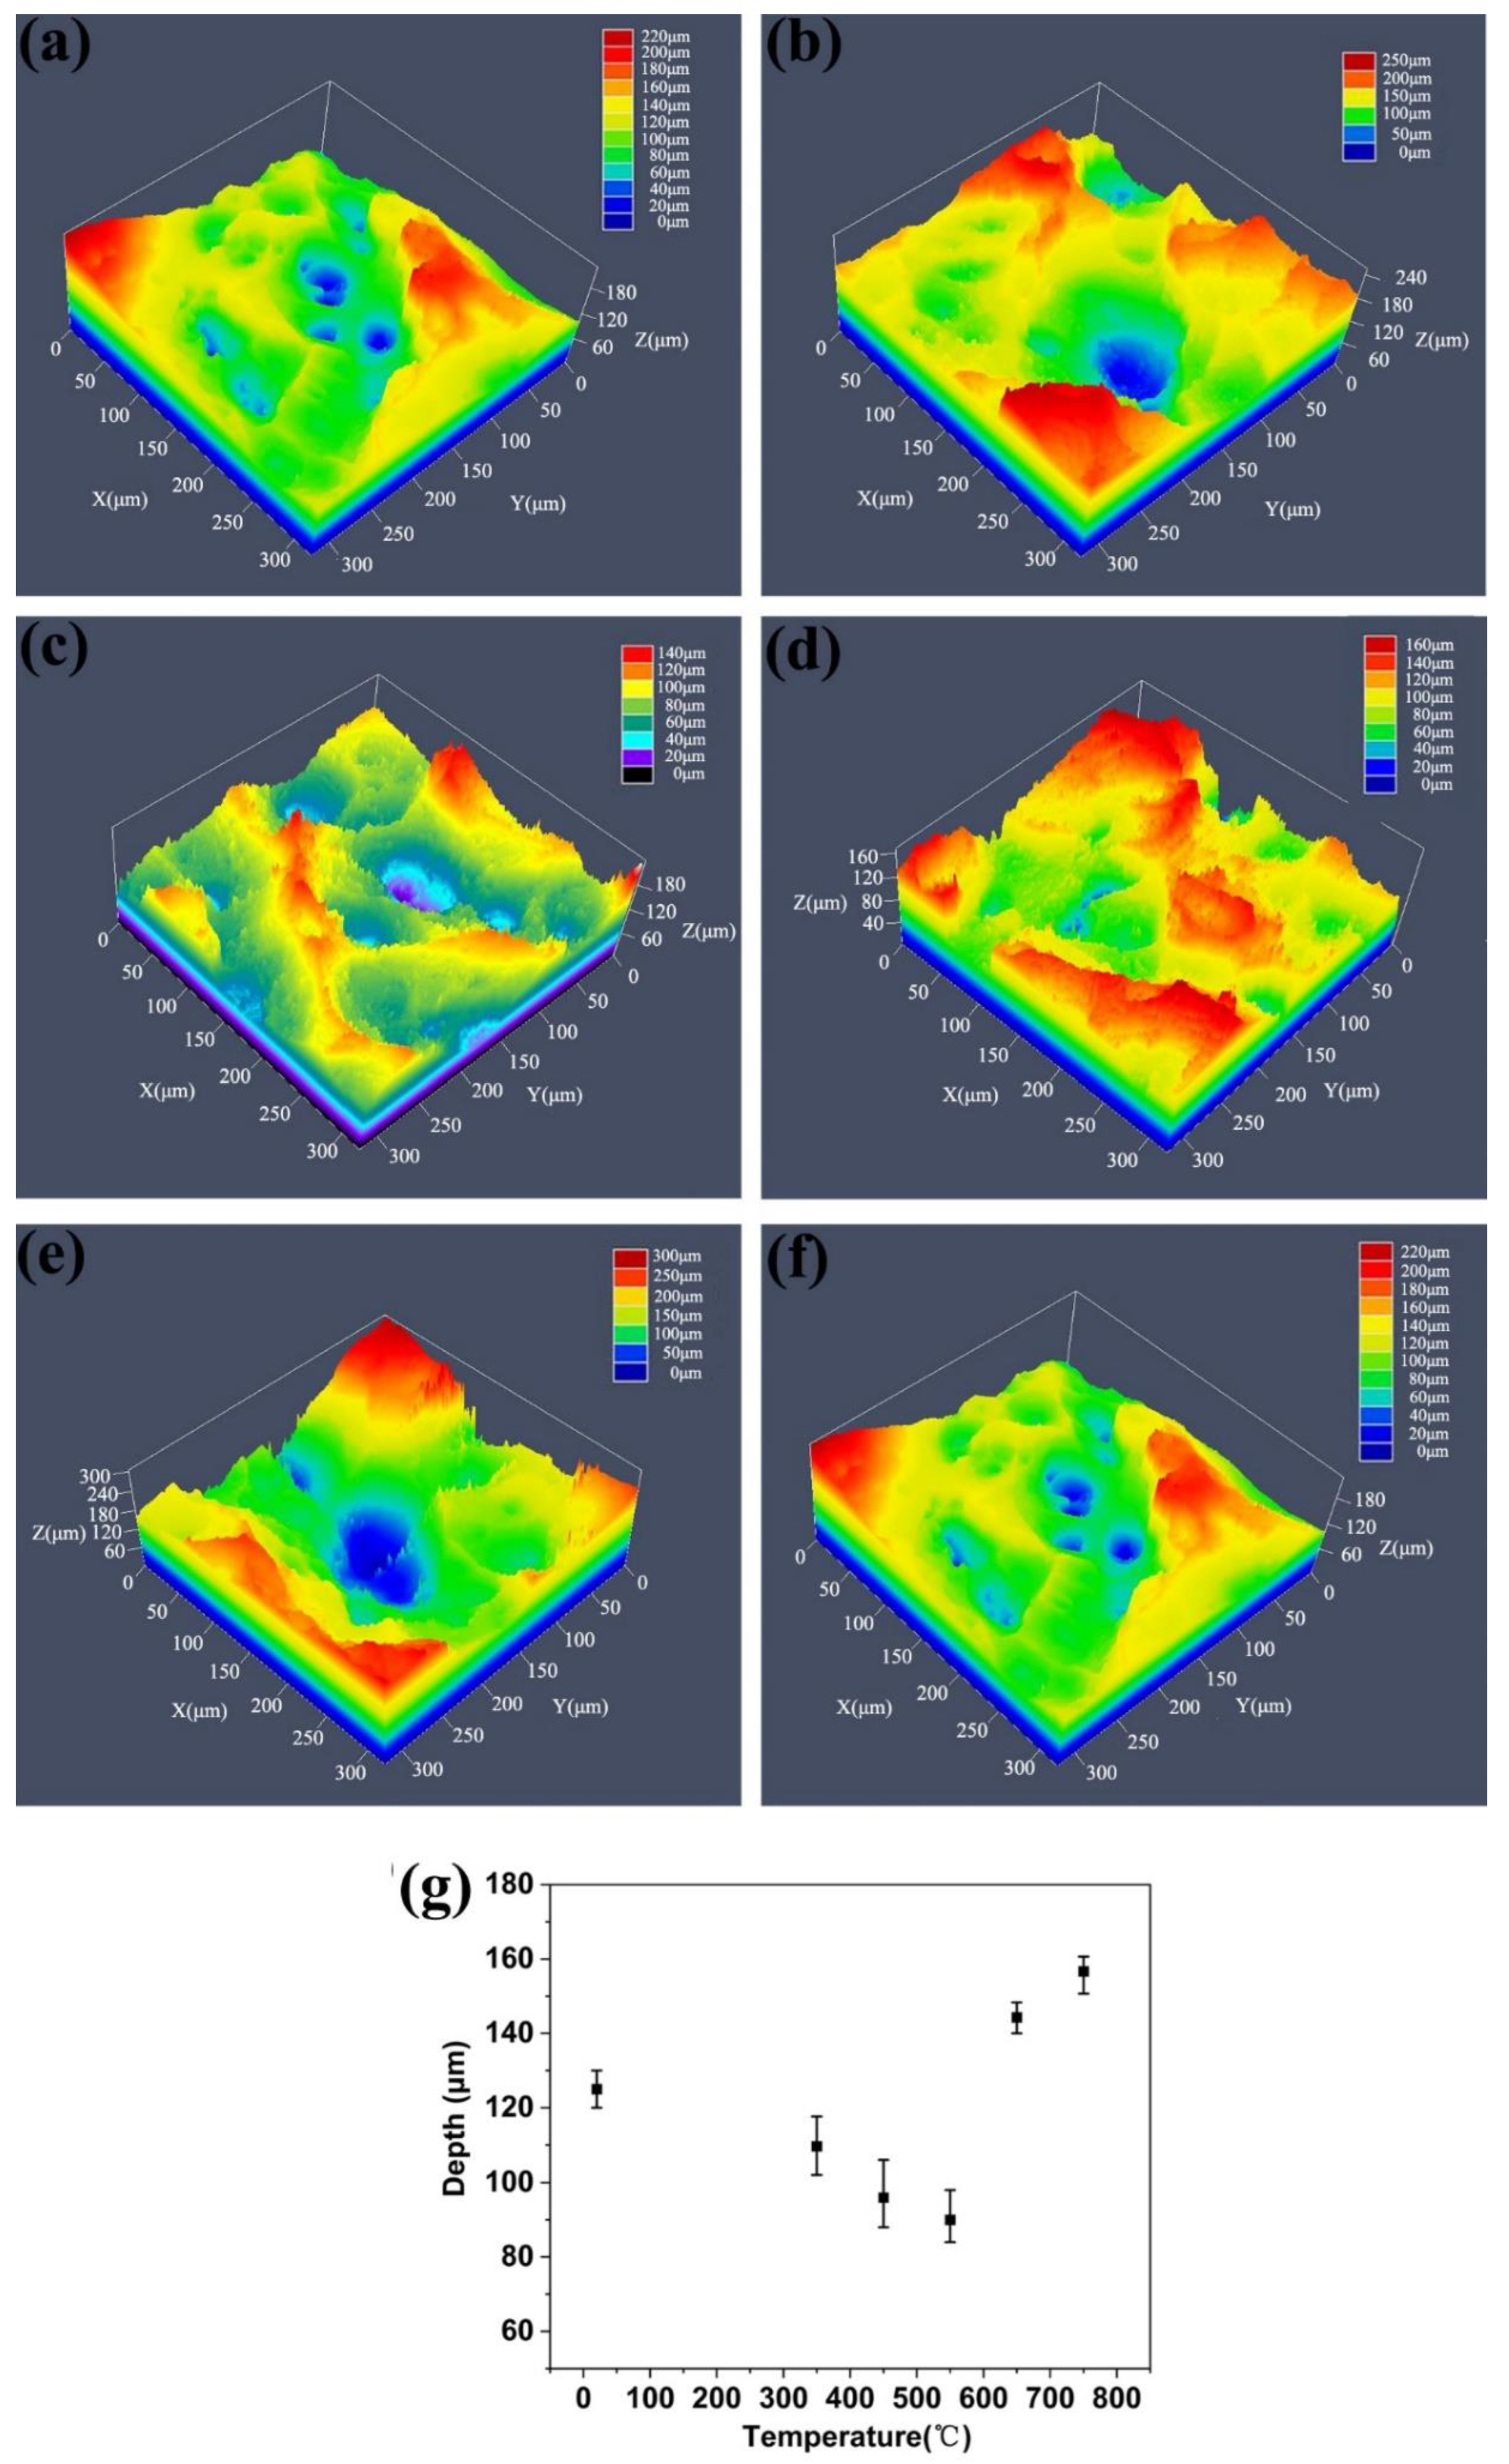
The tensile stress–strain curves at the temperature ranging from 20 °C to 750 °C are shown in Figure 2a. Smooth tensile curves were observed at 20 °C and 750 °C, while serrated tensile curves were observed in the temperature range of 350–650 °C. The variations of yield strength (YS), ultimate tensile strength (UTS), and ductility as a function of test temperature are shown in Figure 2b,c. As shown in Figure 2b, the YS was found to decrease gradually as the test temperature increased from 20 °C to 750 °C. However, the temperature dependence of UTS exhibited a plateau in the temperature range of 350–550 °C, and the UTS was in the range of 436~480 MPa. Beyond this temperature range, the UTS decreased remarkedly with increasing temperature, i.e., the UTS decreased from 600 MPa at 20 °C to 480 MPa at 350 °C, and the UTS was lowered by 178 MPa from 550 °C to 750 °C.
The total elongation did not exhibit a clear temperature dependence, as shown in Figure 2c. A negative temperature dependence of the total elongation was observed from 20 °C to 350 °C, i.e., the total elongation experienced a decrease from 73% to 47%. Minima of total elongation were seen in the intermediate temperature range of 350–550 °C. A positive temperature dependence of the total elongation was found at higher temperatures, showing an increase from 49% to 94% as the temperature increased from 550 °C to 750 °C. However, the uniform elongation showed a rapid decrease from 20 °C to 350 °C followed by a plateau in the intermediate temperature range of 350–550 °C, and a further decrease at higher temperatures.

3.3. Fractography

The fracture surfaces of specimens tested at different temperatures are shown in Figure 3. The typical “cup and cone” type of fracture was observed in the entire temperature range. SEM images show that the fracture surface was characterized by ductile dimples (Figure 3a–f). The dimple sizes as the function of test temperature were estimated via Image-Pro Plus software, as shown in Figure 3g. The mean dimple size increased from 48 μm at 20 °C to 74 μm at 550 °C and then decreased to 43 μm at 750 °C. Meanwhile, the dimple depths as the function of test temperature were measured via LSCM due to its high lateral and axial resolution imaging of rough surfaces with large differences in heights. Three-dimensional (3D) views of the fracture surface are shown in Figure 4a–f. The changes in the dimple depth as a function of tensile temperature were obtained (Figure 4g). The mean dimple depth decreased from 125 μm at 20 °C to 90 μm at 550 °C and then increased to 157 μm at 750 °C. Based on the quantitative analysis of fractography through the combination of SEM and LSCM, large-size and shallow dimples were present in the intermediate temperature range of 350–550 °C while small-size and deep dimples were found at 20 °C and above 550 °C.
Figure 5 shows the microstructure of the longitudinal sections near the fracture surface of specimens tested at different temperatures. It can be found that the grains were elongated along the tensile direction after test in the range of 20–750 °C. However, test temperature could present significant effects on the susceptibility to shear localization. Well-defined shear bands were formed after testing in the intermediate temperature range of 350–550 °C (Figure 5b,c), while shear bands were not available at 20 °C and above 550 °C (Figure 5a,d). The detailed insight into the shear bands shows that micro-cracks formed along the shear bands (inset in Figure 5b,c).

3.4. Microstructure Evolution during Tensile Test

Figure 6 shows the microstructure of the specimens after tensile at different temperatures. According to Figure 6a,b, no precipitates were observed by SEM observation at 20 °C and 550 °C. However, numerous particles were found to precipitate at the grain boundaries at 750 °C, as shown in Figure 6c, which are identified as M23C6-type carbides according to the corresponding selected area electron diffraction (SAED) pattern (the inset in Figure 6d). TEM imaging showed that rod-like particles precipitated at the grain boundaries and no precipitates were found within grains (Figure 6d). The mean size of the rod-like particles along their long axis was ~300 nm.
Figure 7 shows the TEM micrographs of dislocation structures near the fracture area after testing at 20 °C, 350 °C, 550 °C, and 750 °C respectively. Planar dislocation structures were observed after test in the range of 20–550 °C (Figure 7a–c), showing that dislocations tended to glide on particular planes during deformation. The spacing between glide planes was irregular after testing at 20 °C, and the measured maximum spacing was ~1.47 μm (Figure 7a). As the test temperatures increased, the spacing between glide planes was of remarkable regularity and the spacing significantly decreased (Figure 7b,c). The mean spacing was ~0.47 μm and ~0.34 μm after testing at 350 °C and 550 °C. By contrast, the dislocation structures profoundly changed as the test temperature increased to 750 °C, showing that dislocation cells and subgrains were formed (Figure 7d).
In order to reveal the degree of slip planarity from 20 °C to 550 °C, surface slip traces were observed after tensile deformation to the engineering strain of 0.25 at 20 °C, 350 °C, and 550 °C, respectively, as shown in Figure 8. As the test temperature increased, the surface slip waviness was found to decrease. After deformation at 550 °C, sharp and straight slip lines were present (Figure 8c), showing a greater tendency for planar slip.

4. Discussion

4.1. Effect of Temperature on Deformation Mechanism

In the austenitic stainless steels, stacking fault energy (SFE) is known to play an important role in the plastic deformation behavior, which is related to the material component and test condition [51,52]. The calculated SFE of the present AISI 316 austenitic stainless steel is 28.68 mJ∙m−2 [50]. It was found that planar dislocation structures were produced during tensile deformation at 20 °C (Figure 7a), because the relatively low SFE led to wider extended dislocations with reduced abilities to combine to form screw dislocations to cross-slip onto other slip planes. Planar slip characteristics were also reported in the 316 and 316LN austenitic stainless steels after tensile testing at 20 °C [38,46].
Investigations on the temperature dependence of the SFE showed that SFE increased with increasing temperature [24,25,26]. For example, when the temperature increased from 27 to 627 °C, the SFE of the 316L austenitic stainless steels containing 10 at% Ni increased from 10 mJ∙m−2 to 60 mJ∙m−2 [24]. As the test temperature increases, the higher SFE leads to a reduction in the width of extended dislocation, which would suppress the planar dislocation glide. However, TEM microstructures near the fracture area revealed that planar dislocation characteristics were more pronounced after test at 350 °C and 550 °C compared with the dislocation morphologies at 20 °C (Figure 7a–c). As the test temperature increased, specimens surface slip waviness was found to decrease, showing a greater tendency for planar slip (Figure 8). It is concluded that the SFE changes due to temperature variation are not a critical factor for the degree of slip planarity increase. On the contrary, the occurrence of serrated flow in the tensile curves in the range of 350–550 °C represents the manifestation of DSA (Figure 2a). Based on the effective activation energy, the interaction of interstitial atoms with mobile dislocation was reported to responsible for the DSA in the intermediate temperature regime [28,29,30,32,33,34,35,36]. The interaction between mobile dislocations and the solute atmosphere restricts the cross slip of dislocations. The reduced freedom of cross-slip will lead to the localized deformation along the most active slip planes, which might be responsible for the pronounced planar slip at 350–550 °C.
As the test temperature further increased, DSA did not occur, as manifested by the disappearance of serrations flow during test at 750 °C (Figure 2a). Meanwhile, the SFE increased with increasing temperature, which made cross-slip easier. Cross-slip is very critical in the arrangement and annihilation of screw dislocations. Stochastic dislocation dynamics demonstrated that cell structures are facilitated by the cross slip of screw dislocations [53]. Therefore, the cross-slip of screw dislocations at 750 °C contributes to enhanced dynamic recovery, and dislocations generated during deformation can arrange themselves into dislocation cell structures or subgrains. The dislocation cells gradually develop into subgrains through the recovery of dislocations, which is evidenced by the low dislocation density within the subgrains.

4.2. Temperature Dependence of Strength

Yield stress is a combination of the frictional stress (σfr) and various incremental strengthening contributions, such as those due to the initial dislocation density (Δσρi), solid solution hardening (Δσss), precipitate hardening (Δσppt), and grain boundary (Hall–Petch) strengthening (Δσgb) [54]:
σ Y S = σ f r + σ s s + σ p p t + σ g b + σ ρ i
Firstly, the tensile specimens were machined from the same location of the solution-treated plate, so the concentrations of the interstitial and substitional species and the dislocation density were nearly the same. It is reasonable to assume that the contributions of solid solution hardening and initial dislocation density to the yield strength are almost the same for the tensile test in the range of 20–750 °C. Secondly, the frictional stress (σfr) is related to the intrinsic lattice resistance to dislocation motion, which is referred to as Peierls stress (σp). The temperature dependence of the Peierls stress (σp) is given by ref [54] as follows:
σ p = 2 G 1 v exp [ 2 π w 0 b ( 1 + α T ) ]
where G is the shear modulus, ν is Poisson’s ratio, ω0 is the dislocation width, b is the magnitude of the Burgers vector, and T is the temperature. α is a positive constant. It is suggested that σp showed an exponential decrease relation with increasing temperature. Thirdly, no obvious grain growth was detected during test in the range of 20–750 °C (Figure 6). Investigations showed that the grain boundary strength decreased with an increase in the temperature [55]; therefore, the contribution of grain boundary strengthening (Δσgb) decreases with increasing temperature. Lastly, precipitates were not present in the solution-treated AISI 316 steel, and occurrences of precipitation were not observed after test in the range of 20–550 °C (Figure 6a,b). When the test temperature was higher than 550 °C, precipitation of discrete intergranular M23C6 carbides occurred (Figure 6c). The contribution of precipitate hardening (Δσppt) from the discrete intergranular M23C6 carbides was very limited and could be neglected. It is concluded that the decreased yield strength with increasing temperature in the range of 20–750 °C is determined by the temperature dependence of Peierls stress and grain boundary strengthening.
During tensile test, the flow stress depends on the yield stress and the incremental work hardening with accumulated strain. The work-hardening behavior is directly correlated with the evolution of dislocation microstructure, which is generally determined by the SFE. It was found that work-hardening ability was roughly inversely proportional to the SFE in the austenitic stainless steels [56]. The SFE of the AISI 316 steel increased with the increasing test temperature, and it was deduced that the work-hardening ability should gradually decrease from 20 °C to 750 °C. As shown in Figure 9, the variation of the average strain-hardening exponent with test temperature reveals that the strain hardening exponent slightly increased up to 550 °C and significantly dropped above 550 °C, which is not consistent with the aforementioned SFE controlled work-hardening mechanism. Analysis on the temperature dependence of deformation behavior showed that planar slip characteristics were observed after testing in the range of 20–550 °C and pronounced planar slip behaviors resulted at 350–550 °C. As the moving dislocations are pinned by solute atmosphere in the DSA temperature region, dislocation multiplication before the depinning increases the increment of dislocation density per strain, which contributes to the increase in work-hardening rate. In addition, the resultant planar-slip dislocation structures with cumulative strain can act as the effective obstacles to dislocation movement, which further lead to a higher work-hardening ability [57]. The enhanced work-hardening ability phenomenon associated with DSA is also observed in the Fe-Mn-C austenitic stainless steel [58]. Therefore, the much higher work-hardening ability led to the UTS plateau in the temperature range of 350–550 °C (Figure 2b). At higher temperatures, the more favorable dislocation cross-slip significantly contributed to the enhancement of dislocation mobility. The occurrence of dynamic recovery accelerated the dislocation annihilation, which is responsible for the decreased work-hardening ability. As a consequence, a significant reduction in the UTS was present as the test temperature was above 550 °C (Figure 2b).

4.3. Temperature Dependence of Ductility

As discussed above, the much higher work-hardening ability is present in the range of 350–550 °C, which is usually related to the higher uniform elongation according to Considere’s criterion [59,60]. However, the elongation minima were seen in the temperature range of 350–550 °C (Figure 2c), and the corresponding fracture surfaces were covered with the large-size and shallow dimples (Figure 3b–d). As in Section 4.1, localized deformation along the most active slip planes was promoted in the temperature range of 350–550 °C, which is demonstrated by the observed slip bands and surface slip traces along specific crystallographic directions within grains (Figure 7 and Figure 8). When the favorable crystallographic slip propagated into the adjacent grains by cooperative slip, the spread of shear localization over the entire cross-section of the specimens resulted (Figure 5b,c). Eventually, the macroscopic shear bands were observed in the range of 350–550 °C (Figure 5b,c). It is well known that the FCC metals have four {111} slip planes, which is the most active slip system. Microstructural observations of the longitudinal sections near the fracture surface revealed the presence of multiple shear bands, and the measured angle between the two directions was about 70 degrees (Figure 5b), which is almost consistent with the angle between {111} slip planes. As shown in the inset of Figure 5b,c, microcracks were found to be easily initiated inside the shear bands, which may be due to the extreme localization of dislocations within. The strain map near the shear bands obtained by the EBSD local misorientation component revealed that higher strain concentrations were present inside the shear bands, as shown in Figure 10. The presence of macroscopic shear bands reduced the uniform deformation ability, leading to a rapid decrease of uniform elongation from 20 °C to 350 °C. Furthermore, a plateau of uniform elongation was observed in the intermediate temperature regime (350–550 °C) within which the shear bands were formed (Figure 2c). During tensile deformation, microvoids were preferentially initiated in the shear bands under shear stress (Figure 11a). As the microvoids grew, the softened shear bands were the favored direction while the growth rate perpendicular to the shear bands was slower, leading to the elliptical microvoids by the anisotropic growth behavior. The coalescence of elliptical microvoids resulted in the large-size and shallow dimples on the fracture surfaces (Figure 11b). Meanwhile, micro-cracks preferentially initiated within shear bands are prone to propagate along the shear band, which could accelerate the fracture process. Microstructural observations near the fracture surface also demonstrate that the final fracture was obvious along the shear bands (Figure 5b). Therefore, the lower total elongation was observed in the range of 350–550 °C.
At higher test temperatures (above 550 °C), the occurrence of dynamic recovery led to an obvious decrease in the work-hardening ability (Figure 9), resulting in the reduction of the uniform elongation according to Considere’s criterion (Figure 2c). The early onset of necking was also observed from the stress–strain curves at 750 °C (Figure 2a). Meanwhile, the shear localization phenomenon did not occur, and a very high plastic deformation was present in the post-necking regime (Figure 2a), which is mainly responsible for the higher total elongation after testing at 750 °C. During deformation at 750 °C, the dislocation cross-slip was promoted. The moving dislocations could easily overcome the obstacle (inclusions, particles, boundaries etc.) by climb so as to reduce the stress concentration. It is concluded that microvoid formation was significantly suppressed and the formation of microvoid became homogenous, which is verified by the small-size dimples on the fracture surface (Figure 3f). Besides, obvious localized necking occurred (Figure 5d), indicating that the material is capable of tolerating the localized deformation through sustained necking. Under the tensile stress, microvoids became elongated along the tensile direction in the localized necking region. The coalescent of elongated microvoids resulted in the deep dimples on the fracture surfaces (Figure 3f). The schematic description of the microvoid initiation, growth, and coalescence is presented in Figure 11d.

5. Conclusions

To clarify the controversial issues about the fracture behaviors and deformation modes at the elevated temperature of the austenitic stainless steels, the detailed fractography were quantitively characterized by the LSCM, and the deformation-induced dislocations structures were determined by TEM after tensile over the temperatures ranging from 20 °C to 750 °C so as to account for the temperature dependence of mechanical properties of AISI 316 austenitic stainless steel, which is beneficial for future applications in the advanced fourth-generation nuclear reactors. The following conclusions can be obtained:
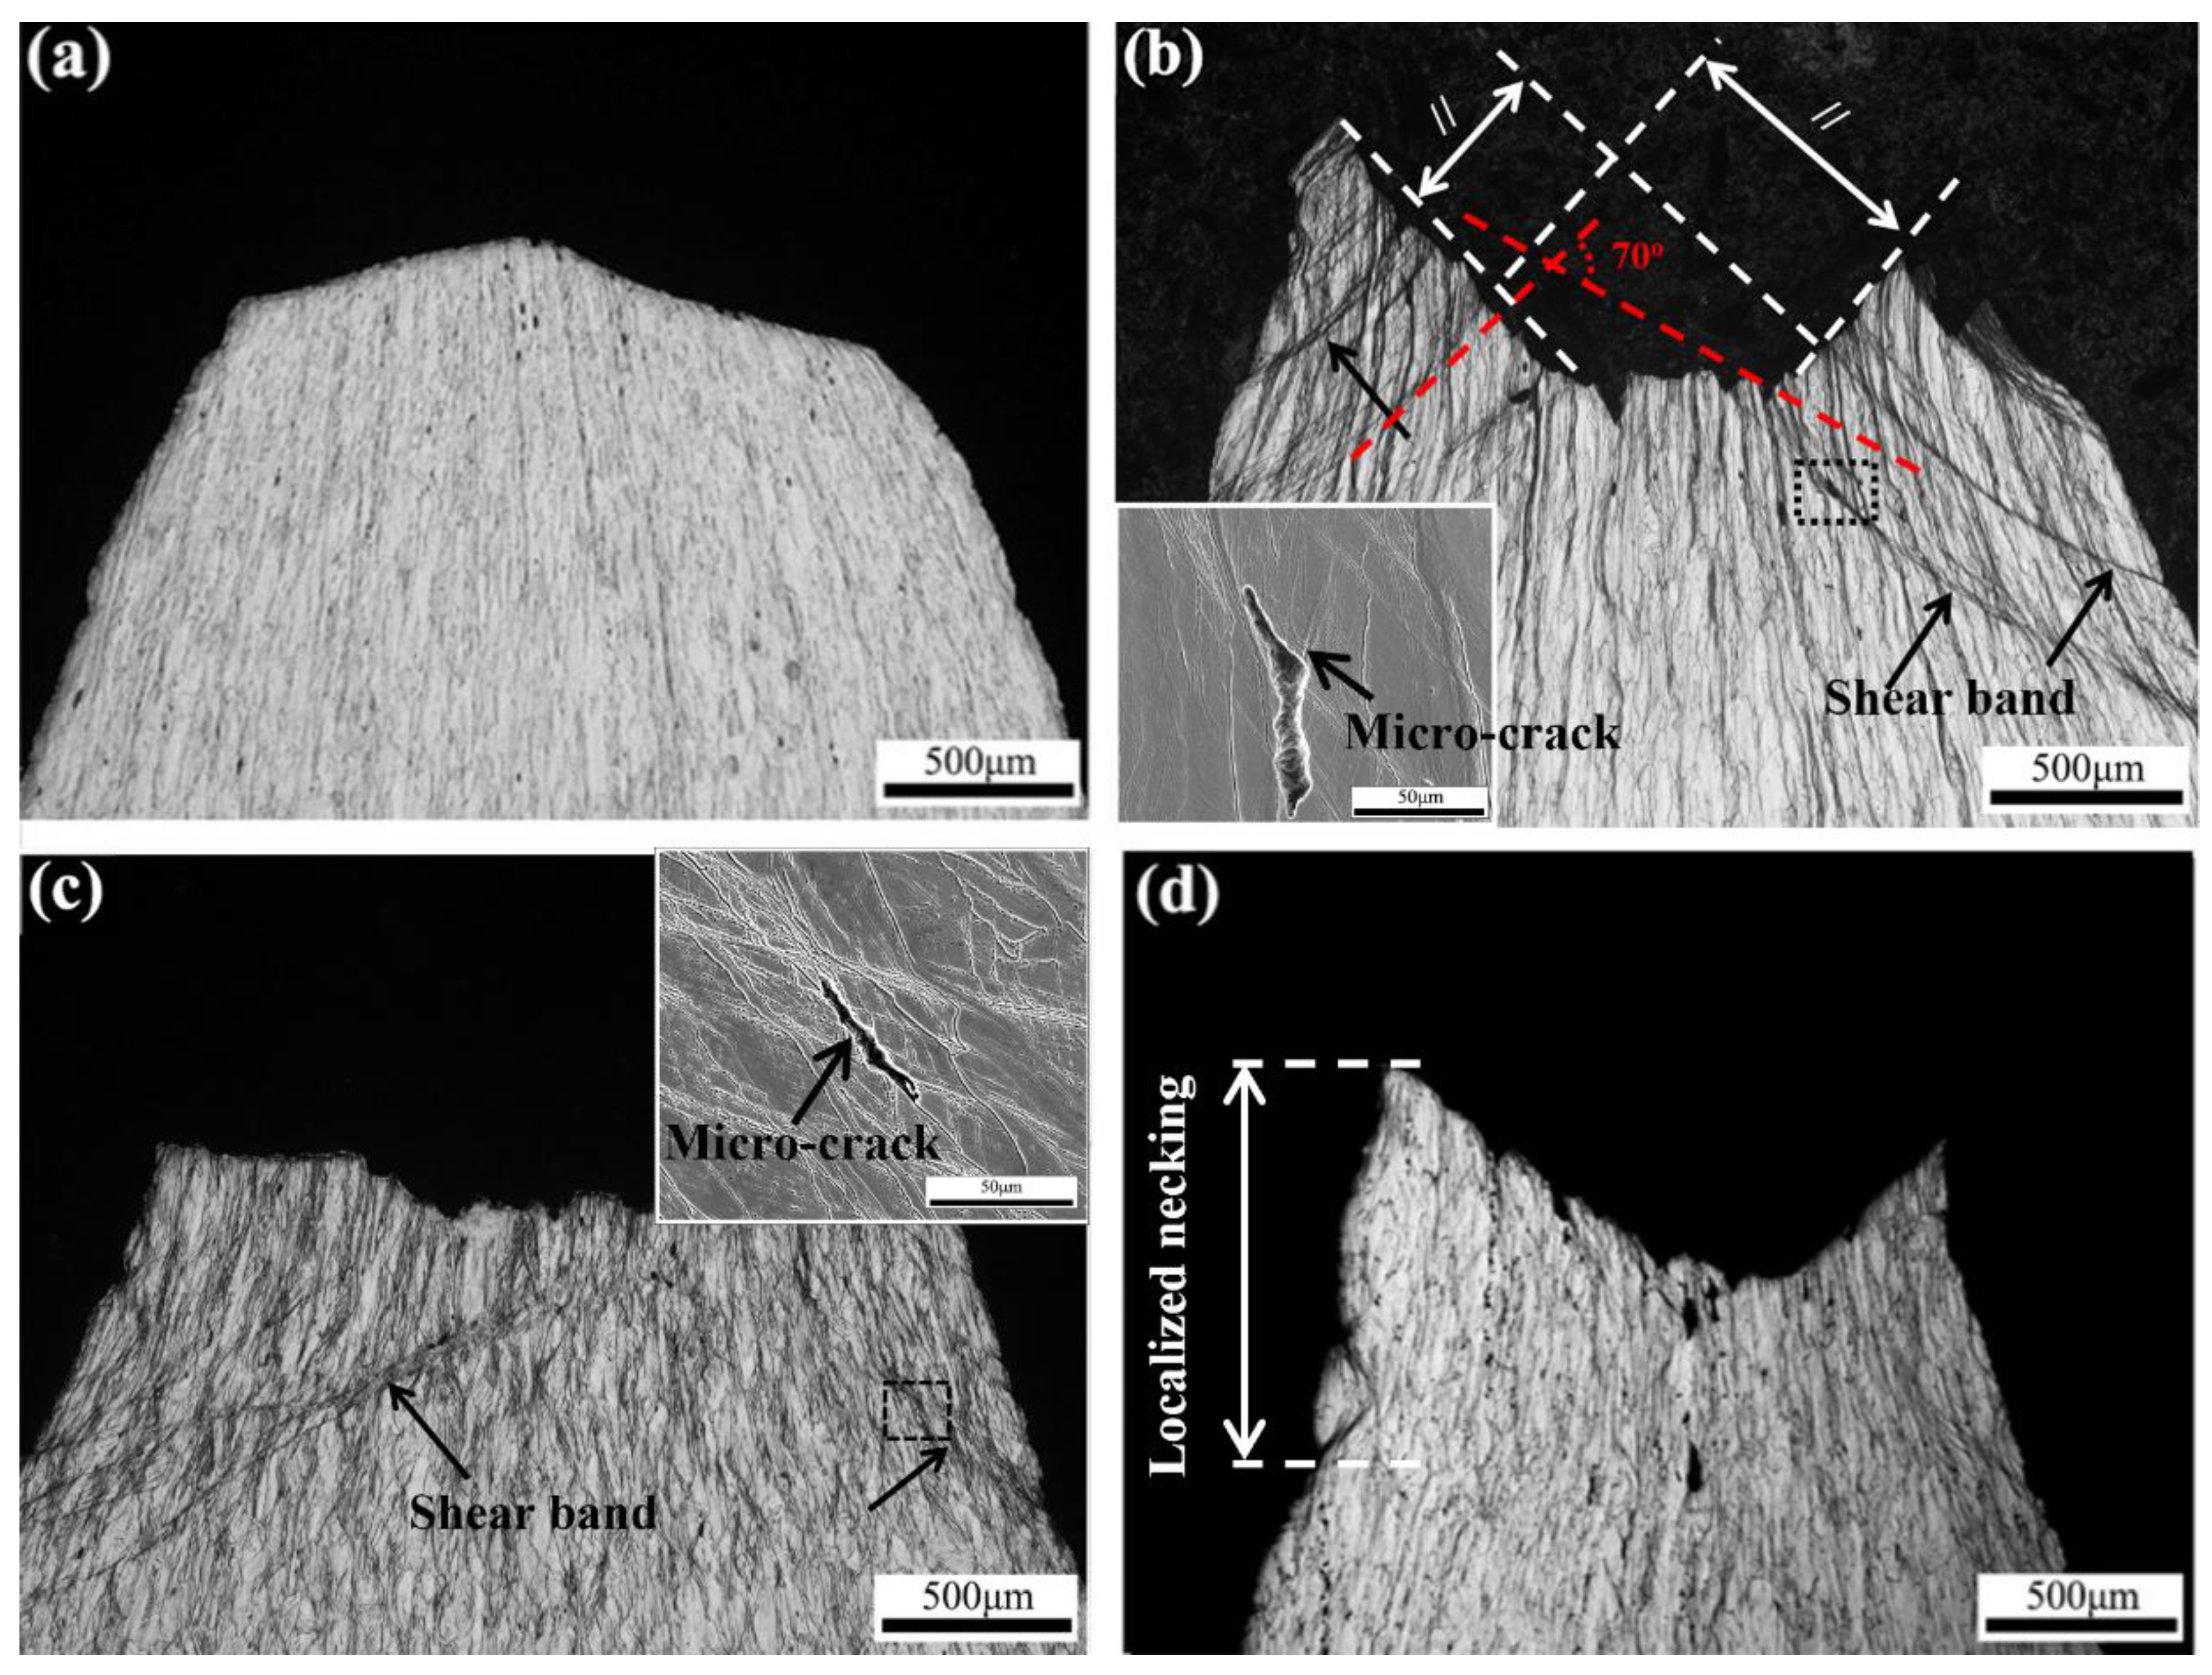
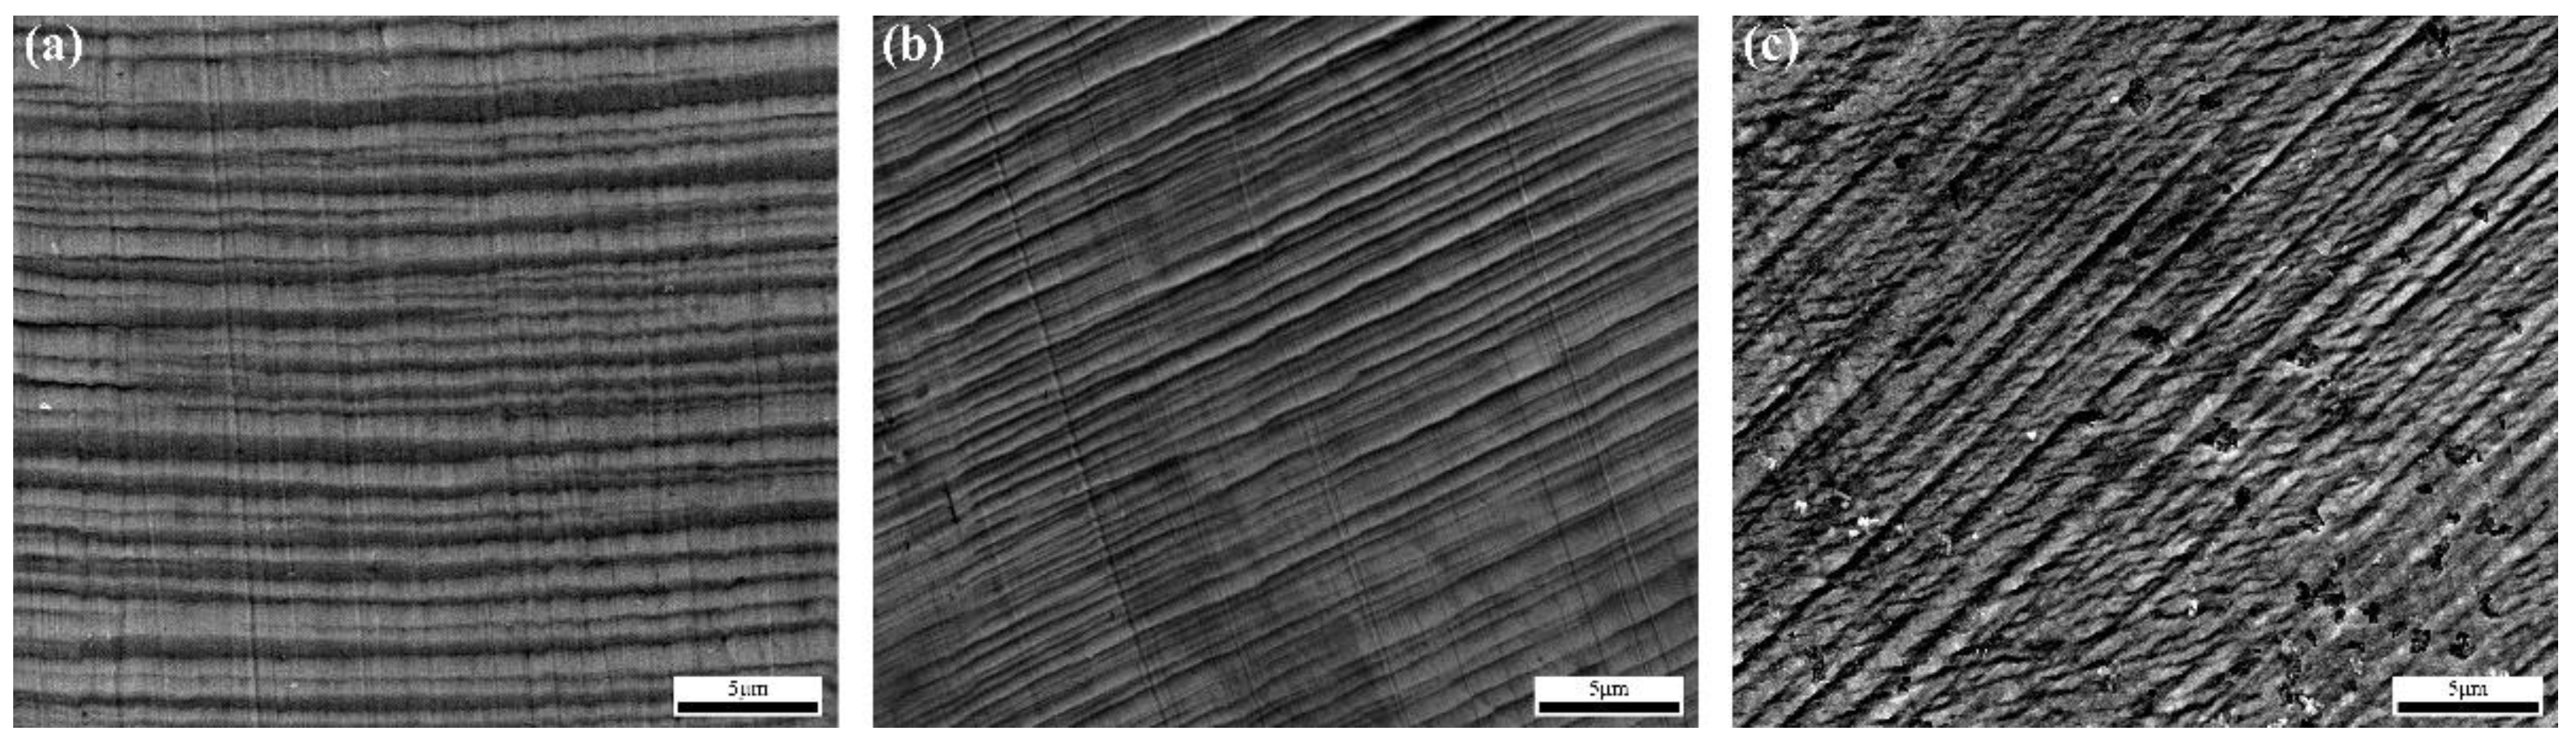
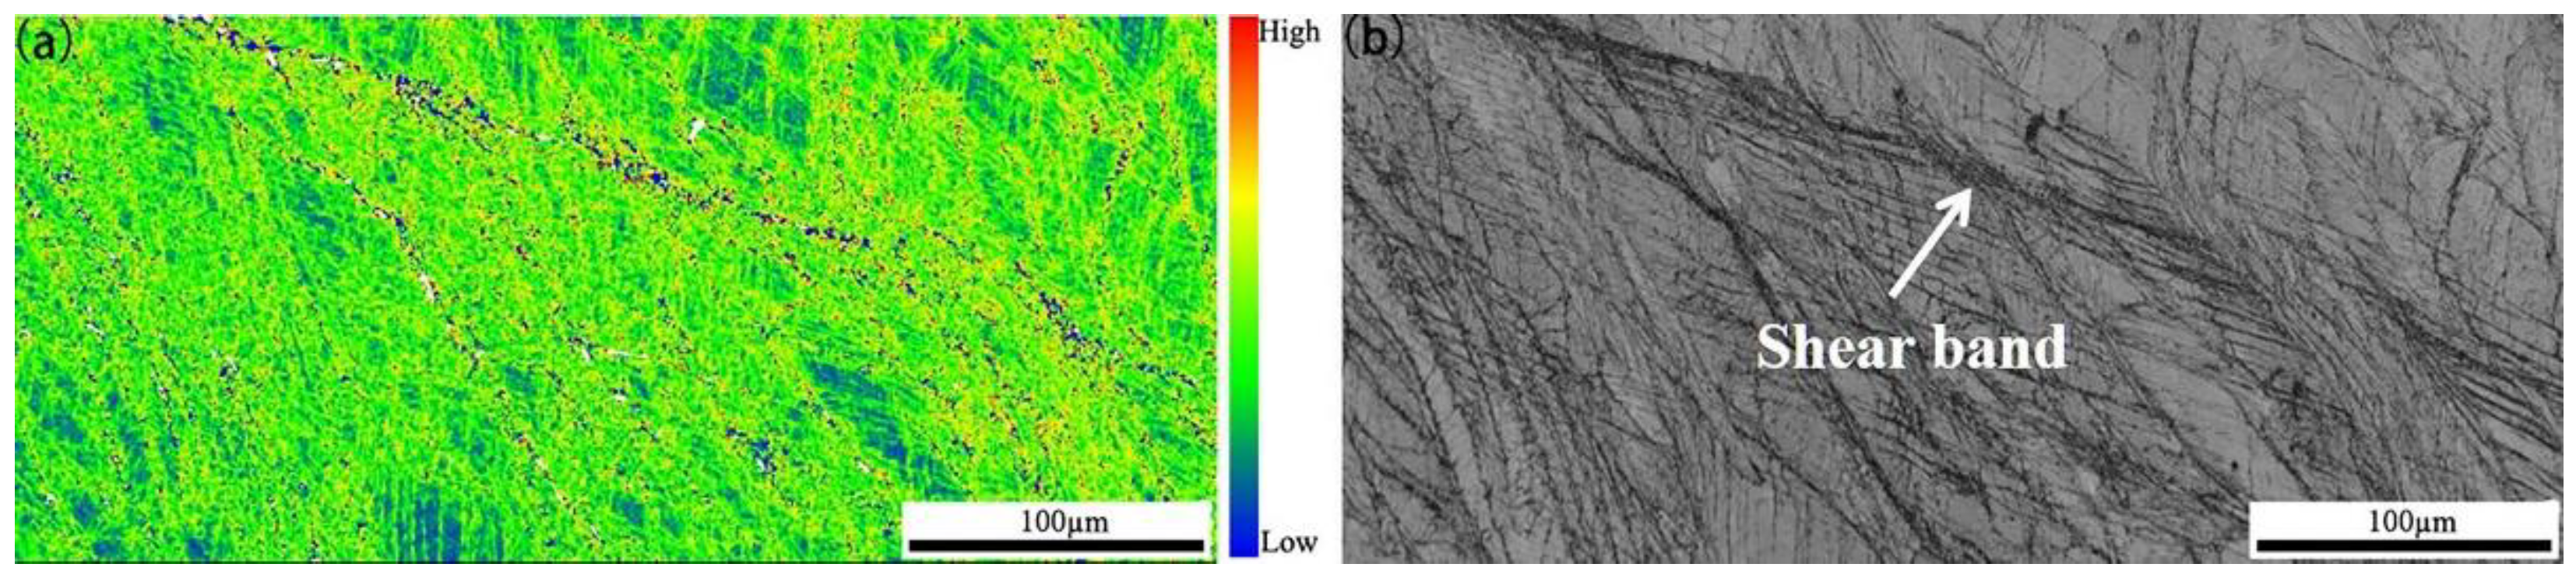
  • Planar slip mode of deformation was observed during tensile at 20 °C due to a relatively low SFE. Pronounced planar slip characteristics were observed in the intermediate temperature range of 350–550 °C, and the resultant localized deformation led to the formation of shear bands. The dislocation cross-slip was much easier above 550 °C, leading to the formation of cell/subgrain structures.
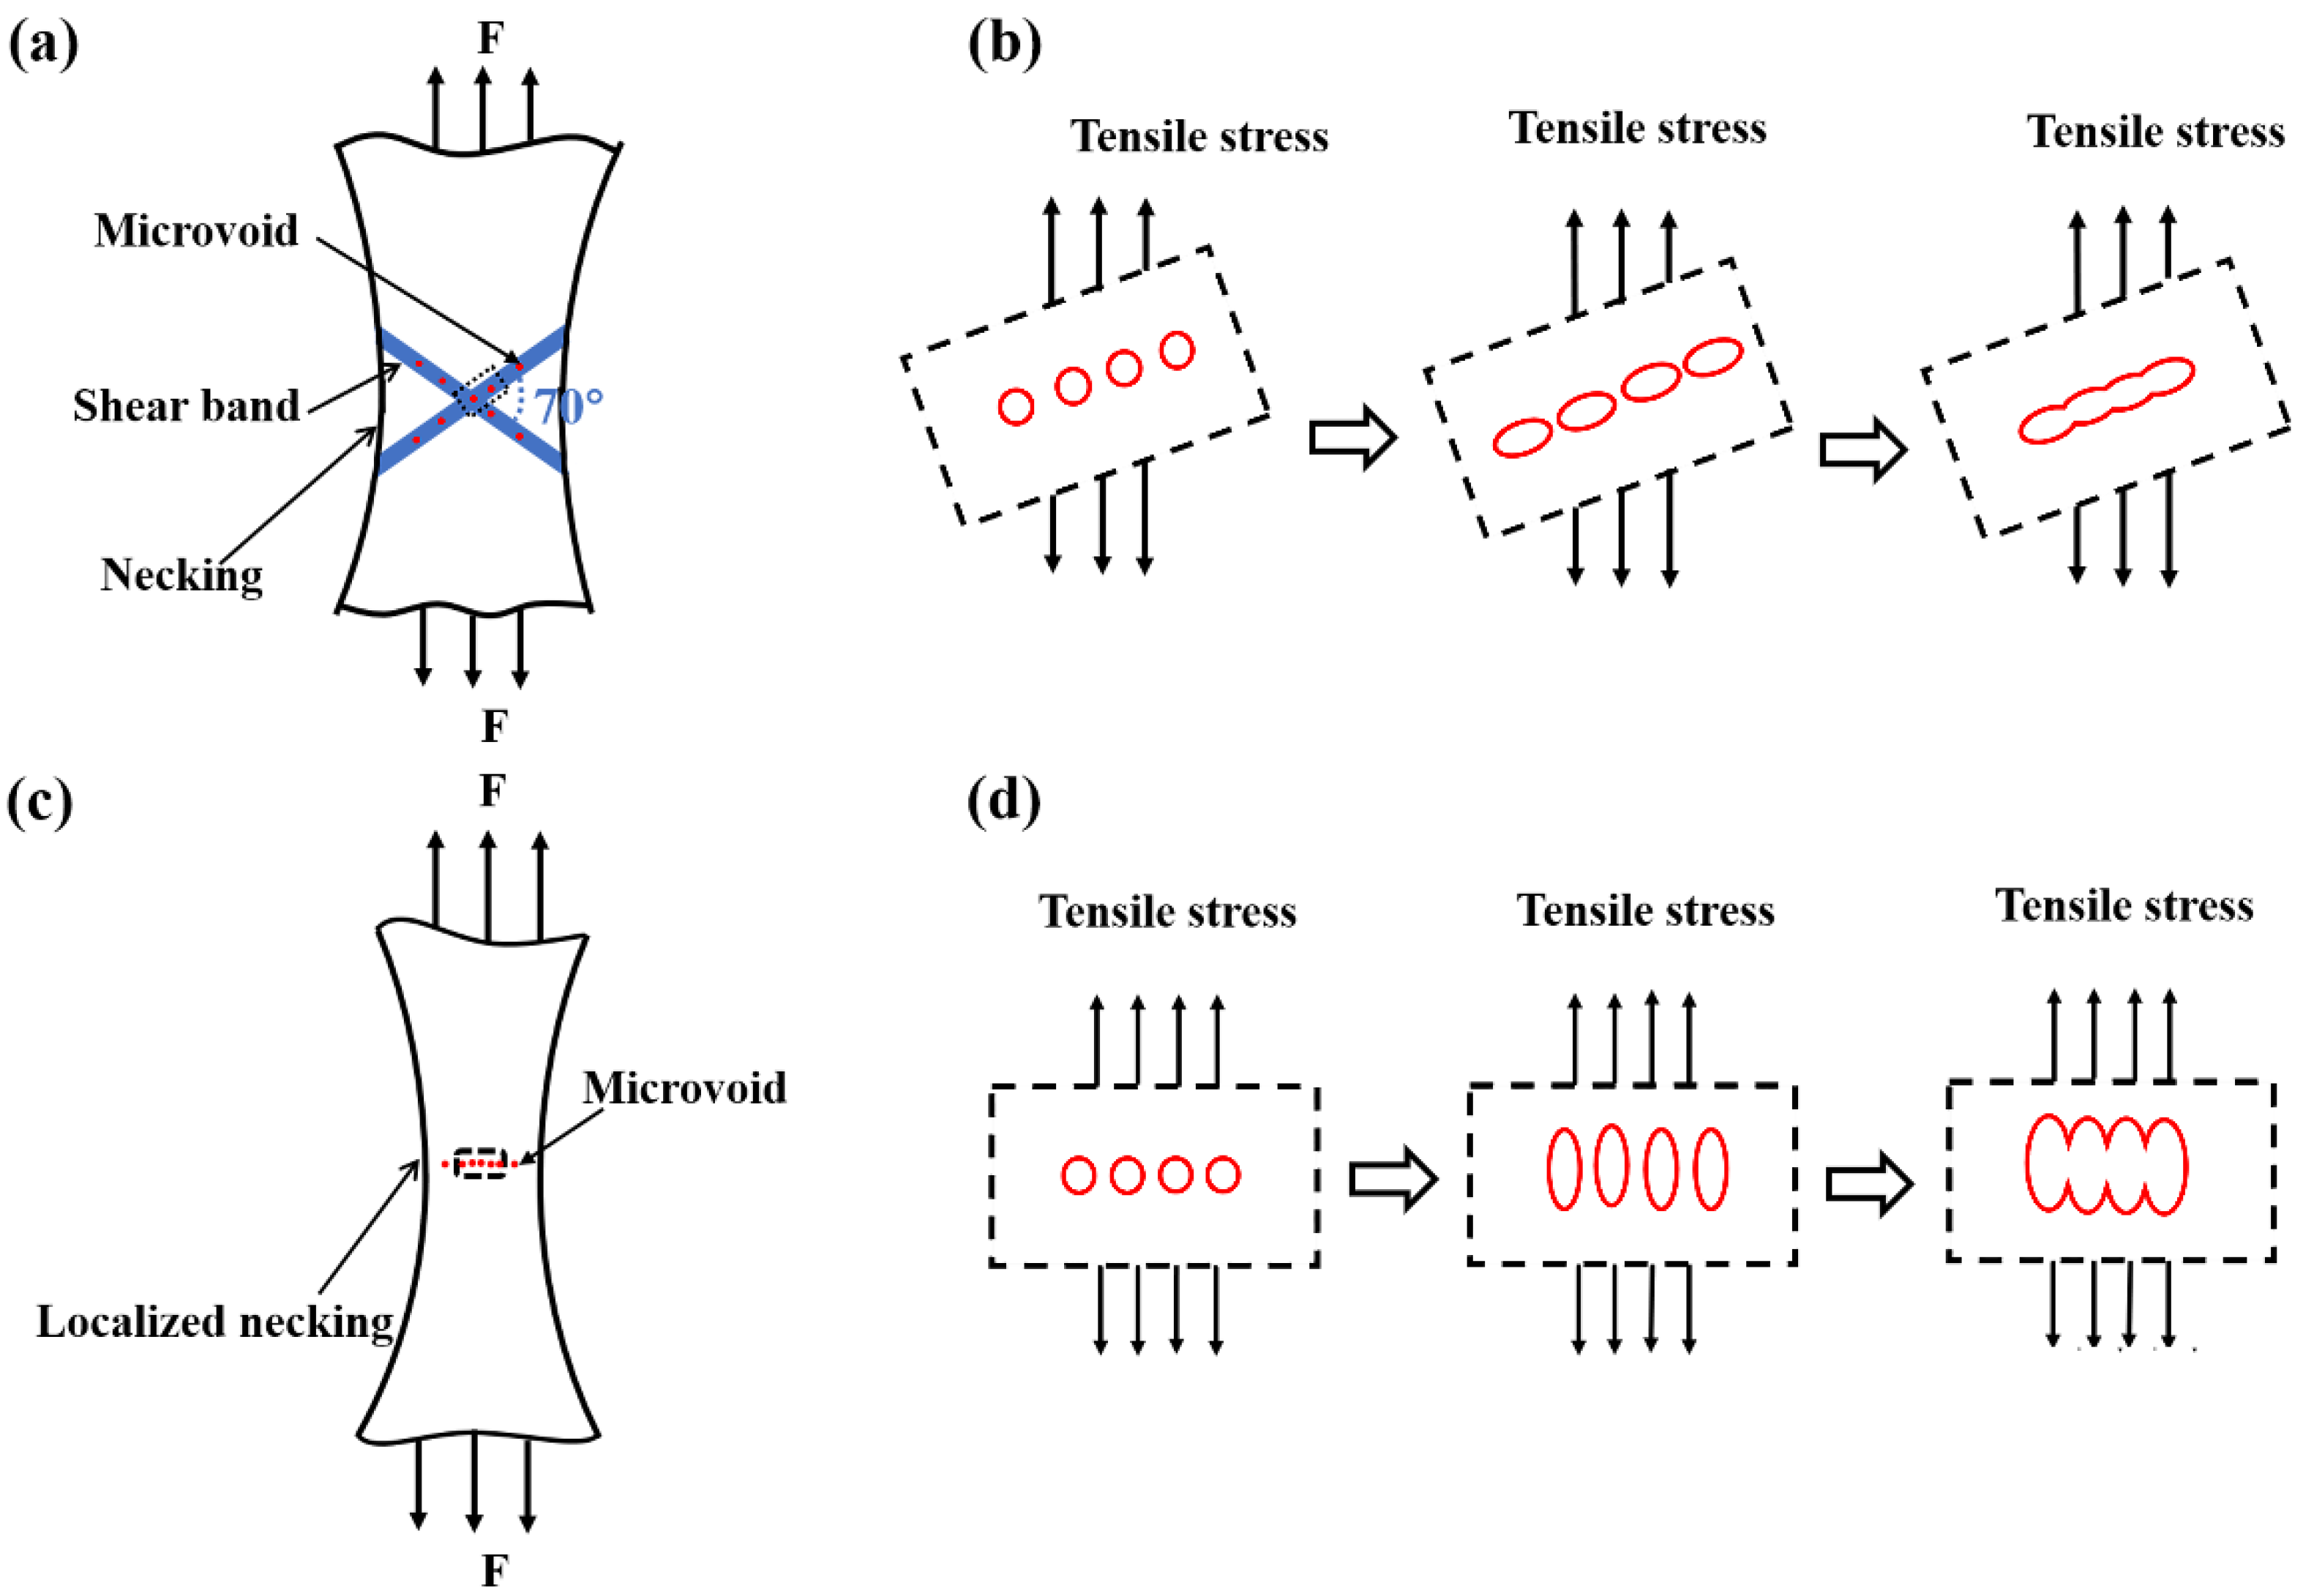
  • Ductile fractures were present in the range of 20–750 °C. The preferential microvoid initiation and subsequent anisotropic growth behavior in the shear bands led to the large-size and shallow dimples on the fracture surfaces in the range of 350–550 °C. However, the microvoid tended to elongate along the tensile direction in the localized necking region above 550 °C, resulting in the small-size and deep dimples.
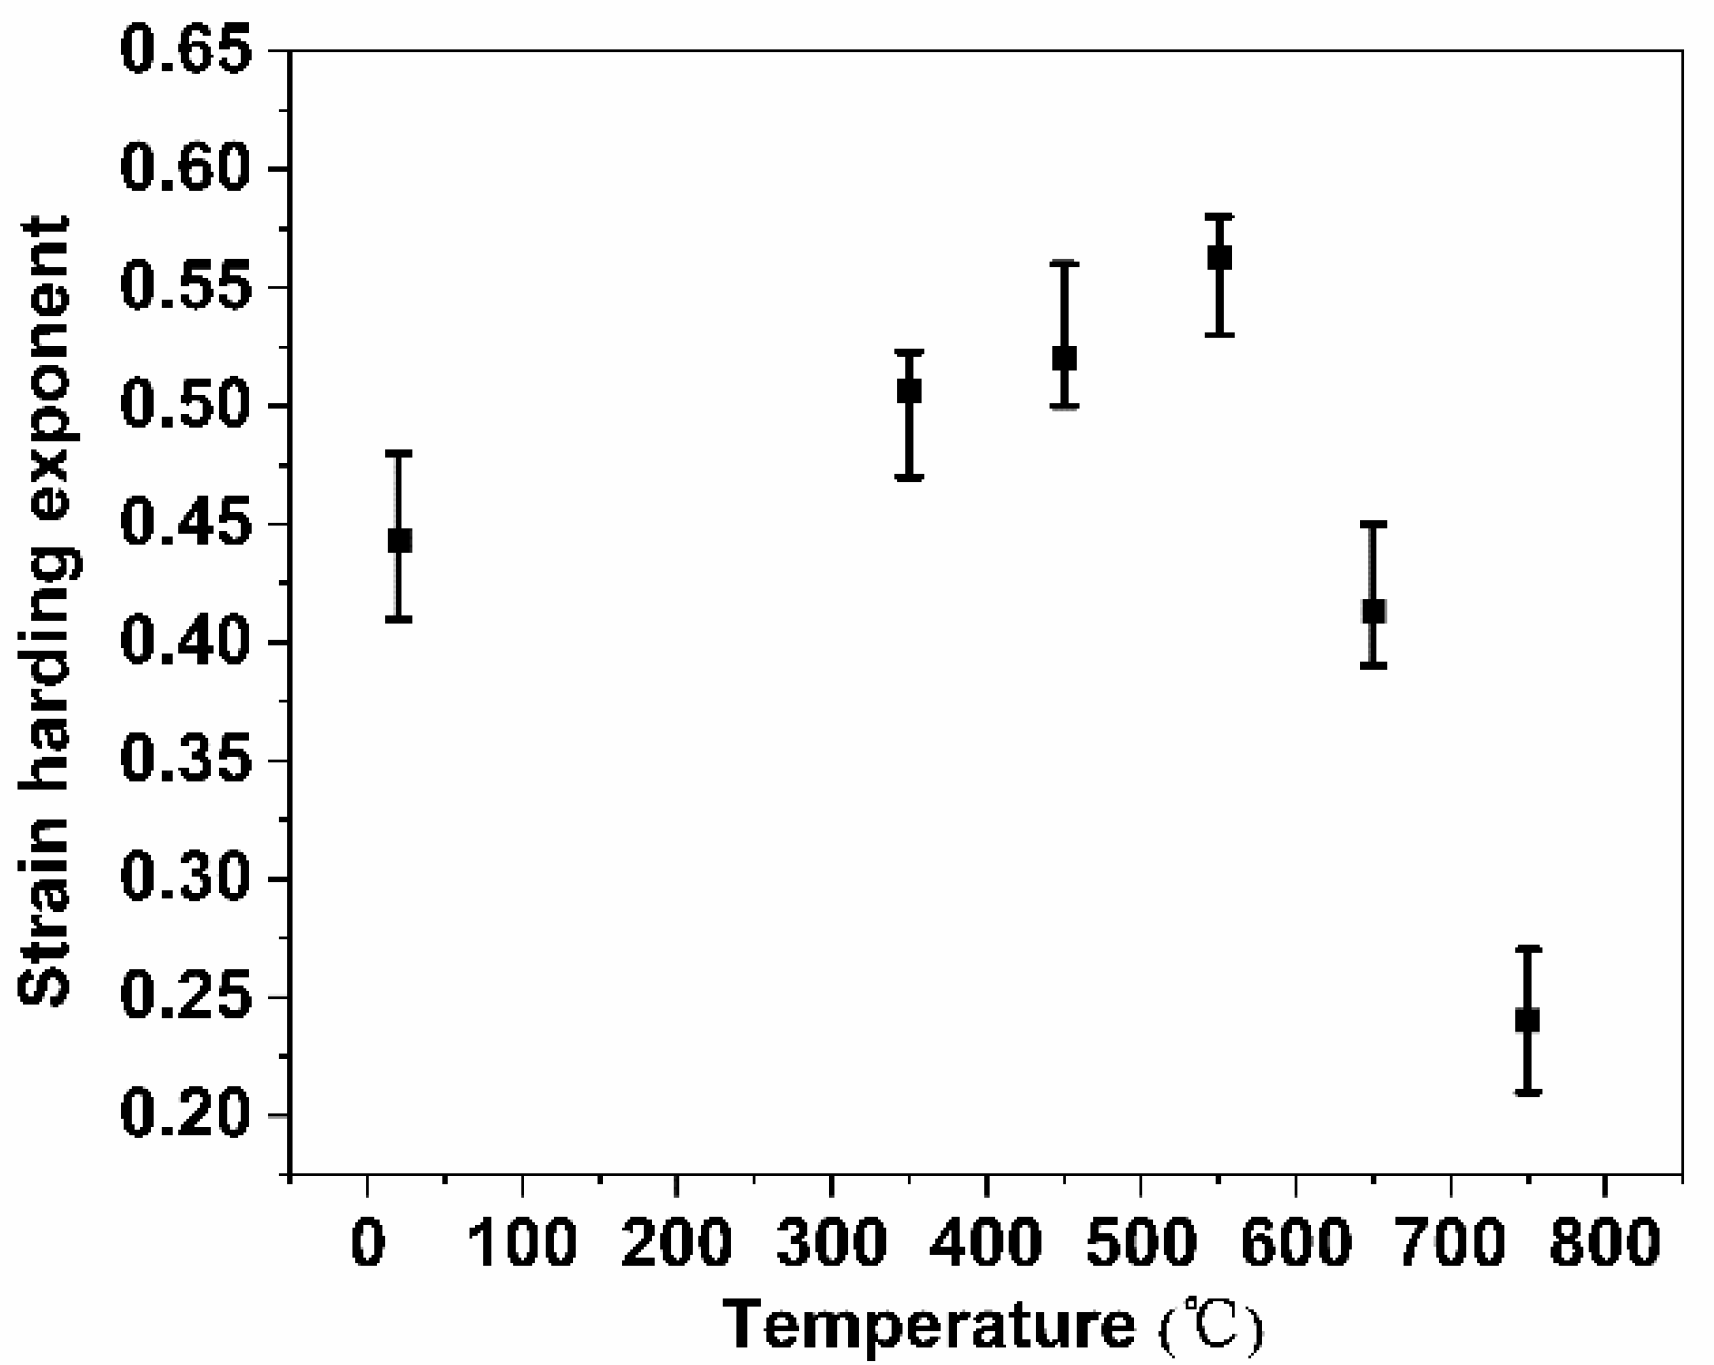
  • The gradual decrease in YS in the range of 20–750 °C is correlated with the reduction in Peierls stress and grain boundary strengthening. The enhanced work-hardening ability led to the UTS plateau in the range of 350–550 °C. The occurrence of dynamic recovery significantly decreased the work-hardening ability, which is responsible for the reduction in UTS above 550 °C.
  • The presence of shear localization reduced the uniform deformation ability and accelerated the fracture process along shear bands, leading to the plateau in uniform elongation and total elongation in the range of 350–550 °C. The much higher capability to tolerate the localized deformation through sustained necking resulted in a significant increase in the total elongation above 550 °C.

Author Contributions

Conceptualization, X.L. and S.C.; methodology, X.L.; validation, S.C., Q.W. and L.R.; formal analysis, X.L.; resources, S.C.; writing—original draft preparation, X.L.; writing—review and editing, S.C.; supervision, Q.W. and L.R.; project administration, L.R. and H.J.; funding acquisition, S.C and H.J. All authors have read and agreed to the published version of the manuscript.

Funding

This work was supported by the National Natural Science Foundation of China (No. 51871218), Youth Innovation Promotion Association, CAS (No. 2018227), LingChuang Research Project of China National Nuclear Corporation and CNNC Science Fund for Talented Young Scholars.

Data Availability Statement

The data presented in this study are available on request from the corresponding author. The data are not publicly available due to an ongoing study.

Conflicts of Interest

The authors declare no conflict of interest.

References

  1. Maziasz, P.J.; Busby, J.T. 2.09—Properties of Austenitic Steels for Nuclear Reactor Applications. In Comprehensive Nuclear Materials; Konings, R.J.M., Ed.; Elsevier: Oxford, UK, 2012; pp. 267–283. [Google Scholar]
  2. Roberts, J.A. Structural Materials in Nuclear Power Systems; Springer Science & Business Media: Berlin, Germany, 2013. [Google Scholar]
  3. Desu, R.K.; Krishnamurthy, H.N.; Balu, A.; Gupta, A.K.; Singh, S.K. Mechanical properties of Austenitic Stainless Steel 304L and 316L at elevated temperatures. J. Mater. Res. Technol. 2016, 5, 13–20. [Google Scholar] [CrossRef]
  4. Pioro, I. Handbook of Generation IV Nuclear Reactors; Woodhead Publishing: Cambridge, UK, 2016. [Google Scholar]
  5. Locatelli, G.; Mancini, M.; Todeschini, N. Generation IV nuclear reactors: Current status and future prospects. Energy Policy 2013, 61, 1503–1520. [Google Scholar] [CrossRef]
  6. Allen, T.R.; Sridharan, K.; Tan, L.; Windes, W.E.; Cole, J.I.; Crawford, D.C.; Was, G.S. Materials Challenges for Generation IV Nuclear Energy Systems. Nucl. Technol. 2008, 162, 342–357. [Google Scholar] [CrossRef]
  7. Zohuri, B. 6—Generation IV nuclear reactors. In Nuclear Reactor Technology Development and Utilization; Khan, S.U.-D., Nakhabov, A., Eds.; Woodhead Publishing: Cambridge, UK, 2020; pp. 213–246. [Google Scholar]
  8. Guérin, Y.; Was, G.S.; Zinkle, S.J. Materials Challenges for Advanced Nuclear Energy Systems. MRS Bull. 2009, 34, 10–19. [Google Scholar] [CrossRef]
  9. Buckthorpe, D. 1—Introduction to Generation IV nuclear reactors. In Structural Materials for Generation IV Nuclear Reactors; Yvon, P., Ed.; Woodhead Publishing: Cambridge, UK, 2017; pp. 1–22. [Google Scholar]
  10. Yvon, P. Structural Materials for Generation IV Nuclear Reactors; Woodhead Publishing: Cambridge, UK, 2016. [Google Scholar]
  11. Dalle, F.; Blat-Yrieix, M.; Dubiez-Le Goff, S.; Cabet, C.; Dubuisson, P. 17—Conventional austenitic steels as out-of-core materials for Generation IV nuclear reactors. In Structural Materials for Generation IV Nuclear Reactors; Yvon, P., Ed.; Woodhead Publishing: Cambridge, UK, 2017; pp. 595–633. [Google Scholar]
  12. Zinkle, S.J.; Was, G.S. Materials challenges in nuclear energy. Acta Mater. 2013, 61, 735–758. [Google Scholar] [CrossRef]
  13. Sauzay, M. 6—Mechanical behavior of structural materials for Generation IV reactors. In Structural Materials for Generation IV Nuclear Reactors; Yvon, P., Ed.; Woodhead Publishing: Cambridge, UK, 2017; pp. 191–252. [Google Scholar]
  14. Yvon, P.; Carré, F. Structural materials challenges for advanced reactor systems. J. Nucl. Mater. 2009, 385, 217–222. [Google Scholar] [CrossRef]
  15. Murty, K.L.; Charit, I. Structural materials for Gen-IV nuclear reactors: Challenges and opportunities. J. Nucl. Mater. 2008, 383, 189–195. [Google Scholar] [CrossRef]
  16. Wang, Q.; Chen, S.; Rong, L. δ-Ferrite Formation and Its Effect on the Mechanical Properties of Heavy-Section AISI 316 Stainless Steel Casting. Metall. Mater. Trans. A 2020, 51, 2998–3008. [Google Scholar] [CrossRef]
  17. Zinkle, S.J.; Terrani, K.A.; Snead, L.L. Motivation for utilizing new high-performance advanced materials in nuclear energy systems. Curr. Opin. Solid State Mater. Sci. 2016, 20, 401–410. [Google Scholar] [CrossRef]
  18. Weiss, B.; Stickler, R. Phase instabilities during high temperature exposure of 316 austenitic stainless steel. Metall. Mater. Trans. B 1972, 3, 851–866. [Google Scholar] [CrossRef]
  19. Sahlaoui, H.; Sidhom, H. Experimental Investigation and Analytical Prediction of σ-Phase Precipitation in AISI 316L Austenitic Stainless Steel. Metall. Mater. Trans. A 2013, 44, 3077–3083. [Google Scholar] [CrossRef]
  20. Wang, Q.; Chen, S.; Lv, X.; Jiang, H.; Rong, L. Role of δ-ferrite in fatigue crack growth of AISI 316 austenitic stainless steel. J. Mater. Sci. Technol. 2022, 114, 7–15. [Google Scholar] [CrossRef]
  21. Yang, Y.; Busby, J.T. Thermodynamic modeling and kinetics simulation of precipitate phases in AISI 316 stainless steels. J. Nucl. Mater. 2014, 448, 282–293. [Google Scholar] [CrossRef]
  22. Lo, K.H.; Shek, C.H.; Lai, J.K.L. Recent developments in stainless steels. Mater. Sci. Eng. R Rep. 2009, 65, 39–104. [Google Scholar] [CrossRef]
  23. Bellefon, G.M.D.; Duysen, J.C.V. Tailoring plasticity of austenitic stainless steels for nuclear applications: Review of mechanisms controlling plasticity of austenitic steels at temperature below 400 °C. J. Nucl. Mater. 2016, 475, 168–191. [Google Scholar] [CrossRef]
  24. Dong, Z.; Li, W.; Chai, G.; Vitos, L. Strong temperature—Dependence of Ni-alloying influence on the stacking fault energy in austenitic stainless steel. Scr. Mater. 2020, 178, 438–441. [Google Scholar] [CrossRef]
  25. Latanision, R.M.; Ruff, A.W. The temperature dependence of stacking fault energy in Fe-Cr-Ni alloys. Metall. Trans. 1971, 2, 505–509. [Google Scholar] [CrossRef]
  26. Rémy, L.; Pineau, A.; Thomas, B. Temperature dependence of stacking fault energy in close-packed metals and alloys. Mater. Sci. Eng. 1978, 36, 47–63. [Google Scholar] [CrossRef]
  27. Curtze, S.; Kuokkala, V.T. Dependence of tensile deformation behavior of TWIP steels on stacking fault energy, temperature and strain rate. Acta Mater. 2010, 58, 5129–5141. [Google Scholar] [CrossRef]
  28. De Almeida, L.H.; Le May, I.; Emygdio, P.R.O. Mechanistic Modeling of Dynamic Strain Aging in Austenitic Stainless Steels. Mater. Charact. 1998, 41, 137–150. [Google Scholar] [CrossRef]
  29. Hong, S.-G.; Lee, S.-B. Mechanism of dynamic strain aging and characterization of its effect on the low-cycle fatigue behavior in type 316L stainless steel. J. Nucl. Mater. 2005, 340, 307–314. [Google Scholar] [CrossRef]
  30. Huang, A.; Wang, Z.; Yuan, Q.; Chen, R.; Zhang, Y.; Guan, R. Study on serration flow and dynamic strain aging of Cr–Ti–B low-carbon steel. J. Mater. Res. Technol. 2021, 12, 1543–1551. [Google Scholar] [CrossRef]
  31. Wesselmecking, S.; Song, W.; Bleck, W. Dynamic and Static Strain Aging in a High-Manganese Steel. Steel Res. Int. 2022, 93, 2100707. [Google Scholar]
  32. De Almeida, L.H.; Emygdio, P.R.O.; Le May, I. Activation energy calculation and dynamic strain aging in austenitic stainless steel. Scr. Metall. Mater. 1994, 31, 505–510. [Google Scholar] [CrossRef]
  33. Field, D.M.; Van Aken, D.C. Dynamic Strain Aging Phenomena and Tensile Response of Medium-Mn TRIP Steel. Metall. Mater. Trans. A 2018, 49, 1152–1166. [Google Scholar] [CrossRef]
  34. Choudhary, B.K. Influence of Strain Rate and Temperature on Tensile Deformation and Fracture Behavior of Type 316L(N) Austenitic Stainless Steel. Metall. Mater. Trans. A 2014, 45, 302–316. [Google Scholar] [CrossRef]
  35. Zhou, H.; Bai, F.; Yang, L.; Wei, H.; Chen, Y.; Peng, G.; He, Y. Mechanism of Dynamic Strain Aging in a Niobium-Stabilized Austenitic Stainless Steel. Metall. Mater. Trans. A 2018, 49, 1202–1210. [Google Scholar] [CrossRef]
  36. Monteiro, S.N.; Margem, F.M.; Candido, V.S.; Figueiredo, A.B.-H.D.S. High Temperature Plastic Instability and Dynamic Strain Aging in the Tensile Behavior of AISI 316 Stainless Steel. Mater. Res. 2017, 20, 506–511. [Google Scholar] [CrossRef]
  37. Alomari, A.S.; Kumar, N.; Murty, K.L. Serrated yielding in an advanced stainless steel Fe-25Ni-20Cr (wt%). Mater. Sci. Eng. A 2019, 751, 292–302. [Google Scholar] [CrossRef]
  38. Karlsen, W.; Ivanchenko, M.; Ehrnstén, U.; Yagodzinskyy, Y.; Hänninen, H. Microstructural manifestation of dynamic strain aging in AISI 316 stainless steel. J. Nucl. Mater. 2009, 395, 156–161. [Google Scholar] [CrossRef]
  39. Choudhary, B.K.; Christopher, J. Influence of temperature and strain rate on tensile deformation and fracture behaviour of boron added P91 steel. Int. J. Press Ves. Pip. 2019, 171, 153–161. [Google Scholar] [CrossRef]
  40. Sikka, V.K.; Booker, B.L.P.; Booker, M.K.; McEnerney, J.W. Tensile and Creep Data on Type 316 Stainless Steel; U.S. Department of Energy: Washington, DC, USA, 1980.
  41. Alomari, A.S.; Kumar, N.; Murty, K.L. Enhanced ductility in dynamic strain aging regime in a Fe-25Ni-20Cr austenitic stainless steel. Mater. Sci. Eng. A 2018, 729, 157–160. [Google Scholar] [CrossRef]
  42. Monteiro, S.N.; Nascimento, L.F.C.; Simonassi, N.T.; Lima, E.S.; de Paula, A.S.; de Oliveira Braga, F. High temperature work hardening stages, dynamic strain aging and related dislocation structure in tensile deformed AISI 301 stainless steel. J. Mater. Res. Technol. 2018, 7, 571–577. [Google Scholar] [CrossRef]
  43. Lan, P.; Zhang, J. Serrated Flow and Dynamic Strain Aging in Fe-Mn-C TWIP Steel. Metall. Mater. Trans. A 2018, 49, 147–161. [Google Scholar] [CrossRef]
  44. Soares, G.C.; Queiroz, R.R.U.; Santos, L.A. Effects of Dynamic Strain Aging on Strain Hardening Behavior, Dislocation Substructure, and Fracture Morphology in a Ferritic Stainless Steel. Metall. Mater. Trans. A 2020, 51, 725–739. [Google Scholar] [CrossRef]
  45. Michel, D.J.; Moteff, J.; Lovell, A.J. Substructure of type 316 stainless steel deformed in slow tension at temperatures between 21° and 816 °C. Acta Metall. 1973, 21, 1269–1277. [Google Scholar] [CrossRef]
  46. Hong, S.-G.; Lee, S.-B. Dynamic strain aging under tensile and LCF loading conditions, and their comparison in cold worked 316L stainless steel. J. Nucl. Mater. 2004, 328, 232–242. [Google Scholar] [CrossRef]
  47. Polat, A. The Effects of Strain Rate and Temperature on the Deformation Behavior of Cold-Rolled TRIP800 Steel. Steel Res. Int. 2012, 83, 775–782. [Google Scholar] [CrossRef]
  48. Kim, J.K.; Chen, L.; Kim, H.S.; Kim, S.K.; Kim, G.S.; Estrin, Y.; De Cooman, B. Strain Rate Sensitivity of C-alloyed, High-Mn, Twinning-induced Plasticity Steel. Steel Res. Int. 2009, 80, 493–498. [Google Scholar]
  49. Mannan, S.L.; Samuel, K.G.; Rodriguez, P. Influence of temperature and grain size on the tensile ductility of AISI 316 stainless steel. Mater. Sci. Eng. 1985, 68, 143–149. [Google Scholar] [CrossRef]
  50. De Bellefon, G.M.; van Duysen, J.; Sridharan, K. Composition-dependence of stacking fault energy in austenitic stainless steels through linear regression with random intercepts. J. Nucl. Mater. 2017, 492, 227–230. [Google Scholar] [CrossRef]
  51. Lu, J.; Hultman, L.; Holmström, E.; Antonsson, K.H.; Grehk, M.; Li, W.; Vitos, L.; Golpayegani, A. Stacking fault energies in austenitic stainless steels. Acta Mater. 2016, 111, 39–46. [Google Scholar] [CrossRef]
  52. Lee, T.-H.; Shin, E.; Oh, C.-S.; Ha, H.-Y.; Kim, S.-J. Correlation between stacking fault energy and deformation microstructure in high-interstitial-alloyed austenitic steels. Acta Mater. 2010, 58, 3173–3186. [Google Scholar] [CrossRef]
  53. Hähner, P. A theory of dislocation cell formation based on stochastic dislocation dynamics. Acta Mater. 1996, 44, 2345–2352. [Google Scholar] [CrossRef]
  54. Wu, Z.; Bei, H.; Pharr, G.M.; George, E.P. Temperature dependence of the mechanical properties of equiatomic solid solution alloys with face-centered cubic crystal structures. Acta Mater. 2014, 81, 428–441. [Google Scholar] [CrossRef]
  55. Chokshi, A.H. Grain boundary processes in strengthening, weakening, and superplasticity. Adv. Eng. Mater. 2020, 22, 1900748. [Google Scholar] [CrossRef]
  56. Seeger, A.; Diehl, J.; Mader, S.; Rebstock, H. Work-hardening and work-softening of face-centred cubic metal crystals. Philos. Mag. A J. Theor. Exp. Appl. Phys. 1957, 2, 323–350. [Google Scholar] [CrossRef]
  57. Cao, Y.; Zhang, C.; Zhang, C.; Di, H.; Huang, G.; Liu, Q. Influence of dynamic strain aging on the mechanical properties and microstructural evolution for Alloy 800H during hot deformation. Mater. Sci. Eng. A 2018, 724, 37–44. [Google Scholar] [CrossRef]
  58. Koyama, M.; Sawaguchi, T.; Tsuzaki, K. Overview of Dynamic Strain Aging and Associated Phenomena in Fe–Mn–C Austenitic Steels. ISIJ Int. 2018, 58, 1383–1395. [Google Scholar] [CrossRef]
  59. Deng, Z.; Liu, J.; Yan, B.; He, Y. Monotonous deformation behavior of ferritic FeCrAl alloy in the dynamic strain aging regime. J. Alloys Compd. 2018, 749, 664–671. [Google Scholar] [CrossRef]
  60. Nabizada, A.; Zarei-Hanzaki, A.; Abedi, H.R.; Barati, M.H.; Asghari-Rad, P.; Kim, H.S. The high temperature mechanical properties and the correlated microstructure/texture evolutions of a TWIP high entropy alloy. Mater. Sci. Eng. A 2021, 802, 140600. [Google Scholar] [CrossRef]
Figure 1. (a) Optical micrograph and (b) SEM micrograph of the solution-treated AISI 316 plate.
Metals 12 01421 g001
Figure 2. (a) Typical engineering stress–engineering strain curves for the samples tested in the temperature range of 20–750 °C, and the variation of tensile properties as a function of test temperature: (b) yield strength and ultimate tensile strength, (c) uniform elongation and total elongation.
Metals 12 01421 g002
Figure 3. SEM images of fracture surfaces of specimens tested at (a) 20 °C, (b) 350 °C, (c) 450 °C, (d) 550 °C, (e) 650 °C, and (f) 750 °C. (g) Changes in mean dimple size as a function of temperature.
Metals 12 01421 g003
Figure 4. LSCM 3D view of fracture surface of specimens tested at (a) 20 °C, (b) 350 °C, (c) 450 °C, (d) 550 °C, (e) 650 °C and (f) 750 °C. (g) Changes in mean dimple depth as a function of temperature.
Metals 12 01421 g004
Figure 5. Microstructures of longitudinal sections near the fracture surface of specimens after testing at (a) 20 °C, (b) 350 °C, (c) 550 °C, and (d) 750 °C. The insets are enlarged view of the selected regions. The 70 degrees angle delimited by red lines is the angle between the shear bands. The shear band is mentioned in the discussion section.
Metals 12 01421 g005
Figure 6. SEM micrographs of fractured specimens tested at (a) 20 °C, (b) 550 °C, and (c) 750 °C. (d) TEM micrographs and selected area diffraction patterns (SADP) of specimens tested at 750 °C.
Metals 12 01421 g006
Figure 7. Bright field TEM micrographs of dislocation morphologies near the fractured region of the samples after testing at (a) 20 °C, (b) 350 °C, (c) 550 °C, and (d) 750 °C.
Metals 12 01421 g007
Figure 8. SEM micrographs of surface slip traces after tensile deformation to the engineering strain of 0.25 at (a) 20 °C, (b) 350 °C, and (c) 550 °C.
Metals 12 01421 g008
Figure 9. Variations of the average strain-hardening exponent as a function of test temperature.
Metals 12 01421 g009
Figure 10. (a) Local misorientation map and (b) corresponding band contrast map near the fracture surface in the longitudinal sections of the sample test at 350 °C by EBSD.
Metals 12 01421 g010
Figure 11. Schematic description about the microvoid initiation, growth, and coalescence behavior during testing in the temperature range of (a,b) 350–550 °C and (c,d) above 550 °C. (b,d) show the microvoid initiation, growth, and coalescence in presence and absence of shear bands.
Metals 12 01421 g011
Table 1. Chemical compositions (wt.%) of the AISI 316 austenitic stainless steel used in this study.
ElementCNCrNiSiMnMoPSFe
(wt.%)0.0440.06517.412.40.391.572.630.02<0.001bal.
Publisher’s Note: MDPI stays neutral with regard to jurisdictional claims in published maps and institutional affiliations.

