Article

Mechanical Behavior and Microstructure Evolution during High-Temperature Tensile Deformation of MnE21 Magnesium Alloy

1
Key Laboratory of Automobile Materials, Ministry of Education, College of Materials Science and Engineering, Jilin University, Changchun 130025, China
2
Roll Forging Research Institute, Jilin University, Changchun 130025, China
*
Author to whom correspondence should be addressed.
Metals 2022, 12(9), 1431; https://doi.org/10.3390/met12091431
Submission received: 11 July 2022 / Revised: 20 August 2022 / Accepted: 25 August 2022 / Published: 29 August 2022

Abstract

:
In this study, tensile tests for magnesium–manganese rare earth alloy (MnE21) were conducted with a WDW-300 high-temperature universal testing machine at different temperatures (300 °C~500 °C) and strain rates (1 × 10⁻⁴s−1~1 × 10⁻¹s−1). The high temperature thermal deformation behavior, dynamic recrystallization, and texture of MnE21 magnesium alloy were analyzed by combining the constitutive equation, hot processing map, and electron backscatter diffraction (EBSD). The results show that the strain compensation equation can accurately predict the thermal deformation behavior. According to the hot processing map, the optimal processing regions were determined to be 350 °C, ε ˙ = 1 × 10²s−1~ ε ˙ = 1 × 10⁴s−1, and 450–500 °C, ε   ˙ = 1 × 101s−1~ ε ˙ = 1 × 10⁴s−1. Based on the EBSD analysis, it was found that dynamic recrystallization of the alloy occurs above 350 °C, it was concluded that dynamic recrystallization was more adequate at 450 °C by analyzing the grain orientation and grain boundary difference orientation distribution. In addition, the texture index at different temperatures was also analyzed and it was found that the material showed a typical extrusion texture internally. During dynamic recrystallization, (01-11) [2-1-11], texture was produced.

1. Introduction

Magnesium alloy is one of the lightest structural metals, with the advantages of being lightweight, high damping, and easy to recycle. All these characteristics mean it has great potential in many fields, including use for aerospace, automotive, and electronic equipment [1,2,3,4,5]. The MnE21 magnesium alloy studied in this paper is an exclusive patented product from Tech Mag-TCM, Switzerland. This alloy contains the element manganese, Mn, which has a more negative standard electrode potential than Zn and Fe; this special feature endows Mn with biodegradability and low-risk galvanic corrosion when Mn is coupled with Mg [6]. Compared with ordinary magnesium–aluminum alloy, MnE21 magnesium alloy has a higher melting point (650 °C), better heat resistance, and processing performance. In addition, the price of magnesium–manganese alloy is lower than that of magnesium–aluminum alloy
However, MnE21 magnesium alloy has poor properties at room temperature due to its HCP crystal type [7]. It is especially important to study the high-temperature deformation behavior of magnesium alloy. In order to make hot working be more suitable for manufacturing the qualified products, it is an imperative task to identify the flow behavior of MnE21 magnesium alloy undergoing deformation at elevated temperatures in detail. Now the combination of the constitutive equation and hot processing map has become an important means to study the high-temperature properties of the materials [8].
Sellars and Tegart proposed the classical Arrhenius equation to describe the relationship between strain rate, temperature, and stress during high temperature deformation [9,10]. The equation can describe the flow behavior during thermal processing and has a wide range of applications [11,12,13,14]. It is considered as an important tool to describe the flow behavior of various metals [15]. Prasad et al. [16] proposed power dissipation equation and an instability criterion, by superimposing both of them, the hot processing map can be established, which is important for optimizing the parameters of thermoforming [17,18]. Zheng et al. established the constitutive relationship of NZ30K magnesium alloy deformed at high temperature by plotting experimental data based on Arrhenius and hyperbolic sine models. Ma et al. [8] investigated the high-temperature hot compression deformation of Mg-16Al magnesium alloy under different conditions and combined the strain compensated Arrhenius equation and Zener–Hollomon parameters to accurately describe the high-temperature flow behavior of this alloy.
During the process of thermal deformation, the evolution of the internal structure of the material cannot be ignored. Huang et al.[19] characterized the microstructure of AZ80 magnesium alloy during hot compression at different strain rates at 350 °C and found that the lower strain rate contributes to the dynamic recrystallization of the material Zeng et al. monitored the texture evolution of Mg-0.3Zn-0.1Ca, Mg-0.4Zn, and Mg-0.1Ca alloys during static recrystallization through EBSD and showed that the formation of recrystallized grains with random orientation generates a weaker texture, and the weak texture formed in the early stages of recrystallization is preferentially grown by recrystallized grains with specific orientations that gradually replaced by a strong basal texture.
The purpose of this paper is to establish the high-temperature constitutive equation of MnE21 magnesium alloy, and study the evolution of its internal structure with temperature change.

2. Materials and Methods

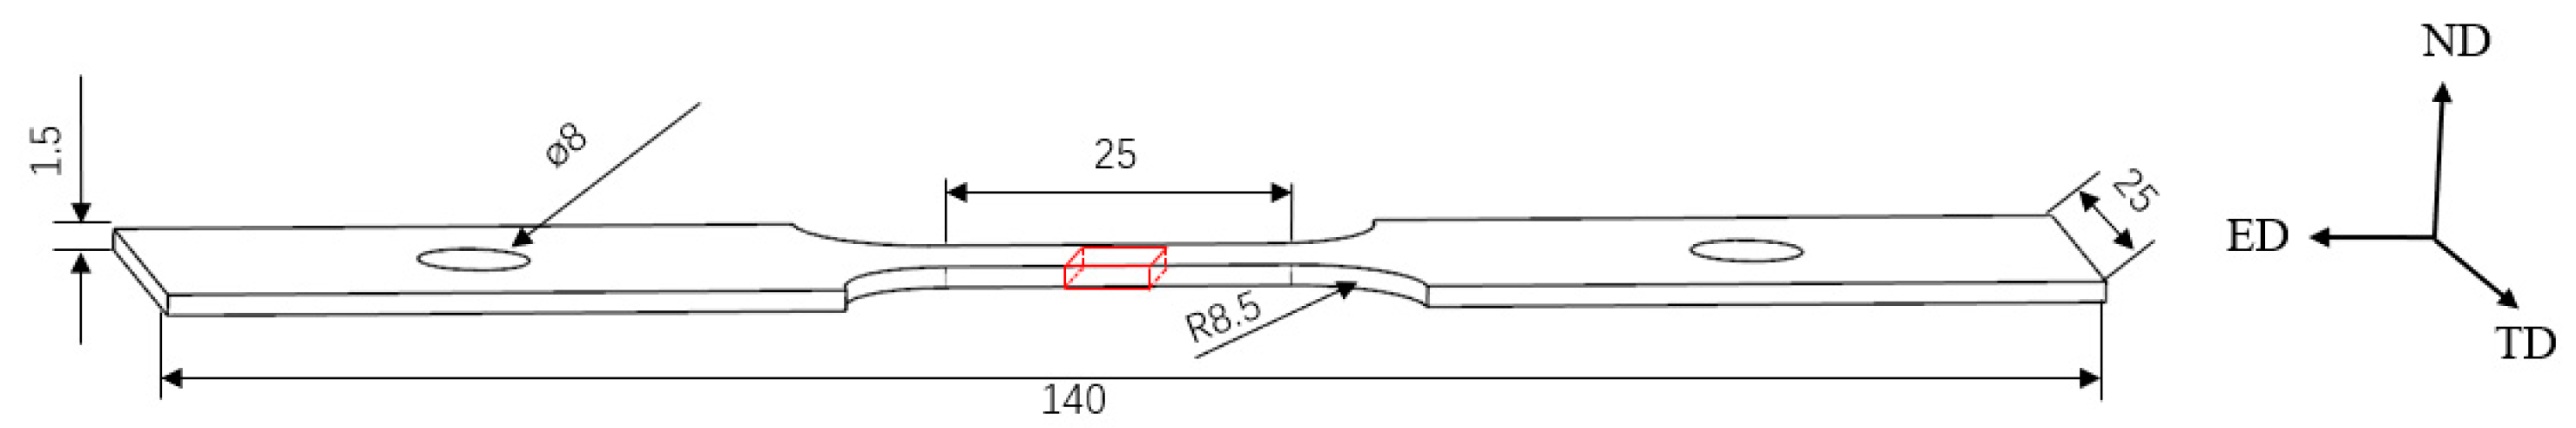
2.1. Materials and Experimental Methods

In this paper, an MnE21 magnesium alloy extrusion plate was used, and its main chemical composition (wt%) is shown in Table 1.
The MnE21 magnesium alloy sheet was cut into uniaxial tensile specimens along the extrusion direction, as shown in Figure 1, and the sample used for electron backscatter diffraction (EBSD) testing is shown in the box in the Figure 1.
The specimens were stretched at different temperatures and strain rates on the universal high-temperature testing machine, and the temperature range used was 300 °C to 500 °C with 50 °C interval. Each specimen was heated to the set temperature, held for 5 min, and then subjected to the hot tensile test. After testing, the specimen was immediately cooled in water, to retain the structural characteristics after thermal deformation.
The surfaces of the specimens used for microscopic characterization were sanded with SiC paper with a grit size of 600# to 7000#, and then polished on nylon cloth. Finally, the specimens were subjected to electrolytic polishing in AC2 solution (800 mL of ethanol, 100 mL of propanol, 15 mL of perchloric acid, 18.5 mL of distilled water, 41.5 g of sodium thiocyanate, 10 g of hydroxyquinoline, and 75 g of citric acid) for about 60 s with a DC voltage of 20 V.
The specimens were analyzed by EBSD using a JSM-7900F field emission scanning electron microscope produced by Japan Electronics Corporation, Tokyo, Japan equipped with Aztec Crystal 2.1 from Oxford Instruments, Oxford, UK and the scanning step is 1.5 µm, followed by subsequent processing using CHANNEL 5.0 by Oxford Instruments, Oxford, UK.

2.2. Numerical Methods

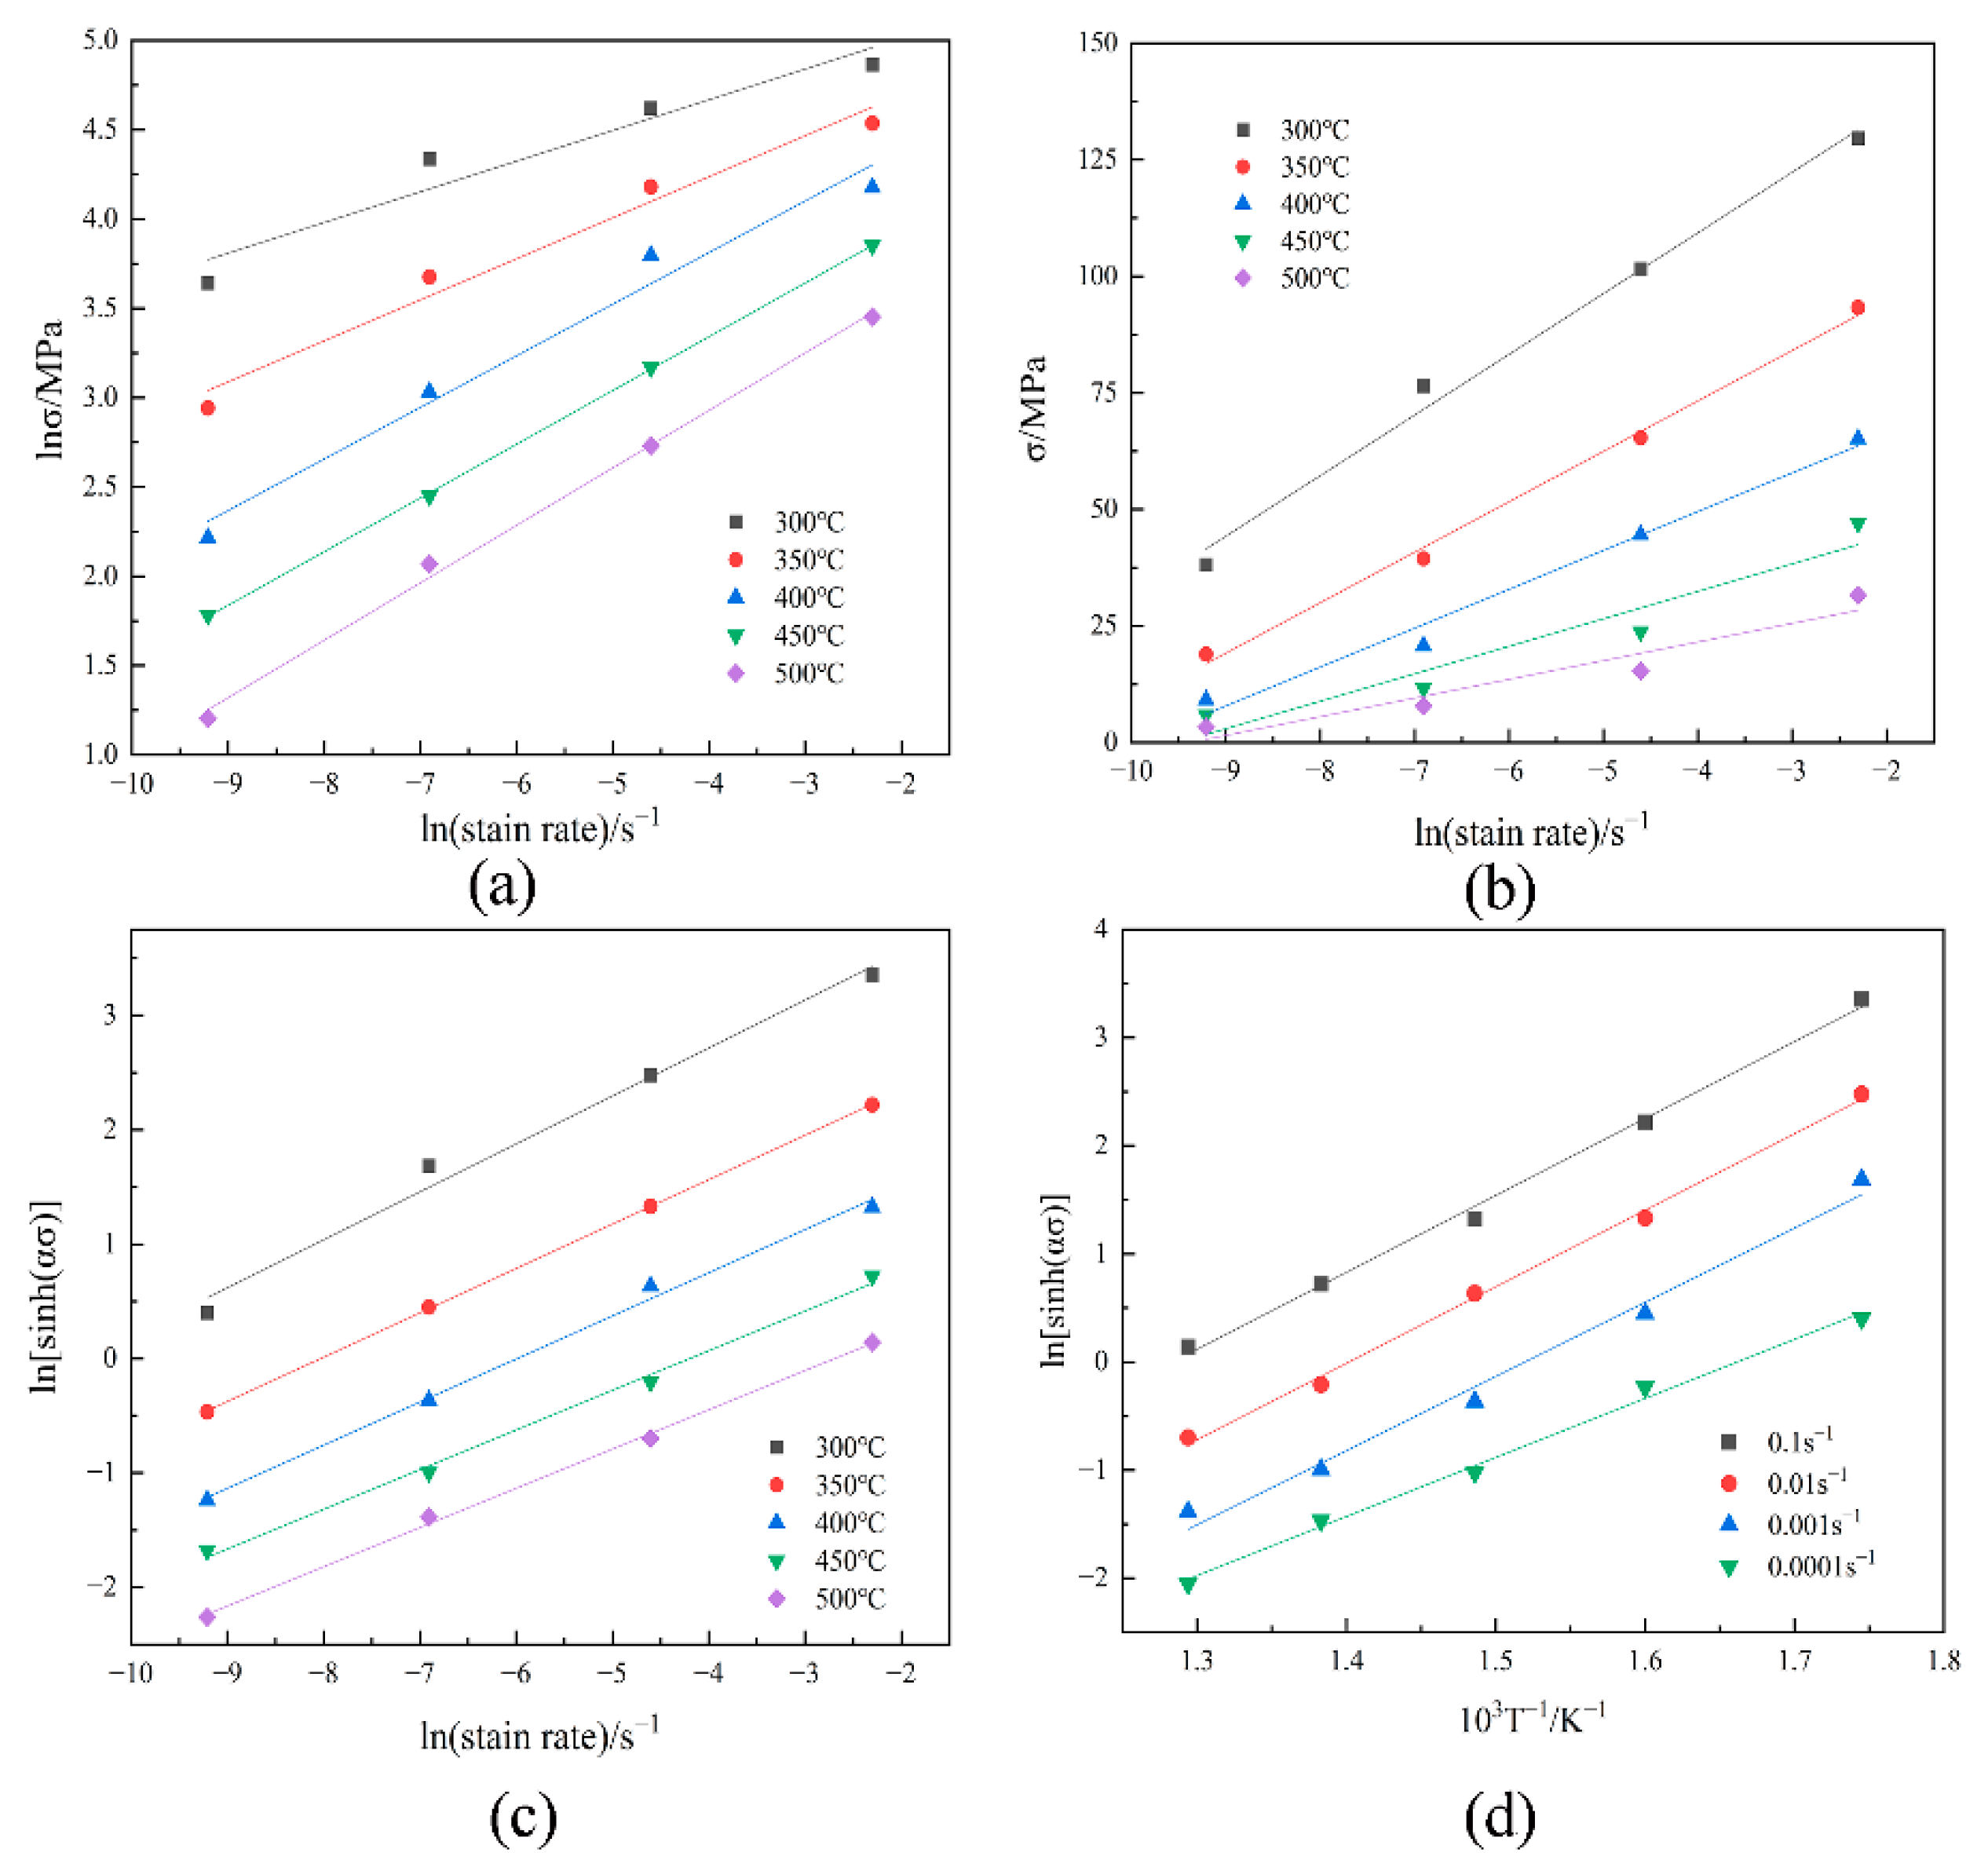
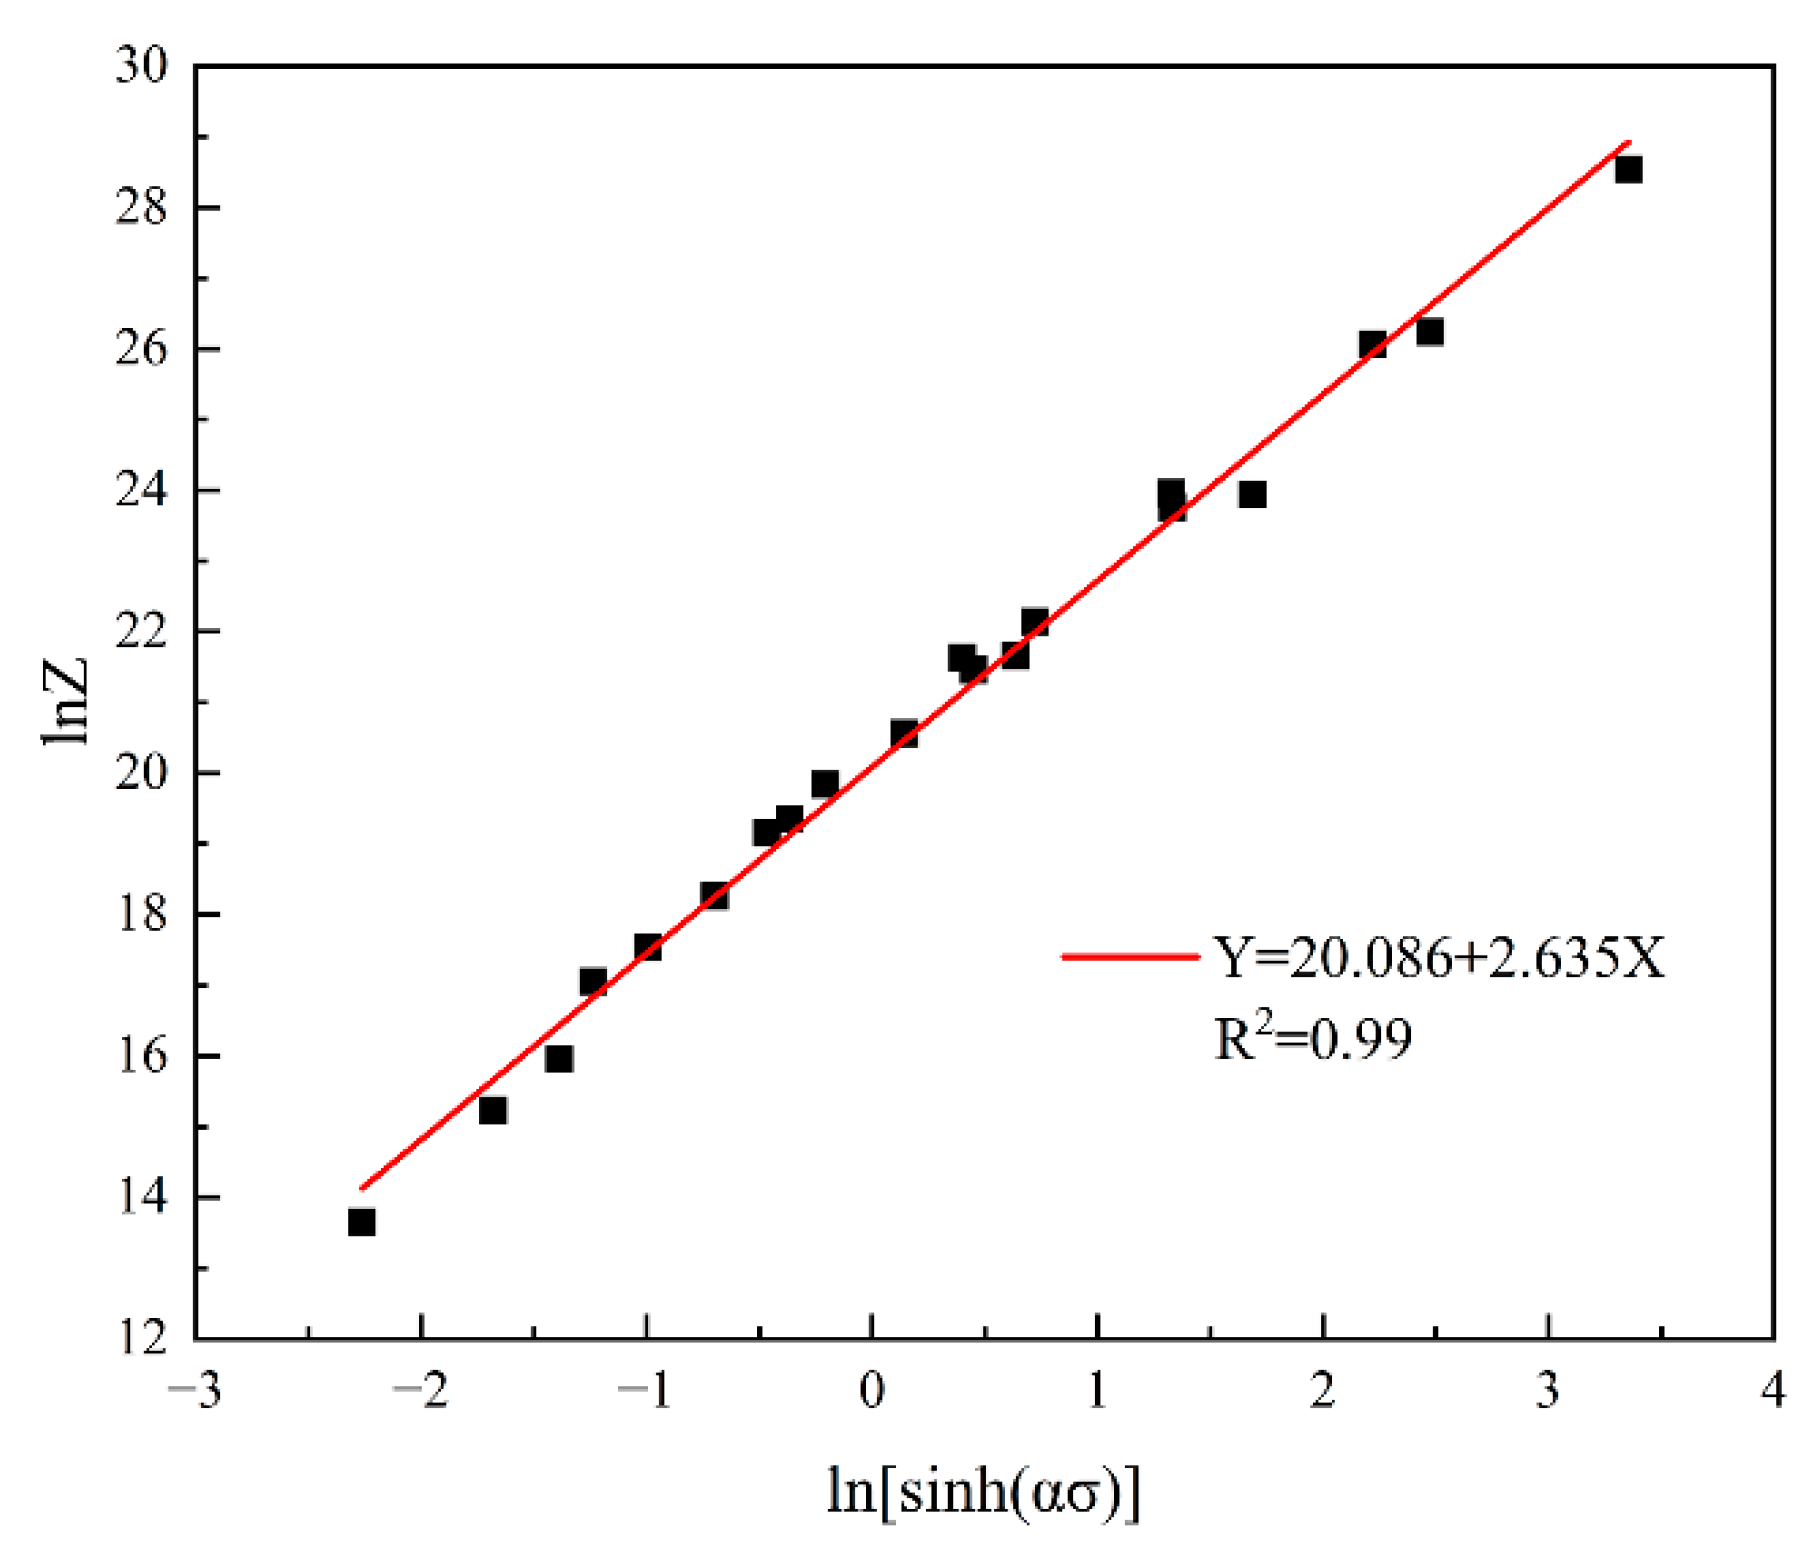
2.2.1. Hyperbolic Sine Arrhenius Model

Arrhenius-type equations have been frequently used to determine the deformation activation energy and hot deformation behavior of alloys. In accordance with the different stress levels, the Arrhenius constitutive equation can be expressed in three forms [20]:
ε ˙ = A sin h ( α σ ) n exp ( - Q / RT )
ε ˙ = A 1 σ n 1 exp ( - Q / RT )   α σ   <   0.8
    ε ˙ = A 2 exp ( β σ ) exp ( - Q / RT )   α σ   >   1.2
The Zener–Hollomon parameter Z =   ε ˙   exp ( Q / RT ) was introduced to measure the combined effect of temperature and deformation rate on plastic deformation [21].
Z   = A sin h ( α σ ) n
Meanwhile, the expression of flow stress is obtained as:
σ = ( 1 / α ) ln ( Z / A ) 1 / n + ( Z / A ) 2 / n + 1 1 / 2
  ε ˙ : strain rate   ( s 1 ); σ : the flow stress   ( MPa); Q: deformation activation energy (J/mol); R: 8.314 J·mol −1K−1; T: absolute temperature ( K);   A , A 1 , A 2 , α , β , n, and n1 are the material constants, where α = β / n 1 .
Taking the natural logarithm for each side of Equations (2) and (3) give the corresponding expressions as follows:
ln ε ˙ = lnA 1 + n 1 ln σ - Q / ( RT )
ln ε ˙ = lnA 2 + β σ   - Q / ( RT )
After determining the parameter α, it is necessary to make further correction to the value of n [15]. Similarly, taking the logarithm of both sides of Equation (1), we can obtain the following equation:
ln   ε ˙ = lnA + nln sin h ( α σ )   - Q / ( RT )
Equation (8) can be changed to below equation:
Q / ( RT ) + ln   ε ˙   - lnA = nln sin h ( α σ )    
From Equation (9), we can see that ln sin h ( α σ ) - 1000 / T is linear at a constant strain rate with slope K = Q / ( nR ) .
The simultaneous logarithm of both sides of Equation (4) results in Equation (10):
lnZ = lnA + nln sin h ( α σ )
According to the above process, the parameters needed to construct the Arrhenius-type constitutive equation can be obtained.

2.2.2. Processing Maps

In the DMM (Dynamic Material Model) model, the target workpiece is considered as a power dissipation system with the following expression [22]:
P = σ ·   ε ˙ = 0 ε ˙ σ d   ε ˙ + 0 σ   ε ˙   d σ = G + J
In Equation (11), P represents the total external energy input, G represents the dissipation and J represents the dissipative co-efficient [23]. The relationship between the flow stress and strain rate during material deformation at constant temperature is [16]:
σ = K ε ˙ m
K is the material constant; m is the strain rate sensitivity factor expressed as:
m = J / G = ε ˙   d σ / σ d   ε ˙ = ln σ / ln ε ˙ ε , T Δ log σ / Δ log   ε ˙
Using cubic polynomial fitting, the variation pattern of flow curves under different deformation conditions can be simply described as:
log σ = a + blog ε ˙ + c ( log ε ˙   ) 2 + d ( log ε ˙   ) 3
By regression analysis of the above data, the temperature-dependent material constants a, b, c, and d can be obtained and differentiation of Equation (14) yields:
m = Δ log σ / Δ log   ε ˙ = ( log σ ) / ( log ε ˙   ) = b + 2 c ( log ε ˙   ) + 3 d ( log ε ˙   ) 2
Denote the dissipative coefficients J by an equation containing m:
J = 0 σ   ε ˙   d σ = ( m / m + 1 ) σ   ε ˙
Power dissipation efficiency is η defined as the ratio of the dissipative co-efficient to its maximum, and the higher the η, the better the machining performance of the material.
η = J / J max = 2 m / m + 1
Processing instability can also occur in certain regions with high dissipation rates, and it is necessary to determine the instability region according to the instability maps.
The instability function is shown as:
ξ ε ˙ = ln m / m + 1 / ln   ε ˙ + m = ( 2 c + 6 d log   ε ˙   ) / m ( m + 1 ) ln 10 + m
ξ ε ˙ is a dimensionless parameter, and the instability of the material can be plotted by combining different deformation temperatures and strain rates. A negative value of the instability function ξ ε ˙ , indicates that flow instability occurs during the deformation process, and the instability region should be avoided during processing.

3. Results and Discussion

3.1. Flow Stress Behavior

The true stress–strain curves of the tensile specimens at 300~500 °C with strain rate at 10−1 s−1~10−4s−1 are shown in Figure 2. As can be seen, in the initial stage of stretching, the stress increases sharply with the increase of strain, this is process hardening caused by the entanglement and stacking of dislocations. After reaching a stress peak, a steady state is observed when the work hardening and dynamic recrystallization reach a dynamic equilibrium, especially at high temperatures and low strain rates, and the magnitude of the stress hardly changes with increasing strain, but these do not fully reflect the hot workability of the material. Further study of the processing properties is possible with the help of constitutive equations and hot processing maps.

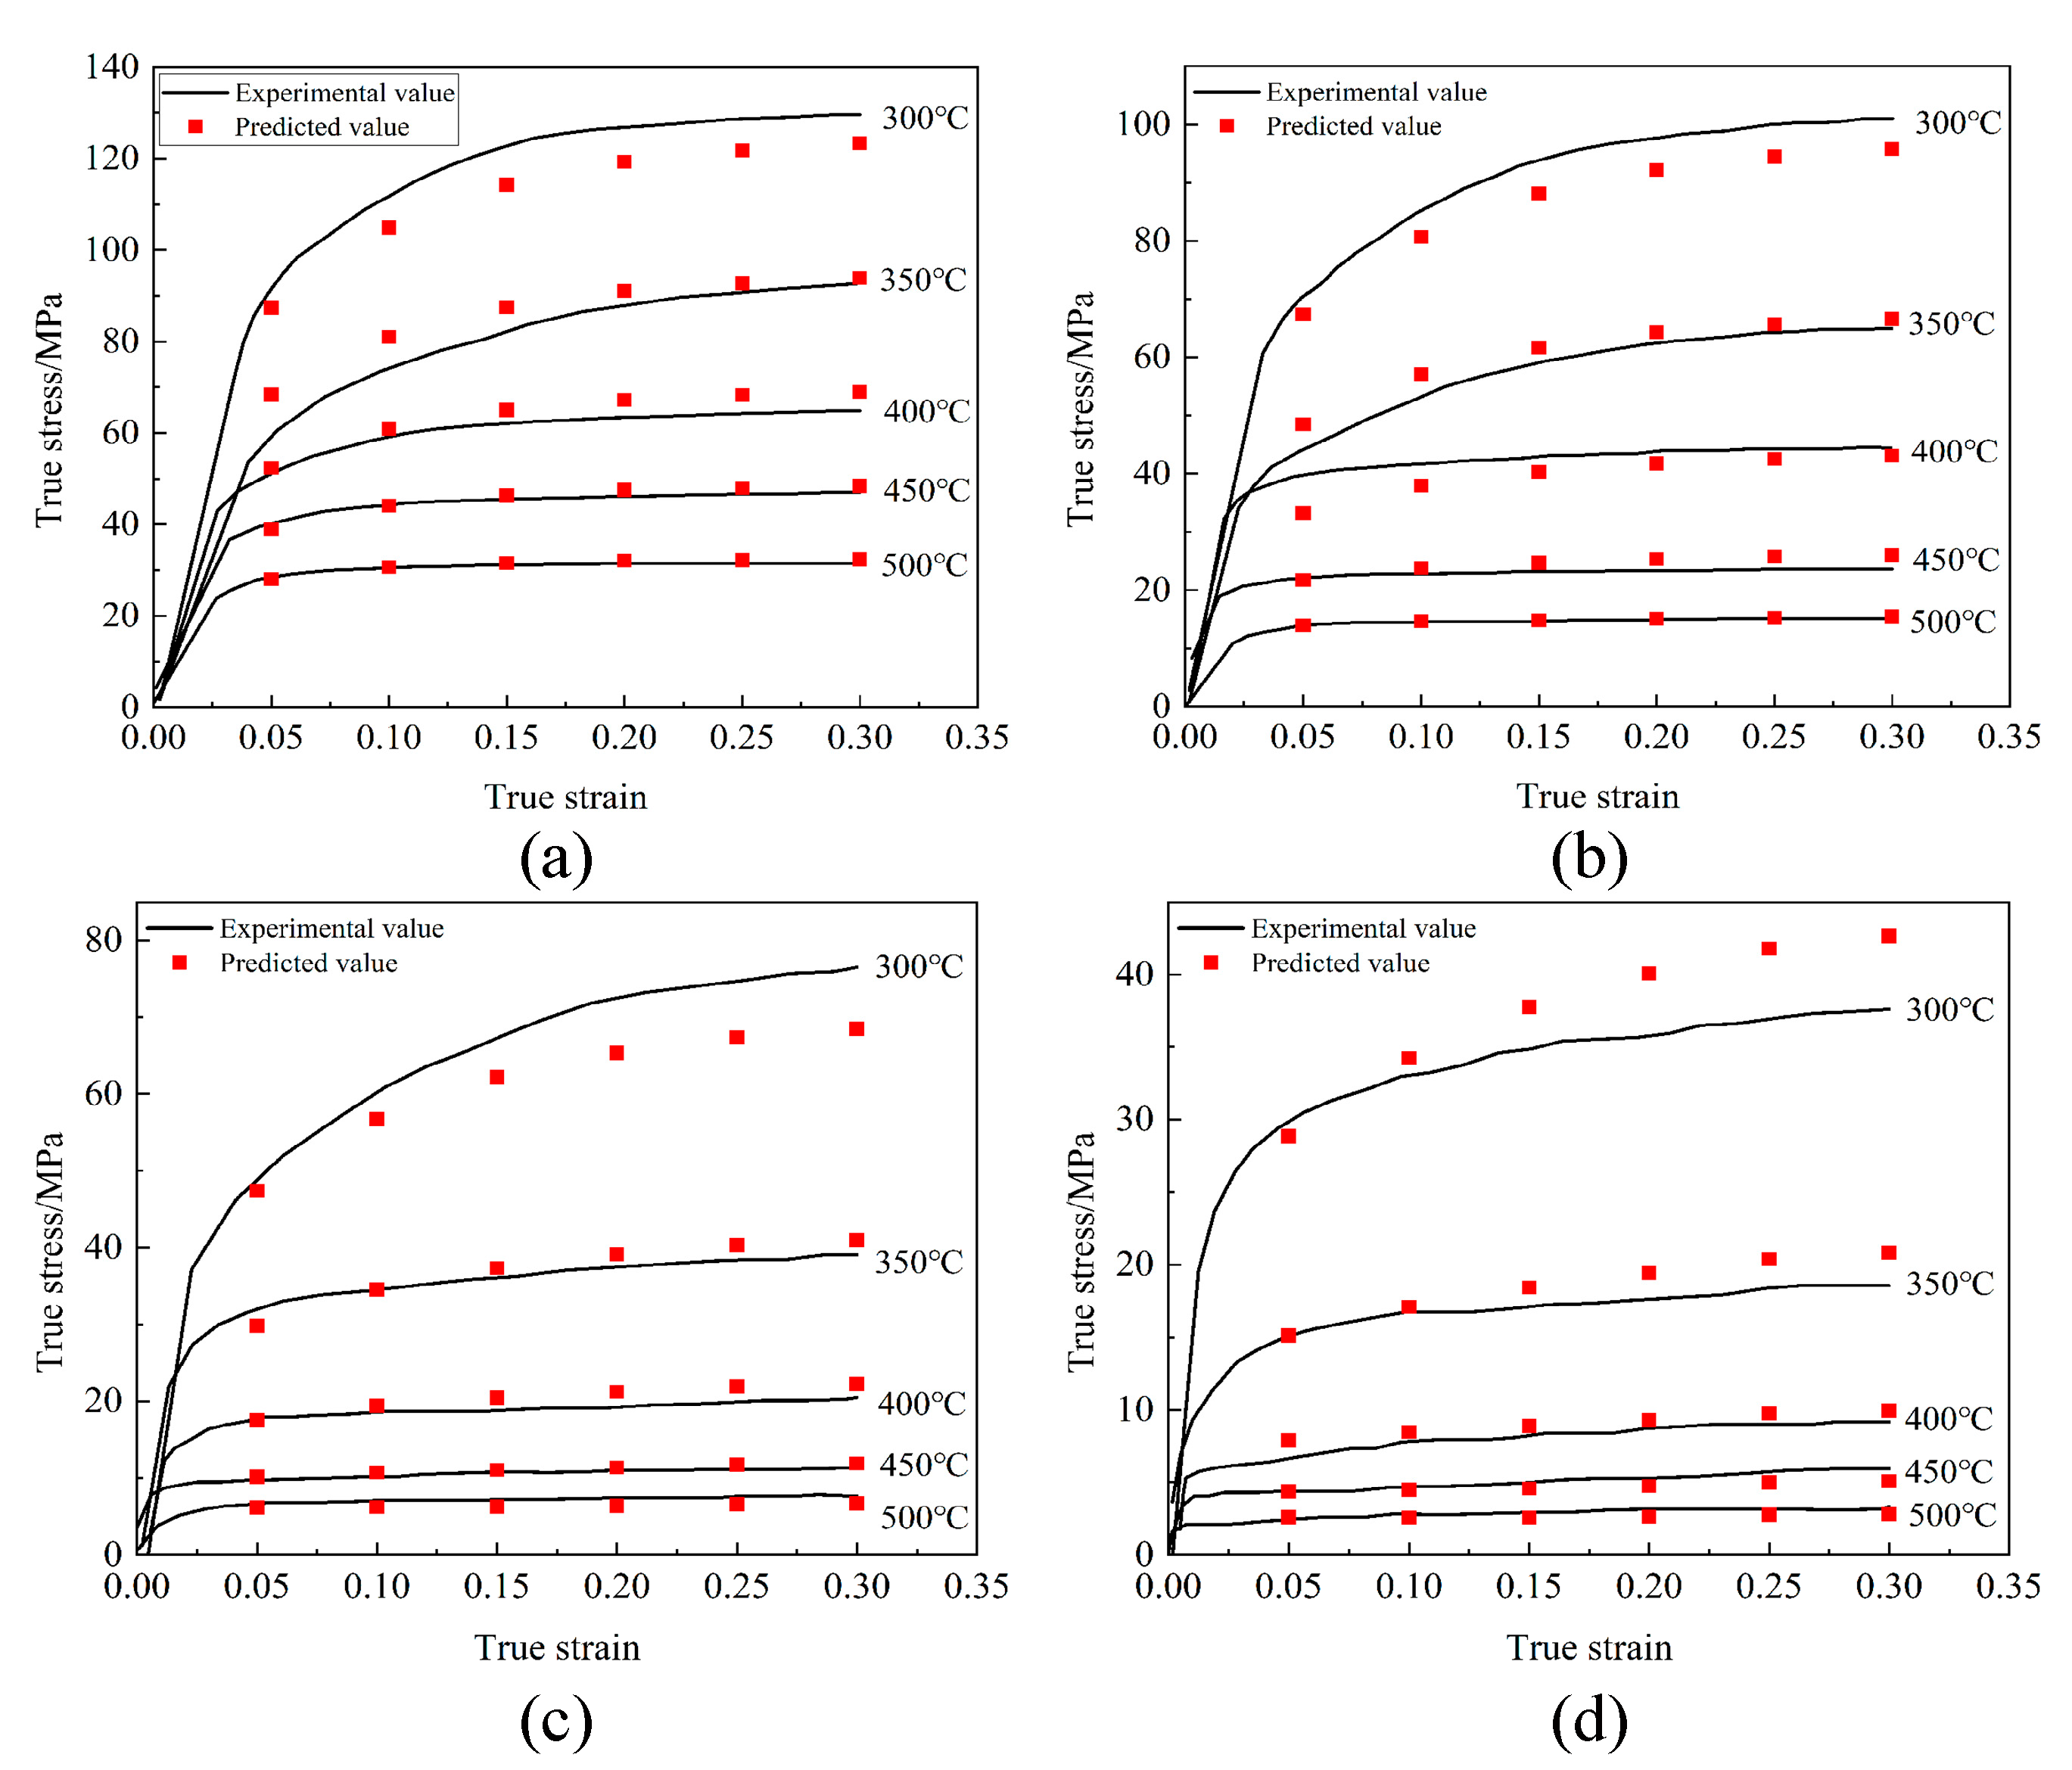
3.2. Analysis of Constitutive Behavior

In order to study the flow behavior of the MnE21 magnesium alloy sheet during hot working, the peak stresses on the flow curve are used to calculate the constitutive equation parameters in this work. The variation in peak stresses with temperature under different strain rates is shown in Table 2.
According to Equations (6) and (7), we substituted the peak stresses to make ln σ - ln   ε ˙ , σ - ln   ε ˙ fitting curves, as shown in Figure 3a,b. Then, obtained n 1 = 3 . 80 , β = 0.12 , respectively, which can calculate the stress level parameter α = β / n 1 = 0 . 03 . Substituting the obtained α = 0.031 into Equation (8) for curve fitting, as shown in Figure 3c, we can obtain a corrected n of 2.67. According to Equation (9), plotting the ln sin h α σ - 1000 / T fitting curves as shown in Figure 3d, we can obtain k = 6.63, and thus we can obtain Q = 1000   K = 146950.2   J / mol .
From Equation (10), we can find that lnZ and ln[sinh(ασ)] are linearly related. Bringing the activation energy Q, deformation temperature T, and strain rate   ε ˙   into the expression, the corresponding values of temperature compensation factor Z can be obtained, and bringing the peak stresses under each condition into (ln[sinh(ασ)], lnZ), multiple data points can be gained, and linear regression analysis is fitted to these points, and the results are shown in Figure 4.
The correlation coefficient R2 = 0.99 was obtained by linear regression fitting, this result fully proves that the relationship between the flow stress of MnE21 magnesium alloy and strain rate can be described using the hyperbolic sine function in the Arrhenius-type constitutive model. In addition, combining Z = ε ˙   exp ( Q / RT ) with Equation (10) we can find A = 5.29 × 10⁸, and then bringing in the required parameters, we can obtain the constitutive equation of MnE21 magnesium alloy as:
  ε ˙ = 5 . 29   ×   10 8 sin h ( 0 . 031 σ ) 2 . 67 exp 146950.2 / ( RT )
σ = 1 / 0 . 031 ln ( Z / 5 . 29   ×   10 8 ) 1 / 2 . 67 + ( Z / 5 . 29   ×   10 8 ) 2 / 2 . 67 + 1 1 / 2
where Z = ε ˙   exp ( 146950 . 02 / RT )
In above analysis, the effect of strain on the material parameters is not considered. The flow stresses at different strain states are not the same. The effect of strains on the flow behavior of metallic materials at high-temperature states is remarkable [24,25]. While Arrhenius does not consider the effect of strain on material parameters, it is necessary to establish strain compensation for the present constitutive equation by extracting the stresses values corresponding to strains from 0.05 to 0.30 at an interval of 0.05 and solving for the material constants α, n, Q, and lnA under different strain conditions, as described in the previous section. Figure 5 shows the variation of the material constants with strain.
A polynomial was fitted to each of the above four parameters, and the quintic polynomial had high fitting accuracy, and the expressions are shown below:
  α = 0 . 058   -   0 . 429 ε + 3 . 233 ε 2 -   12 . 852 ε 3 + 25 . 102 ε 4   -   18 . 586 ε 5 n = 2 . 987   -   12 . 151 ε + 143 . 665 ε 2   -   877 . 756 ε 3 + 2705 . 672 ε 4   -   3226 . 875 ε 5   Q = 133230 . 275   -   313699 . 934 ε + 6 . 617 E 6 ε 2   -   4 . 609 E 7 ε 3 + 1 . 432 E 8 ε 4   -   1 . 662 E 8 ε 5   A = 3 . 873 E 8   -   1 . 664 E 10 ε + 2 . 604 E 11 ε 2   -   1 . 786 E 12 ε 3 + 5 . 827 E 12 ε 4   -   7 . 137 E 12 ε 5
Substituting the above expressions for each parameter into Equation (5), the calculation process is more complicated. The predicted stress values were obtained by running the calculation program on Matlab, and then the values were compared with those obtained from tensile tests, and the results are shown in Figure 6. The results show that the compensation constitutive equation can well reflect the flow stress of MnE21 magnesium alloy at high temperature.

3.3. Hot Processing

The hot processing maps of Mn21 alloy at different strains is established based on the DMM model. The flow stresses with strain variables of 0.1, 0.2, and 0.3 were selected to find out the power dissipation efficiency and construct the corresponding power dissipation maps respectively, and the stresses corresponding to different conditions are shown in the Table 3.
The value of power dissipation efficiency η are calculated according to Equation (17), and the power dissipation maps are plotted by combining the strain rates   ε   ˙ and the deformation temperatures T. Figure 7(a1–c1) show the power dissipation maps for strains ε = 0.1, ε = 0.2 and ε = 0.3, respectively.
From the power dissipation maps, the power dissipation efficiency constants are concentrated in the range of 0.23 to 0.57, which indicates that the change of strain has a small effect on the power dissipation of MnE21 magnesium alloy. However, the presence of various defects (loosening, voids, and cracks) in the deformation process and the dynamic recovery and recrystallization of the material reduces the total energy of the material. Processing instability can also occur in certain regions with high dissipation rates, and it is necessary to determine the instability regions according to the instability maps, which are composed of temperatures, strain rates, and instability functions.
The instability maps are formed by the instability coefficient ξ ε ˙ , the strain rates ε ˙ , and the deformation temperatures T. Figure 7(a2–c2) show the instability maps for the cases of strain ε = 0 . 1 , ε   = 0 . 2 , and ε   = 0 . 3 , respectively. From Figure 7(a2,b2), the instability regions under the strain ε   = 0 . 1 and ε   = 0 . 2 are approximately the same, and material instability occurs at strain rates of ε   ˙ = 1 × 10⁻¹s−1~1 × 10⁻²s−1. Instability exists at ε   ˙ = 1 × 10⁻¹s−1 at almost all temperatures, since the larger the strain rate, the shorter the time to respond to the strain, resulting in localization of the strain.
The resulting power dissipation maps are superimposed with the corresponding instability maps to obtain the MnE21 magnesium alloy hot processing maps as shown in Figure 7(a3–c3). The shaded areas in the figures are the instability zones during material processing, and the lines represent the different power dissipation factors. It can be observed that the region of high dissipation efficiency exists in the low strain rates as well as the high-temperature region. Considering the dissipation factor as well as the instability region, the suitable region for processing is 300 °C~350 °C with a strain rate of 1 × 10⁻²s−1~1 × 10⁻³s−1. Another suitable region for processing is between 450 °C and 500 °C. In this region, there is no instability region and the power dissipation coefficient does not vary significantly, making it suitable for processing at different strain rates.

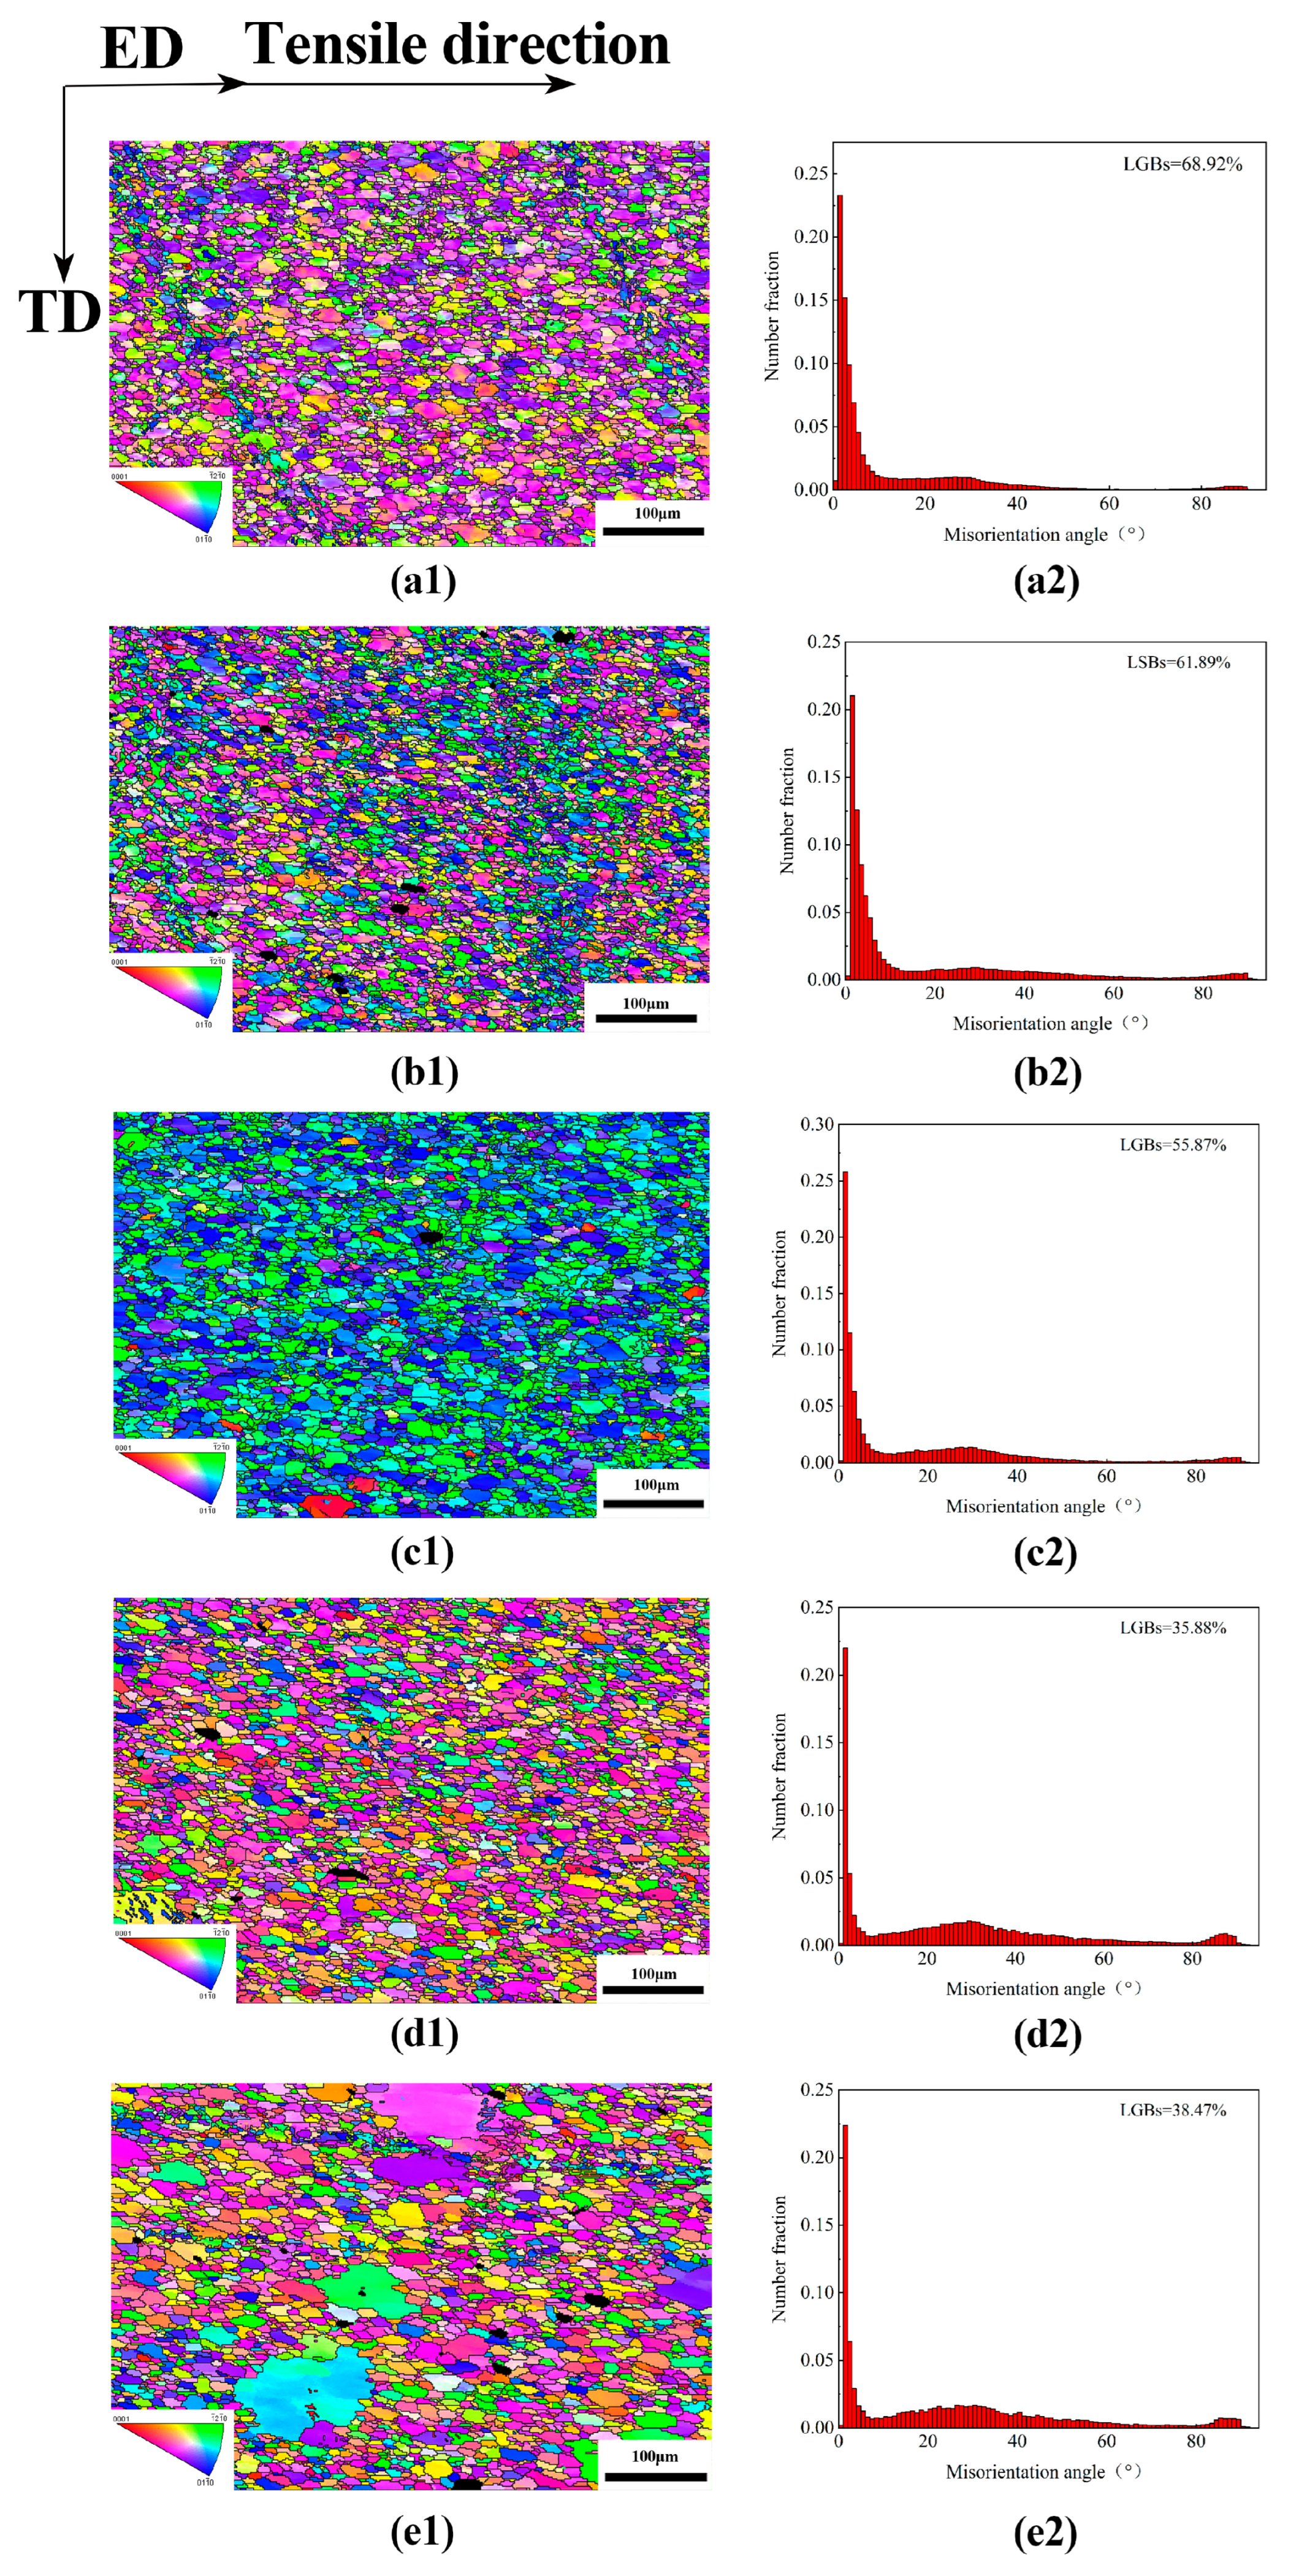
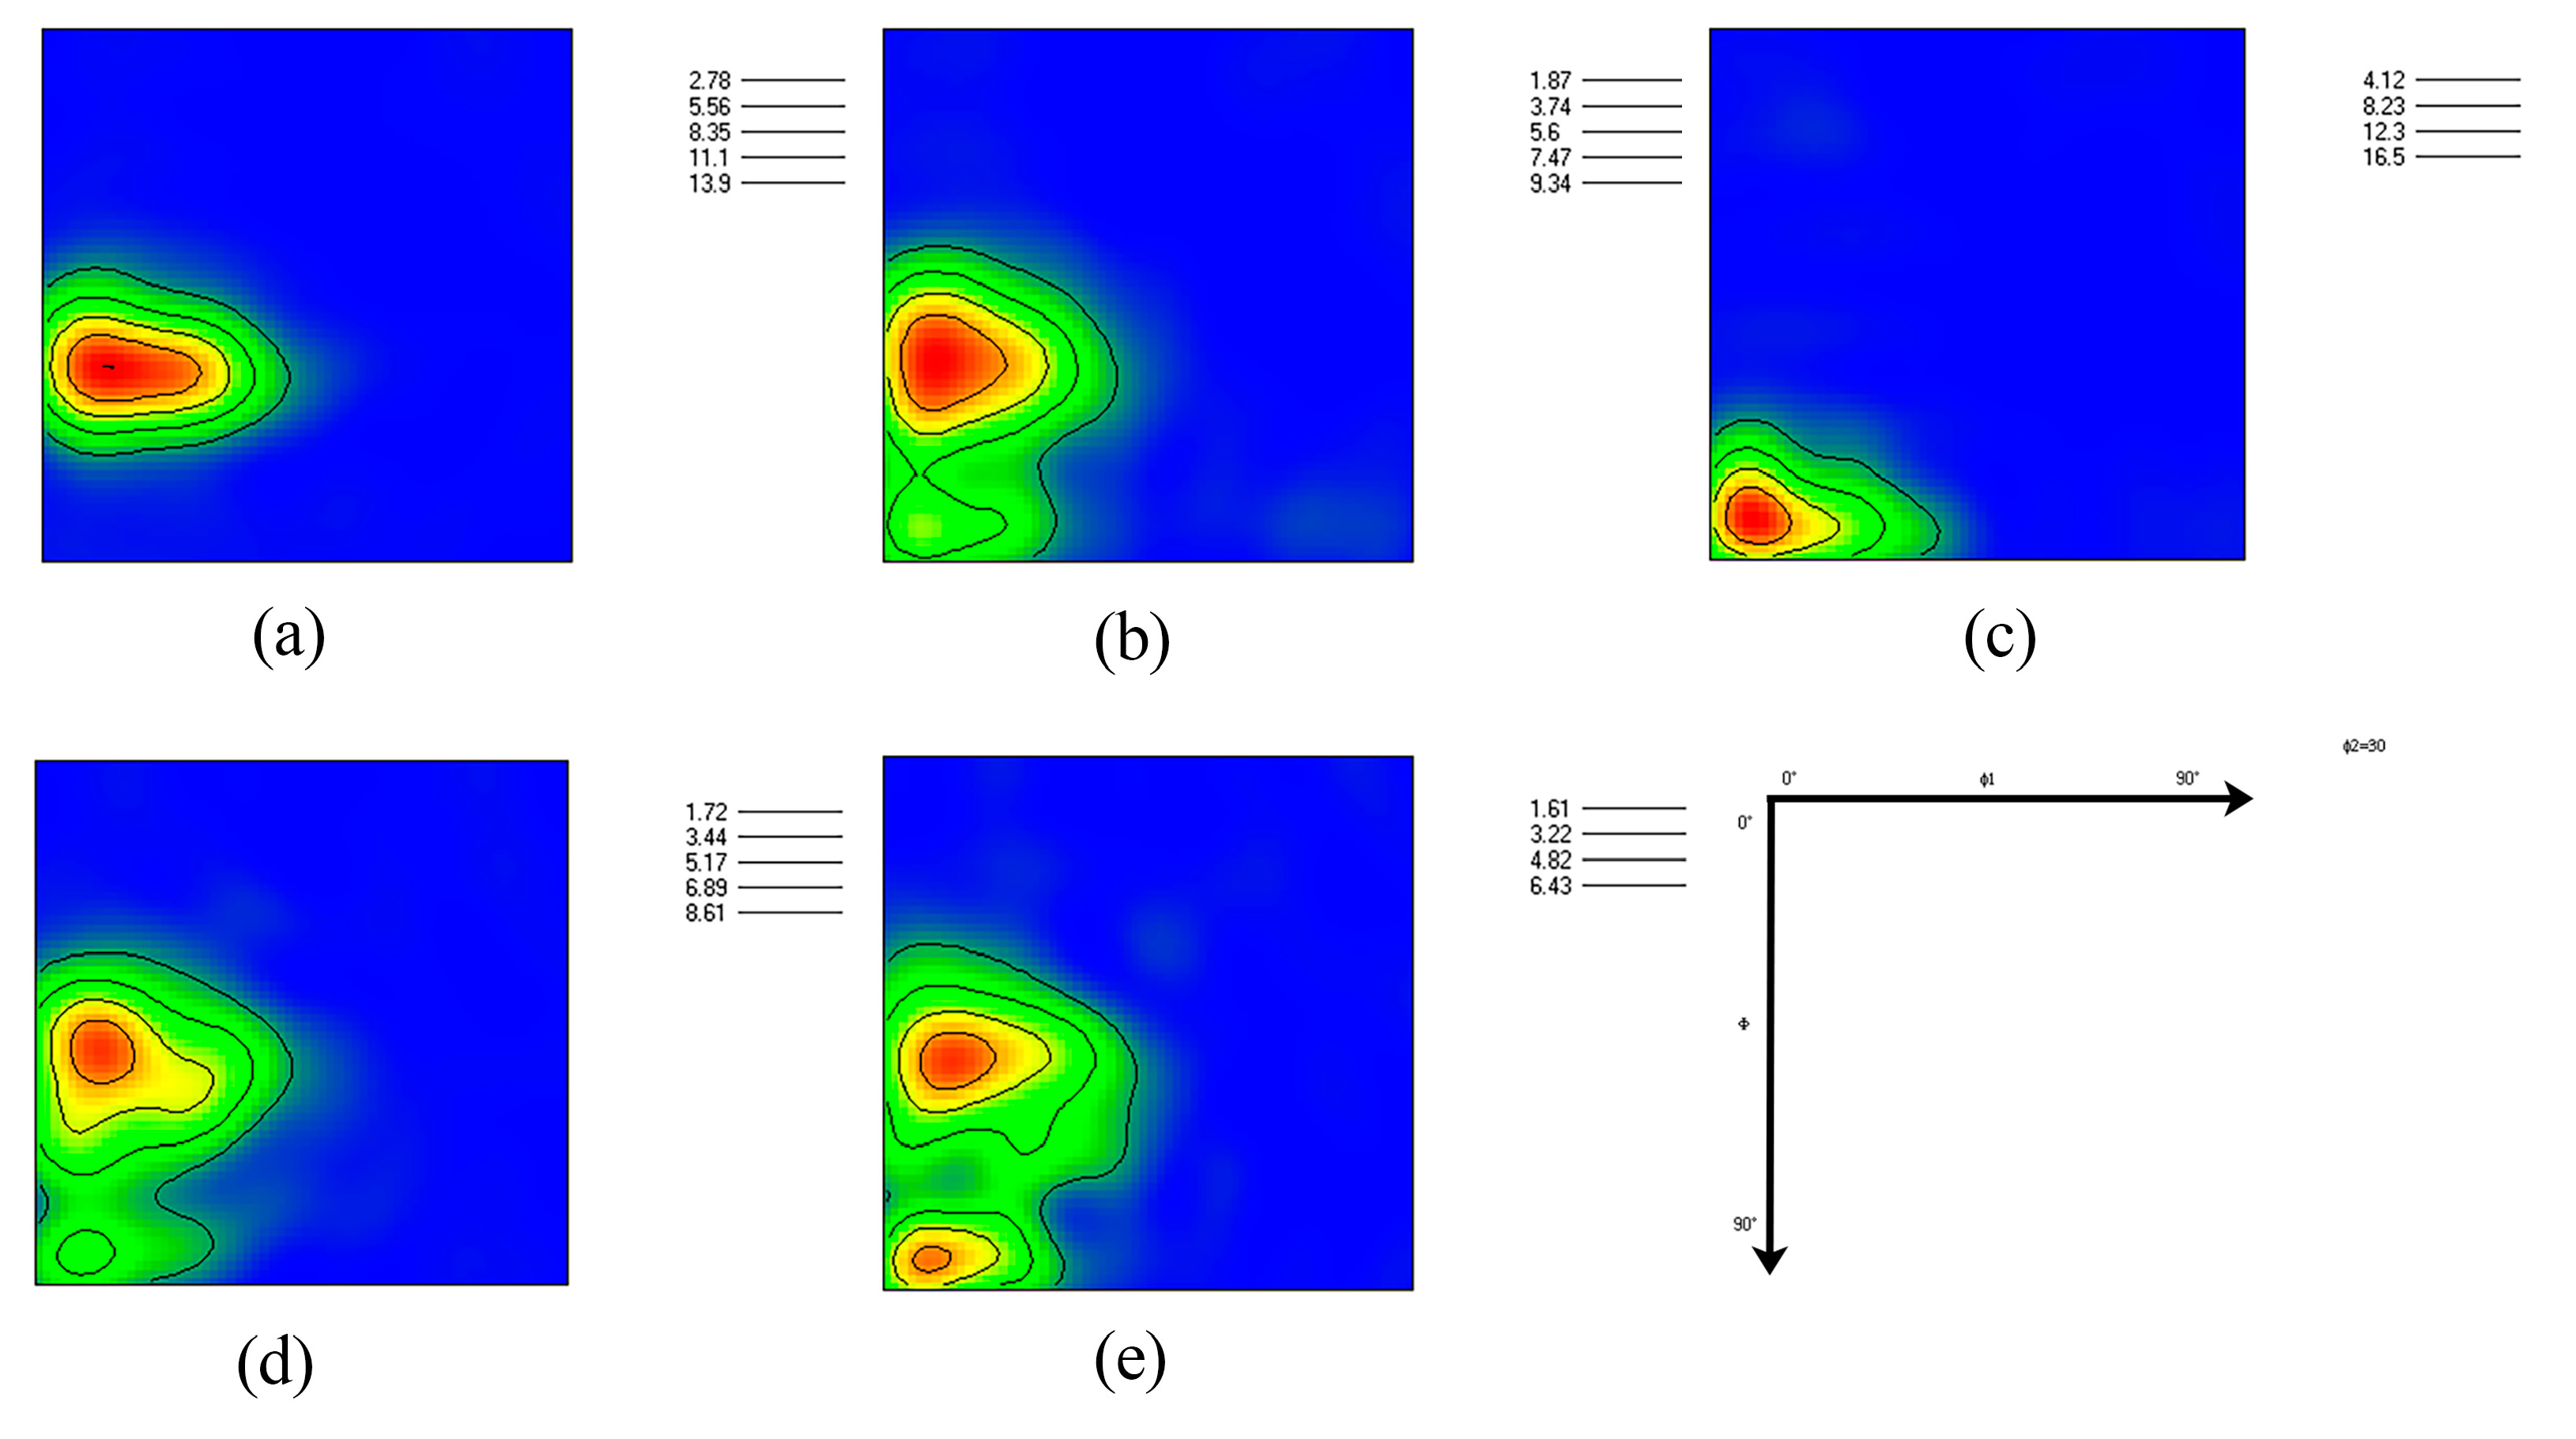
3.4. Microstructures of Deformed MnE21 Magnesium Alloy

According to the constructed hot processing maps, it can be seen the plastic forming of MnE21 magnesium alloy is suitable at a strain rate of   ε ˙ = 1 × 10⁻²s−1. It is necessary to investigate the microstructural evolution at this strain rate. The grain orientation distribution and grain boundary orientation distribution of different tensile specimens at a strain rate of     ε ˙ = 1 × 10⁻²s−1 and tensile temperatures of 300 °C~500 °C (50 °C interval) were analyzed by EBSD method and the results are shown in Figure 8.
The average size of grains at 300 °C was 6.179 μm, and the average size of grains decreased to 5.584 μm when the temperature increased to 350 °C. Small grains were distributed at the boundary of coarse grains, showing typical dynamic recrystallization characteristics. The average size of grains at 400 °C and 450 °C is 6.423 μm and 6.254 μm, respectively, and the average size of grains at 500 °C is 7.571 μm, which indicates that dynamic recrystallization occurs at 350~400 °C.The crystals remain in a stable recrystallization state from 400 to 450 °C, but they start to grow when the temperature increases to 500 °C.
As can be seen from Figure 8(a1–e1), the grain orientation at 400 °C is clearly different from that at other temperatures. In fact, a small change in grain orientation has occurred at 350 °C. This is because during plastic deformation, forging, stretching, and other deformation methods will locally reorient the newly recrystallized grains, but this phenomenon will become less pronounced as the temperature increases, with the result that the final grains are aligned with the stretching direction [26,27].
Figure 8(a2–e2) show the changing trend of grain boundary orientation difference with the increase in deformation temperature. The lower the proportion of small-angle grain boundaries (LAGBs), the more adequate the dynamic recrystallization, which means that at 450 °C, the dynamic recrystallization of MnE21 magnesium alloy is more adequate. The smaller difference in the proportion of small-angle grain boundaries below 450 °C is mainly due to the slower diffusion and thermal vibration of atoms at lower temperatures, which are not sufficient to provide sufficient driving force for dynamic recrystallization. In further study, dynamic recrystallization is divided into continuous dynamic recrystallization and discontinuous dynamic recrystallization. The main characteristics of discontinuous dynamic recrystallization are repetitive nucleation, limited growth, and a typical chain structure during grain growth, which can be seen in the range of 300 °C to 500 °C, all showing typical discontinuous dynamic recrystallization. After 450 °C, the increase in grain boundary diffusion and grain boundary migration ability prompted the readjustment of dislocations in deformation, which was conducive to the merging of dissimilar dislocations and the reduction of dislocation density, thus promoting the growth of dynamically recrystallized grains.
Figure 9a–e show the pole figures at different temperatures and it can be found that the specimens all show a typical extrusion texture distributed along the extrusion direction (ED) in the {0001} pole figure. The strength of the texture decreased substantially at 350 °C. This is due to the de-twinning process that exists within the extruded state, and this de-twinning process is reversible [28,29]. In other words, when the temperature increases, the strength of the texture returns to its previous level, as evidenced by the increase in the strength of the texture at 400 °C.
However, the polar figure is a two-dimensional planar diagram, the polar figure reflects the orientation of the crystal mainly by the density accumulation of many points, and the crystal orientation does not necessarily change when the density accumulation changes. Therefore, the polar figure does not yet allow for quantitative analysis of the crystal orientation.
The orientation distribution function (ODF) can be used to quantitatively analyze the crystal structure accurately. The distribution function is based on the polar angle φ1 and the polar distance φ parameters to indicate the orientation of the crystal axis or the poles of the crystal plane and Φ 2 to indicate the rotation angle of the crystal around the crystal axis. Φ 1 and Φ 2 are obtained in the form of Euler angles, and since the magnesium alloy is a dense hexagonal structure, the orientation of the important cross-section Φ 2 = 0° and Φ 2 = 30° is usually used for the analysis. The obtained Euler angles are calculated to obtain the specific grain orientation, and the calculation formula is as follows.
h k i l = 3 / 2 - 1 / 2 0 0 1 0 - 3 / 2 - 1 / 2 0 0 0 c / a sin Φ 2 sin Φ cos Φ 2 sin Φ cos Φ
u v t w = 2 / 3 - 1 / 3 0 0 2 / 3 0 - 2 / 3 - 1 / 3 0 0 0 c / a cos Φ 1 cos Φ 2 - sin Φ 1 sin Φ 2 cos Φ - cos Φ 1 sin Φ 2 - sin Φ 1 cos Φ 2 cos Φ sin Φ 1 sin Φ
According to Figure 10a, the maximum grain orientation density at 300 °C is Φ 1 = 10 ° , Φ = 55 ° , Φ 2 = 30 ° . After calculation, its texture index is (01-11) [2-1-11]. The strength of the texture decreases as the temperature rises to 350 °C, as shown in Figure 10b, indicating that the increase in temperature contributes to the decrease in the strength of the crystal texture [30]. In addition, the (01-10) [2-1-10] structure starts to appear in small amounts at 350 °C, while at 400 °C, from Figure 10c, we can find that (01-11) [2-1-11] disappears completely and (01-10) [2-1-10] dominates, this is because during the deformation process, the grains are reoriented. Figure 10d shows the texture at 450 °C; there are two kinds of textures inside the crystal, and the textural indices are (01-11) [2-1-11], (01-10) [2-1-10]. The texture at 450 °C is almost the same as that at 350 °C, which is consistent with the point mentioned earlier that reorientation of the grains occurs at 400 °C and that this orientation can be recovered. Figure 10e shows that at 500 °C, the textural indices are still (01-11) [2-1-11], (01-10) [2-1-10], and the strength of the two textures is reduced.

4. Conclusions

(1)
According to the obtained data, the high-temperature constitutive equation of MnE21 magnesium alloy was constructed, and strain compensation was applied to the constitutive equation to better characterize the high-temperature flow behavior of MnE21 magnesium alloy.
(2)
Strain rates have a significant effect on the processing of MnE21 magnesium alloy, and it was found that when ε ˙   =   1 × 101s−1, material destabilization occurs, but a higher temperature can offset this negative effect to some extent. For this alloy, the suitable processing temperature range is 450 °C to 500 °C.
(3)
MnE21 magnesium alloy undergoes significant dynamic recrystallization at 350 to 500 °C. In addition, the reorientation of the grains of MnE21 magnesium alloy occurs at 400 °C. This phenomenon also leads to changes in the internal crystal structure, and the grain orientation and structure are restored as the temperature increases.

Author Contributions

Conceptualization, writing—review and editing, investigation, validation X.L.; methodology, software, writing—original draft preparation, formal analysis, J.W.; visualization, Y.J.; supervision, M.Z. All authors have read and agreed to the published version of the manuscript.

Funding

This work was supported by Jilin Province Natural Science Foundation of China (20200201056JC).

Institutional Review Board Statement

Not applicable.

Informed Consent Statement

Not applicable.

Data Availability Statement

Not applicable.

Conflicts of Interest

The authors declare no conflict of interest.

References

  1. Joost, W.J.; Krajewski, P.E. Towards magnesium alloys for high-volume automotive applications. Scr. Mater. 2017, 128, 107–112. [Google Scholar] [CrossRef]
  2. Deng, J.-F.; Tian, J.; Zhou, Y.; Chang, Y.; Liang, W.; Ma, J. Plastic deformation mechanism and hardening mechanism of rolled Rare-Earth magnesium alloy thin sheet. Mater. Des. 2022, 218, 110678. [Google Scholar] [CrossRef]
  3. Zhang, L.; Qi, G.; Ma, L.; Dai, Y.; Wang, Q.; Wang, R.; Huang, W. Study on Joint Structure and Fatigue Properties of Magnesium Alloy Active TIG Welding and TIG Welding. J. Phys. Conf. Ser. 2020, 1578, 012197. [Google Scholar] [CrossRef]
  4. Zeng, Z.; Salehi, M.; Kopp, A.; Xu, S.; Esmaily, M.; Birbilis, N. Recent progress and perspectives in additive manufacturing of magnesium alloys. J. Magnes. Alloys 2022, 10, 1511–1541. [Google Scholar] [CrossRef]
  5. Easton, M.; Beer, A.; Barnett, M.; Davies, C.; Dunlop, G.; Durandet, Y.; Blacket, S.; Hilditch, T.; Beggs, P. Magnesium alloy applications in automotive structures. Jom-Us 2008, 60, 57. [Google Scholar] [CrossRef]
  6. Liu, Y.; Zheng, Y.; Chen, X.-H.; Yang, J.-A.; Pan, H.; Chen, D.; Wang, L.; Zhang, J.; Zhu, D.; Wu, S.; et al. Fundamental Theory of Biodegradable Metals—Definition, Criteria, and Design. Adv. Funct. Mater. 2019, 29, 1805402. [Google Scholar] [CrossRef]
  7. Somekawa, H.; Singh, A.; Sahara, R.; Inoue, T. Excellent room temperature deformability in high strain rate regimes of magnesium alloy. Sci. Rep. 2018, 8, 656. [Google Scholar] [CrossRef]
  8. Ma, Z.; Hu, F.; Wang, Z.; Fu, K.; Wei, Z.; Wang, J.; Li, W. Constitutive Equation and Hot Processing Map of Mg-16Al Magnesium Alloy Bars. Materials 2020, 13, 3107. [Google Scholar] [CrossRef]
  9. Sellars, C.M.; McTegart, W.J. On the mechanism of hot deformation. Acta Metall. 1966, 14, 1136–1138. [Google Scholar] [CrossRef]
  10. Lin, Y.C.; Chen, X.-M. A critical review of experimental results and constitutive descriptions for metals and alloys in hot working. Mater. Des. 2011, 32, 1733–1759. [Google Scholar] [CrossRef]
  11. Duan, Y.; Ma, L.; Qi, H.; Li, R.; Li, P. Developed constitutive models, processing maps and microstructural evolution of Pb-Mg-10Al-0.5B alloy. Mater. Charact. 2017, 129, 353–366. [Google Scholar] [CrossRef]
  12. Hu, D.-C.; Wang, L.; Wang, H.-J. Dynamic Recrystallization Behavior and Processing Map of the 6082 Aluminum Alloy. Materials 2020, 13, 1042. [Google Scholar] [CrossRef] [PubMed]
  13. Zhou, Z.; Fan, Q.; Xia, Z.; Hao, A.; Yang, W.; Ji, W.; Cao, H. Constitutive Relationship and Hot Processing Maps of Mg-Gd-Y-Nb-Zr Alloy. J. Mater. Sci. Technol. 2017, 33, 637–644. [Google Scholar] [CrossRef]
  14. Liu, F.; Ma, J.; Peng, L.; Huang, G.; Zhang, W.; Xie, H.; Mi, X. Hot Deformation Behavior and Microstructure Evolution of Cu–Ni–Co–Si Alloys. Materials 2020, 13, 2042. [Google Scholar] [CrossRef]
  15. Sun, D.; Jiang, S.; Yan, B.; Yu, J.; Zhang, Y. Mechanical behaviour and microstructural evolution of Ti-37 at.%Nb alloy subjected to hot compression deformation. J. Alloys Compd. 2020, 834, 155010. [Google Scholar] [CrossRef]
  16. Prasad, Y.V.R.K.; Gegel, H.L.; Doraivelu, S.M.; Malas, J.C.; Morgan, J.T.; Lark, K.A.; Barker, D.R. Modeling of dynamic material behavior in hot deformation: Forging of Ti-6242. Metall. Trans. A 1984, 15, 1883–1892. [Google Scholar] [CrossRef]
  17. Wang, M.-H.; Wang, R.; Meng, L.; Wang, G.-T. Processing maps and hot working mechanisms of supercritical martensitic stainless steel. J. Cent. South Univ. 2016, 23, 1556–1563. [Google Scholar] [CrossRef]
  18. Ji, H.; Peng, Z.; Pei, W.; Xin, L.; Ma, Z.; Lu, Y. Constitutive equation and hot processing map of TA15 titanium alloy. Mater. Res. Express 2020, 7, 046508. [Google Scholar] [CrossRef]
  19. Huang Y, Zeng G, Huang L, Zheng Z, Liu C, Zhan H. Influence of strain rate on dynamic recrystallization behavior and hot formability of basal-textured AZ80 magnesium alloy. Mater. Charact. 2022, 187, 111880. [Google Scholar] [CrossRef]
  20. Li, Y.; Ji, H.; Li, W.; Li, Y.; Pei, W.; Liu, J. Hot Deformation Characteristics—Constitutive Equation and Processing Maps—of 21-4N Heat-Resistant Steel. Materials 2019, 12, 89. [Google Scholar] [CrossRef] [Green Version]
  21. Rajput, S.K.; Chaudhari, G.P.; Nath, S.K. Characterization of hot deformation behavior of a low carbon steel using processing maps, constitutive equations and Zener-Hollomon parameter. J. Mater. Process. Technol. 2016, 237, 113–125. [Google Scholar] [CrossRef]
  22. Meng, G.; Li, B.; Li, H.; Huang, H.; Nie, Z. Hot deformation and processing maps of an Al–5.7wt.%Mg alloy with erbium. Mater. Sci. Eng. A 2009, 517, 132–137. [Google Scholar] [CrossRef]
  23. Yang, J.Y.; Kim, W.J. The effect of addition of Sn to copper on hot compressive deformation mechanisms, microstructural evolution and processing maps. J. Mater. Res. Technol. 2020, 9, 749–761. [Google Scholar] [CrossRef]
  24. Meng, B.; Du, Z.; Li, C.; Wan, M. Constitutive behavior and microstructural evolution in hot deformed 2297 Al-Li alloy. Chin. J. Aeronaut. 2020, 33, 1338–1348. [Google Scholar] [CrossRef]
  25. Cai, Z.; Chen, F.; Guo, J. Constitutive model for elevated temperature flow stress of AZ41M magnesium alloy considering the compensation of strain. J. Alloys Compd. 2015, 648, 215–222. [Google Scholar] [CrossRef]
  26. Gryguc, A.; Shaha, S.K.; Behravesh, S.B.; Jahed, H.; Wells, M.; Williams, B. Compression Behaviour of Semi-closed Die Forged AZ80 Extrusion. In Characterization of Minerals, Metals, and Materials 2017; Ikhmayies, S., Li, B., Carpenter, J.S., Li, J.I., Hwang, J.-Y., Monteiro, S.N., Firrao, D., Zhang, M., Peng, Z., Escobedo-Diaz, J.P., Eds.; Springer International Publishing: Cham, Switzerland, 2017; pp. 361–369. [Google Scholar]
  27. Gryguc, A.; Shaha, S.K.; Behravesh, S.B.; Jahed, H.; Wells, M.; Williams, B.; Su, X. Monotonic and cyclic behaviors of cast and cast-forged AZ80 Mg. Int. J. Fatigue 2017, 104, 136–149. [Google Scholar] [CrossRef]
  28. Gryguc, A.; Behravesh, S.B.; Shaha, S.K.; Jahed, H.; Wells, M.; Williams, B.; Su, X. Low-cycle fatigue characterization and texture induced ratcheting behaviour of forged AZ80 Mg alloys. Int. J. Fatigue 2018, 116, 429–438. [Google Scholar] [CrossRef]
  29. Gryguć, A.; Behravesh, S.B.; Shaha, S.K.; Jahed, H.; Wells, M.; Williams, B.; Su, X. Multiaxial cyclic behaviour of extruded and forged AZ80 Mg alloy. Int. J. Fatigue 2019, 127, 324–337. [Google Scholar] [CrossRef]
  30. Tahreen, N.; Zhang, D.F.; Pan, F.S.; Jiang, X.Q.; Li, D.Y.; Chen, D.L. Texture evolution and deformation activity of an extruded magnesium alloy: Effect of yttrium and deformation temperature. J. Alloys Compd. 2016, 688, 270–284. [Google Scholar] [CrossRef]
Figure 1. Geometry of the specimen used for the hot tensile test (unit: mm); ED: extrusion direction, TD: transverse direction; ND: normal direction.
Metals 12 01431 g001
Figure 2. True stress–strain curves of specimens under different deformation temperatures with strain rates of: (a)   ε ˙ = 1 × 10⁻¹s−1; (b)   ε ˙ = 1 × 10⁻²s−1; (c) ε   ˙ = 1 × 10⁻³s−1; (d) ε   ˙ = 1 × 10⁻⁴s−1.
Metals 12 01431 g002
Figure 3. Linear fit to solve for material constants: (a) solving for n values; (b) solving for β values; (c) optimizing for n values; (d) solving for Q values.
Metals 12 01431 g003
Figure 4. Based on lnZ- ln[sinh(ασ)] to solve for the parameters A.
Metals 12 01431 g004
Figure 5. Variation of material constants with strain: (a) α; (b) n; (c) Q; (d) lnA.
Metals 12 01431 g005
Figure 6. Comparison of experimental and predicted values for MnE21 magnesium alloy at different temperatures and strain rates: (a)   ε ˙ = 1 × 10⁻¹s−1; (b)   ε ˙ = 1 × 10⁻²s−1; (c) ε   ˙ = 1 × 10⁻³s−1; (d) ε   ˙ = 1 × 10⁻⁴s−1.
Metals 12 01431 g006
Figure 7. Power dissipation maps for different strains: (a1) ε = 0.1; (b1) ε = 0.2; (c1) ε = 0.3. Instability maps at different strains: (a2) ε = 0.1; (b2) ε = 0.2; (c2) ε = 0.3. Hot processing maps at different strains: (a3) ε = 0.1; (b3) ε = 0.2; (c3) ε = 0.3.
Metals 12 01431 g007
Figure 8. Grain orientation distribution (a1e1) and grain boundary orientation difference distribution (a2e2) at 300 °C~500 °C.
Metals 12 01431 g008
Figure 9. Pole figure for different temperatures at a strain rate of 1 × 10⁻²s−1: (a) 300 °C; (b) 350 °C; (c) 400 °C; (d) 450 °C; (e) 500 °C.
Metals 12 01431 g009
Figure 10. The ODF at different temperatures at a strain rate of   ε ˙ = 1 × 10²s−1: (a) 300 °C; (b) 350 °C; (c) 400 °C; (d) 450 °C; (e) 500 °C.
Metals 12 01431 g010
Table 1. MnE21 magnesium alloy chemical composition.
MgMnSiCeNaAlSCl
97.7821.4390.2670.2670.1970.0350.0260.038
Table 2. Peak stresses at different temperatures and strain rates.
ε ˙ /s−1 ln ε ˙ T / ° C
300350400450500
0.1−2.303129.62993.34065.15347.06131.575
0.01−4.605101.59565.39844.55923.76815.333
0.001−6.90876.47539.46120.74411.5827.916
0.0001−9.21038.14218.9489.1565.9423.333
Table 3. Flow stresses for MnE21 magnesium alloy based on various deformation conditions (MPa).
ε ε ˙ (s−1) 300 °C350 °C400 °C450 °C500 °C
0.10.1111.76474.14159.17144.23530.516
0.0185.23953.22941.67822.70014.499
0.00160.18934.48118.5759.9487.078
0.000133.04416.7457.8114.3952.810
0.20.1126.80787.85862.80046.11131.407
0.0197.67262.43043.37423.33114.953
0.00172.48837.47419.40111.0347.419
0.000135.96117.4498.3825.1003.157
0.30.1129.62992.54164.85247.06131.565
0.01101.05064.97544.40823.62215.220
0.00176.21839.06720.74311.3507.667
0.000137.71818.5539.1565.9423.195
Publisher’s Note: MDPI stays neutral with regard to jurisdictional claims in published maps and institutional affiliations.

