Article

Microstructural Development of Ti-6Al-4V Alloy via Powder Metallurgy and Laser Powder Bed Fusion

by
Alireza Dareh Baghi
1,*,
Shahrooz Nafisi
1,2,
Heike Ebendorff-Heidepriem
3 and
Reza Ghomashchi
1,3
1
School of Mechanical Engineering, University of Adelaide, Adelaide, SA 5005, Australia
2
Relativity Space, Long Beach, CA 90815, USA
3
Institute of Photonics and Advanced Sensing, School of Physical Sciences, University of Adelaide, Adelaide, SA 5005, Australia
*
Author to whom correspondence should be addressed.
Metals 2022, 12(9), 1462; https://doi.org/10.3390/met12091462
Submission received: 28 July 2022 / Revised: 23 August 2022 / Accepted: 24 August 2022 / Published: 31 August 2022

Abstract

:
A detailed study was carried out to gain a better understanding of the microstructural differences between Ti-6Al-4V parts fabricated via the conventional powder metallurgy (PM) and the laser powder bed fusion (L-PBF) 3D printing routes. The parts were compared in terms of the constituent phases in the microstructure and their effects on the micro- and nano-hardness. In L-PBF parts, the microstructure has a single phase of martensitic α′ with hcp crystal structure and acicular laths morphology, transformed from prior parent phase β formed upon solidification of the melt pool. However, for the sintered parts via powder metallurgy, two phases of α and β are noticeable and the microstructure is composed of α grains and α + β Lamellae. The microhardness of L-PBF processed Ti-6Al-4V samples is remarkably higher than that of the PM samples but, surprisingly, the nano-hardness of the bulk martensitic phase α′ (6.3 GPa) is almost the same as α (i.e., 6.2 GPa) in PM samples. This confirms the rapid cooling of the β phase does not have any effect on the hardening of the bulk martensitic hcp α′. The high microhardness of L-PBF parts is due to the fine lath morphology of α′, with a large concentration of low angle boundaries of α′. Furthermore, it is revealed that for the α phase in PM samples, a higher level of vanadium concentration lowers the nano-hardness of the α phase. In addition, as expected, the compacting pressure and sintering temperature during the PM process led to variations in the porosity level as well as the microstructural morphology of the fabricated specimens, which will in turn have a significant effect on the mechanical properties.

1. Introduction

Titanium and titanium-based alloys have emerged as appealing materials for numerous applications due to their adequate strength, high specific strength, excellent corrosion resistance, and exceptional biocompatibility [1,2]; however, conventional manufacturing technologies often utilized for the fabrication of titanium-based alloy products are generally high energy and materials intensive, and time-consuming [3]. Therefore, emerging digitized and automated manufacturing techniques, known as additive manufacturing (AM), are receiving increased attention and starting to play a significant role in the manufacture of titanium parts.
The laser powder bed fusion (L-PBF) technique, also known as selective laser melting (SLM), for titanium alloys has attracted increasing global interest due to its distinctive characteristics and a range of notable advantages over conventional manufacturing techniques. During the L-PBF fabrication process, materials are added layer by layer rather than subtracted as is the case for conventional manufacturing. The layer-wise build technology provides a unique advantage in design freedom for complex geometry without the need for tooling. The other attraction of the L-PBF near-net-shape production route is the ability to simplify production feasibility for fabrication of low quantities of manufactured parts, even down to a batch size of one. The basic working principle and the mechanics of the L-PBF process are widely available in the open literature [4,5,6,7,8]. L-PBF is also capable of processing high melting temperature materials, such as ceramics, and it accurately produces complex features, which is impossible to achieve using conventional fabrication techniques [9,10,11,12]. The more traditional near-net-shape manufacturing route, powder metallurgy (PM), is comparable with L-PBF as both have their starting materials in the powder form, generate near-net shape outcome parts, have high material utilization rates, and create minimum waste [13]. In the L-PBF process, the alloy powder is exposed to rapid melting and solidification, whereas, in the PM route, powder particles are sintered during or after compaction at moderate heating and cooling rates. Since the starting feedstock is the same and the level of net shaping and materials used are comparable for these two manufacturing routes, it is interesting to explore the differences in microstructure and mechanical properties of the fabricated parts.
Ti-6Al-4V (also known as Ti64) is among the titanium alloys to offer a wide range of applications in aerospace [14,15] and biomedical applications [16,17,18]. For this reason, there are many research articles about the mechanical properties of Ti64 fabricated via L-PBF in the open literature, reporting a higher strength of L-PBF that is attributed to the formation of martensitic α′. However, it has not been clarified if the higher hardness of L-PBF parts is related to the martensitic crystal structure or the morphology and refinement of the α′ phase. In addition, the morphology and crystal structure resulting in L-PBF has not yet been compared with the traditional near-net-shape powder metallurgy technique.
In this paper, the constituent phases in the microstructure of Ti64 alloy processed by the two near-net-shape manufacturing routes of L-PBF and PM were studied using micro- and nano-hardness testing of the identified phases of α, β, and α′ to highlight the reasons underlying the higher strength reported for L-PBF fabricated Ti64 parts.

2. Materials and Experimental Procedures

The starting material for both L-PBF and PM processes was Ti64 (grade 5) gas atomized pre-alloyed powder obtained from TLS, Technik GmbH & Co (Wilhelmshaven, Germany) (TLS, Technik GmbH & Co (Wilhelmshaven, Germany) is a subsidiary of ALTANA’s ECKART division (www.eckart.net) accessed on 28 July 2022). The powder used in this investigation exhibited particle diameters between 11.9 μm and 41.3 μm (percentile values d10 and d90, respectively) with a median size d50 of 22.7 μm. The powder size distribution is shown in Figure 1, based on the analysis performed using a laser particle size analyzer, the Malvern Mastersizer 2000 (Malvern Instruments Ltd., Worcestershire, UK). SEM micrographs of the powder particles displayed in Figure 2 exhibit spherical morphology, which is due to the gas atomization process and makes the powders suitable for the L-PBF process because of their high flowability [19]. The satellite particles are also identifiable from the SEM image.
For the chemical composition of the powder, the ICP-AES technique was employed to measure the weight percentages of vanadium, iron and aluminum. To analyze the content of the carbon a LECO CS200 instrument (LECO corporation, St. Joseph, MI, USA) was used, whilst to measure the percentage of hydrogen, nitrogen, and oxygen, a LECO ONH836 analyzer (LECO corporation, St. Joseph, MI, USA) was utilized. Table 1 confirms that the chemical composition of Ti-6Al-4V powder complies with the ASTM F2924-14 standard [20]. For fabrication of specimens via L-PBF routes, the powder did not have any treatment; however, for the PM samples, the powder was mixed up with 1.5 wt.% binders, as explained later.
The L-PBF machine used in this investigation was a 3D SYSTEMS ProX DMP 200(3D Systems, Rock Hill, South Carolina, SC, USA), which employs a laser source with a maximum power of 300 W in continuous laser mode. The laser beam diameter of the machine is 70 µm, with a wavelength (λ) of 1070 nm. The atmosphere of the L-PBF chamber is high purity argon, maintained during the course of deposition at atmospheric pressure (101 KPa) to prevent potential oxidation of the molten pool. The maximum allowed oxygen content of the chamber is regulated at 500 ppm. The L-PBF process parameters, shown in Table 2, are from the previous study [21], where the authors could fabricate Ti64 parts with a relatively high density of 99.86%. The cylindrical samples with a diameter of 9 mm and a length of 20 mm were built horizontally and vertically, i.e., the axis of the cylindrical samples was parallel and perpendicular to the substrate respectively. For the laser scan strategy, a bi-directional laser vector for each layer was selected, while the bi-direction laser pattern was rotating 90° between each consecutive layer.
For fabrication of PM samples, the Ti64 powder was ball-mill treated before being poured in a double-action die set with a punch diameter of Ø11 mm to produce 10 mm long specimens. In ball-mill treatment, the powder was mixed with 1.5 wt.% Acrawax (AcrawaxTM C Atomized is N, N’ Ethylene bis-stearamide (EBS)) lubricant/binder and poured into a stainless steel ball-mill container. The ball milling process was carried out at a constant rotation speed of 100 RPM for 1 h using stainless steel balls with a diameter of 6 mm. The ball-to-powder weight ratio was 5:1 and the milled powder was used as the starting powder for the PM process. The powder mixture was compacted using a Mohr & Federhaff AG Mannheim-Germany (M&F 2) 20-ton hydraulic press, at two different compaction pressures of 450 and 735 MPa, at room temperature.
The sintering process was conducted in a horizontal resistance heating tube furnace, model AY-TF-80-175, with a high purity grade argon atmosphere and heating rate of 5 °C/min. The as-compacted green samples were sintered at 1100 °C and 1250 °C. However, before reaching sintering temperatures, a dwell time of 30 min at 450 °C was employed to burn out the Acrawax lubricant added to the powder. The samples were heated to sintering temperatures and held isothermally for 1 h at these temperatures, followed by a furnace cooling rate of 3 °C/min to room temperature.
For metallographic examinations, all the PM and L-PBF cylindrical samples were sectioned transversally (perpendicular to the axis of samples). However, for the statistical significance of nano-hardness results, it was necessary to section further sites of the L-PBF samples, as will be explained later in this section.
All metallographic samples were mounted in Bakelite and polished conventionally with a fine final polishing of 0.04 μm colloidal silica under 15 N force for 25 min on a Struers Tegramin-25 machine(Struers, Copenhagen, Denmark). For microstructural analysis, the Zeiss Axio optical microscope Imager2 (Zeiss, Wetzlar, Germany) and an FEI Quanta 450 FEG-SEM (FEI, Hillsbor, Oregon, OR, USA) were used. The porosity level of all polished samples was examined on the images obtained from the Zeiss optical microscope via ImageJ software (Zeiss, Wetzlar, Germany). It should be noted that the percentage of porosity was measured on the as-polished surface.
X-ray diffraction (XRD) was performed for phase identification purposes for the powder, as well as the PM and the L-PBF-fabricated samples. The XRD machine (MiniFlex 600-Rigaku, Rigaku, Tokyo, Japan) employed Cu radiation operating at 40 kV and 15 mA, in continuous scan mode with a scan speed of 10°/min and 2θ ranging from 30° to 80°. A Vickers microhardness measurement of all samples was performed with a LECO LM700AT (LECO corporation, St. Joseph, MI, USA). A load of 300 g with a dwelling time of 10 s was chosen for all the measurements. Ten measurements were taken for each sample and the average values were calculated as the microhardness.
For nano-indentation testing, a Fisher-Cripps IBIS system with a Berkovich indenter was utilized. The maximum penetration depth of the indenter was set at 300 nm (depth control) for all samples and the indenter was held for 2 s at the maximum penetration depth before unloading. The loading and unloading rate of the indenter was 60 nm/s; therefore, each loading and unloading procedure took 5 s.
For the PM samples, 120 nano-indentations were performed on unetched metallographic samples where all constituent phases could be observed and identified. The inter-center distances of the nano-hardness impressions for the PM samples were at least 10 µm apart to ensure no interference occurred between the indentations.
For the nano-hardness of L-PBF samples, each sample of the horizontal and vertical builds was equally sectioned into four short cylindrical discs, as displayed in Figure 3a. Then, on each disc, 130 indents with a 60 μm space between the centers of the indents were impressed in two directions, as illustrated in Figure 3b. The reason for impressing nano-indents in two directions was to obtain more representative data from each section, with better statistical significance and representation of the results. To eliminate any effect of an unstable melt pool or induced residual stress near the peripheral surface, the nano-indentions started and ended approximately 0.6 mm away from any surface of the L-PBF samples, Figure 3b. As the final polishing for 25 min with a low load of 15 N left minor polishing-related etching on the samples, the traces of the phases were visible in the micrographs, even in the unetched condition. This minor polishing-related etching helped the nano-indents with their corresponding results be categorized accurately for each specific phase. It has already been shown [22] that the micro-hardness results in the unetched and etched conditions are nearly the same, meaning that the values of micro-hardness in the etched condition are still valid and reliable. However, nano-indentations should be conducted on polished (unetched) samples only to ensure reliable results.
After the microhardness and nano-hardness experiments, all the samples were etched with Kroll’s reagent, (3% HF + 5% HNO3 + 92% distilled water) for 30 s for microstructural characterization by optical and scanning electron microscopy. Energy Dispersive X-Ray Spectroscopy (EDS) was performed using Aztec analysis software (Oxford Instruments, Abingdon, UK) with an SDD detector released by Oxford Instruments fixed on Quanta 450 FEG-SEM (FEI, Hillsbor, Oregon, OR, USA).

3. Results and Discussion

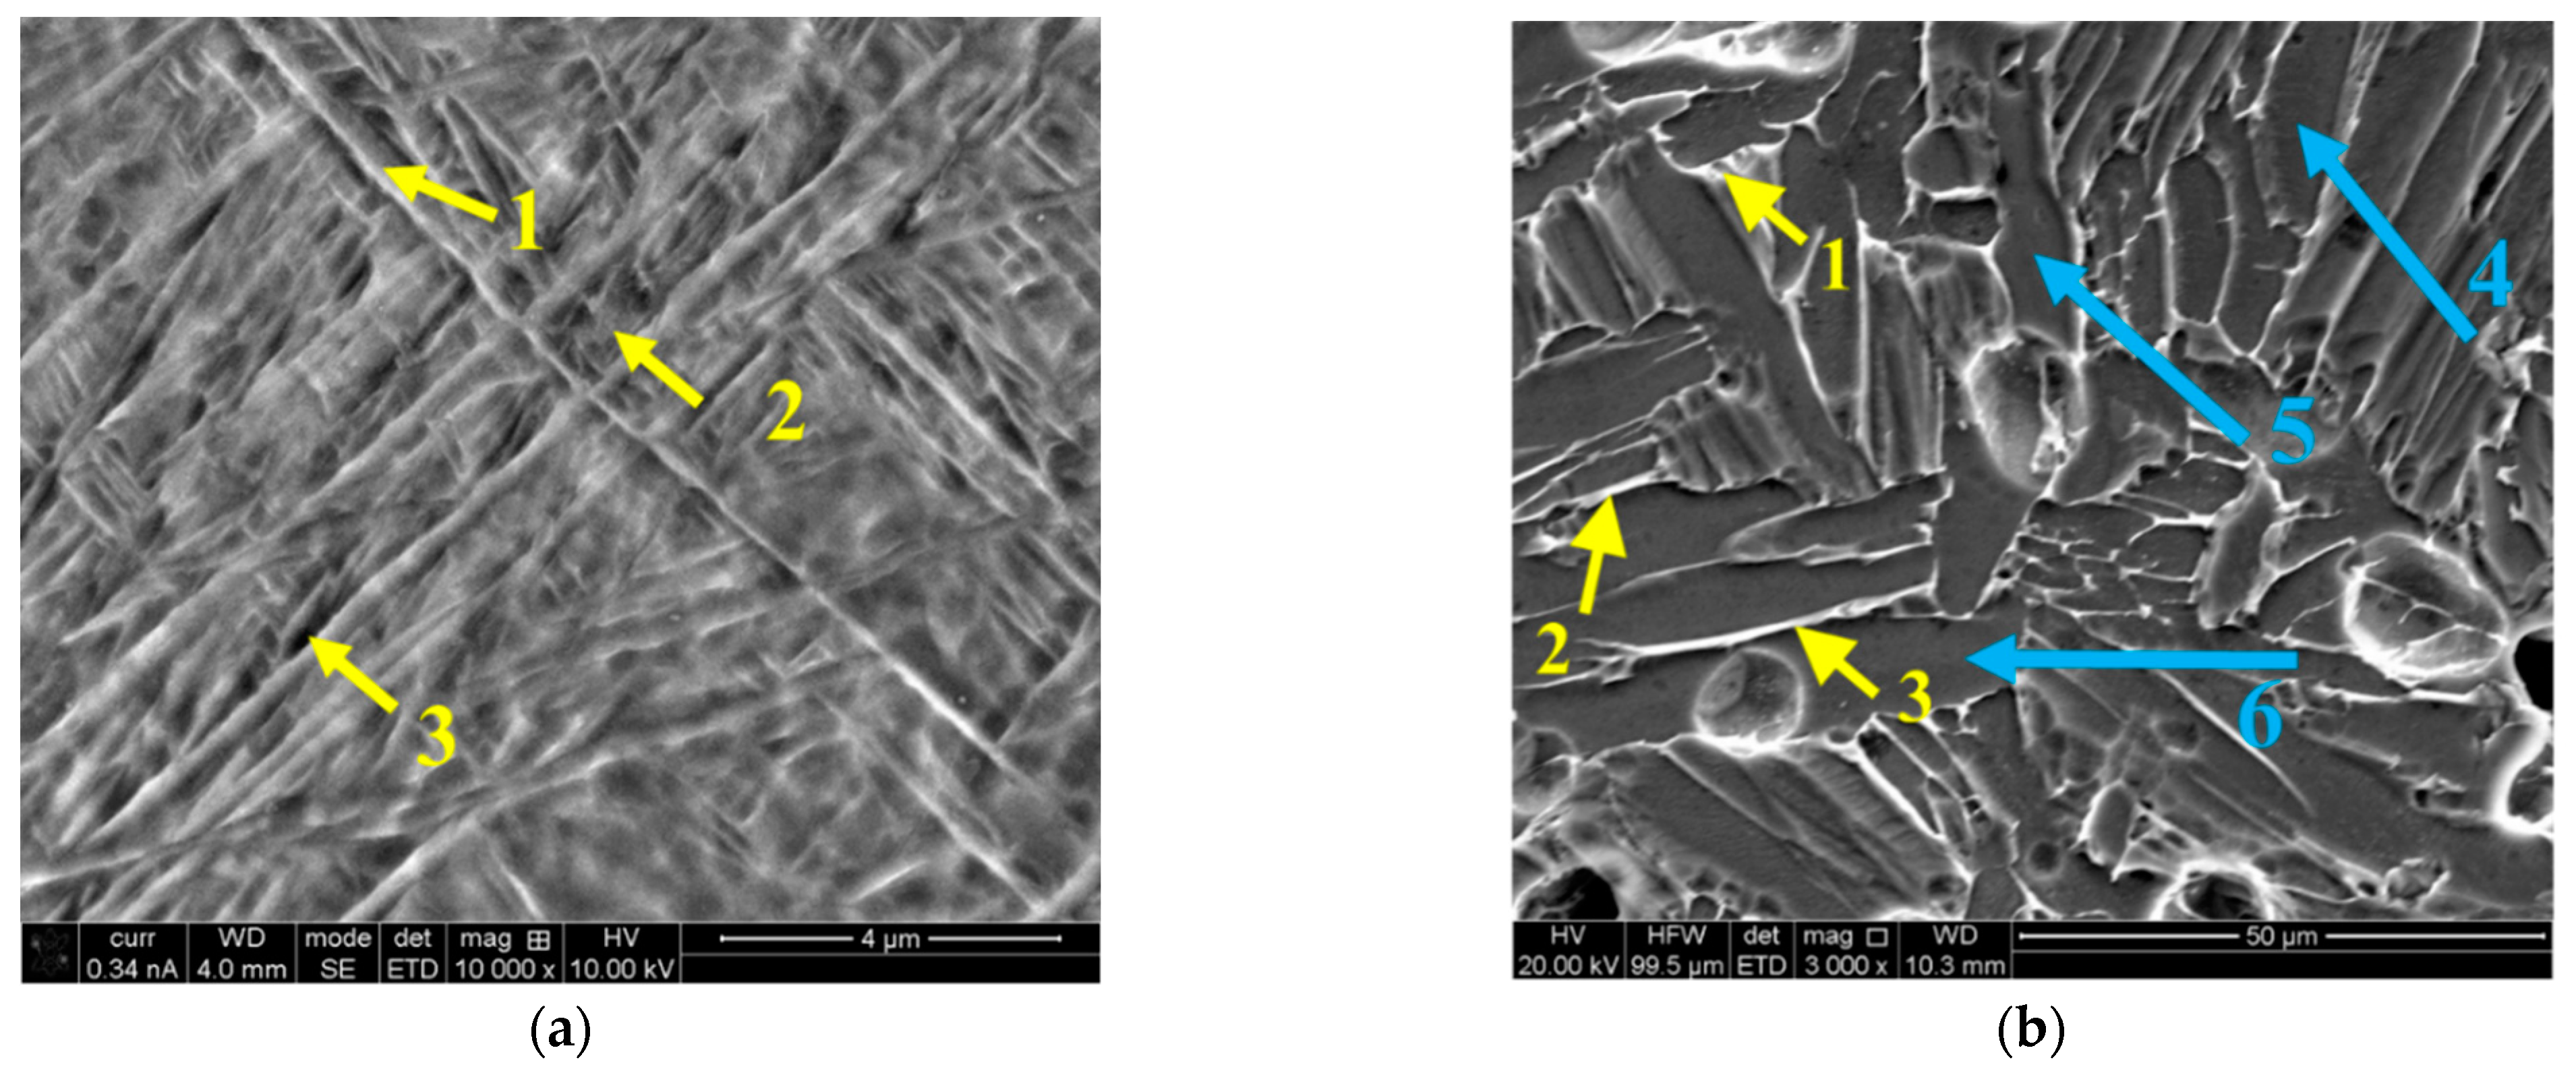
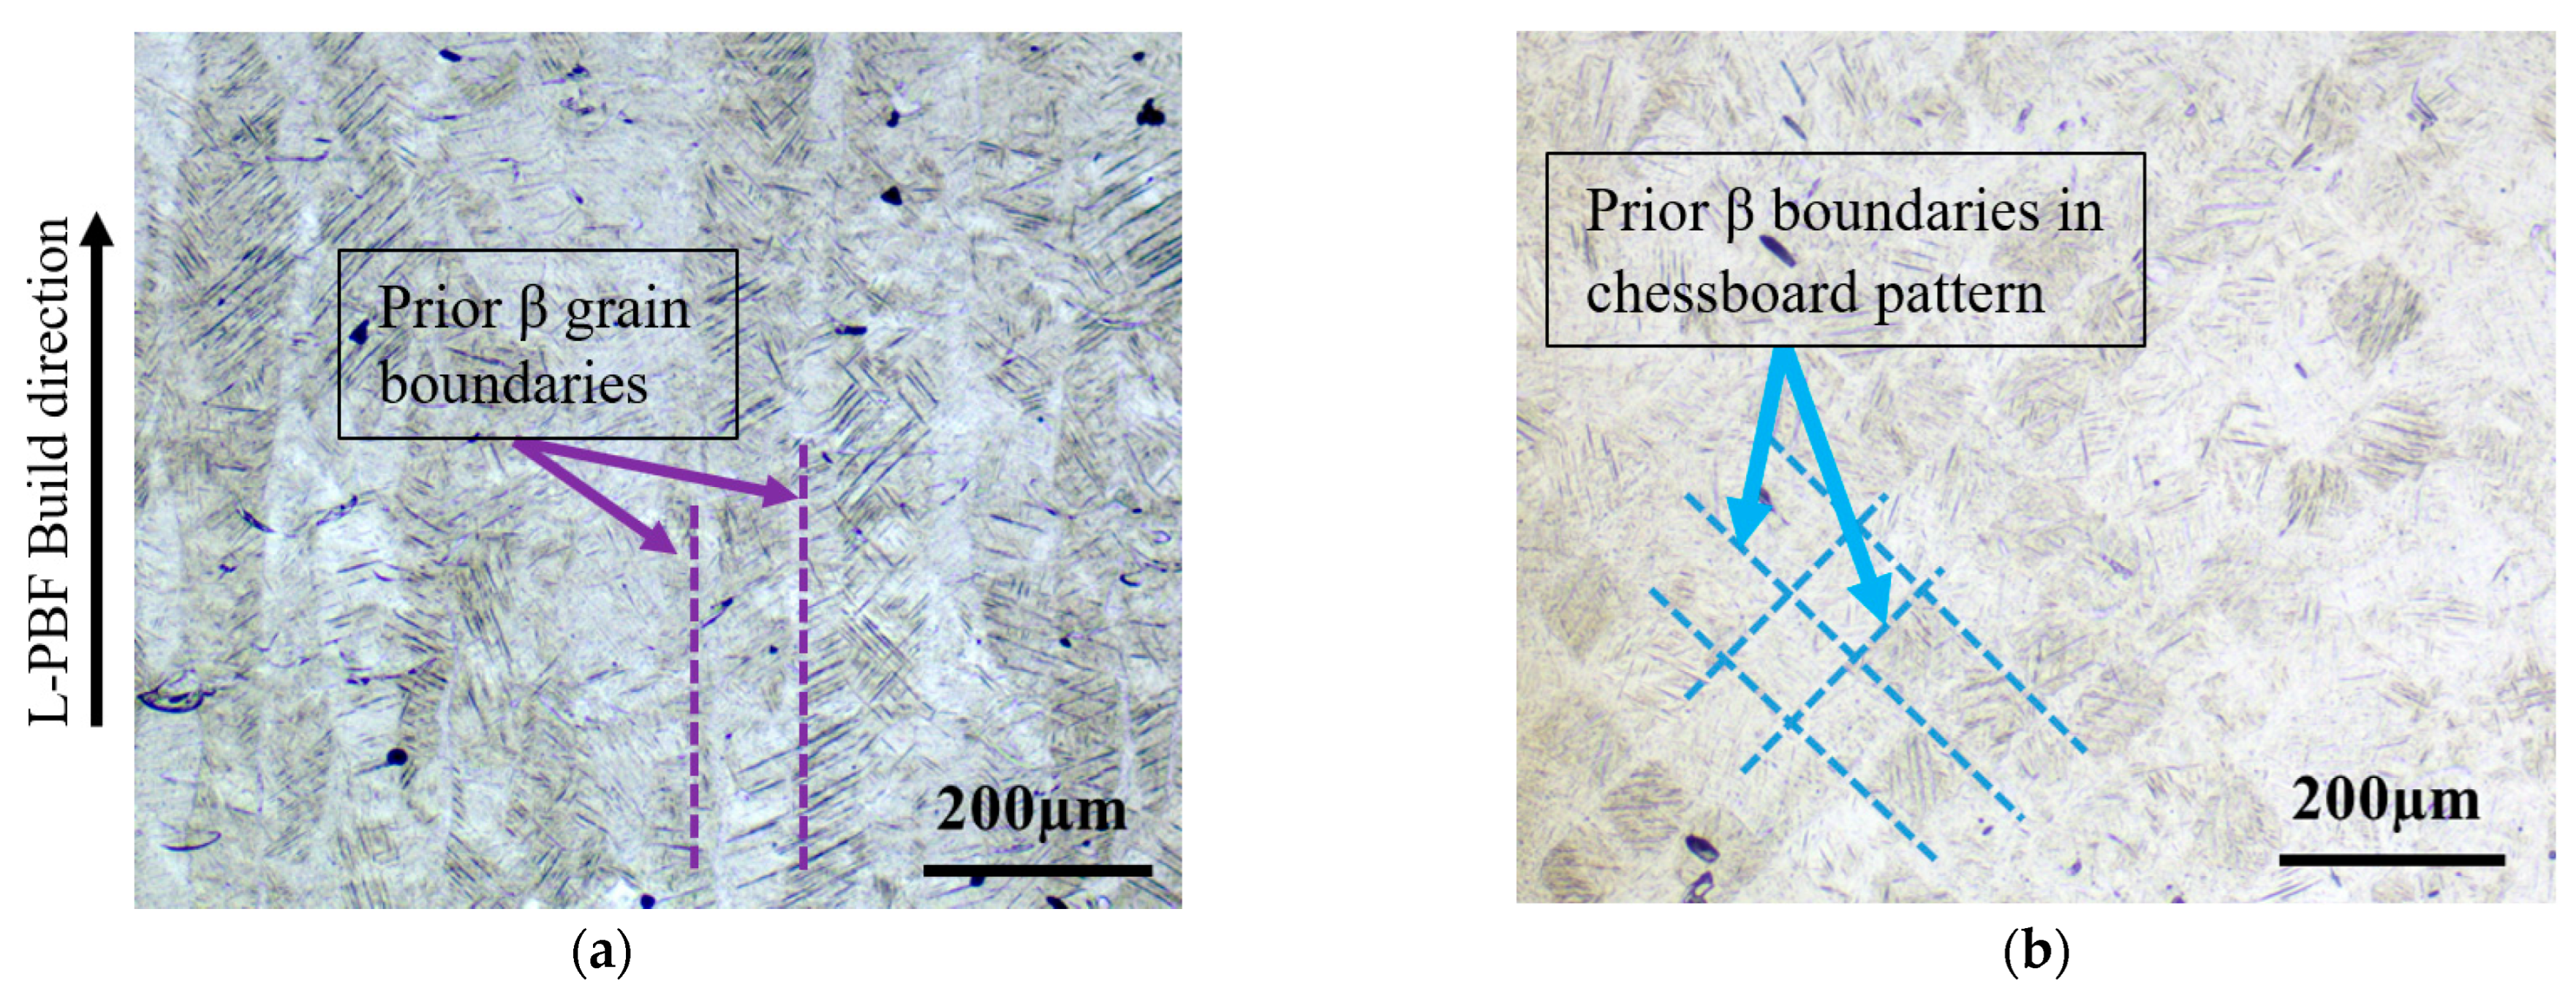
3.1. Microstructural Constituents

Microstructural characterization was initially carried out on the as-received powder particles and then continued on the L-PBF fabricated samples. Due to rapid solidification occurring during the fabrication of powder and L-PBF parts, they were expected to exhibit similar constituent phases. From the SEM micrographs in Figure 4a,b, it is evident that a fully acicular, i.e., tiny needle shape, the martensitic microstructure of α′, has evolved in both the starting powder and the L-PBF fabricated specimens, as reported by other researchers [21,23,24,25]. However, when the L-PBF micrograph (Figure 4b) is examined closely, there are some light contrast features (encircled) different from martensite needles. The arrowed encircled feature in Figure 4b is termed the “fish scale” as reported in a previous study [26]. The fish scale feature is not a new phase. It is the same hcp α′ phase observed in other regions of the microstructure, but its aluminum content has dropped from its nominal value, due to possible localized overheating and vaporization of aluminum, as a volatile alloying element in Ti64 [27].
As seen in Figure 5, it seems the formation of porosities is the main defect in the PM parts. It is quite evident that the sintering temperature is the key parameter on the microstructural development as the specimens sintered at 1100 °C have still preserved their powder morphology character, while this is not the case for samples sintered at 1250 °C, regardless of compaction pressure. However, when the microstructure at 1100 °C is examined closely, it becomes evident that the two mechanisms of Ostwald ripening (smaller particles dissolve and deposit on larger particles) and particle coalescing (joining of particles) [28] are active during the sintering process. In addition to sintering temperature, the application of a higher compaction pressure also imparts some improvement on the density of sintered samples if Figure 5a,c is compared. Based on the porosity percentage analysis shown in Table 3, under the same sintering temperature (either 1100 °C or 1250 °C), the samples compacted at 450 MPa exhibit higher percentages of porosity than those compacted at 735 MPa.
The XRD phase analysis of both L-PBF and PM samples is given in Figure 6 as a stacked graph of XRD spectra of starting powder, as-built L-PBF, and PM samples. The XRD spectrum of the PM belongs to the sample fabricated under 750 MPa compacting pressure and sintering temperature of 1250 °C. As seen in Figure 6, the hcp α/α′ phase exists in all samples, while the formation of the β phase is only observed in the PM samples. Martensitic phase α′ and phase α have not been differentiated in the XRD spectra, as both α and α′ have the same hcp crystal structure and their lattice parameters are very close [26,29,30,31,32]. The α phase has transformed from the parent β (bcc) phase in a diffusion-controlled transformation in the PM sample, while the α′ martensitic phase has experienced a diffusionless transformation from the β (bcc) phase, resulting in supersaturation of vanadium in α′ [33,34].
The evolution of martensitic microstructure in the L-PBF samples is attributed to the rapid cooling [35,36] in which the cooling rate may vary between 103 and 106 K/s [37,38,39,40]. This is true for the α′ martensitic phase in Ti64 powder since the particles experience a high cooling rate during gas atomization of molten alloy [41]. For PM samples in Figure 5, however, the martensitic needle shape α′ observed in the as-atomized powder particles is no longer observed; instead, grains of α have been developed in the matrix of β phase for all PM samples leading to a lamellar morphology. The nearly equiaxed α grains with α + β lamellae in PM samples are the result of diffusion-controlled transformation promoted by the slow cooling rate of 3 °C/min. This is well demonstrated in PM samples sintered at 1250 °C whereas in PM samples sintered at 1100 °C the particles are still in their original morphology, which is believed to be entirely due to a lower diffusion rate resulting from the lower sintering temperature. The presence of some remaining thick laths morphology demonstrated in Figure 5a,c, confirms the coarsening of the lath morphology and their transformation to lamellae. The formation of lamellar structure, Figure 5b,d, was also observed by others [42,43,44]. It is worth mentioning that the highly charged white inter-particle regions, more distinctly seen in Figure 5c, are the metallographic consumables’ residue employed for sample preparation. They have accumulated within the pores.
EDS(Energy dispersive spectroscopy) examination of the microstructure, shown by the high magnification SEM micrographs in Figure 7, confirms that the light grey regions in the PM samples are rich in vanadium. The weight percentage of vanadium in three selected points (1–3), displayed in Figure 7b, is between 8.3% and 16.6%, which is beyond the vanadium nominal concentration of 4% in the Ti64 alloy examined in this study. Although it is a well-known fact that EDS analysis is a semi-quantitative method for measuring chemical composition, especially when the concentration of the element is very low, certainly confirms the localized segregation of vanadium. Since vanadium is a β-stabilizer, the formation of the vanadium-rich region in the Ti64 alloy could be an indication of the β phase [45,46]; so, the bright spots in the PM samples are evidence of the β phase. EDS analysis results of the L-PBF sample, Figure 7a, do not show drastic changes in the weight percentages of either aluminum or vanadium compared with their nominal values of 6% and 4%, respectively.
This is expected as the rapid cooling encountered during L-PBF does not allow diffusion to take place. Optical micrographs of the L-PBF parts illustrated in Figure 8a reveal the columnar grain architecture of the martensitic microstructure, which is parallel with the L-PBF build direction. The chessboard pattern micrograph shown in Figure 8b is, indeed, a section perpendicular to the columnar grains. The prior β phase grain boundaries are observed in both micrographs of Figure 8a,b. This architecture of the microstructure is typically unique for L-PBF parts, as reported by other researchers [24,47], and is due to the layer-wise building mechanism in L-PBF where a thermal gradient of 104–105 °C/cm along the build direction exists within the very small melt pool [48].

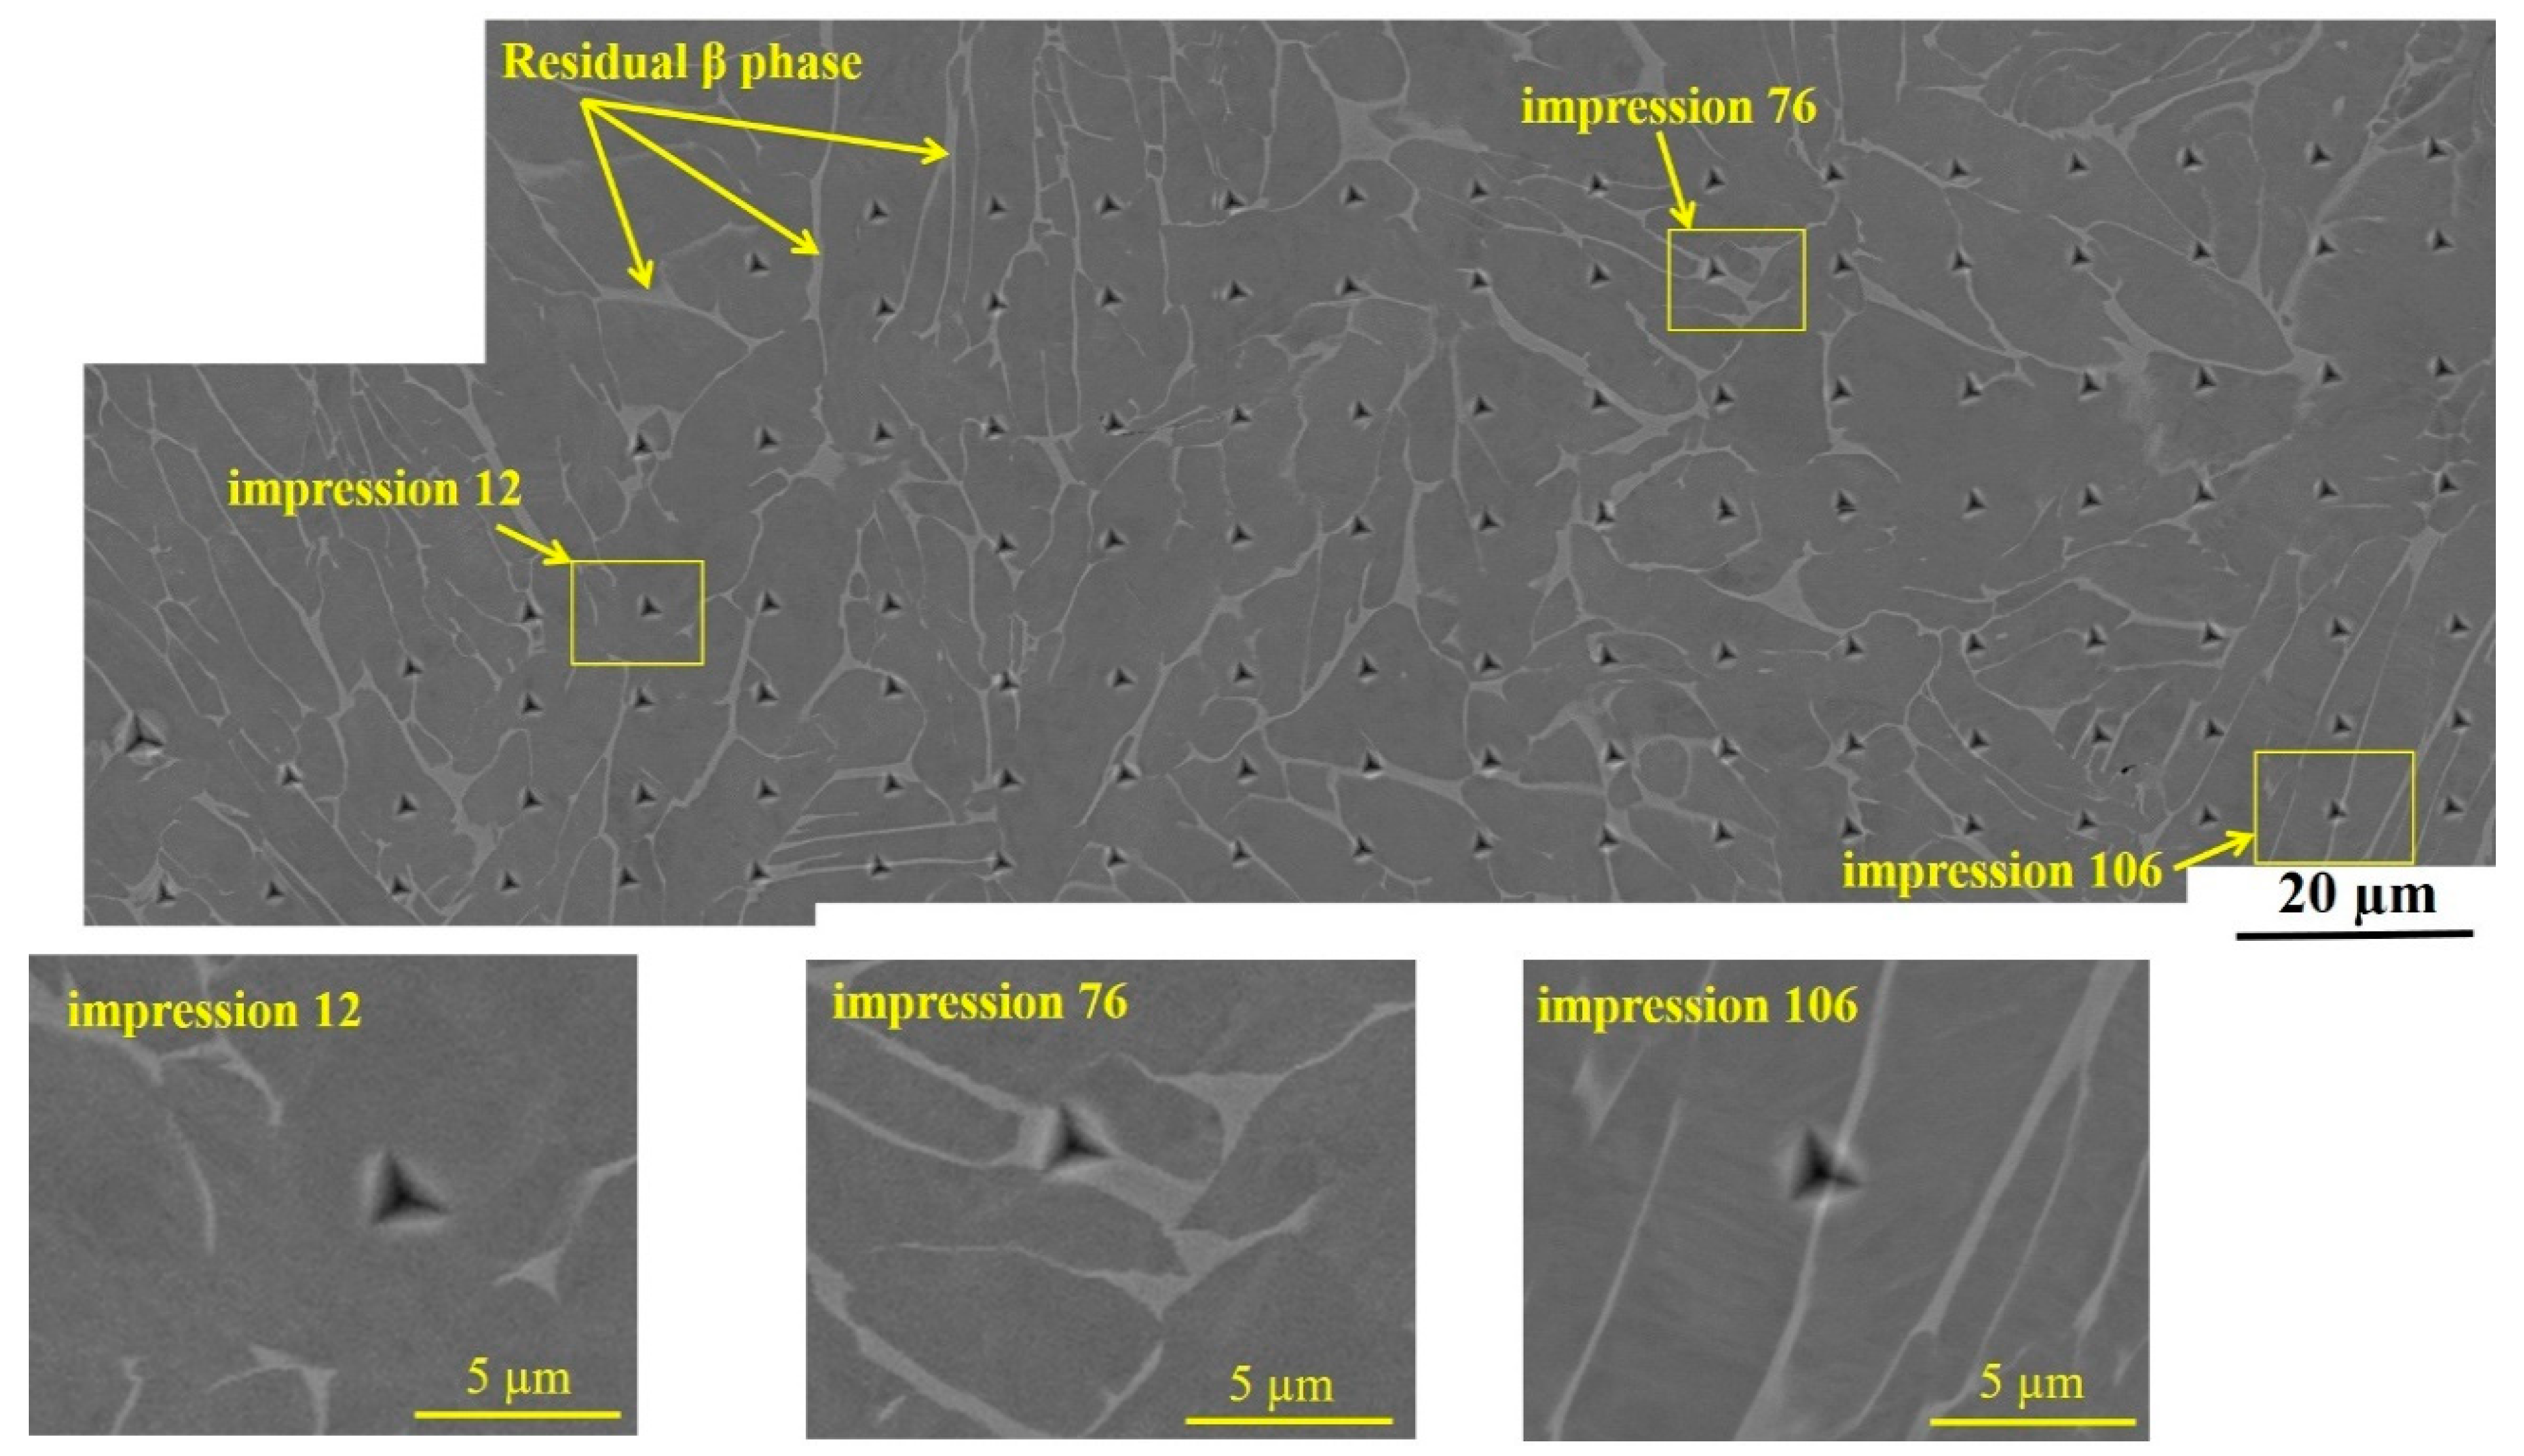
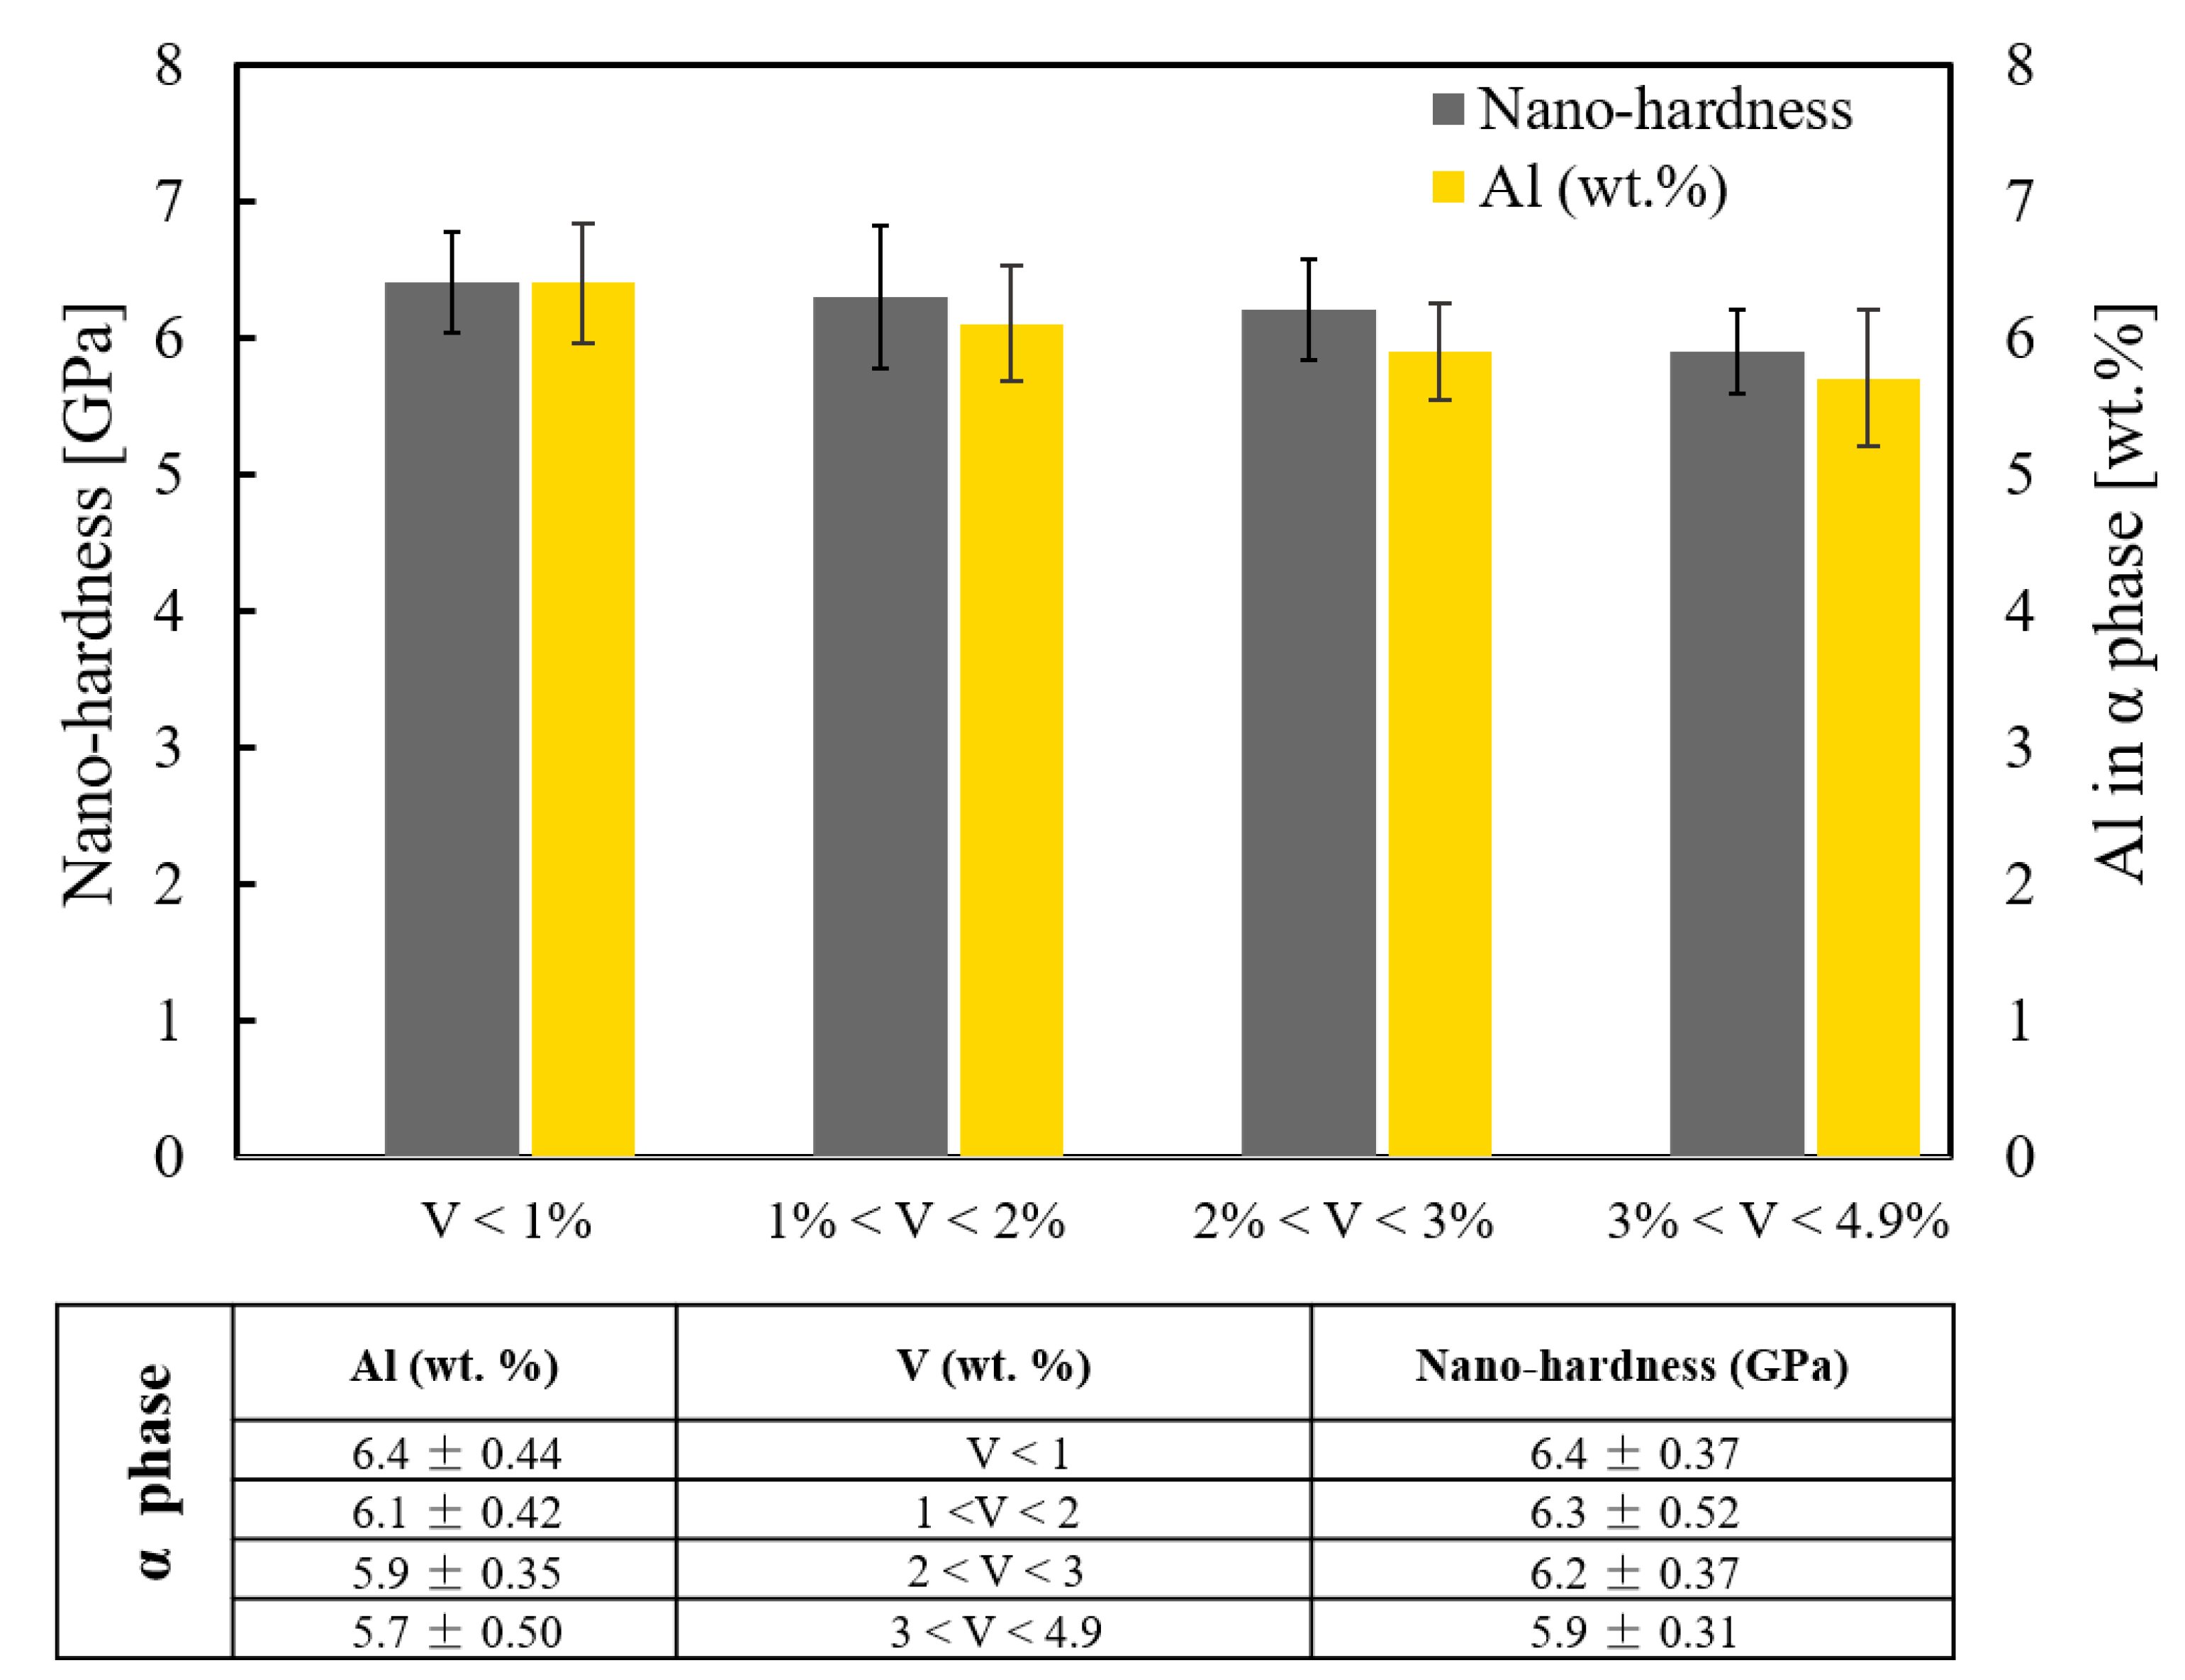
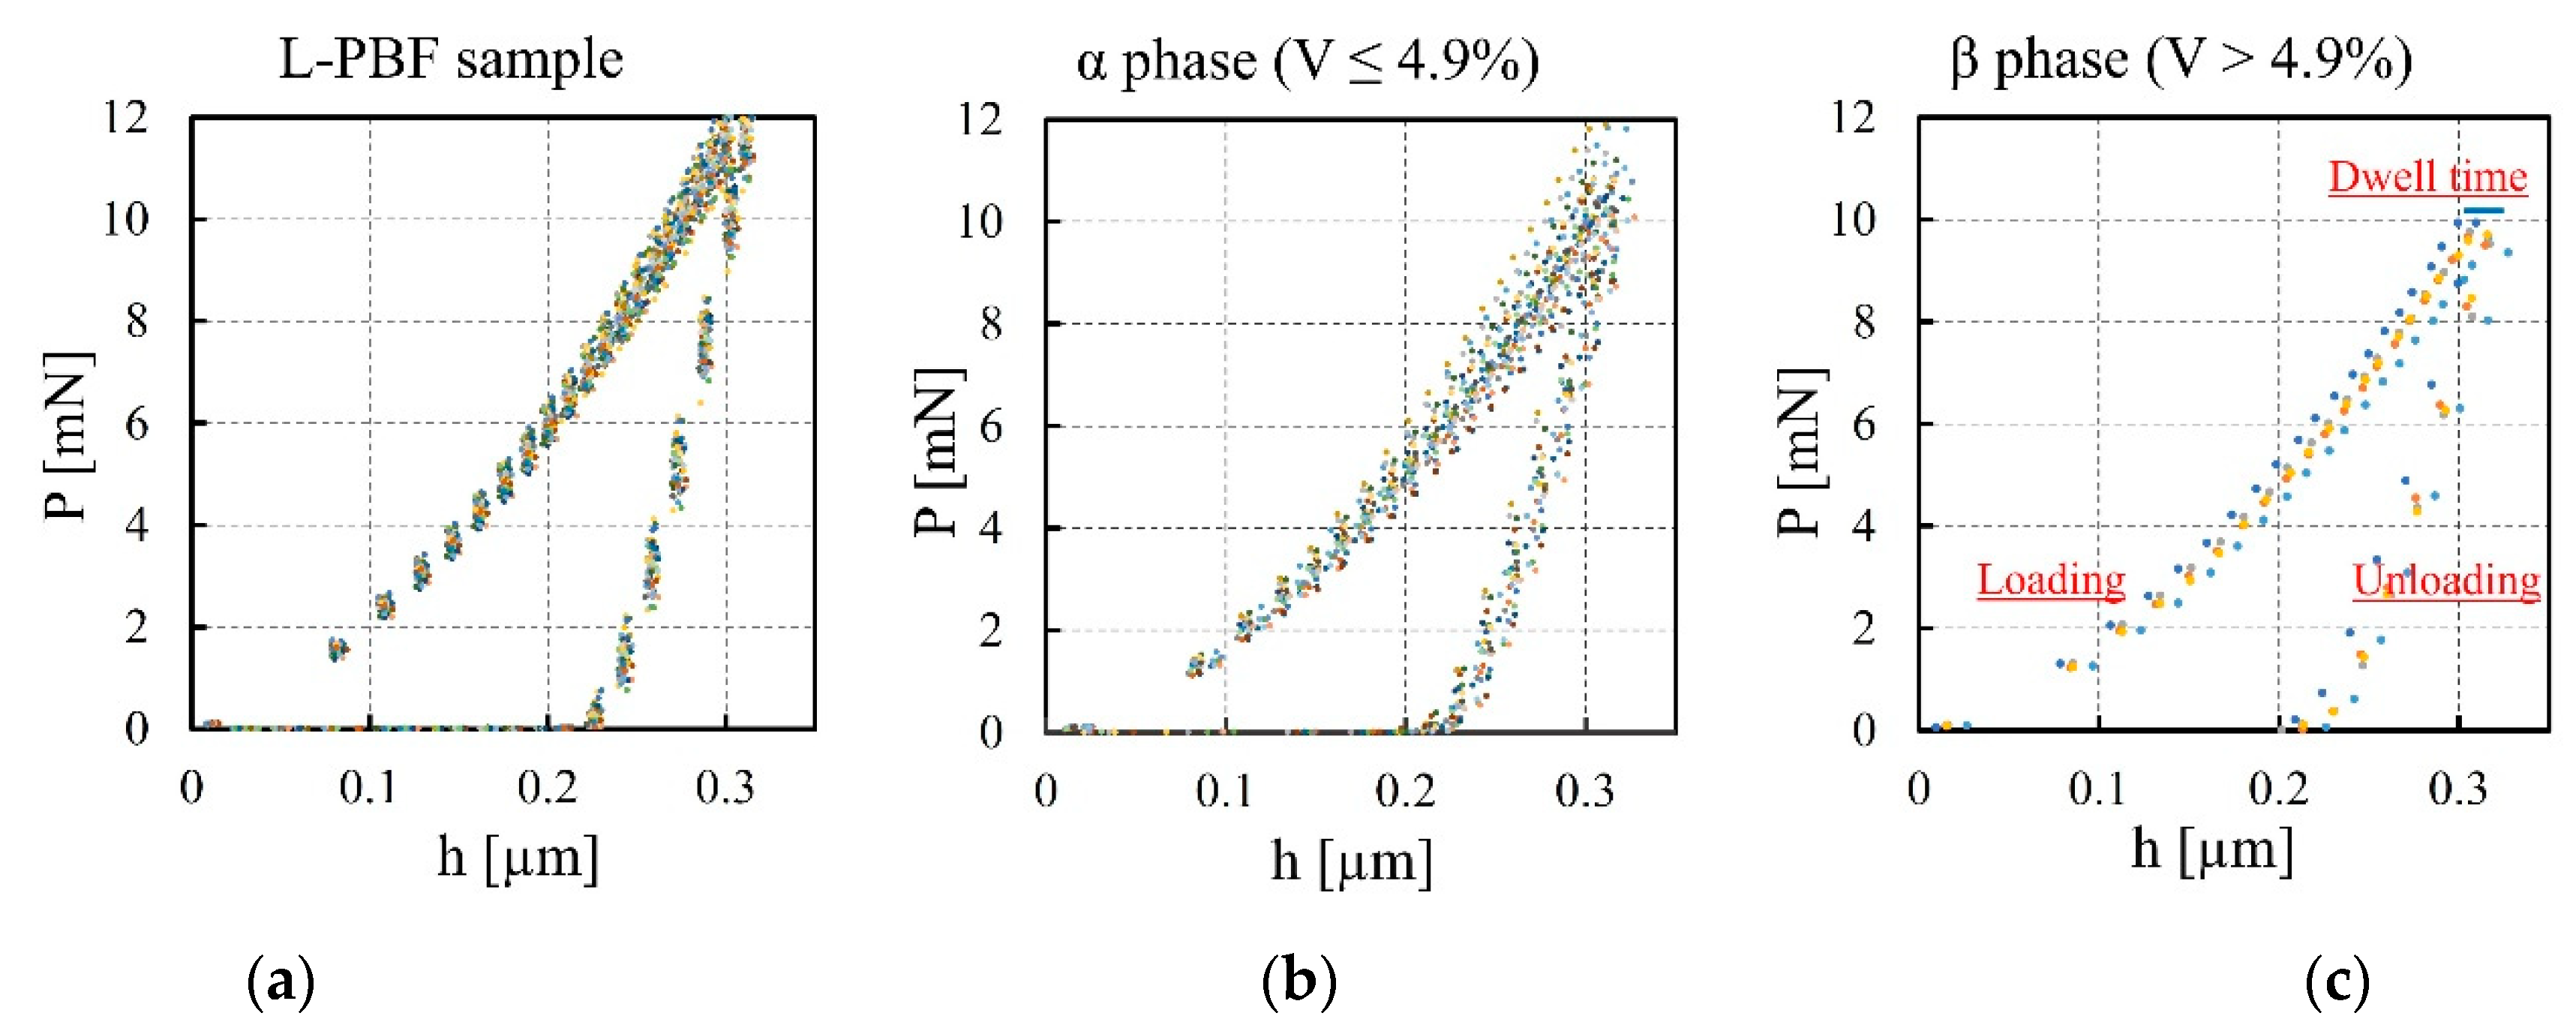
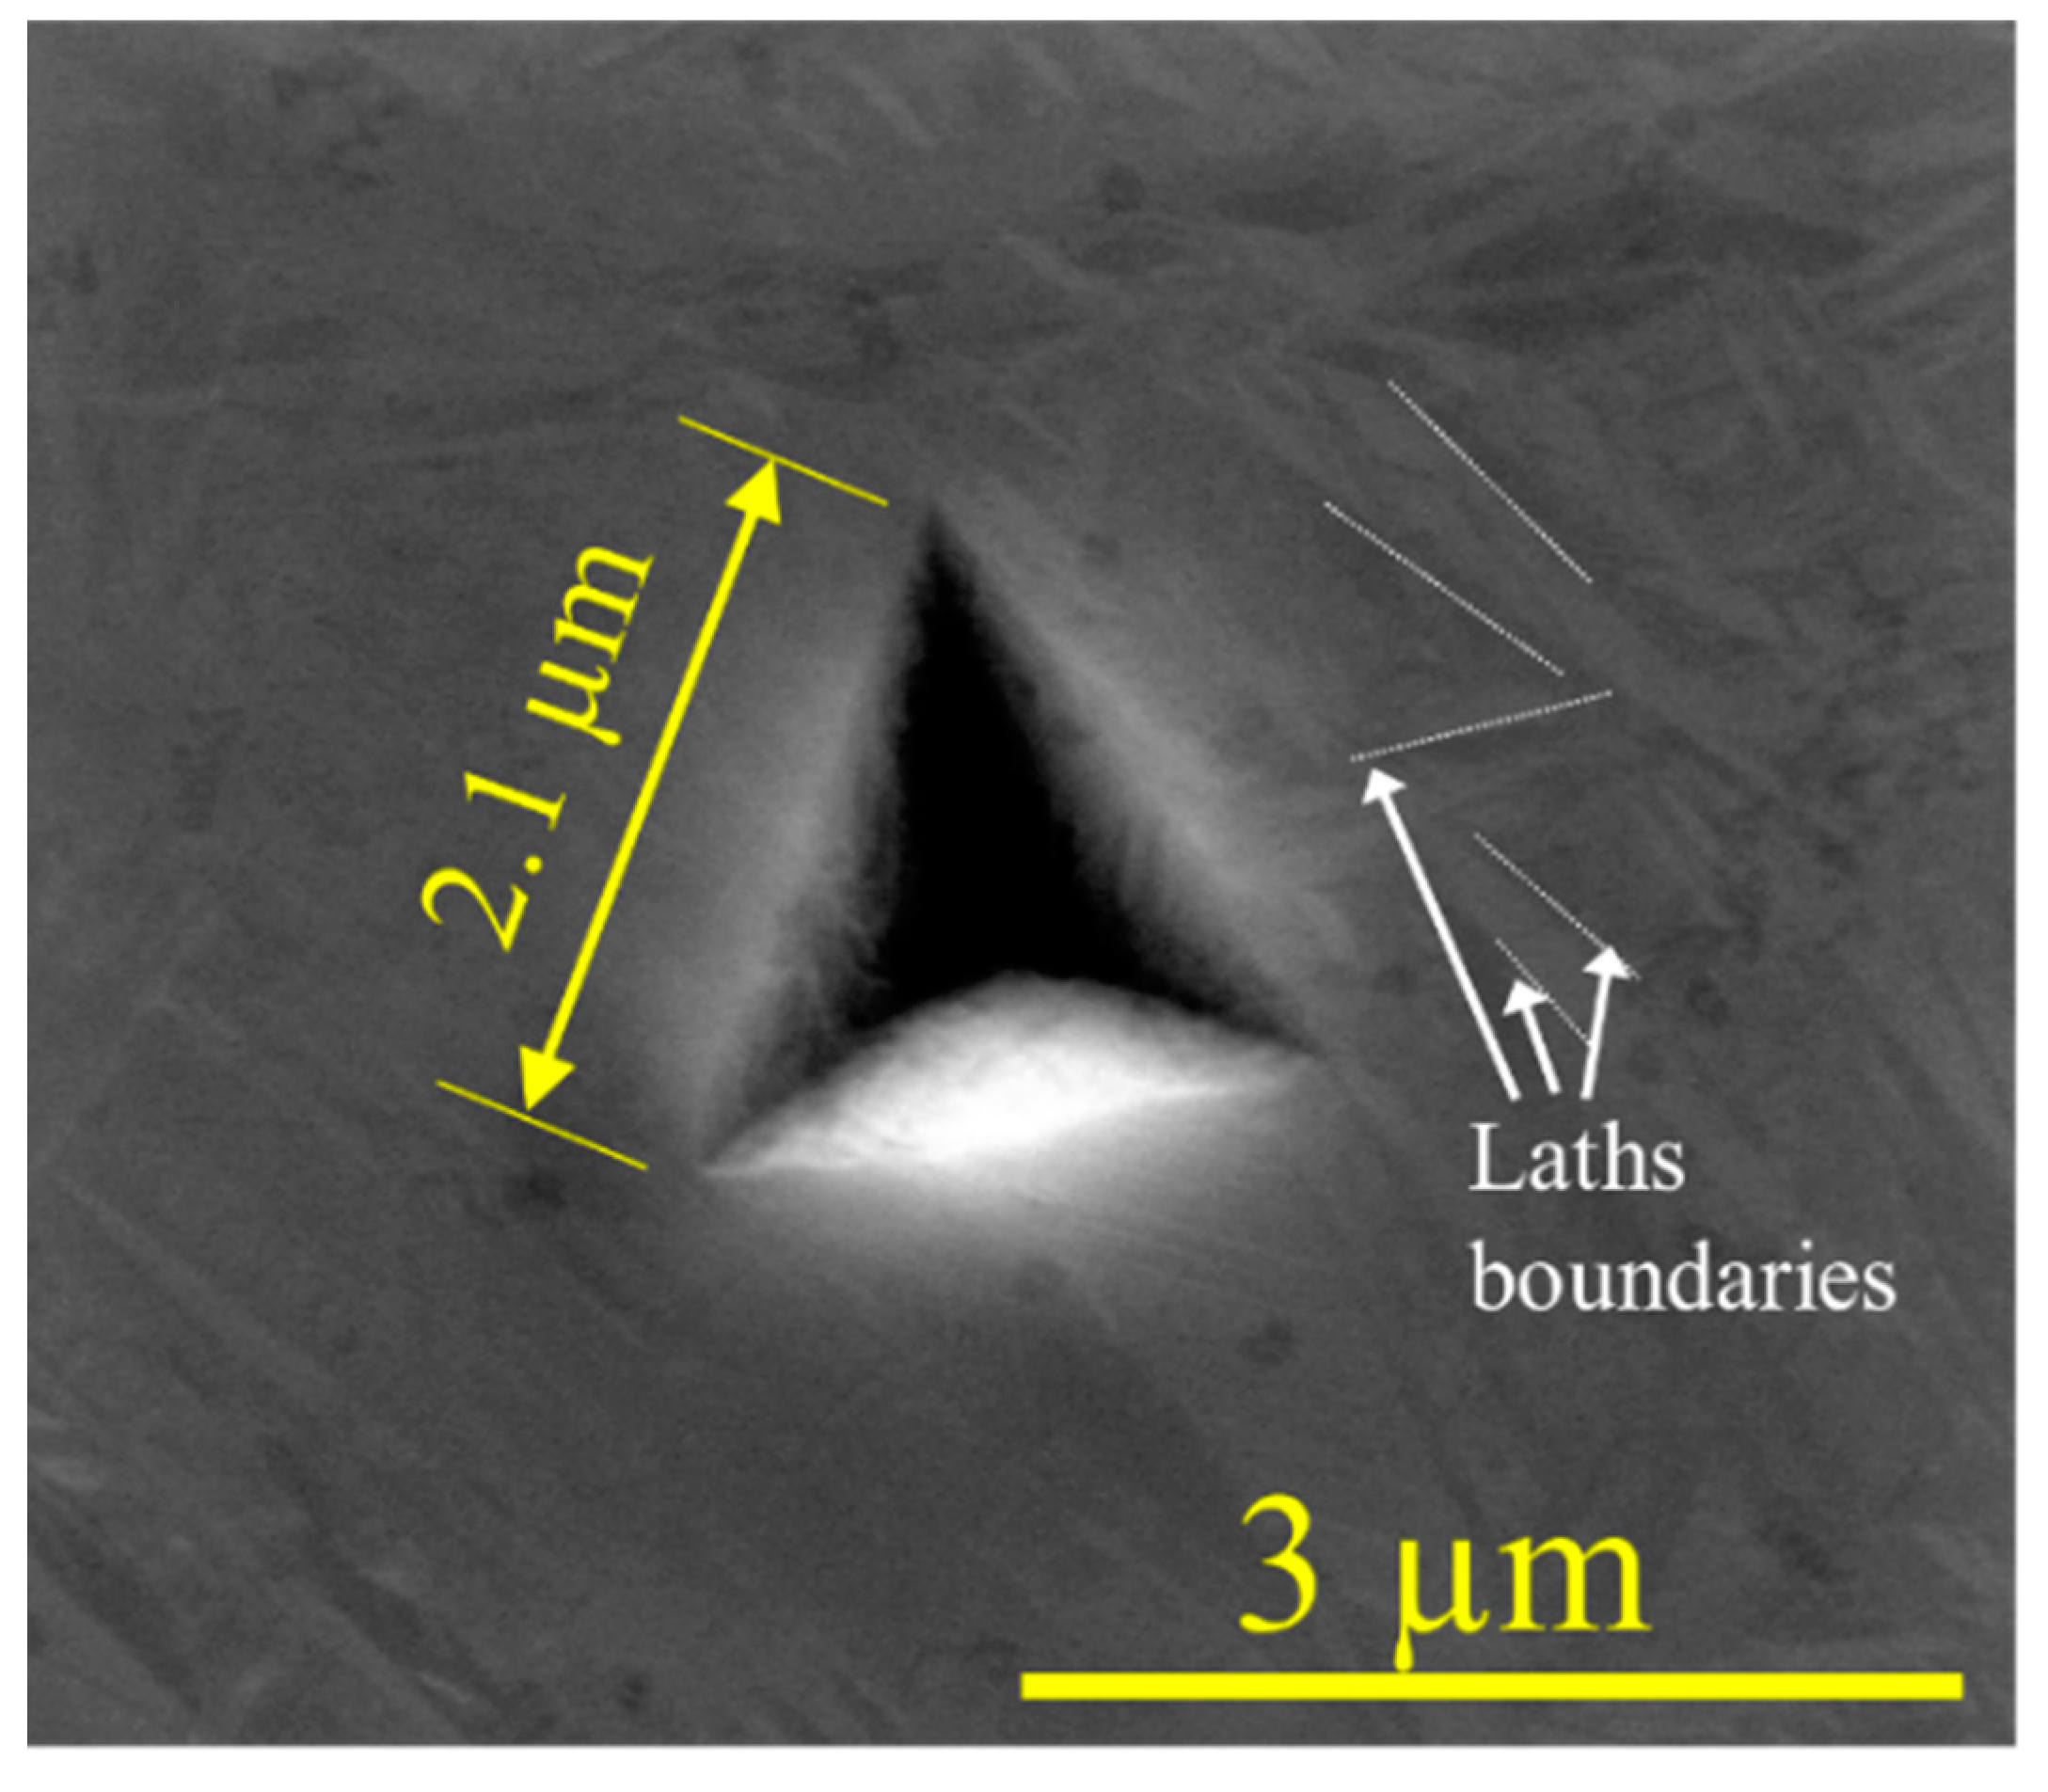
3.2. Micro and Nano-Hardness Characteristics

Figure 9 shows the tabulated results and a graph of the micro-hardness versus the porosity content for both the PM and L-PBF samples. For PM samples, the hardness increases with increasing compaction pressure and sintering temperature. At the same sintering temperature, the hardness value of a specimen compacted at a pressure of 435 MPa is lower than specimens compacted at a higher pressure of 735 MPa; this is attributed to the various levels of porosity content, Table 3, induced by various compacting pressures in the green samples. However as previously explained, the sintering temperature seems to be more effective in lowering the level of porosity than the compacting pressure.
In addition, as seen from Figure 9, the values of Vickers hardness are in the inverse correlation with the samples’ porosity as expected. If the fitted line in Figure 9 is extrapolated to 100% dense PM samples, the highest achievable micro-hardness would be ~310 HV. This hardness value for PM sample, in a fully dense condition, is not far from the hardness (304 ± 12 HV) of the almost fully dense L-PBF sample (relative density of 99.86%) cooled from β -region at a rate of 0.1 °Cs−1 [49]. The reason as why that specific sample (0.1 °Cs−1 with that hardness value was used as a comparison with the fully dense PM estimated hardness is based on the phases that are present in that near equilibrium LPBF sample cooled from temperatures above the β transus temperature of this alloy, i.e., it contains α + β phases, the same phases form in the sintered PM samples. Any other LPBF sample, whether as-printed or reheated, may have a combination of α, α′, and β and are not valid since the phases will be different to those of PM samples and therefore hardness value will be different. For the as-printed L-PBF sample, with an almost fully dense microstructure, the micro-hardness is 22% higher than in the extrapolated fully dense PM sample, which is a noticeable increase in the hardness.
This improvement in the hardness of L-PBF samples is attributed to different constituent phases in L-PBF (α′) and PM parts (α + β), as observed and discussed earlier, alongside the formation of the lath martensitic structure and microstructural refinement in L-PBF [50,51]. In order to clarify whether the increase in hardness value is indeed due to the formation of a martensitic structure or the resulting refinements initiated by rapid cooling during the L-PBF process or both, nano-hardness testing of the PM and L-PBF samples was carried out for in situ measurement of hardness of individual phases.
For a nano-indentation examination, it is critical to perform the hardness measurement on an unetched high-quality surface finish, but the phase’s recognition of the samples in the indented region through optical microscopy is a challenge. It has already been reported [22] that even light etching, can affect the nano-indentation results. As explained in Section 2, the final polishing step with colloidal silica for 25 min helped the phases of the samples be visible through SEM in unetched conditions. As seen from Figure 10a, the differentiation between the two phases of β and α in the PM sample is more pronounced than the thin needle shape α′ in the L-PBF sample, Figure 10b. EDS analysis of the regions at the vicinity of the nano-indentations, which is explained later, confirms that the light grey strips in Figure 10a are β phase, while the dark grey areas, covering the main part of the image, are α phase. This has already been confirmed in the etched PM sample, Figure 7b.
Figure 11 shows the nano-indentation maps conducted on the PM sample. In order to increase the validity of the nano-indentation test results of a specific single phase like β, the regions of mixed phases, where the nano-indents have been impressed, are disregarded. In this way, the contribution of different phases to each other (like the effect of the β phase on α or vice versa), is removed from the nano-indentation results. For example, impression 106 in Figure 11 is one of the points in which the indentation impression has included both phases of α and β. For that reason, the data of any impressions, like 106, were invalid and removed from the data analysis. Impressions 12 and 76 in Figure 11 are examples of the indentations having valid data because they were fully impressed on individual phases of α and β, respectively. For each individual impression, there is nano-characterization data besides the EDS spectrum, showing the elements of a phase on each indentation.
The EDS spectrum of the PM sample showed that the amount of vanadium in α (the dark grey regions in Figure 10) varies between nearly 0% and 4.9%, whereas in the β phase (light grey areas in Figure 10), it changes from 5% to 16.6%. This variation of vanadium in either the α or β phases is related to the segregation phenomenon [52], confirming that the microstructure of the PM sample, made with a furnace cooling rate of 3 °C/min, is a quasi-equilibrium, not a fully equilibrium transformation.
In contrast with the PM sample, the variation of the amount of vanadium in the microstructure of the L-PBF sample was much narrower, i.e., 3.5% to 4.2%. This observation reconfirms that the rapid cooling experienced by the β -phase transformation to martensitic phase α′ prevented the vanadium atoms diffusion. For measuring the percentage of vanadium in L-PBF, more than ten spots were chosen according to the brightness and darkness of the regions, as observed in Figure 10b, but it was noticed the different contrast between acicular α′ in the L-PBF samples was not associated with the percentage of vanadium. This suggests that the different contrast observed in the α′ needles shape in Figure 10b is related to the crystallographic orientation differences between α′ laths. The different orientations of the α′-laths can be observed in other studies where crystallographic texture is presented via EBSD analysis [53,54,55].
Based on the EDS analysis of the regions adjacent to individual indents and the nano-hardness value of each indent in the PM samples, the α phase has been categorized into four groups, based on the amount of dissolved vanadium and aluminum in α. As seen from the graph and tabulated data in Figure 12, it seems there is a decreasing trend of nano-hardness of α when the vanadium content increases and aluminum decreases. Aluminum is a well-known substitutional strengthening element in titanium alloy [56,57,58] and its effect on the nano-hardness of titanium alloy has been reported in [59], but the changes in aluminum weight percentage in the α phase shown in Figure 12, compared with vanadium changes, is very little. So, the decreasing trend in nano-hardness of the α phase, observed in Figure 12, is believed to be more related to the higher vanadium concentration than trace reduction in aluminum. The hypothesis that may explain this observation is related to the radius of the vanadium atom (RV = 0.134 nm), which is smaller compared to aluminum (RAl = 0.143 nm) and titanium (RTi = 0.145 nm) atoms. When the vanadium atoms substitute the titanium atoms in the crystal lattice, the smaller size of the V atoms reduces lattice frictional forces (Peierls load) necessary for slip systems to activate. This makes it easier for the dislocations to move to initiate plastic deformation, i.e., lower hardness. In a way, it is hypothesized that the smaller size of substituting vanadium atoms relaxes the Ti crystal lattice and therefore the atomic displacement necessary for hardness measurement is easier, i.e., reduction in hardness.
Nano-hardness of Ti64 alloys with a bimodal microstructure of α and β phases has already been reported by other researchers [60,61] and the wide variation of nano-hardness of α, like 4.57 GPa to 6.84 GPa in [61], has been attributed to α grain orientation [61,62,63]. However, they have not investigated whether these changes in nano-hardness can be associated with variations in chemical composition and segregation. In addition to the effect of α -grain orientation on nano-hardness value, the mechanics of nano-indentation testing could introduce some variation in the reported results. The indentation size effect (known as ISE) [64,65,66] and tip radius of indenter [67,68,69] are some parameters that could be responsible for different values of the nano-hardness reported in the open literature.
The nano-hardness of α in this study, Figure 12, fits well in the range found in the open literature, see Table 4, and the slight difference may be due to phase chemistry and the mechanics of nano-hardness measurement mentioned above.
Figure 13 displays the graphs of load (P) vs. penetration depth (h) of nano-indentations of the L-PBF and the two phases of α and β in the PM samples. The graph shows the rate of loading and unloading, with the loading dwell time of 2 s as specified in the experimental procedure (Figure 13c). It is important to point out that the loading and unloading rates along with the dwell time and applied load plus the geometry of the indenter, all affect the value of nano-hardness. Table 4 summarizes the average of all the results of nano-hardness of all the phases observed in the microstructure of all the samples in this study. The graphs in Figure 13 reveal that the bcc structure of β phase is softer than the hcp phase of α and α′, confirming previous reports [46,58,70]. This is due to the fact that the bcc crystal structure has more slip systems than the hcp and consequently should exhibit better movement of dislocations and greater ductility. However, by comparison of the graphs for α and α′, Figure 13a,b as well as the values in Table 4, it seems α′ does not really require greater loads for the same degree of plastic deformation, i.e., a penetration depth of 300 nm. The nano-hardness of the α phase is the average hardness of all the values of α discussed in Figure 12. Although in some articles [62,71] the effect of β phase and its grain boundaries (with the α phase) on nano-indentation results has been discussed, it is hard to find any reports in the open literature in which they have explicitly differentiated the nano-hardness of each phase of α and β of Ti64 alloy.
Table 4. Nano-hardness of α’, α, and β in L-PBF and PM samples.
PhaseNano-Indentation Load (mN)Indenter Penetration Depth (nm)Nano-Hardness (GPa)Reference
α′ phase of L-PBF sample10.3 ± 0.43006.3 ± 0.27This study
50025003.9[72]
α phase10.13 ± 0.723006.2 ± 0.51This study
50550–6754.4–6.2[60]
2110–1504.09–4.71[62]
24.1–10.0[73]
8–10.63004.57–6.84[61]
β phase9.6 ± 0.23005.9 ± 0.37This study
It is interesting to note that the standard deviation of nano-hardness value for α′, i.e., ±0.27 as shown in Table 4, is lower than in α. It is related to the nearly uniform concentration of aluminum and vanadium in α′, which is not the case for the α phase as explained in Figure 12.
By comparing the nano-hardness values of α′ and α (6.3 ± 0.27 GPa and 6.2 ± 0.51 GPa, respectively) it is clear that their nano-hardness values are nearly the same. Moreover, the refined laths structure of α′ martensite, with a greater area of low angle boundaries as barriers for movement of dislocations, can increase the nano-hardness. This is illustrated in Figure 14, where a 300 nm deep indentation with a semi-equilateral triangle has encountered a few laths boundaries. Apart from α′ laths’ size and associated boundaries, the existence of the dislocations network, stacking faults, and twinning in α′ martensite, as reported by Kurdi et al. [74], are expected to increase the nano-hardness of the L-PBF printed sample. In other words, the negligible increase in the nano-hardness value of α′ (1.6%) is due to the opposing issues of defects in α′ (hardening) and supersaturation of vanadium in α′ (softening).

4. Conclusions

  • The microstructural characterization of Ti64 parts fabricated by L-PBF reconfirms columnar growth of prior β grains upon solidification that transforms to acicular martensite hcp α′ in contrast with Ti64 parts fabricated via the conventional powder metallurgy route, exhibiting diffusional transformation of β to a bimodal microstructure of α and β phases with nearly equiaxed α grains and α + β lamellae;
  • The average micro-hardness of L-PBF fabricated parts is 391 HV compared with an estimated hardness of 310 HV of fully dense PM samples. The higher micro-hardness of L-PBF parts is associated with the laths’ morphology and refinement of the microstructure of a single phase of α′ in L-PBF parts, whereas in PM samples two phases of α and β are influencing the micro-hardness;
  • The nano-hardness measurement enables isolation of the grains boundaries from interfering in the hardness measurement and thus rendering the true bulk hardness of individual phases of α′, α, and β;
  • Almost the same bulk nano-hardness values of α′ and α, i.e., 6.3 GPa and 6.2 GPa, respectively, supports the hypothesis that only the morphology and refinement of α′ are responsible for the greater microhardness values of L-PBF parts;
  • The bulk nano-hardness of α in PM samples seems to be dependent on the concentration of vanadium solute atoms. A higher concentration of vanadium in the hcp crystal structure of α, lowers its hardness;
  • It is hypothesized that the space created by smaller vanadium atoms substituting titanium atoms in α phase crystal lattice allows for the dislocations to move with lesser frictional stresses, leading to a softer α phase.

Author Contributions

Conceptualization, R.G. methodology, R.G.; formal analysis, A.D.B.; investigation, A.D.B.; writing—original draft preparation, A.D.B.; writing—review and editing, S.N., H.E.-H. and R.G.; supervision, R.G., S.N. and H.E.-H.; project administration, A.D.B. All authors have read and agreed to the published version of the manuscript.

Funding

This research received no external funding.

Institutional Review Board Statement

Not Applicable.

Informed Consent Statement

Not Applicable.

Data Availability Statement

The data stored at the University of Adelaide’s “Data storage facilities, BOX folder”.

Acknowledgments

This work has been supported by the Australian Government Research Training Program Scholarship (A.D.B) and The University of Adelaide. This work was performed in part at the Optofab node of the Australian National Fabrication Facility (ANFF) utilizing Commonwealth and South Australian State Government Funding.

Conflicts of Interest

The authors declare no conflict of interest.

References

  1. Banerjee, D.; Williams, J.C. Perspectives on Titanium Science and Technology. Acta Mater. 2013, 61, 844–879. [Google Scholar] [CrossRef]
  2. Geetha, M.; AKSingh RAsokamani Gogia, A.K. Ti based biomaterials, the ultimate choice for orthopaedic implants—A review. Prog. Mater. Sci. 2009, 54, 397–425. [Google Scholar] [CrossRef]
  3. Peters, M.; Leyens, C. Fabrication of Titanium Alloys. In Titanium and Titanium Alloys; Wiley-VCH Verlag GmbH & Co. KGaA: Weinheim, Germany, 2005; pp. 245–261. [Google Scholar]
  4. Kruth, J.-P.; Levy, G.; Klocke, F.; Childs, T. Consolidation phenomena in laser and powder-bed based layered manufacturing. CIRP Ann. 2007, 56, 730–759. [Google Scholar] [CrossRef]
  5. Brandt, M. Laser Additive Manufacturing: Materials, Design, Technologies, and Applications; Woodhead Publishing: Thorston, UK, 2016. [Google Scholar]
  6. Gu, D.; Shi, X.; Poprawe, R.; Bourell, D.L.; Setchi, R.; Zhu, J. Material-structure-performance integrated laser-metal additive manufacturing. Science 2021, 372, eabg1487. [Google Scholar] [CrossRef]
  7. Papazoglou, E.L.; Karkalos, N.E.; Karmiris-Obratański, P.; Markopoulos, A.P. On the Modeling and Simulation of SLM and SLS for Metal and Polymer Powders: A Review. Arch. Comput. Methods Eng. 2021, 29, 941–973. [Google Scholar] [CrossRef]
  8. Singh, D.D.; Mahender, T.; Reddy, A.R. Powder bed fusion process: A brief review. Mater. Today Proc. 2020, 46, 350–355. [Google Scholar] [CrossRef]
  9. Hu, Y.; Cong, W. A review on laser deposition-additive manufacturing of ceramics and ceramic reinforced metal matrix composites. Ceram. Int. 2018, 44, 20599–20612. [Google Scholar] [CrossRef]
  10. Hegab, H.A. Design for additive manufacturing of composite materials and potential alloys: A review. Manuf. Rev. 2016, 3, 11. [Google Scholar] [CrossRef]
  11. Yap, C.Y.; Chua, C.K.; Dong, Z.L.; Liu, Z.H.; Zhang, D.Q.; Loh, L.E.; Sing, S.L. Review of selective laser melting: Materials and applications. Appl. Phys. Rev. 2015, 2, 041101. [Google Scholar] [CrossRef]
  12. Yeong, W.; Yap, C.; Mapar, M.; Chua, C. State-of-the-art review on selective laser melting of ceramics in High Value Manufacturing: Advanced Research in Virtual and Rapid Prototyping. In Proceedings of the 6th International Conference on Advanced Research in Virtual and Rapid Prototyping, Leiria, Portugal, 1–5 October 2014. [Google Scholar]
  13. Randall, M.G. Powder Metallurgy Science, 2nd ed.; Metal Powder Industries Federation: Princeton, NJ, USA, 1994. [Google Scholar]
  14. Santos, L.V.; Trava-Airoldi, V.J.; Corat, E.J.; Nogueira, J.; Leite, N.F. DLC cold welding prevention films on a Ti6Al4V alloy for space applications. Surf. Coat. Technol. 2006, 200, 2587–2593. [Google Scholar] [CrossRef]
  15. Blakey-Milner, B.; Gradl, P.; Snedden, G.; Brooks, M.; Pitot, J.; Lopez, E.; Leary, M.; Berto, F.; du Plessis, A. Metal additive manufacturing in aerospace: A review. Mater. Des. 2021, 209, 110008. [Google Scholar] [CrossRef]
  16. Murr, L.; Quinones, S.; Gaytan, S.; Lopez, M.; Rodela, A.; Martinez, E.; Hernandez, D.; Martinez, E.; Medina, F.; Wicker, R. Microstructure and mechanical behavior of Ti–6Al–4V produced by rapid-layer manufacturing, for biomedical applications. J. Mech. Behav. Biomed. Mater. 2009, 2, 20–32. [Google Scholar] [CrossRef]
  17. Salmi, M. Additive Manufacturing Processes in Medical Applications. Materials 2021, 14, 191. [Google Scholar] [CrossRef]
  18. Ghomi, E.R.; Khosravi, F.; Neisiany, R.E.; Singh, S.; Ramakrishna, S. Future of additive manufacturing in healthcare. Curr. Opin. Biomed. Eng. 2021, 17, 100255. [Google Scholar] [CrossRef]
  19. Kumar, S. Selective Laser Sintering/Melting. In Comprehensive Materials Processing; Elsevier: Amsterdam, The Netherlands, 2014; pp. 93–134. [Google Scholar]
  20. ASTM F2924-14; Standard Specification for Additive Manufacturing Titanium-6 Aluminum-4 Vanadium with Powder Bed Fusion. ASTM International: West Conshohocken, PA, USA, 2014.
  21. Dareh Baghi, A.; Nafisi, S.; Hashemi, R.; Ebendorff-Heidepriem, H.; Ghomashchi, R. Experimental realisation of build orientation effects on the mechanical properties of truly as-built Ti-6Al-4V SLM parts. J. Manuf. Processes 2021, 64, 140–152. [Google Scholar] [CrossRef]
  22. Dareh Baghi, A.; Ghomashchi, R.; Oskouei, R.H.; Ebendorff-Heidepriem, H. Nano-mechanical characterization of SLM-fabricated Ti6Al4V alloy: Etching and precision. Metallogr. Microstruct. Anal. 2019, 8, 749–756. [Google Scholar] [CrossRef]
  23. Xie, B.; Fan, Y.; Zhao, S. Characterization of Ti6Al4V powders produced by different methods for selective laser melting. Mater. Res. Express 2021, 8, 076510. [Google Scholar] [CrossRef]
  24. Thijs, L.; Verhaeghe, F.; Craeghs, T.; Humbeeck, J.V.; Kruth, J.-P. A study of the microstructural evolution during selective laser melting of Ti–6Al–4V. Acta Mater. 2010, 58, 3303–3312. [Google Scholar] [CrossRef]
  25. Rafi, H.K.; Karthik, N.V.; Gong, H.; Starr, T.L.; Stucker, B.E. Microstructures and Mechanical Properties of Ti6Al4V Parts Fabricated by Selective Laser Melting and Electron Beam Melting. J. Mater. Eng. Perform. 2013, 22, 3872–3883. [Google Scholar] [CrossRef]
  26. Dareh Baghi, A.; Nafisi, S.; Hashemi, R.; Ebendorff-Heidepriem, H.; Ghomashchi, R. Effective post processing of SLM fabricated Ti-6Al-4 V alloy: Machining vs thermal treatment. J. Manuf. Processes 2021, 68, 1031–1046. [Google Scholar] [CrossRef]
  27. Mukherjee, T.; Zuback, J.S.; De, A.; Debroy, T. Printability of alloys for additive manufacturing. Sci. Rep. 2016, 6, 19717. [Google Scholar] [CrossRef] [PubMed]
  28. Martin, J.W.; Doherty, R.D.; Cantor, B. Stability of Microstructure in Metallic Systems; Cambridge University Press: Cambridge, UK, 2010. [Google Scholar]
  29. Facchini, L.; Magalini, E.; Robotti, P.; Molinari, A.; Höges, S.; Wissenbach, K. Ductility of a Ti-6Al-4V alloy produced by selective laser melting of prealloyed powders. Rapid Prototyp. J. 2010, 16, 450–459. [Google Scholar] [CrossRef]
  30. Kubiak, K.; Sieniawski, J. Development of the microstructure and fatigue strength of two phase titanium alloys in the processes of forging and heat treatment. J. Mater. Process. Technol. 1998, 78, 117–121. [Google Scholar] [CrossRef]
  31. Jovanović, M.T.; Tadić, S.; Zec, S.; Mišković, Z.; Bobić, I. The effect of annealing temperatures and cooling rates on microstructure and mechanical properties of investment cast Ti–6Al–4V alloy. Mater. Des. 2006, 27, 192–199. [Google Scholar] [CrossRef]
  32. Malinov, S.; Sha, W.; Guo, Z.; Tang, C.; Long, A. Synchrotron X-ray diffraction study of the phase transformations in titanium alloys. Mater. Charact. 2002, 48, 279–295. [Google Scholar] [CrossRef]
  33. Thöne, M.; Leuders, S.; Riemer, A.; Tröster, T.; Richard, H.A. Influence of heat-treatment on Selective Laser Melting products-eg Ti6Al4V. In 2012 International Solid Freeform Fabrication Symposium; University of Texas at Austin: Austin, TX, USA, 2012. [Google Scholar]
  34. Sallica-Leva, E.; Caram, R.; Jardini, A.L.; Fogagnolo, J.B. Ductility improvement due to martensite α′ decomposition in porous Ti–6Al–4V parts produced by selective laser melting for orthopedic implants. J. Mech. Behav. Biomed. Mater. 2016, 54, 149–158. [Google Scholar] [CrossRef]
  35. Welsch, G.; Boyer, R.; Collings, E.W. Materials Properties Handbook: Titanium Alloys; ASM International: Almere, The Netherlands, 1994; p. 1169. [Google Scholar]
  36. Ahmed, T.; Rack, H.J. Phase transformations during cooling in α + β titanium alloys. Mater. Sci. Eng. A 1998, 243, 206–211. [Google Scholar] [CrossRef]
  37. Das, M.; Balla, V.K.; Basu, D.; Bose, S.; Bandyopadhyay, A. Laser processing of SiC-particle-reinforced coating on titanium. Scr. Mater. 2010, 63, 438–441. [Google Scholar] [CrossRef]
  38. Prashanth, K.G.; Scudino, S.; Klauss, H.J.; Surreddi, K.B.; Löber, L.; Wang, Z.; Chaubey, A.K.; Kühn, U.; Eckert, J. Microstructure and mechanical properties of Al–12Si produced by selective laser melting: Effect of heat treatment. Mater. Sci. Eng. A 2014, 590, 153–160. [Google Scholar] [CrossRef]
  39. Li, Y.; Gu, D. Parametric analysis of thermal behavior during selective laser melting additive manufacturing of aluminum alloy powder. Mater. Des. 2014, 63, 856–867. [Google Scholar] [CrossRef]
  40. Hooper, P.A. Melt pool temperature and cooling rates in laser powder bed fusion. Addit. Manuf. 2018, 22, 548–559. [Google Scholar] [CrossRef]
  41. Gianoglio, D.; Ciftci, N.; Armstrong, S.; Uhlenwinkel, V.; Battezzati, L. On the Cooling Rate-Microstructure Relationship in Molten Metal Gas Atomization. Met. Mater. Trans. A 2021, 52, 3750–3758. [Google Scholar] [CrossRef]
  42. Bolzoni, L.; Ruiz-Navas, E.M.; Gordo, E. Feasibility study of the production of biomedical Ti–6Al–4V alloy by powder metallurgy. Mater. Sci. Eng. C 2015, 49, 400–407. [Google Scholar] [CrossRef] [PubMed]
  43. Dunstan, M.K.; Paramore, J.D.; Fang, Z.Z. The effects of microstructure and porosity on the competing fatigue failure mechanisms in powder metallurgy Ti-6Al-4V. Int. J. Fatigue 2018, 116, 584–591. [Google Scholar] [CrossRef]
  44. Fang, Z.Z.; Paramore, J.D.; Sun, P.; Chandran, K.R.; Zhang, Y.; Xia, Y.; Cao, F.; Koopman, M.; Free, M. Powder metallurgy of titanium–past, present, and future. Int. Mater. Rev. 2018, 63, 407–459. [Google Scholar] [CrossRef]
  45. Molchanova, E.K. Phase Diagrams of Titanium Alloys Israel Program for Scientific Translations. Jerusalem 1965, 90, 93. [Google Scholar]
  46. Peters, M.; Hemptenmacher, J.; Kumpfert, J.; Leyens, C. Structure and Properties of Titanium and Titanium Alloys. In Titanium and Titanium Alloys; Wiley-VCH Verlag GmbH & Co. KGaA: Weinheim, Germany, 2005; pp. 1–36. [Google Scholar]
  47. Murr, L.E.; Gaytan, S.M.; Ramirez, D.A.; Martinez, E.; Hernandez, J.; Amato, K.N.; Shindo, P.W.; Medina, F.R.; Wicker, R.B. Metal Fabrication by Additive Manufacturing Using Laser and Electron Beam Melting Technologies. J. Mater. Sci. Technol. 2012, 28, 1–14. [Google Scholar] [CrossRef]
  48. Zhang, L.-C.; Attar, H. Selective Laser Melting of Titanium Alloys and Titanium Matrix Composites for Biomedical Applications: A Review. Adv. Eng. Mater. 2016, 18, 463–475. [Google Scholar] [CrossRef]
  49. Dareh Baghi, A.; Arputharaj, J.D.; Nafisi, S.; Ghomashchi, R. L-PBF 3D Printing of Ti64 Alloy, Unpublished Results; University of Adelaide: Adelaide, SA, Australia, 2022. [Google Scholar]
  50. Gu, D.; Hagedorn, Y.-C.; Meiners, W.; Meng, G.; Batista, R.J.S.; Wissenbach, K.; Poprawe, R. Densification behavior, microstructure evolution, and wear performance of selective laser melting processed commercially pure titanium. Acta Mater. 2012, 60, 3849–3860. [Google Scholar] [CrossRef]
  51. Attar, H.; Calin, M.; Zhang, L.C.; Scudino, S.; Eckert, J. Manufacture by selective laser melting and mechanical behavior of commercially pure titanium. Mater. Sci. Eng. A 2014, 593, 170–177. [Google Scholar] [CrossRef]
  52. Callister, W.D.; Rethwisch, D.G. Materials Science and Engineering: An Introduction; Wiley: New York, NY, USA, 2007; Volume 7. [Google Scholar]
  53. Medvedev, A.E.; Lui, E.W.; Edwards, D.; Leary, M.; Qian, M.; Brandt, M. Improved ballistic performance of additively manufactured Ti6Al4V with α-β lamellar microstructures. Mater. Sci. Eng. A 2021, 825, 141888. [Google Scholar] [CrossRef]
  54. Liu, J.; Li, G.; Sun, Q.; Li, H.; Sun, J.; Wang, X. Understanding the effect of scanning strategies on the microstructure and crystallographic texture of Ti-6Al-4V alloy manufactured by laser powder bed fusion. J. Mater. Process. Technol. 2021, 299, 117366. [Google Scholar] [CrossRef]
  55. Simonelli, M.; Tse, Y.Y.; Tuck, C. On the Texture Formation of Selective Laser Melted Ti-6Al-4V. Met. Mater. Trans. A 2014, 45, 2863–2872. [Google Scholar] [CrossRef]
  56. Truax, D.; McMahon, C. Plastic behavior of titanium-aluminum alloys. Mater. Sci. Eng. 1974, 13, 125–139. [Google Scholar] [CrossRef]
  57. Fitzner, A.; Prakash, D.; da Fonseca, J.Q.; Thomas, M.; Zhang, S.-Y.; Kelleher, J.; Manuel, P.; Preuss, M. The effect of aluminium on twinning in binary alpha-titanium. Acta Mater. 2016, 103, 341–351. [Google Scholar] [CrossRef]
  58. Donachie, M.J. Titanium: A Technical Guide; ASM International: Novelty, OH, USA, 2000. [Google Scholar]
  59. Fitzner, A.; Palmer, J.; Gardner, B.; Thomas, M.; Preuss, M.; da Fonseca, J.Q. On the work hardening of titanium: New insights from nanoindentation. J. Mater. Sci. 2019, 54, 7961–7974. [Google Scholar] [CrossRef]
  60. Wen, Y.; Xie, L.; Wang, Z.; Wang, L.; Lu, W.; Zhang, L.-C. Nanoindentation characterization on local plastic response of Ti-6Al-4V under high-load spherical indentation. J. Mater. Res. Technol. 2019, 8, 3434–3442. [Google Scholar] [CrossRef]
  61. Viswanathan, G.B.; Lee, E.; Maher, D.M.; Banerjee, S.; Fraser, H.L. Direct observations and analyses of dislocation substructures in the α phase of an α/β Ti-alloy formed by nanoindentation. Acta Mater. 2005, 53, 5101–5115. [Google Scholar] [CrossRef]
  62. Han, F.; Tang, B.; Kou, H.; Li, J.; Feng, Y. Experiments and crystal plasticity finite element simulations of nanoindentation on Ti–6Al–4V alloy. Mater. Sci. Eng. A 2014, 625, 28–35. [Google Scholar] [CrossRef]
  63. Zambaldi, C.; Yang, Y.; Bieler, T.R.; Raabe, D. Orientation informed nanoindentation of α-titanium: Indentation pileup in hexagonal metals deforming by prismatic slip. J. Mater. Res. 2011, 27, 356–367. [Google Scholar] [CrossRef]
  64. Peng, Z.; Gong, J.; Miao, H. On the description of indentation size effect in hardness testing for ceramics: Analysis of the nanoindentation data. J. Eur. Ceram. Soc. 2004, 24, 2193–2201. [Google Scholar] [CrossRef]
  65. Durst, K.; Backes, B.; Franke, O.; Göken, M. Indentation size effect in metallic materials: Modeling strength from pop-in to macroscopic hardness using geometrically necessary dislocations. Acta Mater. 2006, 54, 2547–2555. [Google Scholar] [CrossRef]
  66. Rodriguez, R.; Gutierrez, I. Correlation between nanoindentation and tensile properties: Influence of the indentation size effect. Mater. Sci. Eng. A 2003, 361, 377–384. [Google Scholar] [CrossRef]
  67. Lu, C.-J.; Bogy, D. The effect of tip radius on nano-indentation hardness tests. Int. J. Solids Struct. 1995, 32, 1759–1770. [Google Scholar] [CrossRef]
  68. Shih, C.; Yang, M.; Li, J. Effect of tip radius on nanoindentation. J. Mater. Res. 1991, 6, 2623–2628. [Google Scholar] [CrossRef]
  69. Sagadevan, S.; Murugasen, P. Novel Analysis on the Influence of Tip Radius and Shape of the Nanoindenter on the Hardness of Materials. Procedia Mater. Sci. 2014, 6, 1871–1878. [Google Scholar] [CrossRef]
  70. Lei, X.; Dong, L.; Zhang, Z.; Hu, M.; Wang, Z.; Hao, Y.; Yang, R. Microtexture and nanoindentation of α and β Phases in Ti–6Al–1.5 Cr–2.5 Mo–0.5 Fe–0.3 Si titanium alloy. Sci. Adv. Mater. 2017, 9, 1476–1483. [Google Scholar] [CrossRef]
  71. Weaver, J.; Kalidindi, S.R. Mechanical characterization of Ti-6Al-4V titanium alloy at multiple length scales using spherical indentation stress-strain measurements. Mater. Des. 2016, 111, 463–472. [Google Scholar] [CrossRef]
  72. Hadadzadeh, A.; Asadi, E.; Shakil, S.I.; Amirkhiz, B.S.; Mohammadi, M.; Haghshenas, M. Indentation-derived mechanical properties of Ti-6Al-4V: Laser-powder bed fusion versus electron beam melting. Mater. Lett. 2021, 301, 130273. [Google Scholar] [CrossRef]
  73. Li, R.; Riester, L.; Watkins, T.; Blau, P.J.; Shih, A.J. Metallurgical analysis and nanoindentation characterization of Ti–6Al–4V workpiece and chips in high-throughput drilling. Mater. Sci. Eng. A 2008, 472, 115–124. [Google Scholar] [CrossRef]
  74. Kurdi, A.; Basak, A. Micro-mechanical behaviour of selective laser melted Ti6Al4V under compression. Mater. Sci. Eng. A 2021, 826, 141975. [Google Scholar] [CrossRef]
Figure 1. Size distribution of Ti64 powder particles.
Metals 12 01462 g001
Figure 2. Spherical morphology of Ti64 powder with satellite particles and particles inside particles.
Metals 12 01462 g002
Figure 3. (a) sectioning plan for hardness measurement of L-PBF fabricated vertical and horizontal samples, (b) nano-indentation maps for sectioned discs from vertical and horizontal samples.
Metals 12 01462 g003
Figure 4. SEM micrographs of etched (a) starting powder particles and (b) L-PBF sample.
Metals 12 01462 g004
Figure 5. SEM images of PM samples sintered at 1100 °C: (a) compacted at 450 MPa and (c) 735 MPa, and PM samples sintered at 1250 °C: (b) compacted at pressure 450 MPa and (d) 735 MPa.
Metals 12 01462 g005aMetals 12 01462 g005b
Figure 6. XRD spectra of Ti64 powder, as-built L-PBF, and PM sample.
Metals 12 01462 g006
Figure 7. EDS analysis of (a) as-built L-PBF fabricated part, (b) PM sample (750 MPa/1250 °C).
Metals 12 01462 g007aMetals 12 01462 g007b
Figure 8. Optical micrographs of transverse sections of L-PBF parts after etching (a) horizontally built cylinder and (b) vertically built cylinder.
Metals 12 01462 g008
Figure 9. Hardness of PM and L-PBF samples vs. their porosity contents.
Metals 12 01462 g009
Figure 10. Backscatter electron image of polished samples in unetched conditions, (a) PM and (b) L-PBF sample.
Metals 12 01462 g010
Figure 11. Backscatter electron images of 120 indents on the PM sample in unetched condition.
Metals 12 01462 g011
Figure 12. Nano-hardness values of the α phase with different contents of vanadium and aluminum.
Metals 12 01462 g012
Figure 13. Loading and unloading indentations graphs of (a) L-PBF, (b) α phase-PM and (c) β phase -PM samples.
Metals 12 01462 g013
Figure 14. A 300 nm deep penetrated nano-indentation in L-PBF sample.
Metals 12 01462 g014
Table 1. Chemical composition of Ti64 powder (wt.%).
ElementAlVFeOCNHTi
Ti64 powder6.153.940.180.0980.0050.01<0.002Bal.
ASTM F2924-145.50–6.753.50–4.50Max 0.3Max 0.2Max 0.08Max 0.05Max 0.015Bal.
Table 2. L-PBF processing parameters for fabrication of Ti64 samples.
Laser Power (W)Scan Speed (mm/s)Layer Thickness (μm)Hatch Spacing (μm)
27018003085
Table 3. Porosity percentage of PM samples.
SampleCompacting Pressure (MPa)Sintering Temperature (°C)Sintering Time (h)Porosity (%)
Powder metallurgy (PM)4501100126.0 ± 1.2
12509.0 ± 0.5
735110013.0 ± 1.6
12504.0 ± 0.2
Publisher’s Note: MDPI stays neutral with regard to jurisdictional claims in published maps and institutional affiliations.

