Article

Effect of High-Sintering-Temperature Reduction Behavior on Coke Solution Loss Reaction with Different Thermal Properties

1
School of Materials and Metallurgy, University of Science and Technology Liaoning, Anshan 114051, China
2
The Key Laboratory of Chemical Metallurgy Engineering of Liaoning Province, Anshan 114051, China
*
Author to whom correspondence should be addressed.
Metals 2023, 13(1), 117; https://doi.org/10.3390/met13010117
Submission received: 13 December 2022 / Revised: 1 January 2023 / Accepted: 4 January 2023 / Published: 6 January 2023

Abstract

:
With the shortage of high-quality coking coal resources and the pursuit of low-cost smelting, the types and sources of coal have changed. Therefore, it is difficult to establish an effective correlation between the existing evaluation indexes of coke thermal performance and the production indexes of the blast furnace. The dissolution deterioration of coke directly affects the production benefits of the blast furnace, and the dissolution deterioration of blast furnace coke is the result of ore–coke coupling. To better understand the mechanism of the coupling reaction relative to the thermal properties of coke, this paper experimentally studies ore–coke coupling between two kinds of coke and one kind of blast furnace standing sinter which have different reactivities but are used in practical applications. This method adopts a matched thermogravimetric device. By analyzing and calculating the high-temperature reduction behavior and characteristics of the sinter and the dissolution loss behavior and characteristics of coke in the gas–solid coupling reaction test of coke and sinter, and comparing and fitting the coupling reaction factors of the coupling reaction and the thermal properties of coke, it was revealed that the real degradation behavior of coke was affected by the reduction reaction of the sinter. The results show that the temperature range with the best matching degree between the reduction reaction of oxygen supply from sinter and the gasification reaction of oxygen consumption from coke is at a position where the coupling factor is closest to 1. In the gas–solid coupling reaction between low-reactivity coke and sinter, the strongest dissolution rate, RCSL, is approximately 1200 °C, while in the gas–solid coupling reaction between high-reactivity coke and sinter, the RCSL is approximately 1100 °C. The minimum strength, CSCSL, of high-active coke and sinter after dissolution is approximately 1100 °C, while that of low-active coke and sinter after dissolution is approximately 1200 °C. It is shown that there is a good linear relationship between the RCSL of high- and low-reactive coke and strength after dissolution loss CSCSL.

1. Introduction

In the 1960s, several blast furnaces were dissected and studied, and it was found that coke dissolved in the soft melting zone of the blast furnace at approximately 900–1300 °C, which led to a decrease in the particle size and strength of the coke and affected the air permeability and liquid permeability of the material column [1,2,3,4,5,6,7]. At present, the coke reactivity index (CRI) and coke strength after reaction (CSR) tests are primarily used to evaluate the ability of coke to resist dissolution and deterioration, and it is believed that smelting coke with a low CRI index and high CSR index in a blast furnace is beneficial to the stable operation of the blast furnace and the reduction of energy consumption. However, the CRI and CSR tests do not simulate the temperature change under blast furnace conditions and the CO2 concentration change caused by ore reduction, so it is difficult to calculate the production index of the blast furnace using the CRI and CSR test data.
The ore coke in the blast furnace is in a stratified state, and the CO produced by the combustion and direct reduction of the tuyere fuel flows through the ore bed and is indirectly reduced:
F e X O Y ( s ) + C O ( g )   =   F e X O Y 1 ( s )   +   C O 2 ( g )
The generated CO2 flows through the coke layer and is involved in a dissolution reaction:
z C O 2 + z C ( s ) = 2 z C O ( g )
Indirect reduction (1) and dissolution reaction (2) are superimposed to form direct reduction:
F e X O Y ( s )   +   z C ( s )   =   F e X O Y 1 ( s ) + ( 2 z 1 ) C O ( g )   +   ( 1 z ) C O 2 ( g )
Therefore, the dissolution and degradation of coke in a blast furnace are not only related to reactivity, but also affected by direct reduction. Considering that the total dissolution rate of coke in the blast furnace is affected by the direct reduction degree, the author puts forward a method to evaluate the thermal performance of coke by using the coke strength after the dissolution rate of coke is 25%, which has shown advantages in evaluating the high-temperature thermal performance of highly reactive coke [8,9,10,11,12]. However, there are still shortcomings, which ignore the effect of high-temperature behavior and the characteristics of iron ore on coke dissolution and deterioration.
In this paper, the sinter and different CRI and CSR coke-layered samples were used for the high-temperature reduction test and coke dissolution degradation test. The high-temperature reduction behavior and characteristics of sinter and their influence on the degradation performance of coke dissolution were revealed, which provided theoretical and technical support for the evaluation of the coke thermal performance and blast furnace application.

2. Experiment

2.1. Sample

The samples used in this work were prepared by mixing industrial sinter and coke. This is high-basicity sinter for blast furnace (w(CaO)/w(SiO2) = 1.91). See Table 1 for its chemical composition and Table 2 for the performance indexes of the two kinds of coke with very different thermal properties. Among them, Coke 1 has high reactivity, with a CRI of 38.6% and CSR of 38.9%. Coke 2 has low reactivity with a CRI of 23.6% and CSR of 66.2%.

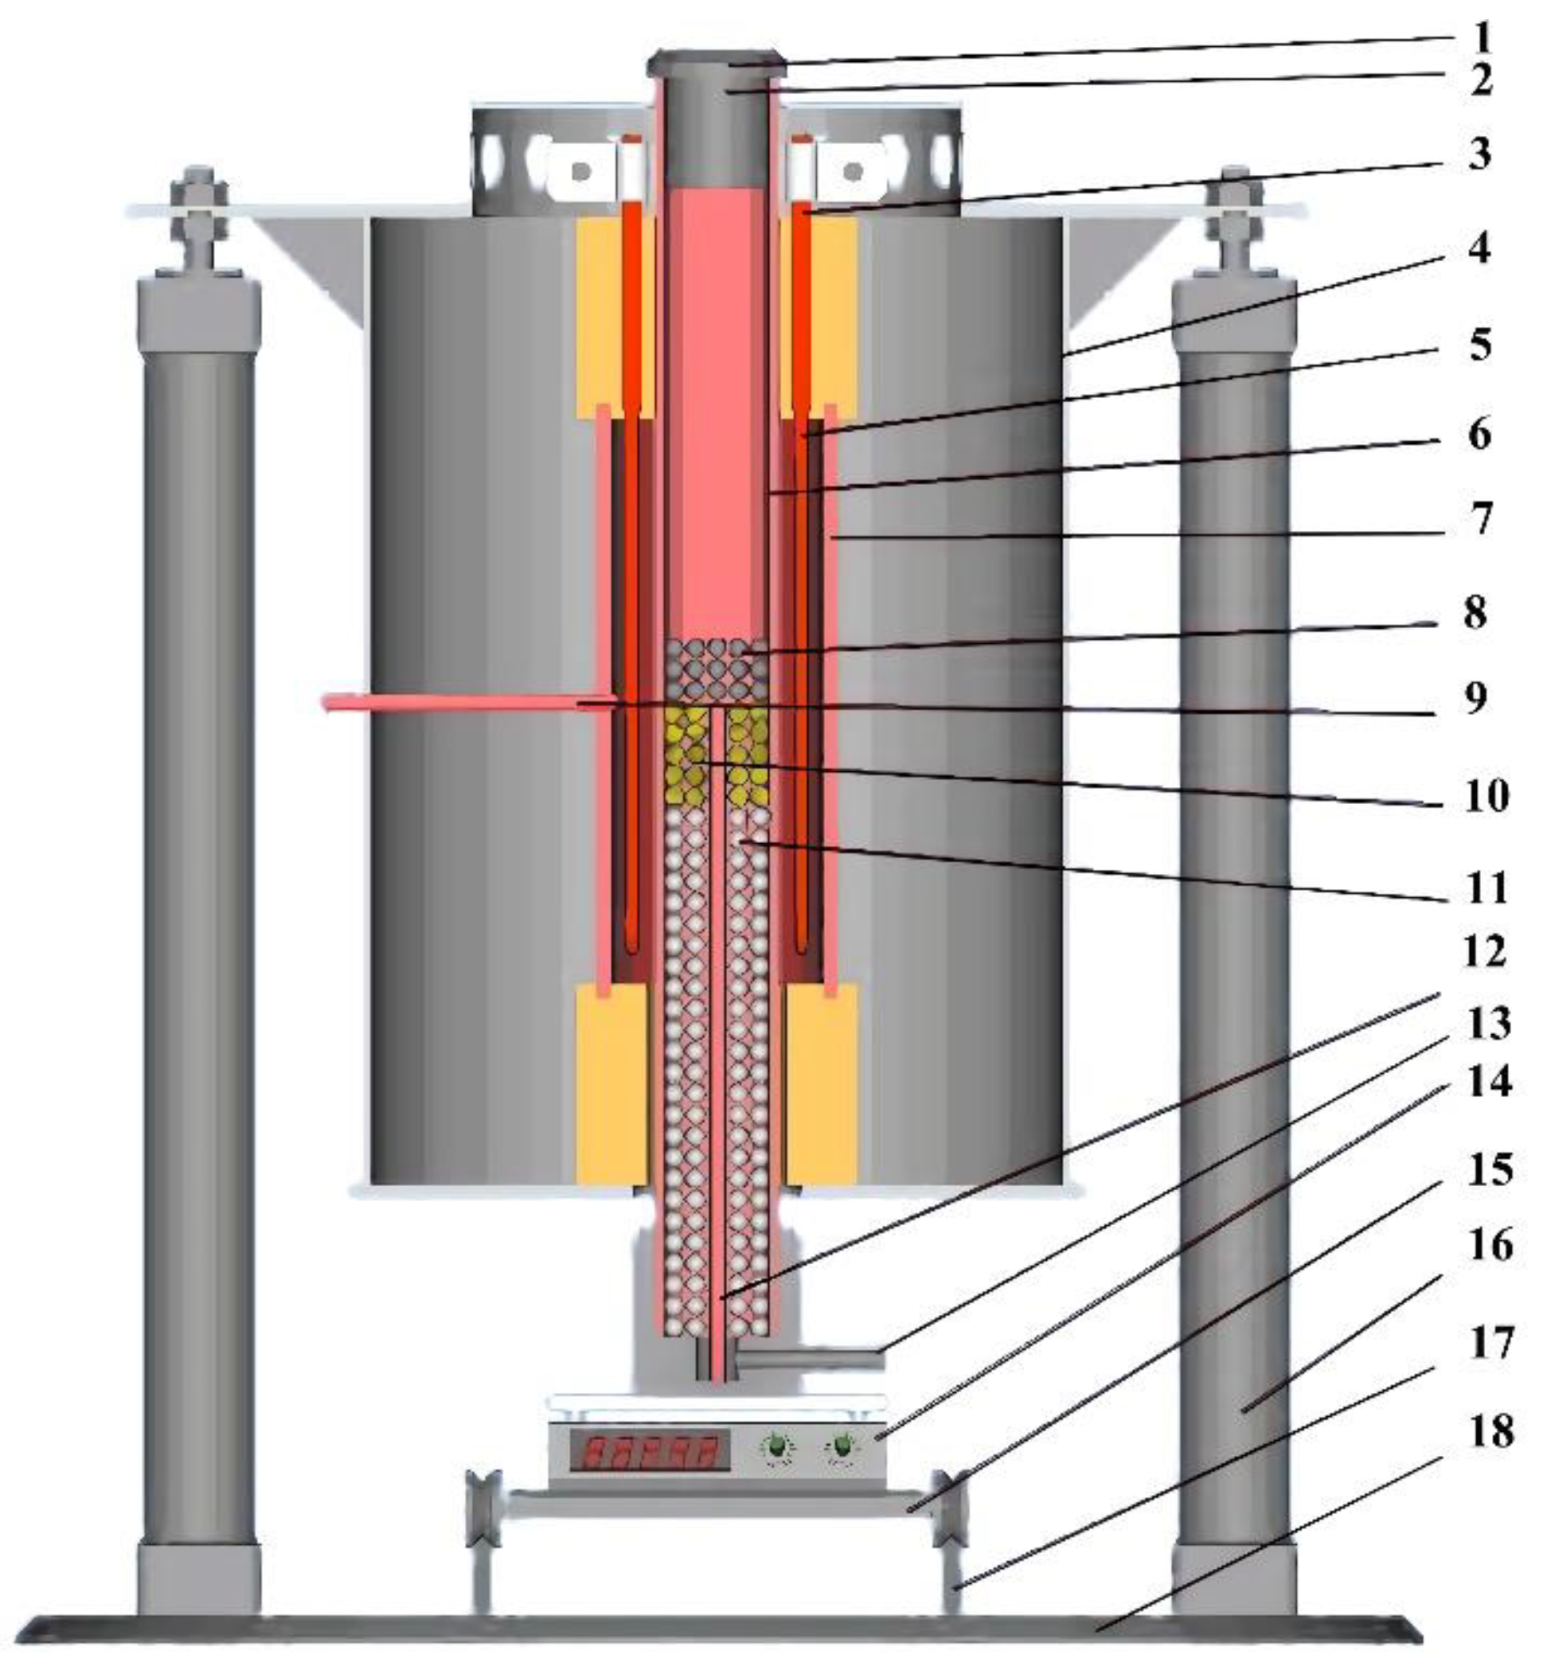
2.2. Experimental Device

The experimental device (made by University of Science and Technology Liaoning, China, Patent No.: 201010157449.0) is a supported thermogravimetric system with a maximum service temperature of 1600 °C, and the reaction tube is a high-temperature corundum tube with an inner diameter of 80 mm (see Figure 1).

2.3. Experimental Methods

2.3.1. Sample

The samples were firstly prepared by grinding and sieving. For each group of experiments, the sinter had a grain size of 10.0–12.5 mm and a mass of 400 ± 0.5 g, while the particle size of coke was 23–25 mm with a mass of 80 ± 0.5 g. To understand the influence of the sinter reduction on coke dissolution deterioration, sinter and coke were charged in two layers into the reaction tube, as shown in Figure 1. The protective gas, N2, was injected at a flowrate of 5 L/min, the reducing gas was a mixture of 30 ± 0.5% CO and 70 ± 0.5% N2, and the flowrate was 15 ± 1 L/min.

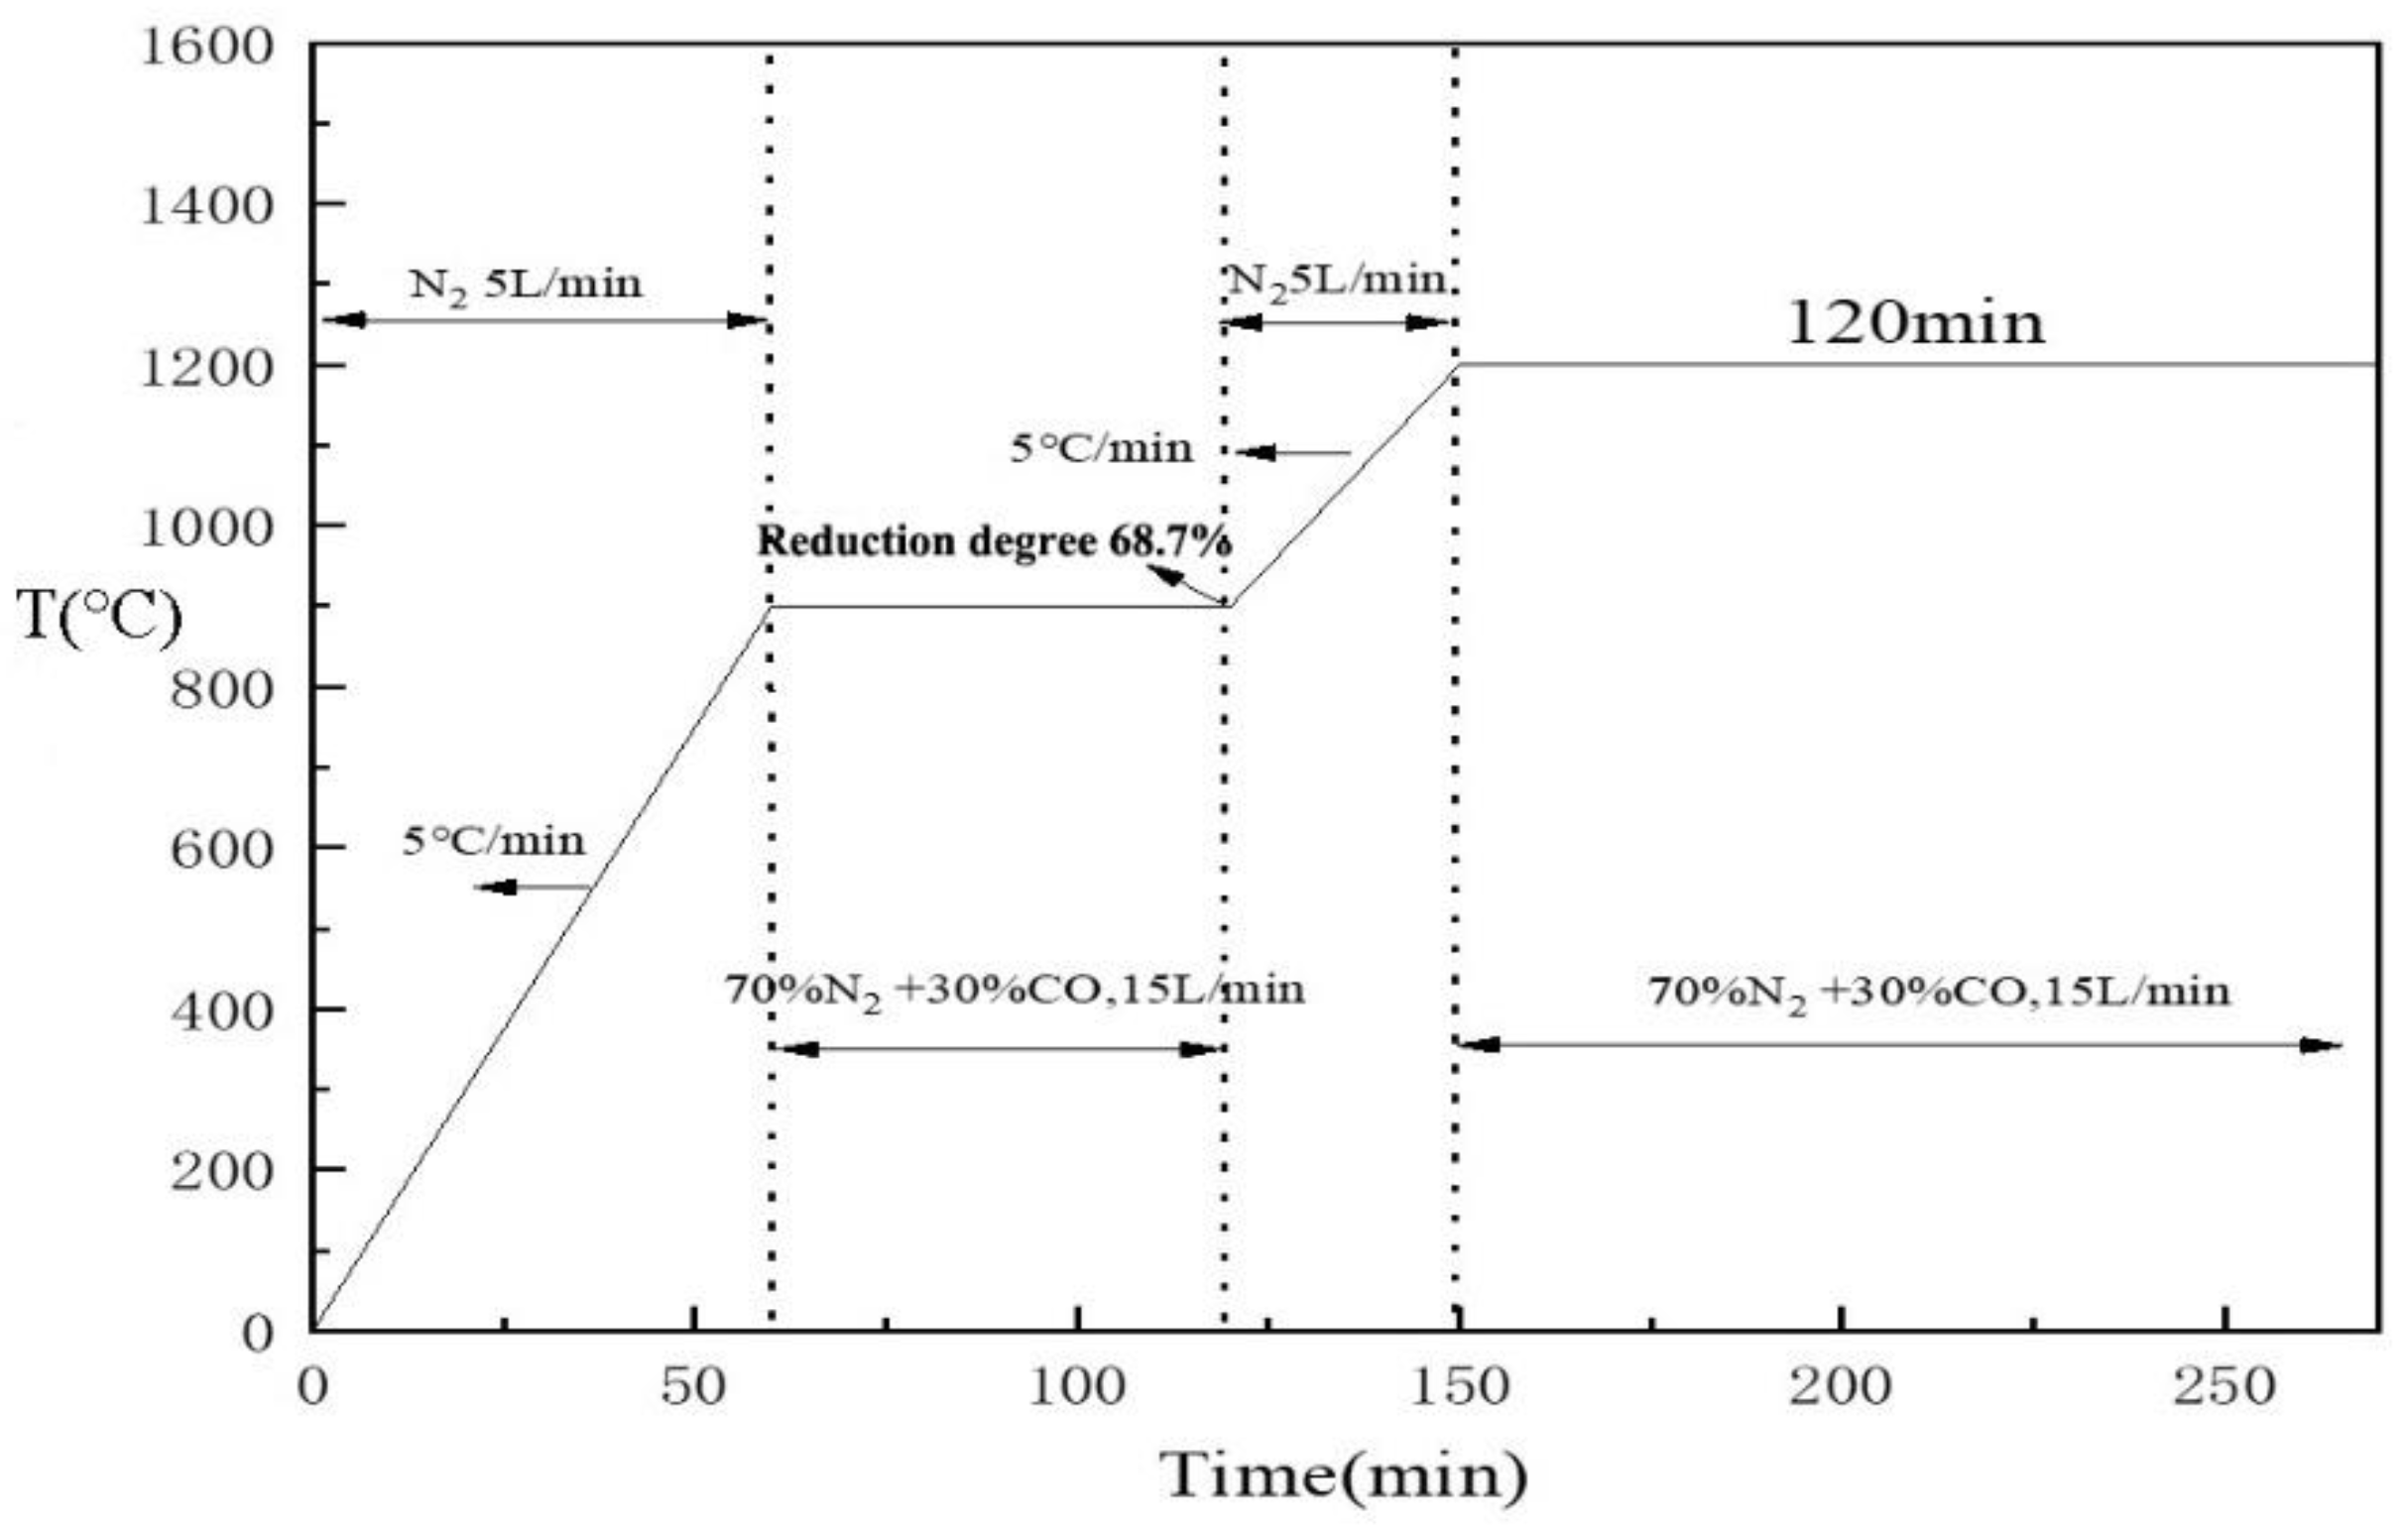
2.3.2. High-Temperature Reduction Experiment

The high-temperature isothermal reduction experiment after pre-reduction is shown in Figure 2. The five sets of experimental samples were heated to 900 °C at a rate of 5 °C/min under the protection of N2 gas until the reduction degree reached 68.7% (the direct reduction degree of iron in the blast furnace was 0.5). The pre-reduction sample was heated to a specified temperature, 1050 °C, 1100 °C, 1150 °C, 1200 °C, or 1250 °C, at a rate of 5 °C/min under the protection of 5 L/min N2 gas, and then changed to reducing gas for 120 min. After the reduction, the sample was cooled to room temperature under the protection of N2 gas and kept for performance testing [13].
The high-temperature non-isothermal reduction experiment was carried out at three heating rates (5, 10, and 15 °C/min), respectively, from 400 °C to 1250 °C under a 15 L/min reducing gas flow. After the reduction, the sample was cooled to room temperature under the protection of N2 gas.

2.3.3. Index

The mass change of sinter during high-temperature reduction after pre-reduction is as follows:
Δ m s , HT   =   m s , p     m s , HT
where Δms,HT is the mass change of sinter at the t moment of high-temperature reduction, g; ms,p is the mass of sinter after pre-reduction, g; and ms,HT is the mass of sinter at the t moment of high-temperature reduction, g.
The calculation formula of high-temperature reduction degree is:
R s , H T = O s , H T O q × 100 = Δ m s , H T 0.429 w TFe 0.112 w FeO m s , 0 × 100 , %
where Rs,HT is the reduction degree of sinter at high temperature, %; Os,HT is oxygen loss due to high-temperature reduction, g; Oq is the total oxygen content of iron oxide in the sinter, g; ms,0 is the mass of the sinter sample, g; wTFe is the total iron content of sinter, %; and wFeO is the amount of FeO in sinter, %.
The quality change of coke sample during high-temperature reduction is as follows:
Δ m c = Δ m s c Δ m s , M T
where Δmc is the mass change of coke in the ore coke sample at time t, g; Δms-c is the mass change of the ore–coke sample at time t, g; and Δms,MT is the mass change of the sample at time t when the sinter is reduced, g.
The calculation formula of the coke dissolution loss rate is RCSL:
R C S L = Δ m c m c , 0 × 100 , %
where mc,0 is the mass of the coke sample, g.
Type I drum is used to detect the cooled coke, and the formula for calculating the strength CSCSL of coke after dissolution loss is:
CS C S L = m CSL 10 m CSL × 100 , %
where m CSL is the mass of residual coke after reaction, g; m CSL 10 is the mass of the reacted coke with a grain size greater than 10 mm after the drum, g.

3. Experimental Results and Analysis

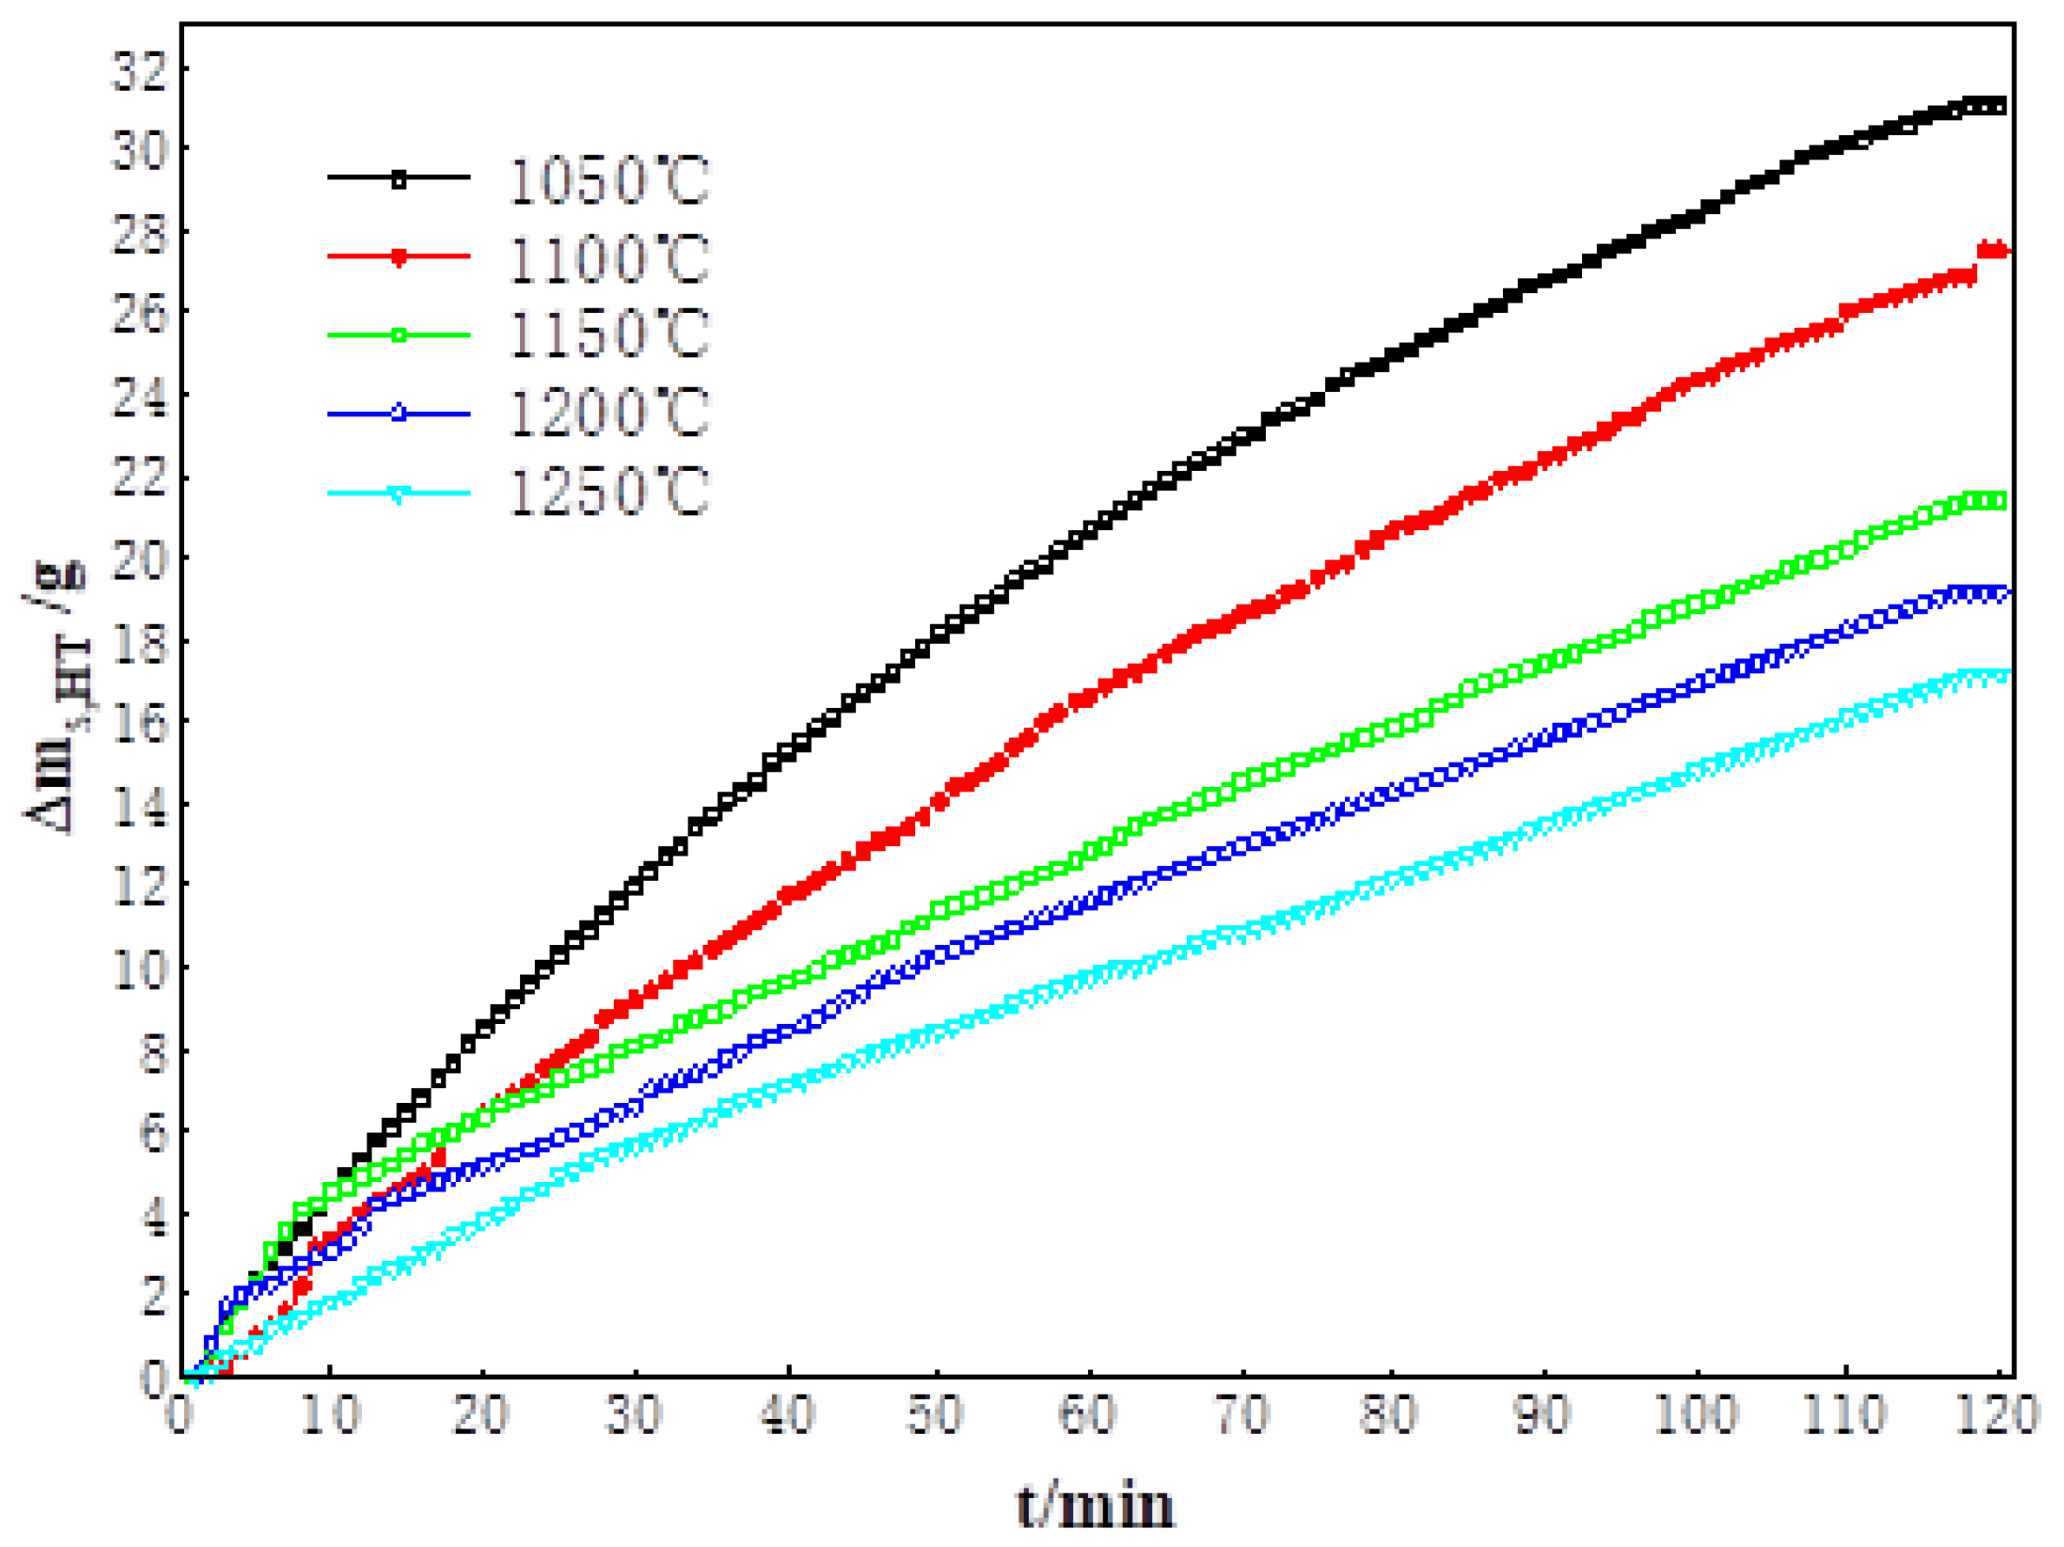
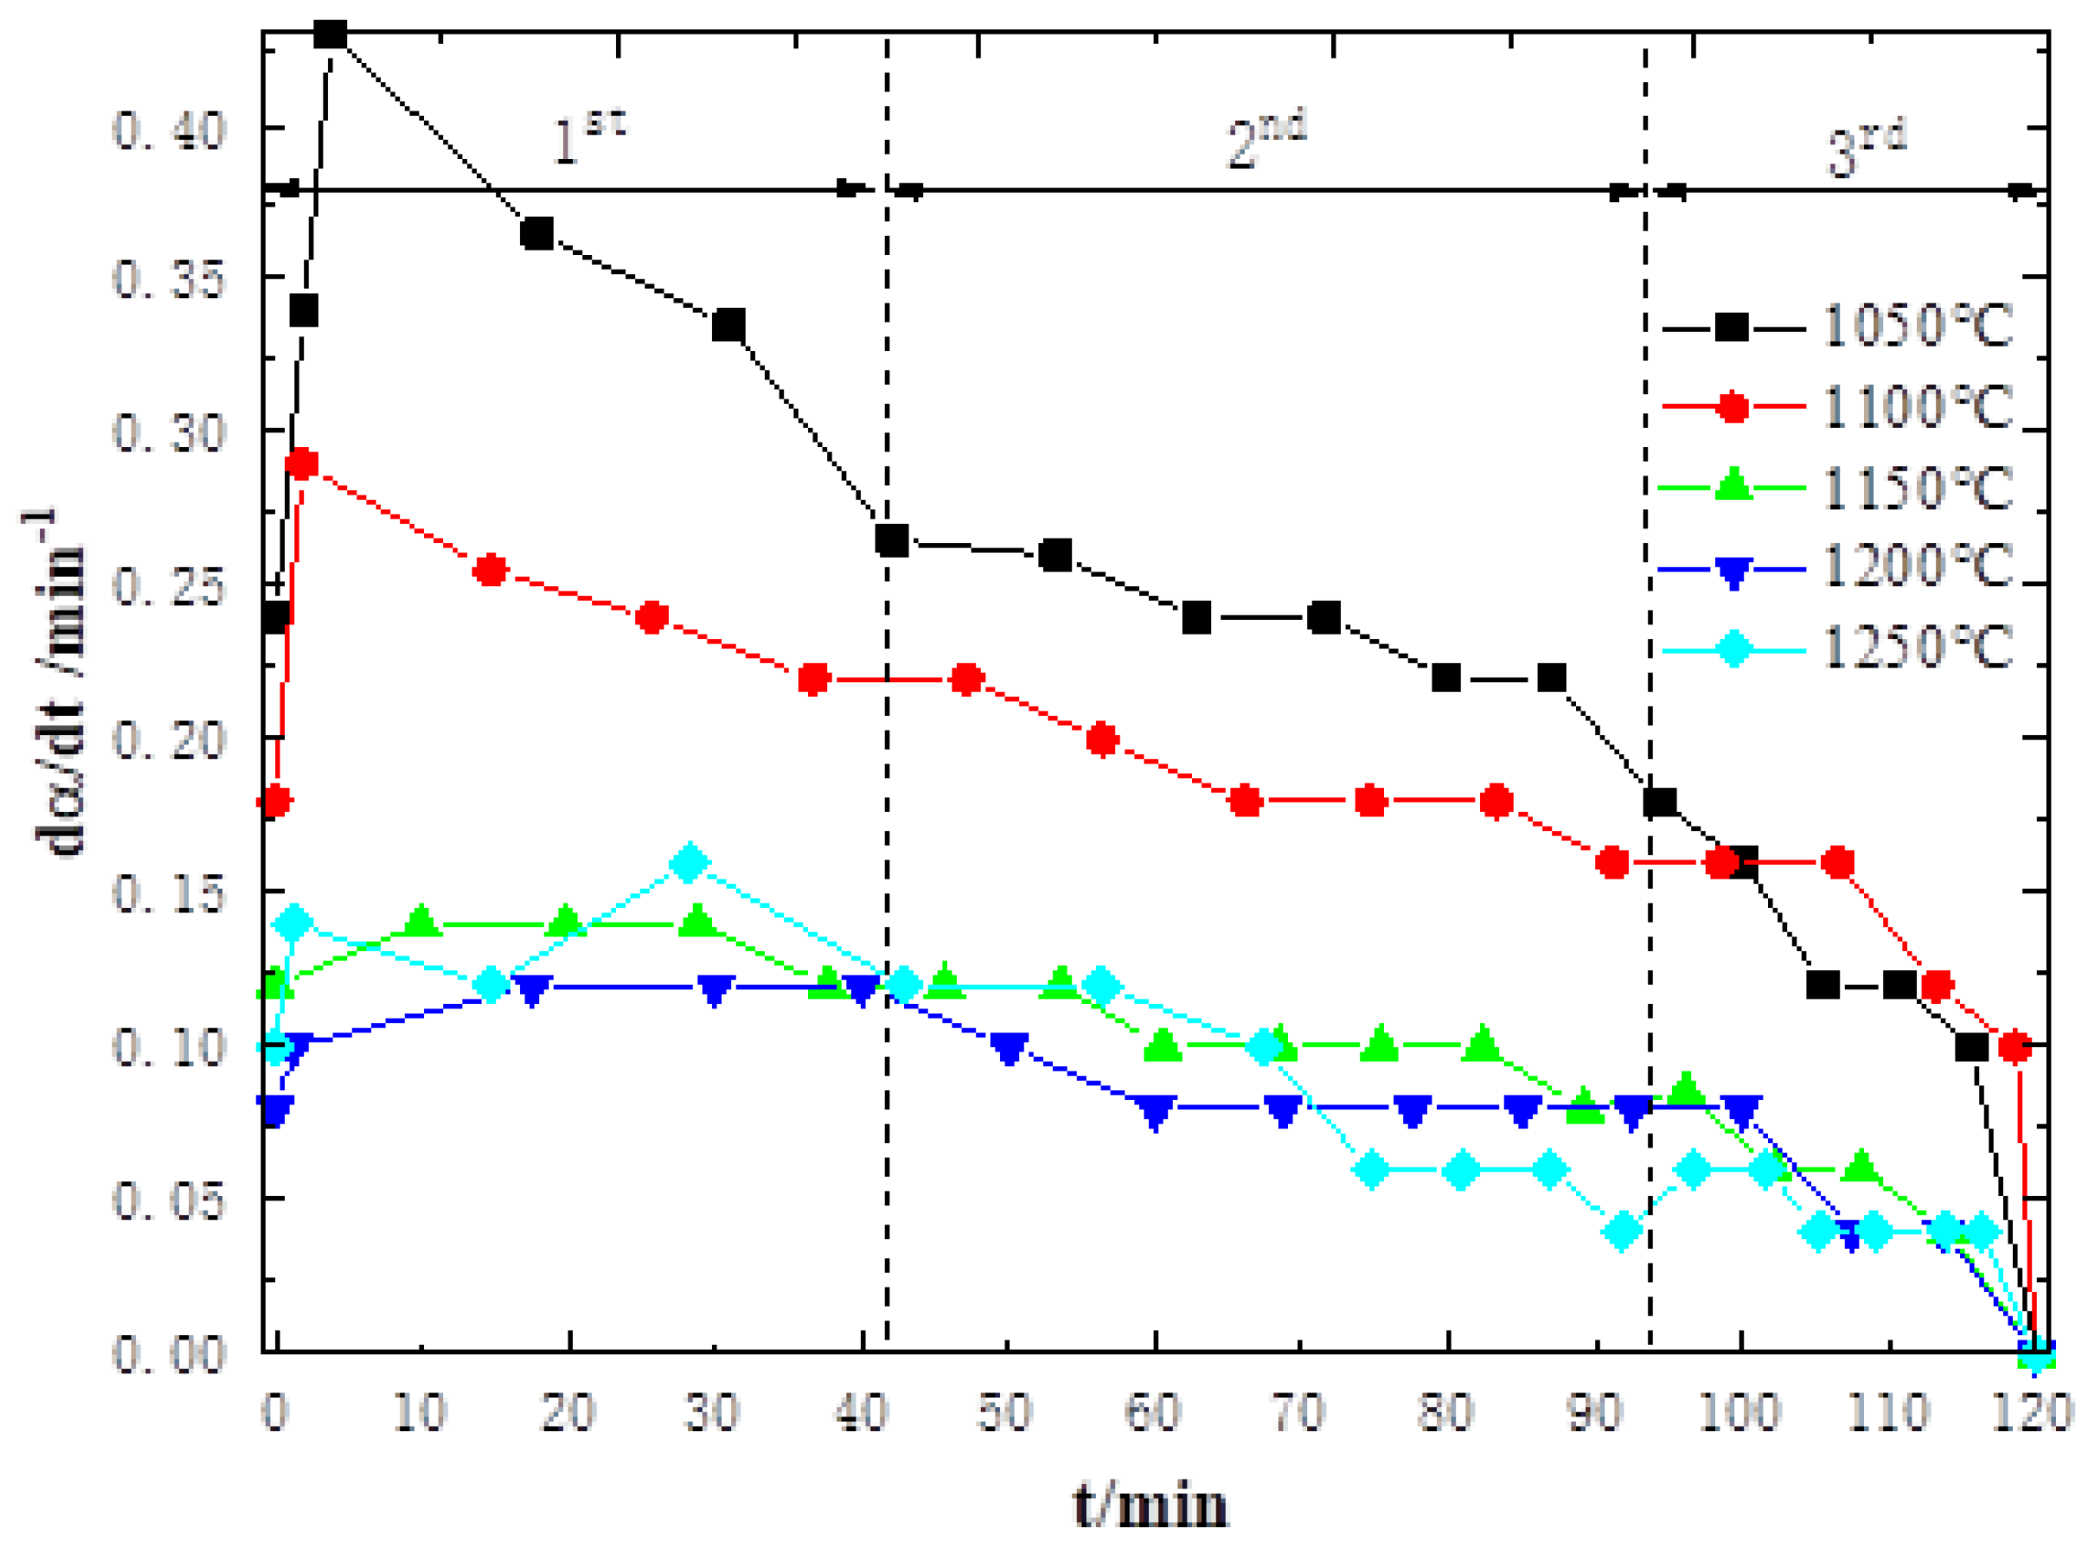
3.1. High-Temperature Reduction Behavior and Characteristics of Sinter

See Figure 3 for the weight loss curve of sinter at high-temperature reduction and Table 3 for the reduction degree. As can be seen from Figure 2 and Table 3, when the reduction temperature increases from 1050 °C to 1250 °C, the reduction degree obviously decreases. Within this range, when the temperature increases from 1050 °C to 1150 °C, it decreases greatly, and when it increases from 1150 °C to 1250 °C, it decreases more gradually.
It can be seen from the high-temperature reduction rate curve of sinter shown in Figure 4 that the reduction behavior changes with the reaction process and temperature rise. During the initial stage of reduction, the rate decreased rapidly, then slowly in the middle stage, and rapidly in the later stage. The increasing temperature has different effects on the reduction rate. The effect is obvious when the reduction temperature is low (1050–1150 °C), but it has little effect when the temperature is high (1150–1250 °C).
The high-temperature reduction behavior of the sinter can be expressed as follows:
g ( R S , HT ) = kt
where g(Rs,HT) is the mechanism of reduction reaction; in this paper, for simplicity, g(α) is used instead of g(Rs,HT). k is the reaction rate constant, and t is the time, min.
The relationship between reaction rate constant k and temperature is as follows:
k = A exp ( E / RT )
where A is the pre-exponential factor, E is the apparent activation energy, R is the gas constant, and T is the absolute temperature.
According to the experimental results of the isothermal reduction of the sinter between 1050 °C and 1250 °C, the model-matching method was used to solve the three kinetic factors [14,15,16,17,18,19,20,21,22,23,24,25], which includes two steps: the first step is the determination of the proper model best representing the experimental data in Table 4, and the latter is the calculation of the “Ea”, “A”, and “n” values. Despite their popularity and ability to directly determine whole kinetic parameters, the reliability of model-fitting methods is controversial due to some shortcomings that limit their single use for complicated reaction kinetics. As a complementary alternative, isoconversional methods (also known as model-free methods) allow for the determination of activation energy without assuming a kinetic model about the reaction mechanism. In fact, employing model-fitting methods along with model-free approaches is an increasingly common practice in recent kinetic studies. In this study, integral Flynn–Wall–Ozawa (FWO), Kissinger–Akahira–Sunose (KAS), and differential Friedman methods (see Equations (11)–(13), respectively) were adopted for model-free analysis of non-isothermal kinetic data obtained at all heating rates.
FWO : ln ( β ) = ln A · E a R · g ( α ) 5.331 1.051 E a R · T
KAS : ln β T 2 = ln A · R g ( α ) · E a E a R · T
FR : ln β · d α d T = E a R · T + ln A · f ( α ) · C n
First, the non-isothermal reduction experiment of sinter was analyzed. As shown in Figure 5 under different heating rates (5, 10, and 15 °C/min), the “α” and “T” values based on the reduction mechanism of sinter were first evaluated by model-free FWO and KAS methods to determine the change of “Ea” as a conversion function. For each group of experiments with different heating rates, 16 temperature values corresponding to 16 conversion levels varying from 0.05 to 0.8 (increment of 5%) were determined and then used to linearly fit “β” to “T” data according to the equation. In addition to the integral FWO method and KAS method, the non-isothermal data were also processed by the differential FR method according to the equation, and the change of “Ea” as a conversion function was obtained. Through the straight line in Figure 6, the average “Ea” values were determined by the FWO, KAS, and FR methods to be 89.45 kJ/mol, 75.81 kJ/mol, and 60.03 kJ/mol, respectively. Therefore, the average “Ea” value obtained by the non-isothermal, model-free method was used to verify the model selection in each stage of the isothermal model method so as to judge the correct reaction model in different stages. For the first area of isothermal sinter reduction, the “Ea” value was determined to be 138.87 kJ/mol by the nucleation and growth control model, where the R2 was 0.9897 (note that for the reaction controlled by the nucleation and growth model, the “Ea” value is quite high), while the R2 and Ea were determined to be 0.9858 and 45.79 kJ/mol by the diffusion model. It can be seen that the R2 values are very close in terms of linearity, and the models are rather indistinguishable. Similarly, the “Ea” of the second reduction region was determined to be 68.67 kJ/mol with an R2 values of 0.9871 by the diffusion model, while the “Ea” of the same region was 117.1 kJ/mol with an R2 value of 0.9963 by the interface reaction model. Therefore, when determining the rate control mechanism of the first and second regions of isothermal reduction, the “Ea” values previously obtained by model-free method (the FWO, KAS, and FR methods were 89.45 kJ/mol, 75.81 kJ/mol, and 60.03 kJ/mol, respectively) were compared with the analysis results of the isothermal model fitting method. Therefore, it is concluded that it may be misleading to decide the model based only on high linear R2 values. For all the reasons mentioned above, the diffusion control model was selected as the most suitable model for the kinetic data of the three-stage area of the sinter reduction process. The results of g(Rs,HT), A, and E are shown in Table 5.
In this paper, the experimental results of the sinter reduction kinetics at high temperature were analyzed and simulated, and the kinetic parameters were estimated. The results show that the rate-limiting step of the reduction reaction of sinter in the high temperature zone is diffusion. This causes the reaction rate of the sinter to slow down with increasing temperature in the high-temperature area, which may affect the high-temperature thermal performance of coke in the coupling reaction between sinter and coke in the blast furnace. This may explain why the severe melting loss of high-activity coke is not observed in the high-temperature softening zone, as the reduction reaction of iron ore affects the reaction rate of high-activity coke, enabling it to maintain a specific strength and smoothly decline in the high-temperature softening zone.

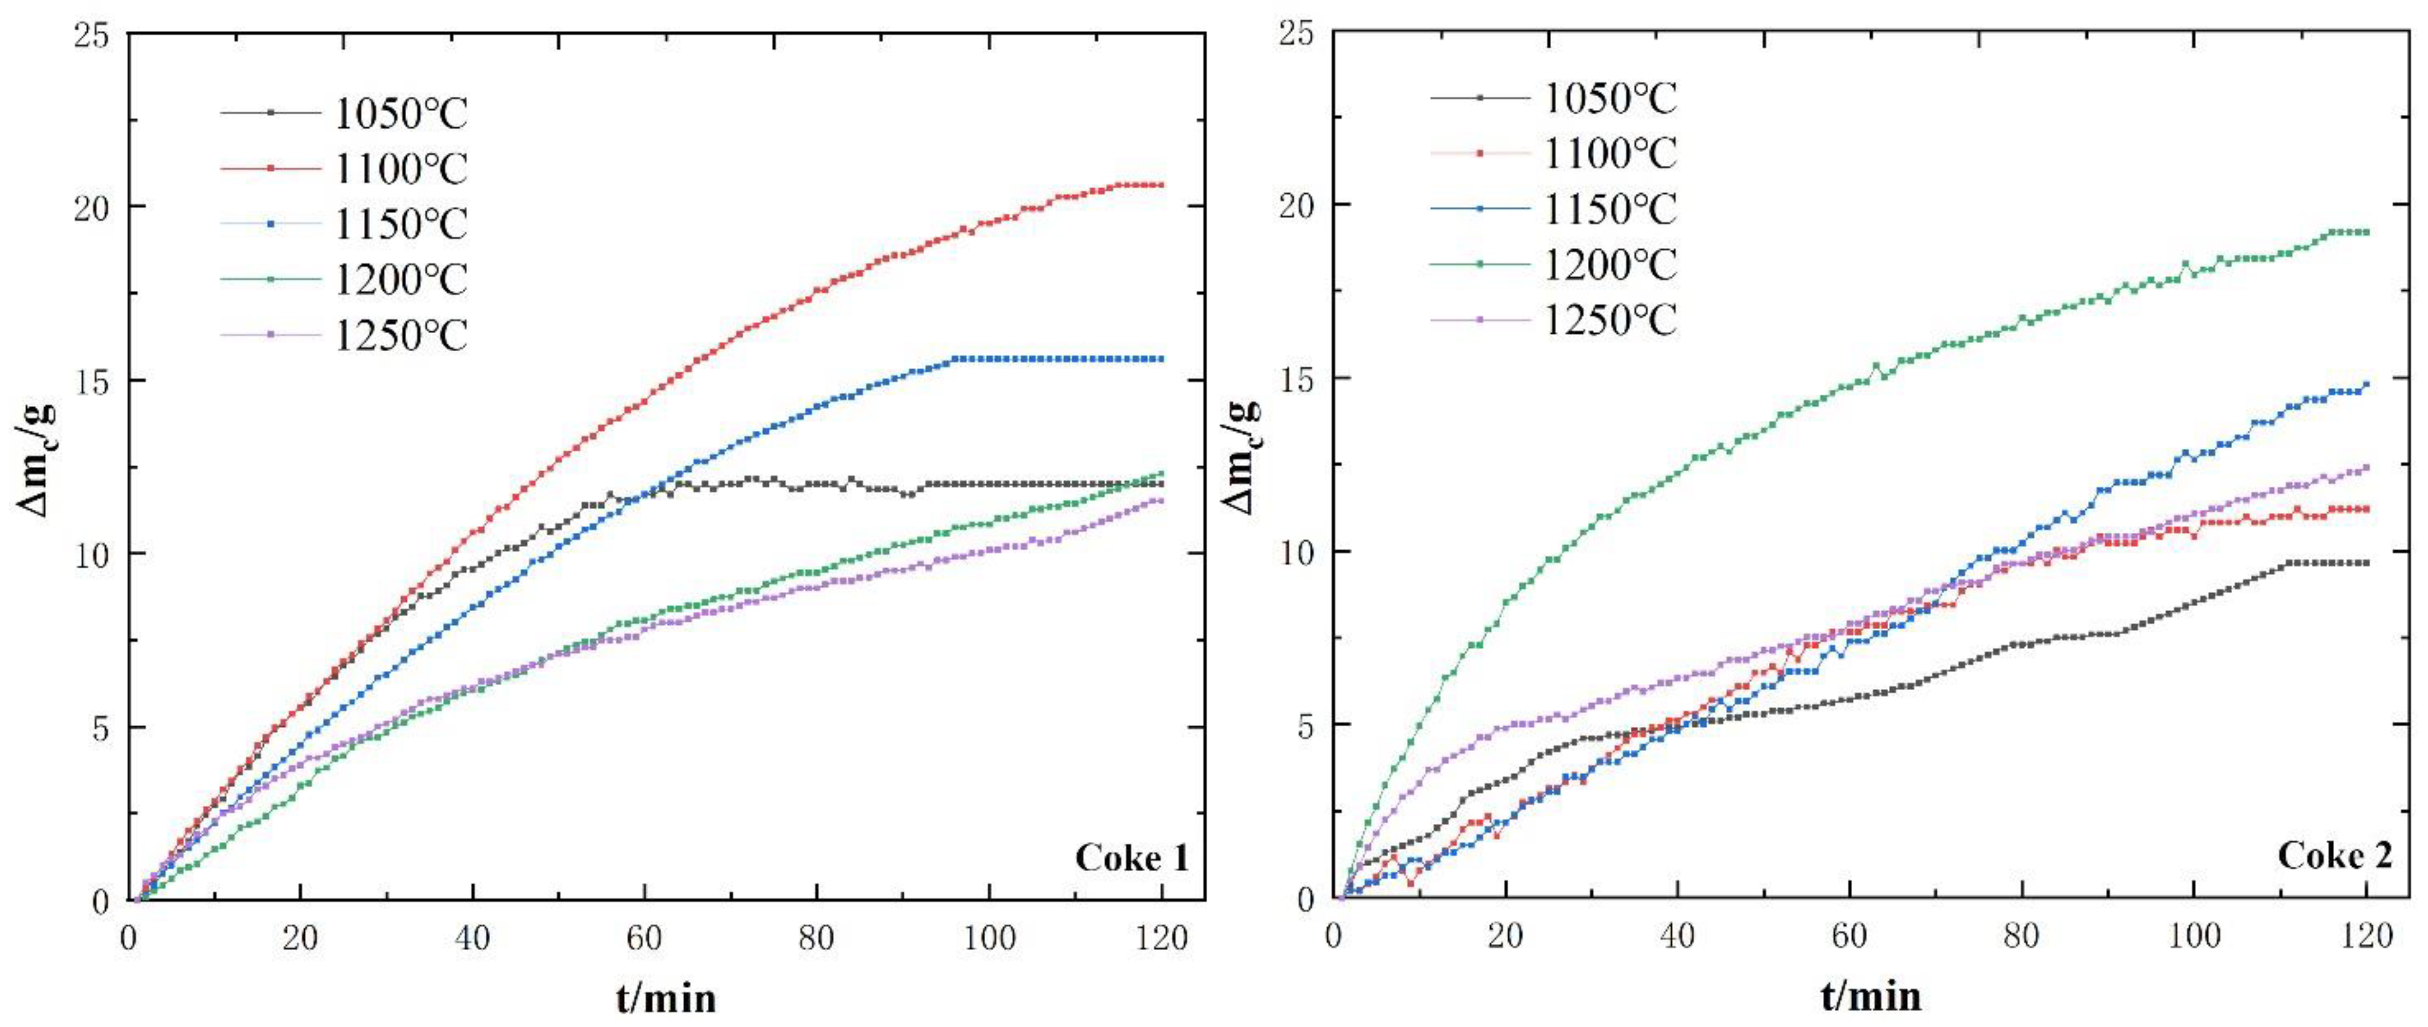
3.2. Behavior and Characteristics of Coke Dissolution Loss

See Figure 7 for the quality change curve of coke during the solution loss reaction and Figure 8 for the solution loss rate and strength after solution loss of the experimental terminal sample. It can be seen from Figure 7 and Figure 8 that, with increasing reduction temperature, the RCSL first increases and then decreases, while the CSCSL decreases first and then increases. It is worth noting that the temperature range corresponding to the maximum value of RCSL or the minimum value of CSCSL increases with decreasing coke reactivity. This value increases from 1100 °C of high reactivity Coke 1 to 1200 °C of low reactivity Coke 2. This shows that sinter reduction has different degradation behaviors and characteristics for high- and low-reactivity coke [26,27,28,29,30].
It can be seen from the dissolution rate measured and sampled at the end of the reduction experiment shown in Table 6 that the dissolution rate measured by the experiment is slightly lower than that of the sampling, but its variation law with increasing temperature is consistent. The study on the dissolution rate of coke measured by the reduction experiment of ore coke samples proves the influence of sinter reduction behavior on the dissolution behavior and characteristics of coke.
In the process of sample reduction, the coke dissolution rate depends on the CO2 rate produced by iron ore reduction and the CO2 reaction rate consumed by coke gasification, that is, the deoxidization rate of iron ore reduction and the carbon dissolution rate of coke. Therefore, the degree of influence of sinter reduction on coke dissolution behavior can be expressed by the ratio of carbon dissolution rate of coke to iron ore reduction rate, which is called the “ore–coke coupling factor” and is calculated by:
η c s = d n c / d t d n o / d t = d m c / d t × 1 12 d m o / d t × 1 16
where ηc~s is the coupling factor of ore and coke; d n c / d t is the coke dissolution rate, mol/min; d n o / d t is the reduction rate of sinter, mol/min; d m c / d t is the weight loss rate of coke dissolution reaction, g/min; d m o / d t is the reduction weight loss rate of sinter, g/min.
ηc~s < 1, which means that the rate of CO2 produced by the reduction of iron ore is greater than the reaction rate between coke and CO2, that is, the reactivity of coke is the limiting link of the reaction rate of dissolution loss; ηc~s = 1, which means that the CO2 rate produced by iron ore reduction is equal to or less than the reaction rate between coke and CO2, that is, iron ore reduction is the limiting link of coke dissolution rate.
As shown in Figure 9 and Table 7, the changes in the coupling factor of coke with respect to temperature shows that with increasing reduction temperature, the rate of coke dissolution increases due to the decreasing high-temperature reduction rate of sinter, from ηc~s < 1 to ηc~s gradually approaching 1, indicating that the rate of coke dissolution gradually changes from a coke reactivity limitation to the high-temperature reduction of sinter. The ηc~s of highly reactive Coke 1 began to approach 1 after the reduction temperature reached 1100 °C, while the ηc~s of low reactive Coke 2 began to approach 1 after the reduction temperature increased to 1200 °C, indicating that the change of coke dissolution rate limiting link was related to coke reactivity, and the higher the reactivity, the lower the transition temperature.
The behavior and characteristics of coke dissolution loss during the high-temperature reduction of sinter are as follows: the rate of coke dissolution loss is within the control range of reactivity coke, and the rate of dissolution loss increases with increasing reduction temperature. When the high-temperature reduction of sinter and the reaction of coke dissolution loss are mixed, the rate of dissolution loss reaches a maximum, and it enters the control range of the high-temperature reduction of sinter, and the rate of dissolution loss decreases with increasing reaction temperature.
It can be seen from the relationship between the strength, CSCSL, of coke after dissolution and the dissolution rate, RCSL, shown in Figure 10, that there is a good linear relationship between the CSCSL and RCSL of Coke 1 and Coke 2. The high-temperature reducibility of sinter decreases with the reaction process and increasing temperature. Most of the data of the two cokes are basically the same. Even if the RCSL of high-reactivity Coke 1 reaches a maximum value of 25.7% at 1100 °C and its CSCSL reaches a minimum value of 68.5%, and the RCSL of low-reactivity Coke 2 reaches a maximum value of 24.0% at 1200 °C and its CSCSL reaches a minimum value of 69.6%, there is little difference between them. This may be why the high-activity Coke 1 still exhibits stability when used in the blast furnace.
The above analysis of the limiting link of the coupling reaction between ore and coke at high temperature and the calculation of the thermal properties of coke are only for the two kinds of coke studied in this paper. Although it cannot represent all kinds of coke, it will provide some useful data and a basis for the later analysis of the detection of the thermal properties of coke. It can be found that under the conditions of the coupling reaction between coke and sinter in the high temperature area, the reaction rate and strength of gasification and dissolution loss of coke will be affected by the change in oxygen concentration provided by the sinter reduction process. There will be a change in the coupling reaction limiting link or limiting action intensity, which will have different effects on the high-temperature thermal performance of coke. This study reveals that the oxygen in the conventional coke thermal performance test comes from carbon dioxide, while the oxygen provided for the actual melting loss reaction of coke in the high-temperature softening zone of the blast furnace comes from the reduction of iron ore, so the low reactivity coke itself is the limiting link, which occupies most of the temperature range of the soft melting zone of blast furnace. It shows that no matter who provides oxygen, it will not affect the reaction process, so there will be no deviation between the conventional test results and the actual of the blast furnace. However, for highly reactive coke, the limiting link is affected by the reduction of iron ore, which occupies most of the temperature range. Therefore, determining whether the amount of oxygen in CO2 routinely detected is consistent with the amount of oxygen provided by iron ore in the blast furnace will affect the results. This leads to a deviation between the conventional test results and the actual conditions of the blast furnace. Therefore, using the data and methods in this experiment to evaluate the high-temperature thermal performance of some special high-reactivity cokes is closer to the actual situation in a blast furnace.

4. Conclusions

In this study, under the conditions of an ore–coke coupling reaction, the influence of the sinter reduction reaction on the degradation behavior and characteristics of different reactive cokes at high temperature was analyzed, which provided a basis for the evaluation and calculation of the thermal properties of coke in the blast furnace in the future. The main conclusions are as follows:
(1)
From the mutual verification and analysis of non-isothermal equal conversion rate method and isothermal fitting model method, it is found that the diffusion step in the sinter reduction reaction is the limiting link in each stage of the high-temperature region. As a result, the reduction rate of sinter in the coupling reaction decreases with increasing temperature, which, in turn, affects the degradation behavior and characteristics of coke.
(2)
In the coupling reaction between high-reactive coke sample and sinter, the most severe dissolution rate, RCSL, is observed near 1100 °C, which is also the lowest point of the CSCSL value after the dissolution of high-reactive coke. However, in the coupling reaction between the low-reactivity coke sample and sinter, the most severe dissolution rate, RCSL, is observed near 1200 °C, which is also the lowest point of the CSCSL value after the dissolution of low-reactivity coke. Sinter reduction has different effects on the degradation of high- and low-reactivity coke.
(3)
In the coupling reaction between sinter and coke, the dissolution rate, RCSL, and the strength, CSCSL, of the two cokes have a good linear relationship at all temperature points and a good correlation with the coupling factor. Between sinter and coke, the temperature range with the best matching degree is the position where the coupling factor is closest to 1. The limiting link of the coupling reaction is obtained from the coupling factor, and the reason why high- and low-reaction coke can maintain their thermal performance in the high-temperature softening zone of a blast furnace due to the reduction behavior of sinter is revealed, so as to obtain a more accurate basis for evaluating and calculating the thermal performance of coke.

Author Contributions

Conceptualization, J.J. and Q.W.; methodology, J.J. and Q.W.; software, J.J.; validation, Q.W.; formal analysis, J.J.; investigation, J.J.; resources, Q.W.; writing—original draft preparation, J.J.; writing—review and editing, Q.W.; supervision, Q.W.; project administration, S.Z. and Q.W.; funding acquisition, S.Z. and Q.W. All authors have read and agreed to the published version of the manuscript.

Funding

This research was funded by the National Natural Science Foundation of China (NSFC, Projects U1361212, 51704149, and 51634004).

Data Availability Statement

Data are contained within the article.

Acknowledgments

The support of the National Natural Science Foundation of China (NSFC, Projects U1361212, 51704149, and 51634004) for the funding of this work is gratefully acknowledged.

Conflicts of Interest

The authors declare no conflict of interest.

References

  1. Liu, D.-J. Relationship between essential characteristic of metallurgical coke and modern blast furnace smelting. Iron Steel 2016, 51, 78. [Google Scholar]
  2. Zhang, S.; Peng, L.; Rui, G.; Pengfei, L.; Yinhua, L. Preparation of high strength and highly reactive coke by the addition of steel slag. Coke Chem. 2014, 57, 391–397. [Google Scholar]
  3. Meng, F.; Shao, L.; Zou, Z. Investigation of the effects of coke reactivity and iron ore reducibility on the gas utilization efficiency of blast Furnace. Energies 2020, 13, 5062. [Google Scholar] [CrossRef]
  4. Rejdak, M.; Bigda, R.; Wojtaszek, M. Use of alternative raw materials in coke-making: New insights in the use of lignites for blast furnace coke production. Energies 2020, 13, 2832. [Google Scholar] [CrossRef]
  5. Naito, M.K.; Takeda, K.; Matsui, Y. Ironmaking technology for the last 100 years: Deployment to advanced technologies from introduction of technological know-how, and Evolution to Next-generation Process. ISIJ Int. 2015, 55, 7–35. [Google Scholar] [CrossRef] [Green Version]
  6. Bao, J.W.; Chu, M.S.; Liu, Z.G.; Han, D.; Cao, L.G.; Guo, J. Research progress on preparation and application of iron coke in blast furnace. Iron Steel 2020, 55, 38–48. [Google Scholar]
  7. Guo, D.Y.; Li, D.T.; Zhang, X.M.; Ma, C.; Dai, X.; Liu, Y. Optical structure and thermal and cold properties of different rank coal coke. Iron Steel 2020, 55, 20–26. [Google Scholar]
  8. Wang, Q. Effect of coke solution loss reaction on iron-making by blast furnace and discussion on high temperature properties of coke. Ansteel Technol. 2013, 1–8. [Google Scholar]
  9. Cheng, A. Coke quality requirements for blast furnaces, Part VIII. Ironmak. Steelmak. 2001, 28, 78–81. [Google Scholar]
  10. Nomura, S.; Ayukawa, H.; Kitaguchi, H.; Tahara, T.; Matsuzaki, S.; Naito, M.; Koizumi, S.; Ogata, Y.; Nakayama, T.; Abe, T. Improvement in blast furnace reaction efficiency through the use of highly reactive calcium rich coke. ISIJ Int. 2005, 45, 316–324. [Google Scholar] [CrossRef] [Green Version]
  11. Nomura, S.; Naito, M.; Yamaguchi, K. Post-reaction strength of catalyst-added highly reactive coke. ISIJ Int. 2007, 47, 831–839. [Google Scholar] [CrossRef] [Green Version]
  12. Wang, Q.; Guo, R.; Zhao, X.F.; Sun, J.F.; Zhang, S.; Liu, W.Z. A new testing and evaluation method of cokes with greatly varied CRI and CSR. Fuel 2016, 182, 879. [Google Scholar] [CrossRef]
  13. Jin, J.; Wang, Q.; Zhang, S. Kinetics and mechanisms of coke and sinter on the coupling reaction to evaluate the integrated effects of coke solution loss reaction on blast furnace processes. Metall. Res. Technol. 2021, 118, 506. [Google Scholar] [CrossRef]
  14. Zamalloa, M.; Utigard, T.A. Characterization of industrial coke structures. ISIJ Int. 1995, 35, 449–457. [Google Scholar] [CrossRef]
  15. Hilding, T.; Gupta, S.; Sahajwalla, V.; Bjoerkman, B.; Wikstroem, J.O. Degradation behaviour of a high CSR coke in an experimental blast furnace: Effect of carbon structure and alkali reactions. ISIJ Int. 2005, 45, 1041–1050. [Google Scholar] [CrossRef] [Green Version]
  16. Rao, Y.K. The kinetics of reduction of hematite by carbon. Metall. Trans. 1971, 2, 1439–1447. [Google Scholar] [CrossRef]
  17. Fruehan, R.J. The rate of reduction of iron oxides by carbon. Metall. Trans. B 1977, 8, 279–286. [Google Scholar] [CrossRef]
  18. Freeman, E.S.; Carroll, B. The application of thermoanalytical techniques to reaction kinetics: The thermogravimetric evaluation of the kinetics of the decomposition of calcium oxalate monohydrate. J. Phys. Chem. 1958, 62, 394–397. [Google Scholar] [CrossRef]
  19. Pineau, A.; Kanari, N.; Gaballah, I. Kinetics of reduction of iron oxides by H2. Thermochim. Acta 2007, 456, 75–88. [Google Scholar] [CrossRef]
  20. Huang, B.H.; Lu, W.K. Kinetics and mechanisms of reactions in iron ore/coal composites. ISIJ Int. 2007, 33, 1055–1061. [Google Scholar] [CrossRef] [Green Version]
  21. Patisson, F.; François, M.G.; Ablitzer†, D. A non-isothermal, non-equimolar transient kinetic model for gas-solid reactions. Chem. Eng. Sci. 2014, 53, 697–708. [Google Scholar] [CrossRef] [Green Version]
  22. Qie, Y.; Lyu, Q.; Jianpeng, L.I.; Lan, C.; Liu, X. Effect of hydrogen addition on reduction kinetics of iron oxides in gas-injection BF. ISIJ Int. 2017, 57, 404–412. [Google Scholar] [CrossRef] [Green Version]
  23. Vyazovkin, S.; Wight, C.A. Isothermal and non-isothermal kinetics of thermally stimulated reactions of solids. Int. Rev. Phys. Chem. 1998, 17, 407–433. [Google Scholar] [CrossRef]
  24. Fott, P.; Straka, P. Effect of pore diffusion on reactivity of lump coke. Fuel 1987, 66, 1287–1288. [Google Scholar] [CrossRef]
  25. Homma, S.; Ogata, S.; Koga, J.; Matsumoto, S. Gas–solid reaction model for a shrinking spherical particle with unreacted shrinking core. Chem. Eng. Sci. 2005, 60, 4971–4980. [Google Scholar] [CrossRef]
  26. The British Carbonization Resarch Association (BCRA). The Evaluation of the Nippon Steel Corporation Reactivity and Postreaction Strength Test for Coke; Carbonization Research Report 91; British Carbonization Research Association: Chesterfield, UK, 1980. [Google Scholar]
  27. Sohn, H.Y.; Szekely, J. A structural model for gas—Solid reactions with a moving boundary—IV. Langmuir—Hinshelwood kinetics. Chem. Eng. Sci. 1972, 27, 763–778. [Google Scholar] [CrossRef]
  28. Maalmi, M.; Strieder, W.C.; Varma, A. Spatiotemporal evolution of conversion and selectivity for simultaneous noncatalytic gas−solid reactions in a compact of particles. Ind. Eng. Chem. Res. 1997, 36, 1470–1479. [Google Scholar] [CrossRef]
  29. Sohn, I.; Fruehan, R.J. The reduction of iron oxides by volatiles in a rotary hearth furnace process: Part II. The reduction of iron oxide/carbon composites. Metall. Mater. Trans. B 2006, 37, 223–229. [Google Scholar] [CrossRef]
  30. Ma, Z.; Bai, J.; Wen, X.; Li, X.; Shi, Y.; Bai, Z.; Kong, L.; Guo, Z.; Yan, J.; Li, W. Mineral transformation in char and its effect on coal char gasification reactivity at high temperatures part 3: Carbon thermal reaction. Energy Fuels 2014, 28, 3066–3073. [Google Scholar] [CrossRef]
Figure 1. Bracing thermogravimetric device of the gas–solid coupling reaction: 1—gas outlet; 2— sealing cap; 3—silicon molybdenum rod (cold end); 4—furnace shell; 5—silicon molybdenum rod (hot end); 6—reaction tube; 7—outer protective tube; 8—coke samples; 9—thermocouple for temperature control; 10—ore samples; 11—high aluminum ball (refractory); 12—thermocouple for temperature measurement; 13—gas entrance; 14—electronic balance; 15—feeder conveyer; 16—rail way; 17—furnace elevator; 18—bottom plate.
Metals 13 00117 g001
Figure 2. Temperature profile of the experiment.
Metals 13 00117 g002
Figure 3. Weight loss curve of sinter during high-temperature reduction after pre-reduction.
Metals 13 00117 g003
Figure 4. High-temperature reduction reaction rate curve of sinter.
Metals 13 00117 g004
Figure 5. Non-isothermal “α vs. T” graphs for iron ore at different heating rates.
Metals 13 00117 g005
Figure 6. (a) FWO, (b) KAS, and (c) FR graphs for non-isothermal reduction of iron ore.
Metals 13 00117 g006
Figure 7. Weight loss curve of coke during the dissolution loss reaction.
Metals 13 00117 g007
Figure 8. RCSL and CSCSL of coke at various temperatures.
Metals 13 00117 g008
Figure 9. Coupling factor curves of coke and sinter.
Metals 13 00117 g009
Figure 10. The linear fitting relationships between RCSL and CSCSL of high- and low-reactivity coke.
Metals 13 00117 g010
Table 1. Composition of the sinter used in this work (wt%).
TFeFeOSiO2CaOMgOR2
56.008.405.2810.101.791.91
Table 2. Characteristics of the coke used in this work (wt%).
Fixed CAshVolatilesSM10M40MtP
coke187.412.850.980.885.781.50.290.033
coke287.1213.981.290.876.281.90.310.035
Table 3. High-temperature reduction degree of sinter, %.
Temperature1050 °C1100 °C1150 °C1200 °C1250 °C
Rs,HT27.723.518.314.011.4
Table 4. Set of alternate reaction models applied to describe the reaction kinetics in heterogeneous solid-state systems.
Reaction ModelSymbolf(α)g(α)
Mampel power lawM14α3/4α1/4
Mampel power lawM23α2/3α1/3
Mampel power lawM32α1/2α1/2
Avrami–ErofeevA14 (1 − α)[−ln(1 − α)]3/4[−ln(1 − α)]1/4
Avrami–ErofeevA23 (1 − α)[−ln(1 − α)]2/3[−ln(1 − α)]1/3
Avrami–ErofeevA32 (1 − α)[−ln(1 − α)]1/2[−ln(1 − α)]1/2
Reaction orderR14 (1 − α)3/41 −(1 − α)1/4
Reaction orderR23 (1 − α)2/31 −(1 − α)1/3
Reaction orderR32 (1 − α)1/2 1 −(1 − α)1/2
One-dimensional diffusionD11/2α−1α2
Ginstling–Brounshtein diffusionD23/2 [(1 − α)1/3 −1]−11 − 2/3α − (1 − α)2/3
Jander diffusionD33/2 (1 − α)2/3 [1 − (1 − α)1/3]−1[1 −(1 − α)1/3]2
Table 5. Kinetic parameters of sinter reduction, %.
g(Rs,HT)E/kJ mol−1A/s−1R2
1st Stage[1 − (1 − α)1/3]245.791.09 × 1060.9858
2nd Stage1 − 2α/3 − (1 − α)2/368.679.3 × 1060.9871
3rd Stageα263.456.9 × 1060.9998
Table 6. Coke dissolution loss rate, %.
T1050 °C1100 °C1150 °C1200 °C1250 °C
RCSLCoke 1experiment152519.515.614.3
sample17.525.42016.515
Coke 2experiment11.81418.52415.5
sample1216202518
Table 7. Influencing factors of average weight loss rate in reaction time at each temperature point, %.
T1050 °C1100 °C1150 °C1200 °C1250 °C
Coke 10.4940.9981.0250.9850.995
Coke 20.4880.5380.8991.0911.098
Disclaimer/Publisher’s Note: The statements, opinions and data contained in all publications are solely those of the individual author(s) and contributor(s) and not of MDPI and/or the editor(s). MDPI and/or the editor(s) disclaim responsibility for any injury to people or property resulting from any ideas, methods, instructions or products referred to in the content.

