Abstract
Laser powder bed fusion (L-PBF) additive manufacturing has reached wide-scale technology readiness for various sectors. However, some challenges posed by the complex nature of the process persist. Limited studies investigated the correlation between the micro- and macroscopic properties of L-PBF AlSi10Mg parts and the features’ sizes with the build orientation in mind. Therefore, this study presents a comprehensive view on the “size effect” for samples larger than those available in the literature (up to 12 mm) on the defects, microstructure evolution, and mechanical properties in two build orientations using a fixed set of process parameters. Microstructural differences were observed between the build orientations, but no considerable difference with size change was detected. The porosity content was inversely proportional to the feature size irrespective of the build orientation, leading to an increase in ductility that was more evident in the horizontal specimens (~44%). This was attributed to an in-situ heat treatment. Although specimens oriented parallel to the build direction showed no significant size-effect in terms of the mechanical properties (hardness and tensile), anisotropy was evident. Based on the findings presented in the study and the scientific explanations discussed corroborated by thermal imaging during processing, it is concluded that although any set of ‘optimised’ process parameters will only be valid for a specific size range, the severity of the size-effect changes dynamically based on the range.
1. Introduction
The AlSi10Mg alloy possesses a rather attractive combination of properties (low density, high strength, and good corrosion resistance) [1]. Good weldability, stemming from the near eutectic Al-Si composition, makes AlSi10Mg a suitable candidate for a broad range of applications [2,3]. As the need for producing more cost-efficient and sustainable vehicles and planes grows, manufacturers, and researchers alike, have been progressively relying on advanced structural designing concepts and simulations, especially for light-weighting [4,5]. Coupled with advanced manufacturing techniques, AlSi10Mg is a strong candidate for producing complex and light industry-ready parts.
Additive Manufacturing (AM) is key for facilitating the production of these complex parts [6,7], thanks to the extended degrees of freedom it offers. In addition to the design freedom [8], AM allows for sustainable production with minimal waste [9,10]. Laser Powder Bed Fusion (L-PBF) is incontrovertibly the most established and widely accepted metal AM process in the industrial context [11]. L-PBF AlSi10Mg parts demonstrate higher strength than their die-cast counterparts [12], thanks to the extremely fine microstructure, supersaturated solid solution, and nano-precipitates [12,13]. Despite all its advantages, L-PBF is yet to promise consistency and repeatability to be promoted for a wider range of industrial applications and certifications. Processability challenges with AlSi10Mg [14] can lead to defects such as, porosity (lack-of fusion, hydrogen, and keyhole). The detrimental impact of these on the mechanical properties is not unknown [15].
There is an abundance in parametric studies, each defining an ‘optimised’ set of process parameters to produce highly dense AlSi10Mg parts [3,16,17]. The literature on the anisotropic behaviour of this material is not scarce either [18,19]. Identifying these optimal parameters as well as studying the microstructure and mechanical properties of the printed parts is typically performed using specimens (dog-bone [3,20,21] or cubic [3,12,22]) of a fixed size. The validity of this ‘optimised’ set of parameters across the length scale has raised several concerns, given the potentially distinctive thermal profile that will be generated in cross-sections of different sizes shall one set of parameters be deployed. Few studies have acknowledged the importance of a feature size on the microstructural and mechanical properties’ variation in L-PBF.
Dong et al. [23] reported that varying the gauge diameter of AlSi10Mg specimens from 5 to 1 mm led to significant variation in porosity with a detrimental effect on strength. Takata et al. [24] manufactured plate-like AlSi10Mg samples with varying widths, reporting a slight variation in microstructure and hardness. This phenomenon has also been reported for other materials. For instance, Demeneghi et al. [25] observed significant changes in mechanical properties and porosity with size variation (0.7–2 mm) for a copper-chromium-niobium alloy. Interestingly, Barba et al. [26] not only studied the size-effect for Ti-6Al-4V (3–0.5 mm), but also considered the coupled effect of the build orientation, which is missing from the AlSi10Mg literature. The influence of the size on the cooling rate and thus the microstructure was evident in that study. For additional literature touching upon the effect of changing feature sizes on the properties the reader is referred to [27,28,29,30,31,32].
Nevertheless, the current literature lacks a systematic study on the “size-effect” or in other words the effect of changing the feature size and its overall impact on the microstructure and properties of AlSi10Mg parts produced by L-PBF with the build orientation’s influence taken into account. The literature in the field has primarily considered the effect of size for features below 5 mm, focusing primarily on the manufacturability of lattices with thin struts. Yet, there is limited focus on understanding the impact of size on the properties of parts with relatively larger features, e.g., in the range of tens of millimetres. Additionally, it is important to understand how the size effect could be simulated outside the research environment where there is minimal or complete absence of the optimization of parameters, where users heavily rely on the parameters provided by Original Equipment Manufacturer (OEM). Moreover, the coupled role of mechanical anisotropy with size variation is worth investigating to expand the knowledge in this domain and move a step further to achieve more reliable and repeatable outcomes from the process.
With the above in mind, this study thoroughly investigates the evolution of relative density, microstructure, and mechanical properties with varying the size and build orientation of cylindrical tensile bars. A fixed ‘optimised’ set of process parameters, recommended by the machine manufacturer, was used to fabricate all parts to simulate the industrial environment where parameters’ optimization might not be necessarily undertaken prior to production. Finally, the experimental methodology was designed to systematically evaluate whether the “size-effect” is process- or material-related.
2. Materials and Methods
2.1. Materials and Manufacturing Methodology
AlSi10Mg powder, supplied by EOS GmbH (Krailling, Germany), was used to manufacture the samples in this study. The powder was mostly spherical with some irregular particles and minimal presence of satellites. It had a particle size distribution of D10, D50, and D90 of 21, 37, and 77 μm, respectively. An EOS M400-4 system (Krailling, Germany) equipped with 400 W Yttrium fibre lasers was used to produce the specimens. The process parameters used for printing are presented in Table 1 while the samples were processed under an atmosphere of nitrogen. The build-plate was maintained at 150 °C throughout the process.

Table 1.
L-PBF process parameters employed to produce the various test specimens in the study.
Standard cylindrical dog-bone specimens were designed and fabricated in two build orientations: vertical (V) and horizontal (H), i.e., parallel and perpendicular to the build direction. The as-built samples were removed from the build-plate using wire electron discharge machining (EDM) and then machined with precision CNC to attain the cylindrical tensile bars of gauge diameters 4, 6, 9, and 12.5 mm, in accordance with ASTM standard E8/E8M [33] (Figure 1). For each test described in the following sections, at least three repeats of every sample were manufactured for statistical confidence in the data collected. Hereon, these samples will be referred to as (H4, H6, H9, and H12.5) and (V4, V6, V9, and V12.5), for the horizontal and vertical samples, respectively.
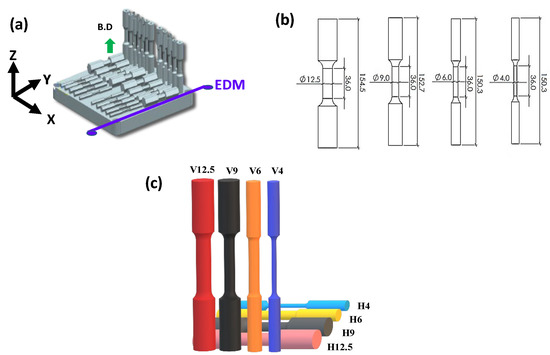
Figure 1.
(a) Build set-up for the specimens in the EOS M-400 machine. (b) Size parameters defined for the samples after machining. All the dimensions are in mm. (c) Naming convention for the samples used in the study. The letter represents the orientation, and the corresponding number represents the gauge diameter of the machined sample.
2.2. Defect Analysis
The relative density of the gauge section of the tensile bars was assessed using X-ray micro-computed tomography (XCT). The scans were performed on a GE Phoenix Nanotom M system (Houston, TX, USA), operating at 120 kV and 230 μA. A pixel size of 4 μm was used, in-line with the common practice in the literature [34,35]. A third-party software, Avizo by Thermo Fisher Scientific Inc. (Avizo 3D 2021.2, Waltham, MA, USA), was used to reconstruct the images of the scanned sections. To allow for better visualization and minimize discrepancies, a sub-volume of 500 px × 500 px × 500 px from the centre of the specimens was analysed qualitatively and quantitatively to assess the porosity content in each sample. A non-local means filter was applied to reduce noise and acquisition artefacts, and then the pores were identified by means of segmentation through thresholding.
2.3. Microstructure Evaluation
The as-built gauge section was cross-sectioned, mounted, and mechanically polished. Metallographic examination was conducted to assess any correlation between the feature size or build orientation and the microstructure. The two extreme sizes (4 and 12.5 mm) of each build orientation were selected for this part of the study. All analyses were performed across the plane perpendicular to the build direction. A Scios 2 DualBeam scanning electron microscope (SEM) (Thermo Fisher Scientific Inc., Waltham, MA, USA), fitted with a C-Nano Electron Backscatter Diffraction (EBSD) detector (Oxford Instruments plc, Abingdon, UK), was used to collect EBSD maps from the polished samples with an operating voltage of 20 kV and a constant step size of 0.23 µm. Aztec Crystal software (version 2.2, Oxford Instruments plc, Abingdon, UK) was used to generate inverse pole figure (IPF) maps and the average equivalent grain diameters. The cross-sections were then etched using Keller’s reagent. An Olympus DSX 100 optical microscope (OM) (Olympus Corporation, Tokyo, Japan) was used to image the melt pools. Additionally, the SEM was used to observe the sub-grain structure.
2.4. Mechanical Properties Investigations
Tensile tests were conducted using an Instron 3982 UTM machine (Instron, Norwood, MA, USA) equipped with a 100 kN load cell and a crosshead speed of 0.5 mm/min, corresponding to a strain rate of 1.8 × 10⁻⁴ s−1. A black and white speckle pattern was applied onto the samples’ surfaces to collect strain data using Digital Image Correlation (DIC) by Correlated Solutions Inc (Irmo, SC, USA), employing multiple 5 MP optical units capturing images at two fps. DIC is proven to be a more reliable strain measurement solution in contrast to traditional extensometers [36,37]. The fracture surfaces were analyzed qualitatively using SEM. Further, they were cross-sectioned and polished perpendicular to the failure plane and imaged using optical microscopy using the Dark Field mode (DF). Micro-indentation Vickers hardness (HV) testing was performed on polished cross-sections from the gauge section using a Wilson VH3100, Buehler (Lake Bluff, IL, USA), with a load of 0.3 kg, dwell time of 10 s, and indent spacing of 0.5 mm. The micro-hardness data, corresponding to an array of indentations across each specimen, was exported as coloured contour maps using the software Origin by OriginLab Corporation (Northampton, MA, USA).
2.5. Thermal Profile Imaging
To better understand the mechanisms behind the changes in the quality and properties of the samples with the feature size, thermal data from AlSi10Mg layers irradiated by the laser beam during L-PBF were collected from rectangular cross-sections with widths corresponding to the extremities of the size range investigated in this study (4 and 12.5 mm). In addition, samples with widths of 2 mm and 25 mm were added to the set to corroborate the conclusions of this study. As such testing capability was not available on the EOS-400-M used in producing the samples in this study, an Aconity MIDI+ system from Aconity 3D GmbH (Herzogenrath, Germany) was used instead. The system is equipped with an off-axis infrared (IR) camera (Infratech GmbH, Dresden, Germany). The IR signal output was recorded with respect to time while scanning the entire layer.
3. Results and Discussion
3.1. The Influence of the Feature Size and Build Orientation on Porosity
AlSi10Mg is highly prone to the formation of defects due to its poor laser absorptivity, high thermal conductivity, and high likelihood for oxidation during melting and solidification [22,38]. Porosity content and its spatial distribution in each representative sample can be seen in Figure 2, as extracted from the digital reconstruction of the XCT scans. As the gauge diameter (i.e., feature size) increased, porosity decreased linearly, for both build orientations. For the horizontal specimens (Figure 2a), increasing the gauge diameter from 4 mm to 12.5 mm reduced porosity by ~70% (0.17% to 0.05%). A similar trend (~60%) was noted in the vertical samples (Figure 2b). Irrespective of the build orientation, the largest specimens (H12.5 and V12.5) had the lowest porosity content (~0.04%). Hence, the process parameters are considered well-suited for features in the order of 12 mm. However, porosity increased significantly (>0.1%) for the smallest samples, indicating unsuitability of this set of parameters.
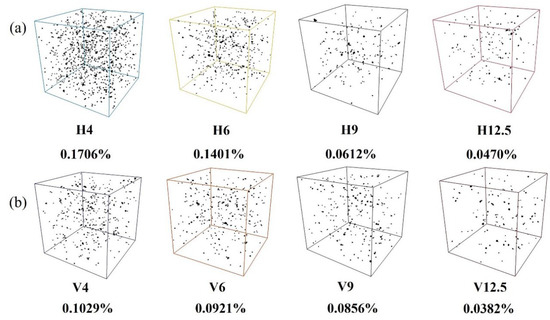
Figure 2.
XCT reconstructions (500 px × 500 px × 500 px) and void density of the samples manufactured in (a) horizontal and (b) vertical orientations.
It is important to note that although XCT may not be the best technology for capturing all the small metallurgical pores, especially given the common practice of using a relatively large voxel size of 4 µm, it is indeed powerful in terms of providing both quantitative and qualitive analysis of the defects present in the sample under investigation. For instance, with the decrease in the sample size, an increase in the relative frequency of the small spherical pores (<tens of microns) was observed (Figure 3). Small spherical pores are often attributed to either hydrogen or keyhole porosity. The former is associated with the entrapped gas within the melt pool, mostly hydrogen originating from moisture on the powder [14]. The latter on the other hand forms because of the melt pool instability with excessive energy inputs, i.e., is process-related. It increased for smaller samples due to the shorter scan vectors, resulting in local regions with relatively higher energy inputs. As the scanning area becomes smaller, the laser beam following a scan vector will come back relatively quickly to the initial point of the preceding vector while being irradiated across a layer through the dictated overlap amount. This, combined with the higher cooling rates associated with a smaller surface area, is envisaged to have exaggerated gas entrapment while providing less time before solidification, leading to insufficient outgassing [39].
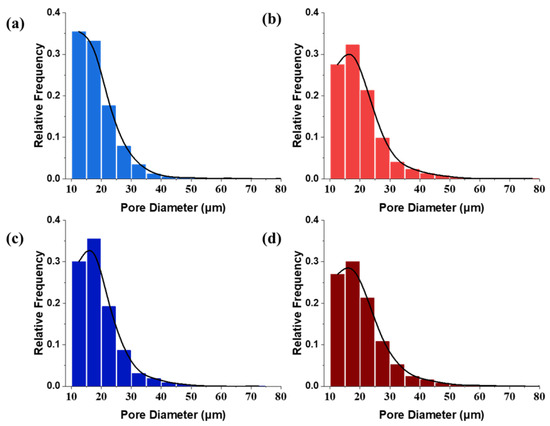
Figure 3.
Graphs representing the pore diameters vs. relative frequency for the L-PBF specimens (a) H4 (b) H12.5 (c) V4 and (d) V12.5.
As for the larger pores, known as lack-of-fusion pores, they increased for smaller samples. This held for both horizontal and vertical specimens. These process-induced defects in the 4 mm samples (H4 and V4) can be attributed to the temperature distribution intrinsic to the process. As the size of the cross-sectional area scanned in a layer decreases, having fewer scan tracks with the fixed scan speed used for larger samples, can lead to an unstable melt flow. The unstable flow of molten material within the scan track then promotes the formation of more process-induced defects with tracks and layers’ accumulation.
Coupling in the influence of the build orientation, it was noticed that porosity was marginally higher in the horizontal samples. This is due to the faster heat dissipation via higher cooling and solidification rates. The faster heat dissipation stems from the fact that the orientation of these samples means that they are in close proximity to the heated build plate, which is kept at an elevated temperature specifically to act as a heat sink. As the printing process progresses and the z-height increases, the layer being irradiated by the laser beam is further away from this heat sink. Therefore, for the gauge section of the vertical samples, heat dissipation was slower. In addition, remaining on the heated build plate for longer than the vertical samples until the printing process was completed, the horizontal ones experience in-situ heat treatment, which encourages the diffusion of hydrogen to increase or enlarge the gas pores.
The literature on features smaller than 5 mm claim that there is a limited size window that can be produced with minimal porosity for a given set of parameters, irrespective of the material used [23,31]. The study on hand corroborates these claims for defect analysis and further extrapolates the dataset to show that this hypothesis holds true even for larger features.
3.2. The Influence of the Feature Size Variation on the Microstructure
When processed by L-PBF, AlSi10Mg exhibits a fine microstructure with metastable phases due to the extremely high cooling rates (~105–106 K/s) intrinsic to the manufacturing process [40,41,42]. This is demonstrated in Figure 4a,d, where the isometric construction of the microstructure in the vertical and horizontal samples is presented, respectively. The characteristic fish-scale-like microstructure of overlapping melt pools can be clearly seen with the well-established hierarchy of melt pool cores, boundaries, and heat affected zones. Higher magnification images of the melt pool cores, as viewed perpendicular and parallel to the build direction, are also provided (Figure 4). Along the build direction, the melt pool core shows the typical sub-grain columnar microstructure with the α-Al matrix (dark regions) surrounded by the network of Si particles (bright regions), exhibiting a fibrous eutectic texture. The equiaxed cellular morphology was observed in the cross-section perpendicular to the build direction. Although this microstructure is well-established in the literature [20,42,43], its change with the size-orientation interrelationship due to the difference in the thermal profile created by laser irradiation in production is the new angle of this work.
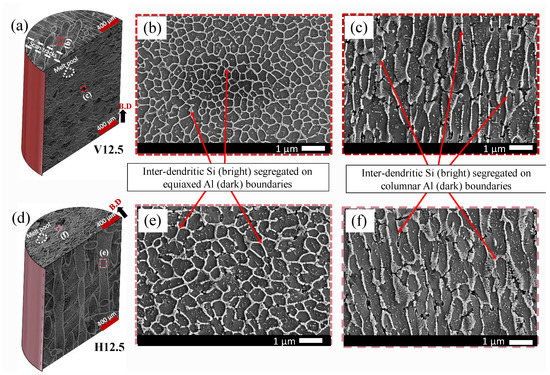
Figure 4.
(a,d) Melt pool characteristics in the planes perpendicular and parallel to the build directions in samples V12.5 and H12.5, respectively. (b,c,e,f) High magnification SEM images showing the cells’ structure in the directions perpendicular and parallel to the build direction for (b,c) V12.5 and (e,f) H12.5 samples. (B.D = build direction).
Some variability in the microstructure depending on the build orientation was detected with comparing the 12.5 mm samples (Figure 4). Perpendicular to the build direction, the vertical samples showed the distinctive α-Al matrix with a continuous eutectic Si network (Figure 4b) which was discontinuous in the case of the horizontal specimen (Figure 4e). Additionally, the horizontal samples had relatively slightly coarser cells. The reason behind this difference can be attributed to the fact that these samples remained on the heated platform for longer, i.e., until the manufacture of the full height of the vertical samples was completed. It is envisaged that the elevated temperature of the build plate led to an in-situ heat treatment that stimulated some decomposition of the inter-dendritic Si and its diffusion within the α-Al matrix, thereby disrupting the eutectic Si network [44,45].
The effect of varying the sample size for a fixed orientation on the microstructure (i.e., H4 vs. H12.5, and V4 vs. V12.5) can be seen in Figure 5a–d. No significant difference was observed in the morphology or size of the Al cells. Interestingly, for smaller samples (<5 mm) in the literature [23] a variability in the average cell size (0.75 to 1.75 μm) and coarseness was reported with the increase in feature size from 1 mm to 5 mm, respectively. In Takata et al. [24], however, there was no discernible effect for the size (>5 mm) on the microstructure. This was further supported by the quantitative assessment of the grain size from the IPF maps of the EBSD scans on the plane perpendicular to the build direction in our study, as shown in Figure 5e–h. The maps cover multiple melt pools within the cross-section, typically revealing more refined equiaxed grains along the melt pool boundaries, in agreement with the literature [46]. The variation in cell sizes within the melt pool, represented by the corresponding IPF maps, was also evident by the standard deviation reported with the average grain size. No significant correlation was observed between the grain size and the sample size. Furthermore, there was no evidence of crystallographic texture variation with size. The formation of the sub-grain cellular structure, evaluated qualitatively using electron microscopy (Figure 5a–d) and quantitively through the average grain diameters from the IPF maps (Figure 5e–h), did not change with the size of the specimen. Based on these results, it was concluded that the “size-effect” was not significant enough to alter the microstructure in the size range investigated in this study.
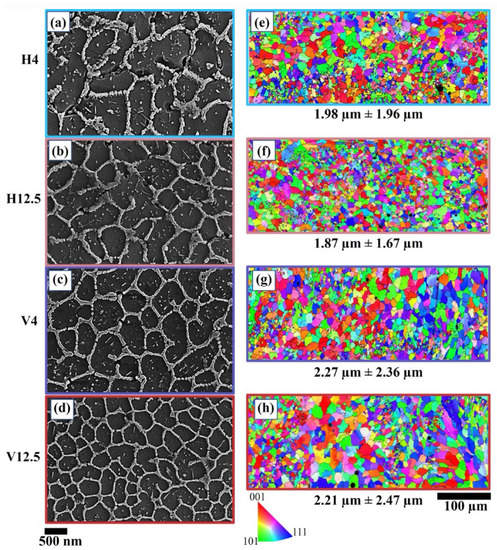
Figure 5.
High magnification SEM images illustrating the characteristic cellular structure of L-PBF AlSi10Mg in the cross-sections perpendicular to the build direction for (a) H4, (b) H12.5, (c) V4 and (d) V12.5. (e–h) IPF maps extracted from the EBSD scans on the cross-sections perpendicular to the build orientation of the corresponding samples. The average eq. spherical diameter of the grains is presented under the respective IPF maps for all the samples under consideration.
From the perspective of the build orientation’s effect, grains’ mean equivalent diameter in the horizontal specimens was marginally lower than that in the vertical ones (Figure 5e–h). This can also be due to the overall high heat dissipation and cooling rates experienced by the former, as described in Section 3.1.
3.3. The Influence of the Feature Size and Build Orientation on the Mechanical Properties
The colour contour maps corresponding to the hardness profile across the cross-section of the gauge section (the plane perpendicular to the direction of loading in the tensile tests), can be found in Figure 6. No significant change in micro-hardness with size was detected. The micro-hardness of the vertical specimens was in the range of 135–138 HV, while the horizontal samples were relatively softer (125–127 HV). This softness is attributed to the subtle in-situ heat treatment and its impact on the material’s microstructure. With the higher effective build plate temperature for horizontally placed samples slight decomposition of the inter-dendritic Si occurs along with diffusion within the α-Al matrix. This in turn affects the hardness of the material [44,45]. Hardness is a property that is local to the indented area, and in the case of L-PBF materials, it is heavily influenced by the cooling rate fluctuations throughout the build and hence by the microstructural variations that eventually follow [47,48]. The hardness maps corresponding to the vertical specimens in Figure 6b denote such rapid spatial fluctuations in hardness within each sample. On the other hand, the horizontal specimens showed a more uniform hardness profile, due to the in-situ thermal treatment experience.
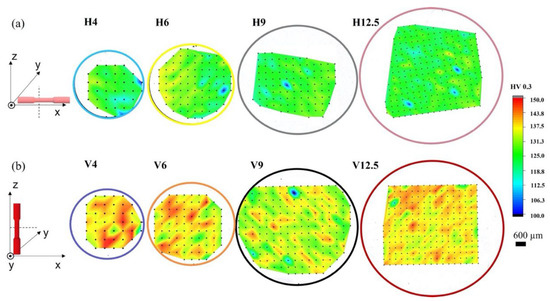
Figure 6.
Colour contour maps representing Vickers micro-hardness (HV) values of the cross-sections (planes perpendicular to the tensile loading direction) of the specimens with various size parameters, oriented (a) Horizontally and (b) Vertically in the AM build. Black marks represent the indents on the respective samples.
In general, the micro-hardness of all tested specimens surpassed that of the cast counterparts (64–75 HV) [19,49]. This agrees with data documented in the literature and is attributed to the refined microstructure due to the very high cooling rates (105–106 K/s) encountered during fabrication [19,50]. The strengthening mechanisms involved in case of the L-PBF material include grain boundary strengthening, solid solution strengthening, and dislocation strengthening [42].
The tensile properties of the samples tested in this study, including yield strength (YS), ultimate tensile strength (UTS), and elongation are listed in Table 2. With the change in the effective gauge diameter of the horizontal specimens from 12.5 mm to 4 mm, a decline of 37 MPa (~9%) in UTS and 21 MPa (~8%) in YS was observed. However, the impact on elongation was more remarkable, witnessing a drop of ~30%. It was observed that the majority of the H4 samples failed pre-maturely. This can be attributed to them having the highest porosity content (~0.17%), which eventually led to the increased scatter in their elongation data. Nonetheless, the ductility exhibited a linear trend, similar to that of the porosity content, decreasing with the sample size. Elongation in L-PBF samples is strongly correlated to the presence of defects [15]. The fracture mechanism changes with the increase in defects as these pores act as nucleation sites for crack initiation due to tension, leading to low ductility. Although the other properties followed a similar trend, they were not impacted as significantly, showing a weaker correlation.

Table 2.
Elongation, Ultimate tensile strength, and Yield strength values of horizontally and vertically built tensile samples.
The vertical specimens, for which the loading direction was parallel to the build direction, had lower YS and higher UTS in combination with considerably poor elongation when compared with the corresponding horizontal samples. This anisotropy is attributed to the “peculiar crystal orientation” [51] of the elongated grains that grow in a preferential direction based on the thermal gradient intrinsic to the process. Moreover, in the case of the vertical build orientation, the layers are stacked along the loading direction, hence presenting as slipping surfaces during deformation leading to lower ductility [52]. Furthermore, comparing the two ends of the size spectrum in the vertical samples, a more subtle variation in the mechanical properties was noted in contrast to the horizontal specimens. Only the elongation showed a statistically significant difference. Elongation dropped by ~12% and UTS by ~4%, while no considerable drop was observed in the mean values of the YS. None of the mechanical properties varied significantly for the medium-range samples (V6 and V9). Therefore, the influence of the feature size on the tensile properties of the vertically built specimens was concurred as less significant.
As noted earlier, the variation in ductility in the horizontal specimens was correlated to the density variation with size. However, the vertical samples did not present a similar trend. This can be attributed to the overall lower elongation values yielded by the samples printed in this orientation, i.e., the variation in the tensile properties due to anisotropy overshadowed the size effect. Such an impact of the feature size with respect to the build orientation during fabrication has not been reported before for AlSi10Mg. A coupled impact of feature size and build orientation has been reported for samples smaller than 5 mm in Ti-6Al-4V [26]. However, in that case the variation in microstructure and thus mechanical performance was attributed to the hatching-to-contour-scanning ratio changes as the feature size varied in net-shape specimens. This effect was eliminated in the current study as the samples were machined, which is a common industrial practice. It is important to note that comparing our findings for the larger size range with the data documented in the literature for the smaller size ranges [23] to understand the impact of features’ sizes on a wider range of dimensions, it was deduced that a more pronounced degradation in properties is evident in features below 5 mm. This indicates that the assertations in the literature in this regard cannot be fully extrapolated to larger samples. If the influence started to slightly subside in the size range tested in this study, then it is envisaged that it could potentially diminish or become insignificant for even larger samples.
Findings from the tensile tests were supplemented with fractography analysis. The horizontal samples (e.g., H4 and H12.5) failed in two distinctive modes, as per Figure 7a,e, respectively. The fracture plane in the 4 mm specimen was flat and perpendicular to the loading direction (i.e., parallel to the build direction). Conversely, the fracture plane for the 12.5 mm sample was inclined to the specimen’s longitudinal axis by 45°, indicating failure primarily through plastic flow in the direction of the maximum shear stress [52]. This discrepancy was further visualized by the cross-sectional views of the corresponding fracture surfaces in Figure 7b,f, showing the distinctive orientation of the crack propagation path with respect to the melt pools. The insets in Figure 7b,f reveal the microstructural features identifiable along the boundaries of the fracture surfaces. Regardless of the sample size, the crack propagated by shearing through the cores of the melt pools (Figure 7b) and scan tracks (Figure 7f). Although the topography of the fracture surfaces observed by OM did not reveal significant differences between H4 and H12.5, high magnification SEM images indicated a higher presence of shallow pores in H4 (Figure 7c,d,g,h). This observation is in-line with the XCT results, where porosity showed an inverse relationship with the gauge diameter.
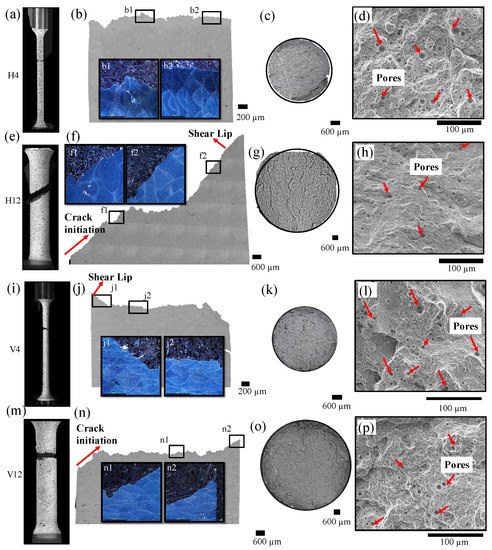
Figure 7.
Overview of the fractography investigation conducted on the horizontally built tensile specimens with a diameter of (a–d) 4 mm and (e–h) 12 mm. (a,e) Location of failure in the tested tensile samples; (b,f) bright-field OM images of the specimens’ cross-section perpendicular to the failure plane with dark-field OM insets showing the arrangement of the scan tracks/melt pools along the fracture surface boundary; (c,g) OM and (d,h) SEM micrographs of the corresponding fracture surfaces. Overview of the fractography investigation conducted on the vertically built tensile specimens with a diameter of (i–l) 4 mm and (m–p) 12 mm.
Contrarily, the corresponding vertical samples in Figure 7i–p exhibited flat failure planes that were perpendicular to the loading direction, indicating a more brittle failure manner. Fracture steps with sharp edges inclined by 45° to the direction of the maximum tensile stress were observed in the cross-sectional views of the fracture surfaces. These edges, also known as ‘shear lips’ [53], form in the last phase of failure due to the rapid change in the direction of the crack propagation front. Furthermore, the insets in Figure 7j,n show that failure primarily occurred following preferential pathways at the melt pool boundaries. No significant differences compared to the corresponding surfaces of the horizontal samples were noted. Fine dimples were identified on all the fracture surfaces, indicating the material’s intrinsic ductile nature. Some porosities were also detected across the fracture surfaces. Overall, the findings from the fractography analysis were in-line with the variations noted in the porosity, microstructure, and mechanical properties of the samples due to the build orientation and size of the respective samples.
3.4. The Correlation between the Size of the Irradiated Cross-Sectional Area and the Thermal Profile Generated
The evolution of the thermal profile during L-PBF with the change in the feature size is presented in Figure 8. This heat map was obtained using the IRBIS 3.1 software (Infratech GmbH, Dresden, Germany) after sequentially processing the thermographic data using the maximum IR signal value obtained for every pixel in each recorded frame (Figure 8a). Even with the constant laser parameters used throughout, the heat map clearly shows the different thermal profile experienced by each cross-section/size. Figure 8b, similarly, reveals that the scanning time of each layer decreased with size, but interestingly, the maximum value of the IR signal consistently increased. This qualitative analysis with a lab-scale AM system equipped with a process monitoring set-up provides further evidence for the importance of correlating the feature size to the process parameters employed during manufacture. For instance, it was quite noticeable in the heat maps and the IR signal value plot that the thermal profiles for samples of 4 mm width or below were comparable, i.e., showing a plateau. On the other hand, a significantly cooler thermal imprint was observed for specimens of 12.5 mm width or larger. These novel findings compliment the results presented in this paper to assert that as the range of feature size shifts towards larger specimens as in the current study, the impact of size variation in L-PBF parts could almost flatten, showing a relatively less significant effect on the mechanical properties.
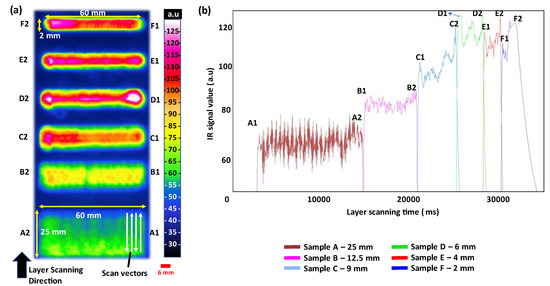
Figure 8.
(a) Heat map representing the maximum value of each pixel of the thermal image in the selected region of interest. The rectangular cross-sections with fixed length (60 mm) and varying widths (25 mm, 12.5 mm, 4 mm and 2 mm) were scanned sequentially by the laser in a single layer. (b) IR-signal-time-plots with different line colours indicating the samples with varying widths. The data are clipped at 130 a.u. because of the limitation of the blackbody calibration range chosen. The time stamp starts at the beginning of capturing the signal (t = 0) and not at the beginning of laser scanning.
4. Conclusions
This study thoroughly investigated the combined effects of the feature size and build orientation on defect formation, microstructure evolution, and mechanical properties of AlSi10Mg bulk parts manufactured by L-PBF. The study focused on a size range (4–12.5 mm) that has not been previously investigated in the literature. The following was concluded:
- For a particular set of process parameters only a certain features’ size range can be manufactured with acceptable density. Porosity content decreased by 70% and 60% when increasing the sample size from 4 mm to 12.5 mm for horizontal and vertical samples, respectively. Anisotropic behaviour was evident as horizontal samples had more defects because of the faster cooling and solidification rates.
- The metallurgy of the material was not affected by the features’ sizes as all samples exhibited the same microstructure.
- The micro-hardness did not change significantly with size. However, the horizontal samples were generally softer (125–127 HV) as compared to vertical samples (135–138 HV). A more uniform hardness profiles were also observed in horizontal samples due to the in-situ heat treatment resulting from the high surface in contact with the heated build plate for an extended duration.
- In terms of the tensile properties, ductility was affected the most by the orientation and size. Smaller horizontal samples presented less ductile behaviour due to defects (4 mm sample—5.3 ± 0.5%). In vertical samples, the overall anisotropic tensile properties overshadowed the “size-effect”.
- It was confirmed that the size effect is much more significant for small feature sizes, such as features < 6 mm, than the feature sizes investigated in this manuscript.
Researchers in the industry put immense efforts in defining the process parameters for a material’s optimum processability. However, as the findings from this study have shown, complimenting existing studies in the literature, the applicability of process maps at an industrial scale is incomplete without taking the “size-effect” into account. The size-effect holds true for large features and the impact of well-studied anisotropic behaviour in AlSi10Mg L-PBF parts varies with the change in size. Experimental and modelling studies on size-effect with a more comprehensive range of sizes and various L-PBF alloys are crucial to extend the knowledge in the domain and move a step further to achieving more reliable and repeatable outcomes from the process. This highlights the need for in-process active changes in parameters with features’ sizes if the full potential of L-PBF in design freedom is to be exploited.
Author Contributions
Conceptualization, N.T.A.; methodology, C.P., F.B. and N.A.; software, A.A., C.P., F.B. and L.K.; validation, F.B. and N.T.A.; formal analysis, C.P.; investigation, A.A, C.P., F.B., L.K. and N.A.; resources, N.T.A.; data curation, A.A., C.P., F.B. and N.A.; writing—original draft preparation, C.P.; writing—review and editing, N.T.A.; supervision, N.T.A.; project administration, N.T.A. All authors have read and agreed to the published version of the manuscript.
Funding
This research received no external funding, and the APC was funded by Technology Innovation Institute, Abu Dhabi, United Arab Emirates.
Data Availability Statement
The data used to support the findings of this study are available from the corresponding author upon request.
Acknowledgments
This work was supported by the Advanced Technology Research Council (ATRC) in Abu Dhabi, UAE. The authors thank Rafael Santiago and Henrique Ramos (Technology Innovation Institute, UAE) for their support with the tensile testing experiments. The authors want to acknowledge Pradeep George (Khalifa University, UAE) and Jide Oyebanji (Technology Innovation Institute, UAE) for their assistance with XCT scanning and software trainings for XCT reconstructions. Finally, the support provided by Sundharamoorthy Venugopal and Sai Nimmaggada (Khalifa University, UAE) for EDM and CNC machining jobs is highly appreciated. The authors want to thank the Advanced Technology Research Council (ATRC) in Abu Dhabi.
Conflicts of Interest
The authors declare no conflict of interest.
References
- Hatch, J.E. Aluminum : Properties and Physical Metallurgy; Hatch, J.E., Ed.; ASM International: Novelty, OH, USA, 1984; ISBN 978-0-87170-176-3. [Google Scholar]
- Li, W.; Li, S.; Liu, J.; Zhang, A.; Zhou, Y.; Wei, Q.; Yan, C.; Shi, Y. Effect of heat treatment on AlSi10Mg alloy fabricated by selective laser melting: Microstructure evolution, mechanical properties and fracture mechanism. Mater. Sci. Eng. A 2016, 663, 116–125. [Google Scholar] [CrossRef]
- Read, N.; Wang, W.; Essa, K.; Attallah, M.M. Selective laser melting of AlSi10Mg alloy: Process optimisation and mechanical properties development. Mater. Des. 2015, 65, 417–424. [Google Scholar] [CrossRef]
- European Commission. ALIVE (Advanced High Volume Affordable Lightweighting for Future Electric Vehicles), CORDIS; European Commission: Wolfsburg, Germany, 2016. [Google Scholar]
- Zhu, L.; Li, N.; Childs, P.R.N. Light-weighting in aerospace component and system design. Propuls. Power Res. 2018, 7, 103–119. [Google Scholar] [CrossRef]
- Plocher, J.; Panesar, A. Review on design and structural optimisation in additive manufacturing: Towards next-generation lightweight structures. Mater. Des. 2019, 183, 108164. [Google Scholar] [CrossRef]
- Emmelmann, C.; Sander, P.; Kranz, J.; Wycisk, E. Laser additive manufacturing and bionics: Redefining lightweight design. Phys. Procedia 2011, 12, 364–368. [Google Scholar] [CrossRef]
- Gibson, I.; Rosen, D.; Stucker, B.; Khorasani, M. Additive Manufacturing Technologies; Springer: Cham, Switzerland, 2021. [Google Scholar] [CrossRef]
- Pereira, T.; Kennedy, J.V.; Potgieter, J. A comparison of traditional manufacturing vs additive manufacturing, the best method for the job. Procedia Manuf. 2019, 30, 11–18. [Google Scholar] [CrossRef]
- Gebler, M.; Schoot Uiterkamp, A.J.M.; Visser, C. A global sustainability perspective on 3D printing technologies. Energy Policy 2014, 74, 158–167. [Google Scholar] [CrossRef]
- Campbell, I.; Diegel, O.; Kowen, J.; Mostow, N. Terry Wohlers Wohlers Report 2020—3D Printing and Additive Manufacturing : Global State of the Industry; Wohlers Associates: Fort Collins, CO, USA, 2020. [Google Scholar]
- Girelli, L.; Tocci, M.; Gelfi, M.; Pola, A. Study of heat treatment parameters for additively manufactured AlSi10Mg in comparison with corresponding cast alloy. Mater. Sci. Eng. A 2019, 739, 317–328. [Google Scholar] [CrossRef]
- Chen, B.; Moon, S.K.; Yao, X.; Bi, G.; Shen, J.; Umeda, J.; Kondoh, K. Strength and strain hardening of a selective laser melted AlSi10Mg alloy. Scr. Mater. 2017, 141, 45–49. [Google Scholar] [CrossRef]
- Zhang, J.; Song, B.; Wei, Q.; Bourell, D.; Shi, Y. A review of selective laser melting of aluminum alloys: Processing, microstructure, property and developing trends. J. Mater. Sci. Technol. 2019, 35, 270–284. [Google Scholar] [CrossRef]
- Laursen, C.M.; DeJong, S.A.; Dickens, S.M.; Exil, A.N.; Susan, D.F.; Carroll, J.D. Relationship between ductility and the porosity of additively manufactured AlSi10Mg. Mater. Sci. Eng. A 2020, 795, 139922. [Google Scholar] [CrossRef]
- Hyer, H.; Zhou, L.; Park, S.; Gottsfritz, G.; Benson, G.; Tolentino, B.; McWilliams, B.; Cho, K.; Sohn, Y. Understanding the Laser Powder Bed Fusion of AlSi10Mg Alloy. Metallogr. Microstruct. Anal. 2020, 9, 484–502. [Google Scholar] [CrossRef]
- Buchbinder, D.; Schleifenbaum, H.; Heidrich, S.; Meiners, W.; Bültmann, J. High power selective laser melting (HP SLM) of Aluminum parts. Phys. Procedia 2011, 12, 271–278. [Google Scholar] [CrossRef]
- Nezhadfar, P.D.; Thompson, S.; Saharan, A.; Phan, N.; Shamsaei, N. Structural integrity of additively manufactured aluminum alloys: Effects of build orientation on microstructure, porosity, and fatigue behavior. Addit. Manuf. 2021, 47, 102292. [Google Scholar] [CrossRef]
- Yusuf, S.M.; Hoegden, M.; Gao, N. Effect of sample orientation on the microstructure and microhardness of additively manufactured AlSi10Mg processed by high-pressure torsion. Int. J. Adv. Manuf. Technol. 2020, 106, 4321–4337. [Google Scholar] [CrossRef]
- Chen, J.; Hou, W.; Wang, X.; Chu, S.; Yang, Z. Microstructure, porosity and mechanical properties of selective laser melted AlSi10Mg. Chin. J. Aeronaut. 2020, 33, 2043–2054. [Google Scholar] [CrossRef]
- Aboulkhair, N.T.; Maskery, I.; Tuck, C.; Ashcroft, I.; Everitt, N.M. The microstructure and mechanical properties of selectively laser melted AlSi10Mg: The effect of a conventional T6-like heat treatment. Mater. Sci. Eng. A 2016, 667, 139–146. [Google Scholar] [CrossRef]
- Louvis, E.; Fox, P.; Sutcliffe, C.J. Selective laser melting of Aluminium components. J. Mater. Process. Technol. 2011, 211, 275–284. [Google Scholar] [CrossRef]
- Dong, Z.; Zhang, X.; Shi, W.; Zhou, H.; Lei, H.; Liang, J. Study of size effect on microstructure and mechanical properties of AlSi10Mg samples made by selective laser melting. Materials 2018, 11, 2463. [Google Scholar] [CrossRef]
- Takata, N.; Kodaira, H.; Suzuki, A.; Kobashi, M. Size dependence of microstructure of AlSi10Mg alloy fabricated by selective laser melting. Mater. Charact. 2018, 143, 18–26. [Google Scholar] [CrossRef]
- Demeneghi, G.; Barnes, B.; Gradl, P.; Mayeur, J.R.; Hazeli, K. Size effects on microstructure and mechanical properties of additively manufactured copper–chromium–niobium alloy. Mater. Sci. Eng. A 2021, 820, 141511. [Google Scholar] [CrossRef]
- Barba, D.; Alabort, C.; Tang, Y.T.; Viscasillas, M.J.; Reed, R.C.; Alabort, E. On the size and orientation effect in additive manufactured Ti-6Al-4V. Mater. Des. 2020, 186, 108235. [Google Scholar] [CrossRef]
- Koutny, D.; Palousek, D.; Pantelejev, L.; Hoeller, C.; Pichler, R.; Tesicky, L.; Kaiser, J. Influence of scanning strategies on processing of aluminum alloy EN AW 2618 using selective laser melting. Materials 2018, 11, 298. [Google Scholar] [CrossRef]
- Zhao, X.; Li, S.; Zhang, M.; Liu, Y.; Sercombe, T.B.; Wang, S.; Hao, Y.; Yang, R.; Murr, L.E. Comparison of the microstructures and mechanical properties of Ti–6Al–4V fabricated by selective laser melting and electron beam melting. Mater. Des. 2016, 95, 21–31. [Google Scholar] [CrossRef]
- Tancogne-Dejean, T.; Spierings, A.B.; Mohr, D. Additively-manufactured metallic micro-lattice materials for high specific energy absorption under static and dynamic loading. Acta Mater. 2016, 116, 14–28. [Google Scholar] [CrossRef]
- Sombatmai, A.; Uthaisangsuk, V.; Wongwises, S.; Promoppatum, P. Multiscale investigation of the influence of geometrical imperfections, porosity, and size-dependent features on mechanical behavior of additively manufactured Ti-6Al-4V lattice struts. Mater. Des. 2021, 209, 109985. [Google Scholar] [CrossRef]
- Phutela, C.; Aboulkhair, N.T.; Tuck, C.J.; Ashcroft, I. The effects of feature sizes in selectively laser melted Ti-6Al-4V parts on the validity of optimised process parameters. Materials 2019, 13, 117. [Google Scholar] [CrossRef] [PubMed]
- Paul, P.P.; Paranjape, H.M.; Amin-Ahmadi, B.; Stebner, A.P.; Dunand, D.C.; Brinson, L.C. Effect of machined feature size relative to the microstructural size on the superelastic performance in polycrystalline NiTi shape memory alloys. Mater. Sci. Eng. A 2017, 706, 227–235. [Google Scholar] [CrossRef]
- ASTM. E8/E8M Standard Test Methods for Tension Testing of Metallic Materials; ASTM: West Conshohocken, PA, USA, 2018. [Google Scholar] [CrossRef]
- Kan, W.H.; Nadot, Y.; Foley, M.; Ridosz, L.; Proust, G.; Cairney, J.M. Factors that affect the properties of additively-manufactured AlSi10Mg: Porosity versus Microstructure. Addit. Manuf. 2019, 29, 100805. [Google Scholar] [CrossRef]
- Maskery, I.; Aboulkhair, N.T.; Corfield, M.R.; Tuck, C.; Clare, A.T.; Leach, R.K.; Wildman, R.D.; Ashcroft, I.A.; Hague, R.J.M. Quantification and characterisation of porosity in selectively laser melted Al–Si10–Mg using x-ray computed tomography. Mater. Charact. 2016, 111, 193–204. [Google Scholar] [CrossRef]
- Schreier, H.; Orteu, J.J.; Sutton, M.A. Image Correlation for Shape, Motion and Deformation Measurements: Basic Concepts, Theory and Applications; Springer Science & Business Media: New York, NY, USA, 2009; pp. 1–321. [Google Scholar] [CrossRef]
- Wang, Y.H.; Jiang, J.H.; Wanintrudal, C.; Du, C.; Zhou, D.; Smith, L.M.; Yang, L.X. Whole field sheet-metal tensile test using digital image correlation. Exp. Technol. 2017, 34, 54–59. [Google Scholar] [CrossRef]
- Yang, T.; Liu, Y.; Liao, W.; MacDonald, E.; Wei, H.; Zhang, C.; Chen, X.; Zhang, K. Laser Powder bed Fusion of AlSi10Mg: Influence of energy intensities on spatter and porosity evolution, microstructure and mechanical properties. J. Alloys Compd. 2020, 849, 156300. [Google Scholar] [CrossRef]
- Weingarten, C.; Buchbinder, D.; Pirch, N.; Meiners, W.; Wissenbach, K.; Poprawe, R. Formation and reduction of hydrogen porosity during selective laser melting of AlSi10Mg. J. Mater. Process. Technol. 2015, 221, 112–120. [Google Scholar] [CrossRef]
- Li, X.P.; Wang, X.J.; Saunders, M.; Suvorova, A.; Zhang, L.C.; Liu, Y.J.; Fang, M.H.; Huang, Z.H.; Sercombe, T.B. A selective laser melting and solution heat treatment refined Al–12Si alloy with a controllable ultrafine eutectic microstructure and 25% tensile ductility. Acta Mater. 2015, 95, 74–82. [Google Scholar] [CrossRef]
- Frazier, W.E. Metal additive manufacturing: A review. J. Mater. Eng. Perform. 2014, 23, 1917–1928. [Google Scholar] [CrossRef]
- Aboulkhair, N.T.; Simonelli, M.; Parry, L.; Ashcroft, I.; Tuck, C.; Hague, R. 3D printing of aluminium alloys: Additive manufacturing of aluminium alloys using selective laser melting. Prog. Mater. Sci. 2019, 106, 100578. [Google Scholar] [CrossRef]
- Rao, H.; Giet, S.; Yang, K.; Wu, X.; Davies, C.H.J. The influence of processing parameters on aluminium alloy A357 manufactured by selective laser melting. Mater. Des. 2016, 109, 334–346. [Google Scholar] [CrossRef]
- Bosio, F.; Shen, H.; Liu, Y.; Lombardi, M.; Rometsch, P.; Wu, X.; Zhu, Y.; Huang, A. Production strategy for manufacturing large-scale AlSi10Mg components by laser powder bed fusion. JOM 2021, 73, 770–780. [Google Scholar] [CrossRef]
- Santos Macías, J.G.; Douillard, T.; Zhao, L.; Maire, E.; Pyka, G.; Simar, A. Influence on microstructure, strength and ductility of build platform temperature during laser powder bed fusion of AlSi10Mg. Acta Mater. 2020, 201, 231–243. [Google Scholar] [CrossRef]
- Liu, X.; Zhao, C.; Zhou, X.; Shen, Z.; Liu, W. Microstructure of selective laser melted AlSi10Mg alloy. Mater. Des. 2019, 168, 107677. [Google Scholar] [CrossRef]
- Zuback, J.S.; DebRoy, T. The hardness of additively manufactured alloys. Materials 2018, 11, 2070. [Google Scholar] [CrossRef] [PubMed]
- Liu, M.; Takata, N.; Suzuki, A.; Kobashi, M. Effect of heat treatment on gradient microstructure of AlSi10Mg lattice structure manufactured by laser powder bed fusion. Materials 2020, 13, 2487. [Google Scholar] [CrossRef] [PubMed]
- Zyguła, K.; Nosek, B.; Pasiowiec, H.; Szysiak, N. Mechanical properties and microstructure of AlSi10Mg alloy obtained by casting and SLM technique. World Sci. News 2018, 104, 456–466. [Google Scholar]
- Prashanth, K.G.; Eckert, J. Formation of metastable cellular microstructures in selective laser melted alloys. J. Alloys. Compd. 2017, 707, 27–34. [Google Scholar] [CrossRef]
- Casati, R.; Nasab, M.H.; Coduri, M.; Tirelli, V.; Vedani, M. Effects of platform pre-heating and thermal-treatment strategies on properties of AlSi10Mg alloy processed by selective laser melting. Metals 2018, 8, 954. [Google Scholar] [CrossRef]
- Hitzler, L.; Janousch, C.; Schanz, J.; Merkel, M.; Heine, B.; Mack, F.; Hall, W.; Öchsner, A. Direction and location dependency of selective laser melted AlSi10Mg specimens. J. Mater. Process. Technol. 2017, 243, 48–61. [Google Scholar] [CrossRef]
- González-Velázquez, J.L. Shear lips. In Fractography and Failure Analysis; Springer International Publishing: New York, NY, USA, 2018; p. 35. [Google Scholar]
Disclaimer/Publisher’s Note: The statements, opinions and data contained in all publications are solely those of the individual author(s) and contributor(s) and not of MDPI and/or the editor(s). MDPI and/or the editor(s) disclaim responsibility for any injury to people or property resulting from any ideas, methods, instructions or products referred to in the content. |
© 2023 by the authors. Licensee MDPI, Basel, Switzerland. This article is an open access article distributed under the terms and conditions of the Creative Commons Attribution (CC BY) license (https://creativecommons.org/licenses/by/4.0/).